
Submitted:
06 June 2025
Posted:
06 June 2025
You are already at the latest version
Abstract
Aging in sexually reproducing organisms is shaped by the declining force of natural selection after reproduction begins. In Drosophila melanogaster, experimental evolution shows that altering the age of reproduction shifts the timing of aging. Using the Drosophila Experimental Evolution Population (DEEP) resource, which includes long- and short- lived populations evolved under distinct reproductive schedules, we investigated how immune defense against Beauveria bassiana changes with age and evolved lifespan. We tested survival post-infection at multiple ages and examined genomic differentiation for immune-related genes. Both population types showed age-related declines in immune defense, but long- lived populations consistently exhibited greater defense at all ages. Genomic comparisons revealed thousands of differentiated loci, yet no enrichment for canonical immune genes or overlap with gene sets from studies of direct selection for immunity. These results suggest that enhanced immune defense can evolve alongside extended lifespan, likely via general physiological robustness rather than traditional immune pathways. Our findings challenge the assumption of a trade-off between longevity and immunity and demonstrate the utility of experimentally evolved populations for dissecting the genetic architecture of aging and immune defense against Beauveria bassiana.
Keywords:
entomopathogenic fungi
; arthropod immunity
; host-pathogen interactions
; Beauveria bassiana
; Drosophila melanogaster
; aging
1. Introduction
In evolutionary biology, aging is defined as a decline in adaptive capacity caused by the weakening of natural selection after the age of first reproduction in sexually reproducing populations [1,2]. This definition is supported by a robust body of experimental evidence demonstrating that the timing of aging can be altered through laboratory selection on reproductive onset [2,3,4].
The Drosophila Experimental Evolution Population (DEEP) resource - commonly referred to as the Rose populations - includes the largest and most extensively studied collection of laboratory-evolved Drosophila melanogaster populations --e.g., [2]. This resource includes populations that have undergone direct selection on reproductive onset and become differentiated in life history traits, including lifespan [5]. Responses to such selection are repeatable, resistant to evolutionary history, consistent across replicate populations, and accompanied by widespread allele frequency shifts across the genome [5,6]. Comparisons between long- and short- lived populations of the DEEP resource have revealed enhanced early-life immune defense in long-lived populations [7], and an overrepresentation of immunity-related genes among genomic differences between these populations [8]. Similarly, genome-wide association studies in other Drosophila systems have identified immunity genes as overrepresented among those associated with survival to extreme old age [9].
Despite these associations, immune function in D. melanogaster is known to decline with age [10,11,12], and experimental evolution studies have shown that improvements in pathogen resistance come at the cost of reduced lifespan in uninfected conditions [13]. These findings suggest an evolutionary tradeoff between longevity and immune defense, potentially driven by energetic or resource allocation constraints, and likely impacted by cumulative exposure to microbes throughout the lifespan. However, the universality of this tradeoff remains uncertain.
A common limitation of studies on immune aging in D. melanogaster is the confounding effect of cumulative microbial exposure in comparisons between young and old individuals from the same population [14]. Alternatively, comparisons of immunity in mutant lines that differ in aging [15] often involve large-effect alleles that can distort other life-history traits and may not reflect the genetic variation that segregates in natural populations [16].
The DEEP resource provides a unique opportunity to disentangle biological aging from chronological aging. Populations selected for delayed reproduction exhibit extended lifespan and delayed physiological decline, as evidenced by both population-level mortality and individual-level declines in traits like reproductive output and locomotion [17,18,19,20]. Thus, the DEEP resource allows for direct comparisons of flies that are the same chronological age but differ substantially in biological age.
In this study, we used the DEEP resource to investigate the relationship between aging and immune defense using the fungal entomopathogen Beauveria bassiana, a widespread natural pathogen of a broad range of insect hosts, including D. melanogaster. B. bassiana is environmentally persistent and used in biological pest control [21], representing a natural, ecologically relevant challenge that engages both barrier defenses and systemic immune responses in D. melanogaster [22,23]. We addressed three central questions: How does chronological age affect immune defense in long- and short- lived D. melanogaster populations? What is the relationship between evolved lifespan and immune defense in these populations? And, does experimental evolution for lifespan divergence lead to genomic differentiation in immune-related genes?
2. Materials and Methods
2.1. Drosophila melanogaster Populations
We used populations from the DEEP resource, all derived from the ancestral IV population collected from an apple orchard in Massachusetts (Figure 1). The IV population was originally maintained on 14-day discrete generation cycles (from egg to egg). In 1980, five populations (O1–5) were created by gradually extending generation cycles to 70 days [3]. From these, five replicate populations (CO1–5) were derived and maintained on 28-day cycles [24] - subscripts indicate shared lineage, for example, CO1 was derived from O1. Another five populations (ACO1–5) were derived from the CO lines and selected for 10-day generation cycles [4].
The ACO and CO populations have undergone hundreds of generations of divergent selection and differ significantly in phenotypes including lifespan, development time, reproductive output, heart function, stress resistance, and activity levels [5,20,25]. These populations also show genome-wide divergence in allele frequencies [6,8].
For phenotyping immune defense, we used four replicates each of the ACO (ACO1,3-5) and CO (CO1,3-5) populations. For genomic analyses, we expanded the sample to include 20 poulatiosn in total: 10 short-lived (ACO1-5, AO1-5) and 10 long-lived (CO1-5 and nCO1-5). These additional populations share the same selection regimes and have converged in genome-wide allele frequencies with their respective population types [6].
All populations were maintained on banana-molasses diet at 25 °C under constant light. The diet composition per liter of distilled water was: 13.5 g Apex Drosophila agar type II, 121 g peeled ripe banana, 10.8 mL each of Light and Dark Karo syrup, 16.1 mL Eden organic barley malt syrup, 32.3 g Red Star active dry yeast, 2.1 g Sigma-Aldrich Methyl-4-hydroxybenzoate (anti-fungal) and 42.5 mL ethanol. Nutritional content per liter was approximately: 1.2 g fat, 37.2 g total sugar, 90.4 g total carbohydrates, 21.2 g protein, and 450 kcal [26].
2.2. Immune Defense Assay
Prior to immune testing, ACO1-4 and CO1-4 populations were reared for two generations on a common 14-day cycle to minimize environmental and parental effects. On day 13 from egg laying, adults were transferred to plexiglass cages at densities of ~1500-2000 flies per cage.
Flies were tested for immune defense at ages 14, 21, and 28 days post-egg in both ACO and CO populations; CO flies were additionally tested at ages 42 and 56. Immune defense was quantified as survival following inoculation with the entomopathogenic fungus Beauveria bassiana ARSEF 12460 [23]. Flies were briefly anesthetized using carbon dioxide, placed on ice-chilled Petri dishes, and sprayed using a custom-built spray tower [27,28] with 5 mL of a fungal suspension (0.36 g of spores in 30 mL of 0.03% Silwet L-77 in DI water), delivering ~103 spores/mm2 to the fly cuticle.
Inoculated flies were placed into Plexiglass cages (450 cm3) at densities of 100-150 flies/cage, sexes mixed and kept at 25 °C and 100% humidity for 24 hours to allow the fungus to germinate. Afterward, cages were kept at 25 °C at ~50% humidity. Mortality was recorded daily, and dead flies were removed from the cages and sexed. Uninfected controls were handled identically but sprayed with Silwet solution alone. An additional “untreated” control at age 14 was not anesthetized or sprayed.
To confirm that spore viability was >90% for all sprays, a 2 mL suspension of a 1:1000 dilution of the suspension was sprayed through the Spray Tower onto a 60 x 15 mm water agar Petri dish which was incubated at 25 °C for 24 hours. Following incubation one hundred spores within a central swath were inspected under a light microscope for presence or absence of a growing germ tube. Spores with germ tubes greater than or equal to the length of the spore were tabulated as living while others were considered non-viable. To estimate infection dose, a plastic microscope coverslip (22 x 22 mm) was placed adjacent to the flies during the sprays. After each coverslip was dried, it was placed in a 50 mL centrifuge tube with small glass beads and 5 mL of 0.03% Silwet solution and vortexed [29]. Then 10 uL of this spore suspension was placed onto another microscope slide and the number of spores were counted under a light microscope.
2.3. Statistical Analysis of Phenotype Data
We analyzed survival data using an exponential Weibull regression model [30]. When we fit an exponentiated Weibull regression model on the survival data of control flies and uninfected flies of A-type and C-type populations, the estimates of survival function obtained from the model were close to the raw data. We added 95% credible intervals using Bayesian simulations to the estimates of survival function.
To determine the immune defense change of A-type populations and C-type populations we compared post-infection survival using exponential Weibull regression model with Markov chain Monte Carlo (MCMC) sampling methods Gibbs sampler [31] and Metropolis-Hastings [32] algorithm to assess properties of survival function, hazard ratio, and percentage of change on scale parameters as a measurement for immunity.
This assumes the time to death of a fly follows an exponentiated-Weibull distribution with shape parameters, and scale parameter, where the scale parameter is an exponentiated linear combination of covariates treatment, sex, age groups, and any interaction terms. Using prior distributions and the sampling methods simulated 800,000 to 1,000,000 draws from posterior distributions of (α, θ,i’s). First 200,000 to 300,000 draws before convergence had been burned in. The remaining and convergent draws had been diagnosed for autocorrelation and thinned by taking one draw every 200 to 250 iterations to reduce the final autocorrelation in the samples. After MCMC diagnosis, there are at least 2,000 draws for (α, θ,i’s). Using the final simulated draws, we computed the estimates and 95% credible intervals of shape parameters, covariate coefficients, survival functions, and hazard ratios.
The simulated data allow us to calculate the percentage of change on scale parameters as a measurement of immune defense. Holding the shape parameters as constant, the survival function is stretched out to the right as it increases in value and pushed toward the initial experiment day as it decreases in value. Hence, we first computed infected and uninfected for an infected group and an uninfected group of the same population at the same age, for example ACO at age 14. Next, we computed to quantify the percentage of change between an infected group to the uninfected using scale parameters. If the quantity is sufficiently smaller compared to another, this group has better immunity. For example, because the one of ACO at age 14 is smaller than the one of ACO at age 28, we conclude that the immunity of ACO at age 14 is better than the immunity of ACO at age 28.
The exponential Weibull regression model also allows us to assess sexual dimorphism in terms of survival using hazard ratios. For example we show hazard ratio and related 95% credible intervals of ACO infected and uninfected groups at all ages (14, 28, and 42 days). We compared the hazard ratios to one. If hazard ratio was above 1, the baseline had less hazard and survived better.
By using the Bayesian simulations, we can compute the median residual lifetime and related 95% credible intervals for ACO and CO populations. The median residual lifetime is the length of the interval from current time t0 to the time where one-half of the flies alive at time t0 will still be alive. This quantity may give us additional insights on immunity measurement. We can also compute the percent of change on scales and related 95% credible intervals for ACO and CO populations through Bayesian simulations. Based on the exponentiated Weibull regression model per age, we have been able to find the immunity measurements to compare ACO and CO populations of the same age.
2.4. Meta-Analysis of Candidate SNPs
To test the prediction that genes associated with immune defense might be differentiated between the ACO and CO populations, we mined previously obtained, publicly-available sequence data from these populations. Graves et al. [6] identified a list of genome-wide SNPs that were significantly differentiated between populations with A-type (generation time of 9-10 days) and C-type (generation time of 28 days) ancestry. These A-type and C-type populations of Graves et al. [6] include the populations phenotyped in the present study, as well as additional populations that had experienced identical selection conditions (ACO1-5, AO1-5, CO1-5 and nCO1-5 populations). We identified all unique genes containing these significant SNPs using the relevant genome release (r5.51). We ran the resulting gene list through LAGO (https://go.princeton.edu/cgi-bin/LAGO; [33]) to search for enriched GO terms exceeding a significance threshold of p<0.01, using a Bonferroni correction. Results were corrected for hierarchical clustering using GO-Module [34].
We also compared this list of genes to two other relevant D. melanogaster experimental evolution publications: i) Fabian et al. [34], which is itself a meta-analysis comparing three different experiments in which D. melanogaster populations were selected for postponed ages of reproduction; and ii) Shahrestani et al. [13], which sequenced D. melanogaster populations that had experienced 19 generations of selection for defense against the same strain of Beauveria bassiana that we use in this study. Our rationale behind making the first comparison is that if immune defense is a primary trait driving the evolution of aging, then we should observe genes associated with immune defense in populations selected for both accelerated and postponed ages of reproduction. Our rationale behind making the second comparison is that if immune defense is a key trait driving the evolution of aging, then we should observe the same candidate genes in populations selected directly for immune defense as we observe in populations selected for accelerated and/or postponed ages of reproduction. The R package SuperExactTest was used to compare matches between these three sets of genes; this tool uses a forward algorithm based procedure to calculate the intersection probability among sets, with the computational complexity linear to the number of sets [36].
3. Results
We tested age-specific survival of short- and long- lived D. melanogaster under three conditions: fungal-infected (inoculated with fungus), uninfected (inoculated with just the silwet solution, without fungus) and control (not inoculated at all) (Figure S1). Comparing survival between uninfected and control conditions revealed that the handling of inoculation did impact survival, but in inconsistent, and likely biologically unimportant ways (Figure S2), Specifically, in the short-lived populations, the uninfected females and males survived better than controls, and in the long-lived populations, the uninfected females survived worse than the controls while male survival did not differ between uninfected and control groups (Figure S2).
In the short-lived ACO populations, at all ages infected flies died faster than uninfected flies (Figure 2). Sex affected survival for both infected and uninfected groups (Figure 2). Among 14-day old flies, females survived better than males regardless of infection status (Figure 2). For those sprayed at age 28, 28-day old flies, males survived better than females regardless of infection status (Figure 2). Finally, flies tested at age 42 demonstrated no observable sex differences in either infected survival or uninfected survival (Figure 2). Upon observing males only, the hazard ratio shows an increased association between infection and reduced survival when sprayed at age 28 compared to age 14 and 42 (Figure 2).
In our study, both infected and uninfected groups are followed until all flies die. Therefore, an estimate of “immune defense” could be made from comparisons of uninfected and infected groups, instead of using just the survival of the infected groups. We used median residual lifetime and related 95% credible intervals for short- and long- lived populations for insights on the immune defense phenotype. We measured the t50 at every age by looking at the residual life from that age in the ACO populations (Figure 3). We calculated the percent of change on scales and related 95% credible intervals to measure immune defense for the ACO populations (Table 1). Younger (14-day-old) ACO flies had better immune defense than older flies; the changes between uninfected and infected groups at age 14 is significantly smaller than age 28 and 42 (Table 1).
Long-lived CO populations were also tested at ages 14, 28, and 42, but these were additionally tested at ages 42 and 56 when the ACO flies had died (Figure 4) and t50 was measured for each age (Figure 5). At ages 14, 28, 42, and 56, female CO flies survived better than males in both infected and uninfected conditions (Figure 4). However, there was no sexual dimorphism seen in survival with flies sprayed at age 70 (Figure 4). Younger CO flies had better immune defense than older CO flies (Table 2). In the CO populations there was also sexual dimorphism in immune defense at ages 14 and 42 with females having better immune defense than males (Table 2).
Both short- and long- lived populations were tested at ages 14, 28, and 42 allowing for side-by-side comparisons of infection survival at these ages (Figure 6, Table 3). Immune defense was better in the CO populations compared to the ACO populations at all ages (Table 3).
Graves et al. [6] found 10,109 SNPs differentiated between populations with A-type (i.e., the ACO populations tested here) and C-type (i.e., the CO populations tested here) ancestry; these SNPs were evaluated for significance using Cochran-Mantel-Haenszel (CMH) tests and an empirically determined significance threshold (p < 8.21 x 10-167). Of these 10,109 SNPs, 8,864 were observed in 1,136 unique protein-coding genes. These 1,136 genes were run through the LAGO GO term enrichment tool, which returned 208 enriched GO terms for Biological Process at p < 0.01. GO-Module further refined this list of GO terms to 33 (Table S1) by removing GO terms that are redundant due to hierarchical clustering. These 33 GO terms generally pertain to organismal development, and do not obviously include any related to immune defense. We also did this analysis for just the ACO and CO populations, excluding the AO and nCO (Table S2).
We compared the list of 1,136 genes differentiating A- and C- type populations to two other relevant gene lists. Fabian et al. [35] reported 71 candidate genes underlying differentiation between populations selected for postponed reproduction and control populations that were also involved in immune response [35]. Shahrestani et al. [13] identified 42 SNPs that were significantly differentiated (using CMH tests and an empirically-determined significance threshold of p < 3.94 x 10⁻¹⁸) between populations selected for defense against a fungal pathogen and controls. Of these 42 significant SNPs, 33 were observed in 21 unique protein-coding genes. Comparing these three gene lists (1,136 from Graves et al. [6]; 71 from Fabian et al. [35]; 21 from Shahrestani et al. [13]) returned very few observations of overlap (Figure 7). Fabian et al. [35] had 6 genes in common with Graves et al. [6] and one gene in common to Shahrestani et al. (2021). Graves et al. [6] and Shahrestani et al. [13] had one gene in common, and no genes were shared by all three studies. Using the R-package SuperExactTest to evaluate multi-set intersections, we found no evidence that these overlaps were statistically significant, though the single shared gene between Shahrestani et al. [13] and Fabian et al. [35] was associated with p = 0.0809.
4. Discussion
This study used experimentally evolved D. melanogaster populations to investigate how immune defense changes with age, lifespan, and evolutionary history. By comparing short-lived ACO and long-lived CO populations - diverged under selection for different reproductive schedules - we investigated whether short-lived populations exhibit better immune defense (which would indicate trade-offs between immunity and longevity), how immunity changes with age in short- and long- lived populations, and whether immune-related genes evolve in parallel with life-history traits. Our findings suggest that immunity has indeed evolved in response to life-history selection, but in complex and sometimes counterintuitive ways.
In both ACO and CO populations, immune defense declined with chronological age. Younger flies consistently survived fungal infection better than older flies, demonstrating typical immunosenescence [10,12]. However, the rate of decline differed: CO flies retained higher immune function later into life compared to ACO flies, particularly in females. The faster decline of immune defense in the ACO compared to the CO is consistent with prior findings that physiological decline in the CO populations occurs more slowly than in the ACOs [17,18]. These results support the idea that the pace of immune aging is coupled to the overall rate of biological aging, rather than just to chronological time. However, while uninfected flies from the ACO also died faster than uninfected flies from the CO - which was consistent with previous results [2] - this uninfected mortality rate difference was taken into account in our analyses of mortality of the infected groups. Thus the differences in the infected groups cannot be explained just by the uninfected mortality differences in these populations.
Across all matched ages (14, 28, and 42 days), the long- lived CO populations exhibited better immune defense than the short- lived ACO populations - populations evolved for extended lifespan evolved enhanced immunity at each age tested. Contrary to some expectations of a trade-off between immunity and longevity - e.g., Shahrestani et al., [13], our results show that improved immune defense and increased lifespan can evolve together under long-term selection for delayed reproduction. This pattern may reflect a shared underlying mechanism, such as enhanced overall stress resistance. The CO populations’ extended resilience against fungal infection even in late life suggests that longevity-associated pathways can improve immune robustness, rather than compromise it.
Despite the clear phenotypic differences in immune defense between ACO and CO populations, our analysis of genome-wide SNP data revealed no overrepresentation of immune-related genes among the loci most strongly differentiated between population types. Instead, enriched GO terms were mostly related to development and metabolism. Additionally, we observed minimal overlap between differentiated genes in our study and candidate immune genes identified in other experiments selecting directly for immunity [13] or longevity [35]. This suggests that while immune defense clearly evolves alongside lifespan, it may do so through indirect mechanisms, rather than through direct selection on canonical immune genes.
The absence of immune gene enrichment at differentiated loci could reflect the complex and polygenic nature of immune defense in outbred populations such as the ones used in this study. It is also possible that selection in these populations has acted on regulatory elements or genes that contribute to general organismal robustness, which incidentally improves immune outcomes. In this context, the distinction between antagonistic immune defense mechanisms (limiting pathogen burden) and cooperative immune defense mechanisms (limiting damage from infection) may help explain why classical immune pathways were not prominent in our genomic data. Selection for delayed reproduction prolongs the impact of natural selection, leading to increased adaptive capacity at later ages.
A more detailed analysis of the effects of laboratory selection on immunity may reveal that direct selection for improved immune defense primarily targets antagonistic immune mechanisms - such as pathogen-killing pathways - while selection for delayed reproduction and increased lifespan favors cooperative or tolerance-based mechanisms, which mitigate infection damage without triggering immune activation. This distinction could help explain how long-lived populations maintain stronger immune performance without incurring the cost of systemic inflammation. Recognizing that different classes of genes influence resistance and tolerance may also clarify why some immune phenotypes, like survival after infection, decline with age, while others, such as immune pathway activation, increase with age- reviewed in [14]. These contrasting patterns highlight a promising area for future research into potential biological strategies for mitigating inflammaging and other costs associated with constitutive immune activation.
Supplementary Materials
The following supporting information can be downloaded at the website of this paper posted on Preprints.org. The following supporting information is available at the bottom of this submission for peer review: Figures S1-2, and Tables S1-2.
Author Contributions
Investigation and methodology, E.B., A.L.C.B., K.E.R., R.C.; conceptualization, resources, supervision, funding acquisition, and project administration P.S.; data curation and software, H.Y., M.K.B., M.A., P.S.; formal analysis, H.Y., M.K.B.; visualization, H.Y.; writing - original draft, E.B., A.L.C.B, K.E.R., T.C., M.K.B., P.S.; writing - review and editing, A.L.C.B., P.S. All authors have read and agreed to the published version of the manuscript.
Funding
This research received funding from the CSU Fullerton (start-up funds for P.S.), and CSU BIOTECHNOLOGY (New Investigator Grant to P.S.).
Data Availability Statement
All raw data for this study will be uploaded to an online database upon acceptance of the manuscript for publication.
Acknowledgments
This research was made possible by dozens of personnel, including undergraduate student volunteers to assisted with various aspects of data collection and lab maintenance.
Conflicts of Interest
The authors declare no conflicts of interest.
Abbreviations
The following abbreviations are used in this manuscript:
| DEEP | Drosophila Experimental Evolution Population Resource |
References
- Rose MR, Charlesworth B. Genetics of life history in Drosophila melanogaster. I. Sib analysis of adult females. Genetics. 1981 Jan;97(1):173-86. [CrossRef] [PubMed] [PubMed Central]
- Rose, M. R. , Passananti, H. B., & Matos, M. (2004). Methuselah flies: A case study in the evolution of aging. World Scientific.
- Rose, M. R. (1984). Laboratory evolution of postponed senescence in Drosophila melanogaster. Evolution, 38(5), 1004-1010.
- Chippindale, A. K., Alipaz, J. A., Chen, H. W., & Rose, M. R. (1997). Experimental evolution of accelerated development in Drosophila. 1. Developmental speed and larval survival. Evolution, 51(5), 1536-1551.
- Burke MK, Barter TT, Cabral LG, Kezos JN, Phillips MA, Rutledge GA, Phung KH, Chen RH, Nguyen HD, Mueller LD, Rose MR. Rapid divergence and convergence of life-history in experimentally evolved Drosophila melanogaster. Evolution. 2016 Sep;70(9):2085-98. [CrossRef] [PubMed]
- Graves Jr, J., Hertweck, K., Phillips, M., Han, M., Cabral, L., Barter, T., . . . Rose, M. (2017). Genomics of parallel experimental evolution in Drosophila. Molecular biology and evolution, 34(4), 831-842.
- Burke, M. K. (2010a). Adaptation in experimentally-evolved populations of Drosophila melanogaster (Vol. 72, No. 01).
- Burke MK, Dunham JP, Shahrestani P, Thornton KR, Rose MR, Long AD. Genome-wide analysis of a long-term evolution experiment with Drosophila. Nature. 2010b Sep 30;467(7315):587-90. [CrossRef] [PubMed]
- Burke MK, King EG, Shahrestani P, Rose MR, Long AD. Genome-wide association study of extreme longevity in Drosophila melanogaster. Genome Biol Evol. 2014 Jan;6(1):1-11. [CrossRef] [PubMed] [PubMed Central]
- Zerofsky, M., Harel, E., Silverman, N., & Tatar, M. (2005). Aging of the innate immune response in Drosophila melanogaster. Aging cell, 4(2), 103-108.
- Ramsden, S., Cheung, Y. Y., & Seroude, L. (2008). Functional analysis of the Drosophila immune response during aging. Aging Cell, 7(2), 225-236.
- Kubiak, M. , & Tinsley, M. C. (2017). Sex-specific routes to immune senescence in Drosophila melanogaster. Scientific reports, 7(1), 1-7.
- Shahrestani P, King E, Ramezan R, Phillips M, Riddle M, Thornburg M, Greenspan Z, Estrella Y, Garcia K, Chowdhury P, Malarat G, Zhu M, Rottshaefer SM, Wraight S, Griggs M, Vandenberg J, Long AD, Clark AG, Lazzaro BP. The molecular architecture of Drosophila melanogaster defense against Beauveria bassiana explored through evolve and resequence and quantitative trait locus mapping. G3 (Bethesda). 2021 Dec 8;11(12):jkab324. [CrossRef] [PubMed] [PubMed Central]
- Sciambra N, Chtarbanova S. The Impact of Age on Response to Infection in Drosophila. Microorganisms. 2021 Apr 29;9(5):958. [CrossRef] [PubMed] [PubMed Central]
- Garschall K, Flatt T. The interplay between immunity and aging in Drosophila. F1000Res. 2018 Feb 7;7:160. [CrossRef] [PubMed] [PubMed Central]
- Libert, S. , Chao, Y., Zwiener, J., & Pletcher, S. D. (2008). Realized immune response is enhanced in long-lived puc and chico mutants but is unaffected by dietary restriction. Molecular immunology, 45(3), 810-817.
- Rauser, C. L. , Abdel-Aal, Y., Shieh, J. A., Suen, C. W., Mueller, L. D., & Rose, M. R. (2005). Lifelong heterogeneity in fecundity is insufficient to explain late-life fecundity plateaus in Drosophila melanogaster. Exp Gerontol, 40(8-9), 660-670.
- Shahrestani, P., Quach, J., Mueller, L. D., & Rose, M. R. (2012a). Paradoxical physiological transitions from aging to late life in Drosophila. Rejuvenation research, 15(1), 49-58.
- Shahrestani, P., Tran, X., & Mueller, L. (2012b). Patterns of male fitness conform to predictions of evolutionary models of late life. Journal of evolutionary biology, 25(6), 1060-1065.
- Shahrestani, P., Wilson, J. B., Mueller, L. D., & Rose, M. R. (2016). Patterns of physiological decline due to age and selection in Drosophila melanogaster. Evolution, 70(11), 2550-2561.
- Kaushal K. Sinha, Ajoy Kr. Choudhary, Priyanka Kumari, Chapter 15 - Entomopathogenic Fungi, Editor(s): Omkar, Ecofriendly Pest Management for Food Security, Academic Press, 2016, Pages 475-505. ISBN 9780128032657. [CrossRef]
- Levitin A, Whiteway M. Drosophila innate immunity and response to fungal infections. Cell Microbiol. 2008 May;10(5):1021-6. [CrossRef] [PubMed]
- Shahrestani, P., Chambers, M., Vandenberg, J., Garcia, K., Malaret, G., Chowdhury, P., ... & Lazzaro, B. P. (2018). Sexual dimorphism in Drosophila melanogaster survival of Beauveria bassiana infection depends on core immune signaling. Scientific reports, 8(1), 12501.
- Leroi, A. M. , Chippindale, A. K., & Rose, M. R. (1994). Long-Term Laboratory Evolution of a Genetic Life-History Trade-Off in Drosophila melanogaster. 1. The Role of Genotype-by-Environment Interaction. Evolution, 48(4), 1244–1257. [CrossRef]
- Shahrestani P, Burke MK, Birse R, Kezos JN, Ocorr K, Mueller LD, Rose MR, Bodmer R. Experimental Evolution and Heart Function in Drosophila. Physiol Biochem Zool. 2017 Mar/Apr;90(2):281-293. [CrossRef] [PubMed] [PubMed Central]
- Lesperance DN, Broderick NA. Meta-analysis of diets used drosophila microbiome research and introduction of the drosophila dietary composition calculator (DDCC). G3 Genes|Genomes|Genetics. 2020;10(7):2207–11.
- Vandenberg, J. D. (1996). Standardized bioassay and screening of Beauveria bassiana and Paecilomyces fumosoroseus against the Russian wheat aphid (Homoptera: Aphididae). Journal of Economic Entomology, 89(6), 1418-1423.
- Rai KE, Yin H, Bengo ALC, Cheek M, Courville R, Bagheri E, Ramezan R, Behseta S, Shahrestani P. Immune defense in Drosophila melanogaster depends on diet, sex, and mating status. PLoS One. 2023 Apr 13;18(4):e0268415. [CrossRef] [PubMed] [PubMed Central]
- Ugine TA, Wraight SP, Brownbridge M, Sanderson JP. Development of a novel bioassay for estimation of median lethal concentrations (LC50) and doses (LD50) of the entomopathogenic fungus Beauveria bassiana, against western flower thrips, Frankliniella occidentalis. J Invertebr Pathol. 2005 Jul;89(3):210-8. [CrossRef] [PubMed]
- Mudholkar, G. S. , & Srivastava, D. K. (1993). Exponentiated Weibull family for analyzing bathtub failure-rate data. IEEE transactions on reliability, 42(2), 299-302.
- Geman, S., & Geman, D. (1984). Stochastic relaxation, Gibbs distributions, and the Bayesian restoration of images. IEEE Transactions on pattern analysis and machine intelligence(6), 721-741.
- Hastings, W. K. (1970). Monte Carlo sampling methods using Markov chains and their applications.
- Boyle, E., Weng, S., Gollub, J., Jin, H., Botstein, D., Cherry, M.J., Sherlock, G. (2004). GO::TermFinder—open source software for accessing Gene Ontology information and finding significantly enriched Gene Ontology terms associated with a list of genes. Bioinformatics 20(18):3710-3715.
- Yang, X. , Li, J., Lee, Y., & Lussier, Y. A. (2011). GO-Module: functional synthesis and improved interpretation of Gene Ontology patterns. Bioinformatics, 27(10), 1444-1446.
- Fabian, D. K., Garschall, K., Klepsatel, P., Santos-Matos, G., Sucena, E., Kapun, M., . . . Flatt, T. (2018). Evolution of longevity improves immunity in Drosophila. Evolution letters, 2(6), 567-579.
- Wang, M. , Zhao, Y., & Zhang, B. (2015). Efficient test and visualization of multi-set intersections. Scientific reports, 5, 16923.
Figure 1.
Evolutionary history of the Drosophila Experimental Evolution Population (DEEP) Resource populations used in this study. The ancestral population (IV) originated from an apple orchard in 1970. Five “O-type” populations (orange) were derived from the IV and selected for delayed reproduction on 70-day discrete generation cycles. The C-type (CO and nCO) populations (red) emerged from the O-type and were selected on 28-day discrete generation cycles. The A-types (ACO and AO) populations (blue) were selected for early age of reproduction, on 10-day generation cycles.
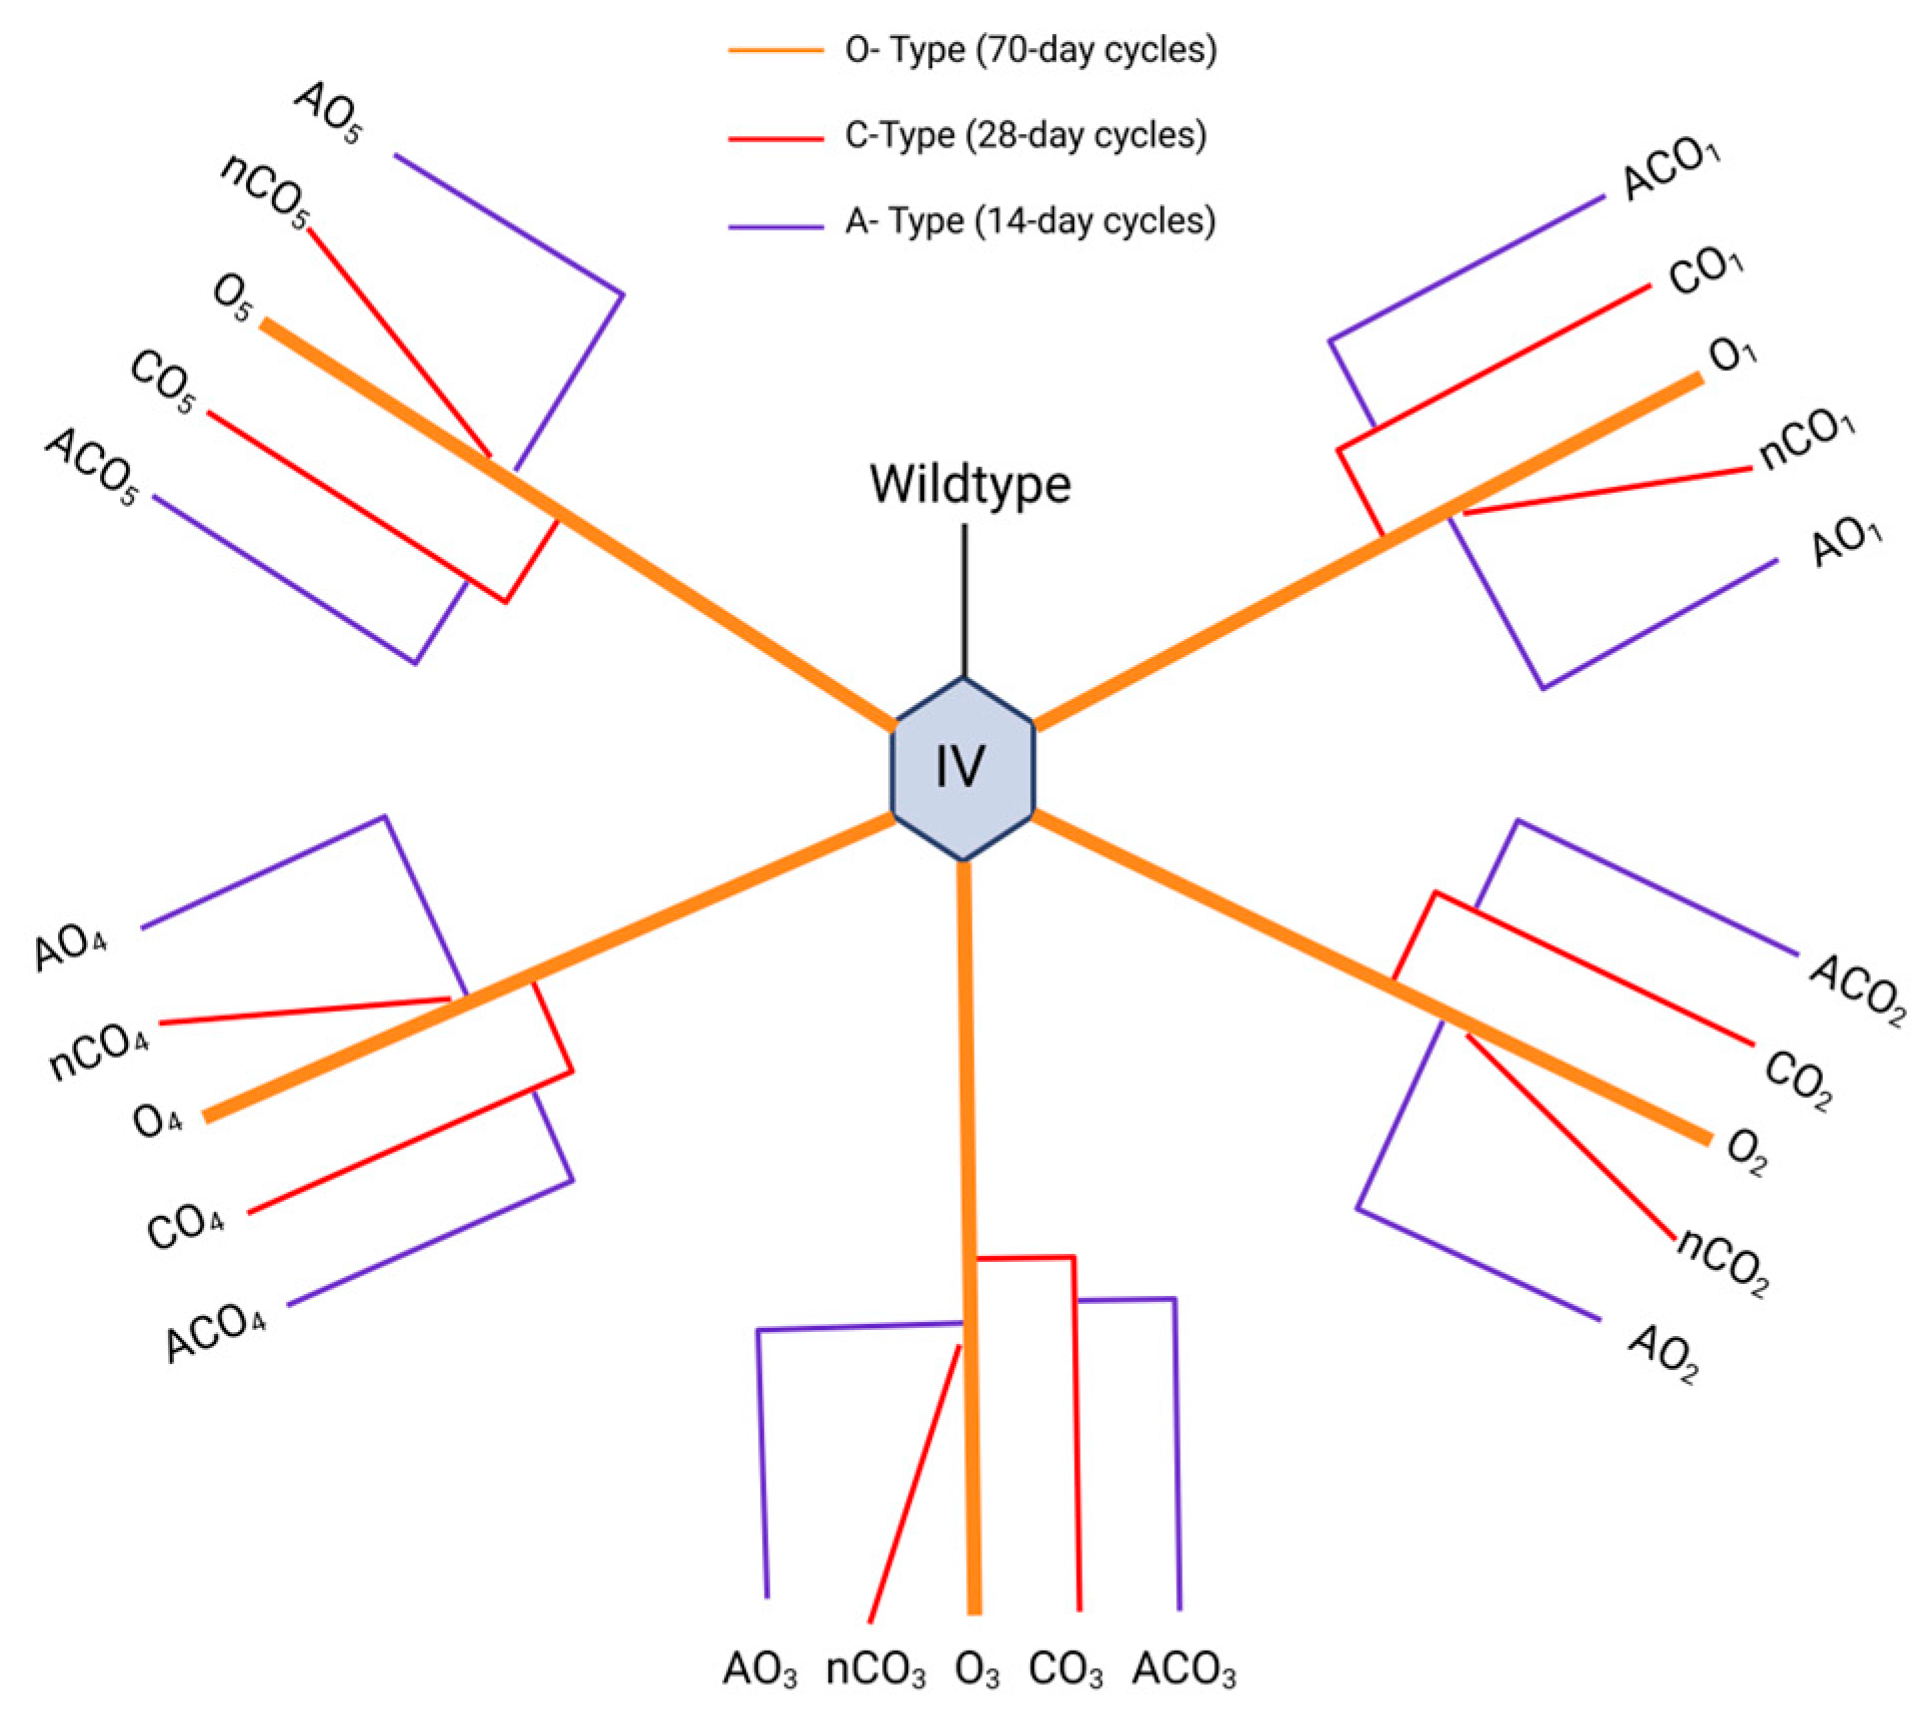
Figure 2.
Survival function and hazard ratios for ACO. (a) Comparison of male and female in ACO infected (solid line) and uninfected (dash line) groups using the exponentiated Weibull regression model. This model also allows us to assess the sexual dimorphism in terms of survival using hazard ratios. In panel A, 95% credible intervals using Bayesian simulations are added to the estimates. (b) Hazard ratio and related 95% credible intervals of ACO infected (red lines) and un-infected (blue lines) at all ages (14, 28, and 42 days). Base line (black line) is male flies. If the hazard ratio is above 1, the baseline has less hazard and survives better. At age 14, females survive better than males under both treatments. At age 28, males survive better than females under both treatments and at age 42, since the 95% credible intervals hit the black line at 1, there is no difference between males and females in terms of survival.
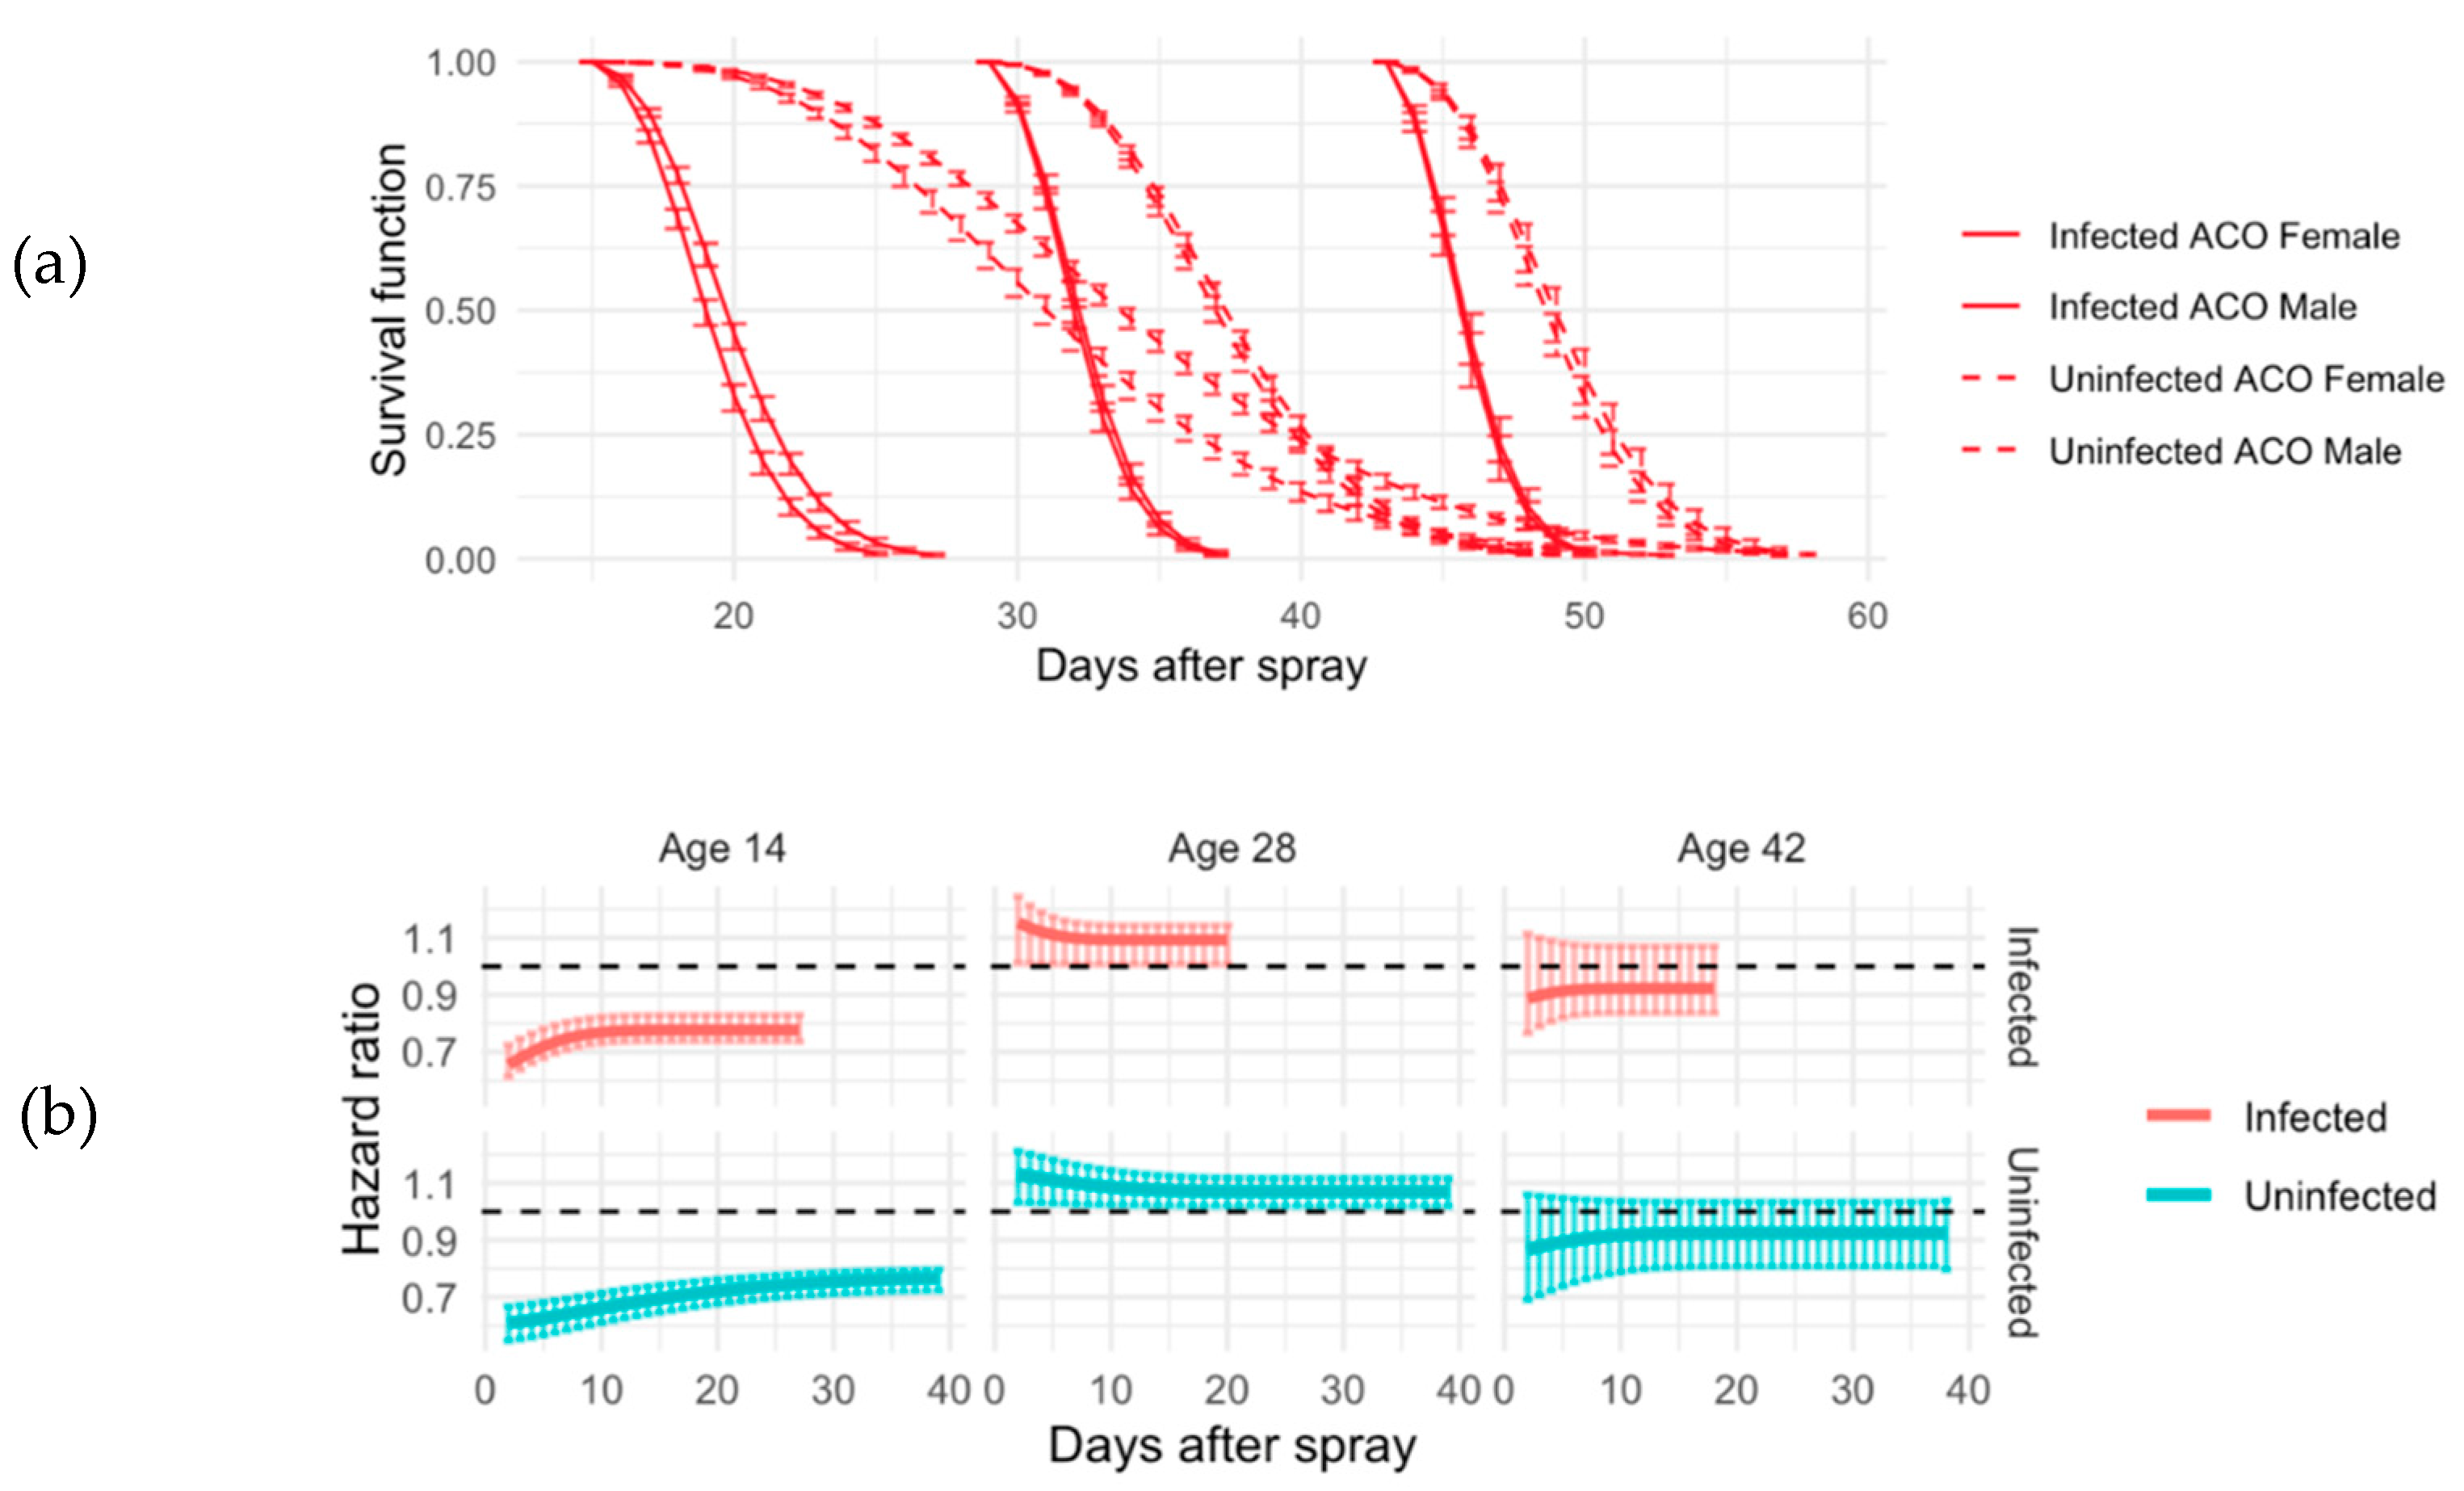
Figure 3.
Median residual lifetime for ACO. Using the Bayesian simulations, we compute the median residual lifetime and related 95% credible intervals for ACO populations. The median residual lifetime is the length of the interval from current time t0 to the time where one-half of the flies alive at time t0 will still be alive. This quantity may give us some insights on immunity measurement. (a) Median residual life in un-infected ACO and (b) median residual life time in infected ACO at age 14 (blue line), 28 (yellow line), and 42 (gray line). Day is days after the spray.
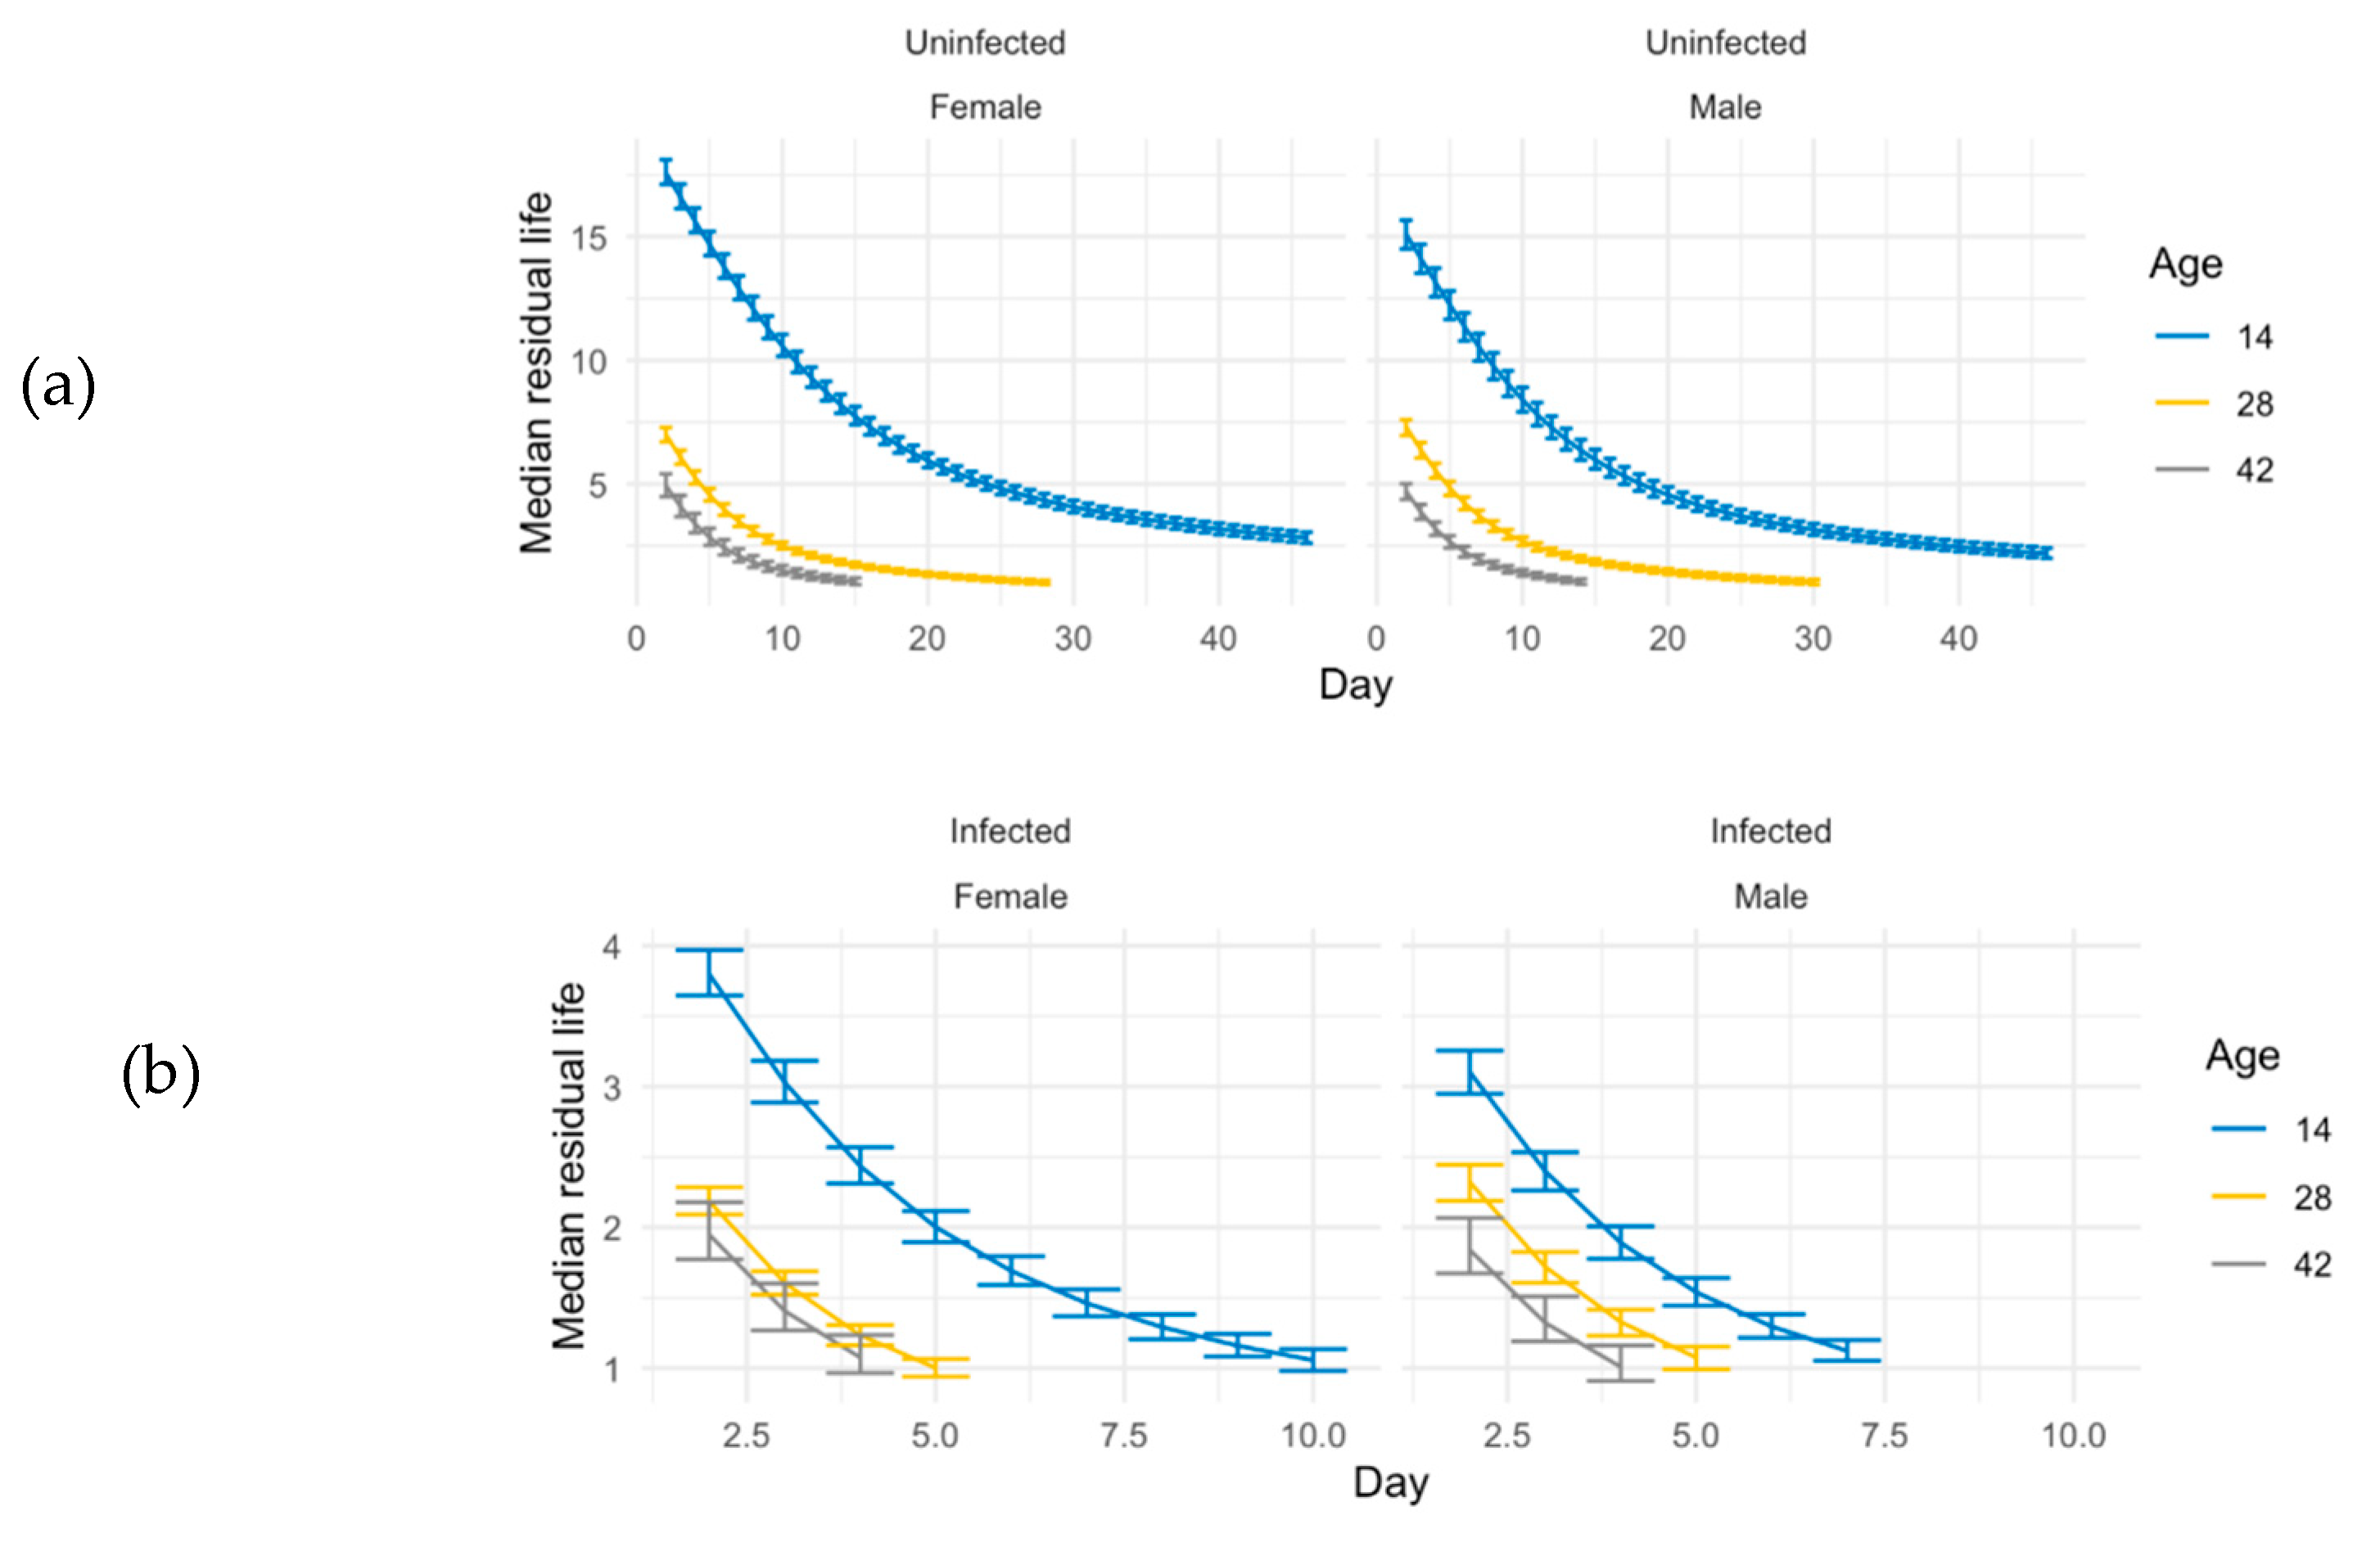
Figure 4.
Survival function and hazard ratios for CO. (a) Comparison of male and female in ACO infected (solid line) and uninfected (dash line) groups using the exponentiated Weibull regression model. This model also allows us to assess the sexual dimorphism in terms of survival using hazard ratios. (b) Hazard ratio and related 95% credible intervals of CO Infected (red lines) and uninfected (blue lines) at all ages (14, 28, 42, 56, and 70 days). Base line (black line) is male flies. If the hazard ratio is above 1, the baseline has less hazard and survives better. At ages 14 to 56, female survives better than males under both treatments and there is no difference between males and females at age 70 with or without infection.
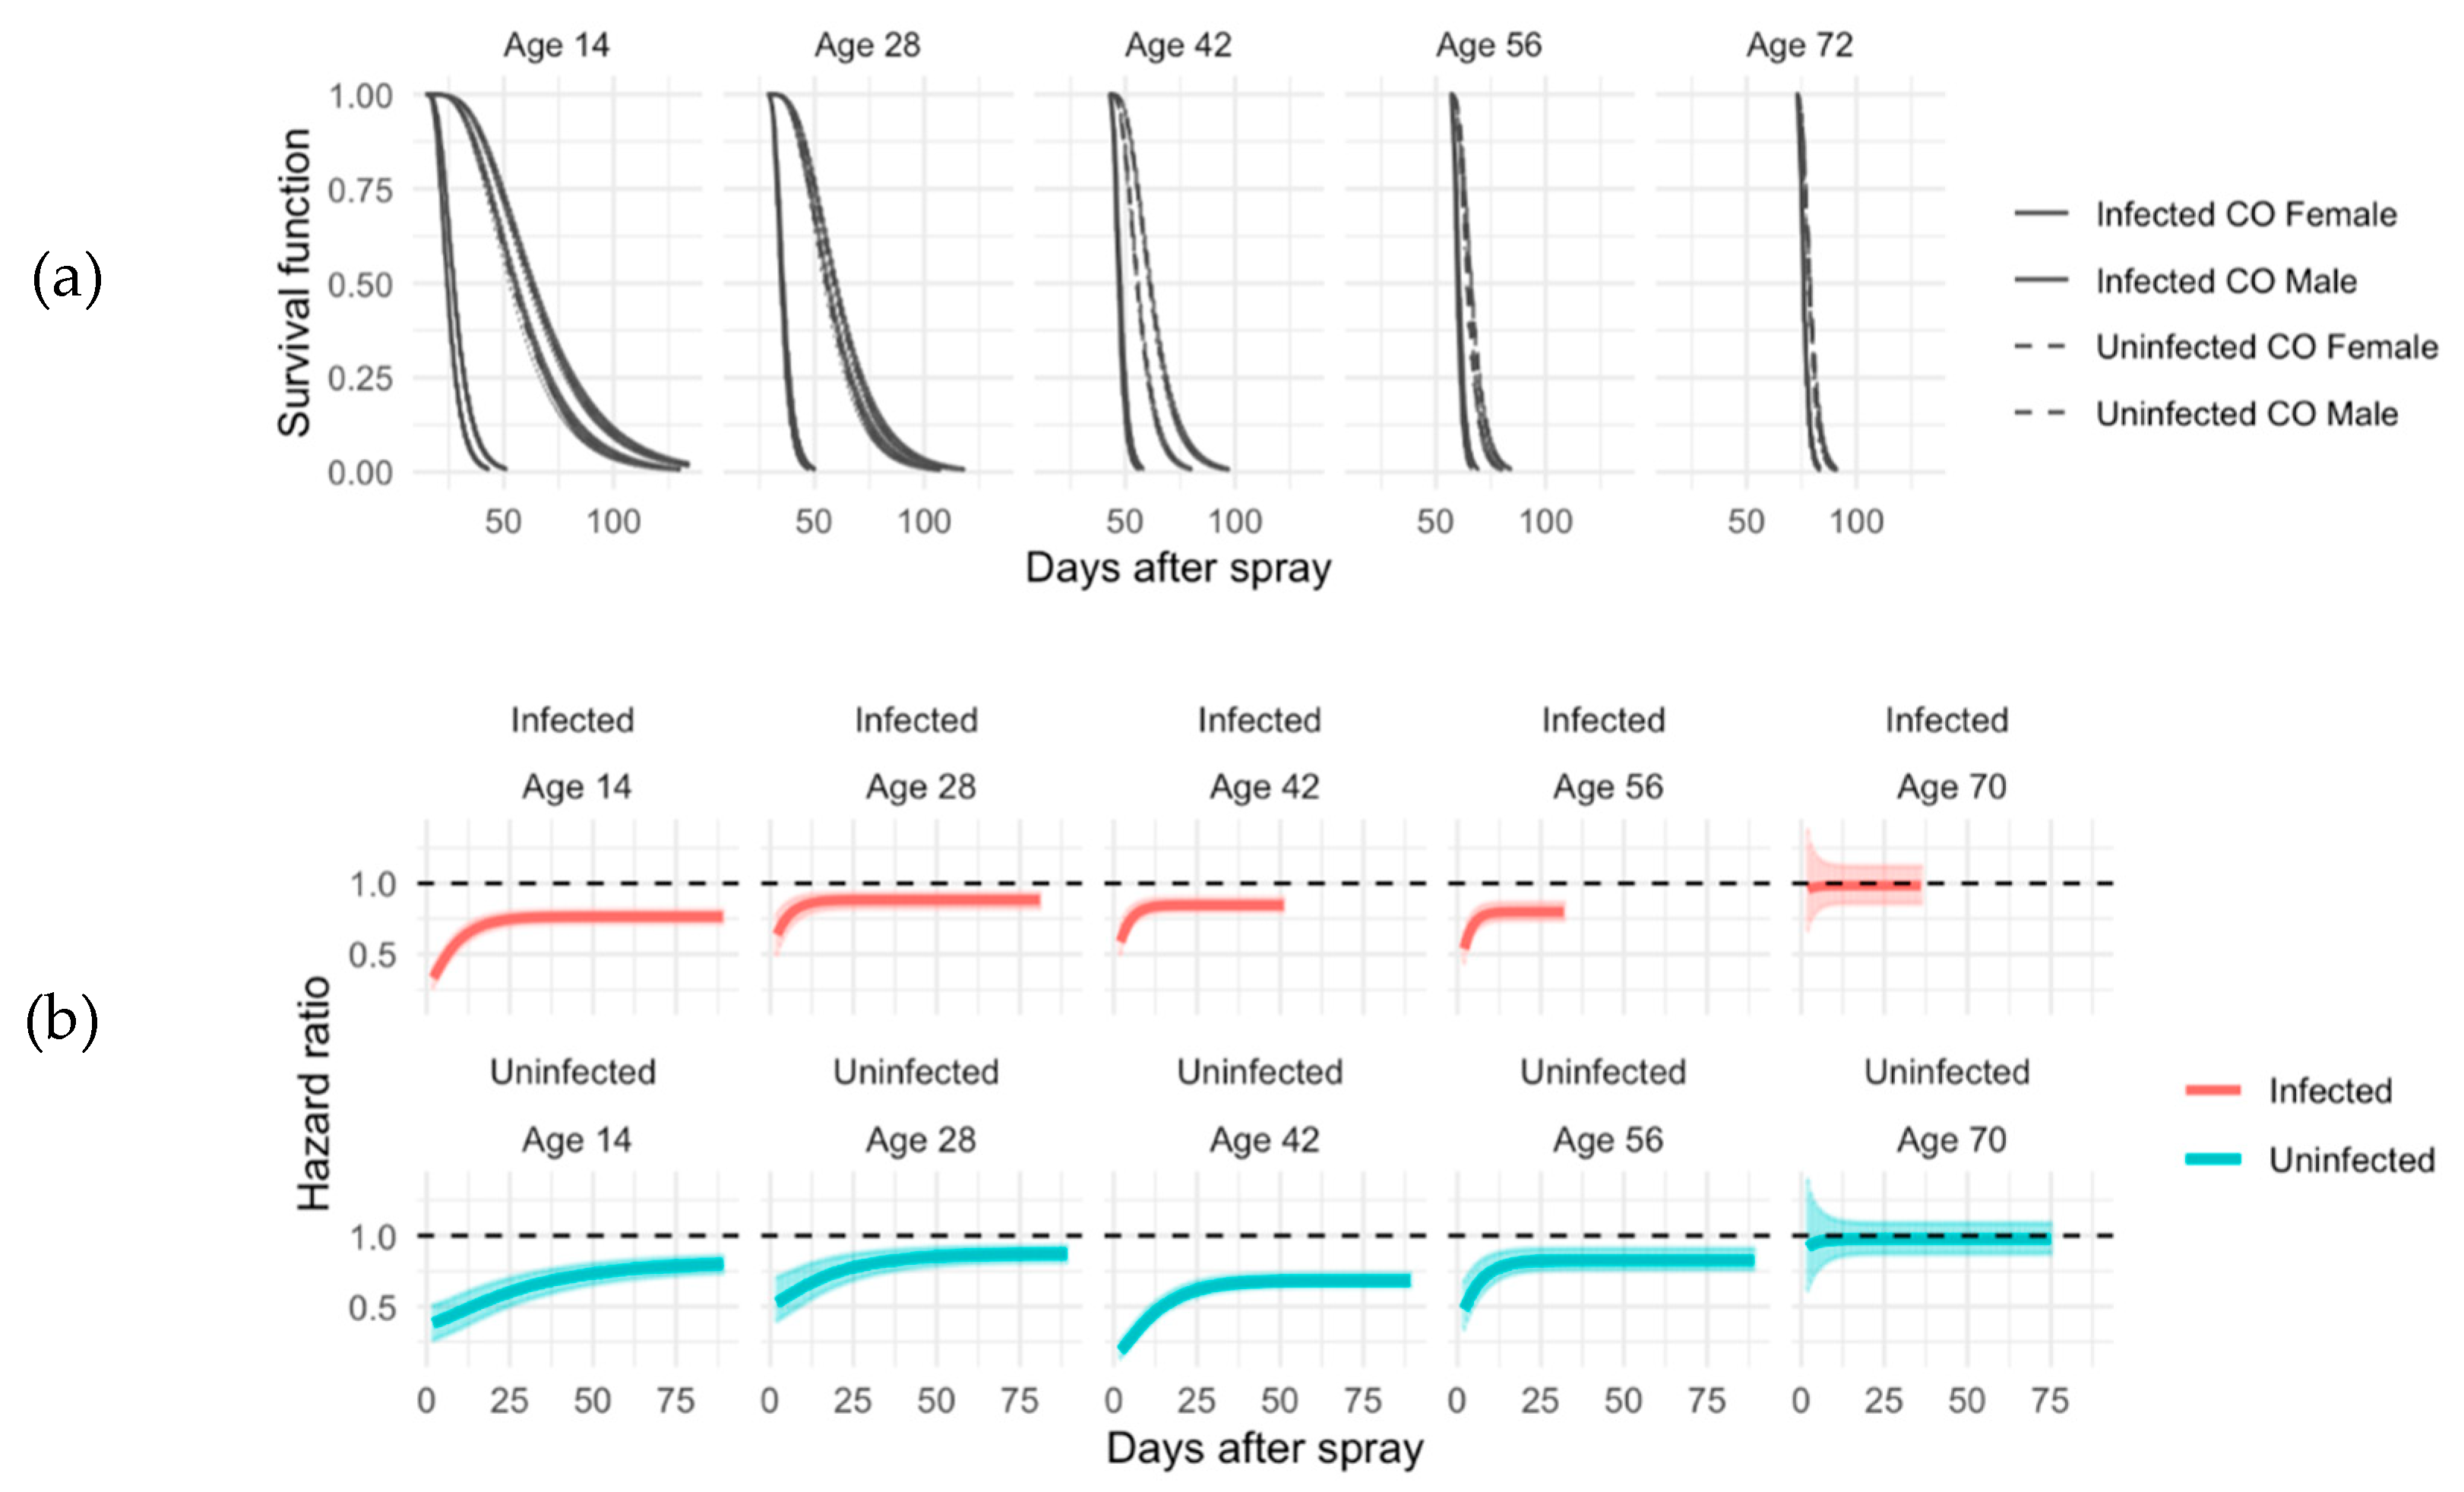
Figure 5.
Median residual lifetime for CO. Using the Bayesian simulations, we compute the median residual lifetime and related 95% credible intervals for CO populations. The median residual lifetime is the length of the interval from current time t0 to the time where one-half of the flies alive at time t0 will still be alive. This quantity may give us some insights on immunity measurement. (a) Median residual life in uninfected CO and (b) median residual lifetime in infected CO at age 14 (dark blue line), 28 (yellow line), 42 (gray line), 56 (red line), and 72 (light blue line). Day is days after the spray.
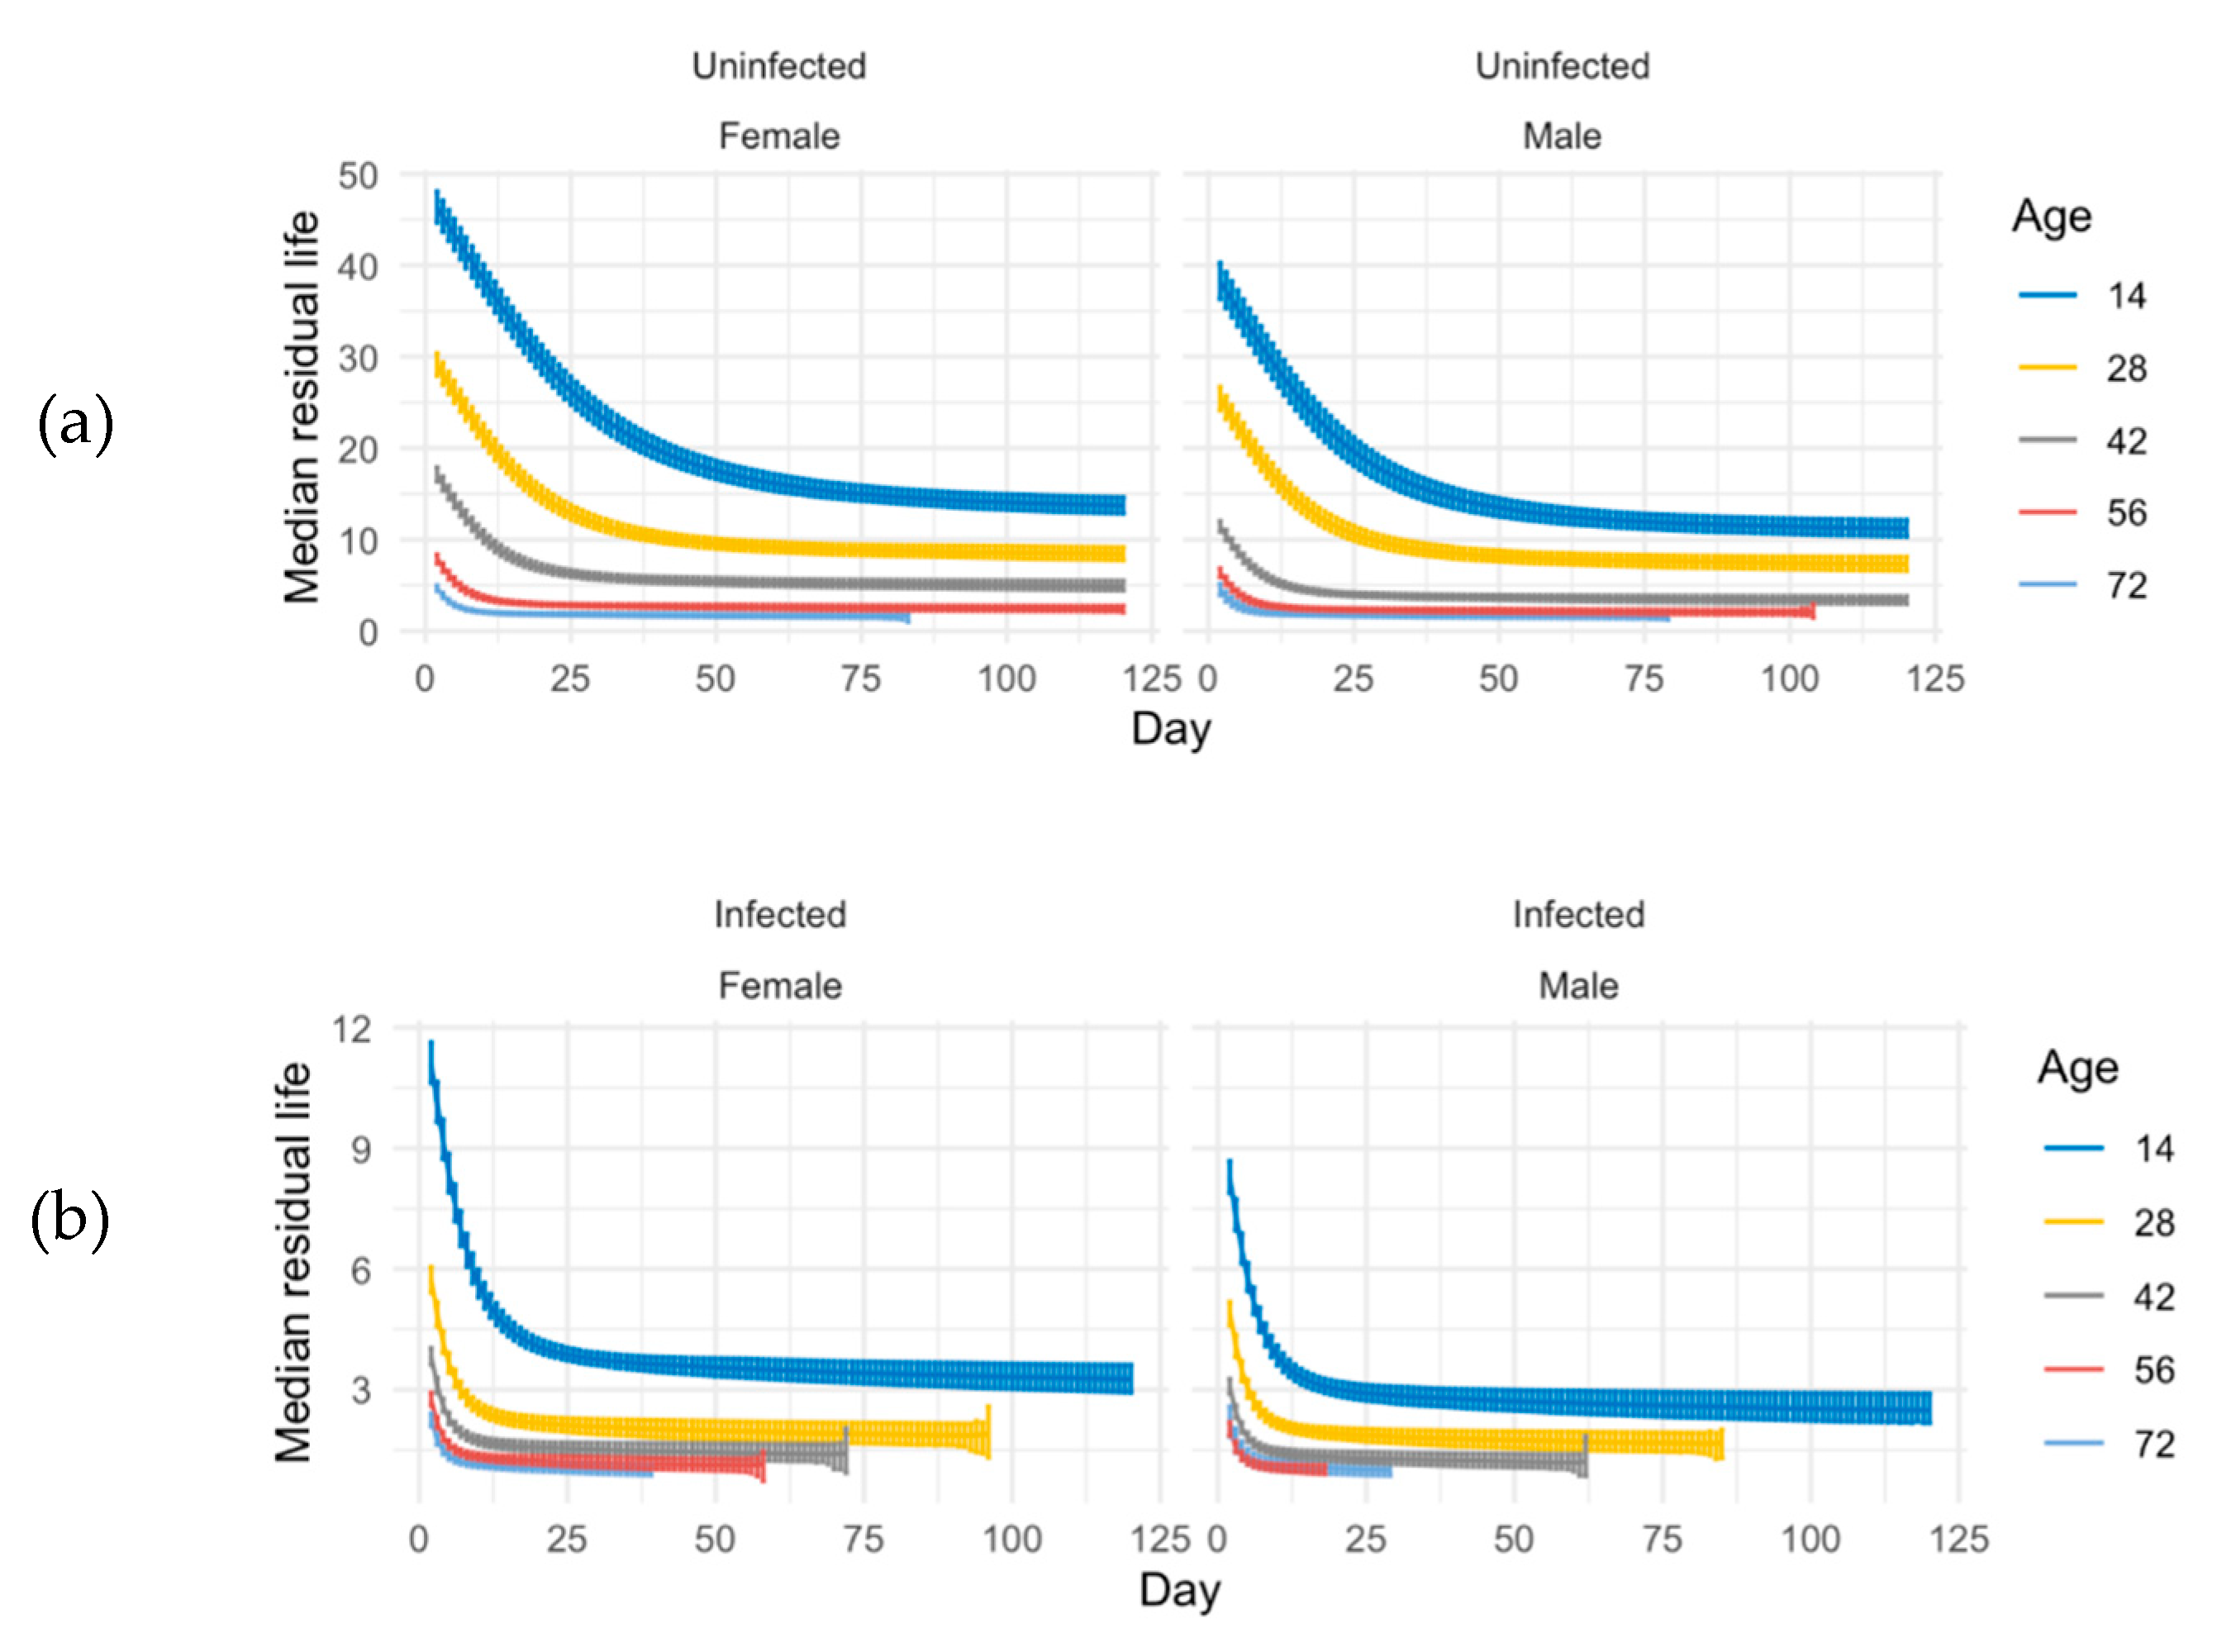
Figure 6.
Survival of infected ACO and CO. Percent survival of infected ACO1,3-5 (red lines) and CO1,3-5 (gray lines) populations at age 14 (solid lines), 28 (dash lines), and 42 (dot lines) days. Y axis displays survival percent and X axis shows day after spray. Visual comparison of infected ACO and CO flies demonstrates that survival percent of ACO populations at age 14 overlapped with survival percent of CO populations at age 42. The observed survival percent on day t after treatment is calculated by 1 minus the cumulative death count until day t divided by the total number of flies.
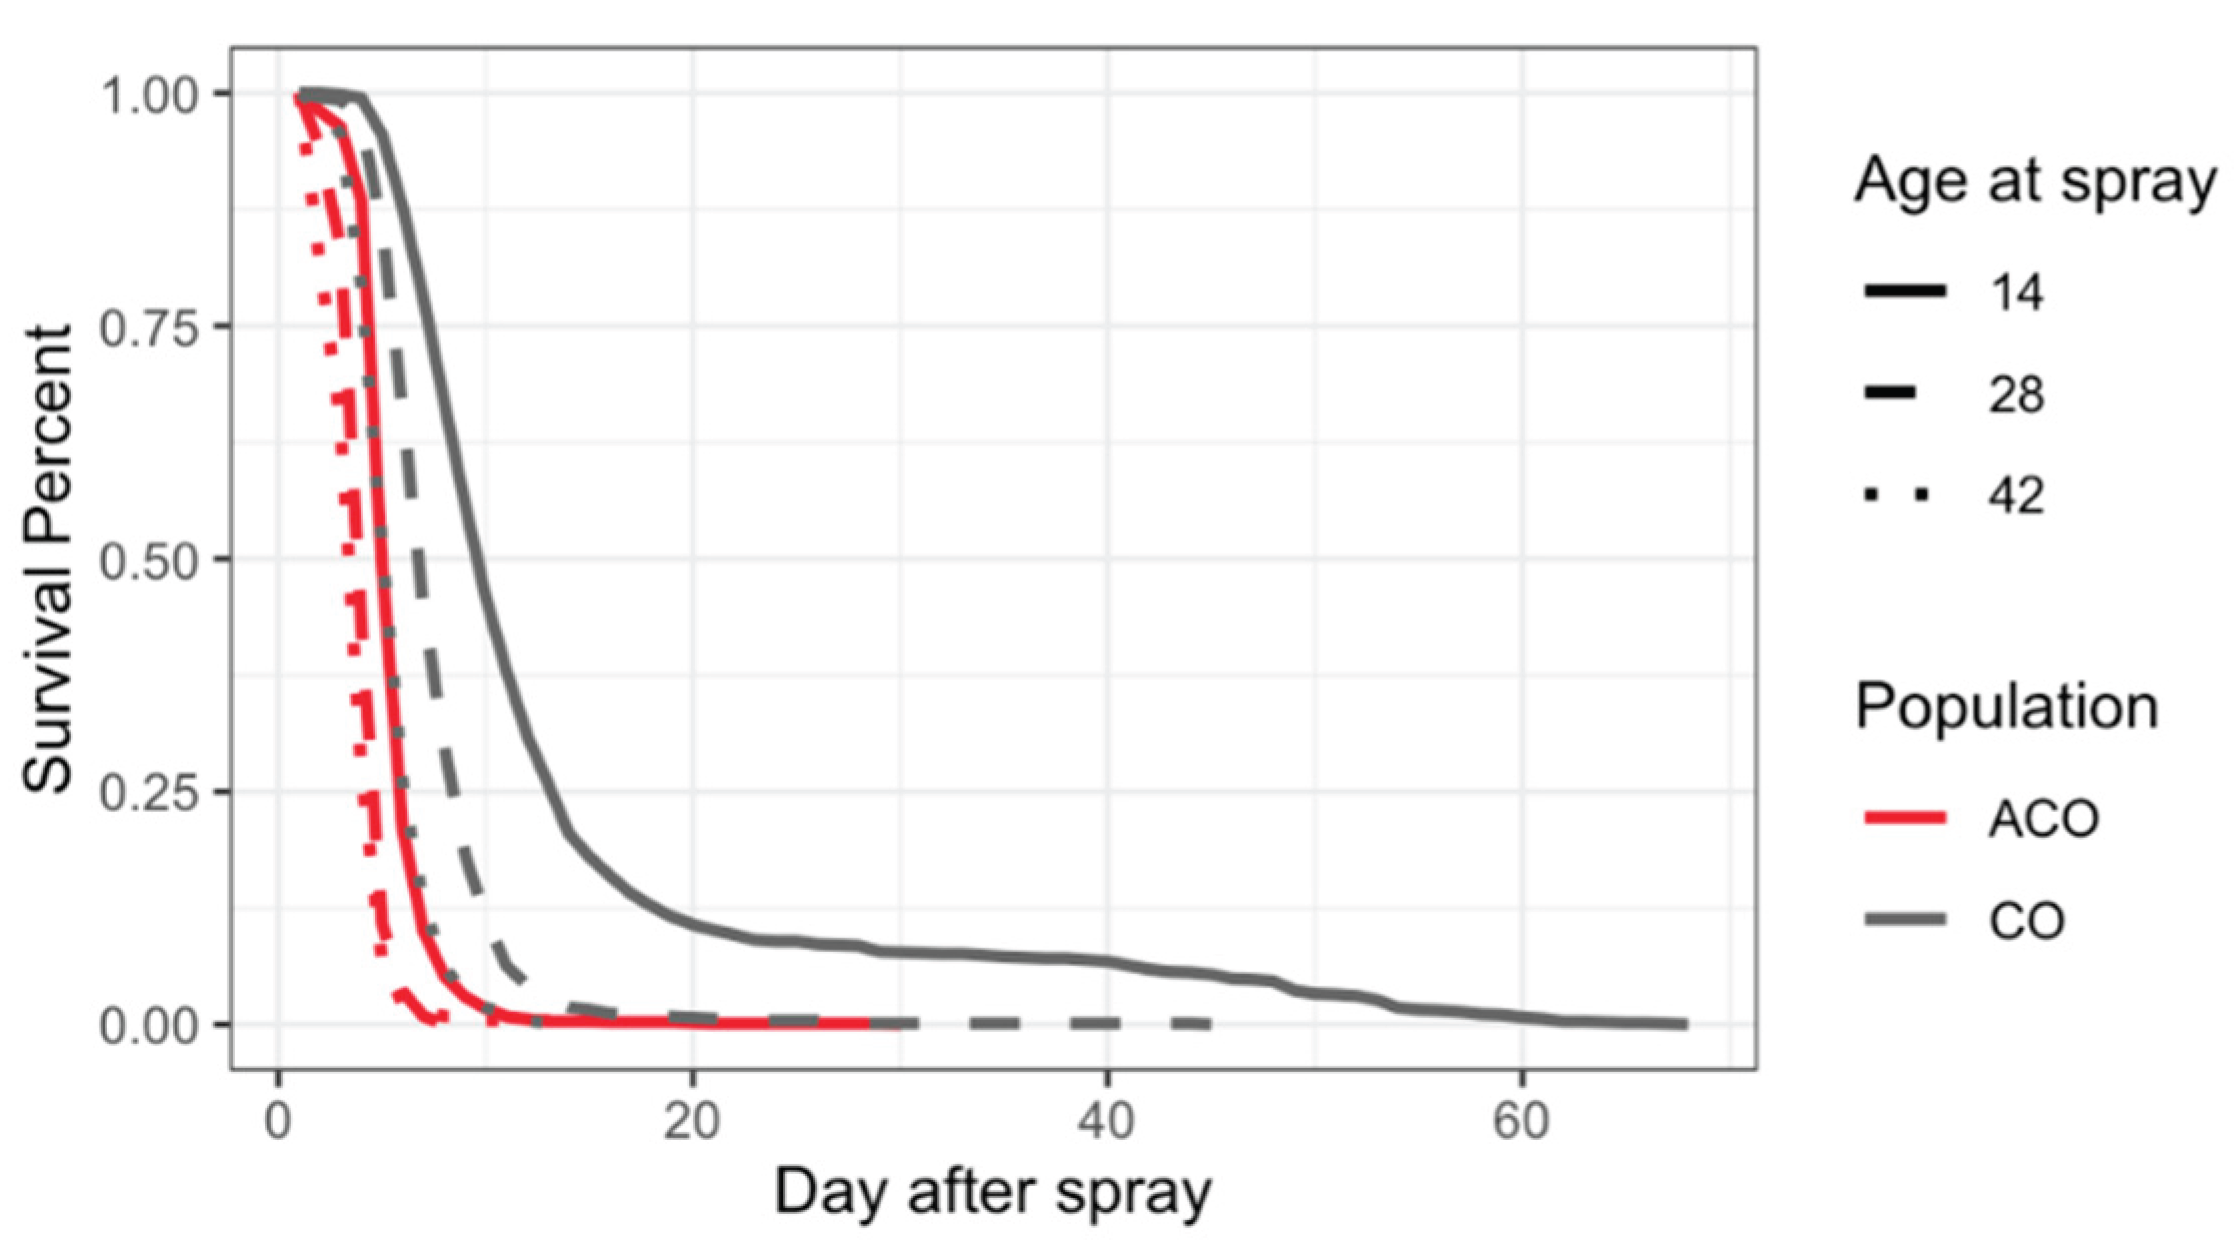

Table 1.
Immunity Measurement at Different ages in ACO. Using the Bayesian simulations, we computed the percent of change on scales and related 95% credible intervals for ACO populations. These are the changes of scales between the infected and uninfected ACO based on the sigma formula (). Sigma is called scale parameter. 95% intervals at age 14 is smaller than age 28 and 42. If the quantity is small, we say the change between the groups is small.
| Age | Sex | Estimates | 95% Intervals |
|---|---|---|---|
| Age 14 | Female | 0.016 | (0.015, 0.017) |
| Male | 0.019 | (0.018, 0.020) | |
| Age 28 | Female | 0.054 | (0.048, 0.059) |
| Male | 0.052 | (0.047, 0.058) | |
| Age 42 | Female | 0.084 | (0.076, 0.097) |
| Male | 0.089 | (0.081, 0.101) |
Table 2.
Immunity Measurement at Different Ages in CO. Using the Bayesian simulations, we computed the percent of change on scales and related 95% credible intervals for CO populations. These are the changes of scales between the infected and uninfected CO based on the sigma formula (). Sigma is called scale parameter. 95% intervals at age 14, 28, 42, 56, and 70 are shown. If the quantity is small, we say the change between the groups is small. Significant difference between male and female immunity at age 14 and 42.
| Age | Sex | Estimates | 95% Intervals |
|---|---|---|---|
| Age 14 | Female | 0.011 | (0.010, 0.012) |
| Male | 0.012 | (0.011, 0.013) | |
| Age 28 | Female | 0.015 | (0.014, 0.017) |
| Male | 0.017 | (0.016, 0.019) | |
| Age 42 | Female | 0.031 | (0.028, 0.034) |
| Male | 0.051 | (0.046, 0.060) | |
| Age 56 | Female | 0.091 | (0.082, 0.104) |
| Male | 0.099 | (0.080, 0.112) | |
| Age 70 | Female | 0.177 | (0.159, 0.203) |
| Male | 0.192 | (0.161, 0.225) |
Table 3.
ACO Versus CO Immunity. We build an exponential Weibull regression model per age using the Bayesian simulations to find the immunity measurements to compare ACO and CO populations of the same age.
Table 3.
ACO Versus CO Immunity. We build an exponential Weibull regression model per age using the Bayesian simulations to find the immunity measurements to compare ACO and CO populations of the same age.
| Age | Sex | Population | Estimates | 95% Intervals |
|---|---|---|---|---|
| Female | ACO | 0.04058 | (0.03522, 0.04779) | |
| 14 | CO | 0.01410 | (0.01254, 0.01410) | |
| Male | ACO | 0.06329 | (0.05398, 0.07544) | |
| CO | 0.01712 | (0.01448, 0.02005) | ||
| 28 | Female | ACO | 0.06155 | (0.05549, 0.06874) |
| CO | 0.00857 | (0.00778, 0.00943) | ||
| Male | ACO | 0.04694 | (0.04214, 0.05327) | |
| CO | 0.01014 | (0.00929, 0.01130) | ||
| 42 | Female | ACO | 0.07634 | (0.06126, 0.09586) |
| CO | 0.01554 | (0.01380, 0.01796) | ||
| Male | ACO | 0.10163 | (0.08395, 0.12585) | |
| CO | 0.02391 | (0.02089, 0.02820) |
Disclaimer/Publisher’s Note: The statements, opinions and data contained in all publications are solely those of the individual author(s) and contributor(s) and not of MDPI and/or the editor(s). MDPI and/or the editor(s) disclaim responsibility for any injury to people or property resulting from any ideas, methods, instructions or products referred to in the content. |
© 2025 by the authors. Licensee MDPI, Basel, Switzerland. This article is an open access article distributed under the terms and conditions of the Creative Commons Attribution (CC BY) license (http://creativecommons.org/licenses/by/4.0/).
Copyright: This open access article is published under a Creative Commons CC BY 4.0 license, which permit the free download, distribution, and reuse, provided that the author and preprint are cited in any reuse.


