
Submitted:
04 June 2025
Posted:
04 June 2025
You are already at the latest version
Abstract
This study aimed to valorize underutilized local ingredients by developing nutritionally enhanced pasta products enriched with sorghum and cork oak flours. The resulting pasta samples were characterized for their chemical composition, color attributes, functional properties, texture, microstructure, and antioxidant capacity. Semolina-based pasta showed higher protein content, while cork oak flour contributed significantly to lipid content, and sorghum flour was notably rich in fiber and minerals. Colorimetric analysis revealed visible differences in appearance depending on the type of flour used. Functional assessment showed comparable water absorption indices across all samples; however, sorghum-enriched pasta exhibited significantly higher water solubility. Textural analysis indicated that sorghum reduced pasta adhesiveness and cohesiveness, whereas cork oak flour increased hardness, gumminess, and adhesiveness—likely due to its high fiber content, contributing to a stickier mouthfeel. Microstructural observations confirmed a denser and more compact matrix in pasta formulated with cork oak flour. Antioxidant analysis revealed that cork oak flour imparted the highest antioxidant potential, followed by sorghum and semolina. HPLC/ESITOF- MS profiling demonstrated a rich and diverse polyphenolic composition in the enriched samples. These formulations not only enhance the functional and nutritional profile of traditional pasta but also align with the increasing consumer demand for low-carbohydrate, fiber-rich foods.
Keywords:
Trida pasta
; sorghum flour
; cork oak flour
; nutritional enhancement
; antioxidant capacity
; culinary quality
; texture profile
; microstructure
1. Introduction
Dry pasta is a staple food consumed globally and holds particular importance in Mediterranean diets, where it is valued for its texture and versatility. Traditionally, pasta is made from durum wheat semolina, which remains the main ingredient in conventional recipes [1]. The production of pasta typically involves a series of unit operations, including hydration, mixing, extrusion or lamination, and drying [2]. In Algeria, durum wheat is a fundamental part of the national diet, used to produce a variety of foods such as industrial pasta, couscous, flatbreads, and other traditional products. Surveys have documented the wide range of pasta types consumed across the country, especially in the eastern regions [3]. Among these, Trida is a notable traditional pasta, resembling Italian tagliatelle, and is widely enjoyed both in homemade preparations and, increasingly, by commercial producers. Recently, there has been growing interest in enhancing the nutritional value of pasta by incorporating bioactive ingredients beyond durum wheat [4]. Legume flours, barley, dietary fibers, proteins, and omega-3 fatty acids have all been explored as functional additions to improve pasta’s nutritional profile [5]. While these ingredients can boost nutritional content, they also influence the technological and sensory qualities of the final product. Parallel to this trend, there is increasing consumer demand for low-carbohydrate, high-fiber foods with reduced glycemic impact, driven by health concerns such as metabolic syndrome, diabetes, and weight management. Historically, during periods of food scarcity such as World War II, Algerian and Moroccan communities turned to alternative ingredients like acorn flour for making couscous and flatbreads [6]. Acorn flour from cork oak (Quercus suber L.) is particularly rich in unsaturated fatty acids (notably oleic acid), dietary fiber, minerals, and antioxidants. It provides slow-digesting carbohydrates and has a low glycemic index, making it an attractive option for health-conscious consumers. Sorghum (Sorghum bicolor), the world’s fifth most important cereal, is also valued for its high protein, fiber, and mineral content. Sorghum flour is widely used in gluten-free products and contributes to enhanced nutritional and functional properties. Despite the potential of these ingredients, research on their use in traditional Algerian pasta products remains limited. Many local foods, including pasta and couscous, are still under-studied and not fully documented [7]. The present study aims to develop a traditional Algerian pasta, Trida, enriched with sorghum flour ("draa" or "bechna" in Jijel province) and cork oak flour from Quercus suber (locally called "Ballout"). By incorporating these nutritionally valuable and underutilized local ingredients, the study seeks to diversify and enhance the range of traditional pasta products, assess the feasibility of producing pasta with these alternative flours, and evaluate the culinary quality, texture, microstructure, and antioxidant potential of the resulting pasta compared to a semolina-based control. These formulations result in a substantial reduction in digestible carbohydrates and a marked increase in dietary fiber, positioning them as promising candidates for the development of reduced-carbohydrate and lower glycemic index pasta products.
2. Materials and Methods
2.1. Raw Materials
The ingredients used in this study for the formulation of traditional Algerian pasta "Trida" include durum wheat semolina, two types of enrichment flours (sorghum flour and cork oak fruit flour), salt, and water. Four commercial durum wheat semolina samples (Triticum durum) were selected from the local market, each packaged in 25 kg bags and classified as "superior quality" (SSSE) primarily intended for pasta production. These semolina-labeled S1 (Spac), S2 (Kenza), S3 (Mexicali), and S4 (Bousbaa) were stored at ambient temperature in a dry place. According to packaging information, all semolina samples consisted of 100% durum wheat with no additives and were stored sealed under controlled ambient conditions until analysis. Salt used was extra-fine iodized table salt produced by the Algerian National Salt Company (E.N.A.Sel, Constantine, Algeria), packaged in 1 kg sachets for culinary use. Tap water served as the hydration medium for pasta preparation. For enrichment, two fermented flours were employed: sorghum flour (SF) from Sorghum bicolor, and cork oak flour (CF) from Quercus suber both purchased locally in the Jijel region of Algeria. Prior to laboratory testing, no pretreatment or blending was applied. Particle size distribution of the raw materials was determined by mechanical sieving, in accordance with the French standard NF V03-733 [8], using a stack of sieves with mesh sizes of 500 µm, 315 µm, 180 µm, and 125 µm. One hundred grams of each semolina were sieved, and the mass percentages retained on each sieve were measured to characterize particle size distribution.
2.2. Chemical Composition of Raw Materials
The chemical composition of the semolina and additives samples was determined using standardized laboratory methods to assess their suitability for pasta production. Moisture content of raw materials, as well pasta samples, was measured gravimetrically, in accordance with the French standard NF V03-707 [9] by drying approximately 5 g of sample in pre-weighed aluminum dishes at 130 ± 2 °C for 2 hours, then cooling in a desiccator and weighing to calculate dry mass as a percentage of initial mass (w/w). Ash content was determined by incinerating 5 g of semolina at 550 °C in a muffle furnace according to the French standard NF V03-720 [10], with the residual mineral matter weighed and expressed as a percentage of the dry sample. Total protein content was quantified using the Kjeldahl method (ISO 20483:2006) [11], involving digestion in sulfuric acid with a catalyst, neutralization, distillation, and titration of released ammonia; nitrogen content was converted to crude protein using a factor of 6.25 and expressed on a dry weight basis. Crude fat content was optionally measured by Soxhlet extraction (AOAC 920.39) [12], where about 5 g of sample underwent continuous petroleum ether extraction for 6 hours; after solvent evaporation, extracted lipids were dried, weighed, and reported as a percentage of dry mass. Additionally, dietary fiber content was determined using enzymatic-gravimetric methods (AOAC 985.29) [13], which involve enzymatic digestion of starch and protein followed by gravimetric measurement of insoluble and soluble fiber fractions, expressed as a percentage of dry matter. Digestible carbohydrates were calculated by difference, subtracting moisture, protein, fat, ash, and fiber contents from 100%, providing an estimate of available carbohydrates relevant for energy contribution. The energy value of semolina samples was calculated based on proximate composition using Atwater’s factors: 4 kcal/g for proteins and carbohydrates, and 9 kcal/g for fats, yielding total caloric content per 100 g dry weight.
2.3. Pasta Preparation
Samples of pasta were prepared using various semolina types and additives. Four semolina types were used: T1 (from "Spac" semolina), T2 (from "Kenza" semolina), T3 (from "Mexicali" semolina), and T4 (from "Bousbaa" semolina), combined with salt and water. The control pasta contained no additives and was made with 2000 g of semolina, salt, and 400 ml of water. Enriched pasta samples were prepared only with "Kenza" semolina: one formulation (TSF) included 1980 g of semolina (99%), 20 g of sorghum flour (Sorghum bicolor) (1%), salt, and 450 mL of water; the other (TCF) contained 1920 g of semolina (96%), 80 g of cork oak flour (Quercus suber) (4%), salt, and 600 mL of water. Pasta formulations are presented in Table 1. The pasta was rolled, spread with a thin layer of corn powder to prevent clogging, cut into small square portions and dried in a room temperature for a maximum 72 hours, then collected and stored in ambient conditions prior to analyses.
2.4. Pasta Characterization
2.4.1. Measurement of the Length, Width, and Thickness of Pasta
The geometric dimensions of the sample, including length, width, and thickness, were measured using a caliper. For the length measurement, the sample was positioned between the caliper jaws along its longest dimension. The jaws were gently closed until they made contact with the surface of the sample without compressing it, and the reading was recorded. The width was then measured by orienting the sample perpendicularly to the initial position and repeating the same procedure. To determine the thickness, the sample was placed between the thickness-measuring jaws of the caliper, which were gently closed until they held the sample firmly without causing deformation. The corresponding measurement was then noted. This procedure ensured accurate and reproducible geometric characterization of the sample in accordance with standard metrological practices [14].
2.4.2. Determination of Water Absorption Index and Water Solubility Index
The Water Absorption Index (WAI) and Water Solubility Index (WSI) were measured in triplicate following the procedure described by Wójtowicz and Mościcki [15]. In test tubes, 7 mL of distilled water was added to 0.7 g of ground dry pasta (particle size less than 300 µm). After standing for 5 min, the sample was mixed for 10 min and then centrifuged at room temperature at 15,000 rpm for 10 min in a Digicen 21 laboratory centrifuge (Labsystem, Kraków, Poland). The supernatant was collected and dried in an oven at 110 °C to constant weight. The water absorption index and water solubility index were calculated using the following equations:
WAI = (Weight of sediment) / (Weight of dry solids)
WSI = (Weight of dissolved solids in supernatant × 100) / (Weight of dry solids)
2.4.3. Color Profile Evaluation
Absolute color measurements of cooked pasta samples were performed using a Lovibond CAM-System 500 (The Tintometer Ltd., Amesbury, UK). The colorimetric parameters L* (lightness, where 0 = black and 100 = white), a* (red-green axis, with positive values indicating redness and negative values indicating greenness), and b* (yellow-blue axis, with positive values indicating yellowness and negative values indicating blueness) were quantified for each sample using the 2° standard observer position [16]. The instrument was calibrated prior to each analysis with certified white and black standard tiles to ensure measurement accuracy. The measurements were performed ten times for each pasta sample. To quantify the overall color difference between samples the ΔE* was calculated according to formula applied by Romankiewicz et al. [17].
2.5. Culinary Quality Assessment
Culinary quality was assessed in triplicate through three main parameters: minimum cooking time (MCT), water absorption capacity (WAC), and cooking loss (CL). These indicators reflect the technological behavior of pasta during cooking and are commonly used to evaluate product performance and consumer acceptability.
2.5.1. Minimum Cooking Time
Minimum cooking time (MCT) was determined according to the AACC International Approved Method 66-50 [18], with modifications from Chillo et al. [19]. A 10 g sample of flat pasta cut into small square strands (approximately 12–14 mm in length and 14 mm in width) was immersed in 300 mL of boiling distilled water. At regular 30-second intervals, a strand was removed and compressed between two Plexiglas plates to detect the presence of a white core, which indicates ungelatinized starch. The minimum cooking time (MCT) was recorded when the white core completely disappeared, indicating full gelatinization of the starch.
2.5.2. Water Absorption Capacity
Water absorption capacity (WAC) was evaluated based on the method described by Chillo et al. [19]. A 10 g sample of pasta was cooked in 300 mL of boiling distilled water for the optimal cooking time, then rinsed with 100 mL of cold water (20 °C) and drained for 3 minutes using a strainer. The weight of the cooked pasta was recorded, and water absorption was calculated using the following equation:
WAC (%) = (Weight of cooked pasta−Weight of dry pasta/Weight of dry pasta)× 100
2.5.3. Cooking Loss
Cooking loss (CL) was determined using the procedure adapted from Chillo et al. [19], Wójtowicz and Mościcki [15], and Bouasla et al. [20]. A 10 g pasta sample was cooked in 300 mL of distilled water at the optimal cooking time, rinsed with 100 mL of cold water (20 °C), and drained for 3 minutes. The combined cooking and rinsing water was collected and evaporated in an oven at 110 °C until constant weight. The cooking loss, expressed as grams of dry matter lost per 100 g of dry pasta, was calculated as follows:
CL (%) = (Weight of residue/ Weight of dry pasta)× 100
2.6. Texture Profile Analysis
Texture measurements of cooked and drained pasta (50 g) were performed using the Zwick-Roell BDO-FB0.5 TH instrument (Zwick GmbH & Co., Ulm, Germany) similarly to the method described by Szydłowska-Tutaj et al. [21]. The instrument testXpert® 13.3 software automatically calculated key texture parameters, including hardness as a maximum force during first compression, adhesiveness as a work required to overcoming an adhesion between sample and cell material surface, cohesiveness, gumminess (multiplying the product of hardness and cohesiveness), springiness, and chewiness (multiplying the product of gumminess and springiness). OTMS Ottawa cell was used in the experiment with double-compression test with a test speed of 100 mm/min and 50% compression of the cooked pasta layer with 10 s distance between cycles [20,22].
2.7. Functional Components and Antioxidant Activity Analyses of Raw Materials and Pasta Products
2.7.1. Accelerated Solvent Extraction (ASE)
1.0 g of powdered flours, additives and dried pasta products was weighed on an analytical balance. The tested material was then transferred to a 10-mL cell (cell) and extracted with a series of solvents (ethyl acetate, dichloromethane, methanol, 1% tartaric acid solution in methanol, and cyclohexane) by ASE pressurized liquid extraction. One cycle lasted 10 minutes, and each measure of plant material was extracted three times with a new portion of a given solvent. The temperature was 80 °C and the pressure reached 111.5 bar. The extracts, after evaporation to dryness, were transferred to a 10 mL volumetric flask and made up to that volume with methanol.
2.7.2. Qualitative Analysis of Selected Polyphenolic Compounds by high-Performance Liquid Chromatography Coupled to a Mass Spectrometer (HPLC/ESI-TOF-MS)
The sorghum and cork oat extracts were analyzed by high-performance liquid chromatography using an Agilent G3250AA LC/MSD TOF system consisting of an HP 1200 chromatograph (Agilent Technologies, Santa Clara, CA, USA), an autosampler, a pump, a thermostat, a degasser and an LC/MSD 6210 mass spectrometer with a time-of-flight (TOF) analyzer, a dual sputtering system for the sample (ESI) and for the mass standard, and a nitrogen generator. A Zorbax STABLE BOND RP-18 column (250 x 21 mm, dp = 5 μm) at an analysis temperature of 25 °C was used as the stationary phase. The mobile phase was a gradient mixture of A (1% acetonitrile in water with 0.1% formic acid and 10 mM ammonium formate, pH = 3.5) and B (95% acetonitrile in water with 0.1% formic acid and 10 mM ammonium formate, pH = 3.5). From the beginning of the analysis until 45 min, the gradient was linear from 1–60% B solution. During the next minute, the B concentration increased to 90%, which was maintained for a further 4 min. The analysis time was 50 min with a constant mobile phase flow rate of 0.2 mL/min. The sample volume dispensed was 10 μL. Analysis was carried out in an ion source in negative ion mode at fragmentor energies of 140 V, 200 V and 250 V. Identification of the compounds was based on the analysis of ESI-TOF-MS spectra performed at high resolution in the ion source.
2.7.3. Determination of the Total Content of Polyphenolic Compounds
The total content of polyphenolic compounds (TPC) in the analyzed extracts was determined by spectrophotometric method. For this purpose, a UV-VIS spectrophotometer and Folin-Ciocalteu (F-C) reagent were used.
A calibration curve was prepared using the reaction of gallic acid solution with Folin- Ciocalteu reagent (F-C). The work began with the preparation of a standard gallic acid solution. To do this, 5 mg of gallic acid was weighed out, then 100 µL of methanol and 900 µL of distilled water were added. The measuring vessel was capped, and its contents were mixed well. From the resulting gallic acid standard solution, 0, 10, 20, 30, 40, 50, 60, 70, 100, 200 µL were taken sequentially, transferred to separate volumetric vessels, and then methanol was added in such an amount that the final volume of each calibration solution was 1 mL. Accordingly, calibration solutions of gallic acid were obtained with concentrations of, respectively: 0; 0.05; 0.10; 0.15; 0.20; 0.25; 0.30; 0.35; 0.5; 1.0 mg/mL. Then, 100 µL of calibration solutions of appropriate concentrations were transferred sequentially into separate 5 mL glass dishes. 900 µL of distilled water and 100 µL of Folin-Ciocalteu reagent were added. The dishes were capped, their contents mixed, wrapped in aluminum foil and left for 4 minutes. After this time, 1 mL of 7.7% freshly prepared sodium bicarbonate solution and 400 mL of distilled water were added to the dishes. The dishes were capped again, stirred, and then placed in a 40 °C water bath for 50 minutes. Absorbance was measured at 765 nm. Distilled water was used as a reference. The results obtained were used to prepare a calibration curve. It was used to calculate the total polyphenol content of the analyzed extracts. The volume of the extracts was converted to gallic acid content (mg GAE/mL).
Determination of the total content of polyphenolic compounds in the analyzed extracts was carried out as follows. 100 µL each of the tested extracts were transferred to separate 5 ml glass dishes. 900 µL of distilled water and 100 µL of Folin-Ciocalteu reagent were added. The dishes were capped, their contents were mixed, wrapped in aluminum foil and left for 4 minutes. After this time, 1 mL of 7.7% freshly prepared sodium bicarbonate solution and 400 mL of distilled water were added to the dishes. The dishes were capped again, stirred, and then placed in a 40 °C water bath for 50 minutes. Absorbance was measured at 765 nm. Ao sample was prepared by replacing the extract with methanol [23]. Each determination was performed 3 times.
2.7.4. Determination of Total Flavonoid Content
Total flavonoid content (TFC) was determined by a colorimetric method using aluminum chloride. A standard solution of quercetin was used to prepare a calibration curve. For this purpose, 200 mg of quercetin was weighed in a measuring cup and made up to 5 mL with methanol. The contents of the vessel were dissolved. From the quercetin standard solution, 0, 10, 50, 75, 100, 150, 200, 300, 400 µL were taken. It was then transferred to separate 5 mL volumetric flasks and made up with methanol. The flasks were capped with a stopper and stirred. The concentrations obtained were 0; 0.08; 0.40; 0.60; 0.80; 1.20; 1.6; 2.40; 3.2; mg/mL, respectively. From the obtained calibration solutions, 1 mL each was taken, 4 mL of distilled water and 0.3 mL of 5% NaNO2 solution were added. The sample prepared in this way was left for 5 min. Then 0.3 mL of 10% aluminum chloride solution was added and left for 6 minutes. After this time, 2 mL of 1M NaOH was added. The sample was made up to 10 mL with distilled water, capped, mixed and allowed to stand for 10 min. Absorbance was measured at 510 nm. Distilled water was used as a reference. The results obtained were used to prepare a calibration curve. Based on it, the content of flavonoids in the analyzed extracts was calculated.
The total content of flavonoids was determined as follows. Into 10 mL volumetric flasks were transferred 0.5 mL of the extract under study. Then 0.5 mL of methanol, 4 mL of distilled water and 0.3 mL of 5% sodium nitrate (III) solution (NaNO2) were added. The flasks were capped and allowed to stand for 5 minutes. After this time, 0.3 mL of 10% aluminum chloride solution (AlCl3) was added, the sample was mixed and allowed to stand for 6 minutes. After this time, 2 mL of 1M sodium hydroxide (NaOH) solution was added. The sample was made up to 10 mL with distilled water, capped, mixed and allowed to stand for 10 minutes. Absorbance was measured at 510 nm. The Ao sample was prepared by replacing the extract with methanol and aluminum chloride with distilled water [23]. Other sample preparation steps remained unchanged. Each determination was performed 3 times.
2.7.5. Spectrophotometric Analysis of the Obtained Extracts to Determine Their Antioxidant Properties
Determination of the antioxidant capacity of the tested extracts was carried out using a methanolic solution of DPPH (2,2-diphenyl-1-picrylhydrazyl). This is a solution of stable radicals, which changes color from purple to yellow due to a reduction reaction. The DPPH solution was obtained by weighing 0.0039 g of solid DPPH, quantitatively transferring it to a 100 mL volumetric flask, and then topping up with methanol to the mark. A solution of DPPH with a concentration of 0.001 mM was obtained. The solution thus prepared was mixed and refrigerated overnight to stabilize. Spectrophotometric measurements were performed at 517 nm. A UV-VIS spectrophotometer was used for the study, and pure methanol was used for calibration. Spectrophotometric analysis began by measuring the absorbance of a control sample, which consisted of 2.5 mL of DPPH solution and 0.5 mL of methanol. Readings were taken every 2 minutes until the result was stabilized (3 identical values were obtained). The result obtained had to be in the range of 0.900-0.999. The absorbance of the test samples (2.5 mL of DPPH solution and 0.5 mL of test sample) was then measured [23]. Changes in absorbance were read after 0 min, 2.5 min, 5 min, and then every 5 minutes for half an hour. Pure methanol was used as a reference. Each determination was performed 3 times.
2.7.6. TLC-DPPH Test of the Obtained Extracts
The antioxidant properties of the extracts obtained were tested chromatographically using the TLC-DPPH (Thin Layer Liquid Chromatography) test, using 10 × 10 cm silica gel plates as the stationary phase. The mobile phase was a mixture of ethyl acetate, toluene and formic acid in a ratio of 10:10:0.5 v/v/v. The extracts were applied using an automated TLC applicator: Desaga AS-30, the volume of sample applied was 7 µL. The plates were developed unidirectionally in horizontal chambers. After drying, they were sprayed with 0.1% methanolic DPPH solution. The plates were then scanned after 0, 10 and 30 minutes and the image was saved in JPG format. The computer program Sorbfil TLC Videodensitometr software (Sorbpolymer Ltd., Krasnodar, Russia) was used for interpretation of the results.
2.8. Microstructure Observations
Samples of dry pasta and cooked products after freeze-drying were used to observe a microstructure. Pasta samples were mounted on aluminum specimen stubs using a double-sided adhesive silver tape to expose surface and cross-section. Samples were sprayed with gold using Sputter Coater Emitech K550X (Emitech, Essex, UK). Microstructure of pasta was observed with various magnifications of ×200 and ×600 with a scanning electron microscope Vega Tescan LMU (Tescan, Brno, Czech Republic) at an accelerating voltage of 20 keV [20].
2.9. Statistical Analysis
All experiments were performed in replicates, and the resulting data were analyzed using analysis of variance (ANOVA) with SPSS software (version 17.0). Mean values and standard deviations were identified, importance of differences was assessed using Duncan’s multiple range test with statistical significance set at p < 0.05.
3. Results
3.1. Results of Chemical Composition of Raw Materials
The chemical composition analysis results of the raw materials in samples S1 (semolina Spac), S2 (semolina Kenza), S3 (semolina Mexicali), S4 (semolina Bousbaa), SF (Sorghum bicolor flour) and CF (Quercus suber, cork oak flour) are tabulated in Table 2. Presented results revealed significant nutritional variability that aligns with their botanical origins, as well as with established literature values. The semolina samples (S1–S4), derived from durum wheat, exhibited higher protein content consistent with typical enriched semolina values (~12–13% protein), supporting their suitability for products requiring strong dough structure, such as pasta.
In contrast, the flours SF and CF showed lower protein levels, in accordance with the study of Gopalan et al. [24] which mention that wheat contain a higher protein content than sorghum, reflecting their different botanical sources and typical soft flour profiles. Notably, CF (cork oak flour) presented elevated fat content and higher energy value (8.69%), most likely due to its rich lipid content, as reported in Table 2. SF (sorghum flour) had the highest ash and fiber contents (28.27%), consistent with sorghum’s known high mineral and dietary fiber levels, which contribute to its recognized functional food potential. Moisture content of raw materials was relatively uniform among semolina samples but lower in SF and CF, potentially enhancing their shelf life and storage stability. Lower moisture levels decrease water activity, which limits microbial growth and enzymatic spoilage, thereby improving product stability during storage [25]. Carbohydrate content was consistent across semolina (~72–73% typical), but reduced in SF and CF (48.49% and 45.41%, respectively), correlating with their higher fiber and fat contents. This trend is consistent with recent findings indicating that fiber-enriched flours and wholegrain products typically have lower carbohydrate percentages due to the presence of non-digestible polysaccharides and lipids [26,27]. These compositional differences reflect wheat variety, botanical origin, milling, and correspond well with nutritional ranges reported for semolina and wheat flour products [28]. Overall, the results underscore the influence of raw material on nutritional quality, with semolina samples offering high protein and moderate fiber, SF providing exceptional fiber and mineral content, and CF contributing valuable lipids and fiber content, suitable for health-promoting food formulations. The variation in fiber and lipid contents is particularly relevant for designing foods targeting metabolic health and gut microbiota modulation [29]. Moreover, application of tested additives may have an effect on caloric value of enriched products due to the lower energy content in these raw materials, supporting the development of functional foods with reduced caloric density aimed at weight management [30].
3.2. Pasta Characterization Results
3.2.1. Geometric Dimensions of Pasta Samples
The results corresponding to the geometric dimensions of developed Trida pasta samples including length, width, and thickness (in mm) are presented in the Table 3.
The pasta samples show relatively consistent lengths, ranging from approximately 13.45 mm (T3) to 14.35 mm (TCF), with TCF (pasta enriched with cork oak flour) being the longest on average. Widths vary more noticeably, with TCF again showing the greatest average width (13.85 mm), while T2 has the narrowest average width (12.81 mm). Thickness measurements are generally below 1 mm, with T1 being the thickest (0.81 mm) and TSF (sorghum-enriched pasta) the thinnest (0.63 mm). The ranges indicate some variability in pasta size within each sample, but overall, the enriched pastas (TCF and TSF) tend to have slightly larger dimensions compared to traditional control semolina pasta (T1-T4). These dimensional differences may influence cooking behavior and texture, as pasta thickness and size affect water absorption and heat penetration during cooking. The slightly greater thickness and width of TCF could contribute to a firmer texture, while the thinner TSF pasta might cook faster but be more delicate. Consistent size measurements are essential for quality control and to ensure uniform cooking and consumer acceptability.
3.2.2. Water Absorption Index (WAI) and Water Solubility Index (WSI) Results of Pasta
The moisture content of Trida pasta presented in Table 4 prepared from six different semolina and flour types shows no significant differences (p > 0.05), ranging from 10.89% (T1) to 11.47% (T2), with all samples falling within a narrow interval (10.89 – 11.47%). These values are well within the international standards for dried pasta, which typically recommend a maximum moisture content of 12.5% to ensure product stability and safety [31]. The slight variations observed between samples may be attributed to differences in raw material composition or minor fluctuations in processing and drying conditions [32]. The consistently low moisture levels across all pasta samples indicate effective drying and suggest that each formulation is suitable for extended shelf life and resistant to microbial spoilage, as moisture content directly influences water activity, a critical factor for microbial growth [33].
Furthermore, WAI and WSI are important functional parameters reflecting the ability of starch and protein fractions in pasta to absorb and solubilize in water, respectively, which affect cooking quality and texture [34]. Variations in WAI and WSI among different semolina and flour types can be related to differences in starch damage, protein content, and fiber levels [35], impacting water uptake during cooking and final product acceptability. The Water Absorption Index (WAI) values for all samples (T1 to T4, TCF, and TSF) are very similar, ranging from 1.54 to 1.61%, indicating comparable water retention and hydration capacities across the samples. This suggests that the starch and protein matrix in the pasta samples has a similar capacity to absorb water, which is a key factor influencing cooking quality and texture [32]. However, the WSI showed greater variation: most samples have moderate WSI values between 5.81% and 7.33%, reflecting similar levels of soluble components such as degraded starch and soluble fibers [34]. Sample TSF exhibited a significantly higher and more variable WSI (10.19% ± 5.13%), suggesting greater release of soluble substances. This elevated solubility can be attributed to a higher content of damaged starch or soluble fiber fractions in additive used, which may increase nutrient leaching and alter texture during cooking [35]. Higher WSI values are often correlated with softer texture and increased cooking loss, which could negatively impact sensory quality, but may also enhance bioavailability of some nutrients [36]. Therefore, the distinct WSI profile of TSF implies potential differences in cooking behavior and functional properties compared to other samples, which should be considered when developing pasta products with specific texture or nutritional goals.
3.2.3. Results of Pasta Color Profile
Durum semolina pasta brightness and yellowness are considered as one of the most important parameters by both consumers and manufacturers. Semolina pasta should characterize a bright yellow color indicates that the pasta is of high quality [37]. However, enrichment of pasta often leads to color changes. Table 5 shows the values of the cooked pasta colorimetric parameters.
The colorimetric analysis of cooked pasta samples clearly demonstrates the significant influence of flour type on pasta color attributes. Semolina-based pastas (T1 to T4) exhibited high lightness (L* 60–61), low redness (a* 0.8–1.2), and moderate yellowness (b* 9.2–10.6), which aligns well with the typical color profile of durum wheat pasta reported in previous studies [38]. The bright yellow color of semolina pasta is primarily attributed to the presence of carotenoid pigments, especially lutein, which are known to impart desirable visual appeal and are considered quality indicators in pasta products [39]. Among the semolina pasta samples, T4 showed the highest lightness and yellowness, indicating a visually brighter and more appealing product, while T3 was slightly paler, which could be related to variations in pigment content or processing conditions. This variability within semolina pastas is consistent with findings by Feillet et al. [40], who noted that differences in wheat cultivar and milling processes can affect pasta color.
The cork oak flour-enriched pasta (TCF) exhibited a markedly lower lightness (L* = 46.2) and significantly higher redness (a* = 4.71), suggesting a darker and richer hue. This is likely due to the natural phenolic and tannin compounds present in cork oak flour, which contribute to pigmentation and antioxidant properties but also darken the product [41]. Despite the darker color, the yellowness (b*) remained similar to the brightest semolina pasta (T4), indicating that the yellow pigments were not substantially diminished. The sorghum flour-enriched pasta (TSF) showed intermediate lightness and redness values but a notably lower yellowness (b* = 7.48). Sorghum’s pigmentation is often dominated by tannins and phenolic compounds that can impart reddish or brownish hues but lack the intense yellow carotenoids of semolina [42]. There were insignificant differences in total color change index ΔE* between semolina pasta, however both sorghum flour and cork oak flour caused visible differences with values of 3.70 and 14.20 for TSF and TCF pasta, respectively. Visible difference from reference sample is indicated when the ΔE* value is over 3.5 [37].
Overall, these results underscore the critical role of flour composition in determining pasta color, which is a key quality attribute influencing consumer acceptance. While semolina remains the standard for bright yellow pasta, the incorporation of local flours such as cork oak and sorghum offers opportunities to diversify pasta products with distinct visual and nutritional characteristics. For example, Sujka et al. [37] tested pasta products with addition of buckwheat hull to pasta recipe and even addition of 1 to 5% of hulls affected on lower lightness and significant changes in ΔE*. Biernacka et al. [43] added powdered cereal coffee to pasta and differences in ΔE* values were even more significant (13.73-20.94) as compared to control pasta. Martín-Esparza et al. [44] reported total color differences between control and supplemented pasta at the range from 3.5 to 11.0 so differences were clearly visible if tiger nut flour was added. But they concluded that color variation in supplemented pasta is accepted by consumers as they generally associate pasta rich in dietary fiber with a darker color [44].
3.3. Culinary Quality of Pasta
The culinary quality parameters of Trida pasta samples (Table 6) demonstrated variations in minimum cooking time (MCT), water absorption capacity (WAC), and cooking loss (CL), each reflecting structural and compositional differences among the formulations. Most samples (T1–T3) exhibited short and consistent MCTs around 2.00 min, while T4 showed a significantly shorter MCT (1.30 ± 0.01 min), suggesting a more porous or less cohesive matrix. In contrast, TSF and TCF required longer cooking times (2.15 ± 0.17 and 2.30 ± 0.05 min), which could be attributed to stronger gluten networks or higher levels of protein or fiber, as previously observed in legume-enriched or fiber-rich pasta formulations [45].
Regarding water absorption, T4 had the highest WAC (299.82 ± 0.12%), reflecting enhanced hydration properties, likely due to structural openness or reduced protein aggregation, while TCF had the lowest (214.33 ± 1.23%), indicating a denser, less hydrated matrix [46]. Cooking loss values remained within acceptable limits for pasta quality (<8%), with T4 approaching this threshold (8.08 ± 0.04%), and T3 and TCF demonstrating superior cooking stability (7.58 ± 0.03%). According to recent studies, lower cooking losses are indicative of a well-developed protein-starch matrix, which prevents excessive leaching of solids during boiling [47]. These results highlight TCF and T3 as the most promising formulations in terms of both cooking tolerance and nutritional integrity.
3.4. Texture Profile of Cooked Pasta
The texture of cooked pasta is a crucial factor influencing consumer acceptance, as it directly affects the eating experience and overall product appeal [48]. Table 7 presents the texture profile of semolina pasta and developed enriched pasta samples, highlighting differences in parameters such as hardness, adhesiveness, cohesiveness, and chewiness that can impact sensory perception and preference. T4 pasta exhibited the lowest hardness, gumminess and chewiness, probably due to the finer semolina granulation and more soft structure after cooking.
The textural properties of the cooked enriched pasta samples demonstrate that incorporating cork oak flour (TCF) results in pasta texture with significantly higher hardness, adhesiveness, cohesiveness, gumminess, springiness, and chewiness compared to traditional semolina pasta, especially T1 – T3 samples reflecting firm, elastic, and chewy textures typical for semolina pasta, which enhances structural integrity and cooking quality. In contrast, the sorghum flour-enriched pasta (TSF) showed moderate hardness and chewiness but lower adhesiveness and cohesiveness, likely due to its distinct protein, and fiber profile that produces a softer, less elastic texture. According to Bolarinwa and Oyesiji [49], in their study about soy-fortified rice pasta, the increased gumminess observed in their pasta suggests that these samples are likely to have a sticky mouthfeel, which may be attributed to the high fiber content present in soy flour.
3.5. Results of Functional Components and Antioxidant Activity of Raw Materials and Pasta Products
3.5.1. Results of Qualitative Analysis of Selected Polyphenolic Compounds in Raw Materials by HPLC/ESI-TOF-MS
A qualitative analysis of the extracts obtained from sorghum and cork oak flours was conducted using high-performance liquid chromatography (HPLC) due to the notably high antioxidant potential demonstrated by these raw materials. The analysis aimed to identify and characterize the compounds responsible for the observed antioxidant activity. Understanding the chemical profile of these bioactive constituents is essential for elucidating the mechanisms underlying their antioxidant properties, as well as for evaluating their potential applications in the development of functional foods or nutraceutical products. Gaining insight into the phenolic and other antioxidant-related compounds present in sorghum and cork oak makes it possible to better assess their contribution to health-promoting effects, supporting their use as natural sources of antioxidants in food formulations. Qualitative analysis of the phenolic profiles of sorghum and cork oak bark, performed using high-performance liquid chromatography coupled with electrospray ionization time-of-flight mass spectrometry (HPLC/ESI-TOF-MS), revealed a diverse array of polyphenolic compounds in both additives. These findings align with previous studies emphasizing the complexity and richness of phenolic profiles in natural plant sources and their significance in functional food development [50].
The analysis of pasta enriched with sorghum flour SF revealed a distinct phenolic fingerprint. Detected compounds included scopoletin and its isomer, hydroxycaproic acid, phenyl lactic acid, luteolin and its methyl ether, eriodictyol, and naringenin (Figure 1, Table 8).
Many of these compounds belong to the flavonoid subclass and exhibit a range of bioactivities. For instance, luteolin and naringenin are known for their anti-inflammatory, anti-cancer, and neuroprotective effects. Scopoletin, a coumarin derivative, has been reported to possess antioxidant and immunomodulatory activity, while eriodictyol has shown promise in mitigating oxidative damage and inflammation [51].
In the case of cork oak flour CF, accelerated solvent extraction (ASE) allowed the identification of several key phenolic acids and their derivatives, including quinic acid, gallic acid, citric acid, ethyl gallate, methyl gallate, a methylated form of digallic acid, and ellagic acid (Figure 2, Table 9).
These compounds are known for their potent antioxidant, anti-inflammatory, and antimicrobial properties [52]. Gallic acid and ellagic acid, in particular, are well-documented for their radical scavenging abilities and protective roles against oxidative stress-related diseases, including cardiovascular and neurodegenerative disorders. The presence of ethyl and methyl derivatives suggests that oak bark not only contributes free phenolic acids but also more lipophilic conjugates, which may influence their bioavailability and absorption in the human body [52]. Furthermore, the use of ASE proved effective in extracting a wide range of polar and semi-polar phenolic compounds, highlighting its suitability for profiling complex plant-based matrices. These detailed phenolic maps not only contribute to understanding the chemical diversity of functional food ingredients but also provide a scientific basis for future studies exploring their bioactivity and health promoting effects.
3.5.2. Results of Total Content of Polyphenolic Compounds (TPC)
Polyphenols are widely recognized for their health-promoting properties, particularly their ability to scavenge free radicals, modulate enzyme activity, and influence cell signaling pathways associated with inflammation [53]. Total polyphenols content was determined spectrophotometrically by the Folin-Ciocalte method and converted to GAE gallic acid unit (mg GAE/mL of extract). Calibration curve of gallic acid was: y = 3.2941x + 0.0314. The total polyphenol content expressed as gallic acid equivalents (GAE), varied significantly among the tested samples or raw materials, additives and prepared pasta (Table 10).
The lowest TPC values were observed in flours, particularly in semolina, which is in line with previous findings that refined cereal products contain limited phenolic compounds due to the removal of the bran layer during milling [54]. Whole grain flours tend to retain a broader spectrum of polyphenols; however, semolina, being highly refined, lacks much of this bioactive fraction.
Pasta samples demonstrated intermediate levels of TPC, likely reflecting both the dilution of added ingredients and potential degradation of polyphenols during thermal processing. Several studies have reported that cooking and extrusion processes can affect the stability and extractability of polyphenolic compounds in cereal-based products [55]. Despite these losses, the fortification of pasta with polyphenol-rich additives significantly enhanced its phenolic profile. Among the additives, cork oak flour CF exhibited the highest TPC that of sorghum SF. This result aligns with the known phytochemical composition of cork oak bark, which is rich in hydrolysable tannins, phenolic acids and flavonoids. Sorghum flour SF, while slightly lower in TPC than cork oak bark flour CF, still represents a valuable source of polyphenols [56].
Polyphenols are widely recognized for their health-promoting properties, particularly their ability to scavenge free radicals, modulate enzyme activity, and influence cell signaling pathways associated with inflammation. These compounds have an OH group attached to the aromatic ring, determining their antioxidant properties. For many years, it was thought that phenolic antioxidants acted only by a simple hydrogen atom transfer (HAT) mechanism. However, thanks to the development of research methods, it has been proven that most often the mechanism of these reactions is complex, and the rate of reaction of the antioxidant with radicals can be the resultant effect of different mechanisms. Following this line of thought, it was found that the total mechanism of the reaction of an antioxidant having an OH group with a radical is a combination of HAT mechanisms and electron transfer preceded by deprotonation of the OH group- a sequential proton-loss electron-transfer (SPLET) mechanism. Thus, the free radical scavenging efficiency of polyphenols is not determined only by the number of OH groups and their position. The results obtained are very important, from a nutritional point of view [57].
3.5.3. Results of Total Flavonoid Content (TFC)
Flavonoids are the broadest group of phenolic compounds, playing a very important role in protecting the human body from various diseases, mainly due to their high antioxidant activity. Therefore, in the next step, the total content of flavonoids was determined using the aluminum chloride colorimetric method, converting the results obtained into rutin equivalents. The rutin (RA) standard curve was: y = 0.9613x + 0.0638.
The analysis of total flavonoid content TFC, expressed as rutin equivalents, revealed generally low levels in both semolina and pasta (Table 10). These findings are consistent with previous research indicating that traditional cereal-based products, particularly refined wheat flours such as semolina, are typically poor sources of flavonoids due to the removal of bran and germ during milling [54]. In contrast, the highest flavonoid concentrations were observed in the additives used - most notably in cork oak flour CF, followed by sorghum flour SF. The superior flavonoid content of CF is well documented in the literature; it is particularly rich in polyphenolic compounds such as flavonols, flavan-3-ols, and ellagitannins. Sorghum SF also contributes significantly to the flavonoid profile, particularly through its high levels of 3-deoxyanthocyanidins, which are known for their antioxidant and anti-inflammatory properties [58].
Flavonoids play a critical role in human health by neutralizing reactive oxygen species (ROS) and thereby reducing oxidative stress. A growing body of epidemiological and clinical evidence suggests that regular intake of dietary flavonoids is associated with a lower risk of non-communicable diseases such as type 2 diabetes, cardiovascular diseases (including atherosclerosis and stroke), certain cancers, and neurodegenerative disorders. Importantly, maintaining a balanced intake and diversity of flavonoids may enhance their synergistic effects and improve bioefficacy [23,59].
The current findings underscore the nutritional limitations of conventional semolina-based products and the potential health benefits of enriched TSF and TCF pasta products with flavonoid-rich additives. Incorporating ingredients such as cork oak flour and sorghum flour into pasta formulations may not only improve their antioxidant capacity, as previously discussed, but also provide functional benefits by increasing the dietary intake of bioactive flavonoids.
3.5.4. Results of Antioxidant Properties of Raw Materials and Pasta by Spectrophotometric Method Using DPPH
A test with a methanolic solution of DPPH was used to determine the antioxidant capacity of the tested extracts. DPPH is a free radical with a relatively high persistence; in the presence of an oxidant, it is reduced, and its solution turns from violet to yellow, which is monitored spectrophotometrically, at 517 nm. The results are presented as the degree of DPPH stable free radical scavenging (RSA %, Table 11).
The results obtained in this study clearly demonstrate the variability of antioxidant activity among the different samples, both raw materials (semolina and flours) and the corresponding pasta formulations, as assessed by the DPPH radical scavenging assay. Semolina pasta, evaluated at the 30th minute of the test, exhibited relatively poor antioxidant properties, with DPPH scavenging ability ranging from 30.19% to 40.17%. These findings are consistent with existing literature indicating that traditional durum wheat semolina contains limited amounts of phenolic compounds and flavonoids, which are key contributors to antioxidant activity [54].
In contrast, the incorporation of sorghum and cork oak flour into the pasta significantly enhanced the antioxidant potential. Pasta enriched with sorghum TSF exhibited moderate DPPH radical scavenging activity (53.10%), which may be attributed to the high content of phenolic acids, flavonoids, and tannins present in sorghum grains [50]. Cork oak flour, known for its exceptionally rich polyphenolic profile, particularly ellagitannins and gallic acid derivatives - demonstrated even greater scavenging ability when used as an additive in TCF pasta (64.15%), and when tested in its pure form as CF, it showed the highest antioxidant capacity (approximately 91%). These results align with previous reports on the potent antioxidant activity of Quercus species bark extracts [52].
Moreover, pure sorghum SF extract displayed substantial antioxidant capacity (78.65%), outperforming both the sorghum-enriched TSF and cork oak-enriched TCF pasta variants. This may indicate that the matrix of pasta itself potentially impairs the bioavailability or reactivity of polyphenolic compounds during the radical scavenging assay, possibly due to interactions with starch or protein fractions, as previously suggested in food matrix studies [60,61].
These findings emphasize the potential of using functional ingredients such as sorghum and oak bark to enhance the antioxidant profile of cereal-based products. However, the efficacy of these additives can vary depending on their concentration, form, and interactions within the food matrix, warranting further exploration into their stability during processing and digestion.
3.5.5. TLC-DPPH Results of the Extracts Obtained From Raw Materials and Pasta Products
To confirm the antioxidant properties, food samples were analyzed by thin layer chromatography using a stable DPPH radical (the so-called TLC-DPPH assay). Extracts prepared by the ASE method were successively applied to silica gel coated plates and developed. After drying, the plates were sprayed with 0.1% methanolic DPPH solution and scanned after 0, 10 and 30 minutes. The image was then saved in JPG format and converted to numerical data in the Sorbfil TLC Videodensitometrs software. The calculated free radical scavenging potentials were the sum of the areas under the trac peaks of the respective extracts with respect to the area of the semolina extract, whose activity was taken as 1 (Table 12).
Eight peaks corresponding to antioxidant compounds were observed in the sorghum flour (SF) extract, as shown in Figure 3. In comparison, five peaks were identified in the extract of pasta enriched with added sorghum flour (TSF), while the semolina extract showed only three (S1). Such results demonstrate the greater diversity and richness of compounds with potential antioxidant properties in sorghum flour compared to both semolina and pasta containing sorghum additive. A particularly low diversity and presence of antioxidant compounds was found in the semolina sample. These conclusions are confirmed by quantitative analysis, the results of which are presented in Table 12. This analysis is based on the measurement of the area under individual chromatographic peaks, with the value for semolina taken as a unit (1). The values obtained show a clearly higher level of antioxidant compounds in sorghum flour, as well as - although to a lesser extent - in pasta with it than in semolina. The convergence of qualitative and quantitative data clearly indicates the more favorable antioxidant properties of sorghum flour. The results obtained in the TLC-DPPH assay for semolina and pasta with its addition coincide with those obtained in spectrophotometric analyses using DPPH.
As demonstrated in Table 12, the DPPH scavenging abilities of sorghum flour SF extract and sorghum-enriched pasta TSF were found to be lower in comparison to those of extracts containing cork oak flour. These results are consistent with those obtained by spectrophotometric analysis using DPPH. The cork oak flour extract (CF) showed the highest antioxidant activity among the samples analyzed, which clearly indicates the richness of bioactive phenolic compounds in this raw material. Slightly lower levels of antioxidant properties were recorded in pasta extracts enriched with cork oak flour (TCF). In both cases - for both CF flour and TCF products - the presence of four peaks corresponding to antioxidant compounds was observed Figure 4).
In comparison, extracts from semolina (S1) showed only three such peaks. The results of the quantitative analysis of antioxidant compounds are consistent with the qualitative data. The highest values of area under the chromatographic peaks were obtained for CF flour, followed by TCF pasta, while the lowest values were obtained for the S1 semolina sample. This implies not only a higher total content of antioxidant compounds in cork oak flour and its derived products, but also a greater diversity of these compounds, which may be important from the point of view of health-promoting potential. The observed differences in the antioxidant profile between samples of whole-grain origin and semolina are consistent with previous literature reports. As demonstrated by Durazzo et al. [54], highly processed products such as refined wheat products are characterized by a significantly reduced content of phytochemicals, mainly due to the removal of seed coat layers during the milling process, which are the main source of compounds with antioxidant activity.
In light of the data obtained, it can be concluded that pastas enriched with cork oak flour can be a valuable source of natural antioxidants in the diet. Thus, they can potentially contribute to reducing the risk of developing civilization diseases, such as cardiovascular disease, type 2 diabetes and oxidative inflammation. The addition of cork oak flour may therefore play an important role in the design of functional foods with health-promoting properties.
3.6. Pasta Microstructure
Developed pasta based on semolina and pasta enriched with sorghum flour and cork oak flour was analyzed with scanning electron microscopy for the surface and cross-section at various magnifications (×200 and ×600). Structure pictures of the surface of tested pasta were taken both for dry pasta as well as after cooking as freeze-dried samples. SEM surface pictures of dry products are presented in Figure 5 and surface of cooked pasta products in Figure 6. There are visible raw granules of semolina starch on the surface of dry pasta (Figure 5a and 5b) with a specific shape and size with no significant differences between semolina pasta T2 and T4. Some places on the pasta surface are rough with more uneven surface than observed for enriched pasta products, especially for T4 pasta. This may be an explanation of such high WAC results obtained for this pasta, where the cooking water had a greater access to pasta internal structures through porous surface. If sorghum flour was applied in the recipe the surface of Trida pasta was compact and smooth (Figure 5c) whereas pasta with cork oak flour addition showed smooth surface with melted places where some bigger particles with different size and shape were observed indicating the presence of additive (Figure 5d), especially at high magnification (×600).
Surface of cooked and freeze-dried pasta products presented in Figure 6 showed very compact and smooth surface in pasta T2 and T4 made with semolina only (Figure 6a and 6b, respectively). This uniform and flat surface structure is characteristic for semolina pasta, whereas more flat surface was noted for T4 pasta where semolina with the finer particle size was used. Pasta TSF enriched with sorghum flour formed on the surface some cooked agglomerates with visible longitudinal protein structures embedded in molten starch matrix (Figure 6c) due to the high content of protein in sorghum flour added to pasta products. In this pasta the most compact and firm structure was observed with the highest hardness, cohesiveness and chewiness results. The most contrasting structure was the surface observed in TCF pasta (Figure 6d). Here, a lot of fibrous structures was found linked to each other with small empty spaces between, with low cohesiveness and springiness results of this pasta after cooking. In this pasta minimal cooking time and WAC results were the lowest making this pasta more dense and less elastic, probably due to the highest fiber content coming from cork oak flour addition.
Figure 7 illustrated cross-section pictures of the tested dry pasta obtained with various magnification by SEM technique. Structure and thickness of T2 and T4 pasta was similar (Figure 7 a and Figure 7b, respectively). A lot of singular starch granules were visible both on cross-section and surface as well as a few empty spaces inside dry pasta structures. More dense and compact internal structure was found in TSF cross-section with lower thickness of pasta squares confirming results of geometric dimensions of dry pasta (Figure 7c). In this pasta some starch granules were embedded into uniform and smooth structure which was more compact than in semolina pasta. Then if a cork oak flour was used as an additive the internal structure was compact but less uniform with visible agglomerates of raw materials banded with fibrous matrix of protein and fiber from cork oak flour (Figure 7d).
Cooked pasta cross-section pictures, showed in Figure 8, differed depend on pasta components.
T2 semolina pasta appeared a loose internal structure with big in size empty spaces after water penetration during cooking (Figure 8a). In T4 pasta, where internal structure was more spongy-like clear protein network of gluten chains is visible and small empty pores inside are more uniform in size (Figure 8b). Pasta enriched with sorghum flour, presented in Figure 8c, showed not only a gluten network but also some more thick and long protein chains were observed as sorghum flour was rich in proteins other than gliadin and glutenin from durum semolina. These thick, dense and long molten chains may be the reason of the highest hardness, cohesiveness and chewiness results obtained for pasta texture in a double-compression test. This internal structure was leafy-like and several layers were observed as formed during handy rolling of the dough. TCF pasta products (Figure 8d) showed the smallest empty space inside, with very short internal connections between protein structures, probably due to the high fiber and fat content in cork oak flour. These could disturb the formation of uniform long-chain structure after cooking and a lot of small spaces with disrupted structure after leaching pasta components into cooking water was found in the inside structure of TCF pasta.
Romano et al. [62] tested initial microstructures of starch in durum wheat semolina which was mainly characterized by various sizes starch granules as A-type with average diameter 10 μm and B-type with average diameter 2-3 μm. Lu et al. [63] identified diverse wheat starch granule sizes confirmed the presence of both granule types: A-type (diameter over 9.9 μm) and B-type (diameter below 9.9 μm). They reported in a native common wheat flour the presence of A-type granules which contain up to 70% of the volume and 10% of the total number of starch granules, and B-type granules which contain 30% of the volume and 90% of the total granules number. Geera et al. [64] reported also C-type granules (below 3% of total starch granules by weight in endosperm) which are considered mostly as a part of B-type fractions. In our developed dry pasta mostly A-type is present, lenticular in shape and with diameter over 10 μm, but also B-type is visible as small granules with spherical shape (Figure 5). Martín-Esparza et al. [44] obtained similar to our observations structure of uncooked pasta with addition of high fiber tiger nuts and xanthan, in a cross-section compact starch-protein matrix stabilized the product with only few empty holes visible. In cooked pasta the internal structure was similar to that reported by Gallo et al. [65] for durum wheat semolina and whole durum wheat semolina cooked spaghetti. They reported indistinguishable starch granules and protein matrix in external part of pasta after cooking because of protein coagulation and starch gelatinization via cooking process. Internal structure closer to pasta core consisted swollen starch granules embedded in a coagulated but dense protein network. This was only slightly observed in our pasta due to the shape and small thickness of pasta squares which can be hydrated in a shorter time than spaghetti-shape pasta and no contain a core part.
4. Conclusions
This study demonstrates that application of sorghum flours (Sorghum bicolor) and cork oak (Quercus suber) as enriching traditional Algerian Trida pasta significantly enhanced its nutritional and functional properties. Chemical composition analysis confirmed that semolina-based pastas offer higher protein content, while cork oak flour contributes valuable lipids and total fiber and sorghum flour provides exceptional fiber and mineral content. All pasta samples maintained low moisture content, ensuring product stability and shelf life. Functional properties assessment showed comparable water absorption across samples, with increased water solubility observed in sorghum-enriched pasta. Colorimetric evaluation revealed that flour type strongly influences pasta appearance, with semolina producing the brightest, most yellow pasta, sorghum flour addition resulted in less yellow products and cork oak flour addition yielded darker and more red pasta. Culinary quality varied in the tested samples, especially in WBC and texture profile indicating the most important effect of sorghum flour on cooking behavior and structure of developed TSF pasta. HPLC/ESI-TOF-MS profiling confirmed a rich diversity of polyphenolic compounds in the enriched pasta, both those with sorghum and cork oak flours. Importantly, antioxidant potential analyses, including total polyphenol content, flavonoid content, and DPPH radical scavenging assays, demonstrated that cork oak flour impart the highest antioxidant capacity, followed by sorghum flour and semolina. The surface and internal structure differs for enriched pasta and semolina samples, confirming observations of culinary quality and texture of developed pasta. These findings highlighted the potential of using underutilized local ingredients to produce nutritionally superior and functionally diverse pasta products, which may contribute to improved dietary antioxidant intake and help prevent diseases associated with oxidative stress.
Author Contributions
Conceptualization: R.S., H.N., A.W; methodology: R.S., M.S., A.W.; software: R.S., B.A., A.W.,K.K.D. M.D., A.O.; validation: R.S., L.H., A.W., K.K.D, N.H., M.S., L.R., A.O. formal analysis, R.S., B.A., A.W., K.K.D, M.D..; investigation, , R.S., B.A., A.W., K.K.D. M.D. A.O.; resources: R.S., A.W., A.O. ,H.N., L.R; data curation: R.S., L.H., A.W., M.S., M.D., L.R.; writing—original draft preparation: R.S., L.H., B.A., A.W., K.K.D, M.S., M.D., L.R., A.O.; writing—review and editing: R.S., L.H., A.W., M.D., L.R.; visualization: R.S., L.H., B.A., A.W., K.K.D, L.R., A.O.; supervision: L.H., A.W. and L.R.; project administration: H.N., A.W., L.R.; funding acquisition: A.W., H.N., L.R. All authors have read and agreed to the published version of the manuscript.
Funding
Funding: This project was funded under the National Recovery and Resilience Plan (NRRP), Mission 4 Component 2 Investment 1.4—Call for tender No. 3138 of 16 December 2021, rectified by Decree n.3175 of 18 December 2021 of Italian Ministry of University and Research funded by the European Union—NextGenerationEU; Award Number: Project code CN_00000033, Concession Decree No. 1034 of 17 June 2022 adopted by the Italian Ministry of University and Research, CUP: D43C22001260001, Project title “National Biodiversity Future Center—NBFC”.
Institutional Review Board Statement
Not applicable.
Informed Consent Statement
Not applicable.
Data Availability Statement
Dataset available on request from the authors.
Acknowledgments
The Ministry of Higher Education and Scientific Research of Algeria is gratefully acknowledged.
Conflicts of Interest
The authors declare no conflicts of interest.
References
- Romano, A.; Ferranti, P.; Gallo, V.; Masi, P. New ingredients and alternatives to durum wheat semolina for a high quality dried pasta. Curr. Opin. Food Sci. 2021, 41, 249–259. [Google Scholar] [CrossRef]
- Gallo, V.; Romano, A.; Masi, P. Does the presence of fibres affect the microstructure and in vitro starch digestibility of commercial Italian pasta? Food Struct. 2020, 24, 100139. [Google Scholar] [CrossRef]
- Hammami, R.; Sissons, M. Durum wheat products: Couscous. In Wheat Quality for Improving Processing and Human Health, G. Igrejas, T. M. Ikeda, & C. Guzmán Eds., Springer, 2020, pp. 345–366. [CrossRef]
- Carpentieri, S.; Larrea-Wachtendorff, D.; Donsì, F.; Ferrari, G. Functionalization of pasta through the incorporation of bioactive compounds from agri-food by-products: Fundamentals, opportunities, and drawbacks. Trends Food Sci. Technol. 2022, 122, 49–65. [Google Scholar] [CrossRef]
- Rawat, N.; Indrani, D. Functional ingredients of wheat-based bakery, traditional, pasta, and other food products. Food Rev. Intern. 2015, 31(2), 125–146. [Google Scholar] [CrossRef]
- Boukid, F. (Ed.). Cereal-Based Foodstuffs: The Backbone of Mediterranean Cuisine. Springer International Publishing, 2021. [CrossRef]
- Hunter, J.B.; Emanuel, J.; Drysdale, A.E. Food Service and Food System Logistics at the South Pole: Lessons for a Lunar/Martian Planetary Surface Mission. SAE Technical Paper Series, 2003, 01, 2365. [Google Scholar] [CrossRef]
- AFNOR. NF V03-733:2000. Expression des résultats analytiques – Présentation des résultats avec leurs chiffres significatifs et leur incertitude. Association Française de Normalisation, Paris, 2000.
- AFNOR. NF V03-707:2000. Produits alimentaires – Dosage des cendres – Méthode gravimétrique. Association Française de Normalisation, Paris, 2000.
- AFNOR. NF V03-720:2000. Produits alimentaires – Expression des résultats – Arrondissement des chiffres. Association Française de Normalisation, Paris, 2000.
- ISO. ISO 20483:2006. Cereals and pulses – Determination of the nitrogen content and calculation of the crude protein content – Kjeldahl method. International Organization for Standardization, Geneva, 2006.
- AOAC International. Official Method 920.39 – Fat (Crude) or Ether Extract in Foods. In Official Methods of Analysis, 18th ed.; AOAC International, Gaithersburg, MD, 2005.
- AOAC International. Official Method 985.29 – Total Dietary Fiber in Foods. In Official Methods of Analysis, 18th ed.; AOAC International, Gaithersburg, MD, 2005.
- Callister, W.D.; Rethwisch, D.G. Materials Science and Engineering: An Introduction. 10th ed., Hoboken (NJ), Wiley, 2018. Available from: https://www.wiley.com/en.
- Wójtowicz, A.; Mościcki, L. Influence of legume type and addition level on quality characteristics, texture and microstructure of enriched precooked pasta. LWT - Food Sci. Technol. 2014, 59, 1175–1185. [Google Scholar] [CrossRef]
- Cavazza, A.; Corradini, C.; Rinaldi, M.; Salvadeo, P.; Borromei, C.; Massini, R. Evaluation of pasta thermal treatment by determination of carbohydrates, furosine, and color indices. Food Bioprocess. Technol. 2013, 6, 2721–2731. [Google Scholar] [CrossRef]
- Romankiewicz, D.; Hassoon, W.H.; Cacak-Pietrzak, G.; Sobczyk, M.; Wirkowska-Wojdyła, M.; Ceglińska, A.; Dziki, D. The effect of chia seeds (Salvia hispanica L.) addition on quality and nutritional value of wheat bread. J. Food Quality. 2017, 7352631. [Google Scholar] [CrossRef]
- AACC. Approved Methods of the American Association of Cereal Chemists, AACC, St. Paul, MN, USA, 2000.
- Chillo, S.; Laverse, J.; Falcone, P.; Del Nobile, M. Quality of spaghetti in base amaranthus wholemeal flour added with quinoa, broad bean and chick pea. J. Food Eng. 2008, 84, 101–107. [Google Scholar] [CrossRef]
- Bouasla, A.; Wójtowicz, A.; Zidoune, M.N.; Olech, M.; Nowak, R.; Mitrus, M.; Oniszczuk, A. Gluten-free precooked rice-yellow pea pasta: Effect of extrusion-cooking conditions on phenolic acids composition, selected properties and microstructure. J. Food Sci. 2016, 81, C1070–C1079. [Google Scholar] [CrossRef]
- Szydłowska-Tutaj, M.; Złotek, U.; Wójtowicz, A.; Combrzyński, M. The effect of the addition of various species of mushrooms on the physicochemical and sensory properties of semolina pasta. Food Funct. 2022, 13(16), 8425–8435. [Google Scholar] [CrossRef]
- Lewko, P.; Wójtowicz, A.; Kamiński, D.M. The influence of processing using conventional and hybrid methods on the composition, polysaccharide profiles and selected properties of wheat flour enriched with baking enzymes. Foods 2024, 13, 2957. [Google Scholar] [CrossRef] [PubMed]
- Kasprzak-Drozd, K.; Oniszczuk, T.; Kowalska, I.; Mołdoch, J.; Combrzyński, M.; Gancarz, M.; Dobrzański, B.; Kondracka, A.; Oniszczuk, A. Effect of the production parameters and in vitro digestion on the content of polyphenolic compounds, phenolic acids, and antiradical properties of innovative snacks enriched with wild garlic (Allium ursinum L.) leaves. Int. J. Molecul. Sci. 2022, 23(24), 14458. [Google Scholar] [CrossRef]
- Gopalan, C.; Ramasastri, B.V.; Balasubramanian, S.C. Nutritive Value of Indian Foods. National Institute of Nutrition (NIN), Indian Council of Medical Research, 2004.
- Zhang, Y.; Zhao, X.; Chen, L.; Liu, Y. Influence of water activity on shelf life and quality of cereal products: A review. Food Control 2021, 121, 107567. [Google Scholar] [CrossRef]
- Ranhotra, G.S.; Gelroth, J.A.; Lorenz, K. Nutritional composition of wheat and wheat products: The effect of bran, germ and fiber. Cereal Chem. 2020, 97(3), 327–335. [Google Scholar] [CrossRef]
- Călinoiu, L.F.; Gheldiu, A.M.; Vodnar, D.C.; Socaci, S.A. Wholegrain and bran fraction in cereal-based foods: Health impacts and recent advances. Nutrients 2022, 14(2), 298. [Google Scholar] [CrossRef]
- Bhatta, M.; Arendt, E.K.; Gallagher, E. The impact of milling on nutritional and functional properties of wheat and rye flours: A review. Trends Food Sci. Technol. 2020, 100, 120–134. [Google Scholar] [CrossRef]
- Kumar, P.; Sinha, A.K.; Makkar, H.P.S.; Becker, K. Dietary fibers and gut microbiota: Mechanisms and health benefits. Critic. Rev. Food Sci. Nutr. 2022, 62(12), 3232–3248. [Google Scholar] [CrossRef]
- Silva, F.A.; Lopes, C.M.; Santos, L.M. Development of low-calorie functional foods: Trends and challenges. Food Res. Int. 2019, 123, 310–321. [Google Scholar] [CrossRef]
- Codex Alimentarius Commission. Codex Standard for Pasta (CODEX STAN 212-1999). Food and Agriculture Organization/World Health Organization, 2019. https://www.fao.org/fao-who-codexalimentarius/codex-texts/list-standards/en/.
- Giuberti, G.; Cerioli, C.; Galli, V.; Gallo, V. Influence of raw material and processing parameters on pasta quality: A review. Food Res. Int. 2020, 137, 109706. [Google Scholar] [CrossRef]
- Kim, S.K.; Kim, H.; Lee, M. Moisture content and water activity effects on microbial stability and shelf life of dried pasta products. Food Microbiol. 2021, 94, 103641. [Google Scholar] [CrossRef]
- Zhou, Y.; He, J.; Wang, J.; Wang, X. Water absorption index and solubility index in cereal-based products: Impact on cooking and sensory quality. J. Cereal Sci. 2022, 101, 103376. [Google Scholar] [CrossRef]
- Cappa, C.; Cattivelli, L.; Borrelli, G.M. Role of starch damage and protein content on water absorption indices of pasta made from durum wheat. LWT - Food Sci. Technol. 2020, 117, 108608. [Google Scholar] [CrossRef]
- Rashid, M.A.; Khan, M.I.; Husain, S.Z. Influence of damaged starch on cooking quality and nutrient retention in pasta products. J. Food Process. Preserv. 2019, 43(9), e14069. [Google Scholar] [CrossRef]
- Sujka, K.; Cacak-Pietrzak, G.; Sułek, A.; Murgrabia, K.; Dziki, D. Buckwheat hull-enriched pasta: Physicochemical and sensory properties. Molecules 2022, 27, 4065. [Google Scholar] [CrossRef] [PubMed]
- Sissons, M.; Abecassis, J.; Marchylo, B.; Cubadda, R. Methods used to assess and predict quality of durum wheat, semolina, and pasta. In Durum Wheat: Chemistry and Technology, M. Sissons, J. Abecassis, B. Marchylo, and M. Carcea (Eds.); 2nd ed., AACC International, Inc., St. Paul, MN, USA, 2012, pp. 213–234. [CrossRef]
- Oladunmoye, O. Physico-chemical, nutritional and sensory qualities of cassava-wheat semolina macaroni noodles. Doctoral dissertation, 2012. http://ir.library.ui.edu.ng/handle/123456789/9462.
- Feillet, P.; Autran, J.C.; Icard-Vernière, C. Pasta brownness: An assessment. J. Cereal Sci. 2000, 32(3), 215–233. [Google Scholar] [CrossRef]
- Inácio, L.G.; Bernardino, R.; Bernardino, S.; Afonso, C. Acorns: From an ancient food to a modern sustainable resource. Sustainability, 2024, 16(22), 9613. [Google Scholar] [CrossRef]
- Rather, M.A.; Thakur, R.; Hoque, M.; Das, R.S.; Miki, K.S.L.; Teixeira-Costa, B.E.; Gupta, A.K. Sorghum (Sorghum bicolor): Phytochemical composition, bio-functional, and technological characteristics. In Nutri-Cereals: Nutraceutical and Techno-Functional Potential, Sharma, R., Nanda, V., Sharma, S., Eds.; CRC Press: Boca Raton, FL, USA, 2023, pp. 45–77.
- Biernacka, B.; Dziki, D.; Gawlik-Dziki, U.; Różyło, R. Common wheat pasta enriched with cereal coffee: Quality and physical and functional properties. LWT—Food Sci. Technol. 2020, 139, 110516. [Google Scholar] [CrossRef]
- Martín-Esparza, M.E.; Raigón, M.D.; Raga, A.; Albors, A. High fibre tiger nut pasta and xanthan gum: cooking quality, microstructure, physico-chemical properties and consumer acceptance. Food Sci. Biotechnol. 2018, 27(4), 1075–1084. [Google Scholar] [CrossRef]
- Bustos, M.C.; Pérez, G.T.; León, A.E. Influence of fiber-rich ingredients on quality of pasta. Food Rev. Int. 2020, 36(5), 431–454. [Google Scholar] [CrossRef]
- Martínez, M. M.; Li, C.; Dhital, S.; Gidley, M. J. Structural basis and kinetics of starch digestion. Trends Food Sci. Technol. 2021, 108, 524–535. [Google Scholar] [CrossRef]
- Guerra, A.; Bresciani, A.; Marti, A.; Pagani, M. A.; Iametti, S. Understanding the protein-starch matrix in pasta: Implications for quality and digestibility. LWT – Food Sci. Technol. 2023, 177, 114547. [Google Scholar] [CrossRef]
- Bhattacharya, M.; Zee, S.Y.; Corke, H. Physicochemical properties related to quality of rice noodles. Cereal Chem. 1999, 76, 861–867. [Google Scholar] [CrossRef]
- Bolarinwa, I. F.; Oyesiji, O. O. Gluten free rice-soy pasta: proximate composition, textural properties and sensory attributes. Heliyon 2021, 7(1), e06052. [Google Scholar] [CrossRef] [PubMed]
- Rao, S.; Santhakumar, A.B.; Chinkwo, K.A.; Wu, G.; Johnson, S.K.; Blanchard, C.L. Characterization of phenolic compounds and antioxidant activity in sorghum grains. J. Cereal Sci. 2018, 84, 103–111. [Google Scholar] [CrossRef]
- De Morais Cardoso, L.; Pinheiro, S.S.; Martino, H.S.D.; Pinheiro-Sant’Ana, H.M. Sorghum (Sorghum bicolor L.): Nutrients, bioactive compounds, and potential impact on human health. Critic. Rev. Food Sci. Nutr. 2017, 57(2), 372–390. [Google Scholar] [CrossRef]
- Tanase, C.; Nicolescu, A.; Nisca, A.; Ștefănescu, R.; Babotă, M.; Mare, A.D.; Ciurea, C.N.; Man, A. Biological activity of bark extracts from northern red oak (Quercus rubra L.): An antioxidant, antimicrobial and enzymatic inhibitory evaluation. Plants 2022, 11, 2357. [Google Scholar] [CrossRef]
- Dacrema, M.; Sommella, E.; Santarcangelo, C.; Bruno, B.; Marano, M.G.; Insolia, V.; Saviano, A.; Campiglia, P.; Stornaiuolo, M.; Daglia, M. Metabolic profiling, in vitro bioaccessibility and in vivo bioavailability of a commercial bioactive Epilobium angustifolium L. extract. Biomed. Pharmacother. 2020, 131, 110670. [Google Scholar] [CrossRef]
- Durazzo, A.; Azzini, E.; Turfani, V.; Polito, A.; Maiani, G.; Carcea, M. Effect of cooking on lignans content in whole-grain pasta made with different cereals and other seeds. Cereal Chem. 2013, 90(2), 193–198. [Google Scholar] [CrossRef]
- Punia, H.; Tokas, J.; Malik, A.; Sangwan, S. Characterization of phenolic compounds and antioxidant activity in sorghum (Sorghum bicolor (L.) Moench) grains. Cereal Res. Commun. 2021, 49(3), 343–353. [Google Scholar] [CrossRef]
- Przybylska-Balcerek, A.; Frankowski, J.; Stuper-Szablewska, K. Bioactive compounds in sorghum. Europ. Food Res. Technol. 2019, 245(6), 1075–1080. [Google Scholar] [CrossRef]
- Altunkaya, A.; Gökmen, V.; Skibsted, L. H. pH dependent antioxidant activity of lettuce (L. sativa) and synergism with added phenolic antioxidants. Food Chem. 2016, 190, 25–32. [Google Scholar] [CrossRef] [PubMed]
- Khan, I.; Yousif, A.M.; Johnson, S.K.; Gamlath, S. Acute effect of sorghum flour containing pasta on plasma total polyphenols, antioxidant capacity and oxidative stress markers in healthy subjects: A randomised controlled trial. Clinic. Nutr. 2015, 34(3), 415–421. [Google Scholar] [CrossRef] [PubMed]
- Burda, S.; Oleszek, W. Antioxidant and antiradical activities of flavonoids. J. Agric. Food Chem. 2001, 49(6), 2774–2779. [Google Scholar] [CrossRef]
- Seraglio, S.K.T.; Valese, A.C.; Daguer, H.; Bergamo, G.; Azevedo, M.S.; Nehring, P.; Gonzaga, L.V.; Fett, R.; Costa, A.C.O. Effect of in vitro gastrointestinal digestion on the bioaccessibility of phenolic compounds, minerals, and antioxidant capacity of Mimosa scabrella Bentham honeydew honeys. Food Res. Int. 2017, 99(1), 670–678. [Google Scholar] [CrossRef]
- Gayoso, L.; Claerbout, A.-S.; Calvo, M.I.; Cavero, R.Y.; Astiasarán, I.; Ansorena, D. Bioaccessibility of rutin, caffeic acid and rosmarinic acid: Influence of the in vitro gastrointestinal digestion models. J. Funct. Foods 2016, 26, 428–438. [Google Scholar] [CrossRef]
- Romano, A.; di Luccia, A.; Romano, R.; Sarghini, F.; Masi, P. Microscopic and thermal characteristics of experimental models of starch, gliadins, glutenins and gluten from semolina. 12th International Conference on Chemical and Process Engineering (ICheaP) 2015, 43, 163–168. [Google Scholar] [CrossRef]
- Lu, H.; Wang, C.; Guo, T.; Xie, Y.; Feng, W.; Li, S. Starch composition and its granules distribution in wheat grains in relation to post-anthesis high temperature and drought stress treatments. Starch/Starke 2014, 66, 419–428. [Google Scholar] [CrossRef]
- Geera, B.P.; Nelson, J.E.; Souza, E.; Huber, K.C. Composition properties of A- B-type starch granules of wild-type, partial waxy, waxy soft wheat. Cereal Chem. 2006, 83, 551–557. [Google Scholar] [CrossRef]
- Gallo, V.; Romano, A.; Masi, P. Does the presence of fibres affect the microstructure and in vitro starch digestibility of commercial Italian pasta? Food Struct. 2020, 24, 100139. [Google Scholar] [CrossRef]
Figure 1.
HPLC/MS chromatogram of extract from sorghum flour SF.
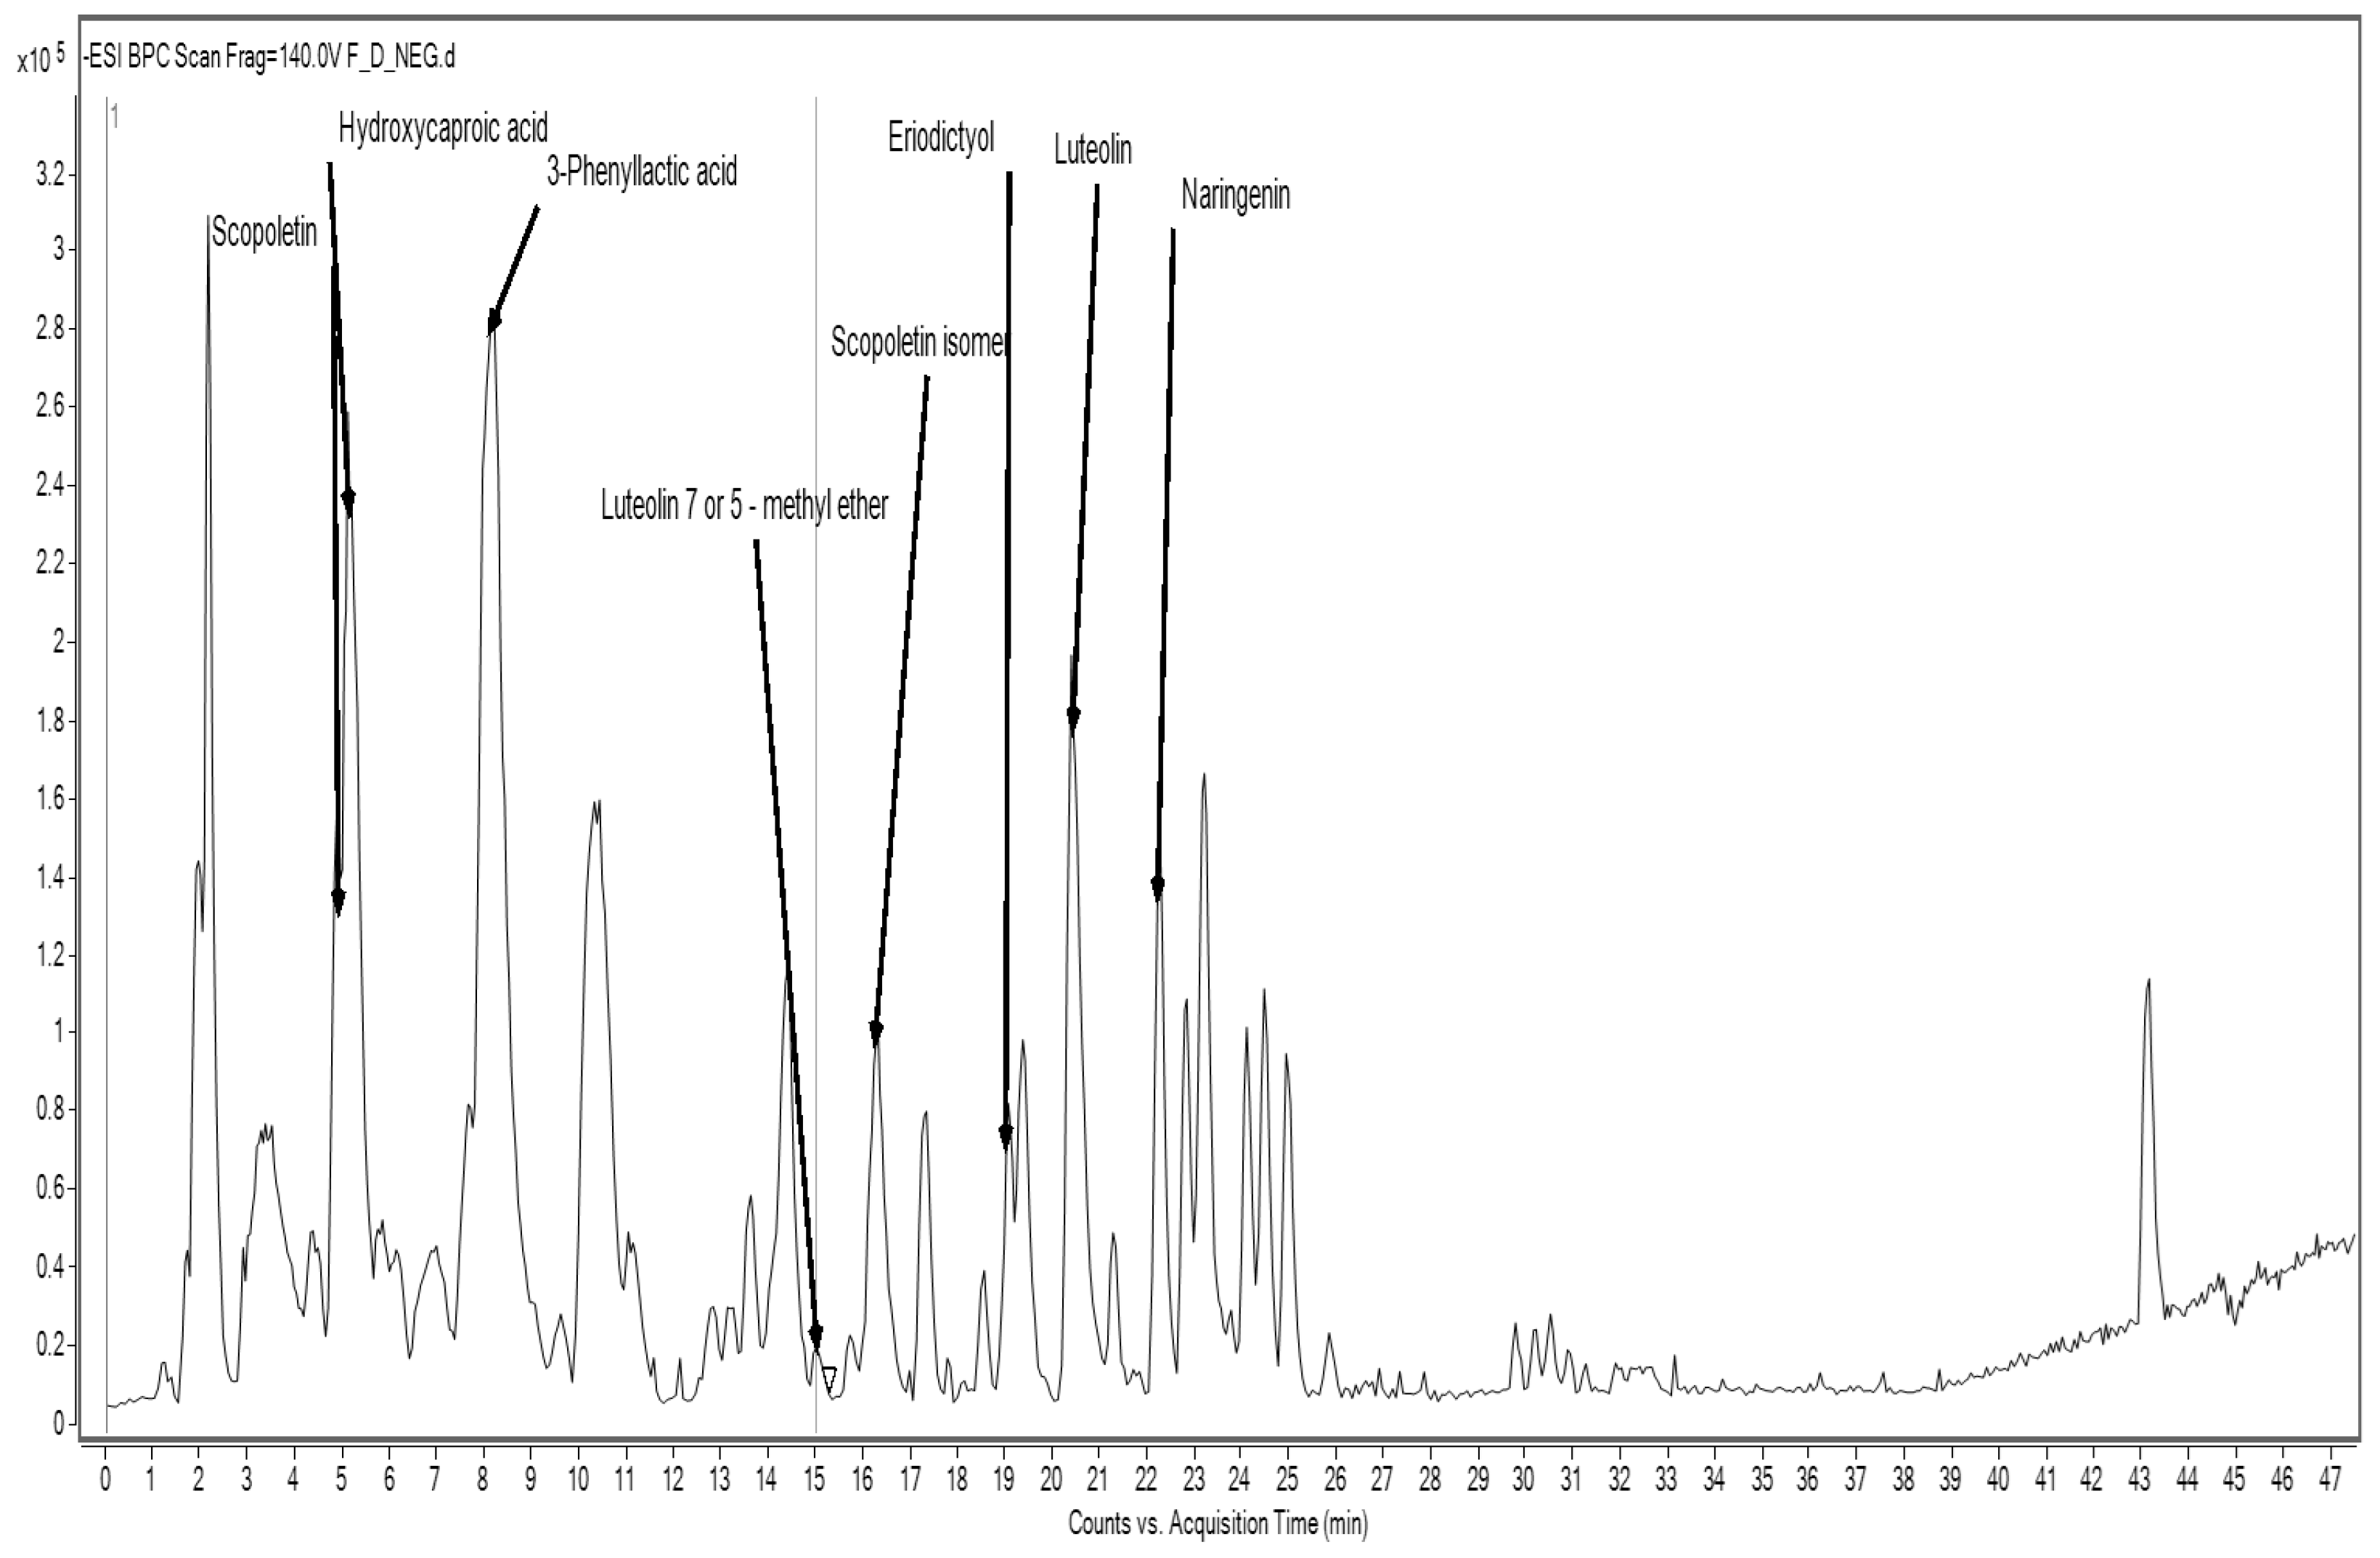
Figure 2.
HPLC/MS chromatogram of ASE extract from cork oak flour CF.
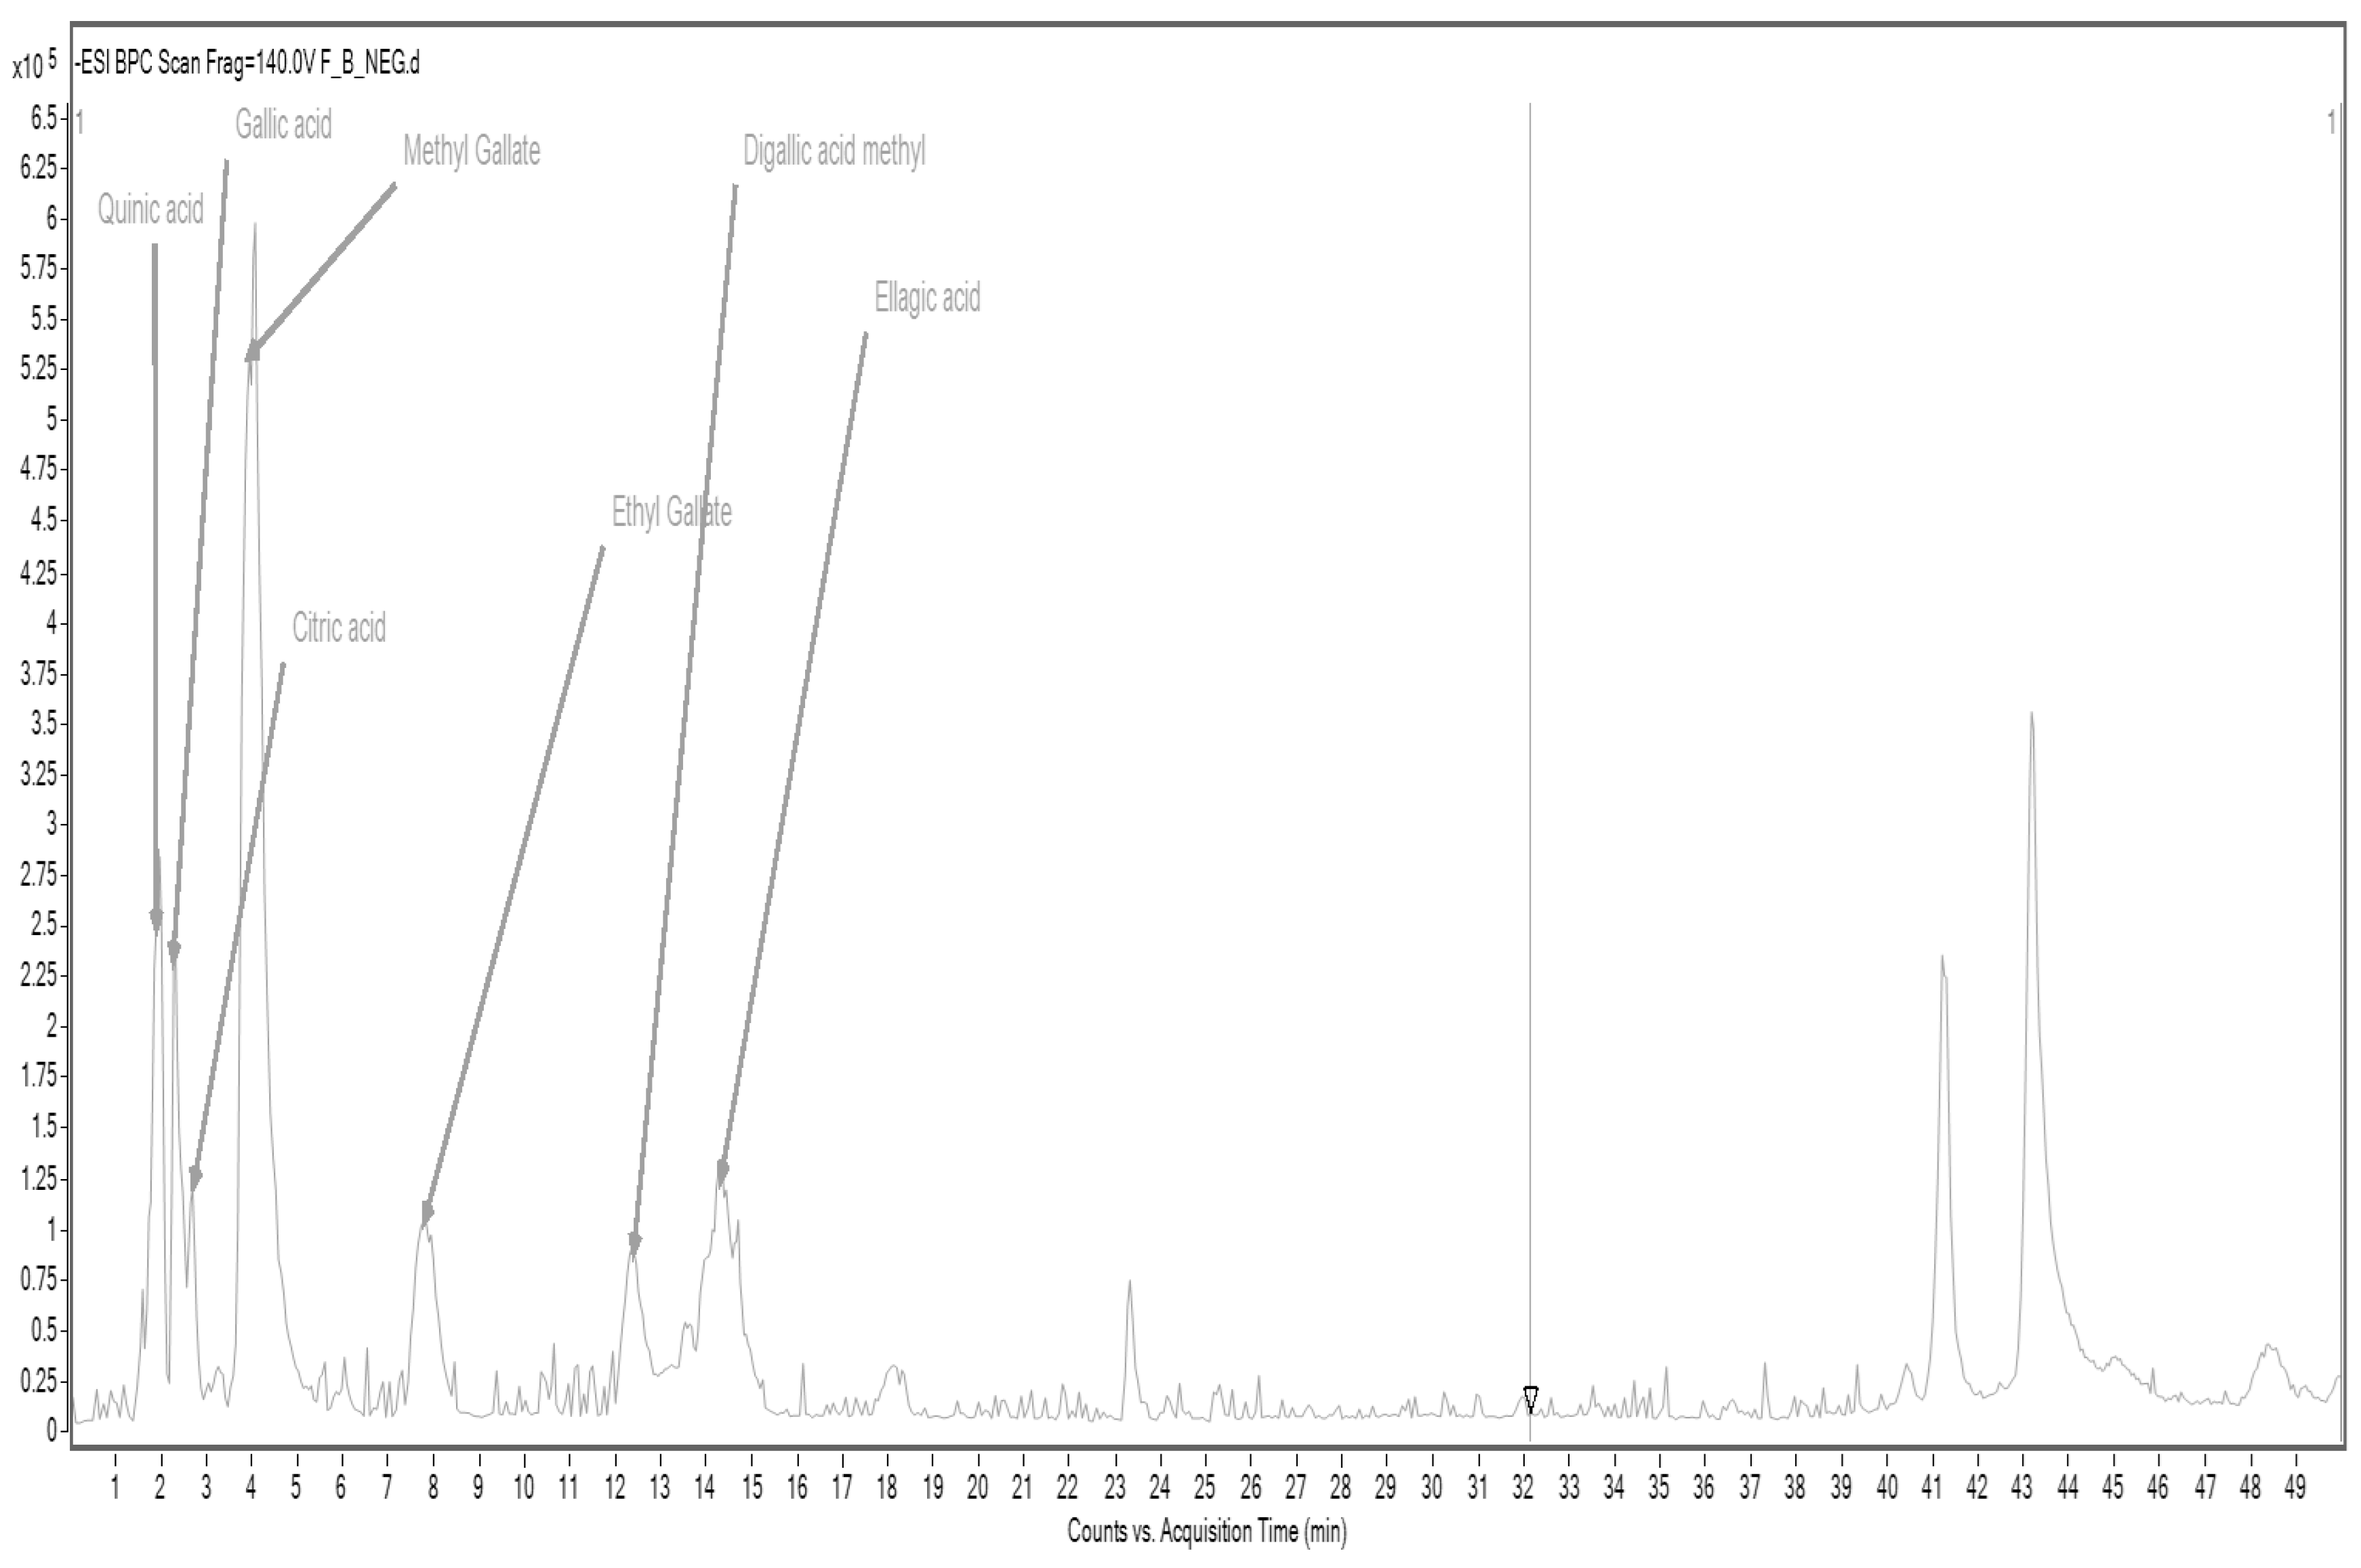
Figure 3.
TLC chromatogram for sorghum flour extract (SF) processed with Sorbil TLC Videodensitometer software; scan after 30 minutes.
Figure 3.
TLC chromatogram for sorghum flour extract (SF) processed with Sorbil TLC Videodensitometer software; scan after 30 minutes.
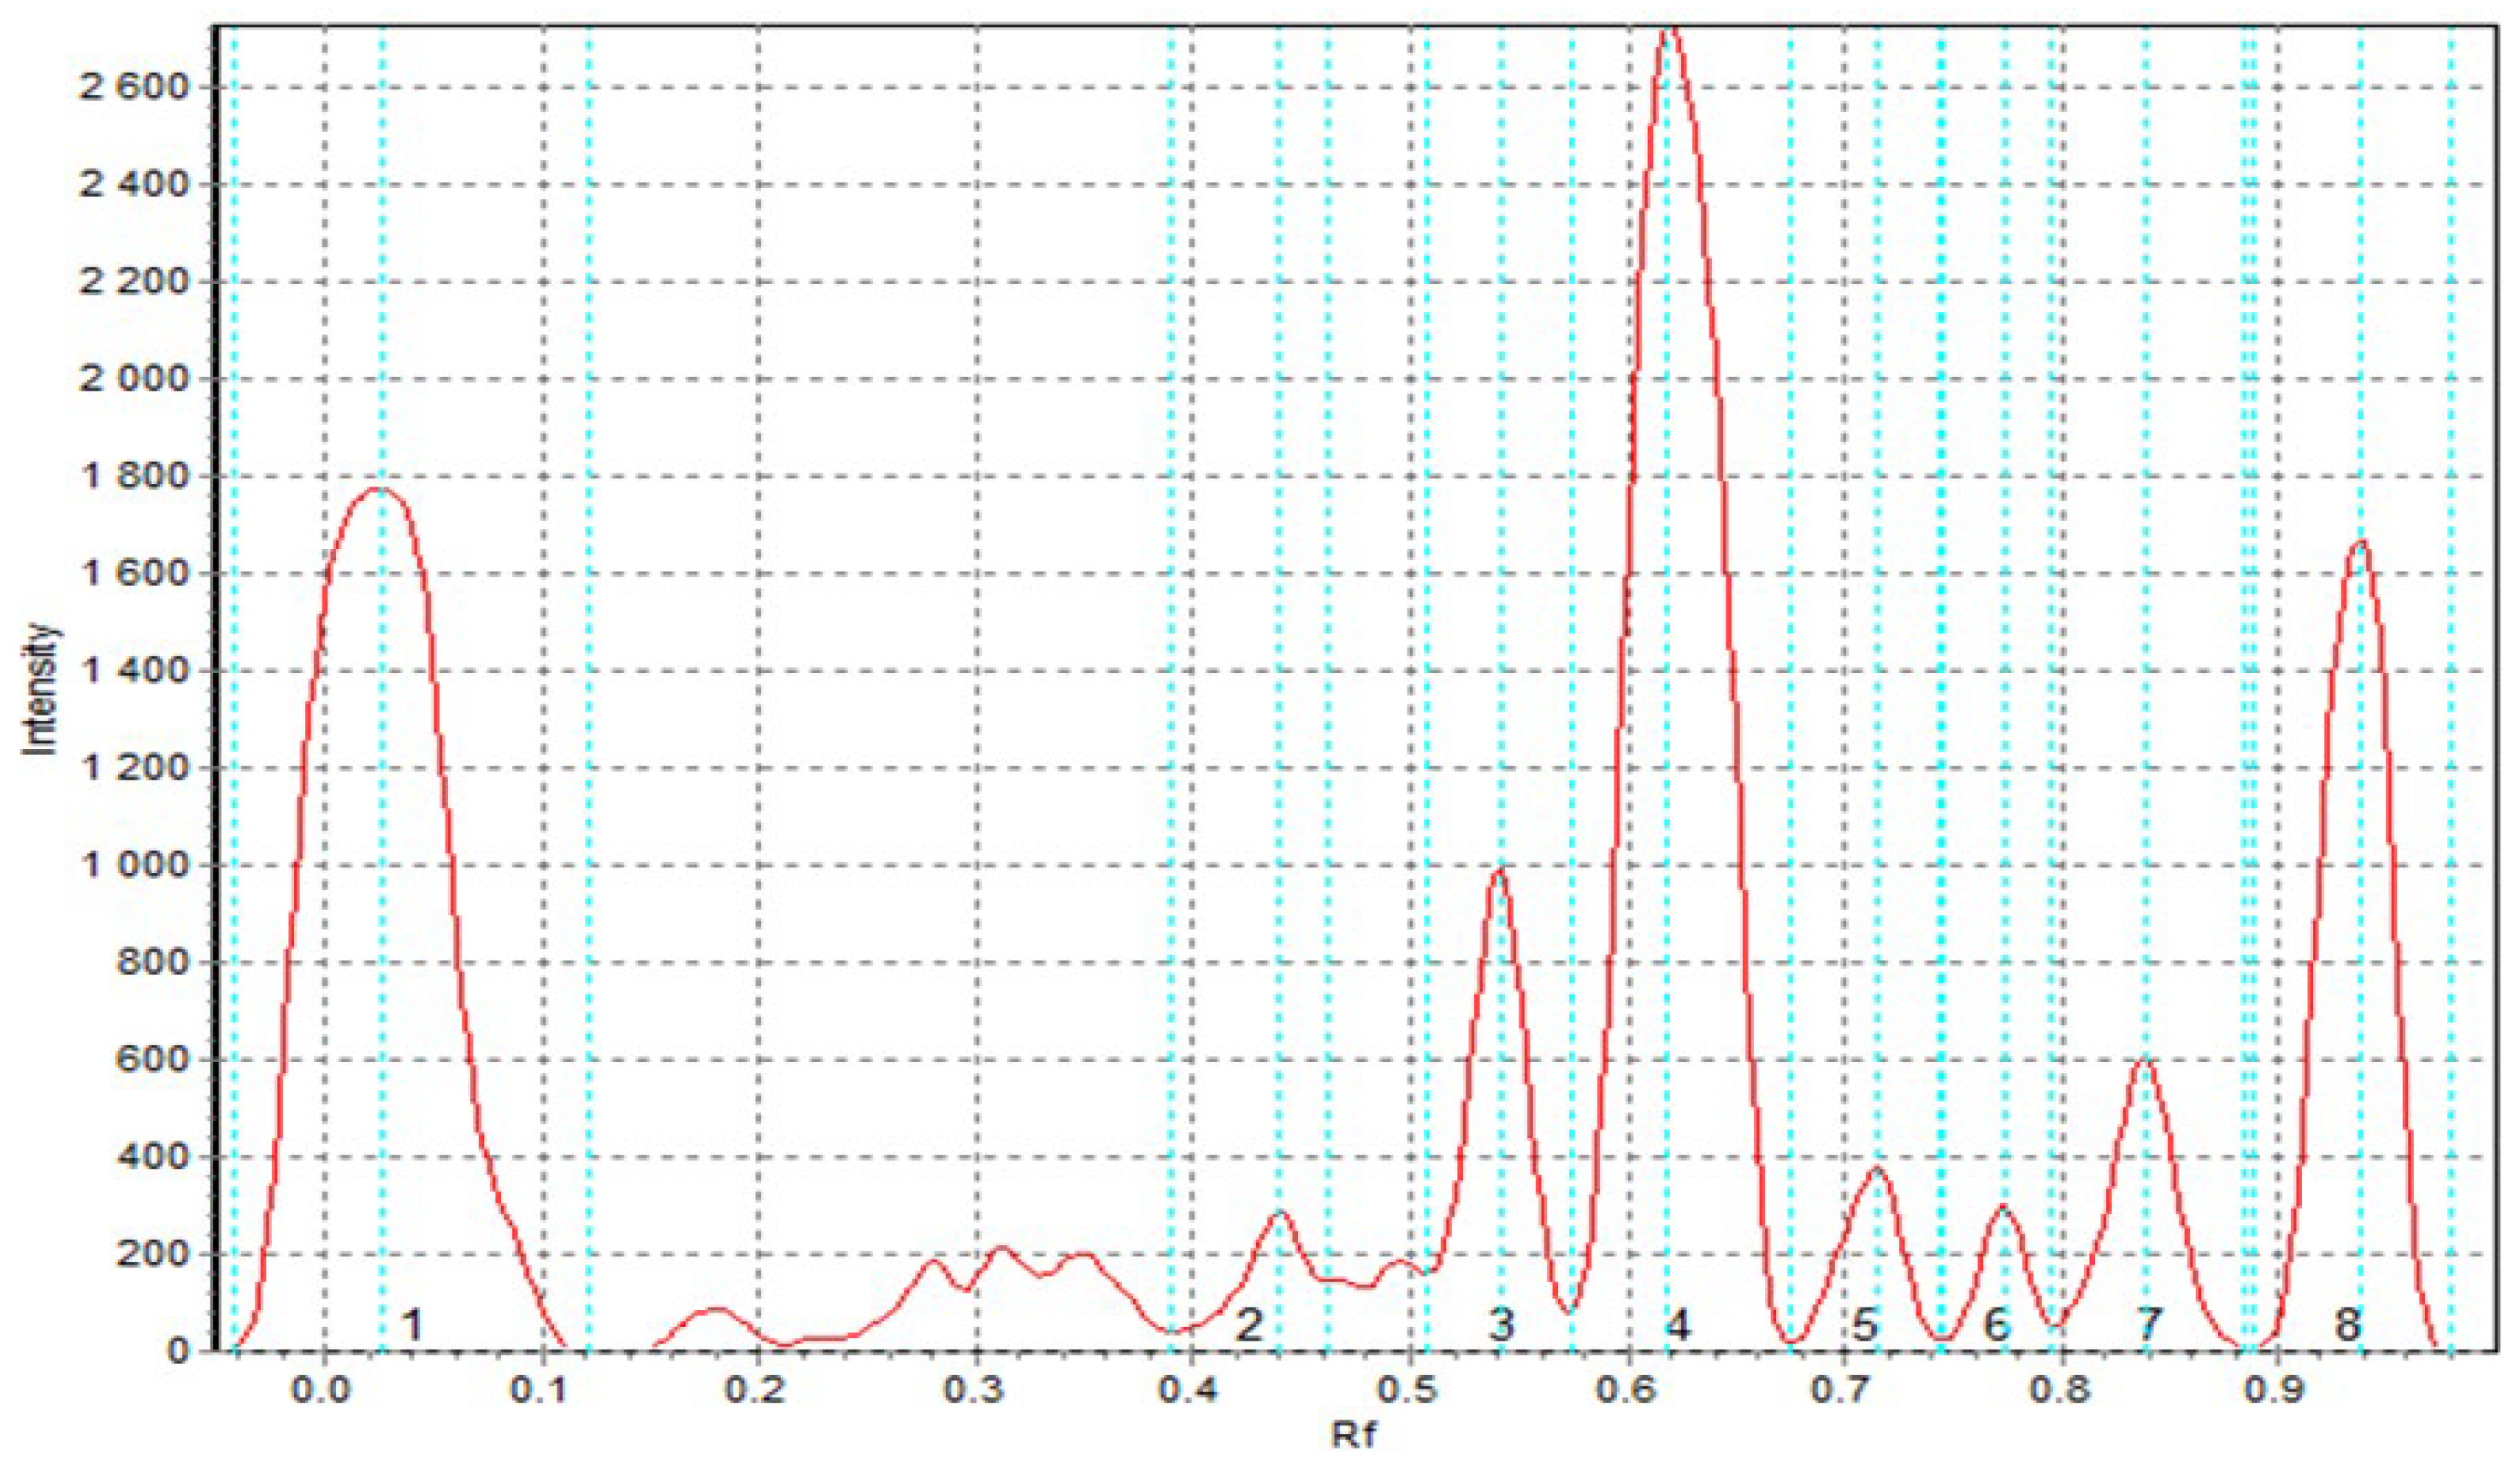
Figure 4.
TLC chromatogram for cork oak flour extract (CF) processed with Sorbil TLC Videodensitometer software; scan after 30 minutes.
Figure 4.
TLC chromatogram for cork oak flour extract (CF) processed with Sorbil TLC Videodensitometer software; scan after 30 minutes.
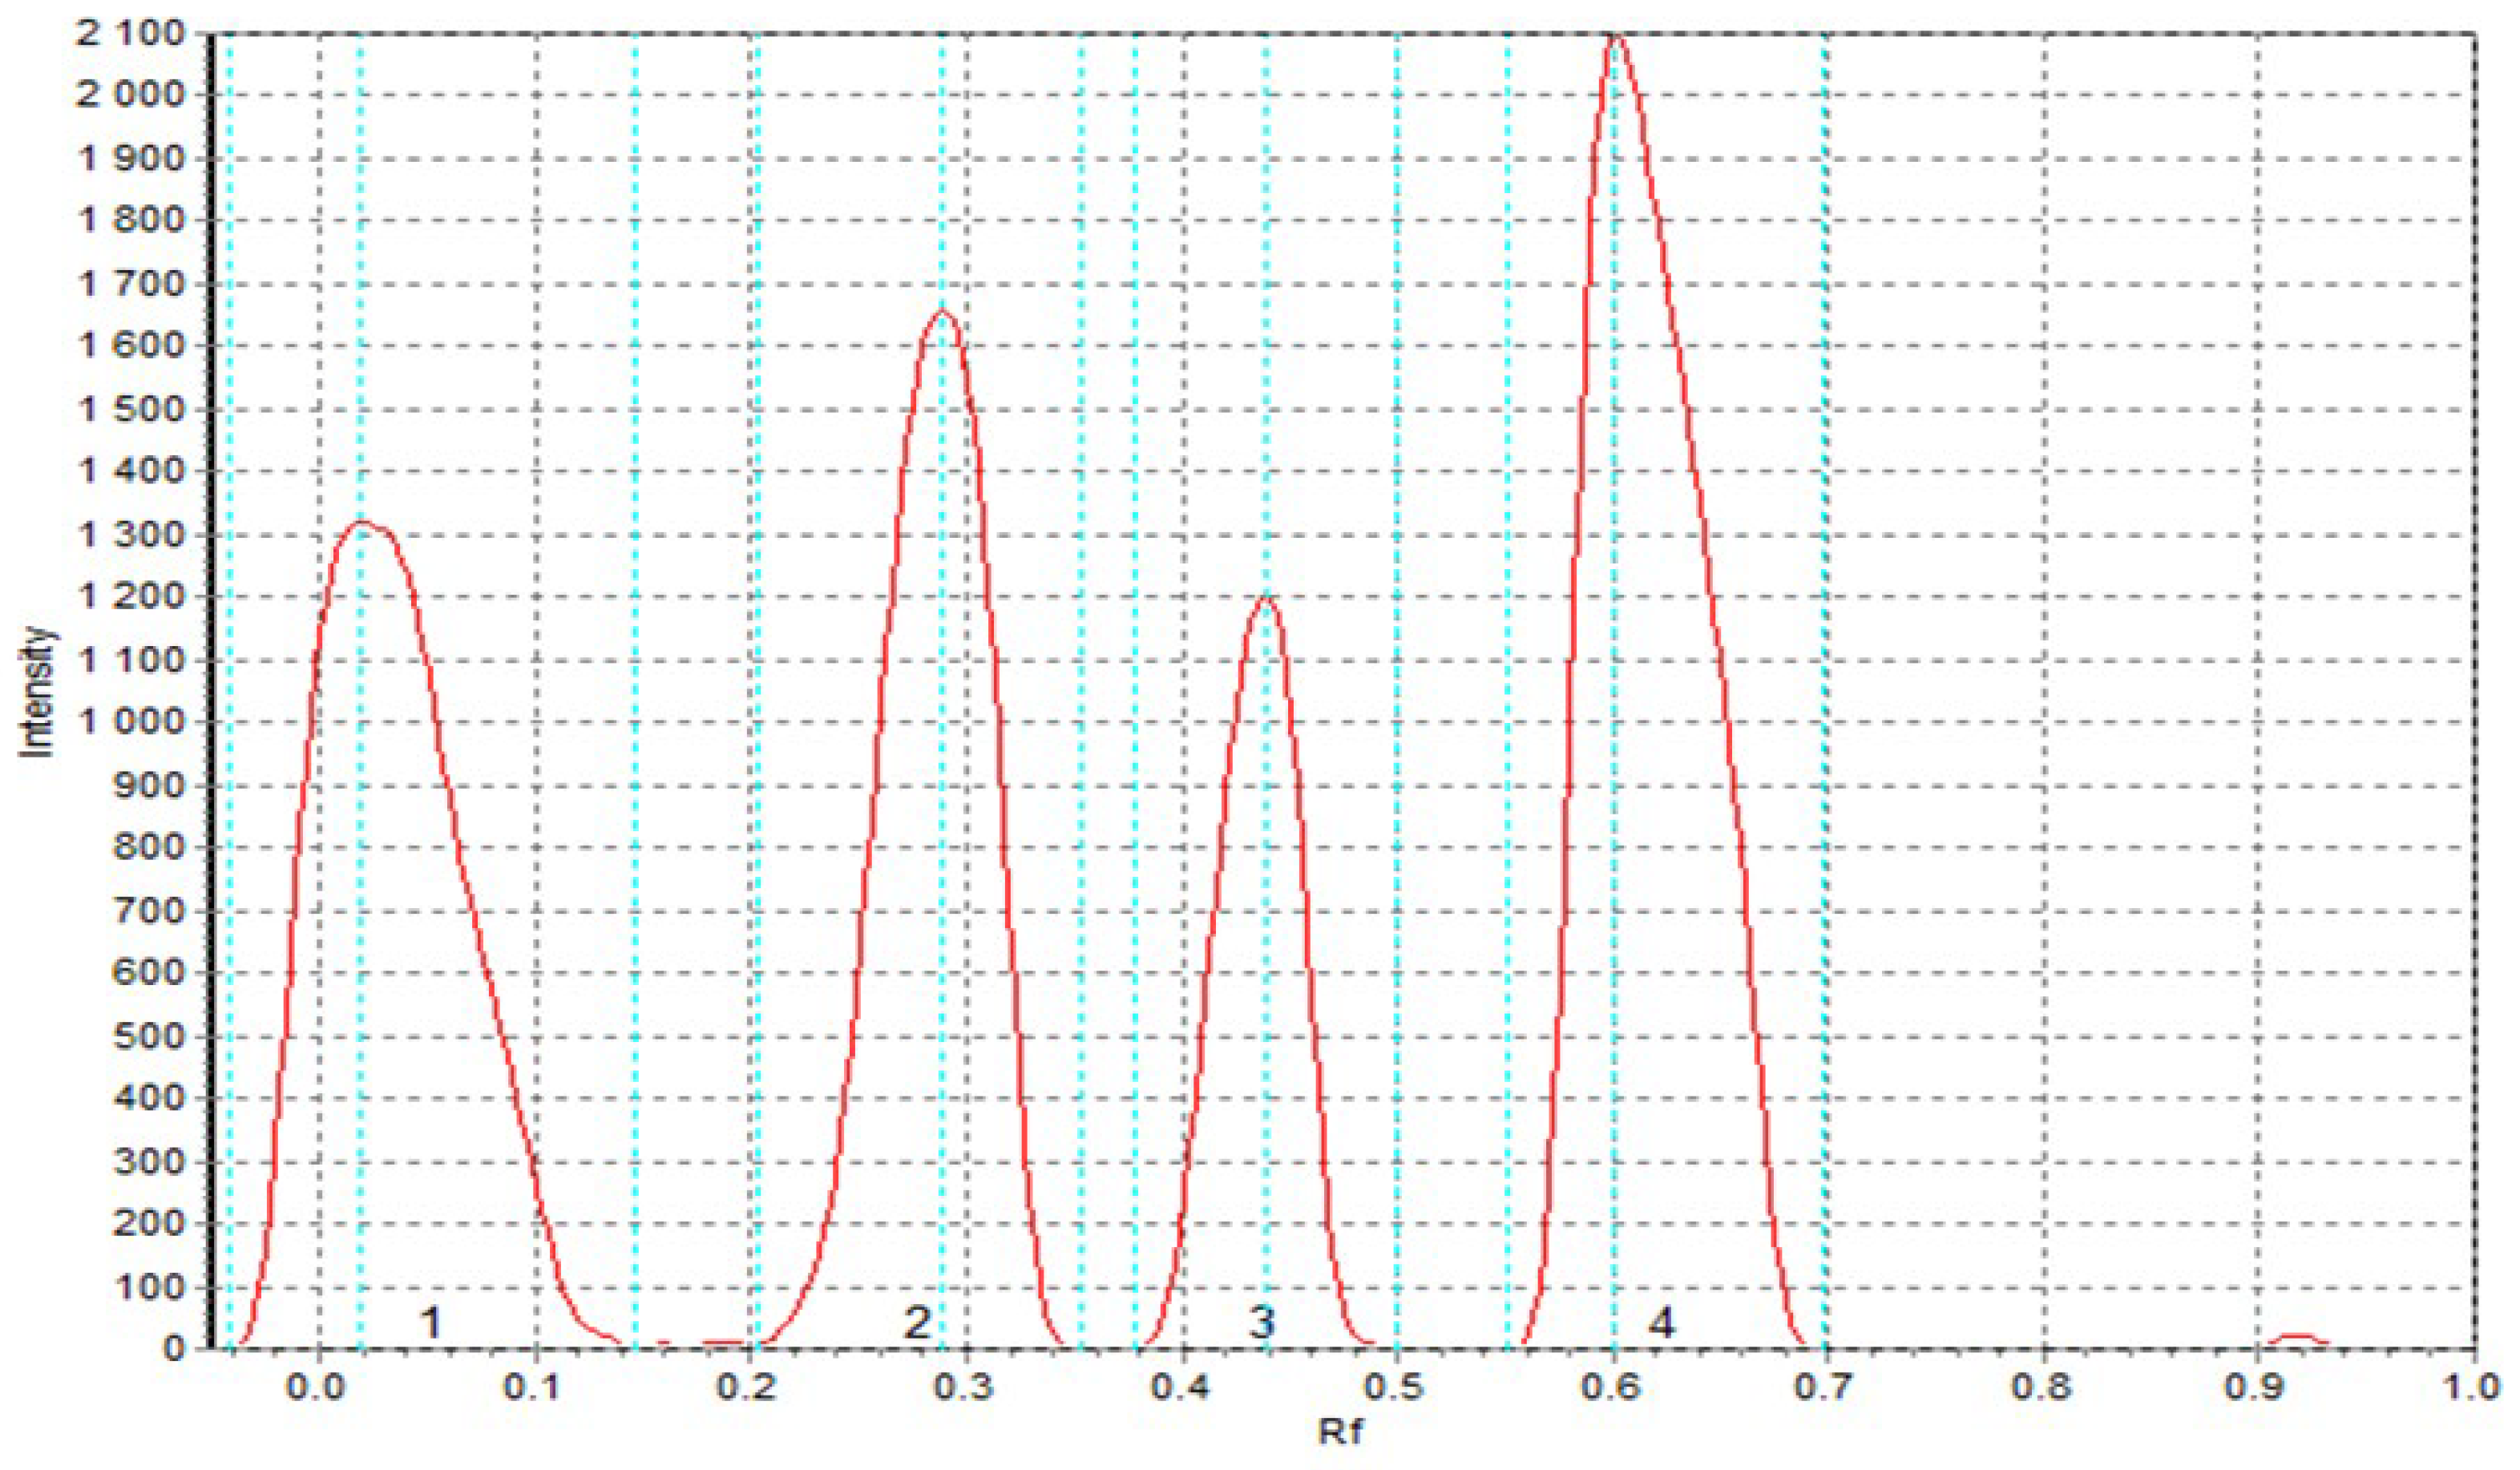
Figure 5.
SEM pictures of dry pasta products surface with various magnifications (×200 left column and ×600 right column): a) semolina T2 pasta, b) semolina T4 pasta, c) TSF pasta with sorghum flour addition, d) TCF pasta with cork oat flour addition.
Figure 5.
SEM pictures of dry pasta products surface with various magnifications (×200 left column and ×600 right column): a) semolina T2 pasta, b) semolina T4 pasta, c) TSF pasta with sorghum flour addition, d) TCF pasta with cork oat flour addition.
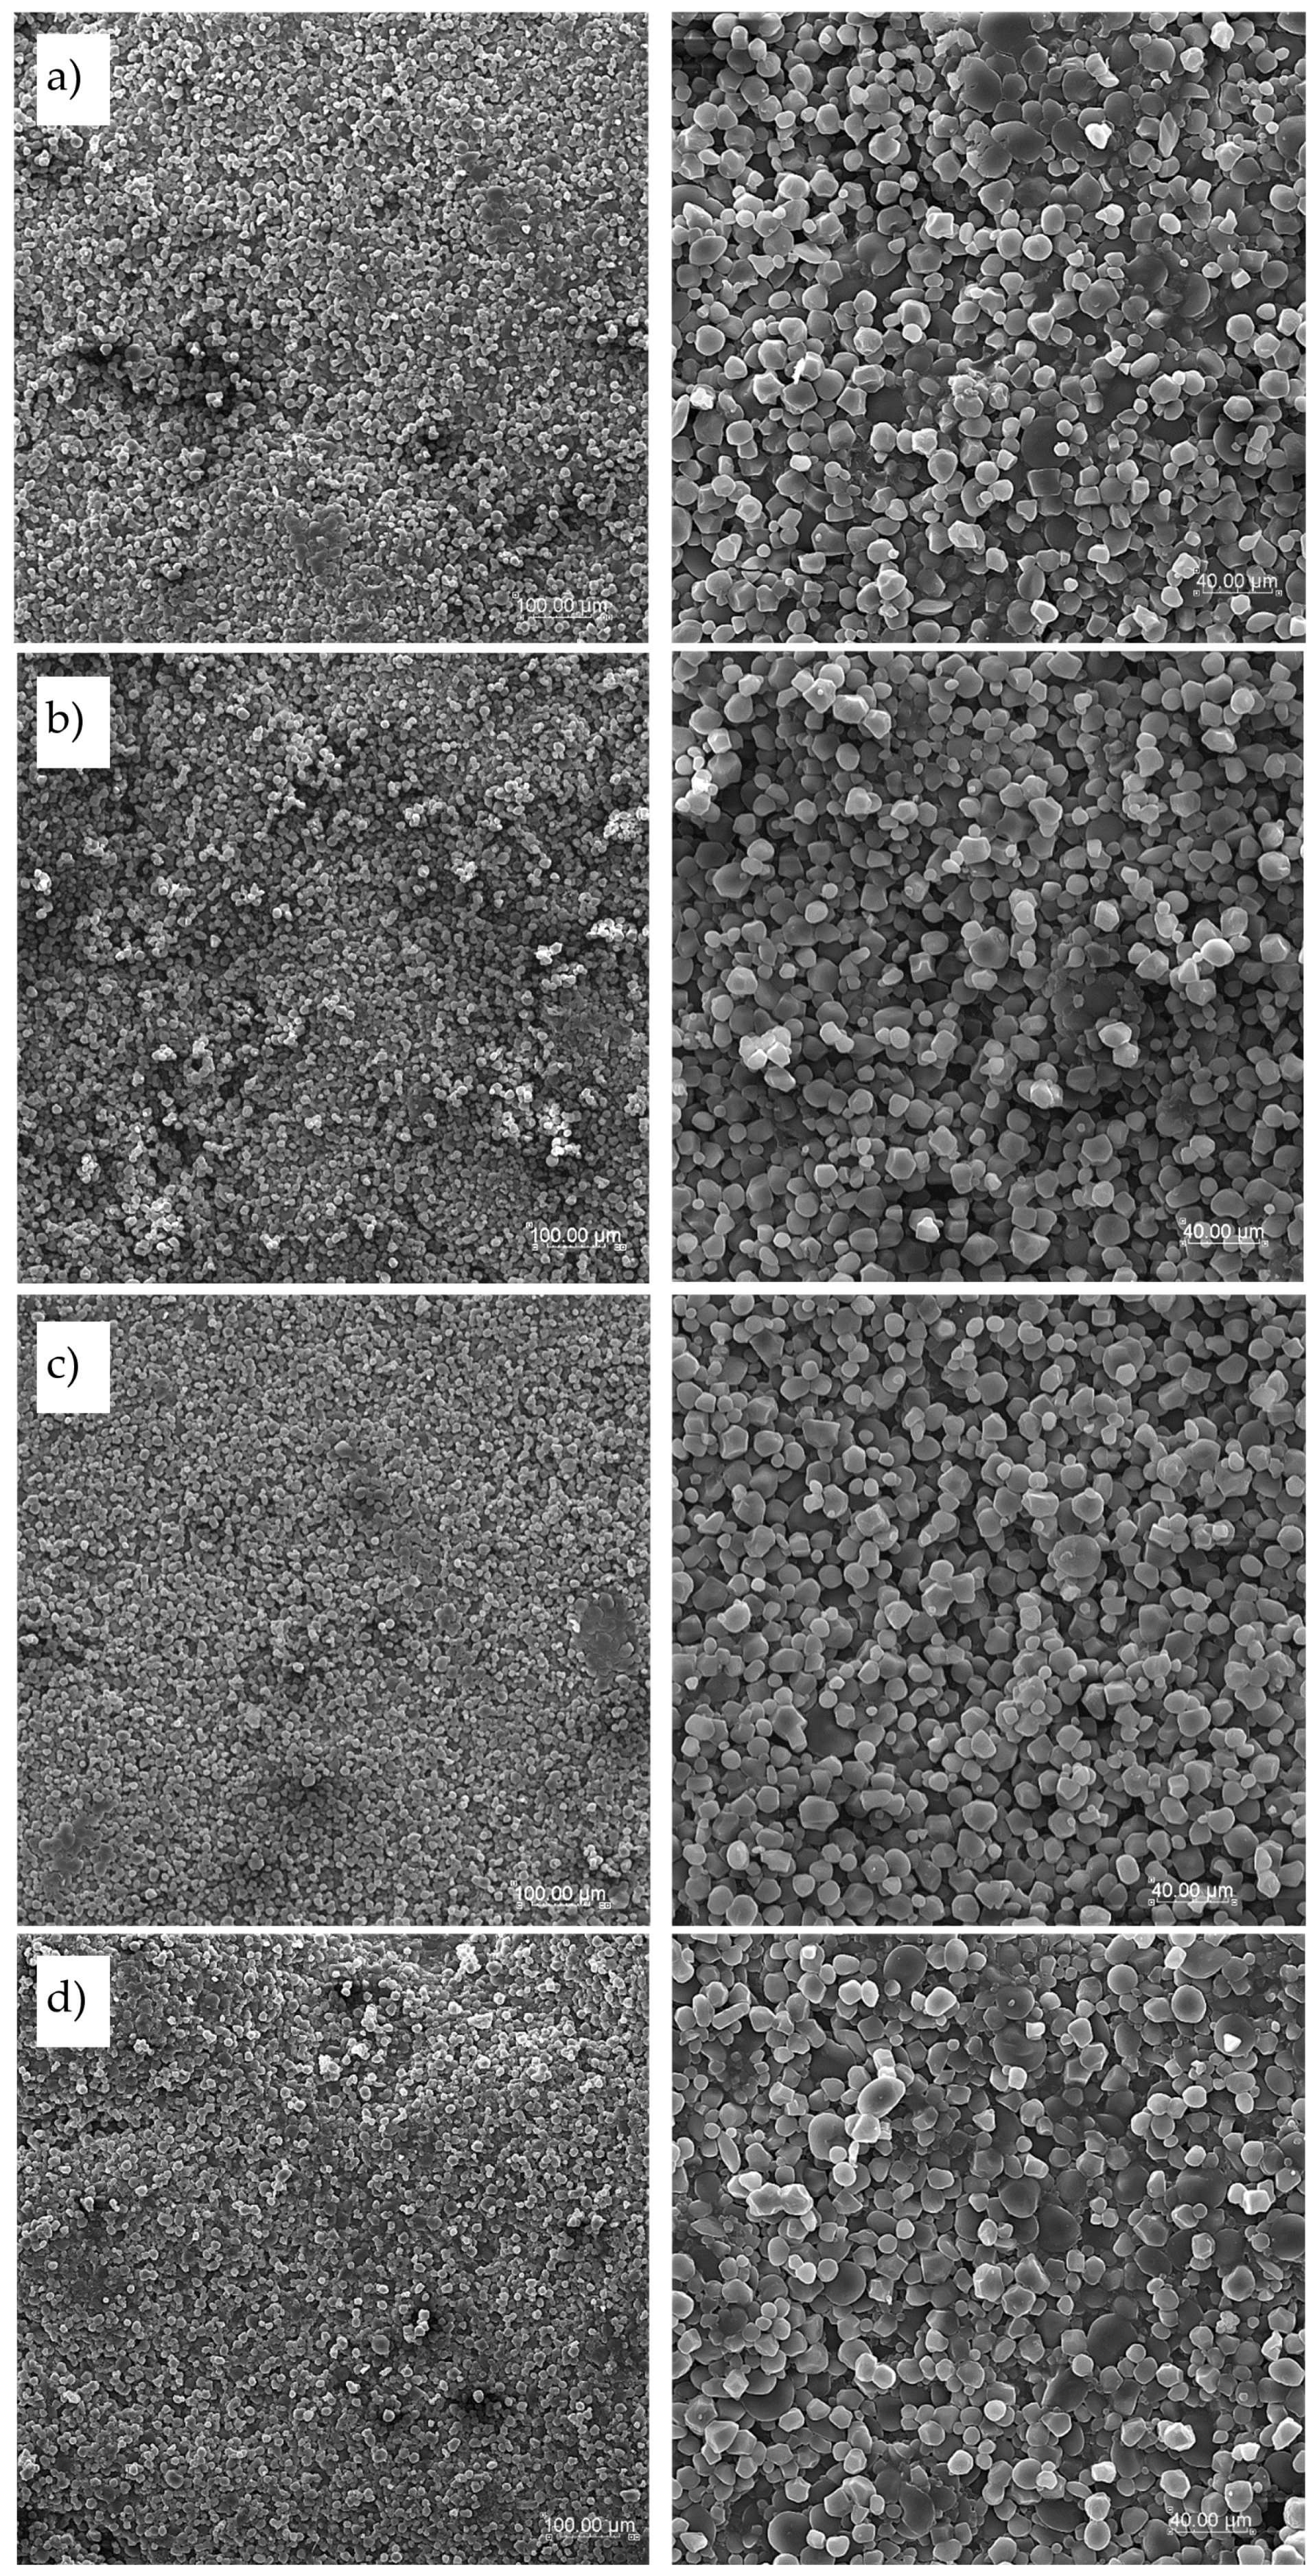
Figure 6.
SEM pictures of cooked pasta products surface with various magnifications (×200 left column and ×600 right column): a) semolina T2 pasta, b) semolina T4 pasta, c) TSF pasta with sorghum flour addition, d) TCF pasta with cork oat flour addition.
Figure 6.
SEM pictures of cooked pasta products surface with various magnifications (×200 left column and ×600 right column): a) semolina T2 pasta, b) semolina T4 pasta, c) TSF pasta with sorghum flour addition, d) TCF pasta with cork oat flour addition.
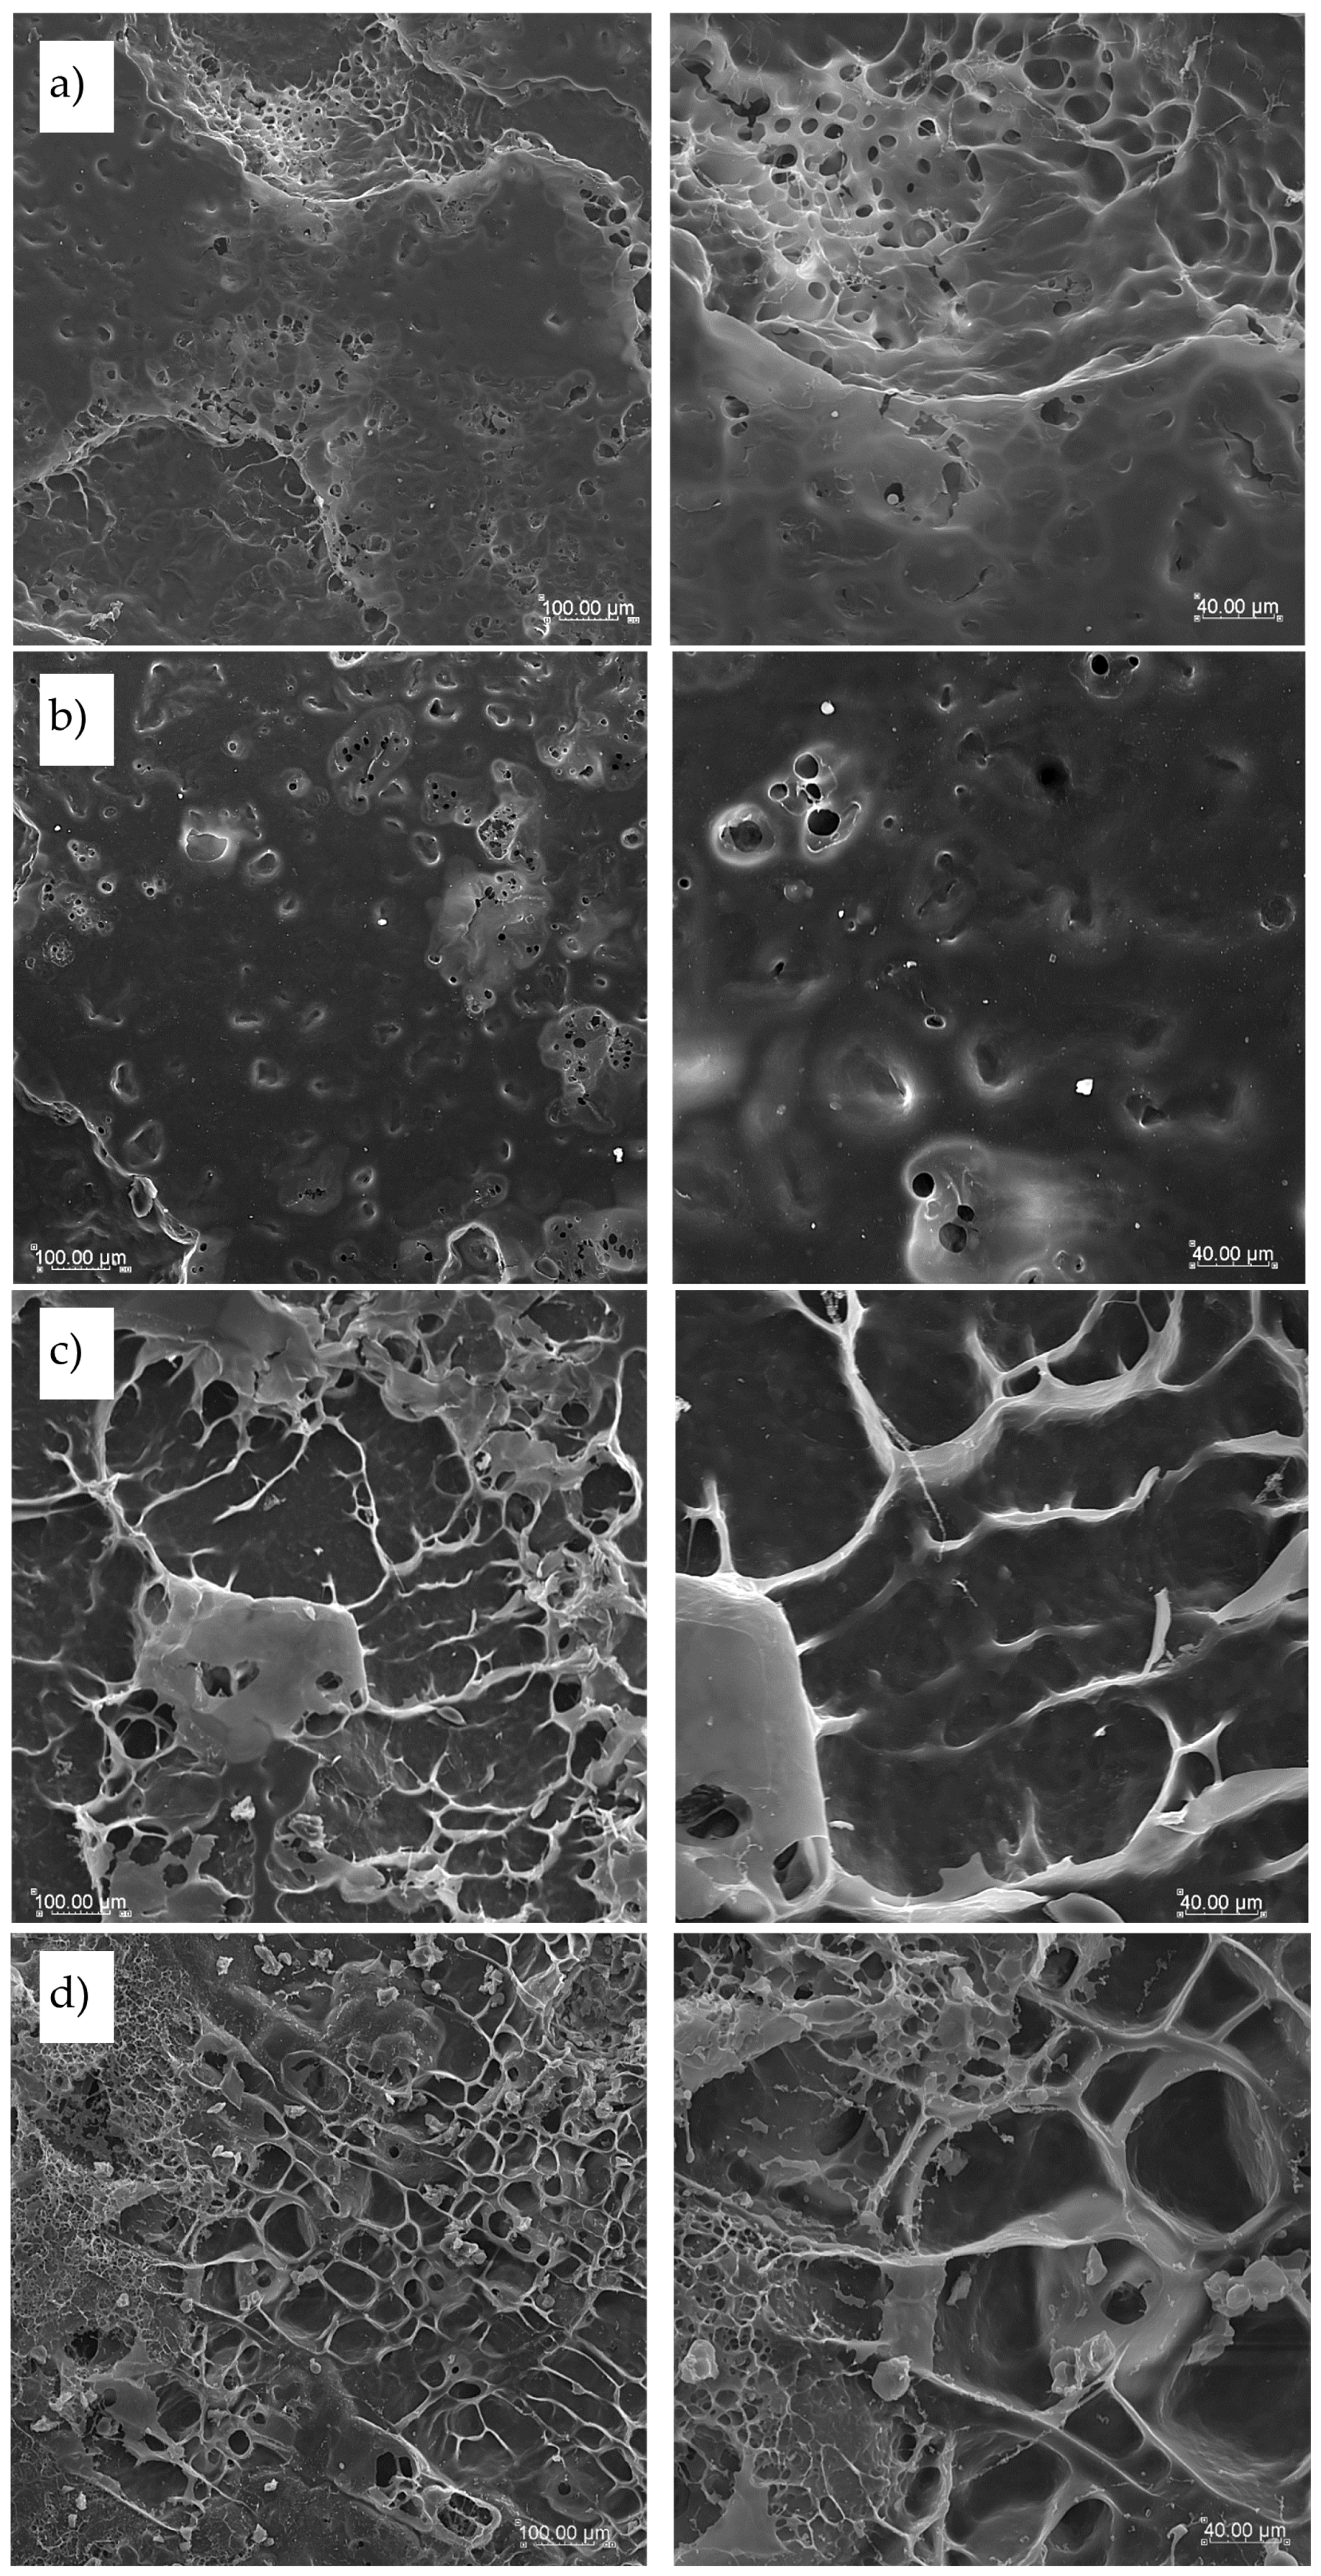
Figure 7.
SEM pictures of dry pasta products cross-section with various magnifications (×200 left column and ×600 right column): a) semolina T2 pasta, b) semolina T4 pasta, c) TSF pasta with sorghum flour addition, d) TCF pasta with cork oat flour addition.
Figure 7.
SEM pictures of dry pasta products cross-section with various magnifications (×200 left column and ×600 right column): a) semolina T2 pasta, b) semolina T4 pasta, c) TSF pasta with sorghum flour addition, d) TCF pasta with cork oat flour addition.
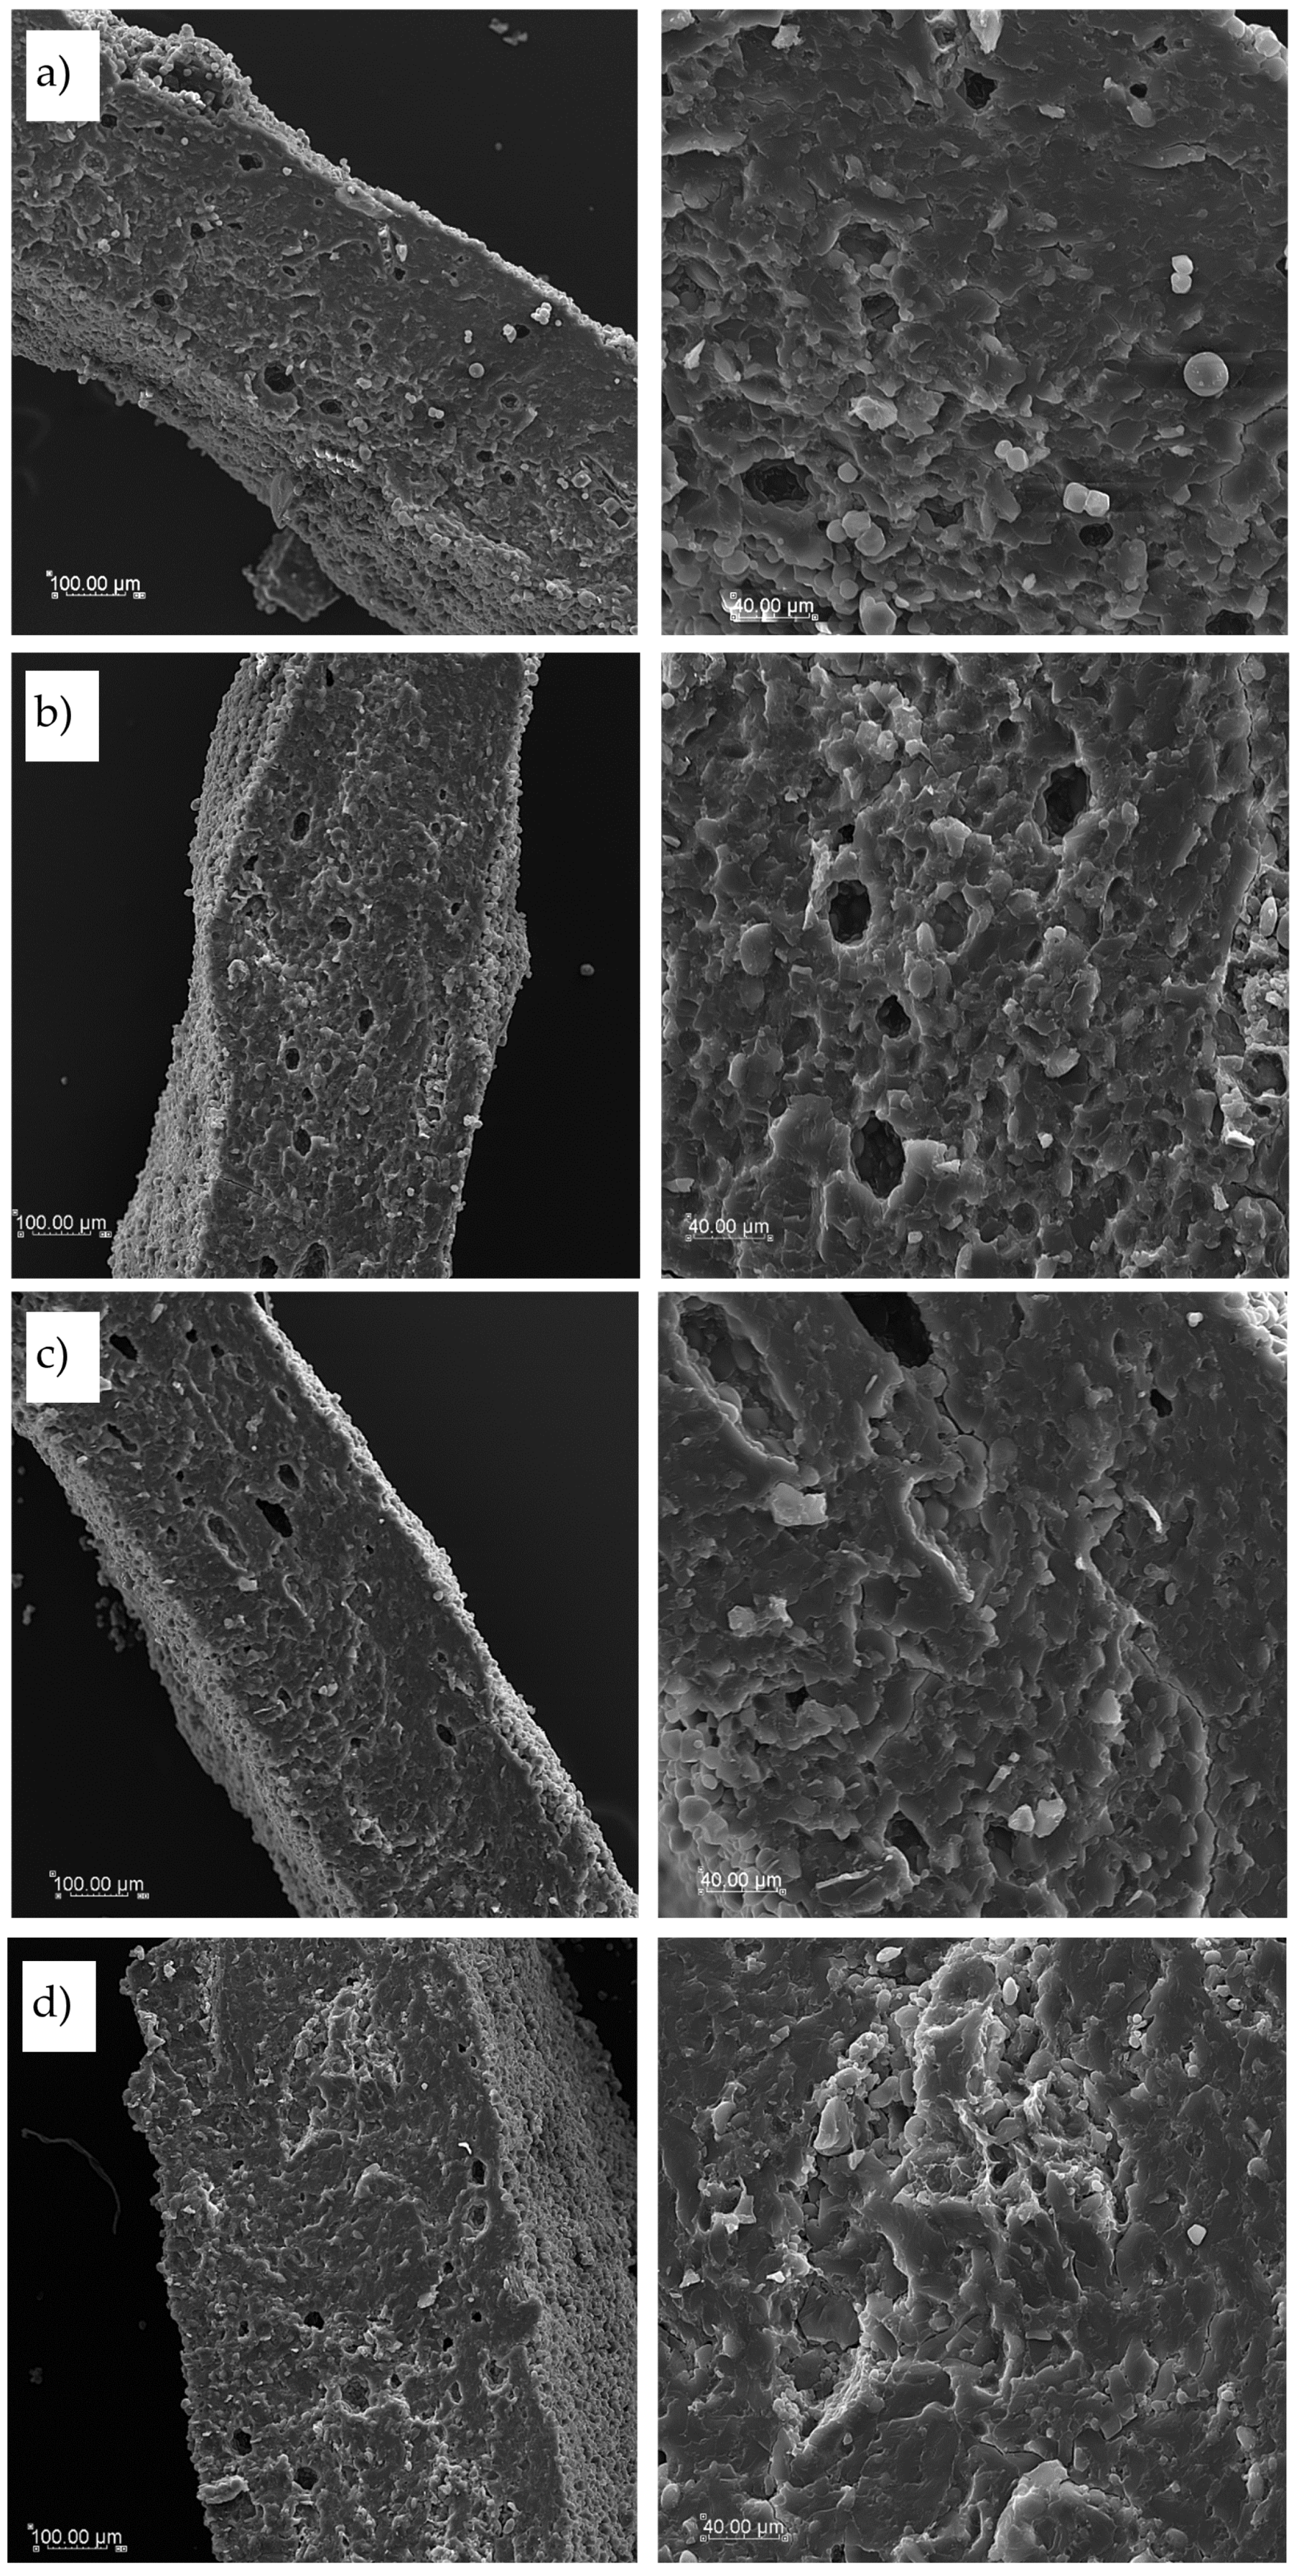
Figure 8.
SEM pictures of cooked pasta products cross-section with various magnifications (×200 left column and ×600 right column): a) semolina T2 pasta, b) semolina T4 pasta, c) TSF pasta with sorghum flour addition, d) TCF pasta with cork oat flour addition.
Figure 8.
SEM pictures of cooked pasta products cross-section with various magnifications (×200 left column and ×600 right column): a) semolina T2 pasta, b) semolina T4 pasta, c) TSF pasta with sorghum flour addition, d) TCF pasta with cork oat flour addition.
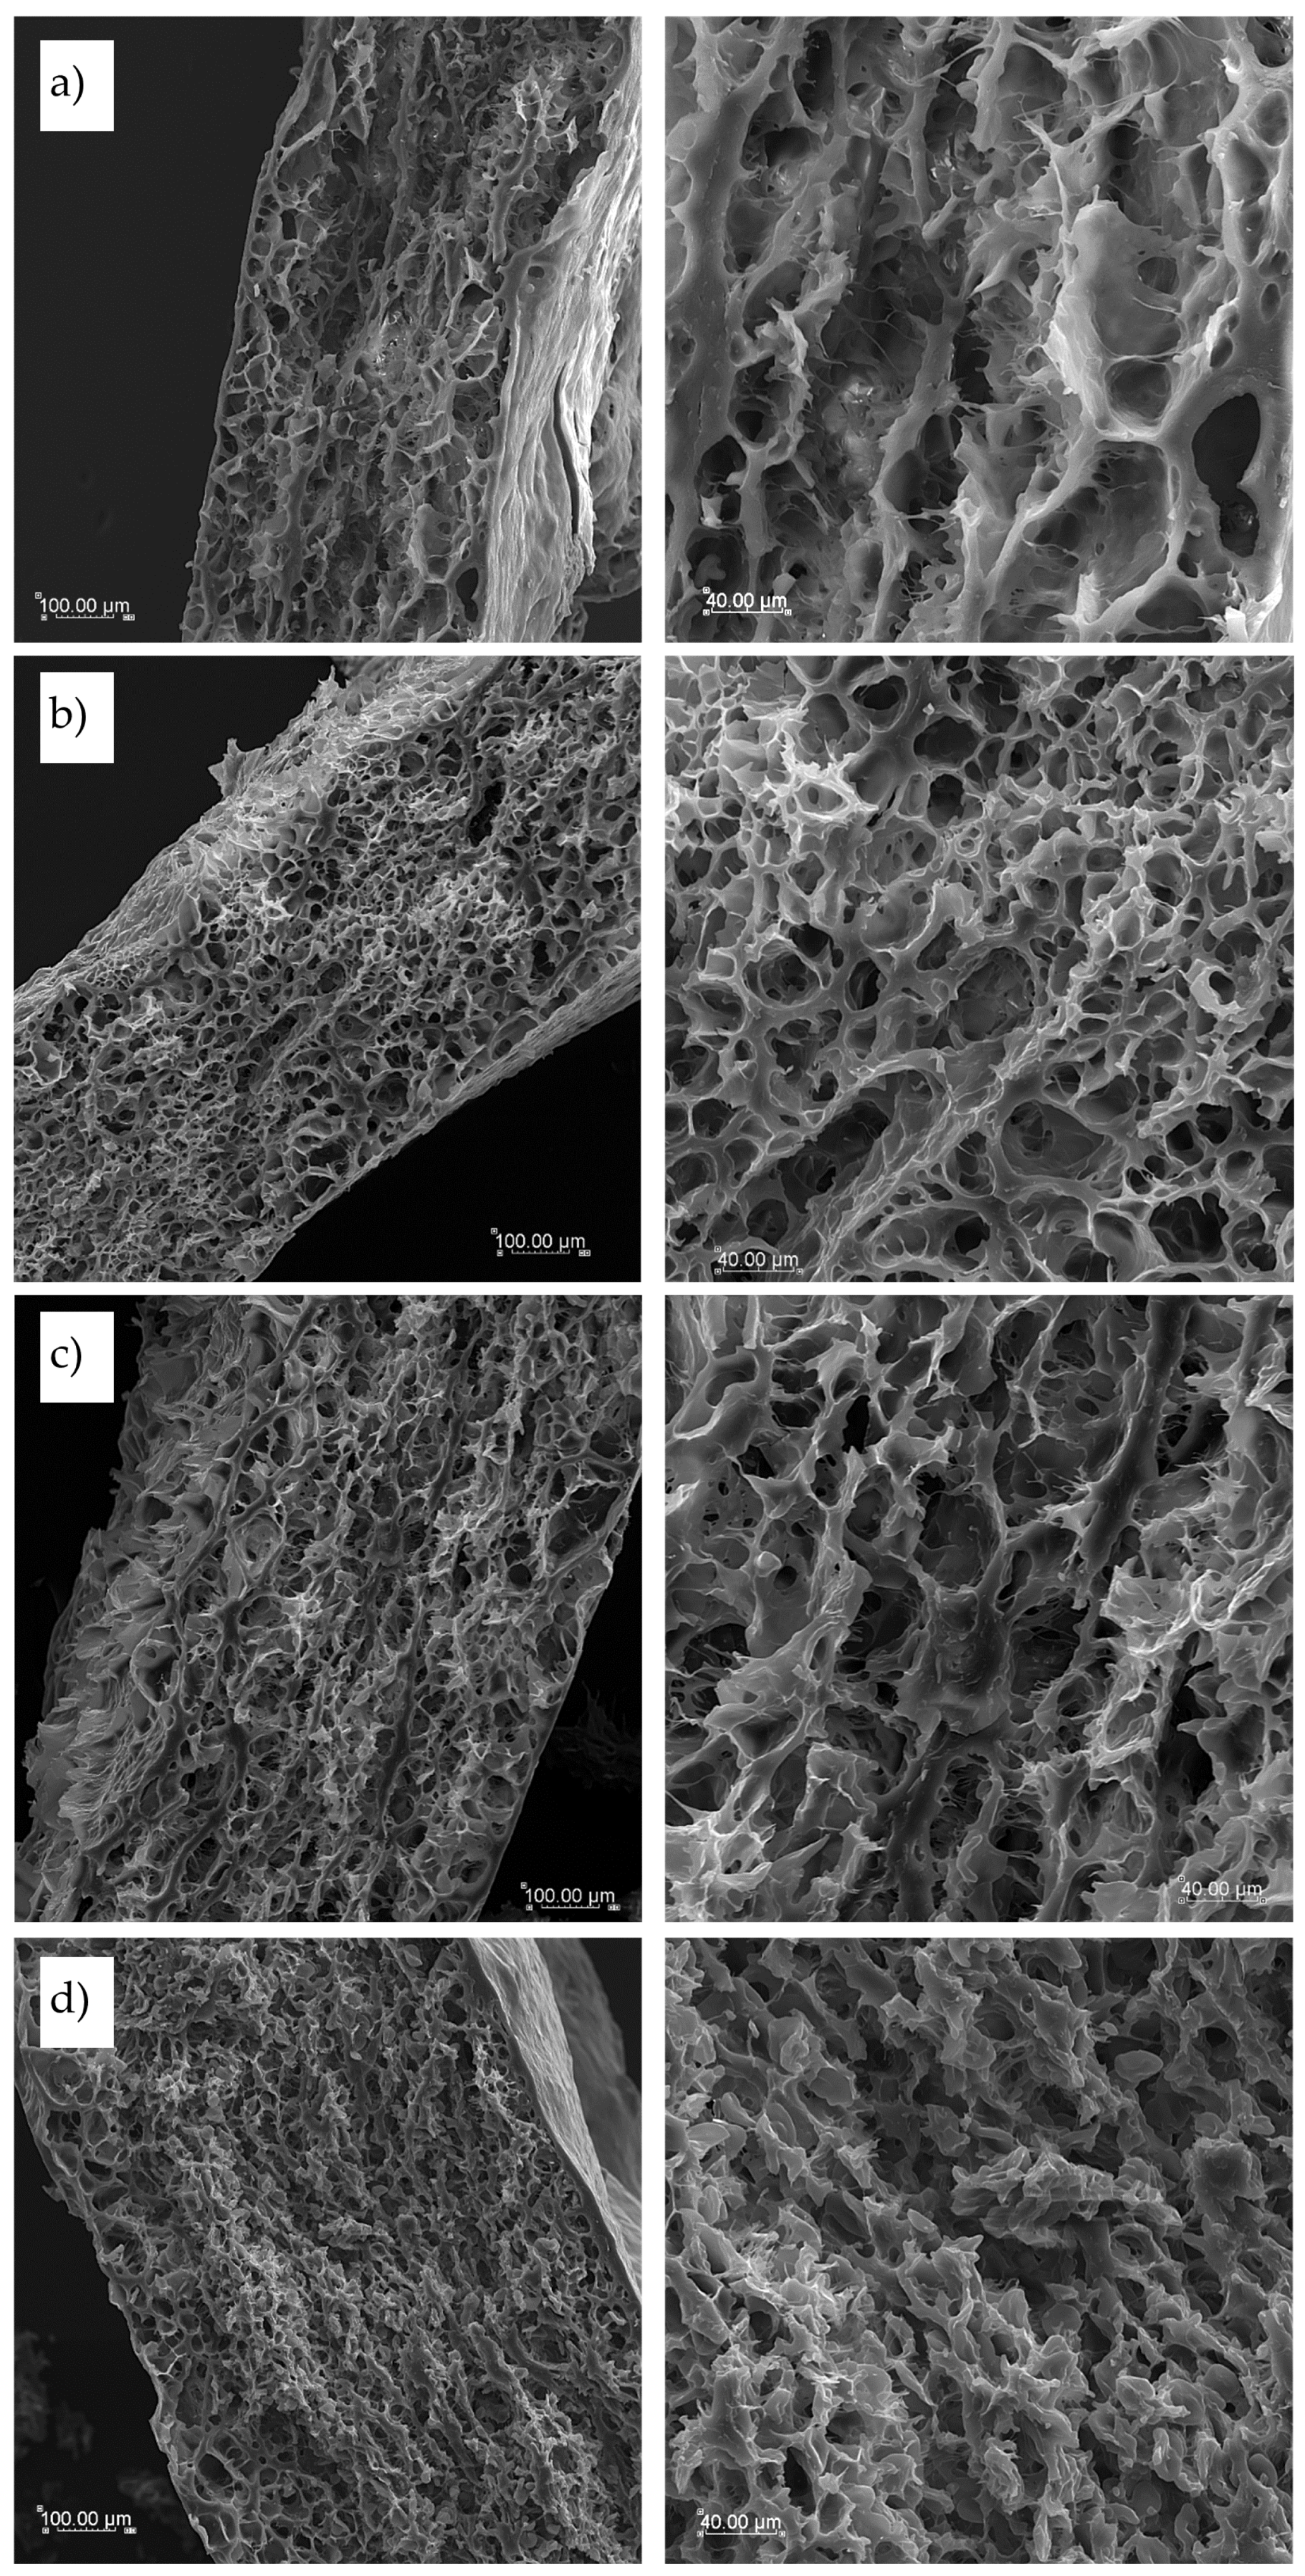

Table 1.
Pasta formulations.
| Sample Type | Semolina (g) | Enrichment Flour (g) | Salt | Water (mL) |
|---|---|---|---|---|
| Control T1 – T4 | 2000 (S1 – S4) | 0 | Yes | 400 |
| Sorghum-Enriched TSF | 1980 (S2 Kenza) | 20 (1%) | Yes | 450 |
| Cork Oak-Enriched TCF | 1920 (S2 Kenza) | 80 (4%) | Yes | 600 |
Table 2.
Chemical composition analysis of the raw materials.
| Sample | Moisture (%) | Protein (%) | Fat (%) | Ash (%) | Fiber (%) | Digestible Carbohydrates (%) | Energy (kJ) | Energy (kcal) |
|---|---|---|---|---|---|---|---|---|
| S1 | 11.56 | 12.02 | 1.44 | 0.77 | 5.70 | 68.51 | 1468 | 346 |
| S2 | 11.95 | 13.07 | 1.52 | 0.82 | 5.97 | 66.67 | 1460 | 345 |
| S3 | 11.07 | 12.83 | 1.48 | 0.74 | 5.96 | 67.92 | 1475 | 348 |
| S4 | 11.09 | 12.25 | 1.83 | 0.83 | 6.19 | 67.81 | 1478 | 349 |
| SF | 8.96 | 8.42 | 3.17 | 2.69 | 28.27 | 48.49 | 1311 | 313 |
| CF | 9.60 | 4.33 | 8.69 | 1.90 | 30.07 | 45.41 | 1408 | 337 |
S1 – S4 – semolina, SF – sorghum flour, CF – cork oak flour. Values are expressed as mean ± standard deviation (n = 3). All analyses were performed in triplicate Standard deviations were below 3% and are therefore not reported.
Table 3.
Dimension characteristics of Trida pasta samples: mean lengths, widths, and thicknesses.
| Sample | Length (mm) | Width (mm) | Thickness (mm) |
|---|---|---|---|
| T1 | 13.31 ± 1.60 | 13.25 ± 1.75 | 0.81 ± 0.14 |
| T2 | 13.50 ± 2.00 | 12.81 ± 1.96 | 0.75 ± 0.07 |
| T3 | 13.45 ± 1.45 | 12.95 ± 1.95 | 0.66 ± 0.14 |
| T4 | 14.00 ± 1.00 | 13.25 ± 1.25 | 0.67 ± 0.13 |
| TSF | 13.90 ± 1.40 | 13.36 ± 1.83 | 0.63 ± 0.12 |
| TCF | 14.35 ± 1.15 | 13.85 ± 1.35 | 0.75 ± 0.03 |
T1 – T4 – semolina pasta, TSF – pasta with sorghum flour, TCF – pasta with cork oak flour. Values are expressed as mean ± standard deviation (n = 3).
Table 4.
Physiochemical characteristics of the tested pasta made with various semolina and enriched with cork oak and sorghum flours.
Table 4.
Physiochemical characteristics of the tested pasta made with various semolina and enriched with cork oak and sorghum flours.
| Sample | Moisture content (%) | WAI (%) | WSI (%) |
|---|---|---|---|
| T1 | 10.887 ± 0.014 | 1.60 ± 0.02 | 6.23 ± 0.16 |
| T2 | 11.468 ± 0.004 | 1.57 ± 0.02 | 6.38 ± 0.45 |
| T3 | 11.203 ± 0.015 | 1.60 ± 0.01 | 6.62 ± 0.38 |
| T4 | 11.239 ± 0.021 | 1.61 ± 0.03 | 5.81 ± 0.33 |
| TSF | 10.905 ± 0.039 | 1.54 ± 0.01 | 10.19 ± 5.13 |
| TCF | 11.179 ± 0.002 | 1.57 ± 0.01 | 7.33 ± 0.22 |
WAI – water absorption index, WSI – water solubility index, T1 – T4 – semolina pasta, TSF – pasta with sorghum flour, TCF – pasta with cork oak flour. Values are expressed as mean ± standard deviation (n = 3).
Table 5.
Colorimetric parameters of the tested pasta made with various semolina and enriched with cork oak and sorghum flours.
Table 5.
Colorimetric parameters of the tested pasta made with various semolina and enriched with cork oak and sorghum flours.
| Sample | L* | a* | b* | ΔE |
| T1 | 59.95 ± 0.8 | 1.17 ± 0.3 | 10.45 ± 0.7 | ref |
| T2 | 61.14 ± 0.7 | 1.02 ± 0.4 | 9.65 ± 0.6 | 1.44 |
| T3 | 60.33 ± 0.6 | 0.82 ± 0.3 | 9.20 ± 0.5 | 1.35 |
| T4 | 61.42 ± 0.7 | 0.85 ± 0.4 | 10.64 ± 0.6 | 1.52 |
| TSF | 57.74 ± 0.9 | 1.25 ± 0.5 | 7.48 ± 0.7 | 3.70 |
| TCF | 46.20 ± 1.0 | 4.71 ± 0.6 | 10.59 ± 0.8 | 14.20 |
L*- lightness, a* - redness, b* - yellowness, ΔE - total color difference, T1 – T4 – semolina pasta, TSF – pasta with sorghum flour, TCF – pasta with cork oak flour. Values are expressed as mean ± standard deviation (n = 3).
Table 6.
Culinary quality parameters of Trida pasta prepared with various semolina and enriched with cork oak and sorghum flours.
Table 6.
Culinary quality parameters of Trida pasta prepared with various semolina and enriched with cork oak and sorghum flours.
| Sample | MCT (min) | WAC (%) | CL (%) |
|---|---|---|---|
| T1 | 2.00 ± 0.01 | 241.99 ± 0.86 | 7.85 ± 0.03 |
| T2 | 2.00 ± 0.01 | 253.69 ± 1.08 | 7.90 ± 0.02 |
| T3 | 2.00 ± 0.02 | 233.04 ± 0.57 | 7.58 ± 0.03 |
| T4 | 1.30 ± 0.01 | 299.82 ± 0.12 | 8.08 ± 0.04 |
| TSF | 2.15 ± 0.17 | 236.88 ± 1.05 | 7.70 ± 0.02 |
| TCF | 2.30 ± 0.05 | 214.33 ± 1.23 | 7.58 ± 0.03 |
MCT – minimal cooking time, WAC – water absorption capacity, CL – cooking loss, T1 – T4 – semolina pasta, TSF – pasta with sorghum flour, TCF – pasta with cork oak flour. Values are expressed as means (n = 3). All analyses were performed in triplicate.
Table 7.
Texture results of cooked pasta.
| Sample | Hardness (N) |
Adhesiveness (mJ) | Cohesiveness (-) | Gumminess (N) | Springiness (-) |
Chewiness (N·mm) |
|---|---|---|---|---|---|---|
| T1 | 208.50 ± 5.50 | 20.11 ± 2.67 | 11.24 ± 1.27 | 30.66 ± 1.20 | 0.27 ± 0.01 | 8.02 ± 0.21 |
| T2 | 243.50 ± 6.50 | 19.39 ± 3.04 | 9.49 ± 3.31 | 46.04 ± 2.13 | 0.33 ± 0.01 | 15.21 ± 0.94 |
| T3 | 219.50 ± 25.5 | 18.35 ± 4.78 | 8.75 ± 2.35 | 35.35 ± 5.94 | 0.36 ± 0.02 | 12.61 ± 1.61 |
| T4 | 166.50 ± 4.50 | 14.77 ± 2.51 | 9.44 ± 1.17 | 20.71 ± 2.21 | 0.27 ± 0.01 | 5.64 ± 0.41 |
| TSF | 191.50 ± 2.50 | 14.17 ± 0.95 | 7.88 ± 1.02 | 33.24 ± 1.33 | 0.29 ± 0.02 | 9.52 ± 0.97 |
| TCF | 276.00 ± 29.00 | 22.17 ± 4.21 | 13.59 ± 3.61 | 54.84 ± 4.63 | 0.35 ± 0.02 | 18.85 ± 0.69 |
T1 – T4 – semolina pasta, TSF – pasta with sorghum flour, TCF – pasta with cork oak flour. Values are expressed as means (n = 3). All analyses were performed in triplicate.
Table 8.
A qualitative analysis of the phenolic compounds present in sorghum flour SF.
| Formula | [M+H]+ | [M+Na]+ | [M-H]- | Fragments | Compounds | Rf (min) |
|---|---|---|---|---|---|---|
| C10H8O4 | - | - | 191.0379 | 176.0186; 148.0234 124.0461 |
Scopoletin | 4.971 |
| C6H12O3 | 131.0718 | 129.0567; 113.0564 | Hydroxycaproic acid | 5.209 | ||
| C9H10O3 | - | - | 165.0559 | 147.0444; 119.0498; 103.0561 | 2-Hydroxy-3-phenylpropanoic acid (3-Phenyllactic acid) | 8.225 |
| C16H12O6 | - | - | 299.0597 | 165.0226; 133.0273 | Luteolin methyl ether (7or5) | 15.184 |
| C10H8O4 | - | - | 191.0361 | 176.0124; 148.0210 | Scopoletin isomer | 16.255 |
| C15H12O6 | - | - | 287.0606 | 151.0058; 135.0462 107.0156 |
Eriodictyol | 18.969 |
| C15H10O6 | - | - | 285.0415 | 151.0013; 133.0292; 107.0148 |
Luteolin | 20.345 |
| C15H12O5 | - | - | 271.0644 | 177.0259; 151.0031; 119.0519 |
Naringenin | 22.301 |
Table 9.
A qualitative analysis of the phenolic compounds present in cork oak flour CF.
| Formula | [M+H]+ | [M+Na]+ | [M-H]- | Fragments | Compound | Rf [min] |
|---|---|---|---|---|---|---|
| C7H12O6 | 191.0563 | 173.0521; 127.0490 | Quinic acid | 1.905 | ||
| C7H6O5 | 169.0145 | 125.0237 | Gallic acid | 2.334 | ||
| C6H8O7 | 191.0207 | 111.0125 | Citric acid | 2.714 | ||
| C9H10O5 | - | - | 197.0470 | 169.0125; 125.0228 | Ethyl Gallate | 7.457 |
| C15H20O10 | 335.0431 | 183.0329 | Digallic acid methyl | 12.530 | ||
| C8H8O5 | 183.0228 | 168.0004; 124.0130 | Methyl Gallate | 4.000 | ||
| C14H6O8 | 301.0008 | 145.0276 | Ellagic acid | 14.502 |
Table 10.
Content of polyphenols (TPC) per gallic acid (mg GAE/mL extract) and flavonoids (TFC) per rutin (mg RA/mL extract) in the tested samples.
Table 10.
Content of polyphenols (TPC) per gallic acid (mg GAE/mL extract) and flavonoids (TFC) per rutin (mg RA/mL extract) in the tested samples.
| Sample | TPC Content (mg GAE/mL extract) |
RSD (%) | TFC Content (mg RA/mL extract) |
RSD (%) |
|---|---|---|---|---|
| S1 | 0.099 | 4.349 | 0.299 | 4.290 |
| S2 | 0.123 | 1.132 | 0.328 | 3.569 |
| S3 | 0.105 | 2.225 | 0.417 | 6.537 |
| S4 | 0.118 | 1.458 | 0.581 | 8.876 |
| SF | 1.048 | 5.314 | 0.947 | 3.298 |
| CF | 1.715 | 2.918 | 1.615 | 0.189 |
| TSF | 0.299 | 4.912 | 0.254 | 4.491 |
| TCF | 0.314 | 4.715 | 0.299 | 0.122 |
S1 – S4 – semolina, SF – sorghum flour, CF – cork oak flour, TSF – pasta with sorghum flour, TCF – pasta with cork oak flour Values are expressed as mean ± standard deviation (n = 3).
Table 11.
DPPH scavenging ability of raw materials and pasta by spectrophotometric method.
| Sample | RSA after 10 min (%) | RSD (%) | RSA after 20 min (%) | RSD (%) | RSA after 30 min (%) | RSD (%) |
|---|---|---|---|---|---|---|
| S1 | 24.87 | 4.521 | 28.27 | 1.864 | 30.19 | 0.249 |
| S2 | 27.53 | 3.001 | 31.68 | 2.139 | 34.40 | 0.437 |
| S3 | 22.11 | 4.539 | 25.66 | 4.213 | 27.89 | 4.151 |
| S4 | 31.44 | 3.437 | 36.90 | 2.928 | 40.17 | 3.074 |
| SF | 77.84 | 0.644 | 78.45 | 0.639 | 78.65 | 0.638 |
| CF | 91.10 | 0.424 | 91.32 | 0.591 | 91.43 | 0.593 |
| TSF | 45.60 | 0.641 | 51.19 | 0.857 | 53.10 | 0.932 |
| TCF | 54.41 | 1.186 | 61.71 | 1.511 | 64.15 | 1.453 |
S1 – S4 – semolina, SF – sorghum flour, CF – cork oak flour, TSF – pasta with sorghum flour, TCF – pasta with cork oak flour. Values are expressed as mean ± standard deviation (n = 3).
Table 12.
Activity of the analyzed extracts with the addition of sorghum and cork oak flour, expressed relative to the semolina extract with activity taken as 1.
Table 12.
Activity of the analyzed extracts with the addition of sorghum and cork oak flour, expressed relative to the semolina extract with activity taken as 1.
| Activity in relation to semolina | SF | TSF | CF | TCF | S1 |
|---|---|---|---|---|---|
| after 0 min | 1.860 | 1.362 | 2.789 | 1.564 | 1.000 |
| after 10 min | 1.867 | 1.371 | 2.883 | 1.566 | 1.000 |
| after 30 min | 1.857 | 1.372 | 2.887 | 1.569 | 1.000 |
SF –sorghum flour, TSF – pasta with sorghum flour, CF – cork oak flour, TCF – pasta with cork oak flour, S1 – semolina.
Disclaimer/Publisher’s Note: The statements, opinions and data contained in all publications are solely those of the individual author(s) and contributor(s) and not of MDPI and/or the editor(s). MDPI and/or the editor(s) disclaim responsibility for any injury to people or property resulting from any ideas, methods, inst m any ideas, methods, instructions or products referred to in the content. |
© 2025 by the authors. Licensee MDPI, Basel, Switzerland. This article is an open access article distributed under the terms and conditions of the Creative Commons Attribution (CC BY) license (http://creativecommons.org/licenses/by/4.0/).
Copyright: This open access article is published under a Creative Commons CC BY 4.0 license, which permit the free download, distribution, and reuse, provided that the author and preprint are cited in any reuse.


