
Submitted:
30 August 2024
Posted:
02 September 2024
You are already at the latest version
Abstract
This study investigates the use of flours derived from the leaves of Pereskia aculeata and Pereskia grandifolia, commonly known as ora-pro-nóbis, in pasta products. The motivation stems from the search for nutritious and affordable dietary alternatives that promote food security. The objective is to produce flours from the leaves of these species through convection drying and to assess their physicochemical quality and potential application in spaghetti-type pasta. The leaves were dehydrated and processed into flour, which was then incorporated into pasta formulations in varying concentrations from 1% to 7%. The resulting samples underwent physicochemical, antioxidant, toxicity, and mineral composition analyses. Significant differences were observed between the flours of P. aculeata and P. grandifolia in terms of protein, lipid, carbohydrate, and bioactive compound content. P. grandifolia was noted for its higher protein and mineral content, while P. aculeata exhibited superior antioxidant activity. The pasta enriched with these flours demonstrated improvements in nutrient content and changes in colorimetric properties. The study concludes that ora-pro-nóbis flours possess high nutritional value and are viable for application in pasta products, contributing to a healthier and more diversified diet without compromising the sensory characteristics of the products.
Keywords:
convection drying
; food security
; microstructure
1. Introduction
Food insecurity remains a persistent challenge in modern society, driving the search for solutions that ensure the provision of quality and affordable food to the population. The rising food prices, particularly after the Covid-19 pandemic, have further hindered access to healthy diets, disproportionately affecting the most vulnerable families. In 2021, approximately 31 million people were unable to afford a healthy diet, representing 42% of the global population [1]. In Brazil, in 2022, approximately 703 million people were experiencing moderate food insecurity, while 211 million were facing severe food insecurity [2].
The search for healthy and affordable dietary alternatives has led to an increased demand for plant-based products, which can be easily incorporated into daily diets [3]. In this context, the utilization of Non-Conventional Food Plants (NCFPs) has emerged as a promising alternative for dietary diversification and nutritional enhancement. Among these NCFPs, Pereskia aculeata Miller and Pereskia grandifolia Haw, commonly known as ora-pro-nóbis (OPN), stand out. These cacti, native to Brazil, are rich in nutrients such as proteins, minerals, fibers, and bioactive compounds, and are used both as vegetables and in the preparation of various food products [4,5].
The production of flours from Pereskia sp. offers a promising alternative to expand the variety of nutritious foods available, allowing the addition of essential nutrients to a wide range of recipes. These flours are notable for various benefits, including the reduction of nutritional losses after harvest, ease of access to the product in dry form, optimization of raw material use, and extension of product shelf life. Recent studies have demonstrated the potential of flours made from Pereskia aculeata and Pereskia grandifolia in the application of pasta products, with positive results in terms of sensory acceptance and nutritional improvement of the developed products [6,7,8,9,10,11].
Given this, the present study aims to obtain flours from the leaves of P. aculeata and P. grandifolia through convection drying, evaluating their physicochemical quality and potential for application in pasta products.
2. Materials and Methods
2.1 Plant Material
The leaves of Pereskia (P. aculeata and P. grandifolia) were obtained from the Experimental Station of the National Institute of the Semi-Arid (INSA), located in Campina Grande, Paraíba, Brazil. The leaves were taken to the Post-Harvest Laboratory of INSA, where they were washed under running water, sanitized in a 15% sodium hypochlorite solution, rinsed, and placed on trays for the removal of surface water.
2.2 Flour Production
The dehydration of the leaves was carried out in an air circulation oven (Marconi, model MA035/3IN250) for 6 hours at 60 ºC, a temperature chosen based on experimental tests. Subsequently, the material was ground in a ball mill (Retsch MM200) and sieved through a 60 mesh sieve. The obtained flour was stored in laminated packages and kept away from light.
2.3 Preparation of Spaghetti-Type Pasta
Nine pasta formulations were prepared and evaluated in four replicates, each weighing 50 g, following the methodology of Rocha et al. (2008), with adaptations. The composition of each formulation is described in Table 1: the control formulation (FC) without the addition of Pereskia flour, and formulations with the addition of 1%, 3%, 5%, and 7% of P. aculeata (PA 1, PA 3, PA 5, and PA 7) and P. grandifolia (PG 1, PG 3, PG 5, and PG 7) flour. The experimental design used was a completely randomized design (CRD).
The pasta was prepared following these steps: ingredient weighing, mixing, kneading, extrusion, drying, and storage. The ingredients were weighed using an analytical balance to ensure precision. After weighing the wheat and Pereskia flours, the ingredients were manually mixed until homogenization. The wet ingredients (egg and olive oil) were then slowly added until the dough reached the kneading point. Manual kneading lasted approximately 30 minutes to achieve the desired texture. The dough was then rested for one hour at room temperature, extruded using a manual pasta machine (Clink brand), and dried at room temperature (25±2 °C). Finally, the pasta was packaged in polyethylene bags and stored at room temperature (25±2 °C).
2.4 Characterization of P. aculeata and P. grandifolia Flour and Spaghetti-Type Pasta
The flours were characterized by physical analyses, such as bulk density, tapped density, Carr’s index, and Hausner’s factor, as well as analyses of water content, water activity, ash, proteins, carbohydrates, total energy value, color, minerals, extractable polyphenols, antioxidants, toxicity, thermographic analysis, and particle morphology. The pasta was evaluated for color, water content, ash, proteins, carbohydrates, total energy value, minerals, and particle morphology.
2.4.1. Physical and Physicochemical Analyses and Antioxidant Activity of the Flours
Bulk Density: Determined by weighing the flour in a 10 mL graduated cylinder, without compaction, to determine the total volume occupied by the solid, according to the method of Souza et al. [12]. Tapped Density: Obtained by weighing the flour until a 10 mL graduated cylinder is filled and manually tapping 50 times on a bench from a height of 10 cm [13]. Compressibility Index: A simple method to indirectly assess the flow properties of powders by comparing bulk density (ρa) and tapped density (ρc). Hausner’s Factor: Indirectly evaluates the flow properties of powders, determined from the bulk (ρa) and tapped (ρc) densities, according to the methodology of Hausner [14]. Solubility: Determined by the method [15] modified by Cano-Chauca et al. [16].
Water Content: Determined by the oven drying method at 105 °C to constant weight [17] Water Activity: Measured using Labmaster-aw equipment, Novasina at 25 °C. Ash Content: Determined by incinerating the sample in a muffle furnace at 550 °C until obtaining a residue free of carbon, according to IAL [17]. Total Nitrogen Content: Determined by the Kjeldahl method, using a conversion factor of 6.25 [17]. Fat Content: Determined by the Bligh-Dyer method [18], using anhydrous sodium sulfate to remove water traces. Total Carbohydrates: Calculated by the difference between 100 and the sum of moisture, protein, lipid, and ash percentages. Total Energy Value: Calculated by multiplying the obtained values by the appropriate conversion factors: proteins and carbohydrates by 4 Kcal/g and lipids by 9 Kcal/g. Color Analysis: Parameters determined by direct reading using a portable colorimeter (Precise Color Reader, model WR-10QC, FRU®) in the CIELAB system.
Total Extractable Polyphenols (TEP): Determined according to the methodology of Obanda and Owuor [19]. Antioxidant Activity: Determined by the ABTS and DPPH methods, according to the methodology of Rufino et al. [20]. Toxicological Properties: Evaluated according to the methodology of Meyer et al. [21].
Mineral Composition: Samples (0.1 g) were weighed in digestion tubes, added with 5 mL of nitric acid, digested in a microwave digester (MARS 6, CEM), and quantified by Microwave Plasma-Atomic Emission Spectrometer (MP-AES, model 4200 Agilent).
2.5. Thermogravimetric Analysis (TG)
The thermogravimetric analysis (TG/DTG) of the flours was performed using a NETZSCH instrument, model STA 449F3, under a nitrogen atmosphere (50 mL/min), with a heating rate of 5 °C/min, from room temperature to 600 °C, using approximately 3 mg of samples in an alumina crucible.
2.6. Scanning Electron Microscopy (SEM)
The particle morphology of the flours and pasta was analyzed by scanning electron microscopy (SEM). The samples were fixed on aluminum stubs, covered with double-sided carbon tape, sputter-coated with gold for 200 seconds (Ion Sputter Coater-G20), and observed under a Scanning Electron Microscope (VEGA4, TESCAN).
2.7. Experimental Design and Statistical Analysis
A completely randomized design (CRD) with a 2 x 4 + 1 factorial scheme was used. The study involved flour from two Ora Pro-nobis species and four flour concentrations, at 1%, 3%, 5%, and 7%. Additionally, an absolute control treatment was included, with no addition of Ora Pro-nobis flour.
Statistical analysis of the data was conducted using R software, version 4.2.3 [22], with the assistance of the ‘Tratamentos.ad’ package. The data were initially subjected to analysis of variance (ANOVA) to verify the existence of significant differences between treatments. After establishing significance by ANOVA, mean comparison tests were performed to explore differences between groups.
To compare means between different species levels within each level of Ora Pro-nobis flour concentration, the T-test was used. For comparing different flour concentration levels within each species, the Student-Newman-Keuls (SNK) test was applied. Finally, to compare the absolute control with each of the treatments, Dunnett’s test was employed.
3. Results and Discussion
3.1. Physicochemical Analysis of P. aculeata and P. grandifolia Flours
The results of the physicochemical evaluation of P. aculeata and P. grandifolia flours are presented in Table 2.
The results demonstrate that most of the evaluated parameters were superior for the species P. grandifolia, except for the water and carbohydrate content, which were higher in P. aculeata. Similar findings were reported by Santos [23].
The flours of P. aculeata and P. grandifolia exhibited moisture content of 5.7% and 4.8%, respectively, complying with the maximum moisture range of 15% for flours as determined by Brazilian standards. The water activity (Aw) decreased after dehydration, with values below 0.60, limiting microbial growth and extending product shelf life [24].
The ash content ranged from 14.2% to 15.9% between the flours of P. aculeata and P. grandifolia, respectively. P. grandifolia stood out with higher mineral content, indicating its potential as a promising dietary source of minerals such as potassium, calcium, and magnesium.
The protein content in Pereskia flours was 17.48 g/100g (for P. aculeata) and 21.86 g/100g (for P. grandifolia), which is higher than that of wheat flour (9.8 g/100g) [25]. The recommended daily intake (RDI) of protein for adults is estimated at 50 g, and for children aged 7 to 10 years, it is 34 g [26]. Thus, the incorporation of Pereskia flour in food preparations is advantageous for meeting these protein requirements. Similar results were reported by Manetta et al. [27], who assessed the composition of dried ora-pro-nóbis leaves and found protein levels ranging from 15.61 to 21.81%.
The lipid content in the flours was 6.18 g/100 g (for P. aculeata) and 8.78 g/100 g (for P. grandifolia). Despite the lipid content, lipids are the least abundant macromolecule in the chemical composition of Pereskia, with results consistent with other studies [7,9,23,28].
Carbohydrate values were 56.44% in P. aculeata and 48.66% in P. grandifolia. These levels are higher than those found in other studies [6,10,27,29], indicating the energy potential of Pereskia flours.
The analysis of the L parameter (luminosity) revealed that the flours have a darker coloration. The drying method resulted in a significant color loss due to the degradation of certain pigments [30]. For the b* parameter, P. grandifolia flour exhibited a greater tendency towards yellowish coloration. In general, Pereskia flours display a greenish and yellowish color, with P. aculeata showing a darker shade.
3.1.1. Analysis of Total Extractable Polyphenols, Antioxidants, and Toxicity
The results of the analysis of total extractable polyphenols, antioxidant activity, and toxicity of Pereskia flours are presented in Table 3, showing a significant concentration of total extractable polyphenols (TEP) and antioxidant capacity.
The amount of polyphenols in P. aculeata flour was lower (485.61 mg/100g) compared to that found in P. grandifolia flour (1129.59 mg/100g). Despite the same thermal treatment, the drying method influenced the species differently.
P. aculeata flour showed higher antioxidant activity by the ABTS method (38.97±1.18 µM of trolox/g), which may be related to better preservation of antioxidant compounds under the specified drying temperature. According to Sommer et al. [10], drying time influences the preservation of bioactive compounds. Thus, the sensitivity of antioxidant and phenolic compounds to higher temperatures may cause their degradation, reducing antioxidant potential [31].
The DPPH assay identified higher antioxidant activity in P. grandifolia flour (15.78g), which also showed a higher concentration of total polyphenols, with results expressed in EC50 (concentration of extract capable of reacting with 50% of the radical present in the DPPH solution). A lower EC50 represents better antioxidant capacity [31].
The methods used for determining antioxidant activity yielded different results, which is related to the properties of each method regarding the samples. Torres et al. [31] emphasize the importance of multiple mechanisms for evaluating the antioxidant capacity of a sample. The DPPH mechanism showed a correlation with the amount of TEP and antioxidant capacity. Variations in the total polyphenol content and antioxidant activity by the ABTS method in the obtained flours were also observed by Torres et al. [31], Almeida et al. [32], and Silva et al. [33] in studies related to the determination of bioactive compounds and antioxidant activity in different species.
Overall, Pereskia, in addition to its nutritional properties, presents significant antioxidant capacity due to the presence of bioactive compounds in the flours. Natural extracts with antioxidant capacity play an important role in combating oxidative stress, which causes imbalances and diseases in the body. The antioxidant activity of bioactive compounds can prevent the development of diseases such as cancer, cardiovascular diseases, and diabetes mellitus [34].
The evaluation of the toxicity of Pereskia flours is fundamental for the safety of food consumption. The results indicated low or no toxicity, as shown in Table 2. P. aculeata flour did not show cytotoxic activity, with DL50 > 1000 μg/mL, while P. grandifolia flour presented a low level of toxicity (971.49 μg/mL), which may be associated with the concentration of phenolic compounds. Recent studies on the cytotoxic activity of Pereskia spp. have shown the absence of toxicity [34,35].
3.2. Physical Analyses of P. aculeata and P. grandifolia Flours
The physical parameters evaluated in Pereskia flours were determined, showing approximate values between the species P. aculeata and P. grandifolia, as presented in Table 4.
Regarding the density parameter, similar behavior was observed between the bulk and compacted densities for P. aculeata flours, where both are higher than those found for P. grandifolia flours, with values of 2.54 g/mL-1 and 4.12 g/mL-1, respectively. Compacted density was higher than bulk density in both flours. Density determination helps understand powder flow properties by indirectly assessing flowability through Carr Index and Hausner Factor parameters. When the flow is adequate, uniform particle packing and a constant mass-to-volume ratio are possible [36].
The Carr Index (CI) ranged between 32.17% and 38% in Pereskia flours, indicating poor flowability since higher CI values correspond to lower flowability. According to Santhalakshmy et al. [37], products with CI values below 15% exhibit excellent flowability. The Carr Index (CI) is related to the study of the flow and compression of a solid [38], being an important parameter associated with powder packing. The flours exhibited Hausner Factor values that indicate low cohesiveness. Values between 1.00 and 1.11 (CI < 10%) indicate excellent flow [36], with the increase in the Hausner Factor being associated with poor flow. The shape of the microstructures in the flours may interfere with water absorption and particle compression.
The solubility parameter results showed values above 90% for the evaluated flours, with P. aculeata flours reaching a solubility of 94.62%.
3.3. Analysis of Mineral Content in Pereskia spp. Flours.
Minerals play an important role in regulating cellular activities in animals and are essential elements in plant development, which are the primary source in the food chain.
Table 5 presents the macronutrient and micronutrient content of Pereskia aculeata and Pereskia grandifolia flours.
Among the minerals found, potassium was the most abundant, while copper and zinc were present in the smallest quantities, indicating varied concentrations between macronutrients and micronutrients. As these are two distinct species, the mineral content had specific values for each. P. aculeata (43.91 mg/g) showed higher potassium levels compared to P. grandifolia (33.81 mg/g). This result is similar to that observed by Almeida et al. [39], who reported potassium levels of 3910.00 mg/100 g and 3186.67 mg/100 g in P. aculeata and P. grandifolia flours, respectively. Both species exhibited high levels of calcium and magnesium in their leaves, with P. grandifolia containing more magnesium (22.60 mg/g). In studies by Takeiti et al. [7] and Barreira et al. [40], calcium and magnesium values varied from 427.08 to 3420 mg/100 g for calcium and from 88.84 to 1900 mg/100 g for magnesium.
Of the micronutrients, manganese concentration was higher in P. aculeata (0.16 mg/g), while sodium was higher in P. grandifolia (7.15 mg/g), followed by higher iron content (0.19 mg/g). The mineral concentrations also differed depending on the type of mineral (macro and micronutrient). Thus, Pereskia becomes an indispensable food species for developing dietary strategies and ensuring the nutritional security of consumers whose eating habits are directly related to the consumption of this species [40].
3.4. Thermogravimetric Analysis (TGA) and Derivative Thermogravimetry (DTG)
Figure 1 presents the thermogravimetric curves (TGA) of P. aculeata and P. grandifolia flours, indicating the mass loss as a function of temperature.
The data obtained from the thermographic curves of P. aculeata and P. grandifolia flours are presented in Table 6.
The data obtained from the TGA and DTG curves demonstrated significant variations in mass during the decomposition events of the samples. The use of thermogravimetric analysis provides a deeper understanding of the thermal behavior of a product, especially concerning controlled time and temperature conditions [41].
It was observed that the decomposition stages varied between the analyzed samples. P. aculeata flour exhibited five distinct stages, with the highest mass loss (19.14%) occurring during the 2nd stage, within the temperature range of 100°C to 280°C. Conversely, P. grandifolia flour also showed a significant increase in mass loss during the 2nd stage, but over a broader temperature range, from 100°C to 360°C, resulting in a mass loss of 40.57%. Mass losses between 25°C and 100°C were lower and were mainly related to the dehydration of the samples.
The residual mass of the samples at 600°C was greater than 50%, with the highest mass loss recorded in P. grandifolia flour, where the remaining mass after heating processes was 37.26%. In P. aculeata flour, the residual mass reached 42.65%. It is important to note that the rates of mass loss tend to increase as the heating temperature rises. Overall, Pereskia flours exhibited similar thermal stabilities, with decomposition peaks occurring approximately within the temperature range of 100°C to 360°C.
These data indicate that both flours possess significant thermal stability, with P. grandifolia exhibiting greater complexity in its thermal decomposition, possibly due to a higher content of bioactive compounds and fibers.
3.5 Scanning Electron Microscopy (SEM)
Figure 2 presents the micrographs obtained by scanning electron microscopy (SEM) of Pereskia aculeata and Pereskia grandifolia flour particles, with magnifications of 100x, 500x, 1000x, and 2000x.
The SEM images of P. aculeata flour samples (Figure 2) show the presence of particles of varying sizes, with larger P. aculeata structures exhibiting more triangular shapes, while those of P. grandifolia are more irregular and smaller. The micrographs of P. grandifolia reveal fissures in the structures starting from 1000x magnification, indicating possible damage during the milling process. In contrast, P. aculeata exhibits a more uniform structure, with fewer visible fissures.
According to Navaf et al. [42], particle size and shape significantly impact functional properties such as digestibility, water absorption capacity, and swelling power. Smaller particles, due to their surface area, demonstrate potential for better digestibility and higher enzymatic activity.
3.6. Characterization of Spaghetti-type Pasta
The results of the physicochemical analysis of the spaghetti-type pasta are presented in Figure 3.
The formulations enriched with P. aculeata (PA) and P. grandifolia (PG) flours resulted in an increase in the analyzed components compared to the control sample. The moisture content was found to be appropriate for most of the obtained formulations, being below the 13% moisture threshold for dry pasta. The addition of Pereskia increased the moisture content in 5% concentrations, particularly in the PG 5% formulation, where the moisture content exceeded the safe range and also surpassed the control sample (12.77%). Moisture determination allows for the analysis of the impact of technological procedures on the product and the favorable storage conditions [43].
The addition of Pereskia flours increased the ash content of the pasta, significantly increasing its content (p < 0.01), with the highest ash content (4.49%) observed in the sample with 5% P. aculeata flour. Sato et al. [44] incorporated 20% P. aculeata flour into pasta and obtained an ash content (5.00%) five times higher than that of the control sample (1.02%). Cazagranda et al. [9] also observed an increase in ash content in cookie formulations with the addition of ora-pro-nóbis flour (formulations with 2% and 5%), finding ash contents of 1.37% and 1.88%. The ash levels in the samples highlight the potential of ora-pro-nóbis as a mineral source.
Regarding proteins, the incorporation of ora-pro-nóbis flour had an effect on the pasta, significantly increasing its protein content (p < 0.05). The PA 7% sample had the highest protein content at 16.39%, while the control sample (FC) averaged 14.34%. It was observed that increasing the concentrations of flours resulted in higher protein levels in the pasta, which is due to the significant protein content found in ora-pro-nóbis flours. Sato et al. [44] observed an increase in protein content in pasta with the addition of 10% and 20% ora-pro-nóbis flour, obtaining 19.86% and 19.60% protein in the respective samples. Proteins play important roles in the body, acting as builders in the formation of human tissues and as regulators of cellular activities. Therefore, a daily protein intake is necessary to maintain an individual’s vital functions.
The lipid content showed little variation between means (p < 0.01), with lower lipid content in most samples with P. aculeata flour and higher lipid content (13.98%) in pasta with 5% P. grandifolia flour. Cazagranda et al. [9] observed a reduction in lipid content in cookie formulations. Thus, ora-pro-nóbis may be an option for consumers seeking diets with lower fat concentrations.
Regarding carbohydrate content, all samples had lower concentrations than the control sample. The pasta with 3% P. aculeata flour and 1% P. grandifolia flour had the highest levels.
Figure 4 presents the colorimetric analysis of spaghetti-type pasta enriched with P. aculeata (PA) and P. grandifolia (PG) flours at different concentrations (1%, 3%, 5%, and 7%) compared to the control formulation (FC).
The formulations enriched with PA and PG showed a reduction in luminosity with increasing flour concentration. This resulted in darker pasta, especially in formulations with 7% flour. The lower luminosity may be attributed to the presence of phenolic compounds and natural pigments in Pereskia spp. flours, which influence the final color of the product. This behavior was also observed by Ferreira et al. [45], who reported a decrease in luminosity when adding ora-pro-nóbis flour to pasta. This confirms that the presence of natural pigments and phenolic compounds in Pereskia spp. flours directly influences the color of food products.
The pasta showed variation in the a* parameter, which measures the intensity of green-red color, with increasing concentrations of Pereskia flours. Formulations with higher concentrations of PA and PG tend to show a greener hue. This is consistent with the presence of chlorophyll in Pereskia spp. leaves, as reported by Alcorta et al. [46].
The b* parameter, which measures the intensity of yellow-blue color, also varied with the addition of Pereskia flours. Formulations with higher amounts of flour showed a greater intensity of yellow, especially in PG formulations. This may be related to the presence of carotenoids in Pereskia spp. flours.
Previous studies have shown that the addition of plant flours rich in bioactive compounds, such as those of Pereskia spp., can significantly alter the colorimetric properties of food products. Sommer et al. [10] observed that drying and processing of ora-pro-nóbis leaves result in the preservation of bioactive compounds that influence the color of final products.
Figure 5 presents the mineral concentrations in different formulations of pasta enriched with Pereskia aculeata (PA) and Pereskia grandifolia (PG) flours at various concentrations (1%, 3%, 5%, and 7%) compared to the control formulation (FC).
The pasta enriched with Pereskia flour showed a progressive increase in calcium concentration as the percentage of flour increased. The PA 7% and PG 7% formulations had the highest calcium concentrations (242 mg/kg and 245 mg/kg, respectively). This increase is significant compared to the control formulation, which did not contain detectable calcium, indicating the effectiveness of Pereskia flour in enhancing the mineral content of pasta.
A similar pattern to calcium was observed with magnesium (Mg) concentrations increasing as the percentage of Pereskia flour increased. The magnesium concentration in PA 7% and PG 7% was 146 mg/kg and 149 mg/kg, respectively. It is noteworthy that pasta with PG flour consistently had higher magnesium levels than those with PA flour. These data suggest that the inclusion of Pereskia flour significantly contributes to magnesium intake, which is essential for various biological functions.
The sodium (Na) concentrations in the enriched pasta are relatively low, ranging from 7 mg/kg to 7.4 mg/kg. The sodium content is slightly higher in pasta with PG flour compared to PA. However, the inclusion of Pereskia flour does not appear to significantly affect sodium levels in the pasta. This aspect is beneficial considering concerns about excessive sodium intake in the modern diet.
The presence of copper (Cu) is minimal but detectable in the enriched formulations. The values slightly increase with the flour concentration, reaching up to 0.024 mg/kg in PG 7%, with PG flour consistently having slightly higher copper concentrations at all percentages.
Zinc (Zn) concentrations in the enriched formulations are low but significantly increase with the percentage of Pereskia flour. The zinc content (Figure 5E) is slightly higher in pasta with PG flour.
Iron (Fe) content slightly increases with Pereskia flour concentration, with the highest being in PG 7% (0.17 mg/kg). Pasta with PG flour has slightly higher iron content.
The enriched formulations show an increase in manganese (Mn) concentration, reaching 0.19 mg/kg in PG 7%. Manganese concentration is slightly higher in pasta with PG flour, important for bone metabolism and connective tissue formation.
Figure 6 presents the micrographs of cross-sections of pasta enriched with P. aculeata and P. grandifolia at different concentrations (1%, 3%, 5%, and 7%).
In Figure 6, it is observed that enriching pasta with Pereskia flours did not result in significant structural changes at the microscopic level when compared to the control sample. However, pasta obtained with P. aculeata flour exhibits a slightly more porous structure compared to those obtained with P. grandifolia flour, which have a more compact structure. This difference may be attributed to the intrinsic characteristics of the flours used, where PA tends to form a less dense matrix.
Some studies indicate that the addition of plant flours, such as Pereskia spp., can significantly alter the micro and macroscopic structure of food products. Navaf et al. [42] observed that particle size and shape significantly impact functional properties, such as digestibility and water absorption capacity. Smaller particles, like those observed in PG flour, may result in a larger surface area, improving digestibility and enzymatic activity.
The micrographs showed starch granule aggregation in all formulations as well as in the control sample. The discontinuous structure of the pasta is likely associated with a high degree of starch gelatinization in the samples, which caused greater irregularity in the structure of the starch granules [47]. This observation is consistent with the effect of adding flours rich in bioactive compounds and fibers, which can influence the starch matrix during the cooking process.
The presence of a discontinuous structure and starch granule aggregation may be associated with the drying process and the intrinsic properties of Pereskia flours. Mir et al. [47] report that starch gelatinization is a crucial factor affecting the final texture of food products, being influenced by water content and the drying process.
The micrographs showed a slight whitish layer covering the particles. According to Vernaza and Chang [48], this layer represents the fat (oil) present in the formulations, which is used as an ingredient to improve the texture and palatability of the pasta.
The presence of a whitish layer in the micrographs indicates the proper incorporation of fat in the formulations, essential for the texture and flavor of the pasta. Vernaza and Chang [48] emphasize that the uniform distribution of fat is critical for the sensory quality of food products.
4. Conclusions
The study conducted on the production and characterization of Pereskia aculeata and Pereskia grandifolia flours demonstrated that both flours possess physicochemical and functional properties that make them suitable for application in pasta products. The analyses indicated that P. aculeata flour had higher carbohydrate content and antioxidant activity, while P. grandifolia flour stood out for its higher levels of proteins, lipids, minerals, and bioactive compounds. These results highlight the nutritional potential of Pereskia spp. flours, aligning with the trend of consuming natural and healthy foods.
6. Patents
This work has been submitted for patent filing with the Application Number: BR 10 2024 009796 3. Title of the Invention: Process for the Production and Obtaining of Spaghetti-type Pasta Enriched with Pereskia sp. Flour.
Author Contributions
Conceptualization, I.R.B. and I.S.M. Methodology, C.A.L.C. and I.S.M.; formal analysis, I.T.R.C., H.V.M. and I.S.M; investigation, I.S.M.; data curation, R.P.L.; writing—original draft preparation, I.R.B., T.C.R. and I.S.M.; writing—review and editing, E.M.P, M.T.C. and F.R.C.B. All authors have read and agreed to the published version of the manuscript.
Funding
This research received no external funding.
Conflicts of Interest
The authors declare no conflicts of interest.
References
- FAO; FIDA; OMS; PAM; UNICEF. O estado da segurança alimentar e nutricional no mundo 2023; FAO: Roma, Italy, 2023. [CrossRef]
- Brasil. Fome no Brasil piorou nos últimos três anos, mostra relatório da FAO. Ministério do Desenvolvimento e Assistência Social, Família e Combate à Fome, 2023. Available online: https://www.gov.br/mds/pt-br/noticias-e-conteudos/desenvolvimento-social/noticias-desenvolvimento-social/fome-no-brasil-piorou-nos-ultimos-tres-anos-mostra-relatorio-da-fao(accessed on 2 ago. 2024).
- Hisatomi, C.M.; Gorgen, D.K.; Roginski, G.S.; Hoffmann, L.F.; da Silva, T. M.; Carnitatto, I.; Garcia, J.R.N. Utilização da planta alimentícia não convencional ora pro nobis em educação nutricional. Brazilian Journal of Animal and Environmental Research 2020, 3, 3846–3855. [Google Scholar] [CrossRef]
- Silva, N.F.N.; Silva, S.H.; Baron, D.; Oliveira Neves, I.C.; Casanova, F. Pereskia aculeata Miller as a Novel Food Source: A Review. Foods 2023, 12, 2092. [Google Scholar] [CrossRef] [PubMed]
- Conceição, M. C.; Junqueira, L. A.; Guedes Silva, K. C.; Prado, M. E. T.; de Resende, J. V. Thermal and Microstructural Stability of a Powdered Gum Derived from Pereskia aculeata Miller Leaves. Food Hydrocoll. 2014, 40, 104–114. [Google Scholar] [CrossRef]
- Rocha, A. F. O. F. Produção de massas alimentícias isentas de glúten a partir de subprodutos da indústria alimentar. Dissertação (Mestrado), Universidade de Lisboa, Portugal, 2015. [Google Scholar]
- Takeiti, C.Y.; Antonio, G.C.; Motta, E.M.P.; Collares-Queiroz, F.P.; Park, K.J. Nutritive Evaluation of a Non-Conventional Leafy Vegetable (Pereskia aculeata Miller). Int. J. Food Sci. Nutr. 2009, 60, 148–160. [Google Scholar] [CrossRef]
- Sobrinho, J. H. B.; Oliveira, J. F. S.; Fernandes, J. S.; Oliveira, A. S.; Paula, H. C. B.; Feitosa, J. P. A. Characterization of a Powdered Gum Derived from Pereskia aculeata Miller Leaves. Food Hydrocoll. 2015, 51, 39–47. [Google Scholar]
- Cazagranda, C.; Amancio, R.; Feiten, M. C.; Gilioli, A.; Gonzalez, S. L.; Fagundes, C. Obtenção de farinha de ora-pro-nóbis (Pereskia aculeata Miller) e sua aplicação no desenvolvimento de biscoitos tipo cookie. Cadernos de Ciência & Tecnologia 2022, 39, 27148. [Google Scholar]
- Sommer, M. C.; Araújo Ribeiro, P. F.; Kaminski, T. A. Obtenção e caracterização físico-química da farinha de ora-pro-nóbis. Braz. J. Health Rev. 2022, 5, 6878–6892. [Google Scholar] [CrossRef]
- Ciríaco, A. C. A.; Mendes, R. M.; Carvalho, V. S. Antioxidant activity and bioactive compounds in ora-pro-nóbis flour (Pereskia aculeata Miller). Braz. J. Food Technol. 2023, 26, e2022054. [Google Scholar] [CrossRef]
- Souza, R. L. A.; Oliveira, L. S. C.; Silva, F. L. H.; Amorim, B. C. Caracterização da poligalacturonase produzida por fermentação semi-sólida utilizando-se resíduos de maracujá como substrato. Rev. Bras. Eng. Agríc. Ambient. 2010, 14, 987–992. [Google Scholar] [CrossRef]
- Tonon, R.V.; Brabet, C.; Hubinger, M.D. Aplicação da secagem por atomização para a obtenção de produtos funcionais com alto valor agregado a partir do açaí. Inclusão Social 2013, 6, 70–76. [Google Scholar]
- Hausner, H.H. Friction conditions in a mass of metal powder. Powder Metall 1967, 3, 7–13. [Google Scholar]
- Eastman, J.E.; Moore, C.O. Cold water soluble granular starch for gelled food composition. U. S. Patent 4465702, 1984. [Google Scholar]
- Cano-Chauca, M.; Stringheta, P.C.; Ramos, A.M.; Cal-Vidal, C. Effect of the carriers on the microstructure of mango powder obtained by spray drying and its functional characterization. Innov. Food Sci. Emerg. Technol. 2005, 6, 420–428. [Google Scholar] [CrossRef]
- INSTITUTO ADOLFO LUTZ (IAL). Normas Analíticas do Instituto Adolfo Lutz: Métodos Químicos e Físicos para Análise de Alimentos, 4th ed.; IAL: São Paulo, Brazil, 2008; p. 1020. [Google Scholar]
- Bligh, E.G.; Dyer, W.J. A rapid method of total lipid extraction and purification. Can. J. Biochem. Physiol. 1959, 37, 911–917. [Google Scholar] [CrossRef] [PubMed]
- Obanda, M.; Owuor, P.O. Flavanol Composition and Caffeine Content of Green Tea as Quality Potential Indicators of Kenya Black Teas. J. Food Agric. 1997, 74, 209–215. [Google Scholar] [CrossRef]
- Rufino, M.S.M.; Alves, R.E.; Brito, E.S.; Morais, S.M.; Sampaio, C.G.; Jiménez, J.P.; Calixto, F.D.S. Metodologia Científica: Determinação da Atividade Antioxidante Total em Frutas pela Captura do Radical Livre ABTS+; Comunicado Técnico 128; EMBRAPA Agroindústria Tropical: Fortaleza, CE, Brazil, 2007. [Google Scholar]
- Meyer, B.N.; Ferrigni, N.R.; Putnam, L.B.; Jacobsen, L.B.; Nichols, D.E.; McLaughlin, J.L. Brine Shrimp: A Convenient General Bioassay for Active Plant Constituents. J. Med. Plant Nat. Prod. Res. 1982, 45, 31–34. [Google Scholar] [CrossRef] [PubMed]
- R Core Team. R: A Language and Environment for Statistical Computing; R Foundation for Statistical Computing: Vienna, Austria, 2023. [Google Scholar]
- Santos, S. M. D. Obtenção da farinha de ora-pro-nóbis (Pereskia aculeata Miller e Pereskia grandifolia Haw) e sua aplicação em massas de pão sem glúten; Monografia (Tecnologia em Alimentos), Universidade Tecnológica Federal do Paraná: Londrina, Brazil, 2023. [Google Scholar]
- Moreira, D.B.; Dias, T.J.; Rocha, V.C.; Chaves, A.C.T. Determinação do Teor de Cinzas em Alimentos e sua Relação com a Saúde. Rev. Ibero-Am. Humanid. Ciênc. Educ. 2021, 7, 3041–3053. [Google Scholar] [CrossRef]
- NEPA—UNICAMP. Tabela Brasileira de Composição de Alimentos, 4th ed.; NEPA—UNICAMP: Campinas, Brazil, 2011; p. 161. [Google Scholar]
- Brasil. Resolução da Diretoria Colegiada - RDC Nº 272, de 22 de setembro de 2005. Aprova o Regulamento Técnico para Produtos Vegetais, Produtos de Frutas e Cogumelos Comestíveis. Diário Oficial da União, Poder Executivo, 23 de setembro de 2005.
- Manetta, G.B.; Romano, B.C.; Costa, T.M.B.; Triffoni-Melo, A.T. Utilização de farinha de Ora-Pro-Nobis (Pereskia aculeata Miller) em preparação de biscoito de polvilho. Braz. J. Dev. 2023, 9, 1494–1508. [Google Scholar] [CrossRef]
- Almeida, M.E.F.; Corrêa, A.D. Utilização de cactáceas do gênero Pereskia na alimentação humana em um município de Minas Gerais. Ciênc. Rural 2012, 42, 751–756. [Google Scholar] [CrossRef]
- Maciel, V.B.V.; Bezerra, R.Q.; Chagas, E.G.L.; Yoshida, C.M.P.; Carvalho, R.A. Ora-pro-nobis (Pereskia aculeata Miller): A Potential Alternative for Iron Supplementation and Phytochemical Compounds. Braz. J. Food Technol. 2021, 24, e2020180. [Google Scholar] [CrossRef]
- Xu, Y.; Xiao, Y.; Lagnika, C.; Li, D.; Liu, C.; Jiang, N.; Song, J.; Zhang, M. Comparative Evaluation of Nutritional Properties, Antioxidant Capacity and Physical Characteristics of Cabbage (Brassica oleracea var. capitata L.) Subjected to Different Drying Methods. Food Chem. 2020, 309, 1–8. [Google Scholar] [CrossRef]
- Torres, T.M.S.; Mendiola, J.A.; Rivera, G.Á.; Mazzutti, S.; Ibáñez, E.; Cifuentes, A.; Ferreira, S.R.S. Protein Valorization from Ora-Pro-Nobis Leaves by Compressed Fluids Biorefinery Extractions. Innov. Food Sci. Emerg. Technol. 2022, 76, 102–926. [Google Scholar] [CrossRef]
- Almeida, J.I.O.; Costa, F.; Paulino, C.G.; Almeida, M.J.O.; Damaceno, M.N.; Santos, S.M.L.; Farias, V.L. Effect of Pasteurization on Bioactive Compounds and Antioxidant Activity of Ziziphus joazeiro Mart. Fruit Pulp. Res. Soc. Dev. 2020, 9, e135953245. [Google Scholar] [CrossRef]
- Silva, J.O.; Santos, D.N.S.; Cosenza, G.P.; Melo, J.C.S.; Monteiro, M.R.P.; Araújo, R.L.B. Determinação da Atividade Antioxidante de Polifenóis Extraíveis, Macromoleculares e Identificação de Lupanina em Tremoço Branco (Lupinus albus). Sci. Electron. Arch. 2019, 12, 12–19. [Google Scholar] [CrossRef]
- Garcia, J.A.A.; Corrêa, R.C.G.; Barros, L.; Pereira, C.; Abreu, R.W.V.; Alves, M.J.; Calhelha, R.C.; Peralta, R.M.; Ferreira, I.C.F.R. Phytochemical Profile and Biological Activities of ‘Ora-Pro-Nobis’ Leaves (Pereskia aculeata Miller), an Underexploited Superfood from the Brazilian Atlantic Forest. Food Chem. 2019, 294, 302–308. [Google Scholar] [CrossRef]
- Maciel, V.; Yoshida, C.; Boesch, C.; Goycoolea, F.; Carvalho, R. Iron Uptake by Caco-2 Cells from a Brazilian Natural Plant Extract Loaded into Chitosan/Pectin Nano-and Micro-Particles. Proc. Nutr. Soc. 2018, 77, E45. [Google Scholar] [CrossRef]
- Pinto, M.C.; Gonçalves, F.F.; Castanheira, C.R.; Ferreira, K.A. Desenvolvimento de Kit para Determinação e Visualização de Fluidez de Pós para Aplicação em Aulas Práticas de Farmacotécnica, Operações Unitárias e Estágio de Manipulação. Braz. J. Dev. 2022, 8, 16488–16498. [Google Scholar] [CrossRef]
- Santhalakshmy, S.; Bosco, S.J.D.; Francis, S.; Sabeena, M. Effect of Inlet Temperature on Physicochemical Properties of Spray-Dried Jamun Fruit Juice Powder. Powder Technol. 2015, 274, 37–43. [Google Scholar] [CrossRef]
- Villanova, J.C.O.; Lima, T.H.; Patrício, P.S.; Pereira, F.V.; Ayres, E. Síntese e Caracterização de Beads Acrílicos Preparados por Polimerização em Suspensão Visando Aplicação como Excipiente Farmacêutico para Compressão Direta. Quím. Nova 2012, 35, 124–131. [Google Scholar] [CrossRef]
- Almeida, M.E.F.; Junqueira, A.M.B.; Simão, A.A.; Corrêa, A.D. Caracterização Química das Hortaliças Não-Convencionais Conhecidas como Ora-Pro-Nobis. Biosci. J. 2014, 30 (Suppl. 1), 431–439. [Google Scholar]
- Barreira, T.F.; Paula Filho, G.X.; Priore, S.E.; Santos, R.H.S.; Pinheiro-Sant’Ana, H.M. Nutrient Content in Ora-Pro-Nóbis (Pereskia aculeata Mill.): Unconventional Vegetable of the Brazilian Atlantic Forest. Food Sci. Technol. 2021, 41 (Suppl. 1), 47–51. [Google Scholar] [CrossRef]
- Machado, G.O. Desenvolvimento Tecnológico e Caracterização Físico-Química da Farinha de Carnaúba (Copernicia prunifera (Mill.) H.E. Moore); Monografia (Curso de Tecnologia em Alimentos), Instituto Federal de Educação, Ciência e Tecnologia do Piauí, Campus Teresina Central, 2022; p. 40. [Google Scholar]
- Navaf, M.; Sunooj, K.V.; Aaliya, B.; Sudheesh, C.; George, J. Physico-Chemical, Functional, Morphological, Thermal Properties and Digestibility of Talipot Palm (Corypha umbraculifera L.) Flour and Starch Grown in Malabar Region of South India. J. Food Meas. Charact. 2020, 14, 1601–1613. [Google Scholar] [CrossRef]
- Quinaud, B.E.R.; Monteiro, P.L.; Pires, C.R.F.; Santos, V.F.; Kato, H.C.A.; Sousa, D.N. Elaboration and Nutritional Characterization of Enriched Food Pasta with Soybean Waste. Res. Soc. Dev. 2020, 9, e718974724. [Google Scholar] [CrossRef]
- Sato, R.; Cilli, L.P.D.L.; Oliveira, B.E.D.; Maciel, V.B.V.; Venturini, A.C.; Yoshida, C.M.P. Nutritional Improvement of Pasta with Pereskia aculeata Miller: A Non-Conventional Edible Vegetable. Food Sci. Technol. 2018, 39, 28–34. [Google Scholar] [CrossRef]
- Ferreira, A.L.; Gonçalves, V.G.O.; Maradini Filho, A.M.; Carneiro, J.C.S.; Francisco, C.L. Caracterização do Pó de Ora-Pro-Nóbis e Utilização em Massas Alimentícias. Ed. Cient. Dig. 2022, 9. [Google Scholar]
- Alcorta, A.; et al. Foods for Plant-Based Diets: Challenges and Innovations. Foods 2021, 10, 293. [Google Scholar] [CrossRef]
- Mir, S.A.; Naseem, Z.; Wani, S.M. Development of Composite Cereal Flour Noodles and Their Technological, Antioxidant and Sensory Characterization During Storage. Food Chem. Adv. 2024, 100650. [Google Scholar] [CrossRef]
- Vernaza, M.G.; Chang, Y.K. Resistant Starch and Soy Protein Isolate in Instant Noodles Obtained by Conventional and Vacuum Frying. Braz. J. Food Technol. 2020, 23, e2018239. [Google Scholar] [CrossRef]
Figure 1.
Thermogravimetric curve of Pereskia aculeata flour (A) and Pereskia grandifolia flour (B).
Figure 1.
Thermogravimetric curve of Pereskia aculeata flour (A) and Pereskia grandifolia flour (B).
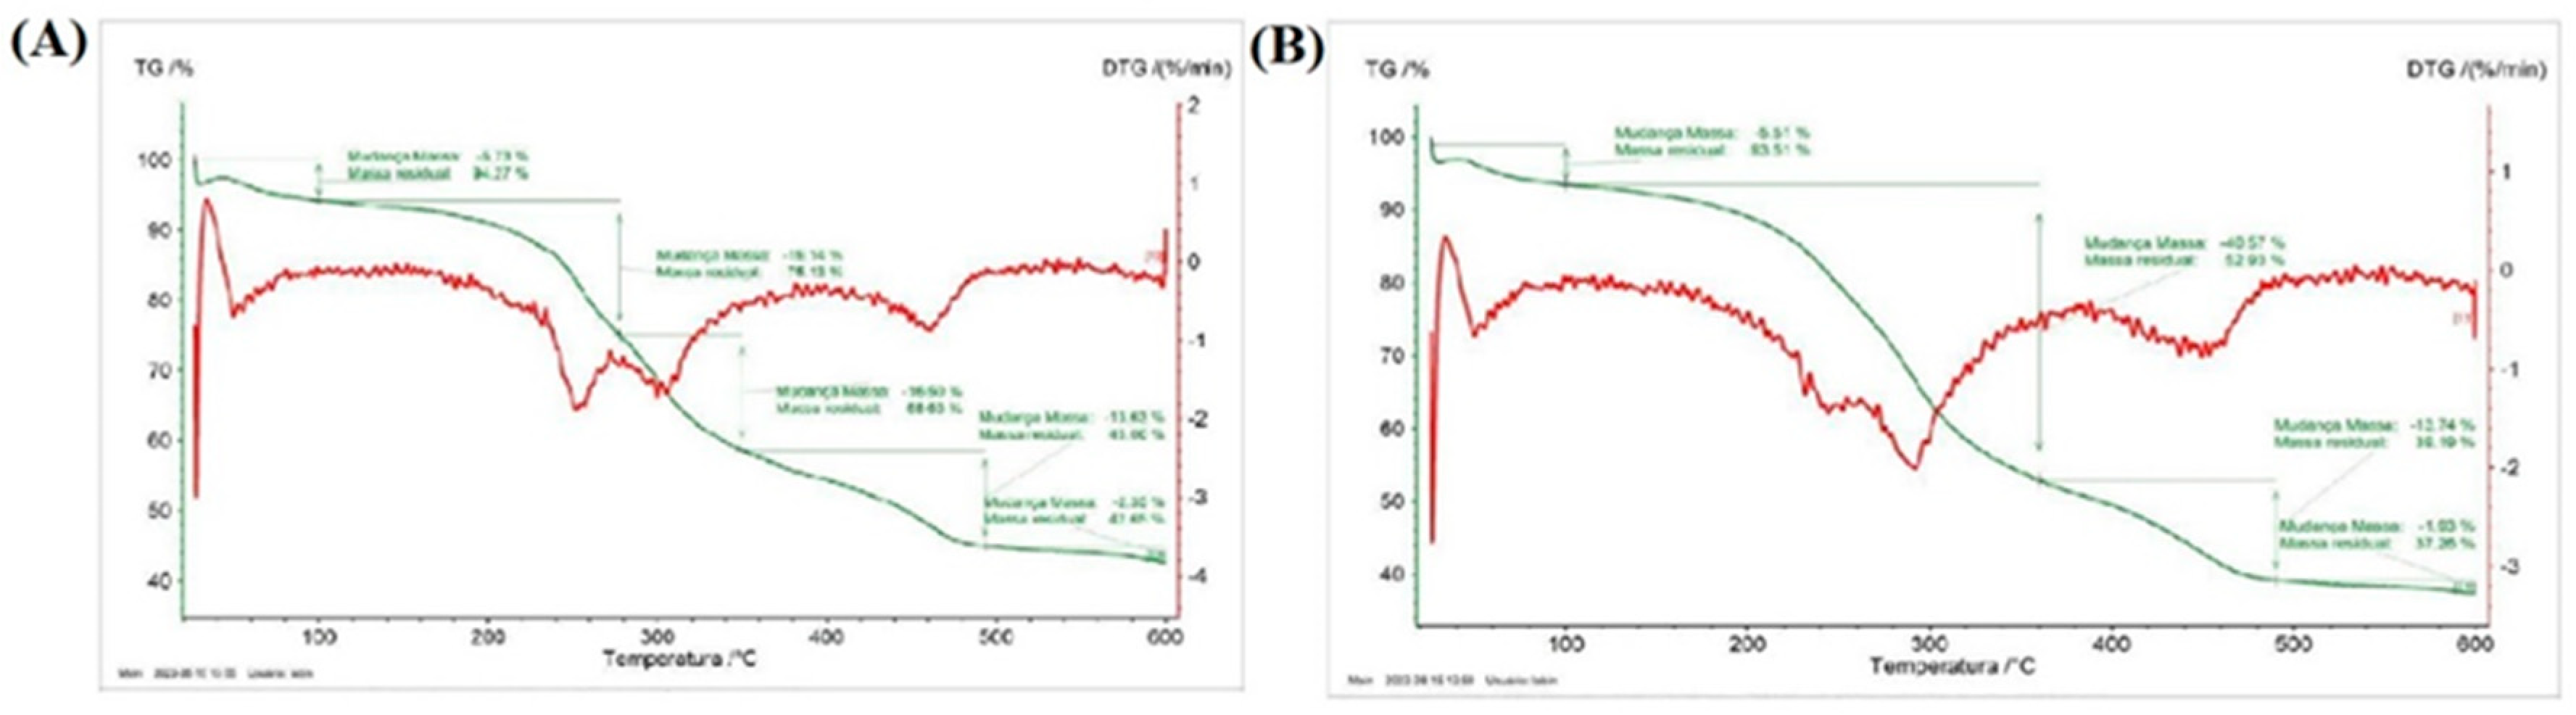
Figure 2.
Scanning Electron Microscopy (SEM) micrographs: (A) P. aculeata flour at 100x magnification; (B) P. aculeata flour at 500x magnification; (C) P. aculeata flour at 1000x magnification; (D) P. aculeata flour at 2000x magnification; (E) P. grandifolia flour at 100x magnification; (F) P. grandifolia flour at 500x magnification; (G) P. grandifolia flour at 1000x magnification; (H) P. grandifolia flour at 2000x magnification.
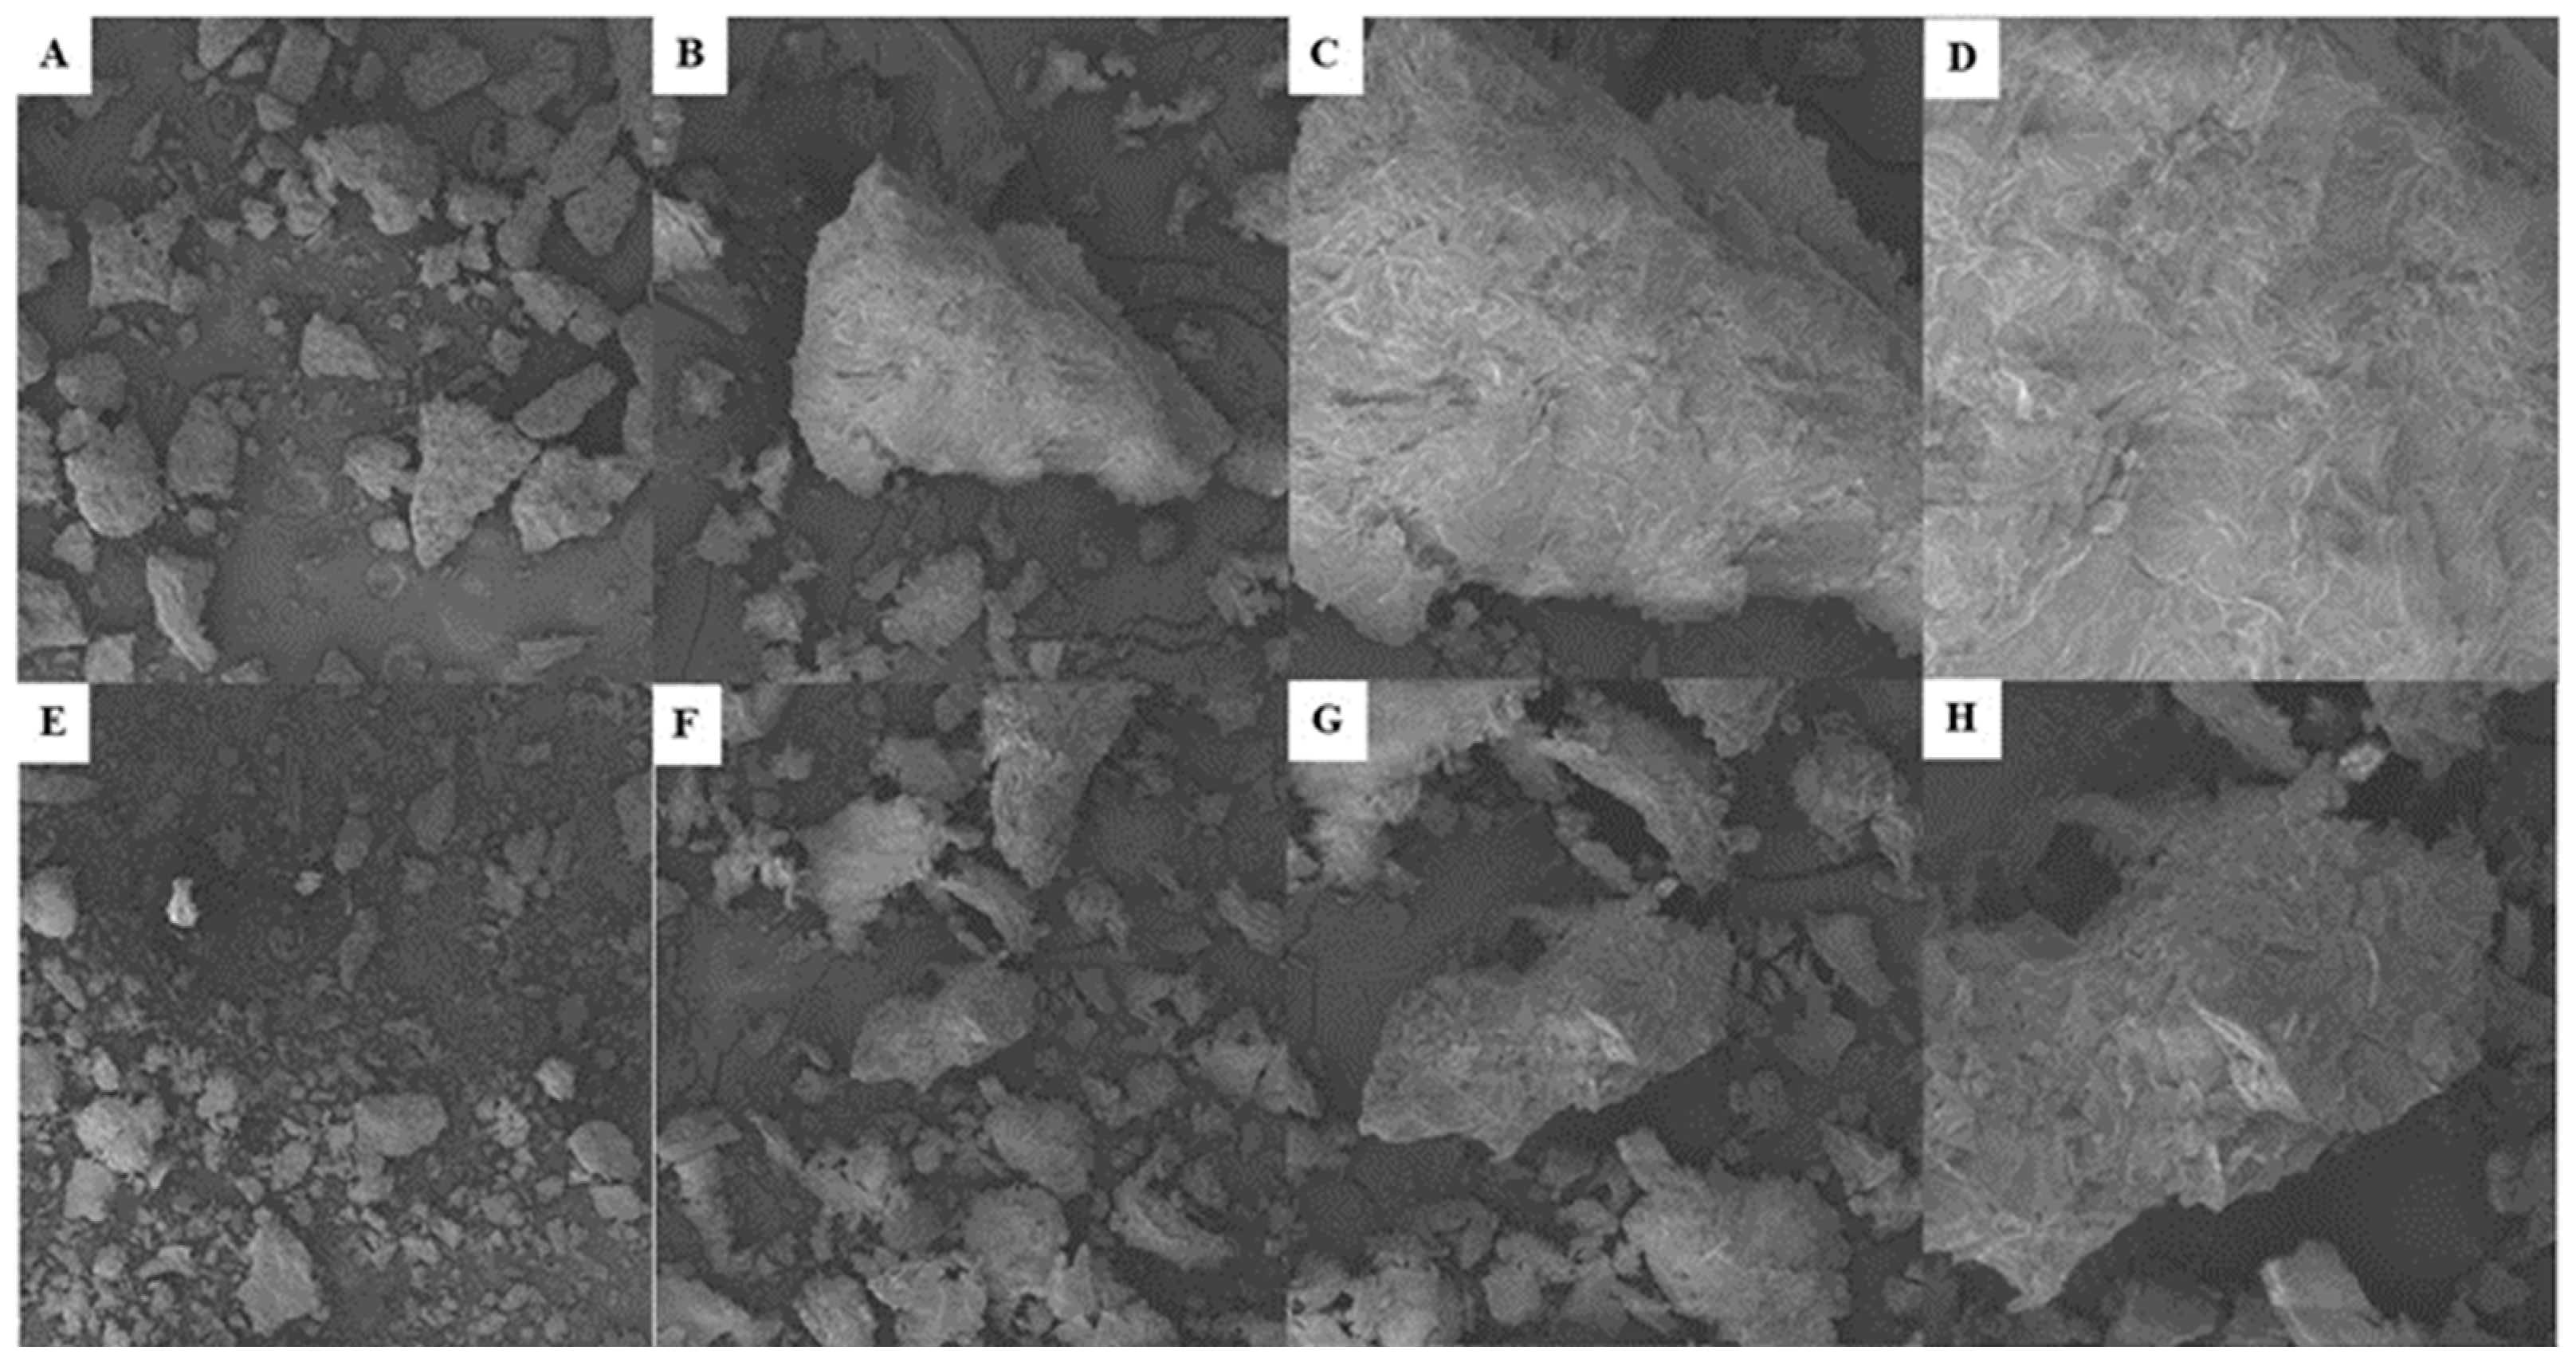
Figure 3.
Physicochemical analysis of pasta enriched with P. aculeata and P. grandifolia. Lowercase letters indicate significant differences between species within each concentration level – T-test. Uppercase letters indicate significant differences between concentration levels within each species – SNK test. * Indicates significant difference between the control and each species concentration level A – Dunnett’s test. ¥ Indicates significant difference between the control and each species concentration level B – Dunnett’s test.
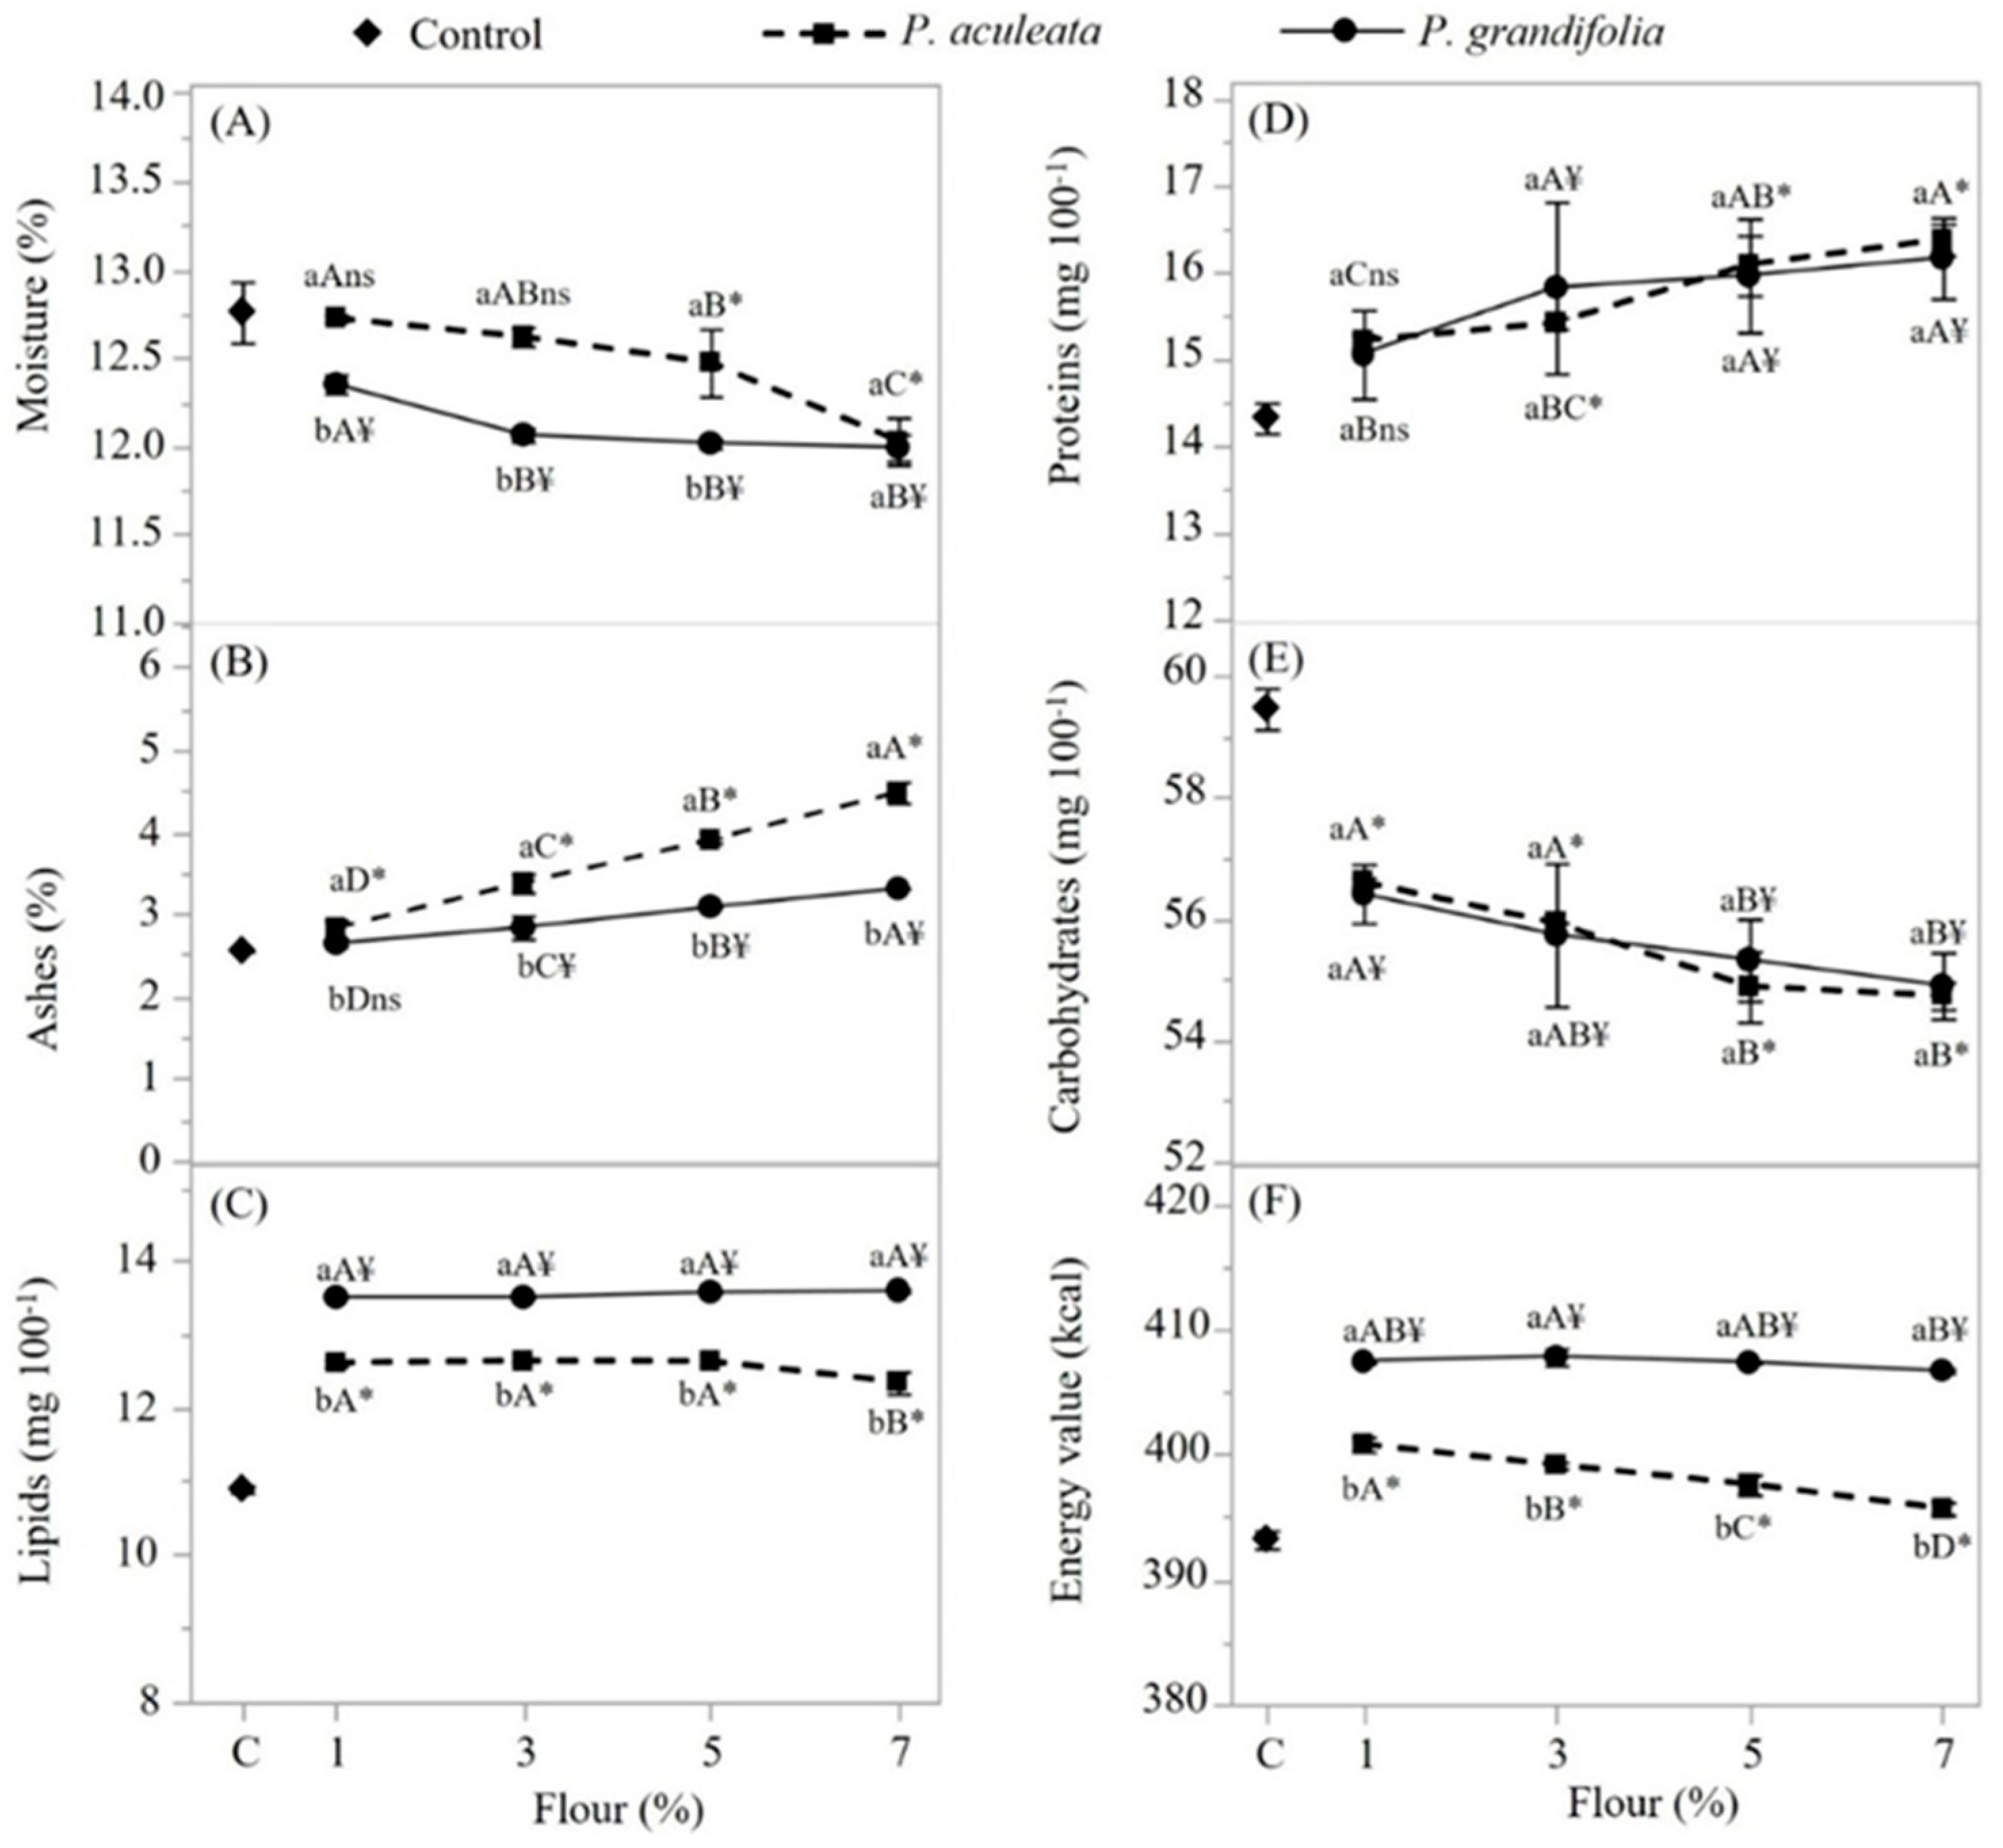
Figure 4.
Color values of spaghetti-type pasta. Lowercase letters indicate significant differences between species within each concentration level – T-test. Uppercase letters indicate significant differences between concentration levels within each species – SNK test. * Indicates significant difference between the control and each species concentration level A – Dunnett’s test. ¥ Indicates significant difference between the control and each species concentration level B – Dunnett’s test.
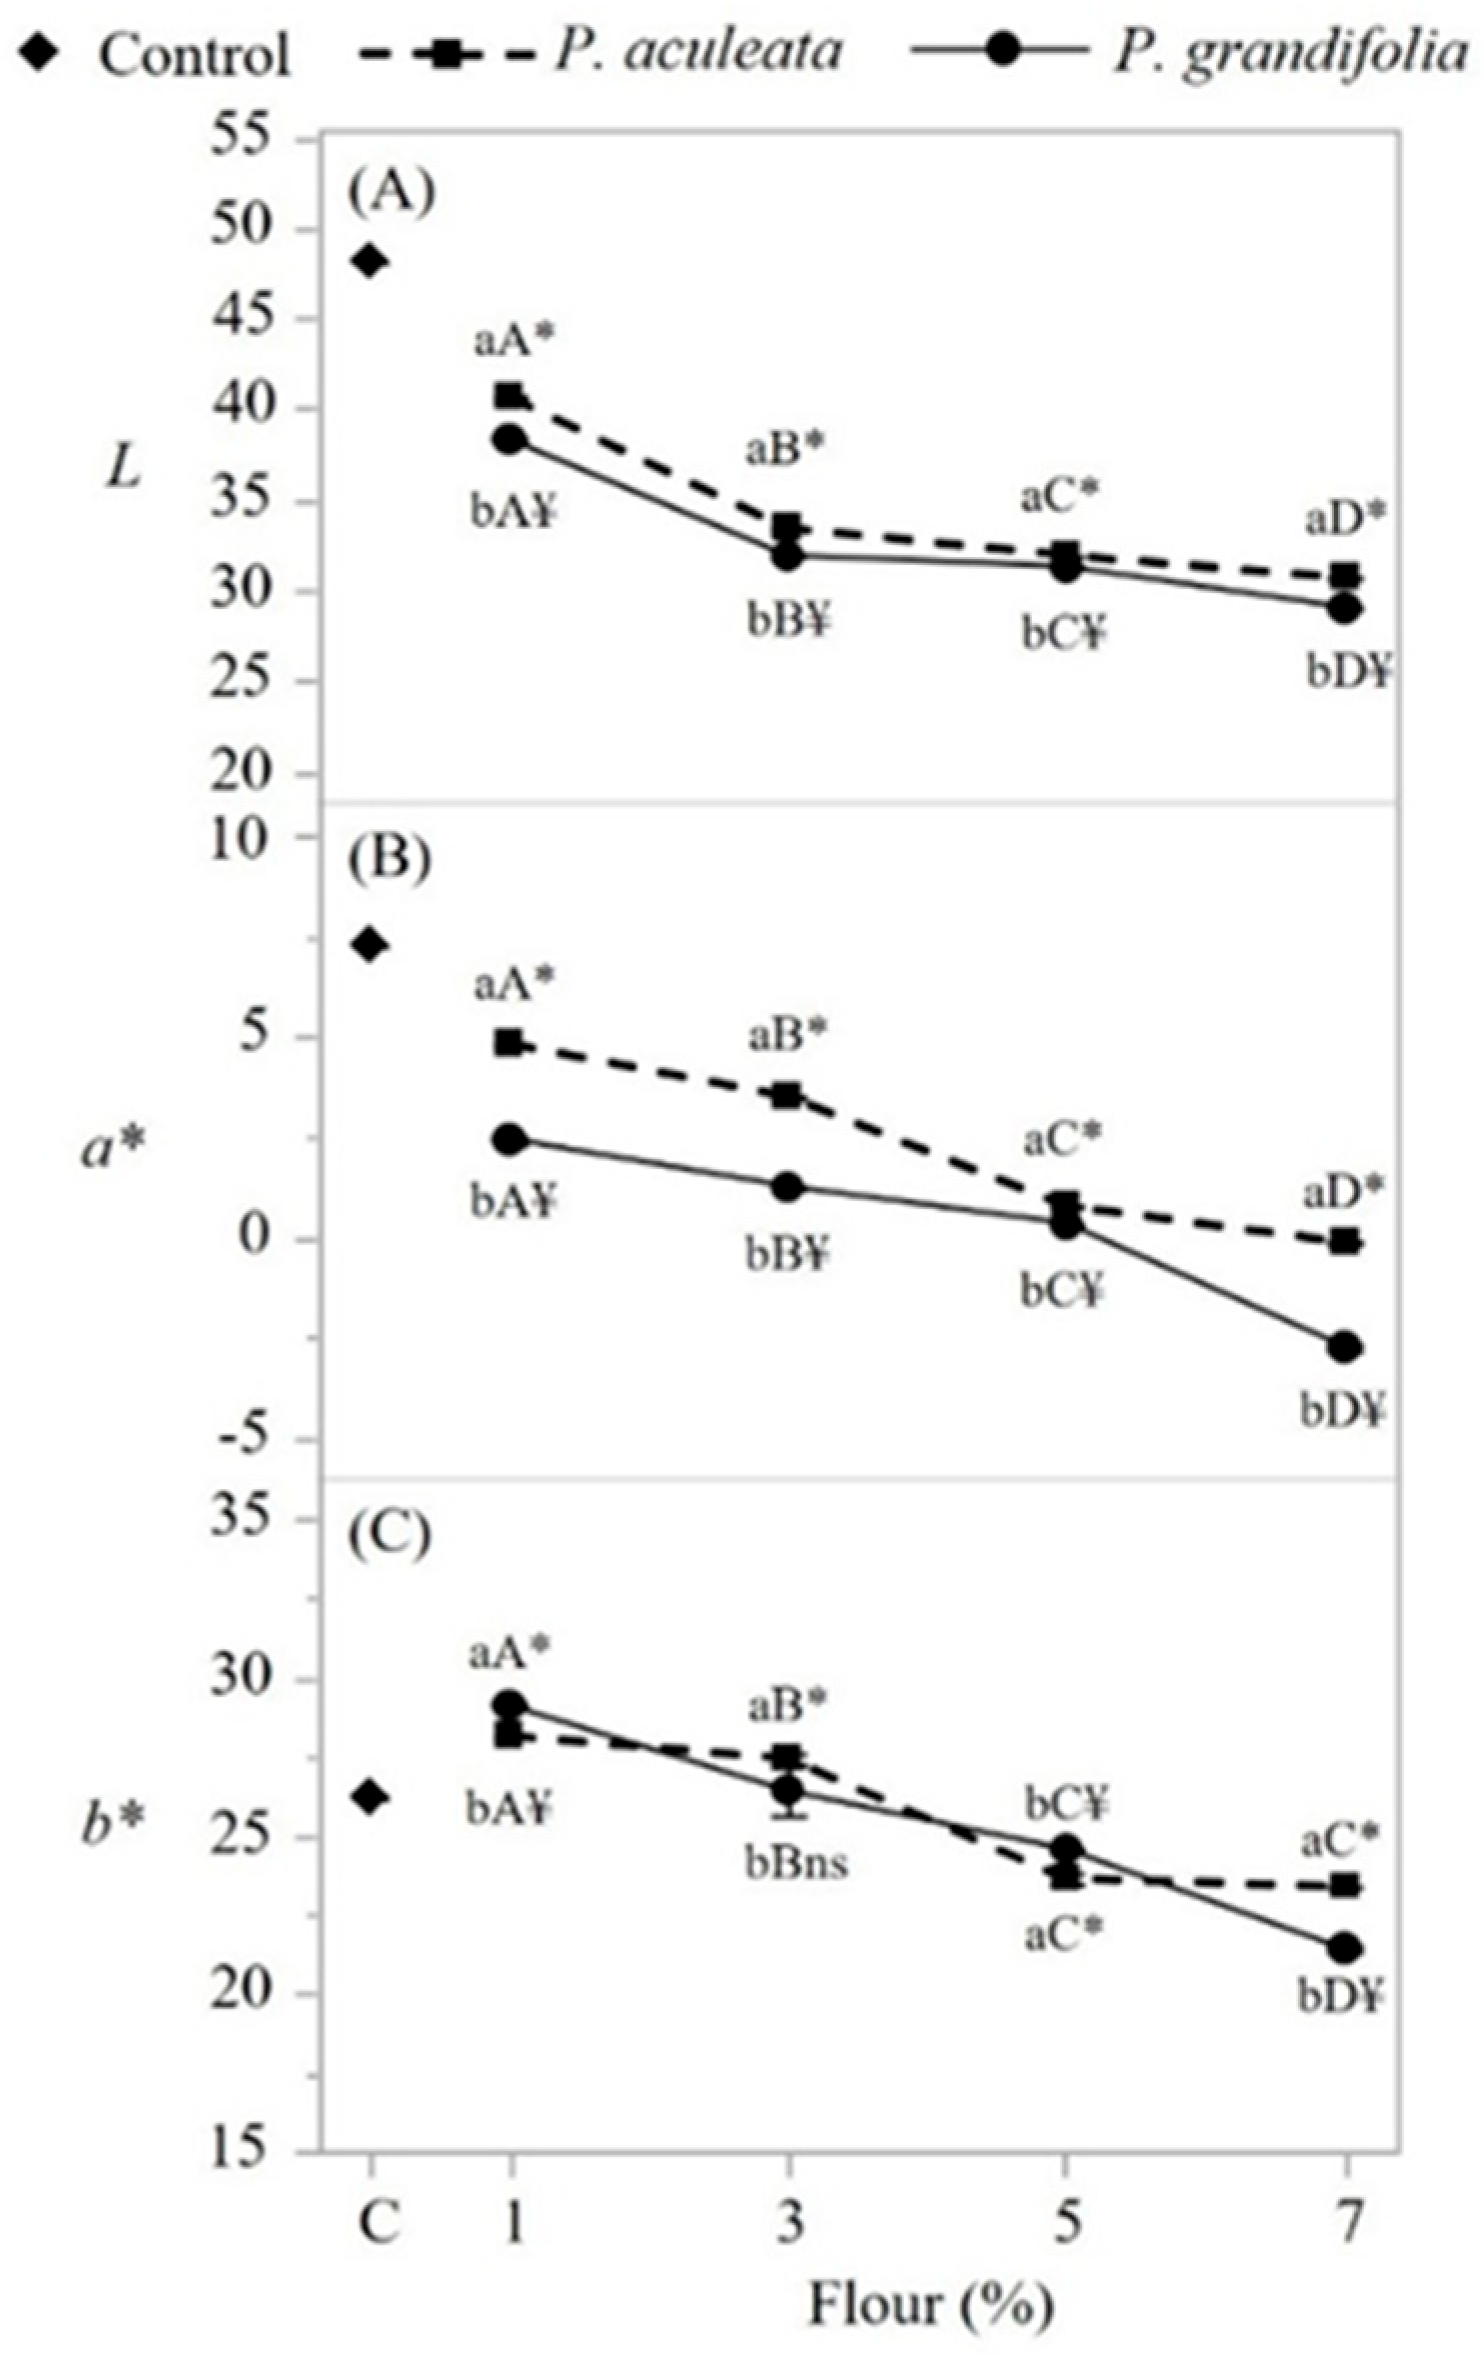
Figure 5.
Minerals present in spaghetti-type pasta. Ca, K, Mg, Na, Zn, Fe, and P are expressed in mg/kg. Lowercase letters indicate significant differences between species within each concentration level – T-test. Uppercase letters indicate significant differences between concentration levels within each species – SNK test. * Indicates significant difference between the control and each species concentration level A – Dunnett’s test. ¥ Indicates significant difference between the control and each species concentration level B – Dunnett’s test.
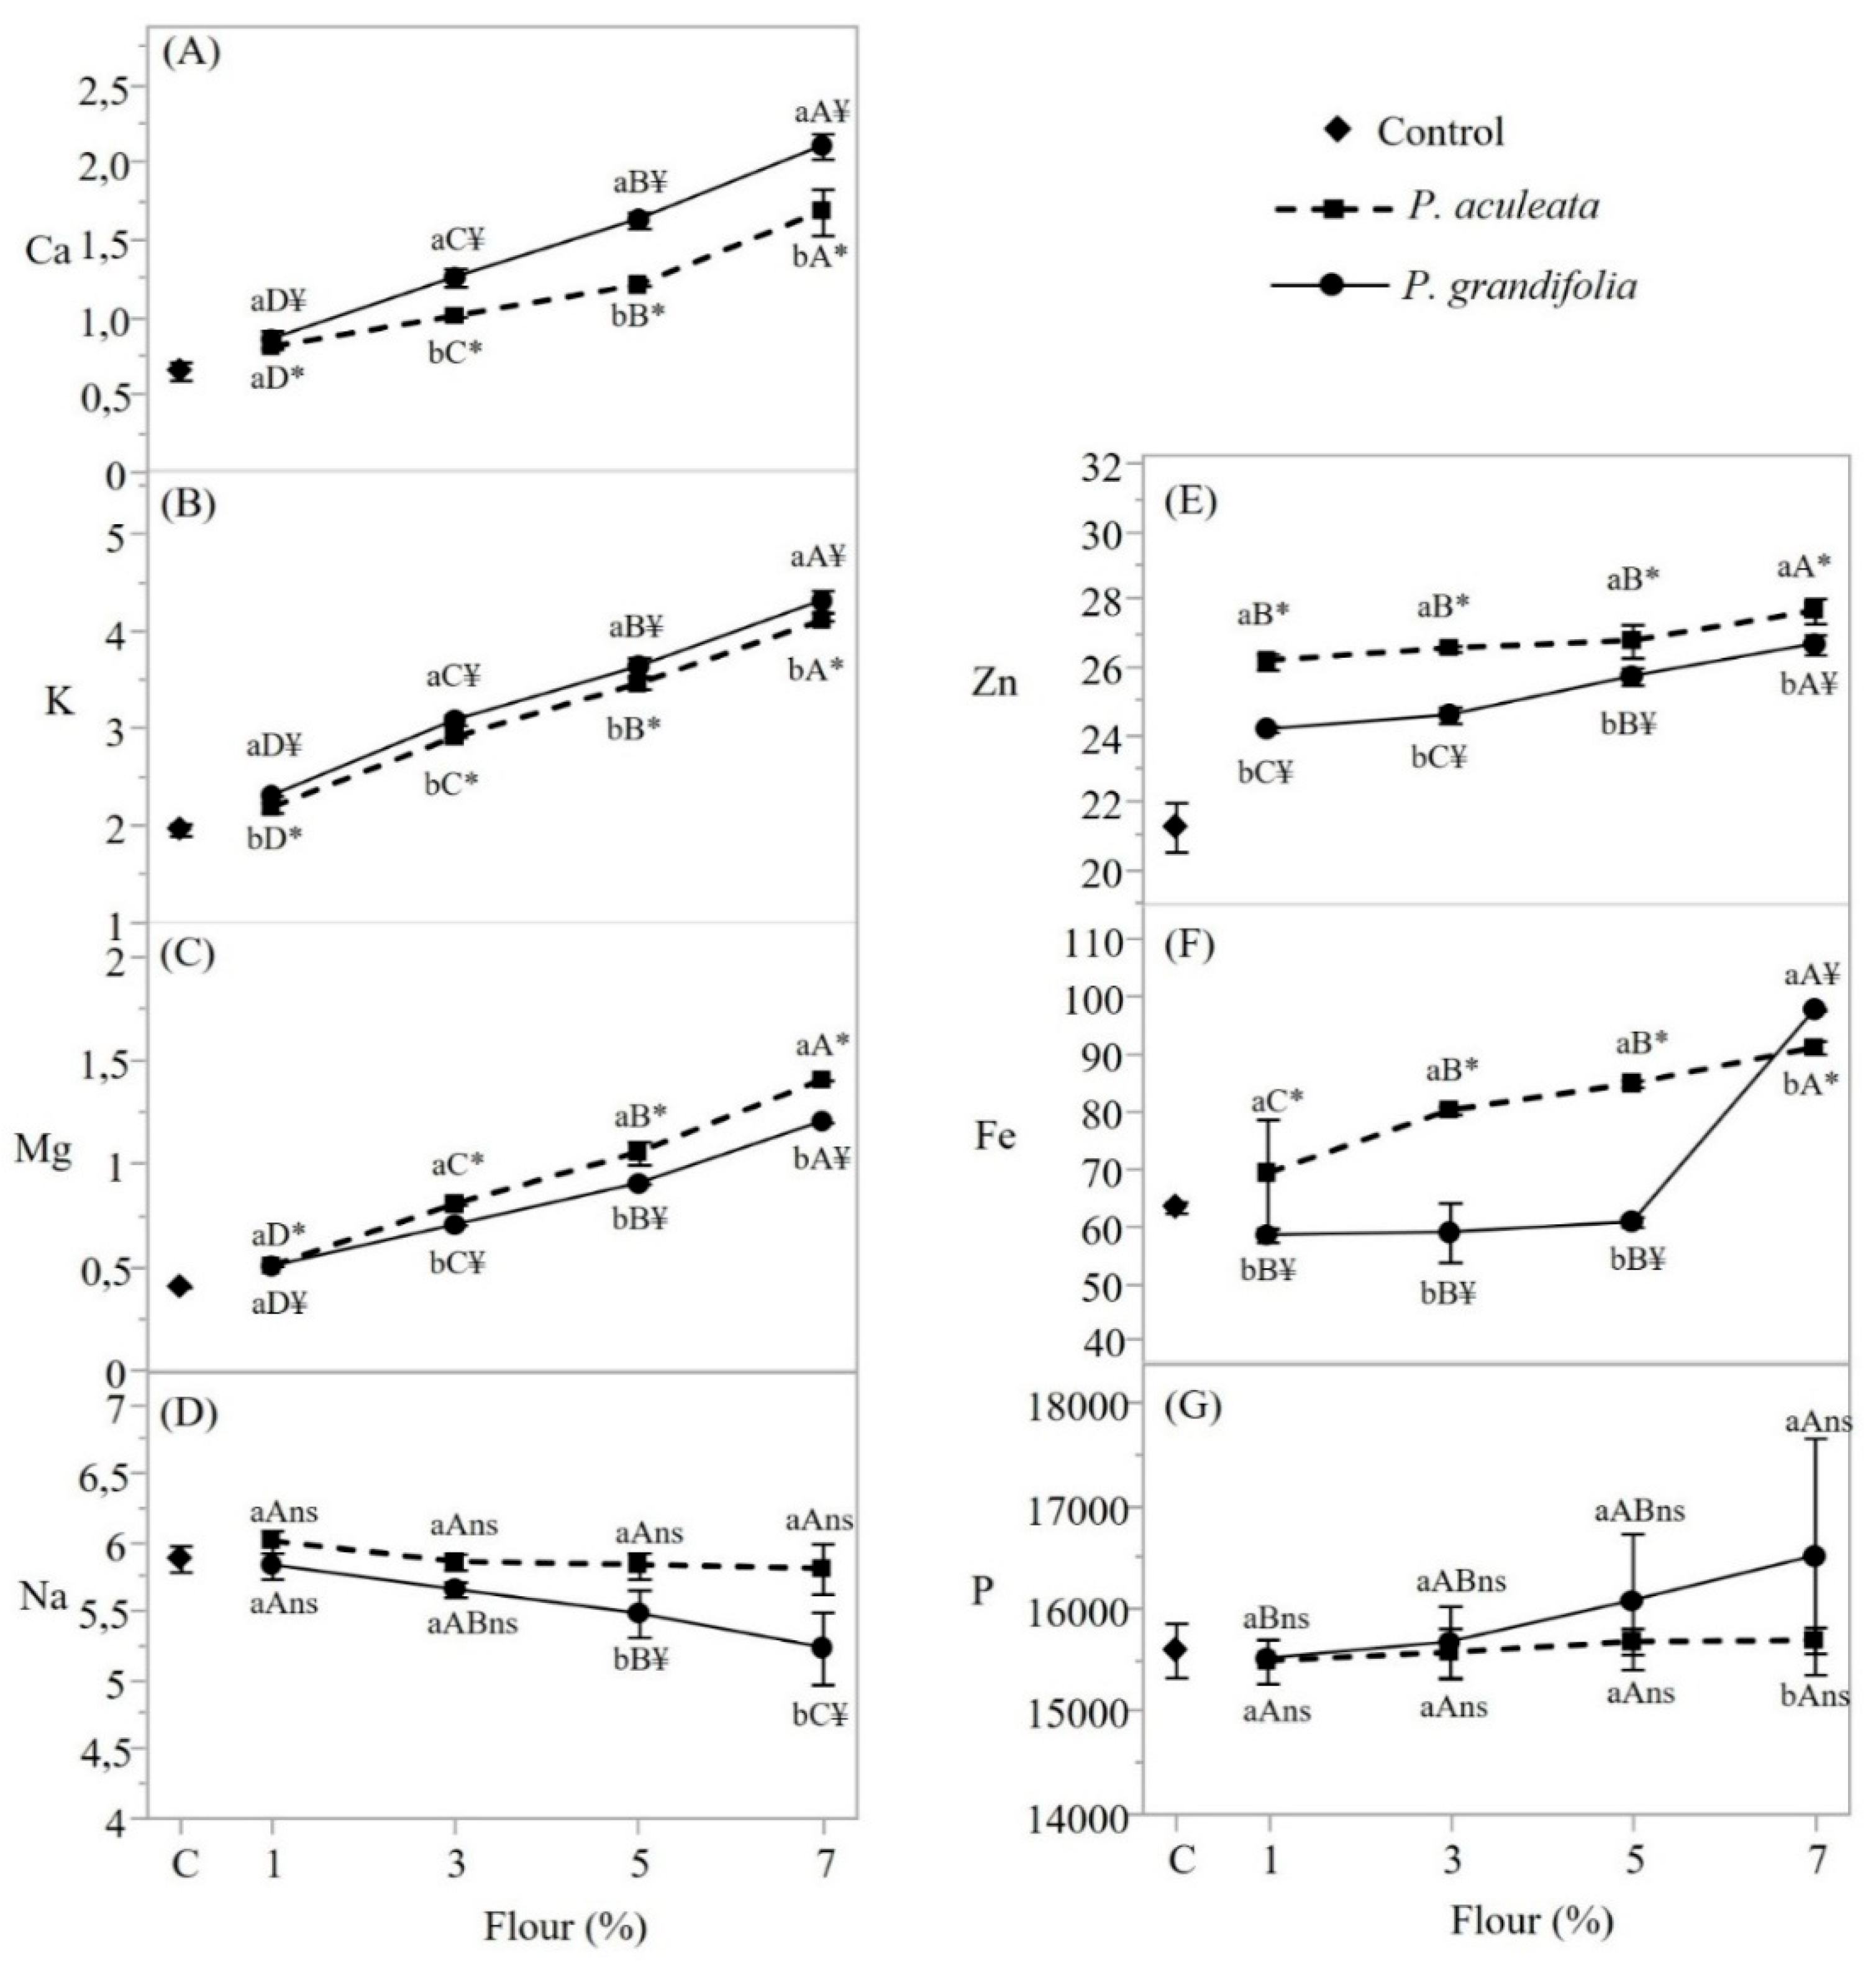
Figure 6.
- Micrographs of cross-sections of pasta enriched with P. aculeata and P. grandifolia: (A) PA 1% - 1000x; (B) PA 3% - 1000x; (C) PA 5% - 1000x; (D) PA 7% - 1000x; (E) PG 1% - 1000x; (F) PG 3% - 1000x; (G) PG 5% - 1000x; (H) PG 7% - 1000x.
Figure 6.
- Micrographs of cross-sections of pasta enriched with P. aculeata and P. grandifolia: (A) PA 1% - 1000x; (B) PA 3% - 1000x; (C) PA 5% - 1000x; (D) PA 7% - 1000x; (E) PG 1% - 1000x; (F) PG 3% - 1000x; (G) PG 5% - 1000x; (H) PG 7% - 1000x.
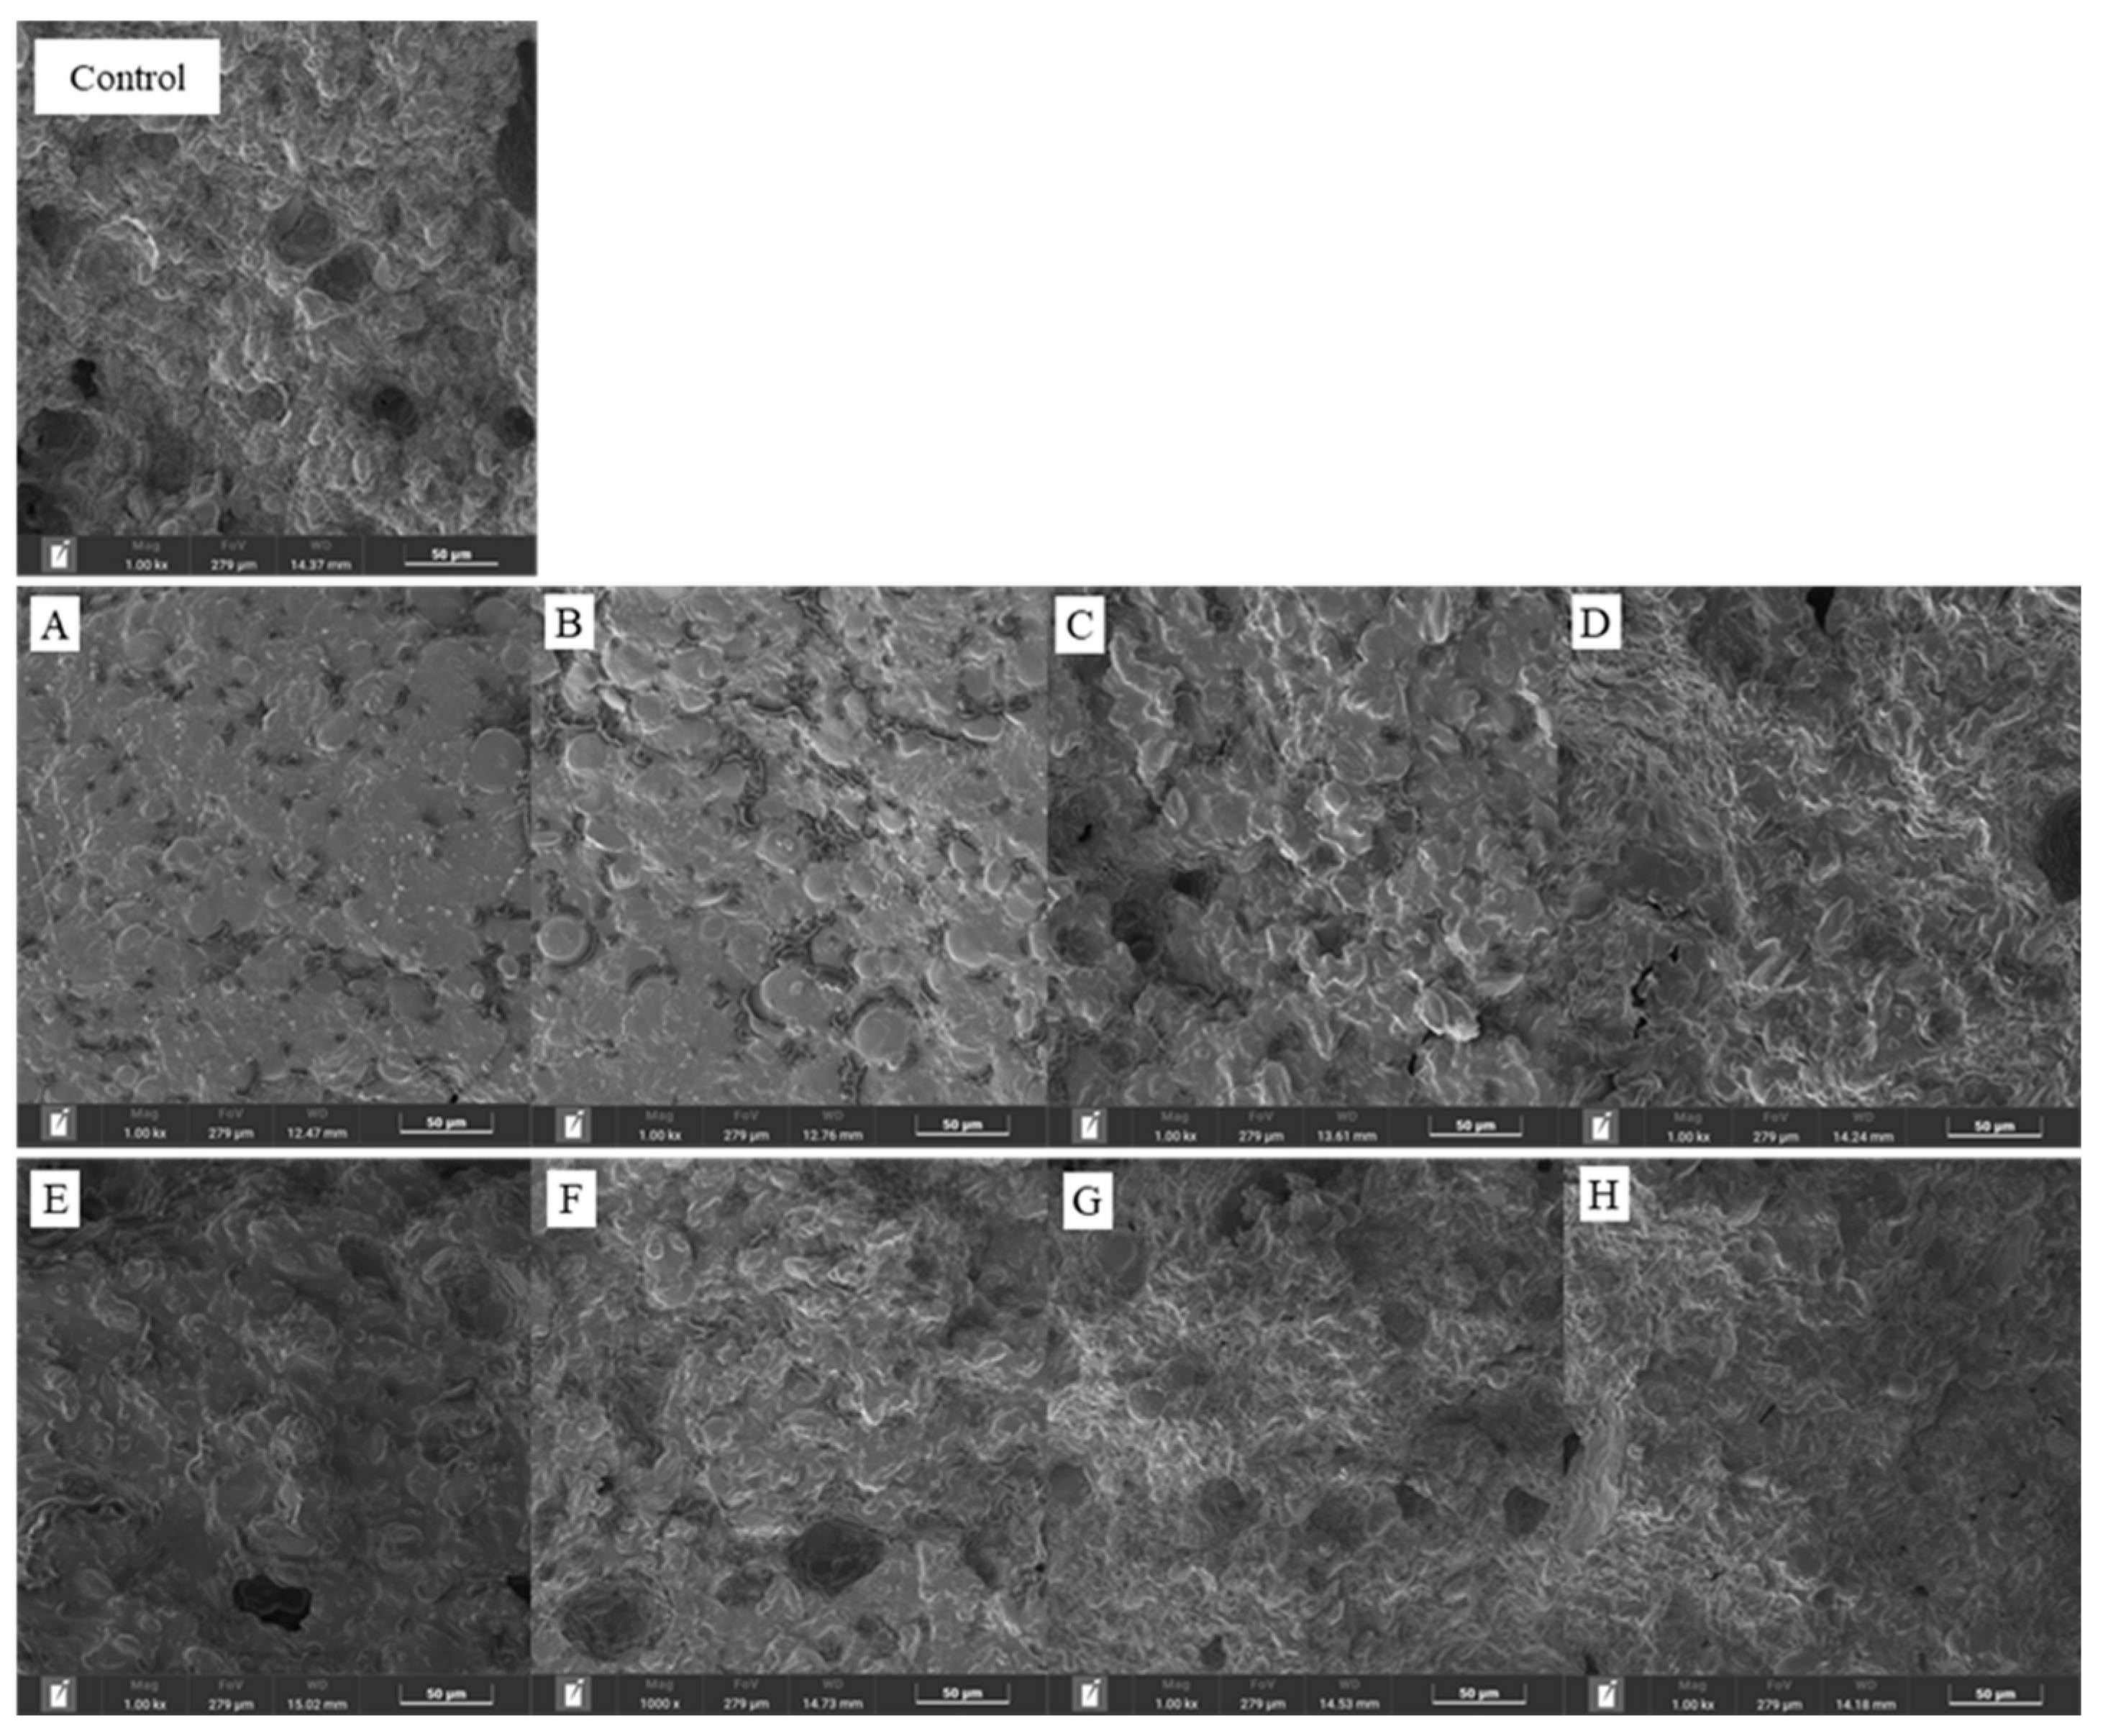

Table 1.
Formulations of pasta with conventional flour and with the addition of P. aculeata and P. grandifolia flour.
Table 1.
Formulations of pasta with conventional flour and with the addition of P. aculeata and P. grandifolia flour.
| Formulation | Wheat Flour (%) | Pereskia Flour (%) |
Salt (%) |
Olive Oil (%) |
Egg (%) |
|---|---|---|---|---|---|
| FC PA 1 PA 3 PA 5 PA 7 PG 1 PG 3 PG 5 PG 7 |
63 62 60 58 56 62 60 58 56a |
0 1 3 5 7 1 3 5 7 |
1 1 1 1 1 1 1 1 1 |
6 6 6 6 6 6 6 6 6 |
30 30 30 30 30 30 30 30 30 |
*FC = control formulation; PA = formulation with Pereskia aculeata flour; PG= formulation with Pereskia grandifolia flour.
Table 2.
Physicochemical profile of Pereskia flours
| Variáveis | Flours | |
|---|---|---|
| Pereskia aculeata | Pereskia grandifolia | |
| Water content (%) Aw Ash content (%) Proteins (%) Lipids (%) Carbohydrates (%) TEV(Kcal) L -a* b* |
5.7 ± 0.23 0.243 ± 0.005 14.2 ± 0.22 17.48 ±0.01 6.18 ± 0.31 56.44 ± 0.03 351.32 ± 0.1 14.54 ± 0.01 -0.23 ± 0.01 7.14 ± 0.01 |
4.8 ± 0.14 0.230 ± 0.005 15.9 ± 0.1 21.86 ± 0.13 8.78 ± 0.13 48.66 ± 0.1 361.08 ± 0.1 30.91 ± 0.01 -5.78 ± 0.01 29.92 ± 0.01 |
TEV: Total Energy Value; L: Luminosity; -a*: Green Intensity; b*: Yellow Intensity
Table 3.
Determination of total extractable polyphenols, antioxidant activity, and toxicity of P. aculeata and P. grandifolia flours.
Table 3.
Determination of total extractable polyphenols, antioxidant activity, and toxicity of P. aculeata and P. grandifolia flours.
| Variables | Flours | |
|---|---|---|
| Pereskia aculeata | Pereskia grandifolia | |
| TEP ABTS DPPH Cytotoxicity DL50 |
485.61 ± 0.32 38.97 ± 1.18 21.24 ± 1.21 2417.32 ± 0.01 |
1129.59 ± 0.43 19.41 ± 0.80 15.78 ± 1.26 971.49 ± 0.01 |
* TEP: Total Extractable Polyphenols (mg/100g); ABTS (μM of Trolox/g of sample); DPPH: EC50 (g of sample/g of DPPH); DL50: Lethal Dose (μg/mL). *Values are expressed as means ± standard deviation.
Table 4.
Evaluation of the physical parameters of P. aculeata and P. grandifolia leaf flours.
| Physical parameters | Pereskia aculeata | Pereskia grandifolia |
|---|---|---|
| Bulk density (g mL-1) | 2.54±0.03 | 2.52±0.01 |
| Compacted density (g mL-1) | 4.12±0.05 | 3.71±0.55 |
| Carr Index (%) | 38.00±0.63 | 32.17±0.55 |
| Hausner Factor | 0.62±0.01 | 0.68±0.01 |
| Solubility (%) | 94.62±0.51 | 91.76±0.73 |
Table 5.
Mineral composition of Pereskia flours
| Parameters | Pereskia aculeata | Pereskia grandifolia |
|---|---|---|
| Calcium (mg/g) | 23.91±0.20 | 23.6±1.35 |
| Magnesium (mg/g) | 14.32±0.21 | 22.60±1.08 |
| Potassium (mg/g) | 43.91±0.58 | 33.81±0.23 |
| Sodium (mg/g) | Nd | 7.15±0.46 |
| Copper (mg/g) | 0.02±0.0005 | 0.01±0.0003 |
| Zinc (mg/g) | 0.01±0.001 | 0.03±0.0003 |
| Iron (mg/g) | 0.13±0.02 | 0.19±0.04 |
| Manganese (mg/g) | 0.16±0.008 | 0.14±0.02 |
Nd: not detected.
Table 6.
Data obtained from TGA and DTG curves for ora-pro-nóbis flour samples.
| Sample | Stages | T (°C) | Mass Loss (%) | Residue at 600°C (%) |
|---|---|---|---|---|
| P. aculeata flour | 1st | 25 – 100 | 5.73 | 42.65 |
| 2nd | 100 – 280 | 19.14 | ||
| 3rd | 280 – 349 | 16.50 | ||
| 4th | 350 – 498 | 13.63 | ||
| 5th | 498 - 600 | 2.35 | ||
| P. grandifolia flour | 1st | 25 – 100 | 5.51 | 37.26 |
| 2nd | 100 – 360 | 40.57 | ||
| 3rd | 360 – 490 | 13.74 | ||
| 4th | 490 – 600 | 1.93 |
Disclaimer/Publisher’s Note: The statements, opinions and data contained in all publications are solely those of the individual author(s) and contributor(s) and not of MDPI and/or the editor(s). MDPI and/or the editor(s) disclaim responsibility for any injury to people or property resulting from any ideas, methods, instructions or products referred to in the content. |
© 2024 by the authors. Licensee MDPI, Basel, Switzerland. This article is an open access article distributed under the terms and conditions of the Creative Commons Attribution (CC BY) license (http://creativecommons.org/licenses/by/4.0/).
Copyright: This open access article is published under a Creative Commons CC BY 4.0 license, which permit the free download, distribution, and reuse, provided that the author and preprint are cited in any reuse.


