
Submitted:
02 June 2025
Posted:
03 June 2025
You are already at the latest version
Abstract
In the context of accelerating digitalization, this article investigates how electronic commerce performance is influenced by Web 2.0 instruments in the 27 EU member states. Analyzing the existing literature review and performing a bibliometric review, there was identified a gap related with measurable economic results of e-commerce. The scope of this paper is to analyze the relationship between Web 2.0 tools and the level of turnover generated by e-commerce, applying robust econometric models based on panel data regression with Random effects and with fixed effects (Arellano-Bond). The results highlight that online paid advertisement and social media usage variables have significative, positive effect on e-commerce performance, confirming the first and second hypothesis. Use of enterprise's blog or microblogs and use of multimedia content sharing websites do not influence enterprises' total turnover from e-commerce sales to a valid and statistically significant extent. Thus, the third and fourth hypotheses are not confirmed by the results of the research conducted, possibly due to limited innovation and platform ownership in Europe region. The study makes a notable empirical and methodological contribution, embedding the digital sustenability in the analysis, which implies that the findings can be used for updating e-commerce policies.
Keywords:
Web 2.0 tools
; e-commerce performance
; sustainability
; digital transformation
; panel data analysis regression
1. Introduction
Digital transformation influences significatively the enterprises and the way that they are doing their activities, especially regarding the electronic commerce [1], known as e-commerce . One of the essential factors for this evolution is the extensive usage of Web 2.0 instruments [2], which facilitates collaboration, co-creation and interactions with the consumers [3]. The economic environment, organizations and consumers behavior [4] were highly impacted by the power of digital transformation. The digitalization of the economy at the level of the European Union states is a priority, showed through diverse initiatives and programs [5], integrating web 2.0 instruments in the digital transformation and sustainable development policies. Therefore the analysis of how e-commerce development is influenced by the Web 2.0 tools is mandatory in the context of rapid digitalization due to the pandemic and economic sustainability.
Social media and online advertisement [6] role in influencing the customer behavior is extensively studied in the literature, but the concrete economic outcome of utilizing these instruments are insufficiently studied for European countries. Scientific literature from the field is concentrated on themes related with social effects and comportments, but the economic performance subject is not explored in a quantitative and comparative way. Taking into consideration that the results of these technologies are not enough studied from the economic point of view, we plan to study how Web 2.0 tool adoption influences the e-commerce performance in the EU states.
The bibliometric review is confirming the gap related with quantitative analysis, because the majority of the works are qualitative, interview or study case based, focused on a single company, industry or country. Also the focus until now was on consumer behavior and on technology advancements, without providing enough attention to the measurable economic effects generated by the relationship web 2.0 instruments and e-commerce. This study has the objective to contribute to the literature, through applying econometric models on panel data gathered from the 27 EU states, a period 2015-2023.
The structure of the article contains the following: critical review of the scientific literature with a focus on web 2.0, e-commerce, sustainability, bibliometric review, identification of the gaps from literature and development of the hypotheses; research methodology based on quantitative approach of panel data regression based on Eurostat database; research results with focus on Coefficients for Fixed Effects and Random Effects variables, Random Effects Estimation Summary, Random Effects – Parameter Estimates, Fixed Effects – Parameter Estimates, Robust standard errors, clustered by both country and year, Robust standard errors – Parameter Estimates, Dynamic panel model (Arellano-Bond style) – Parameter Estimates; discussions with the focus on novelty findings and conclusions. The scope of this paper is to analyze the relationship between Web 2.0 tools and the level of turnover generated by e-commerce, applying robust econometric models based on panel data regression with Random effects and with fixed effects (Arellano-Bond).
2. Materials and Methods
2.1. Analyzing the Scientific Literature Related with Web 2.0 and e-Commerce
Web 2.0. is the second generation of internet based services, with focus on collaboration, social media and content generated by users [7]. It has various instruments such as social media platforms, blogs, vlogs, recensions, between others [8]. Its tools play an important role in building the link between clients and companies, having a big influence on the consumer behavior. E-commerce development is usually measured by indicators such as: number of companies involved in e-commerce activities, percentage of digital transactions, online sales turnover [9]. Web 2.0 technology allows collaboration, two-way interaction and final users content creation which has a big impact on digital transformation of global economy in general. Through this, also marketing strategies and organizational architecture is part of the remodeling process [10]. Web 2.0 tools are more than promoting channels, they have the potential to innovate and collect feedback and collaborative content, in order to answer to the constantly changing needs of the client. SMEs became more and more open to use web 2.0 tools, but the level of adoption differs depending on organizations culture, available resources and sector of activity [11]. Communication with clients, visibility growth of the brand and number of online purchases was improved through adoption of web 2.0 tools, which has the power to influence the shopping comportment [12].
Usage of web 2.0 has a strong contribution for sustainability [13] because it reduces the access barriers to markets, it reduces the costs through digital marketing, it promotes the responsible consumption [14]. Web 2.0 is associated with circular economy [15], responsible consumption, collaborative business [16], going beyond communication and facilitating the sustainability at all levels [17]. The sustainability of the firms is optimized alt economic, ecological, social and governmental level through the use of web 2.0 instruments, evolving into transparency. These firms are more adaptable to changes and crisis because they are able to optimally coordinate their resources [18] and to efficiently communicate with their stakeholders, building their sustainable resilience[19]. Through this tools the ecological footprint is reduced indirectly, because the costs associated with traditional marketing are decreased [20].
EU is trying to harmonize the digital capabilities [21] in order to support e-commerce participation in the member states. In EU there is a significant difference between the member states considering the level of e-commerce adoption [22] and digital infrastructure. The relationship between Web 2.0 tools and e-commerce performance subject, was studied in the scientific literature from the filed by various scientist. Tajvidi & Karami, (2021) evaluate the social media impact on EU companies performance through structural equation modelling [23]. The literature shows that there exist a positive linkage between the performance of e-commerce and Web 2.0 instruments [24]; Ahmad et al., 2019 studied in their articles that the companies from Europe and Asia with online presence in social media will have a superior performance in terms of number of sales, than the companies which use only traditional methods [25]. The results depend on the national context, level of digital development in general and accessibility, governance and types of concurrence, therefore the economic impacts is not always seen on short term. Consequently, recent studies advocate for the use of robust quantitative models [26] —such as panel data regressions and dynamic models—that can isolate the specific effects on financial performance [27]. In scientific literature Web 2.0. was analyzed over the years through different theoretical frameworks, such as: Technology Acceptance Model (TAM) [28], Diffusion of Innovation Theory [29] and Resource-Based View (RBV) [30]. The first two frameworks explain that adoption of new technologies can be influenced by the perception of the users related with ease of use [31].
In order to better understand the relationship between web 2.0 and e-commerce, we did a bibliometric review. The search was done in Web of Science Database with the keywords Web 2.0 AND e-commerce, for the period 2015-2025 and type of documents articles and review articles, resulting into a number of 209 of documents. The analysis tools used in this case were VosViewer and Biblioshiny. The first two research areas in this field are business economics and computer science, the most prolific countries in the world are China, Australia, England [32]. The keyword map contains three clusters, 33 items, 371 links and 887 total link strength [33]. Commerce keyword is central, having the highest number of connections. The first cluster with the keywords commerce, consumer, platform, internet, social commerce suggest consumer behavior under technology adoption. The second cluster with the keywords information, analysis, adoption, opportunity, role, website focuses on the technological part of the e-commerce. And the third cluster with the keywords product, service, time can represent the general methodological part of research. The map highlights high level of interdisciplinarity, with social, technological and methodological themes. Starting with 2015 until 2021 there was an ascendent trend of publication, with the peak in 2021, after the highest registered score the number of publications declined, with a minimum registered in 2024, but in 2025 there is a slight rebound. The citation follow the trend of the publications between 2014 and 2021, with the citation peak in 2021, after 2021 there is a slight decrease. The 2021 year was a prolific year for both publications and citations, having a major academic impact, this can be explained by the interest in the field due to pandemic. After 2021 the interest on this subject drops, imping a possible saturation or change of interest of the academic community.
The most influent articles, with the most registered number of citations are treating the following subjects:

Table 1.
Most influent articles.
| Article | Subject of the article | Number of citations |
| Social commerce constructs and consumer's intention to buy | e-commerce and consumers intention to buy online through SEM quantitative methodology [34] | 491 |
| entry 2 Understanding social commerce: A systematic literature review and directions for further research | systematic literature review of social commerce [35] | 247 |
| Social commerce research: Definition, research themes, and the trends | user-centric research in the field of e-commerce [36] | 185 |
| The effects of Facebook browsing and usage intensity on impulse purchase in f-commerce | Data impulse purchases in the field of e-commerce [37] | 139 |
Source: authors using Biblioshiny from Biliometrix R package
After analyzing the literature, there were found gaps related with lack usage of multiple web 2.0 instruments in explaining e-commerce and few articles using comparative studies between countries based on data panels from EU. There is a lack of dynamic models and quantitative studies, the majority of articles are focusing on individual cases, qualitative aspects. e-commerce and web 2.0 relationship is a studied topic in the scientific literature, but there are various limitations which can be studied further. In the first hand, a significative part of the papers are concentrated on qualitative analysis [38], exploring the perceptions of the users and digital marketing strategies [39]. In the second hand, the quantitative analysis on the subject are focused on a single state or specific industry [40], without international comparison background [41]. Also, digital advantages can be seen on the long term and the relationship between web 2.0 and e-commerce cannot be fully explained by static models.
E-commerce is evolving to a key factor of sustainable competitiveness in Eu. Taking into consideration the limitation existent in the literature, there is a need for advanced econometrical models, such as based on panel data, dynamic models, for examples Arellano-Bond models which can explain the temporal effects of usage of web 2.0 tools on commercial performance.
2.2. Hypotheses Development
In the digital age, consumer behavior is complex, with companies making countless efforts to attract and retain consumers in virtual spaces and to maintain their interest in purchasing goods and services [42]. The clients in online channels are sometimes generated through paid advertising in online platforms [43]. Previous studies have highlighted the positive relationship between Internet advertising features like search advertisement and classified advertisement and E-commerce sales in the case of five European countries [44] Therefore, we propose the following hypothesis:
H.1 Pay to advertise on the internet positively influences the enterprises’ total turnover from e-commerce sales.
In the Web 2.0 context, most companies, including SMEs, use social networks (e.g. Facebook, LinkedIn, etc.) to open new opportunities in customer relationships and to redefine business processes and maximize their e-commerce value. Social networks like Facebook, Instagram, Twitter and LinkedIn provide companies with the ability to directly engage with consumers, building brand awareness and fostering customer loyalty [10]. Research has shown that these platforms allow companies to reach a broader audience and engage in real-time conversations, which is critical in driving e-commerce turnover: Social media serves as both as communication tool and a marketing channel, influencing consumer decisions at multiple stages [8]. Integrating social media marketing efforts can increase both customer engagement and overall e-commerce sales, as clients are increasingly expecting seamless experiences across all platforms [45]. For these reasons, we propose the following hypothesis:
H.2. Use social networks (e.g. Facebook, LinkedIn, etc.) positively influences the enterprises’ total turnover from e-commerce sales.
The frequency and the type of post on microblogs significantly impacted consumer engagement, which turn in increased sales [46,47]. Freberg et al. (2011) highlighted that influencer endorsements on platforms like Twitter or LinkedIn often result in increased consumer trust, which directly correlates with increased sales [48]. Microblogging allows for the rapid sharing of content that can reach millions of users, often resulting in viral promotions that drive traffic to e-commerce platforms. Influencer -generated content and brand mentions can lead to higher engagement and increased e-commerce turnover, as influencers tend to attract highly engaged followers who trust their recommendations [49]. Therefore, we propose the following hypothesis:
H.3. Use enterprise's blog or microblogs (e.g. Twitter, Present.ly, etc.) positively influences the enterprises’ total turnover from e-commerce sales.
Multimedia content sharing websites, such as YouTube, Flickr, Vimeo and others, have become central to digital marketing strategies due to their ability to drive engagement, build brand awareness, and directly influence e-commerce turnover. Incorporating influencers into multimedia campaigns on platforms like Youtube can amplify brand exposure, especially when influencers create content that aligns with the brand’s identity and messaging. This has been shown to enhance brand recall and purchase intent, which leads to increased e-commerce revenue [50].
H.4. Use multimedia content sharing websites (e.g. YouTube, Flickr, etc.) positively influences the enterprises’ total turnover from e-commerce sales.
3. Research Methodology
A quantitative approach based on panel data regression was followed for the research. The data sources used were Eurostat databases on: enterprises' total turnover from e-commerce sales (data set: value of e-commerce sales by size class of enterprise; unit of measure: percentage of turnover) as an expression of e-commerce development, pay to advertise on the internet, use of social networks (e.g. Facebook, LinkedIn, Xing, Viadeo, Yammer, etc.), use enterprise's blog or microblogs (e.g. Twitter, Present.ly, etc.), use multimedia content sharing websites (e.g. YouTube, Flickr, Picasa, SlideShare, etc.; data set: social media use by type, internet advertising and size class of enterprise, unit of measure: percentage of enterprises).
Data from the period 2015-2023 were selected for the dependent variable and the four independent variables for the 27 countries of the European Union. The period was chosen taking into account the years in which all data were available for all five variables of the model. Also, the 27 countries represent the majority of the most advanced and representative in Europe both in terms of the development of Web 2.0 and its tools as well as digital infrastructure and e-commerce. The time interval chosen for the panel data regression is particularly relevant for the purpose of the research conducted because it represents the maturity period of Web 2.0 tools and their potential effects on e-commerce development.
In order to choose the most appropriate regression model between Fixed Effects model estimated with entity and time effects and Random Effects model the Hausman test was applied [51]. The results obtained from the Hausman test showed that the Random Effects model is preferred, more efficient and statistically justified. However, we also preferred to apply the Fixed Effects model given that countries likely have unobserved characteristics affecting e-commerce. In both the Random Effects model and the Fixed Effects model, enterprises' total turnover from e-commerce sales was considered as the dependent variable and pay to advertise on the internet, use of social networks (e.g. Facebook, LinkedIn, Xing, Viadeo, Yammer, etc.), use enterprise's blog or microblogs (e.g. Twitter, Present.ly, etc.), use multimedia content sharing websites (e.g. YouTube, Flickr, Picasa, SlideShare, etc.) were considered as independent variables.
Although the same variables (pay to advertise on the internet, use of social networks) were obtained in the Fixed Effects model as in the Random Effects model as those that positively influence enterprises' total turnover from e-commerce sales, several statistical tests were applied for the fixed effects regression model: Breusch – Pagan test for heterodasticity [52]. Woolridge test for serial correlation [53] and Pesaran Test for cross-sectional dependence [54]. Since the Woolridge test indicated that serial correlation is present in the panel data residuals and the Pesaran Test showed that there is cross – sectional dependence, a re-estimated fixed effects model using robust standard errors, clustered by both country and year was first re-estimated. For the serial correlation problem, we estimated a dynamic panel model (Arellano – Bond style) adding a lagged dependent variable.
4. Research Results
To confirm the research hypotheses and to quantify the positive influence of Web 2.0 tools on the essential elements that illustrate the development of e-commerce (such as enterprises’ total turnover from e-commerce sales), panel data regression was used. To choose the regression model between Fixed Effects model estimated with entity and time effects and Random Effects model the Hausman test is highly relevant and was applied, as it shows which is the most appropriate estimation method. The null hypothesis in the case of Hausmann Test is: Random Effects estimator is consistent and efficient (i.e. unobserved heterogeneity is uncorrelated with regressors). Alternative hypothesis is: Only Fixes Effects estimator is consistent (i.e. unobserved heterogeneity is correlated with regressors). Hausman test coefficients for Fixed Effects and Random Effects variables are presented in the Table 2. Coefficients for Fixed Effects and Random Effects variables.
Hausman test outputs (Hausman statistic= -664.7443; Degrees of freedom =4; P-value=1.000) fail to reject null hypothesis at 5% level and suggests that the random effects model is preferred (more efficient) and statistically justified. The random effects model could be used, is more efficient but assumes no correlation with unobservable.
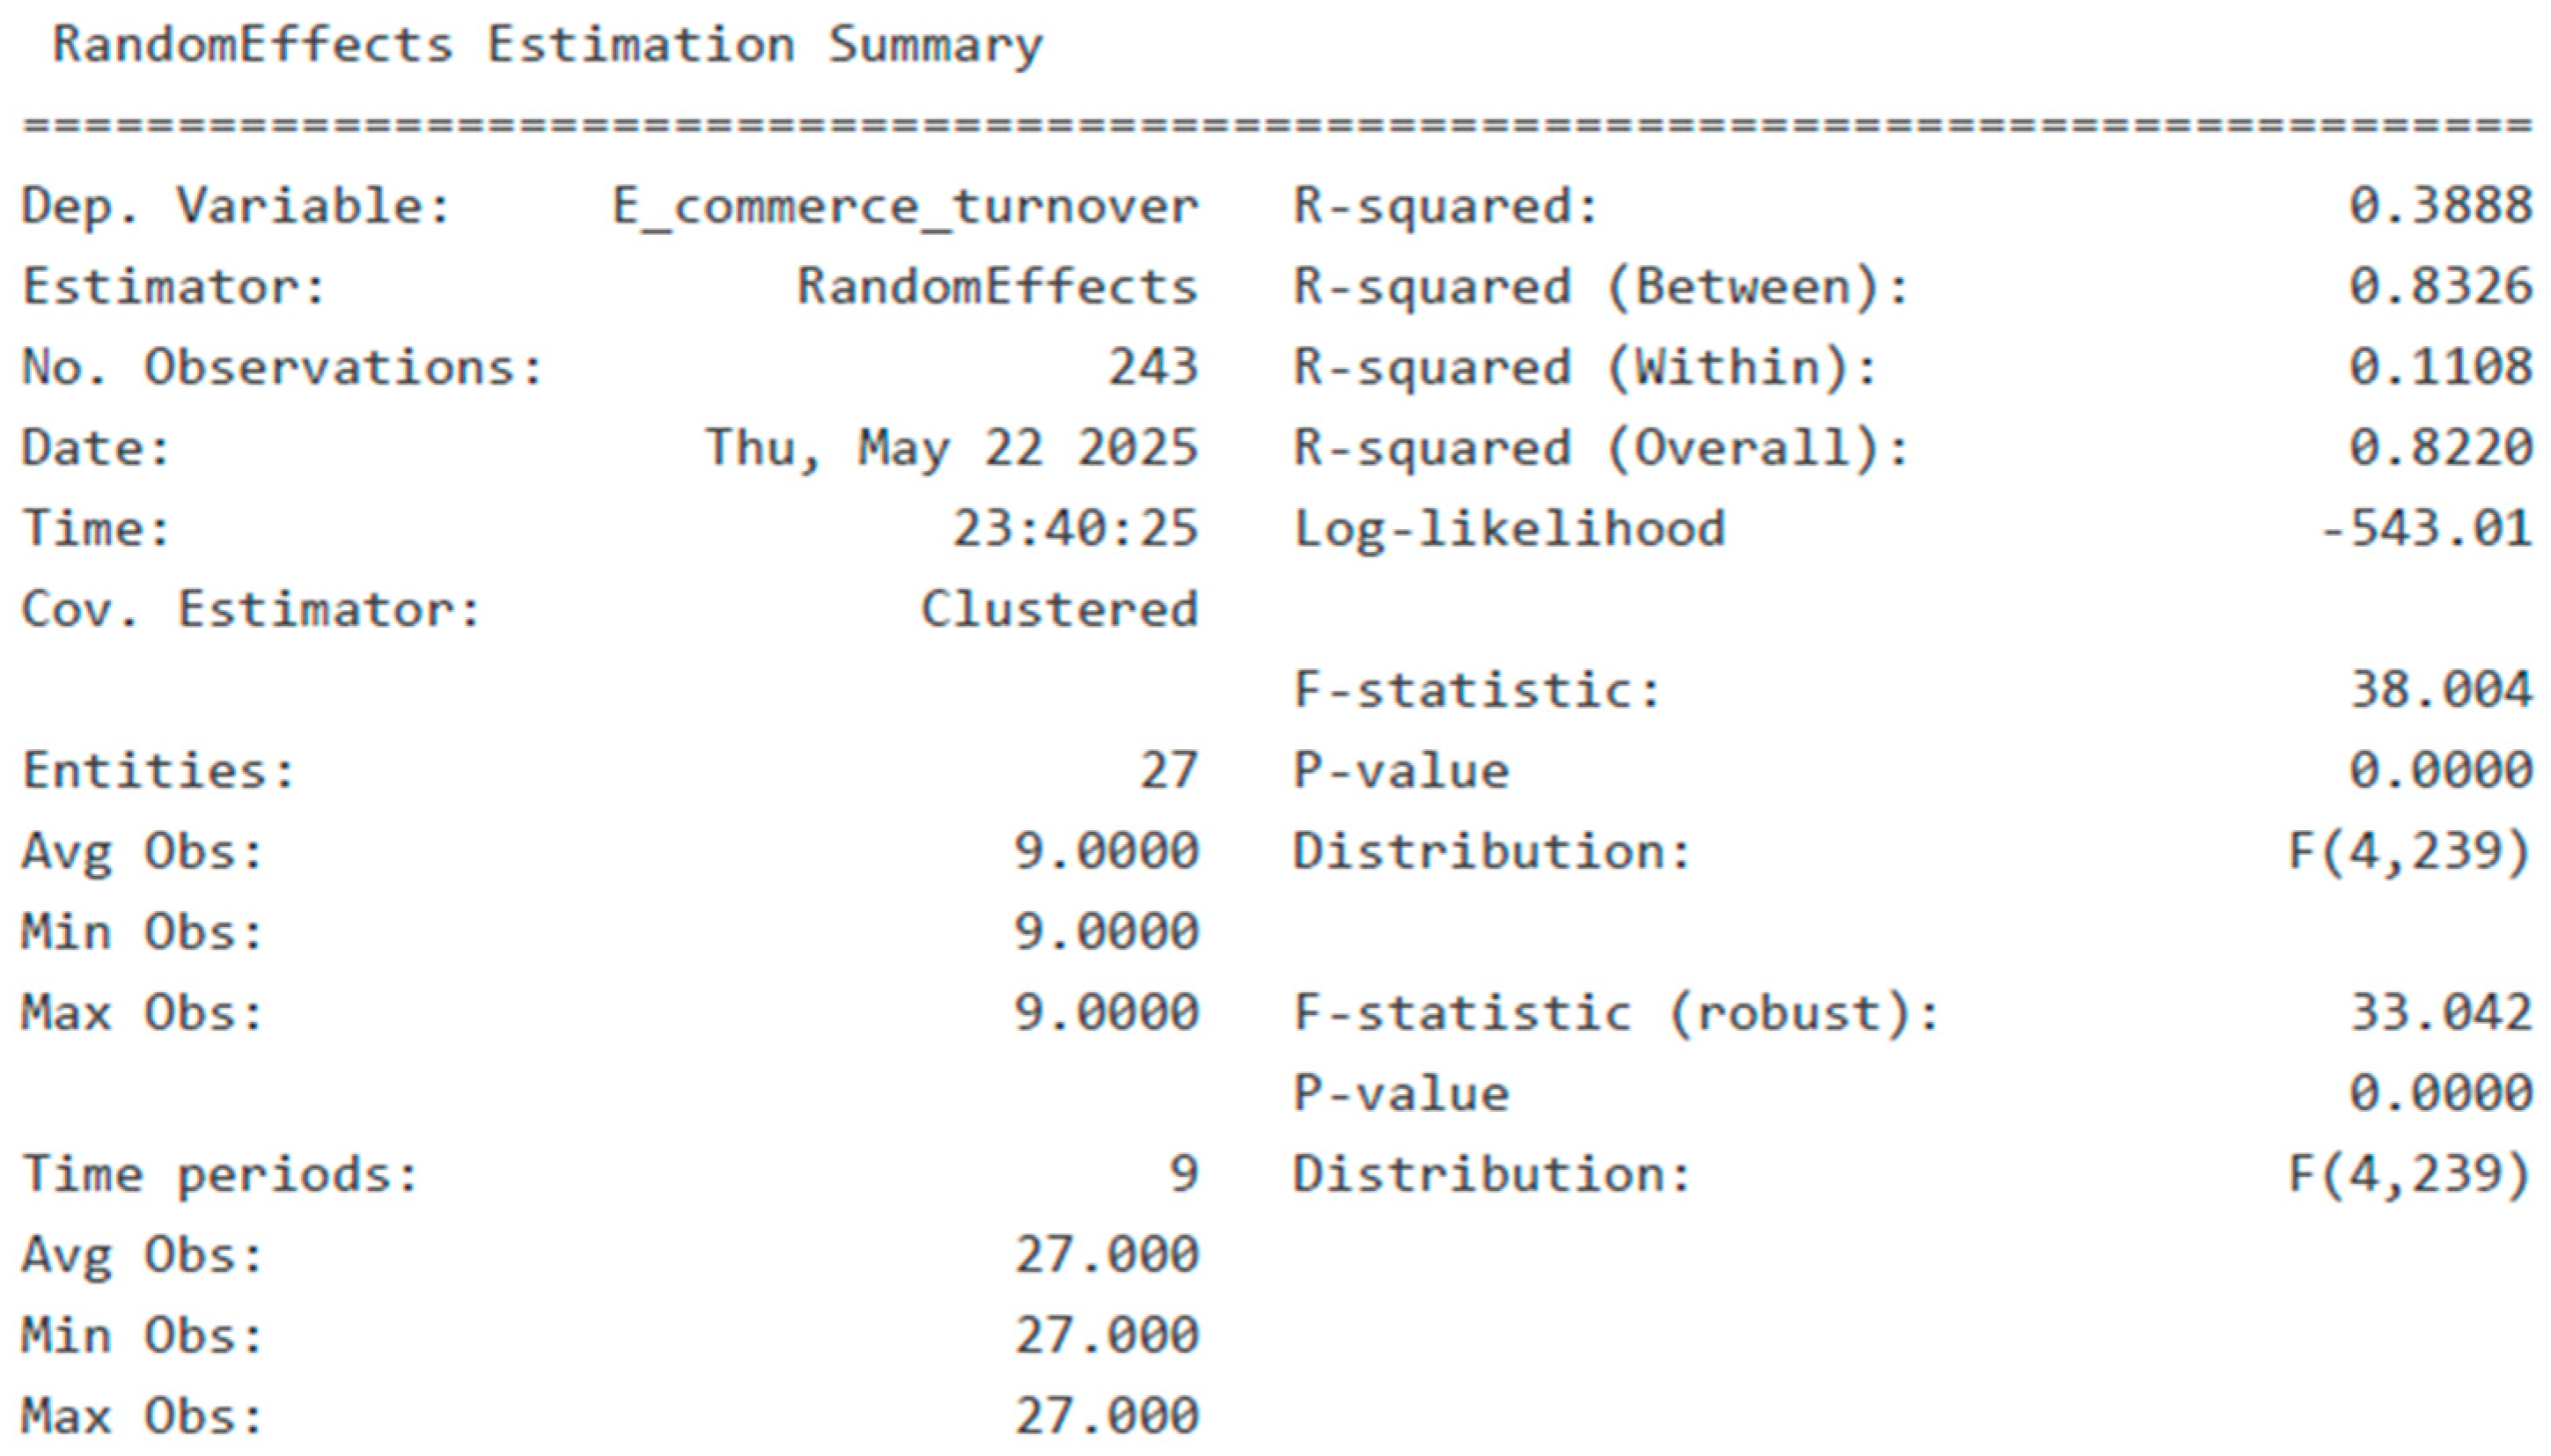
The Random Effects model estimates the impact of various online activities on e-commerce turnover across countries and years. The dependent variable is e-commerce turnover and the independent variables are: pay to advertise on the internet; use social networks; use enterprise's blog or microblogs and use multimedia content sharing websites. Random Effects estimation summary is presented in figure below. The model explains 83,3% variation between countries because R2 (between) is 0.8326. The value of R2 (within), 0.1108, shows that the model explains 11.1% of variation within countries over time. The F-statistic value (38.004; p<0.001) indicates that the model is highly significant overall.
Figure 1.
Random Effects Estimation Summary. Source: own calculations.
Random effects parameter estimates are presented in Table 3. The most influential factor and the strongest predictor in the model is the percentage of enterprises paying to advertise online (β=0.2754; p<0.001). For every 1 percentage point increase in online advertising, e-commerce turnover rises by about 0.28 percentage points.
Social networks usage (β=0.0793; p=0.0016) is also significant at 1% level : a 1 percentage point increase in enterprise use of social networks is associated with 0.08 percentage point increase in e-commerce turnover. The use of enterprise's blog or microblogs (β=0.1177; p=0.3464) and multimedia content sharing websites (β=0.0174; p=0.1184) does not have a statistically significant effect on e-commerce turnover in this model.
Although the results obtained from the Hausman test justify the choice of the Random Effects model, we also considered that Fixed Effect model appears to be theoretically sound given that countries likely have unobserved characteristics affecting e-commerce. The Estimation summary for Fixed Effect model is presented in Table below. And in this model the dependent variable is represented de enterprises’ total turnover from e-commerce sales, and the independent variables are pay to advertise on the internet; use social networks; use enterprise's blog or microblogs and use multimedia content sharing websites. This analysis uses a model with country (entity) fixed effects. There are 243 observations across 27 countries with an average 9 years per country.
Figure 2.
Panel OLS Estimation Summary. Source: own calculations.
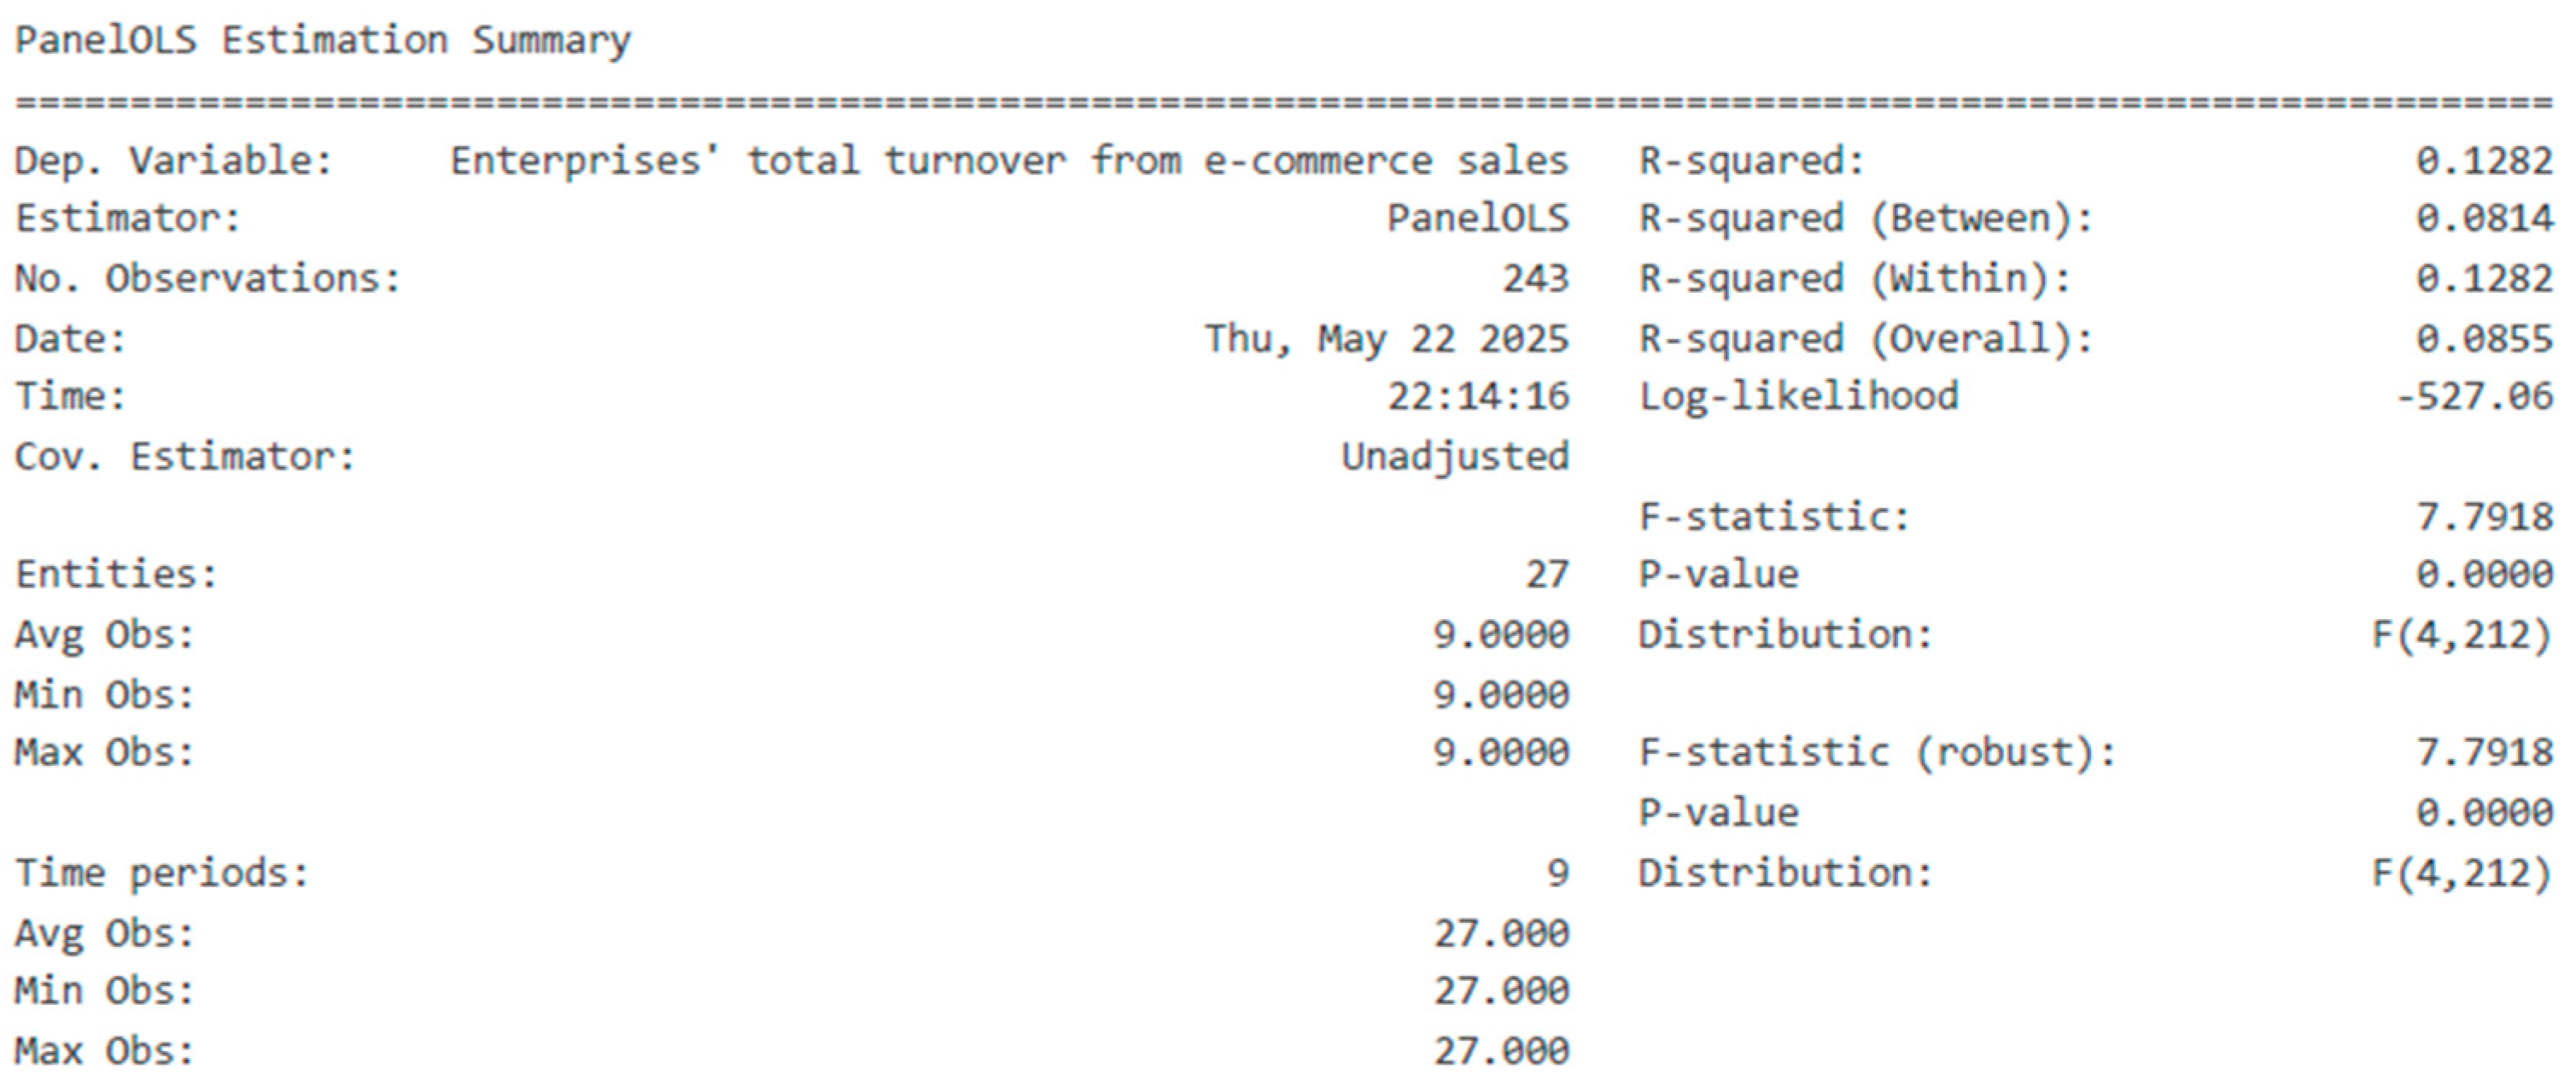
The R2 (Within) is about 0.13, indicating that the model explains around 13% of the variation in turnover within countries over time. The R2 (Overall) is 0.0855, meaning about 8.6% of total variance in turnover is explained by the model. The F-statistic value is 7.79 (p<0.001) indicating the model is statistically significant.
Parameter estimates for Fixed Effects model are presented in Table 4. The constant (intercept) is 7.29 and is the estimated average value of enterprises’ total turnover from e-commerce sales when all independent variables are zero, after accounting for country fixed effects. The p-value of 0.0023 is less than 0.05, deci the intercept is statistically significant at 5% level. In the context of this fixed effects model, the intercept represents the baseline level of e-commerce turnover for a country, after controlling for the effects of the independent variables and the country-specific fixed effects. 95% confidence interval (2.6437, 11.9393) means 95% confidence that the true intercept lies within this range.
For the variable Pay to advertise on the internet the positive and significant coefficient (0.1583) and p-value 0.0191 (statistically significant at the 5% level) suggests that online advertising is associated with higher e-commerce sales. For each 1 percentage point increase in the share of enterprises that pay to advertise on the internet, the total turnover from e-commerce sales increases by about 0.16 units, holding other factors constant. The effect of the use of social network (coefficient 0.0741; p =0.0034) is statistically significant at 1% level, indicating that the social network engagement is positively linked to e-commerce performance. A one percentage point increase in the use of social networks by enterprises is associated with a 0.07 unit increase in e-commerce turnover.
For the variable use enterprise's blog or microblogs (e.g. Twitter, Present.ly, etc.) the coefficient is positive (0.0390) but not statistically significant (p=0.6621). This means there is no strong evidence that using blogs or microblogs by enterprises has a measurable effect on e-commerce turnover in this dataset. Similarly, the use of multimedia content sharing websites (β=0.0151;p=0.3123) does not show a statistically significant relationship with e-commerce turnover.
Activities like paying for online advertising and using social networks are both positively and significantly associated with higher e-commerce sales among enterprises, after accounting for country – specific effects. In contrast, using blogs/microblogs and multimedia sharing sites does not show a significant impact on e-commerce turnover in this analysis.
The scatter plot showing the relationship between the percentage of enterprises that pay to advertise online and their total turnover from e-commerce sales is presented in Figure 3. Each point represents a country -year observation and red line is the fitted regression line with a 95% confidence interval.
In the previous figure there is clear positive trend: as more enterprises engage in online advertising, e -commerce turnover trends to increase. This visual pattern supports the regression results, which found a statistically significant positive effect of online advertising on e-commerce sales.
The scatter plot showing the relationship between the percentage of enterprises using social networks (Facebook, LinkedIn etc.) and their total turnover from e-commerce sales is presented in Figure 4. The visualization reveals a positive relationship between social network usage and e-commerce turnover, which aligns with the regression findings. The positive trend line confirms that, on average, countries with higher rates of enterprise social network usage tend to have higher e-commerce turnover, supporting the hypothesis that social media engagement contributes to online sales success.
Several statistical tests were applied for the fixed effects regression model: Breusch – Pagan test for heterodasticity, Woolridge test for serial correlation and Pesaran Test for cross-sectional Dependence. The Breusch – Pagan test results (LM statistic = 8.45; LM p – value= 0,076; F-statistic= 2.15; F p-value= 0.0758) suggest that we failed to reject null hypothesis of homoskedasticity (p-value=0,076) so there’s no strong evidence of heteroskedasticity in the model.
The results of Woolridge Test for serial correlation (coefficient rho=0.3346; test statistic = 4.9175; p-value=0.00) shows significant serial correlation (p<0.001), meaning the residuals are correlated across time periods within countries. The Pesaran CD test indicates strong cross-sectional dependence (p<0.001) suggesting that shocks affecting one country also affect other countries. These violations of standard panel regression assumptions suggest the possibility to use other models and approaches: robust standard errors (clustered by country and/or time) and a dynamic panel model to address serial correlation.
First, the fixed effects model is re-estimated using robust standard errors, clustered by both country and year. This approach helps correct the standard errors for both types of correlation, making the inference more reliable. The results are presented in below figure.
Figure 5.
PanelOLS Estimation Summary. Source: own calculations.
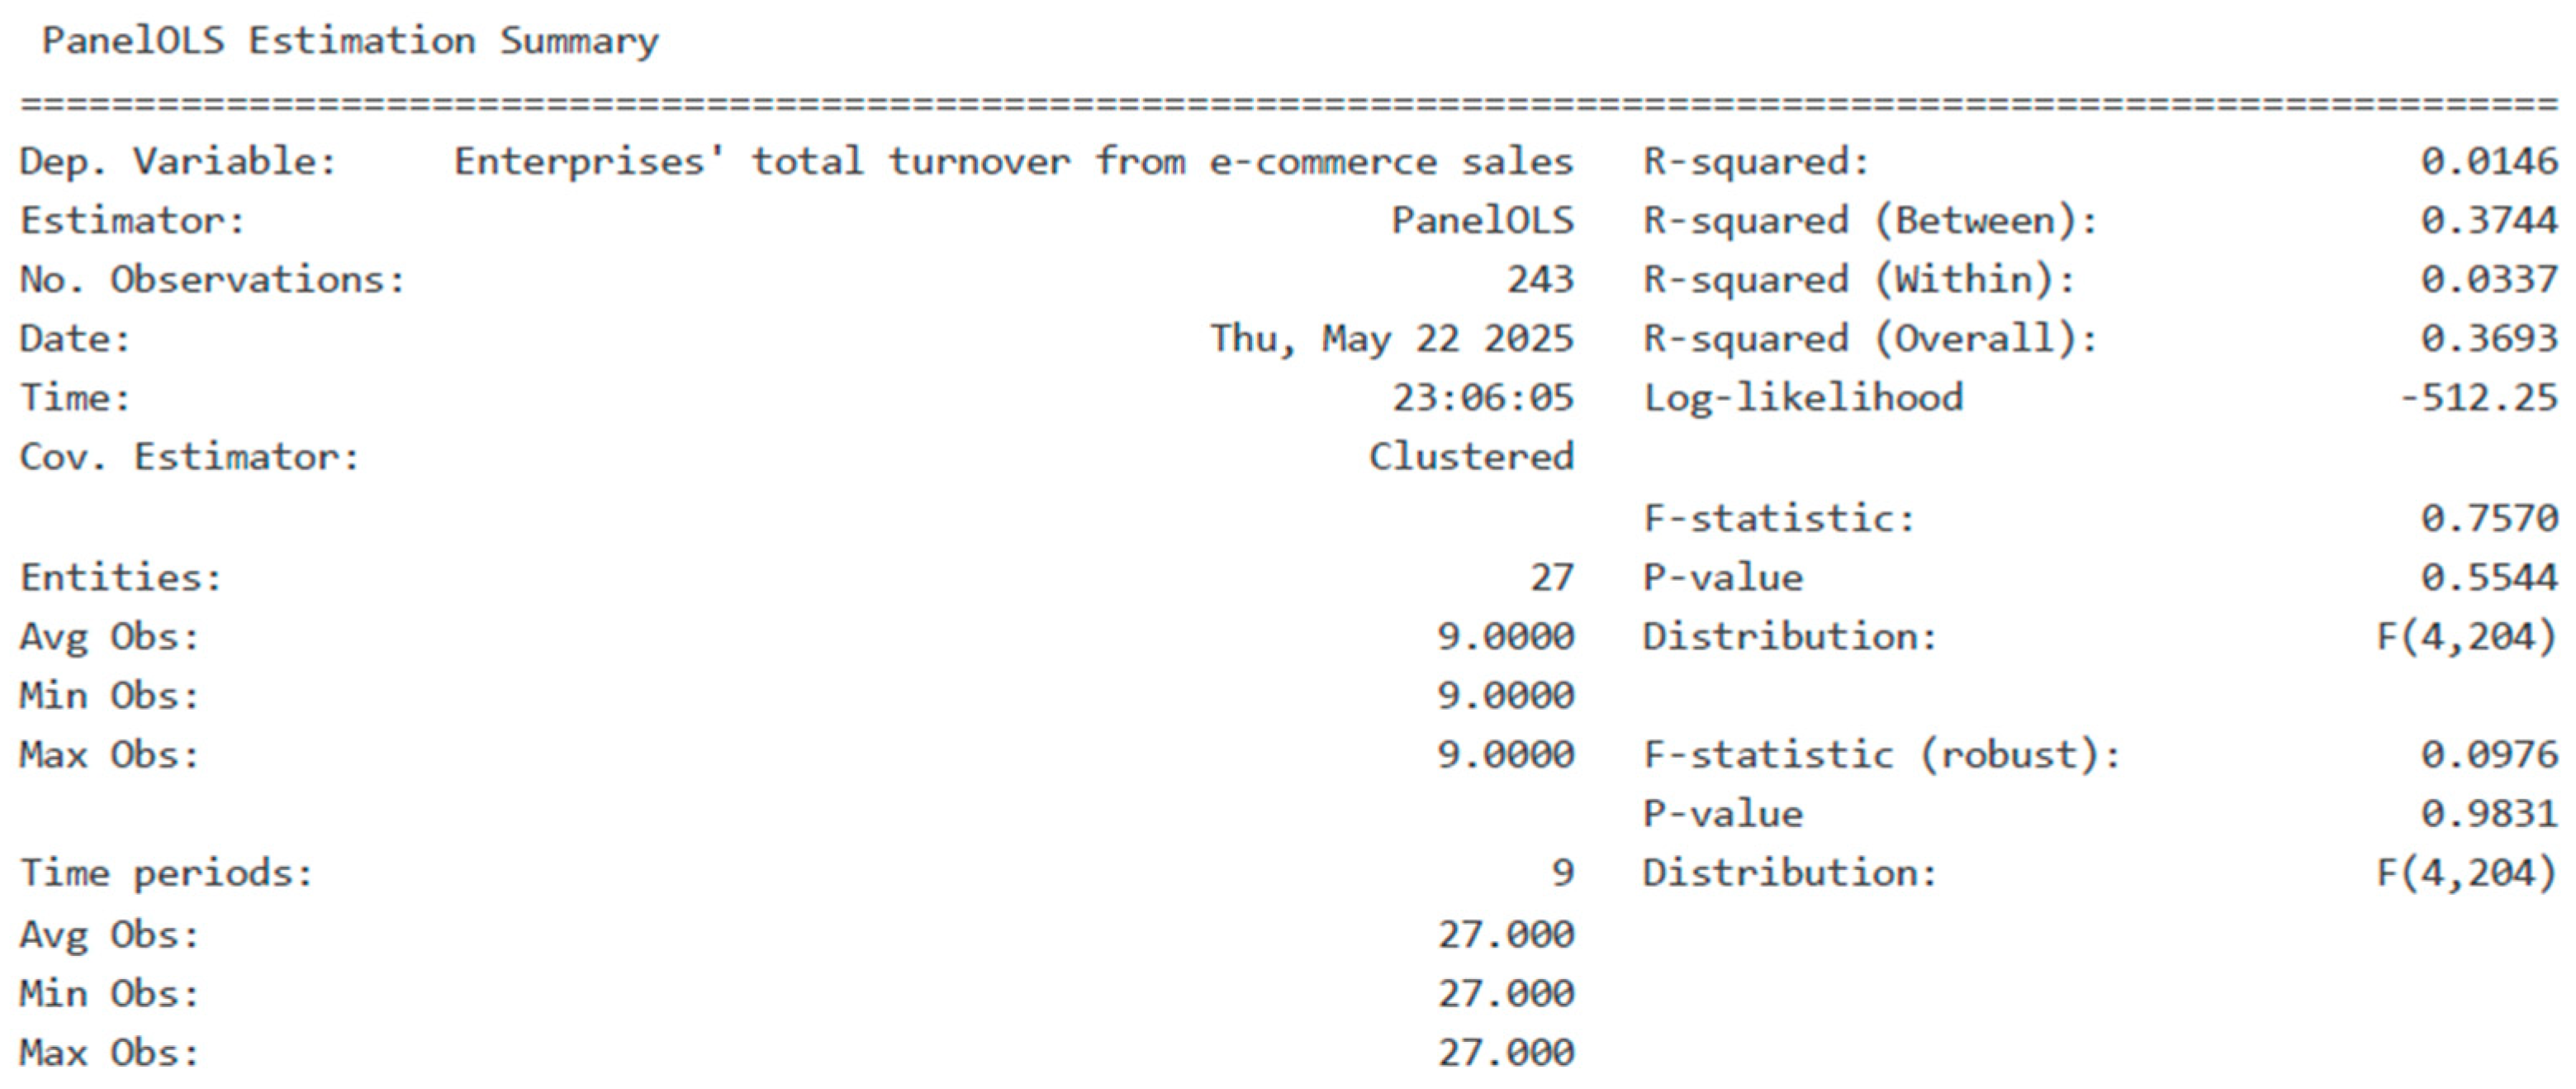
The value of R2 (within), 0.0337 shows that the independent variables explain only 3.37% of the variation within each entity. R2 (between), with a value of 0.3744 shows that the model explains 37.34% of the variation of each entity (differences between countries). The value of R2 , 0.0146, shows that the model explains, in total, only 1.46% of the variation of the dependent variable. The statistical significance tests, the F statistic tests (0.7579; p-value=0.9831) and F statistic (robust.) – 0.0976; p-value=0.9831 , with p-values well above the standard significance threshold (0.05) so we cannot reject the null hypothesis that all coefficients are 0. In practice, the model is not statistically significant even at the robust level.
The model explains very little of the variation in turnover from e-commerce sales. There is no statistical evidence that the included predictors have a relevant common effect. From this perspective, the data on parameter estimates included in Table 5 are relevant.
None of the variables analyzed is, in this model, statistically significant at a 5% threshold, which suggests that, in the current form of the model, we cannot confidently state that these variables influence e-commerce turnover form e-commerce sales. The only variable with a slightly more pronounced effect is Pay to advertise on the internet which presents a positive coefficient (0.1125) and p=0.1010. The other three variables analyzed did not have significant effects, which may suggest an inefficient use of these channels.
To further address serial correlation we estimated a dynamic panel model (Arellano-Bond style) by including a lagged dependent variable and using first – difference estimation. This helps the account for the persistence in turnover over time and provides more robust results in the presence of serial correlation. The dynamic panel model (Arellano-Bond style) First differences are presented in the figure below.
Figure 6.
First differences OLS Estimation Summary. Source: own calculations.
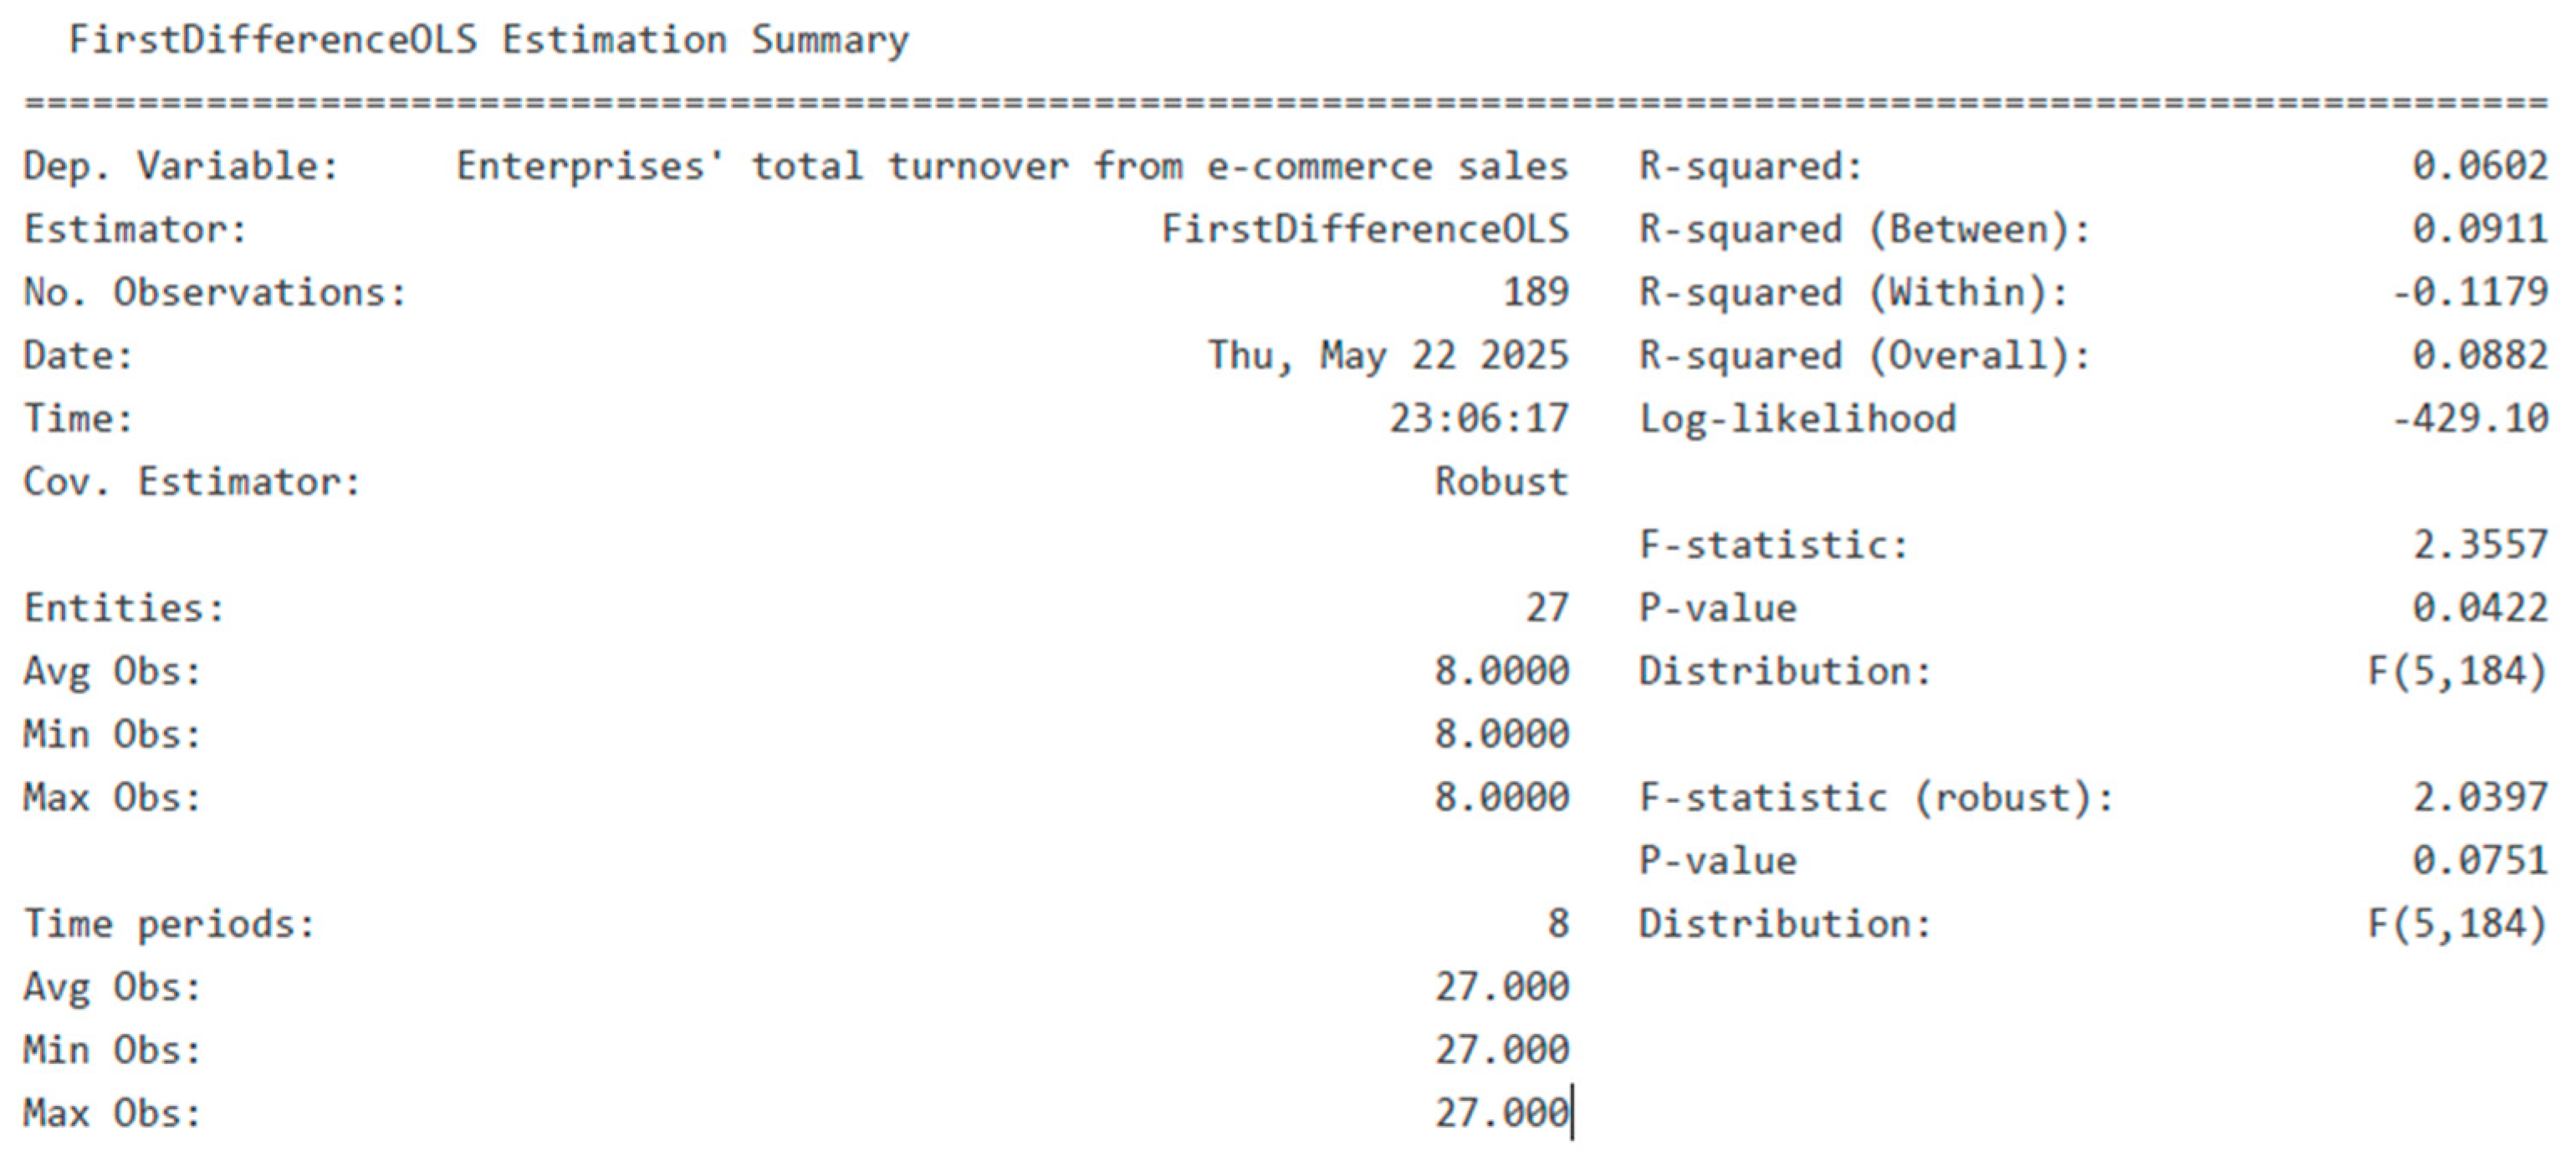
The estimated model provides mixed results in terms of the quality of fit and the statistical significance of the regression. The negative value of R2 (within), for the internal variation of entities over time, shows that the model used does not efficiently explain the variation within the units of analysis (countries over time). The value of 0.0882 of R2 (overall) shows that approximately 8.8% of the total variation of the dependent variable is explained by the independent variables (a relatively modest value, but better than in the first model analyzed). The F-test (F-statistic = 2.3557, p-value=0.0422) is significant at the 5% level, which means that the model, as a whole, is statistically significant and that at least one independent variable has a significant effect on the dependent variable. The model is statistically significant at the global level, but has a modest explanatory power. Parameter estimates for the dynamic panel model (Arellano-Bond style) are presented in the Table below.
Table 6.
Dynamic panel model (Arellano-Bond style) – Parameter Estimates.
| Parameter | Std.Err | T-stat | P-value | Lower CI | Upper CI | |
| Pay to advertise on the internet | 0.1565 | 0.0641 | 2.4413 | 0.0156 | 0.0300 | 0.2830 |
| Use social networks (e.g. Facebook, LinkedIn, Xing, Viadeo, Yammer, etc.) | -0.0057 | 0.0230 | -0.2468 | 0.8053 | -0.0510 | 0.0396 |
| Use enterprise's blog or microblogs (e.g. Twitter, Present.ly, etc.) | 0.0040 | 0.1372 | 0.0291 | 0.9768 | -0.2667 | 0.2747 |
| Use multimedia content sharing websites (e.g. YouTube, Flickr, Picasa, SlideShare, etc`.) | -0.0008 | 0.0086 | -0.0964 | 0.9233 | -0.0178 | 0.0161 |
| Lag turnover | -0.1728 | 0.0923 | -1.8730 | 0.0627 | -0.3548 | 0.0092 |
Source: own calculations
The only statistically significant effect (at 5%) in the dynamic panel (first – difference) model is for „Pay to advertise on the internet”. A one percentage point change in enterprises paying for internet advertising is associated with 0.1565 percentage point change in e-commerce turnover. Other variables (use social networks, blogs/microblogs, multimedia content sharing) are not statistically significant. The lagged dependent variable (previous year’s turnover) shows a marginally significant negative effect, suggesting mean reversion.
5. Discussions
The results obtained in the case of the random effects model and the dynamic panel model (Arellano – Bond) show that the effect of “paying to advertise on internet” on enterprises' total turnover from e-commerce sales is positive and significant, which confirms the first research hypothesis and a large part of the results of previous studies [42,43,44]. Internet advertising has proven, in all its forms in the context of Web 2.0, a decisive tool for increasing the revenues of enterprises in the 27 countries of the European Union.
Also, the research results (in the case of the random effects model) confirm the second research hypothesis regarding the influence of social media use on enterprises' total turnover from e-commerce sales (positive and statistically significant influence in the case of the random effects model, positive but statistically insignificant influence in the case of the fixed effects model). The positive influence of social media on the development of e-commerce thus confirms some of the results of previous studies [6,45]. However, the research results only partially reflect the extent of the effects of social media on the development of e-commerce, revealed by other qualitative or quantitative approaches of previous studies in this regard.
A novel element of the research conducted, one of the key findings, revealed by the results obtained is that use enterprise's blog or microblogs (e.g. Twitter, Present.ly, etc.) and use multimedia content sharing websites (e.g. YouTube, Flickr, Picasa, SlideShare, etc) do not influence enterprises' total turnover from e-commerce sales to a valid and statistically significant extent. Thus, the third and fourth hypotheses are not confirmed by the results of the research conducted. Also, the research results regarding use enterprise's blog or microblogs (e.g. Twitter, Present.ly, etc.) and use multimedia content sharing websites (e.g. YouTube, Flickr, Picasa, SlideShare, etc.) do not support and do not agree with other similar studies [46,47,50], which is explainable since European enterprises are not among the most important innovators in this field nor the owners of the most important multimedia content sharing websites (e.g. YouTube, Flickr, Picasa, SlideShare, etc.). Probably an inclusion of data from other geographical areas (North America, Asia) where e-commerce is even more developed compared to European countries would improve the chances of confirming these two research hypotheses.
The analysis of the obtained results and the comparison with other specialized studies show the theoretical and practical implications of the study presented in this article. The most important theoretical implications of our study concern the need to expand the role of perception on online advertising and the use of social media by European enterprises in the development of e-commerce. The amplification and re-conceptualization of online contacts with consumers in the context of Web 2.0 thus becomes essential from a theoretical perspective for the development of e-commerce. From a pragmatic perspective, of the practical implications of the research carried out, it becomes evident both the need to focus the relationship with customers/consumers towards certain components of the online environment such as social media in relation to others (microblogs). From the perspective of managerial practice, the results reconfirm and emphasize the need to restructure the commercial operational areas of contemporary organizations towards their virtual side, to increase the role of social media and social virtual networks in amplifying e-commerce and the organizations' revenues from sales in the virtual space.
The study conducted and the explanatory and generalizable power of the results are affected by a series of limitations due to the geographical space from which the research data come and the fact that they mainly reflect the organizational approach and less the individual one. Therefore, one of the future directions of the research is to extend it by considering data for other geographical spaces representative of the development of Web 2.0 and e-commerce.
6. Conclusions
This literature review showcases the role of Web 2.0 tool for e-commerce development at the level of the European Union. Our study contributes to answer the questions identified in the literature gap, by using a regression analysis based on panel data gathered from Eurostat which has the power to show relevant perspectives for the digital transformation of EU, for the period 2015-2023. By applying fixed-effects models and a dynamic Arellano-Bond model, the research provides robust empirical evidence of the real and measurable impact of Web 2.0 technologies on e-commerce revenue.
This paper brings both a theoretical and practical contribution, integrating the sustainability perspective for e-commerce development. From the theoretical point of view, the study is showing the importance of interactivity between companies and consumers in the digital environment [56], using web 2.0 tools. From the practical point of view, the results suggest the need to prioritize social media strategies and update commercial operations in order to respond to the need of the clients. The bibliometric review showed a lack of studies applied for economic effectiveness of web 2.0 tools on e-commerce.
The first two research hypothesis were confirmed both through the existing literature and through the econometrical analysis, highlighting the positive and statistic significant effect of internet advertising [57] and social media usage on the total turnover of e-commerce sales. On the other hand, blogs, microblogs and multimedia content sharing platforms were not considered statistical significant, underlining the discrepancy between available technological resources and the actual integration in the digital economy. The main contribution of the research is related with providing quantitative outcomes, in a field dominated by qualitative outcomes or individual country, company, industry approaches.
This articles is integrating the Web 2.0 instruments into the econometric framework, unlike other studies which investigate only the determinants of e-commerce [20]. Used combined techniques are capturing both dynamics of e-commerce and country heterogeneity, providing relevant perspectives for public policy, digital marketing and companies in general. Among Web 2.0 tools, online paid advertising and usage of social media are the ones contributing to the increase of e-commerce revenue, while the other variables, blogs, microblogs, multimedia platforms are not considered relevant, the outcomes is confirmed by applying dynamic and robust models. The results highlight that online paid advertisement and social media usage variables have significative, positive effect on e-commerce performance, confirming the first and second hypothesis. Use of enterprise's blog or microblogs and use of multimedia content sharing websites do not influence enterprises' total turnover from e-commerce sales to a valid and statistically significant extent. Thus, the third and fourth hypotheses are not confirmed by the results of the research conducted, possibly due to limited innovation and platform ownership in Europe region. Web 2.0 instruments has an active role in the digital economy of European Union, as it is considered a digital infrastructure with measurable economic effects.
Future research can be extended by including the diversity of economic sectors, types of organizations, by including additional control variables and by exploring the transitions from Web 2.0 to Web 3.0. The outcomes of the quantitative research validate the hypothesis related with the fact that Web 2.0 instruments, especially paid online advertising and usage of social media, have a positive influence on the turnover generated by electronic commerce. This finding can be applied only to the 27 member states EU and ca not be generalized. Therefore, in the future the research can be extended to other regions like America and Asia.
References
- Lin, X.; Li Y.; Wang, X. Social commerce research: Definition, research themes and the trends. Int. J. Inf. Manag. 2017, 37( 3), 190-201, ISSN 0268-4012. [CrossRef]
- Hajli, N. Social commerce constructs and consumer's intention to buy. Int. J. Inf. Manag, 2015, 35(2), 183–191. [CrossRef]
- Chen, Y.; Wang, Y.; Sun, V. Social media applications and firm performance in B2B marketing: The mediating role of customer engagement. Ind. Mark. Manag., 2020, 84, 89–102.
- Jula, N. M.; Staicu, G. I.; Moraru, L. C., & Bodislav, D. A. Toward a Sustainable Development of E-Commerce in EU: The Role of Education, Internet Infrastructure, Income, and Economic Freedom on E-Commerce Growth. Sustainability, 2024, 16(9), 3809. [CrossRef]
- Gherghina, Ș. C.; Botezatu, M. A., & Simionescu, L. N. Exploring the Impact of Electronic Commerce on Employment Rate: Panel Data Evidence from European Union Countries. Sustainability, 2021, 13(12), 6752.
- Kaplan, A. M. & Haenlein, M. Users of the world, unite! The challenges and opportunities of social media. Bus. Horiz., 2010, 53(1), 59–68.
- Chada, L. M., Parashar, H. V., Singh, I., Rastogi, M., Singh, S., & Raja, S. P. A comparative analysis of Web 3.0, Web 2.0, and Web 1.0: evolution and implications. Int. J. Learn. Change, 2025, 17(1), 1–55.
- Mangold, W. G. & Faulds, D. J. Social media: The new hybrid element of the promotion mix. Bus. Horiz., 2009, 52(4), 357–365. [CrossRef]
- Jula, N. M.; Staicu, G. I.; Moraru, L. C. & Bodislav, D. A.Toward a Sustainable Development of E-Commerce in EU: The Role of Education, Internet Infrastructure, Income, and Economic Freedom on E-Commerce Growth. Sustainability, 2024, 16(9), 3809. [CrossRef]
- Afzal, F. & Lim, B. Organizational Factors Influencing the Sustainability Performance of Construction Organizations. Sustainability, 2022, 14(16), 10449. [CrossRef]
- He, W. Wang, F. K. & Zha, S. Enhancing firm performance through social media and digital platforms: Evidence from China. J. Bus. Res., 2017, 81, 175–185.
- Hajli, N.. Social commerce constructs and consumer's intention to buy. Int. J. Inf. Manag., 2015, 35(2), 183–191. [CrossRef]
- Ballew, M. T.; Omoto, A. M. & Winter, P. L. Using Web 2.0 and Social Media Technologies to Foster Proenvironmental Action. Sustainability, 2015, 7(8), 10620–10648. [CrossRef]
- Firoiu, D., Pîrvu, R., Jianu, E., Cismaș, L. M., Tudor, S., & Lățea, G. Digital Performance in EU Member States in the Context of the Transition to a Climate Neutral Economy. Sustainability, 2022, 14(6), 3343. [CrossRef]
- Urbinati, A., Chiaroni, D., & Chiesa, V. Towards a new taxonomy of circular economy business models. Sustainability, 2017, 9(5), 437.
- Bocken, N. M. P., de Pauw, I., Bakker, C., & van der Grinten, B. Product design and business model strategies for a circular economy. Sustainability, 2016, 8(5), 437.
- Lewandowski, M. Designing the Business Models for Circular Economy—Towards the Conceptual Framework. Sustainability, 2016, 8(1), 43. [CrossRef]
- Castro, C. G., Trevisan, A. H., Pigosso, D. C. A., & Mascarenhas, J. The Rebound Effect of Circular Economy: Definitions, Mechanisms and a Research Agenda. Sustainability, 2022, 14(8), 4471.
- Hysa, E., Kruja, A., Rehman, N. U., & Laurenti, R.. Circular economy innovation and environmental sustainability impact on economic growth: An integrated model for sustainable development. Sustainability, 2020, 12(12), 4831. [CrossRef]
- Gherghina, Ș. C., Botezatu, M. A., & Simionescu, L. N. E-Commerce Calls for Cyber-Security and Sustainability: A Comparative Study of European Countries. Sustainability, 2021, 13(12), 6752.
- Zherlitsyn, D., Kolarov, K. & Rekova, N. Digital Transformation in the EU: Bibliometric Analysis and Digital Economy Trends Highlights. Digital, 2025, 5(1), 1. [CrossRef]
- Past, present, and future of social commerce: a bibliometric analysis. Qual. Quant, 2025, 59, 1–25.
- Tajvidi, R., & Karami, A.. The effect of social media on firm performance. Comput. Hum. Behav., 2021, 115, 105174. [CrossRef]
- Ngai, E. W. T., Tao, S. S. C., & Moon, K. K. L. Social media research: Theories, constructs, and conceptual frameworks. Int. J. Inf. Manag., 2015, 35(1), 33–44.
- Ahmad, S. Z., Ahmad, N., & Abu Bakar, A. R. Reflections of entrepreneurs of small and medium-sized enterprises concerning the adoption of social media and its impact on performance outcomes: Evidence from the UAE. Telemat. Inform., 2019, 38, 27–40.
- Wang, Y., & Kim, Y. The impact of social media use on firm performance in the context of e-commerce. J. Retail. Consum. Serv., 2021, 58, 102304.
- Zhu, Q., Geng, Y., & Sarkis, J. Role of e-commerce and resource utilization for sustainable development. Electron. Commer. Res., 2020, 20(4), 789–807.
- Davis, F. D.. Perceived usefulness, perceived ease of use, and user acceptance of information technology. MIS Quarterly, 1989, 13(3), 319–340.
- Rogers, E. M.. Diffusion of innovations (5th ed.), Free Press, 2003.
- Barney, J. Firm resources and sustained competitive advantage. J. Manag., 1991, 17(1), 99–120. [CrossRef]
- Venkatesh, V., Morris, M. G., Davis, G. B., & Davis, F. D. User Acceptance of Information Technology: Toward a Unified View. MIS Q., 2003, 27(3), 425–478.
- Aria, M., & Cuccurullo, C. bibliometrix: An R-tool for comprehensive science mapping analysis. J. Informetr., 2017, 11(4), 959-975. [CrossRef]
- Van Eck, N.J., Waltman, L. Software survey: VOSviewer, a computer program for bibliometric mapping. Scientometrics, 2010, 84, 523–538. [CrossRef]
- Hajli, N. Social commerce constructs and consumer's intention to buy. Int. J. Inf. Manag, 2015, 35(2), 183–191. [CrossRef]
- Busalim, A. H., & Hussin, A. R. C. (2016). Understanding social commerce: A systematic literature review and directions for further research. International Journal of Information Management, 36(6), 1075–1088. [CrossRef]
- Lin, X., Li, Y., & Wang, X. (2017). Social commerce research: Definition, research themes, and the trends. International Journal of Information Management, 37 (3), 190-201,.
- Leong, L. Y., Jaafar, N. I., & Ainin, S. (2018). The effects of Facebook browsing and usage intensity on impulse purchase in f-commerce. Computers in Human Behavior, 78, 160–173. [CrossRef]
- Hajli, N. Social commerce constructs and consumer's intention to buy. Int. J. Inf. Manag, 2015, 35(2), 183–191. [CrossRef]
- Ahmad, N. R. (2025). Digital Marketing Strategies and Consumer Engagement: A Comparative Study of Traditional vs. E-Commerce Brands. The Critical Review of Social Sciences Studies, 3(1), 1537–1548. [CrossRef]
- Zhu, Q., Geng, Y., & Sarkis, J. (2020). Role of e-commerce and resource utilization for sustainable development. Electronic Commerce Research, 20(4), 789–807.
- Ahmad, S. Z., Ahmad, N., & Abu Bakar, A. R. (2019). Reflections of entrepreneurs of small and medium-sized enterprises concerning the adoption of social media and its impact on performance outcomes: Evidence from the UAE. Telematics and Informatics, 38, 27–40.
- Figueiredo, N., Ferreira, B. M., Abrantes, J. L., & Martinez, L. F. (2025). The Role of Digital Marketing in Online Shopping: A Bibliometric Analysis for Decoding Consumer Behavior. Journal of Theoretical and Applied Electronic Commerce Research, 20(1), 25. [CrossRef]
- Shen, Y. Channel Integration Through a Wireless Applet and an E-Commerce Platform. J. Theor. Appl. Electron. Commer. Res. 2025, 20, 51. [CrossRef]
- Harfoushi, O., Alfawwaz, B., Obeidat, B., Obiedat, R., & Faris, H. (2013). Impact of internet advertisement and its features on e-commerce retail sales: Evidence from Europe. Journal of Software Engineering and Applications, 6(11), 564-570. [CrossRef]
- Verhoef, P. C., Kannan, P. K., & Inman, J. J. (2015). From multi-channel retailing to omnichannel retailing: Introduction to the special issue on multi-channel retailing. Journal of Retailing, 91(2), 174-181.
- De Vries, L., Gensler, S., & Leeflang, P. S. (2012). Popularity of brand posts on brand fan pages: An investigation of the effects of social media marketing. Journal of Interactive Marketing, 26(2), 83-91. [CrossRef]
- Cifci, E., & Tidwell, A. (2025). “Connect” me! Social networking in commercial real estate. Real Estate Economics, 53(1), 37-66.
- Freberg, K., Graham, K., McGaughey, K., & Freberg, L. A. (2011). Who are the social media influencers? A study of public perceptions of personality. Public Relations Review, 37(1), 90-92. [CrossRef]
- Hudders, L., De Jans, S., De Veirman, M., & Molyneaux, H. (2017). Social Media Influencers and Their Impact on Consumer Decision Making. Journal of Digital & Social Media Marketing, 5(3), 197-207.
- De Veirman, M., Cauberghe, V., & Hudders, L. (2017). Marketing through Instagram Influencers: The Impact of Influencer-Generated Content on Consumer Behavior. Journal of Advertising, 46(1), 1-12.
- Hausman, J. A. (1978). Specification Tests in Econometrics. Econometrica, 46(6), 1251–1271.
- Breusch, T. S., & Pagan, A. R. (1979). A Simple Test for Heteroscedasticity and Random Coefficient Variation. Econometrica, 47(5), 1287–1294. [CrossRef]
- Wooldridge, J. M. (2002). Econometric Analysis of Cross Section and Panel Data. Cam-bridge, MA: MIT Press.
- Pesaran, M. H. (2004). General diagnostic tests for cross section dependence in panels. University of Cambridge, Faculty of Economics, Cambridge Working Papers in Economics No. 0435.
Figure 3.
The scatter plot showing effect of paying for online advertising on e-commerce turnover. Source: own calculations.
Figure 3.
The scatter plot showing effect of paying for online advertising on e-commerce turnover. Source: own calculations.
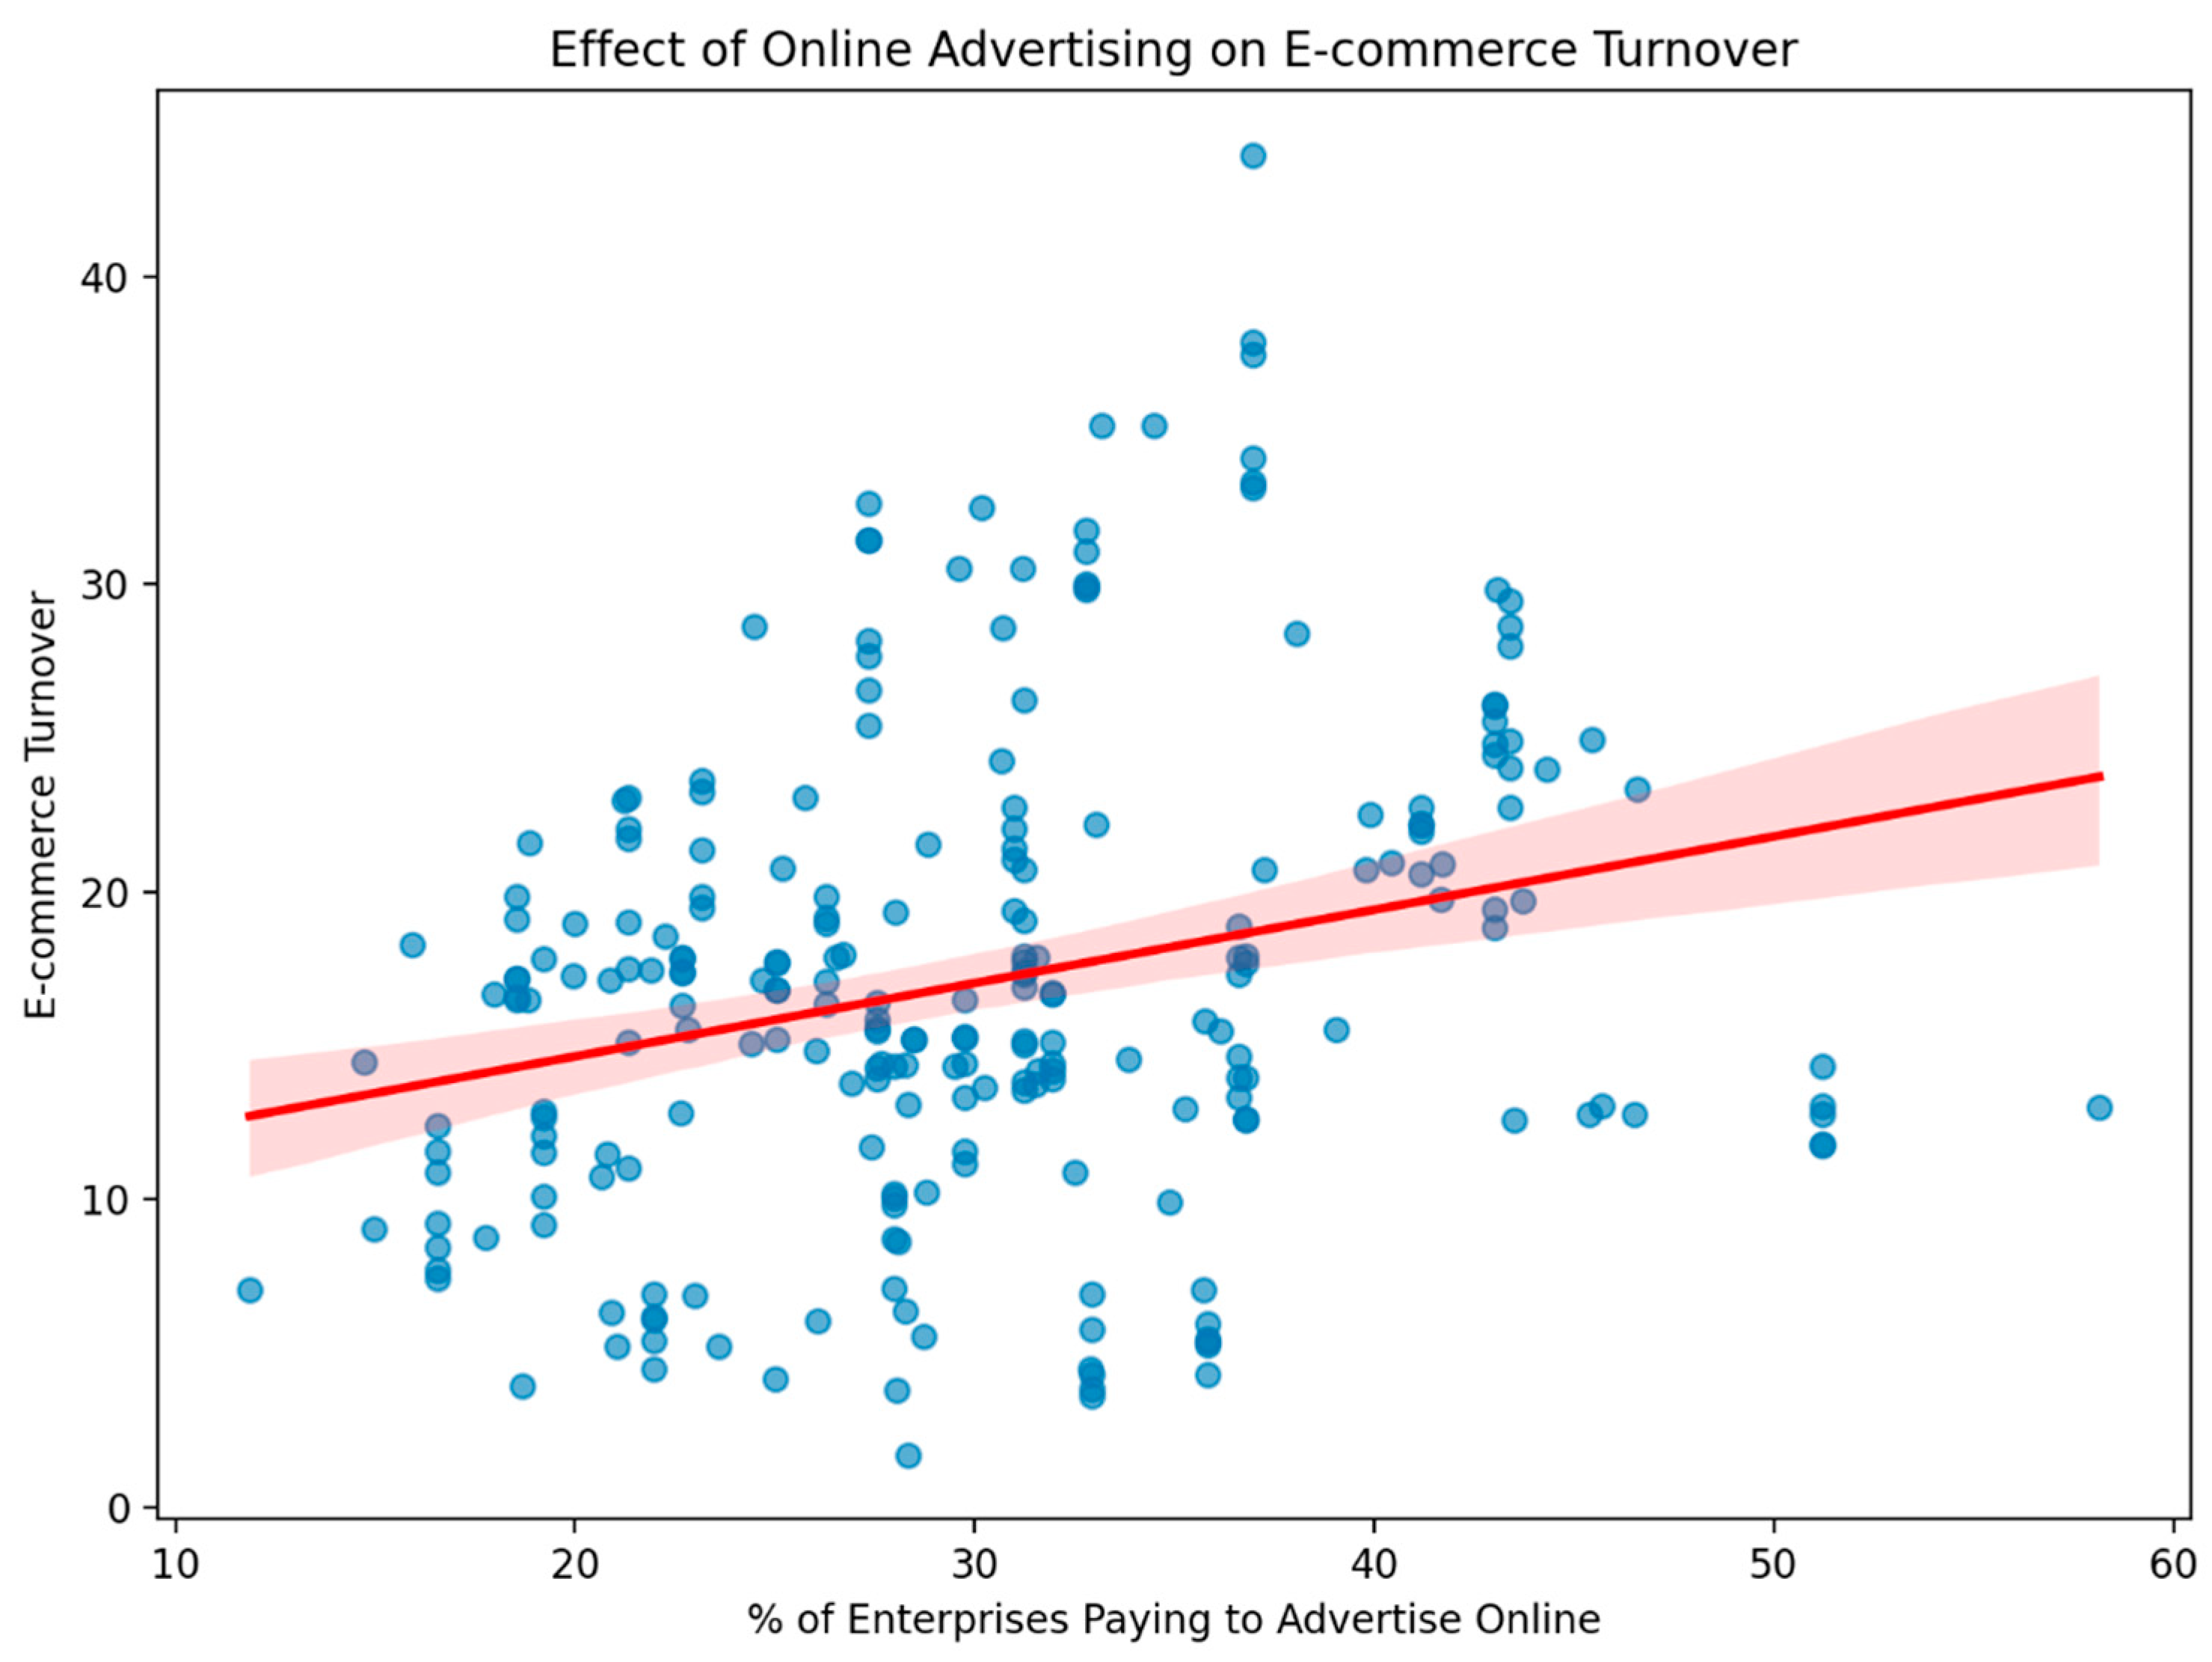
Figure 4.
The scatter plot showing effect of paying for online advertising on e-commerce turnover. Source: own calculations.
Figure 4.
The scatter plot showing effect of paying for online advertising on e-commerce turnover. Source: own calculations.

Table 2.
Coefficients for Fixed Effects and Random Effects variables.
| Variable | Fixed Effects | Random Effects | Difference |
| Pay to advertise on the internet | |||
| 0.1125 | 0.2754 | -0.1629 | |
| Use social networks (e.g. Facebook, LinkedIn, Xing, Viadeo, Yammer, etc.) | |||
| 0.0060 | 0.0793 | -0.0733 | |
| Use enterprise's blog or microblogs (e.g. Twitter, Present.ly, etc.) | |||
| 0.0772 | 0.1177 | -0.0406 | |
| Use multimedia content sharing websites (e.g. YouTube, Flickr, Picasa, SlideShare, etc`.) | |||
| -0.0077 | 0.0174 | -0.0251 |
Source: own calculations
Table 3.
Random Effects – Parameter Estimates.
| Coefficient | Std.Err | T-stat | P-value | Lower CI | Upper CI | |
| Pay to advertise on the internet | 0.2754 | 0.0398 | 6.9135 | 0.0000 | 0.1969 | 0.3538 |
| Use social networks (e.g. Facebook, LinkedIn, Xing, Viadeo, Yammer, etc.) | 0.0793 | 0.0248 | 3.1938 | 0.0016 | 0.0304 | 0.1283 |
| Use enterprise's blog or microblogs (e.g. Twitter, Present.ly, etc.) | 0.1177 | 0.1248 | 0.9435 | 0.3464 | -0.1281 | 0.3635 |
| Data Use multimedia content sharing websites (e.g. YouTube, Flickr, Picasa, SlideShare, etc`.) | 0.0174 | 0.0111 | 1.5670 | 0.1184 | -0.0045 | 0.0392 |
Source: own calculations
Table 4.
Fixed Effects – Parameter Estimates.
| Coefficient | Std.Err | T-stat | P-value | 95% CI Lower | 95% CI Upper | |
| const | 7.2915 | 2.3578 | 3.0925 | 0.0023 | 2.6437 | 11.9393 |
| Pay to advertise on the internet | 0.1583 | 0.067 | 2.3621 | 0.0191 | 0.0262 | 0.2905 |
| Use social networks (e.g. Facebook, LinkedIn, Xing, Viadeo, Yammer, etc.) | 0.0741 | 0.025 | 2.9595 | 0.0034 | 0.0247 | 0.1235 |
| Use enterprise's blog or microblogs (e.g. Twitter, Present.ly, etc.) | 0.039 | 0.0891 | 0.4377 | 0.6621 | -0.1367 | 0.2147 |
| Use multimedia content sharing websites (e.g. YouTube, Flickr, Picasa, SlideShare, etc`.) | 0.0151 | 0.0149 | 1.0128 | 0.3123 | -0.0143 | 0.0445 |
Source: own calculations
Table 5.
Robust standard errors – Parameter Estimates.
| Coefficient | Std.Err | T-stat | P-value | Lower CI | Upper CI | |
| Pay to advertise on the internet | 0.1125 | 0.0683 | 1.6474 | 0.1010 | -0.0221 | 0.2471 |
| Use social networks (e.g. Facebook, LinkedIn, Xing, Viadeo, Yammer, etc.) | 0.0060 | 0.0571 | 0.1060 | 0.9157 | -0.1065 | 0.1186 |
| Use enterprise's blog or microblogs (e.g. Twitter, Present.ly, etc.) | 0.0772 | 0.1257 | 0.6140 | 0.5399 | -0.1706 | 0.3250 |
| Use multimedia content sharing websites (e.g. YouTube, Flickr, Picasa, SlideShare, etc`.) | -0.0077 | 0.0104 | -0.7408 | 0.4597 | -0.0282 | 0.0128 |
Source: own calculations
Disclaimer/Publisher’s Note: The statements, opinions and data contained in all publications are solely those of the individual author(s) and contributor(s) and not of MDPI and/or the editor(s). MDPI and/or the editor(s) disclaim responsibility for any injury to people or property resulting from any ideas, methods, instructions or products referred to in the content. |
© 2025 by the authors. Licensee MDPI, Basel, Switzerland. This article is an open access article distributed under the terms and conditions of the Creative Commons Attribution (CC BY) license (http://creativecommons.org/licenses/by/4.0/).
Copyright: This open access article is published under a Creative Commons CC BY 4.0 license, which permit the free download, distribution, and reuse, provided that the author and preprint are cited in any reuse.


