1. Introduction
The exponential growth of e-commerce (electronic
commerce) in the digital age has revolutionized the retail industry and
business landscape [20]. By 2025, global
e-commerce sales are projected to surpass USD 7.4 trillion, nearly doubling
from 2020 levels, as reported by [12]. This
digital transformation has been accelerated by advancements in technology, the
widespread adoption of mobile devices, and shifts in consumer behavior toward
online platforms. E-commerce is also transforming the way firms operate. For
instance, by redefining inventory management, distribution, and customer
services, e-commerce is fostering new supply networks, services, and business
models. These have often been associated with efficiency improvements, better
asset utilization, faster delivery to market and consumers, and improved
customer service. Furthermore, e-commerce, social media, and visual
advertisements are changing consumer behaviour from offline to online shopping
and presenting them opportunity to purchase goods and services online. As competition
intensifies, companies must leverage digital indicators, website traffic, user
engagement, conversion rates, customer demographics, and purchasing behavior [13].
Website traffic in businesses has emerged as a
critical performance metric that reflects not only user engagement but also
potential revenue streams. For instance, a study of [5]
found that website traffic has a positive impact on total revenue. It is
recommended that e-commerce website operators actively develop traffic sources
such as Direct, Organic Search, Referral, and Paid Search. Additionally, using
Google Analytics 4 for further analysis of the relative impact of different
traffic sources on total revenue can provide valuable insights. Businesses with
high monthly website visits often see correspondingly high transaction rates,
especially when coupled with data-driven
marketing strategies. Businesses with high monthly
website visits often see correspondingly high transaction rates, especially
when coupled with data-driven marketing strategies. To align these marketing
strategies with CLV goals, organizations must have a deep understanding of
customer needs and preferences. By leveraging customer data, behavior
analytics, and segmentation techniques, organizations can identify customer
segments with high CLV potential and tailor marketing strategies accordingly [4]. It is crucial to ensure that marketing
initiatives focus not only on short-term transactions but also on cultivating
long-term relationships and customer loyalty [2].
Traffic is thus not merely a vanity metric; it can influence core financial
outcomes when integrated into a broader digital performance model.
However, while total revenue and market
capitalization have traditionally served as primary indicators of firm success,
newer metrics, such as earnings per visit and revenue per visit, offer a more
refined lens into operational efficiency. These indicators reveal how
effectively companies convert digital attention into economic value. However,
there remains limited empirical analysis linking these metrics directly to
traffic volume in the context of e-commerce, creating a need for further
investigation.
Current research on financial performance in
e-commerce tends to focus on either internal managerial strategies or external
market trends. For instance, [15] found that
e-commerce participation increases firm productivity by up to 30% and exports
by 50% in developing Asian economies. Similarly, [16]
highlight that while e-commerce can significantly improve financial
performance, its impact is often mediated by country-specific factors such as
market maturity and institutional readiness. Moreover, few studies have
holistically examined how online visibility, as measured by website traffic,
correlates with a range of financial indicators. For instance, [19] studied the revenue growth and number of
visitors to websites of banking establishments, indicating that sources of
revenue for banking establishments come from services provided through means
other than the main web platform.
Development status plays a significant role in
shaping a firm’s digital and financial landscape. Companies in developed
nations typically benefit from superior internet infrastructure, stable
economic conditions, and a larger digital customer base. In contrast, firms in
developing countries often face challenges such as limited digital adoption and
reduced consumer purchasing power. Several Studies highlighted that the biggest
challenge of adopting and using e-commerce in developing countries is infrastructural
barriers which include inadequate telecommunications, such as poor network
quality, internet speed quality and the cost of internet and bandwidth [11] affecting the adoption of e-commerce in
developing countries, making it difficult for organisations to survive in a
digital-based market [14]. These differences
suggest that development status may moderate the relationship between website
traffic and financial performance.
This study investigates the relationship between
website traffic and financial performance across leading e-commerce companies,
with specific attention to the moderating role of development status.
Additionally, this study controls for country development status to isolate and
interpret the relationships between variables more accurately. It also provides
a nuanced understanding of how digital engagement translates to profitability.
These insights will be valuable for investors. Digital marketers and policymakers
seeking to optimize digital strategies between companies in different economic
environments.
1.1. Rationale
The rapid growth of e-commerce has transformed the
global economy, reshaping how businesses operate and how consumers purchase
goods and services. Website traffic has emerged as a critical metric in
assessing a company’s digital presence, reflecting consumer interest, brand
visibility, and potential market reach. At the same time, financial performance
remains the ultimate indicator of business success, encompassing profitability,
revenue growth, and market competitiveness. While it is widely assumed that higher
website traffic correlates with stronger financial outcomes, the relationship
may not be straightforward, particularly when accounting for differences in a
country’s development status. Emerging economies may face challenges in
monetizing online traffic due to infrastructure limitations, lower purchasing
power, or evolving digital ecosystems, whereas developed economies may benefit
from mature markets and established online consumer behaviors. Understanding
this dynamic is crucial for stakeholders, including investors, policymakers,
and e-commerce managers, as it offers insights into how digital engagement
translates into financial returns under different economic contexts. This study
seeks to bridge the gap in the literature by examining the relationship between
website traffic and financial performance while distinguishing patterns based
on development status.
1.2. Problem Statement
Despite the recognized importance of online
engagement in driving business outcomes, there is limited empirical research
that examines how website traffic relates to financial performance in the
e-commerce sector, especially when comparing companies across developed and
developing economies. Existing studies often focus on single-market contexts or
treat e-commerce performance as uniform across regions, overlooking the
potential influence of development status on this relationship. This lack of
comparative analysis leaves a critical gap in understanding whether high
website traffic universally leads to improved financial outcomes or if its
impact varies depending on economic maturity. Consequently, e-commerce
stakeholders risk applying generalized strategies that may not align with the
market realities of their operational environment. Addressing this gap is
essential to provide evidence-based guidance for optimizing digital strategies
and achieving sustainable growth across diverse economic contexts.
1.3. Hypothesis
Hypothesis 1:
H0 (Null): There is no significant correlation between website traffic and financial performance indicators (market cap, revenue, earnings, net margin, revenue per visit, and earnings per visit), controlling for country development.
H1 (Alternative): There is a significant positive correlation between website traffic and financial performance indicators, controlling for country development.
Hypothesis 2:
H0 (Null): The correlation between website traffic and financial performance does not differ between developed and developing countries.
H1 (Alternative): The correlation between website traffic and financial performance differs significantly between developed and developing countries.
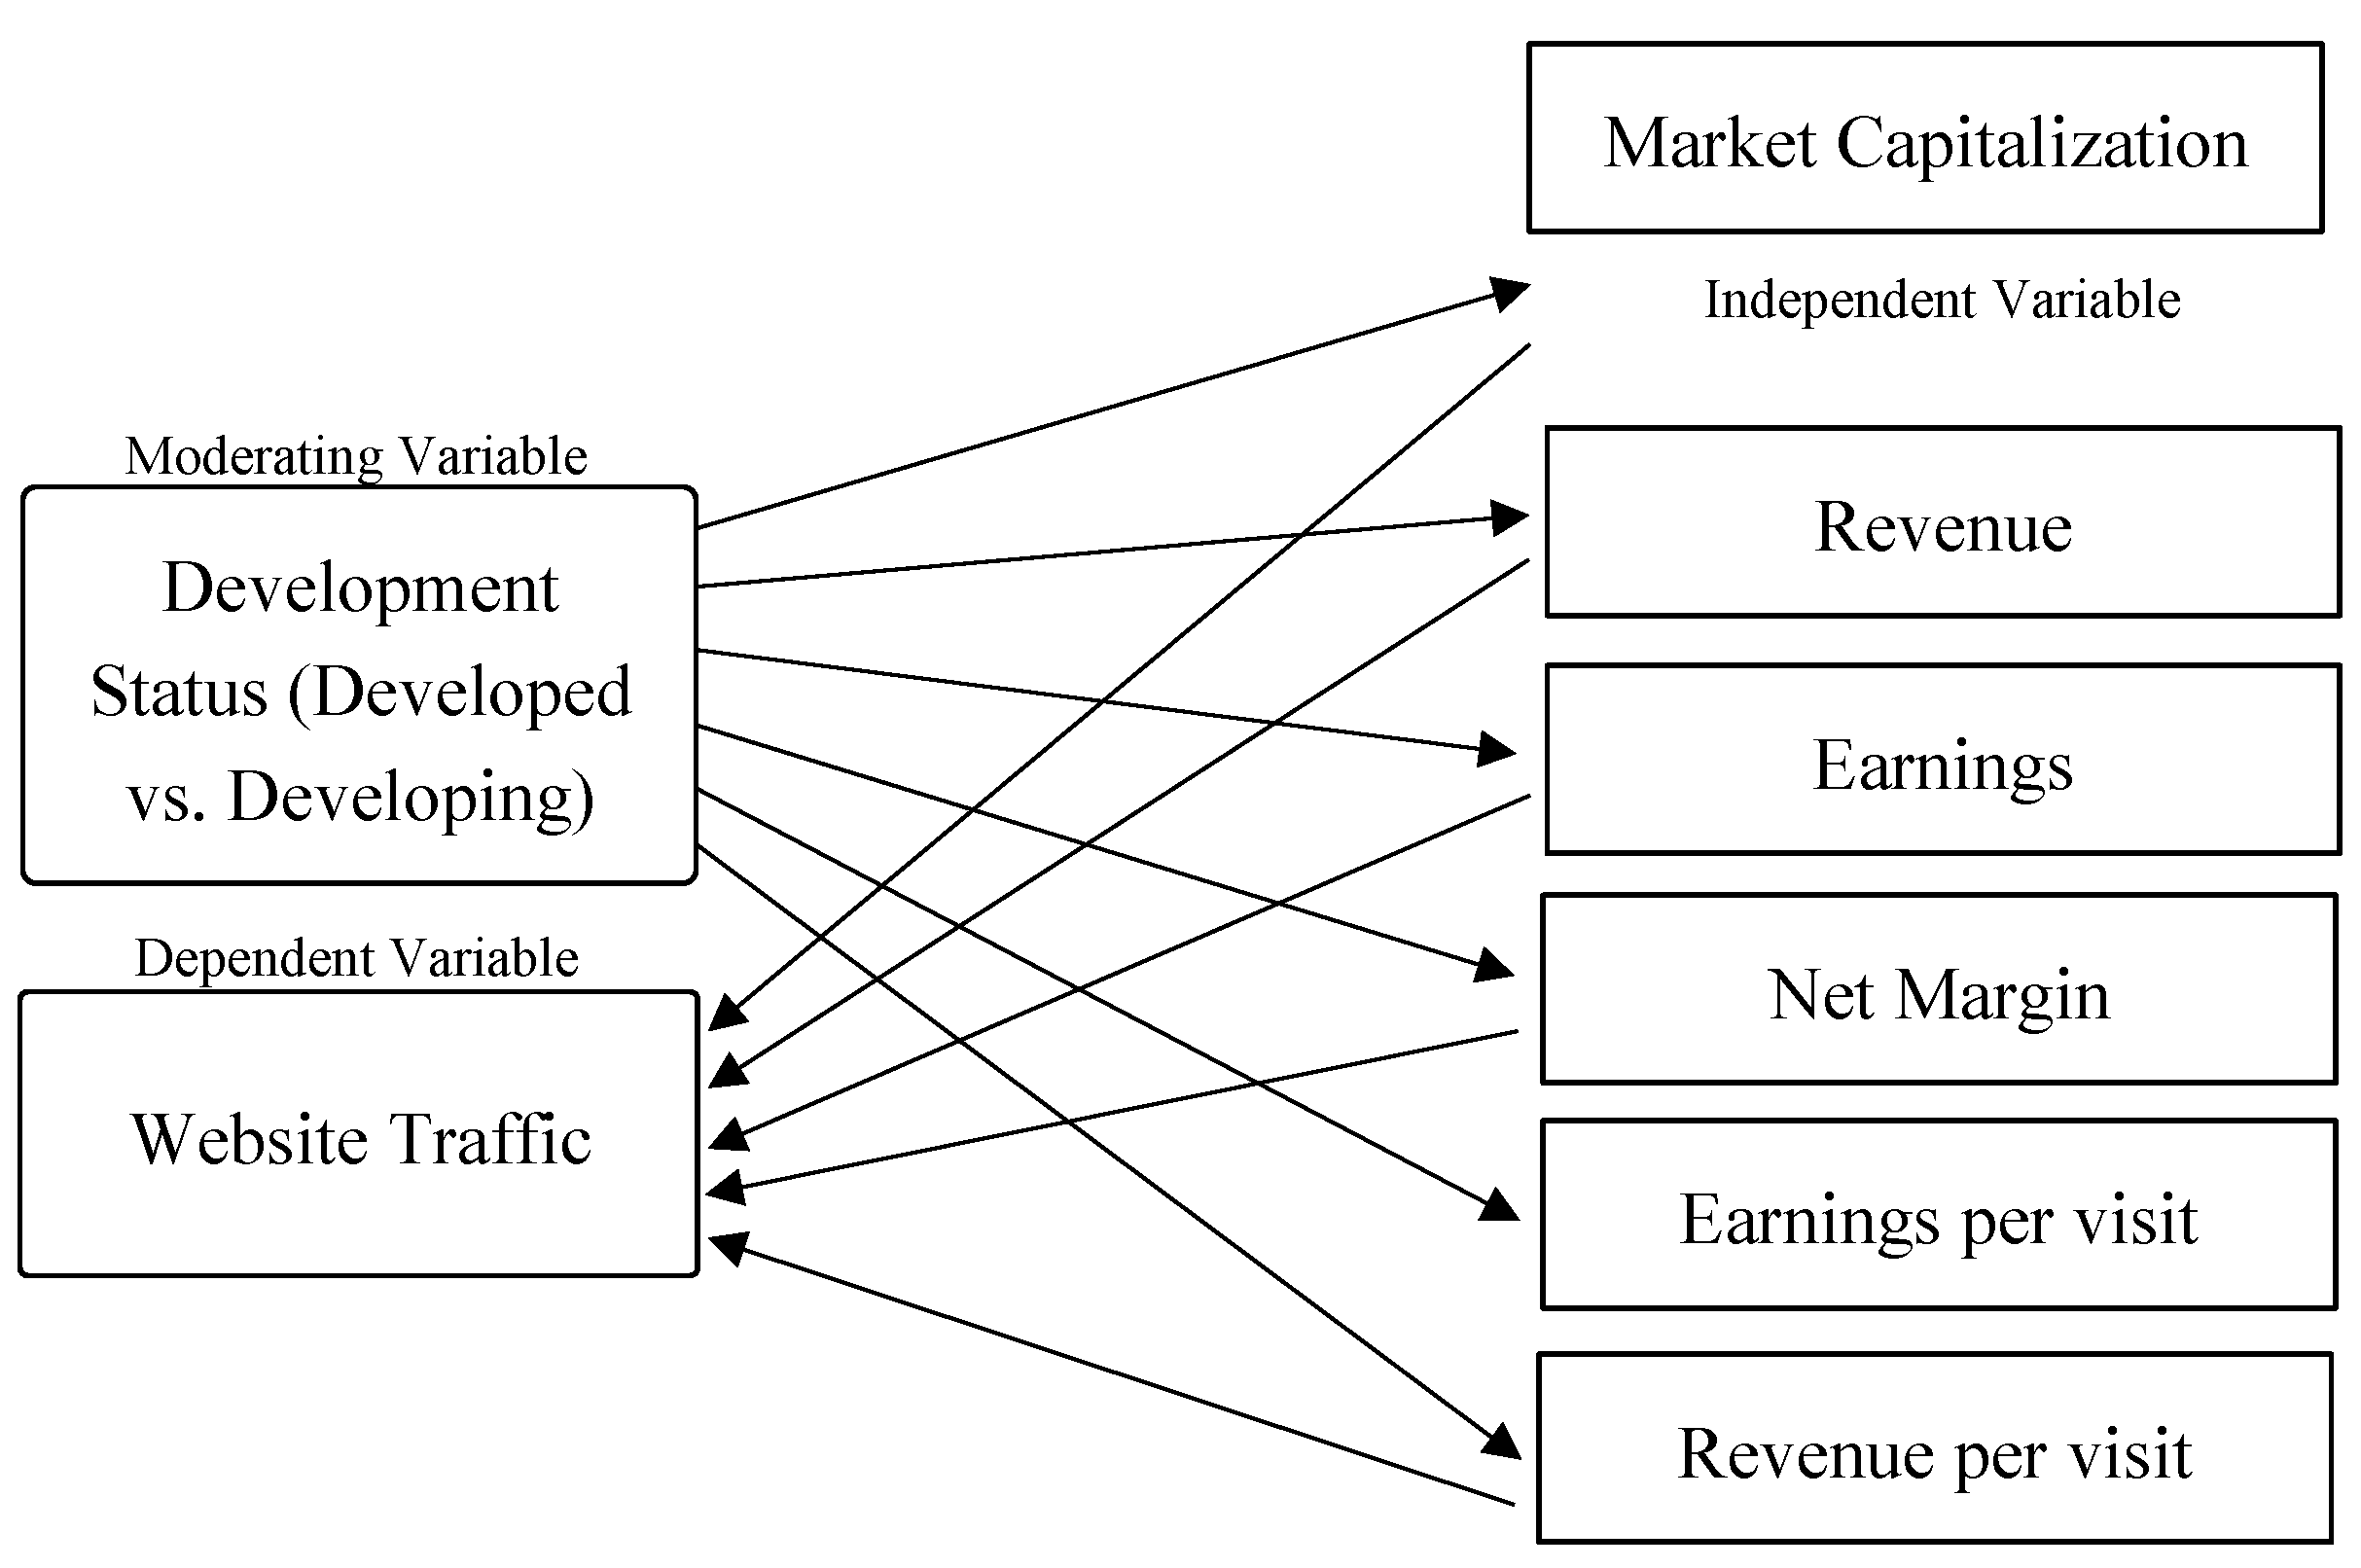
1.4. Conceptual Framework
The dependent variable in this study is website
traffic, while the independent variables are market capitalization, revenue,
earnings, net margin, earnings per visit, and revenue per visit. Development
status (developing vs. developed) serves as a moderating variable affecting the
strength or direction of the relationships between independent variables and
the dependent variables. This study aims to assess the influence of the
selected financial performance indicators in relation to the economic status of
the country among leading e-commerce companies (
Figure
1).
2. Methodology
2.1. Data Collection
Data in this study were obtained from various
reputable online sources. Website traffic data were sourced from Semrush (
https://www.semrush.com/),
a recognized web analytics platform that provides visitor volumes and
engagement metrics using the website’s domain name. All website traffic figures
were recorded for June 2025 to maintain temporal consistency. On the other
hand, financial performance indicators including country, market
capitalization, revenue, earnings, were retrieved from CompaniesMarketCap.com (
https://companiesmarketcap.com/e-commerce/largest-e-commerce-companies-by-market-cap/),
a publicly accessible database that compiles financial performance information
on the largest e-commerce companies worldwide. The reporting period for
financial indicators varied by company, with some data reflecting fiscal year
2024 and others fiscal year 2025, depending on the most recent information
available at the time of collection. To obtain the net margin, revenue per
visist, and earnings per visit, the following formula were used. Net Margin was
calculated as:
Revenue per visit was calculated as:
Earnings per visit was calculated as:
Only companies with complete and consistent data
across both sources were included in the analysis to ensure comparability and
accuracy.
2.2. Statistical Analysis
This study employed a correlational research design
to examine the relationships between website traffic and selected financial
performance indicators such as market capitalization, revenue, earnings, net
margin, revenue per visit, and earnings per visit. Descriptive statistics,
including means and standard deviations, were computed to summarize the
variables. In addition, Partial Spearman’s rank-order correlation () was used to assess the strength and direction of
the monotonic relationship
between website traffic and each financial
performance indicator while controlling for development status (developed vs.
developing). A spearman correlation matrix was also used to determine
differences.
Spearman’s correlation was chosen because variables
were not normally distributed, as checked by the histogram, and the method is
suitable for ordinal or non-parametric data. Statistical significance was set
at , and all analyses were conducted using JAMOVI
software version 2.6.17.
3. Results
3.1. Descriptive Statistics
Descriptive statistics for website performance and
financial metrics were computed separately for companies in developed and
developing countries (
Table 1). For
website visits in June 2025, developed countries (n = 38) averaged 181 million
visits (SD = 440 million), whereas developing countries (n = 12) averaged 26.6
million visits (SD = 34.5 million). Conversely, market capitalization was
higher for developed countries (M =
$125 billion, SD =
$406 billion) than for
developing countries (M =
$53.9 billion, SD =
$91.6 billion). The Average
revenue was also greater in developed countries (M =
$55.9 billion, SD =
$155
billion) compared to developing countries (M =
$34.5 billion, SD =
$57.5
billion). In terms of earnings, developing countries reported a higher mean (M
=
$12.1 billion, SD =
$25.5 billion) than developed countries (M =
$4.11
billion, SD =
$13.9 billion). The net margin was negative on average for
developed countries (M = −1.93%, SD = 30.60), but highly positive for
developing countries (M = 4,675%, SD = 16,191%). Revenue per visit was higher
in developed countries (M =
$20,657, SD =
$115,623) compared to developing
countries (M =
$3,043, SD =
$6,031). Similarly, earnings per visit were greater
for developed countries (M =
$1,915, SD =
$11,150) than for developing
countries (M =
$892, SD =
$559).
3.2. Relationship Between Website Traffic and Financial Performance Indicators (Market Cap, Revenue, Earnings, Net Margin, Revenue Per Visit, and Earnings Per Visit), Controlling for Country Development
A Spearman’s rho partial correlation analysis was
conducted to examine the associations among website visits, market
capitalization, revenue, earnings, net margin, revenue per visit, and earnings
per visit, while controlling for country category (
Table 2). Based on the data gathered (n=50),
there is a strong positive relationship (
ρ = 0.634, p < .001) between
website visits and market capitalization, suggesting that firms with higher
traffic tend to have greater market value. This relationship is highly
significant. Market capitalization, or market cap, is the current market value
of all of a company’s outstanding stock shares. Market cap is often used to
indicate a company’s size and worth in comparison to its peers [6].
Similarly, website visits show a strong positive
correlation with revenue (ρ = 0.590, p < .001), earnings (ρ =
0.602, p < .001), and net margin (ρ = 0.574, p < .001),
implying that increased website traffic is associated with higher financial
performance in terms of sales, profits, and profitability ratios. A study by [8] found that traffic affects the sales volume of
an e-commerce platform. Web traffic data is correlated not only with online
sales but also with total sales and net income of the entire company. The
correlation between traffic data and business performance data may also apply
to traditional companies as well as revenue growth is also significantly
correlated with contemporaneous growth in web traffic. Moreover, the study of [7] states that website traffic sources are often
associated with higher purchase intent, which in turn leads to higher sales and
earnings, as they usually yield consumers who have already familiarized
themselves with the brand.
A moderate positive relationship was also found
between website visits and earnings per visit (ρ = 0.337, p = .018),
which is statistically significant at the 5% level. However, website visits and
revenue per visit exhibit a weak negative and non-significant correlation (ρ
= –0.118, p = .420), suggesting no meaningful association. Market
capitalization displays a very strong positive correlation with revenue (ρ =
0.850, p < .001). This is supported by the study of [17], which found that there was a significant
positive relationship between revenue and market capitalization in 2017. This
suggests that revenue may be used as the main variable in the valuation of
companies using platform business models.
Earnings (ρ = 0.731, p < .001) and
earnings per visit (ρ = 0.631, p < .001) also demonstrate a moderate
to high positive relationship, indicating that larger firms in terms of market
value tend to generate higher revenues and earnings while also converting
traffic into per-visit profitability, significant values of the relationship
further validated that the relationship is real and not due to random chance.
Study of [1] states that dividends and net
income after taxes (a key earnings measure) have a positive relationship with
market capitalization, while earnings per share show no significant
correlation.
Market capitalization also positively correlated
with net margin (ρ = 0.585, p < .001) and revenue per visit (ρ =
0.456, p < .001), highlighting the overall financial strength of firms
with higher valuations. For instance, findings showed that the frequency of
website visits significantly affects the financial performance measures of
banks, such as return on assets (ROA), return on equity (ROE), market value
(Tobin’s Q), net interest margin (NIM), and return on investment (ROI). In
addition, the ESG performance of banks attracts more website visitors and
enhances them with the idea of dealing with banks that enhance financial performance.
The findings indicate that banking websites as a tool for public relations
attract visitors and thus turn them into customers by changing the behavioural
intention of individuals, which affects their decisions to engage in banking
transactions and thus raises the level of financial performance of banks [3].
Revenue is strongly associated with earnings (ρ
= 0.694, p < .001), net margin (ρ = 0.480, p < .001), revenue
per visit (ρ = 0.662, p < .001), and earnings per visit (ρ =
0.693, p < .001), all highly significant, suggesting that increased
sales revenue consistently translates into higher profitability measures.
Similarly, earnings show a very strong positive correlation with net margin (ρ
= 0.834, p < .001) and earnings per visit (ρ = 0.878, p < .001),
while its association with revenue per visit is positive but not significant (ρ
= 0.269, p = .062). The study of [9] shows
that with respect to earnings quality, firms with revenue-supported increases
in earnings have more persistent earnings, exhibit less susceptibility to
earnings management, and have higher future operating performance. With respect
to response coefficients, firms with revenue-supported increases in earnings
have both higher ERCs and lower book value response coefficients. On the other
hand, [10] findings state that business size,
debt-to-equity ratio, and revenue growth significantly affect the net profit
margin of SMEs, guiding better financial management.
Net margin is highly correlated with earnings per
visit (ρ = 0.767, p < .001) but unrelated to revenue per visit (ρ
= 0.016, p = .912), implying that profitability margins are more influenced
by how traffic converts into earnings rather than revenue alone. Findings of [18] found that: 1) The t value of the net profit
margin of 5.378 is greater than the t table of 2.00665 and the significant
value of 0.000 is less than 0.05, it can be concluded that the net profit
margin has a significant effect on stock prices; 2) It is obtained that the t
value of earning per share is 3.349 which is greater than the t table of
2.00665 and a significant value of 0.002 is less than 0.05, so it can be
concluded that earning per share has a significant effect on stock prices.
Finally, revenue per visit is moderately associated with earnings per visit (ρ
= 0.472, p < .001), suggesting that efficiency measures at the per-visit
level tend to move together. Further studies are necessary to obtain more
reliable and robust results.
3.3. Correlation Differences Between Website Traffic and Financial Performance Among Developed and Developing Countries
A series of Spearman’s rank-order correlations were conducted to examine the relationships between website visits and financial performance indicators (market capitalization, revenue, earnings, net margin, revenue per visit, and earnings per visit) for developed and developing countries separately.
Table 3 presents the results for developed and developing countries.
For developed countries (n = 38), website visits were significantly and positively correlated with market capitalization (ρ = .644, p < .001), revenue (ρ = .622, p < .001), earnings (ρ = .573, p < .001), and net margin (ρ = .564, p < .001). However, website visits were not significantly correlated with revenue per visit (ρ = –.164, p = .323) or earnings per visit (ρ = .313, p = .056). Strong positive correlations were also observed between market capitalization and revenue (ρ = .836, p < .001), market capitalization and earnings (ρ = .762, p < .001), and earnings and earnings per visit (ρ = .888, p < .001).
For developing countries (n = 12), website visits were significantly and positively correlated with market capitalization (ρ = .622, p = .035), earnings (ρ = .776, p = .005), and net margin (ρ = .657, p = .024), but not with revenue (ρ = .566, p = .059), revenue per visit (ρ = .021, p = .956), or earnings per visit (ρ = .371, p = .237). As in developed countries, market capitalization was strongly correlated with revenue (ρ = .874, p < .001). Notably, revenue was strongly associated with revenue per visit in developing countries (ρ = .797, p = .003), whereas this relationship was weaker in developed countries (ρ = .596, p < .001). Earnings were also strongly associated with net margin (ρ = .846, p < .001) and earnings per visit (ρ = .804, p = .003).
Overall, the results indicate that in developed countries, website traffic is broadly and consistently associated with financial outcomes, especially market capitalization, revenue, and earnings. In contrast, in developing countries, website visits have a weaker association with revenue but a stronger link to earnings and profitability efficiency measures, suggesting that traffic translates into profit more selectively in less mature markets.
4. Discussion
The present study examined the relationship between website traffic and financial performance indicators among leading e-commerce companies, controlling for country category. The study also investigates the correlation differences between developing and developed countries. Developed countries in this study include the United States of America, Japan, South Korea, Germany, Sweden, Australia, the United Kingdom, Poland, France, Singapore, and Israel. On the other hand, developing countries include China, Malaysia, India, Brazil, Argentina, Chile and Africa.
The findings demonstrate that website visits are broadly and consistently correlated with financial performance in developed economies, whereas in developing economies, the associations are fewer but in some cases stronger, particularly between traffic and earnings. This suggests that in mature markets, website traffic translates into a wide range of financial outcomes, while in emerging markets, its effects are more selective, emphasizing profitability efficiency rather than revenue expansion.
In developed countries, website visits were strongly associated with market capitalization, revenue, and earnings, highlighting the systemic role of digital engagement in sustaining market value and sales growth. These findings are consistent with prior studies that argue digital presence and consumer visibility are integral to revenue streams and firm valuation (Chen et al., 2022; Gao, 2023). Conversely, in developing countries, the correlation between website visits and revenue was not statistically significant, suggesting that high traffic does not consistently translate into sales. Instead, website visits were more strongly tied to earnings and net margin, implying that firms operating in these contexts rely on more efficient conversion mechanisms to translate digital engagement into profitability.
The stronger association between revenue and revenue per visit in developing countries compared to developed countries suggests that emerging market firms may extract greater efficiency from each website visitor. This finding underscores the adaptive strategies of firms in resource-constrained environments, where digital engagement must be carefully leveraged to yield tangible financial returns. At the same time, the lack of consistent significant relationships across multiple financial indicators in developing countries reflects infrastructural and market limitations, echoing previous research that emphasized the challenges of digital adoption in less mature economies (Noor et al., 2023; Hendricks et al., 2024).
Despite providing important insights, this study has several limitations. First, the analysis was limited to a sample of 50 e-commerce companies with complete data, which may restrict the generalizability of results across the broader global market. Second, financial indicators were sourced from different fiscal periods (2024 and 2025), which may introduce minor inconsistencies in cross-company comparisons. Third, correlation analysis cannot establish causality, meaning that while website traffic is associated with financial performance, it cannot be concluded that traffic directly drives financial outcomes. Fourth, the study focused only on website traffic volumes and did not include engagement metrics such as bounce rate, session duration, or conversion rates, which may also shape financial performance. Finally, the sample size disparity between developed (n=38) and developing (n=12) countries limits statistical power for cross-group comparisons, and results should therefore be interpreted with caution. Future studies should expand the dataset to include more firms from diverse regions, integrate time-series data to capture changes over time, and employ advanced econometric models (e.g., regression or structural equation modeling) to test causality. Including additional digital metrics would also provide a more nuanced picture of how online engagement translates into financial performance.
5. Conclusions
This study contributes to the understanding of how website traffic relates to financial performance in the global e-commerce industry, highlighting differences between developed and developing economies. In developed countries, website visits are consistently linked to key financial indicators, particularly market capitalization, revenue, and earnings, reinforcing the importance of digital engagement in driving financial success. In contrast, in developing countries, website visits show weaker associations with revenue but stronger ties to earnings and profitability efficiency, indicating that traffic conversion into profit is more selective in emerging markets.
These findings have practical implications for e-commerce stakeholders. Firms in developed economies should continue to expand digital engagement strategies as traffic is broadly associated with financial growth. Meanwhile, firms in developing economies may benefit from focusing on improving conversion efficiency, ensuring that limited traffic is effectively monetized. For policymakers, strengthening digital infrastructure and consumer adoption in developing countries may help firms translate traffic into sustainable revenue growth.
In conclusion, website traffic is an important but context-dependent indicator of financial performance. Its value is more comprehensive in developed economies but more strategically significant in developing economies, where profitability hinges on efficient traffic conversion.
Supplementary Materials
The following supporting information can be downloaded at the website of this paper posted on Preprints.org.
Data Availability Statement
The data that support the findings of this study are confidential and are not publicly available due to privacy restrictions. Access to the dataset may be granted upon reasonable requests and with permission from the corresponding data owner.
Acknowledgments
The author thanks the reviewers for their comments, which helped to improve the presentation of this manuscript
Conflicts of Interest
The author declares no conflict of interest associated in this study.
References
- Alawneh, A. (2018). Dividends, net income after taxes and earnings per share and their impact on the market capitalization of listed companies Amman Stock Exchange during the period 1978-2016. International Journal of Economics and Finance, 10(10), 69. [CrossRef]
- Ali, N. , & Shabn, O. S. (2024). Customer lifetime value (CLV) insights for strategic marketing success and its impact on organizational financial performance. Cogent Business & Management, 11(1). [CrossRef]
- Amosh, H. A. , & Khatib, S. F. A. (2022). Websites visits and financial performance for GCC Banks: The moderating role of environmental, social and governance performance. Global Business Review. [CrossRef]
- Berger, P. D. , & Nasr, N. I. (2021). Customer lifetime value: Marketing models and applications. Journal of Interactive Marketing, 12(1), 17–30. [CrossRef]
- Chen, C. P. T. C., Cho, T. S., & Chen, S. L. (2020, June 25). Traffic analysis of e-commerce websites: Exploring the mediating effect of consumer behavior. International Journal of Organizational Innovation. Available online: https://www.ijoi-online.org/index.php/current-issue/522-traffic-analysis-of-e-commerce-websites-exploring-the-mediating-effect-of-consumer-behavior.
- Fernando, J. , Silberstein, S., & Rathburn, P. (2025). Market capitalization: What it means for investors. Investopedia. https://www.investopedia.com/terms/m/marketcapitalization.
- Filippou, G. , Georgiadis, A. G., & Jha, A. K. (2023). Establishing the link: Does web traffic from various marketing channels influence direct traffic source purchases? Marketing Letters, 35(1), 59–71. [CrossRef]
- Gao, Y. (2023). Study of the relationship between traffic and sales on e-commerce platforms based on QCA approach. Frontiers in Economics and Management, 4(3), 45–59. [CrossRef]
- Ghosh, A. , Gu, Z., & Jain, P. C. (2004). Sustained earnings and revenue growth, earnings quality, and earnings response coefficients. SSRN Electronic Journal. [CrossRef]
- Gunanto, A. , & Preda, L. (2023). Financial harmony in diversity: Exploring the dynamics of SMEs' finance through the lens of business size, debt-to-equity ratio, and revenue growth toward the perfection of net profit margin. SAR Journal - Science and Research. [CrossRef]
- Hendricks, S. , & Mwapwele, S. D. (2023). A systematic literature review on the factors influencing e-commerce adoption in developing countries. Data and Information Management, 8(1), 100045. [CrossRef]
- Howart, J. (2025). 79+ brand new e-commerce statistics for 2025. Exploding Topics. https://explodingtopics.
- Kanellos, N. , Karountzos, P., Giannakopoulos, N. T., Terzi, M. C., & Sakas, D. P. (2024). Digital marketing strategies and profitability in the agri-food industry: Resource efficiency and value chains. Sustainability, 16(14), 5889. [CrossRef]
- Kiel, D. , Müller, J. M., Arnold, C., & Voigt, K. (2017). Sustainable industrial value creation: Benefits and challenges of Industry 4.0. International Journal of Innovation Management, 21(08), 1740015. [CrossRef]
- Kinda, T. (2019). E-commerce as a potential new engine for growth in Asia. IMF Working Paper, 19(135), 1. [CrossRef]
- Noor, L. S. , Deriawan, D., & Oktrivina, A. (2023). E-commerce and financial performance: Identification on trends, benefits and challenges. ATESTASI Jurnal Ilmiah Akuntansi, 6(1), 528–543. [CrossRef]
- Pomykalski, P. (2019). Revenue and valuation of companies with digital platform business models. Management Sciences, 24(1), 11–18. [CrossRef]
- Ramadhan, A. , & Nuraliati, A. (2020). The effect of net profit margin and earning per share on share prices. Almana: Jurnal Manajemen dan Bisnis, 4(3), 420–430. [CrossRef]
- Rincón, J. S. R. R. , Tarazona, A. R. R. R., Martínez, A. M. M. M., & Acosta-Prado, J. C. (2022). Positioning and web traffic of Colombian banking establishments. Journal of Theoretical and Applied Electronic Commerce Research, 17(4), 1473–1492. [CrossRef]
- Zhan, Y. (2024). E-commerce: The evolution of retail in the digital age [Opinion article]. Business Studies Journal, 16(2), 1–2. https://www.abacademies.org/articles/ecommerce-the-evolution-of-retail-in-the-digital-age-17343.
|
Disclaimer/Publisher’s Note: The statements, opinions and data contained in all publications are solely those of the individual author(s) and contributor(s) and not of MDPI and/or the editor(s). MDPI and/or the editor(s) disclaim responsibility for any injury to people or property resulting from any ideas, methods, instructions or products referred to in the content. |
© 2025 by the authors. Licensee MDPI, Basel, Switzerland. This article is an open access article distributed under the terms and conditions of the Creative Commons Attribution (CC BY) license (http://creativecommons.org/licenses/by/4.0/).