
Submitted:
30 May 2025
Posted:
30 May 2025
You are already at the latest version
Abstract
As the terrestrial realms of the Arctic thaw with climate change, relative southern vector organisms such as ticks and mosquitoes may respond to the resulting landscape transitions by migrating northwards and transmit infectious diseases onto humans and animals of the far North. Expanding climate sensitive infections (CSI’s) constitute a serious global threat. To identify CSI’s, data concerning a selection of human and animal infections were procured from national health reporting systems to cover the current thirty-year climate reference period from western Greenland to the pacific coast of Russia, from approximately 55 to 80 degrees north. The diseases chosen to represent different transmission processes, as via vectors or via water, air, and soil, were borreliosis, brucellosis, cryptosporidiosis, leptospirosis, Puumala haemorrhagic fever, Q-fever, tick-borne encephalitis, and tularaemia. Inferential results indicate that 88% of these infections are changing systematically with respect to incidence levels and/or geographic distribution, and that they therefore should be considered as being potentially climate sensitive. It may hence be concluded that many northern societies are due to potentially changing CSI exposure. In addition, for each of the selected infections, the geographic distribution of their respective thirty-year average incidences was used to define “diseases climates” for future reference. Incompatibles across national health reporting systems are constraining the possibilities to infer international epidemiological trends.
Keywords:
Climate-change effects
; Epidemiology
; Human infectious diseases
; The far North
1. Introduction
As the terrestrial realms of the far North thaw with climate change, relatively cold landscapes transform into warmer biomes (IPCC, 2000; 2014; 2018). The latest IPCC publications state that the warming is occurring up to three times faster in the Arctic as compared with other parts of the world, while other recent publications state the Arctic rate of warming to be as much as four times faster (IPCC, 2021; IPCC, 2022; Rantanen et al., 2022). With the Russian Arctic totally dominating the tundra biomes of the Eurasian continent, the Siberian CSI response to warming is essential in the wider Eurasian health context. In the study of holistically integrated health effects related to climate change, that encompasses the broader environment whereupon humans, animals and other organisms depend alike, the OneHealth approach has become a vital paradigm (WHO 1984; Asokan et al., 2013; Bonebrake et al., 2018; Abass et al., 2019).
With “warming” perceived as being a geographic translation of biomes along regional climate gradients, it may be anticipated that the organism populations that inhabit these biomes migrate with climate change. It has been found through meta-analyses that, on average, terrestrial taxa move pole-ward by 17 km per decade and marine taxa by 72 km per decade. Globally, terrestrial species on mountainsides are moving to higher latitudes and some fish towards deeper parts of the oceans (Chen et al., 2011; Sorte et al., 2010; Polozcanska et al., 2013). As novel organisms are introduced into new geographic areas, they may carry pathogens into recipient populations that are immunologically naive by terms of their ability to meet the associated infections. At least 70% of today’s emerging infections are zoonotic, e.g. introduced to humans by animals (Jones et al., 2008; Taylor et al., 2001). In addition, long-time buried pathogens may re-occur when uncovered by extreme events such as regional summer-thawing of permafrost, flooding, landslides, and other climate-related incidents (Alempic et al., 2023).
One particular group of migratory organisms, that hold a potential of severely threatening northern human infrastructures, are the vector and reservoir organisms that transmit infectious diseases, particularly if introduced into immunologically naïve populations. Examples of such organisms are the ticks, mosquitoes, and rodents that carry infectious diseases onto humans and their husbandry animals (US Institute of Medicine, 2008; Palmer et al., 2011; Waits et al., 2018). With many northern cultures being holistically dependent on the welfare of their husbandry animals, where the status of the family flock traditionally may represent their savings, inheritance, societal status, etc., climate-change effects with the potential of changing the exposure of husbandry animals towards infectious diseases may strike at the heart of northern cultures. With such effects adding to effects of direct human exposure (Sustainable Development Working Group 2017; 2017-2019), as well as to other types of climate-change effects such as having reindeer winter-pastures blocked by the icy snow-pack strata introduced with an increasing frequency of mid-winter thawing episodes (Riseth et al., 2011), the cumulative effects constitute the holistic approach to health called OneHealth (Evengård & McMichael, 2011; WHO, 2017; Mackenzie & Jeggo, 2019; Orlov et al., 2020; Andersen-Ranberg et al., 2024). The present study is devoted to inquiring into the OneHealth effects of a warming North.
2. Objectives
At the population scale, CSIs’ have a (temporally varying) mass, a density, and a geographic distribution. Since the probability of successfully defeating any CSI population basically is a function of its total population mass (Daley et al., 2005), the potential expansion of CSI populations is a climate-change effect of serious global concern. This particularly applies to Siberia, which is largely unobserved and capable of providing CSI expansion-territory enough for a red-alert global warning. Yet, there have been few broad compilations of diseases data made across national borders, particularly in the case of animal diseases (Omazic et al., 2019a). One reason for this is that empirical report systems, that have been an important part of national health strategies for centuries, differ substantially by design and administration when compared across nations. Although international homogenisation of national health report systems is promoted within the European Union (ECDC, 2008; European Commission Recommendation, 2019), the contrast with otherwise excellent Russian report systems (Malkhazova et al., 2017) is striking. These incompatibilities constrain the possibilities of overlooking the international CSI scenario, and of procuring empirically reported diseases data across nations. There is hence an urgent need for international standardisation of diseases report systems (Omazic et al., 2019b), in support of seamless administration across human and animal diseases data, and of repositories wherefrom such combined data may become internationally disseminated.
CSI OneHealth effects of the North are typically stratified with respect to factors such as gender, age, and societal status (AHDR, 2004; 2007; Rasmussen, 2009; Riseth et al., 2011). It is therefore difficult to perform meaningful OneHealth studies without having such factors present in the national diseases report systems. One particularly important aspect of incompatibilities across nations is therefore the inhomogeneity with which such factors are covered. As an example, they are generally absent in the important reporting of Siberian infectious diseases.
The objectives of this study are therefore:
- To provide an overview of how a selection of important infectious diseases have been geographically situated across the North, through the past 30-year climate reference period.
- To provide an overview of how a selection of important infectious diseases may have responded to climate-change across the North, through the past 30-year climate reference period.
- To identify potentially climate sensitive infections (CSI’s), based on a selection of important infectious diseases.
- To identify a robust inferential methodology that is capable of handling diseases data inhomogeneities across nations.
- To contribute with an incentive towards international homogenisation of human and animal diseases report systems.
3. Data and Methods
With standard “climate” most commonly being defined as a statistical summary of the current backlog of weather through a moving thirty-year reference period (WMO Climate Normals), this study presents the “climate” of northern infectious diseases as observed per 2018. The area covered with such a temporal window stretches from western Greenland to the Pacific coast of Russia, from approximately 55 to 80 degrees North. Through this vast geographic expanse, leaving out only Canada and Alaska from a true circumpolar coverage, basically “all” officially reported cases of the selected infectious diseases have been inventoried, collated, and depicted. The depictions include the average annual incidence of selected human diseases which are depicted with formal maps that summarize data through the climate reference period (Appendix 2: The geography of Northern infectious diseases), as well as with map-like year-by-year animations (www.clinf.org).
Based on the latter year-by-year approach, diseases populations may exhibit geographic trends through the temporal climate-window, which include the possibilities of either an expanding (+/-) and/or a translating diseases population. These geographic trends include the possibility for diseases populations adapted to cold biomes to face dilution or extinction if they migrate into a warming dead-end landscape (Oechel & Vourlitis, 2014). Additionally, whether or not any geographic trends are exhibited, infections may respond with changing population densities. Any of these population-scale climate-change effects may be perceived as taking place in a three-dimensional orthogonal space constituted by time (Year), latitude (Lat), and longitude (Long), wherein a generic incidence surface may be assumed to vary continuously (Figure 1a). With this surface linearly parameterised (Figure 1b), linear spatiotemporal incidence trends may be inferred with standard statistical methodologies.
If diseases populations are significantly responding to climate change, one natural question would concern the nature of the associated regulative mechanisms (such as changing weather and/or landscape characteristics). If these mechanisms change with climate-change, and if populations of infectious diseases respond to such climate-induced regulation, we define them as being climate sensitive (Climate Sensitive Infections – CSI’s). If they haven’t responded through the observed climate reference period, we rule them out from being CSI’s. Inferring the regulatory processes of the thus identified CSI’s will be left for another publication (Tronin et al., 2020; Ma et al., 2020: Leibovici et al., 2021; Ma et al., 2021), in the current study we stay with inferring the eventual linear geographic and/or incidence trends of a selection of potential CSI’s. These infections are observed in northern humans and chosen to represent different transmission processes as well as for their relevance for far-north societies (Omazic et al., 2019a).
3.1. Human Diseases
With most diseases included in this study being zoonotic, meaning that they are transmitted from animals to humans, and that they hence may occur in humans as well as in animals, the term “human CSI’s” indicate that the corresponding diseases have been observed in humans and reported via human diseases report systems. The selection of human diseases was based on panel discussions including 20 experts representing different fields of expertise, like veterinary and human medicine, animal science, virology, microbiology, and ecology (Omazic et al., 2019b). As a result, the following diseases were identified as being important potential human CSI’s: BOR = Borreliosis, BRU = Brucellosis, CRY = Cryptosporidiosis, LEP = Leptospirosis, PUU = Haemorrhagic fever with renal syndrome (Puumala virus infection), QFE = Q fever, TBE = Tick-borne encephalitis, and TUL = Tularaemia.
Human diseases data are reported case-by-case, either clinically or via laboratories, in written form or via digital report systems. This introduces a potential of overlap error since single cases of diseases may be reported twice, and since older written report systems may overlap with the implementation of digital dittos. In addition, diseases may have been obtained either within or outside (potentially far away) their associated reporting district, which introduces error since only the former type should be included in a count of incidences per report district. Much effort has been spent in reducing such sources of error to their minimum.
3.2. Spatial Resolution
The data covering human diseases are constituted by empirical observations concerning individual cases reported to authorities in the six nations of:
GRE = Greenland, ICE = Iceland, NOR = Norway, SWE = Sweden, FIN = Finland, RUS = Russia.
The national administration of reported diseases is managed per report district, where the report districts are constituted by counties everywhere except in Russia, where diseases mainly are reported per oblast, republic, or autonomous region. Hence, the smallest possible spatial resolution of the current human diseases data is “report district” – see Appendix 1 for a list of diseases report districts. In Greenland and Iceland, the entire nations constitute one report district, although confined to their respective coastal regions. In Greenland, human diseases are predominantly reported in the southern and western coastal regions.
3.3. Temporal Resolution
In the temporal domain, an attempt has been made to cover the 30-year climate reference period with human diseases data. This ambition has been more or less successful depending on national differences regarding the inclusion of different diseases in their respective lists of reportable diseases (diseases that should be reported by law). Consequently, the time-period covered by CLINF human diseases data varies with diseases and nations, in accordance with Table 1.
In this study, the temporal case-by-case resolution has been scaled up into annual cumulations of cases. When combined with the spatial scale of diseases reporting district, the resulting spatiotemporal scale becomes the number of annually cumulated cases per 100,000 report-district inhabitants, which defines “the incidences of human diseases” (Inc).
The above data have been procured and processed by the CLINF Nordic Centre of Excellence, which is devoted to inquiring “Climate-change effects on the epidemiology of infectious diseases and the associated impacts on Northern societies”. All CLINF data are shared via www.clinf.org.
3.4. The Geographic Distribution of Diseases
In order to provide an overview of how diseases have been geographically situated across the North through the past 30-year climate reference period, the average (arithmetic mean) annual incidences per diseases report district were calculated through the observed period of time. Since the arithmetic mean is robust with respect to the varying periods of time with which different disease have been reported, as illustrated in Table 1, it provides comparable values despite varying reporting periods. As a result, three maps were produced per disease, covering i) the entire study region from western Greenland to pacific Russia, ii) the European parts of the study region, and iii) the Scandinavian parts of the study region. With a total of eight diseases included in the study, each covered with three maps, a total of 24 maps were produced using ArcGIS software. These maps are provided in Appendix 2, but also at www.clinf.org. At the CLINF website, each of these maps is also provided as year-by-year animations. Since observed through the approximate 30-year climate reference period, it is suggested that these maps and map-like animations define “the Northern diseases climate” of the selected diseases.
3.5. The Climate-Change Response of Diseases
With a potential CSI population occupying a number of report districts at any given time (Year), a geographic translation and/or expansion of the population may be interpreted as if the selection of occupied report districts changes in the temporal domain. And with diseases report districts being identified by their respective geographic centroid longitudes and latitudes, the set of variables Inc, Year, Long, and Lat denote observed diseases incidences provided with their spatiotemporal positions (in WGS84). If the translation and/or expansion trend has a linear component, the hypothesis of a generically translating and/or expanding CSI population may hence be tested with regression equation 1:
Regression equation 1 may also be interpreted by terms of the third possible diseases response to climate change, i.e. a geographically stationary effect to the intensity with which diseases occur. This is just another way of expressing that a temporal effect remains independent of longitudinal and/or latitudinal position, which collapses equation 1 into equation 2:
As a result, regression equation 1 is fit for testing hypotheses regarding all the three possible climate-change effects on the populations of infectious diseases; a geographic translation and/or a geographic expansion and/or a geographically stationary change of intensity.
Regression equation 1 may be interpreted as if the continuous interaction between temporal and spatial positions is tested, which may be expanded into two separate terms of longitudinal and latitudinal spatiotemporal effects. If these interactions are statistically significant, the spatial position of Inc changes with Year (or vice versa), which concretely expresses the hypothesis that we wish to test. The sign of the associated regression coefficients β and δ (positive or negative) thereby reflects a trend in either Year or in Long/Lat, where Year definitively is increasing trough the observed period of time. Since this temporal propagation may mask eventual spatial trends, particularly if they are relatively weak, the safest way to determine the direction of significant spatial trends is by visualisation as illustrated in Figure 1. The interpretation of continuous regression interactions has been subject to some discussion, which can be followed in Aiken & West, 1991. However, since the observed incidence populations combine significant right-hand skewness with an abundance of zero incidences, all situated in the theoretical space of [0, ∞ [, a normal assumption fails to fit the expected incidence probability density distributions. Instead, the variable Inc (equation 1) was parameterised into four ordinal categories that were logarithmically fitted to each individual disease. With the number of incidence observations falling within each such category being considered to be a Poisson-distributed version of Inc, regression equation 1 turns into a log-linked Poisson regression model that is robustly capable of handling the rather non-normal characteristics of typical incidence distributions (equation 3). As a result, the below tests for linear geographic translation trends are presented with type 3 maximum likelihood statistics (Fitzmaurice et al., 2004).
With diseases mapped across three sub-regions of the study area “from Nuuk to Yakutsk”, testing for geographic translation requires a different spatial resolution. There are two main reasons for this; i) translation trends may have different directions in different climate zones, and ii) there exists a predetermined interest in inferring geographic CSI translation trends at national levels of diseases administration. In i), CSI populations do per definition respond to climate-change effects such as warming and transforming landscapes. Such warming is introduced along geographic climate gradients that are determined by many factors, such as balancing maritime and continental climates and the physical situation of mountain ranges, rather than pointing exclusively towards “the colder North”. In order to avoid testing across contradictory climate zones, testing for geographic translation trends requires a sample sub-selection per approximate climate zone. In ii), since diseases have been predominantly considered at national levels of administration through history, many administrations have had reason to ask themselves whether or not infections are systematically translating through the nation. Because of incompatibilities across national disease administrations, it has been difficult to ask the same question concerning the international scenario. With the dataset presented here, containing most of the officially registered human cases of selected diseases across several adjacent nations, both questions can be addressed (Figure 1). Nations are homogenously covered with data concerning human reportable diseases through the periods of time provided with Table 1. Since these periods are different in different nations, nations that are combined due to shared climate zones may be represented with more or less overlapping time-periods of national reporting.
In order to fulfil the criteria set by i), ii), as well as by eventual inhomogeneous reporting periods across and within nations, the following regions will be subject for CSI translation-trend testing: Norway, Sweden, Finland, European Russia, Asian Russia, Norway + Sweden, Sweden + Finland, Norway + Sweden + Finland, and Finland + European Russia. Whenever required, combined nations will be solely inferred across homogenously reported subsets of report-periods and years.
4. Results
General information regarding each of the chosen diseases is provided in Appendix 3.
4.1. Borreliosis
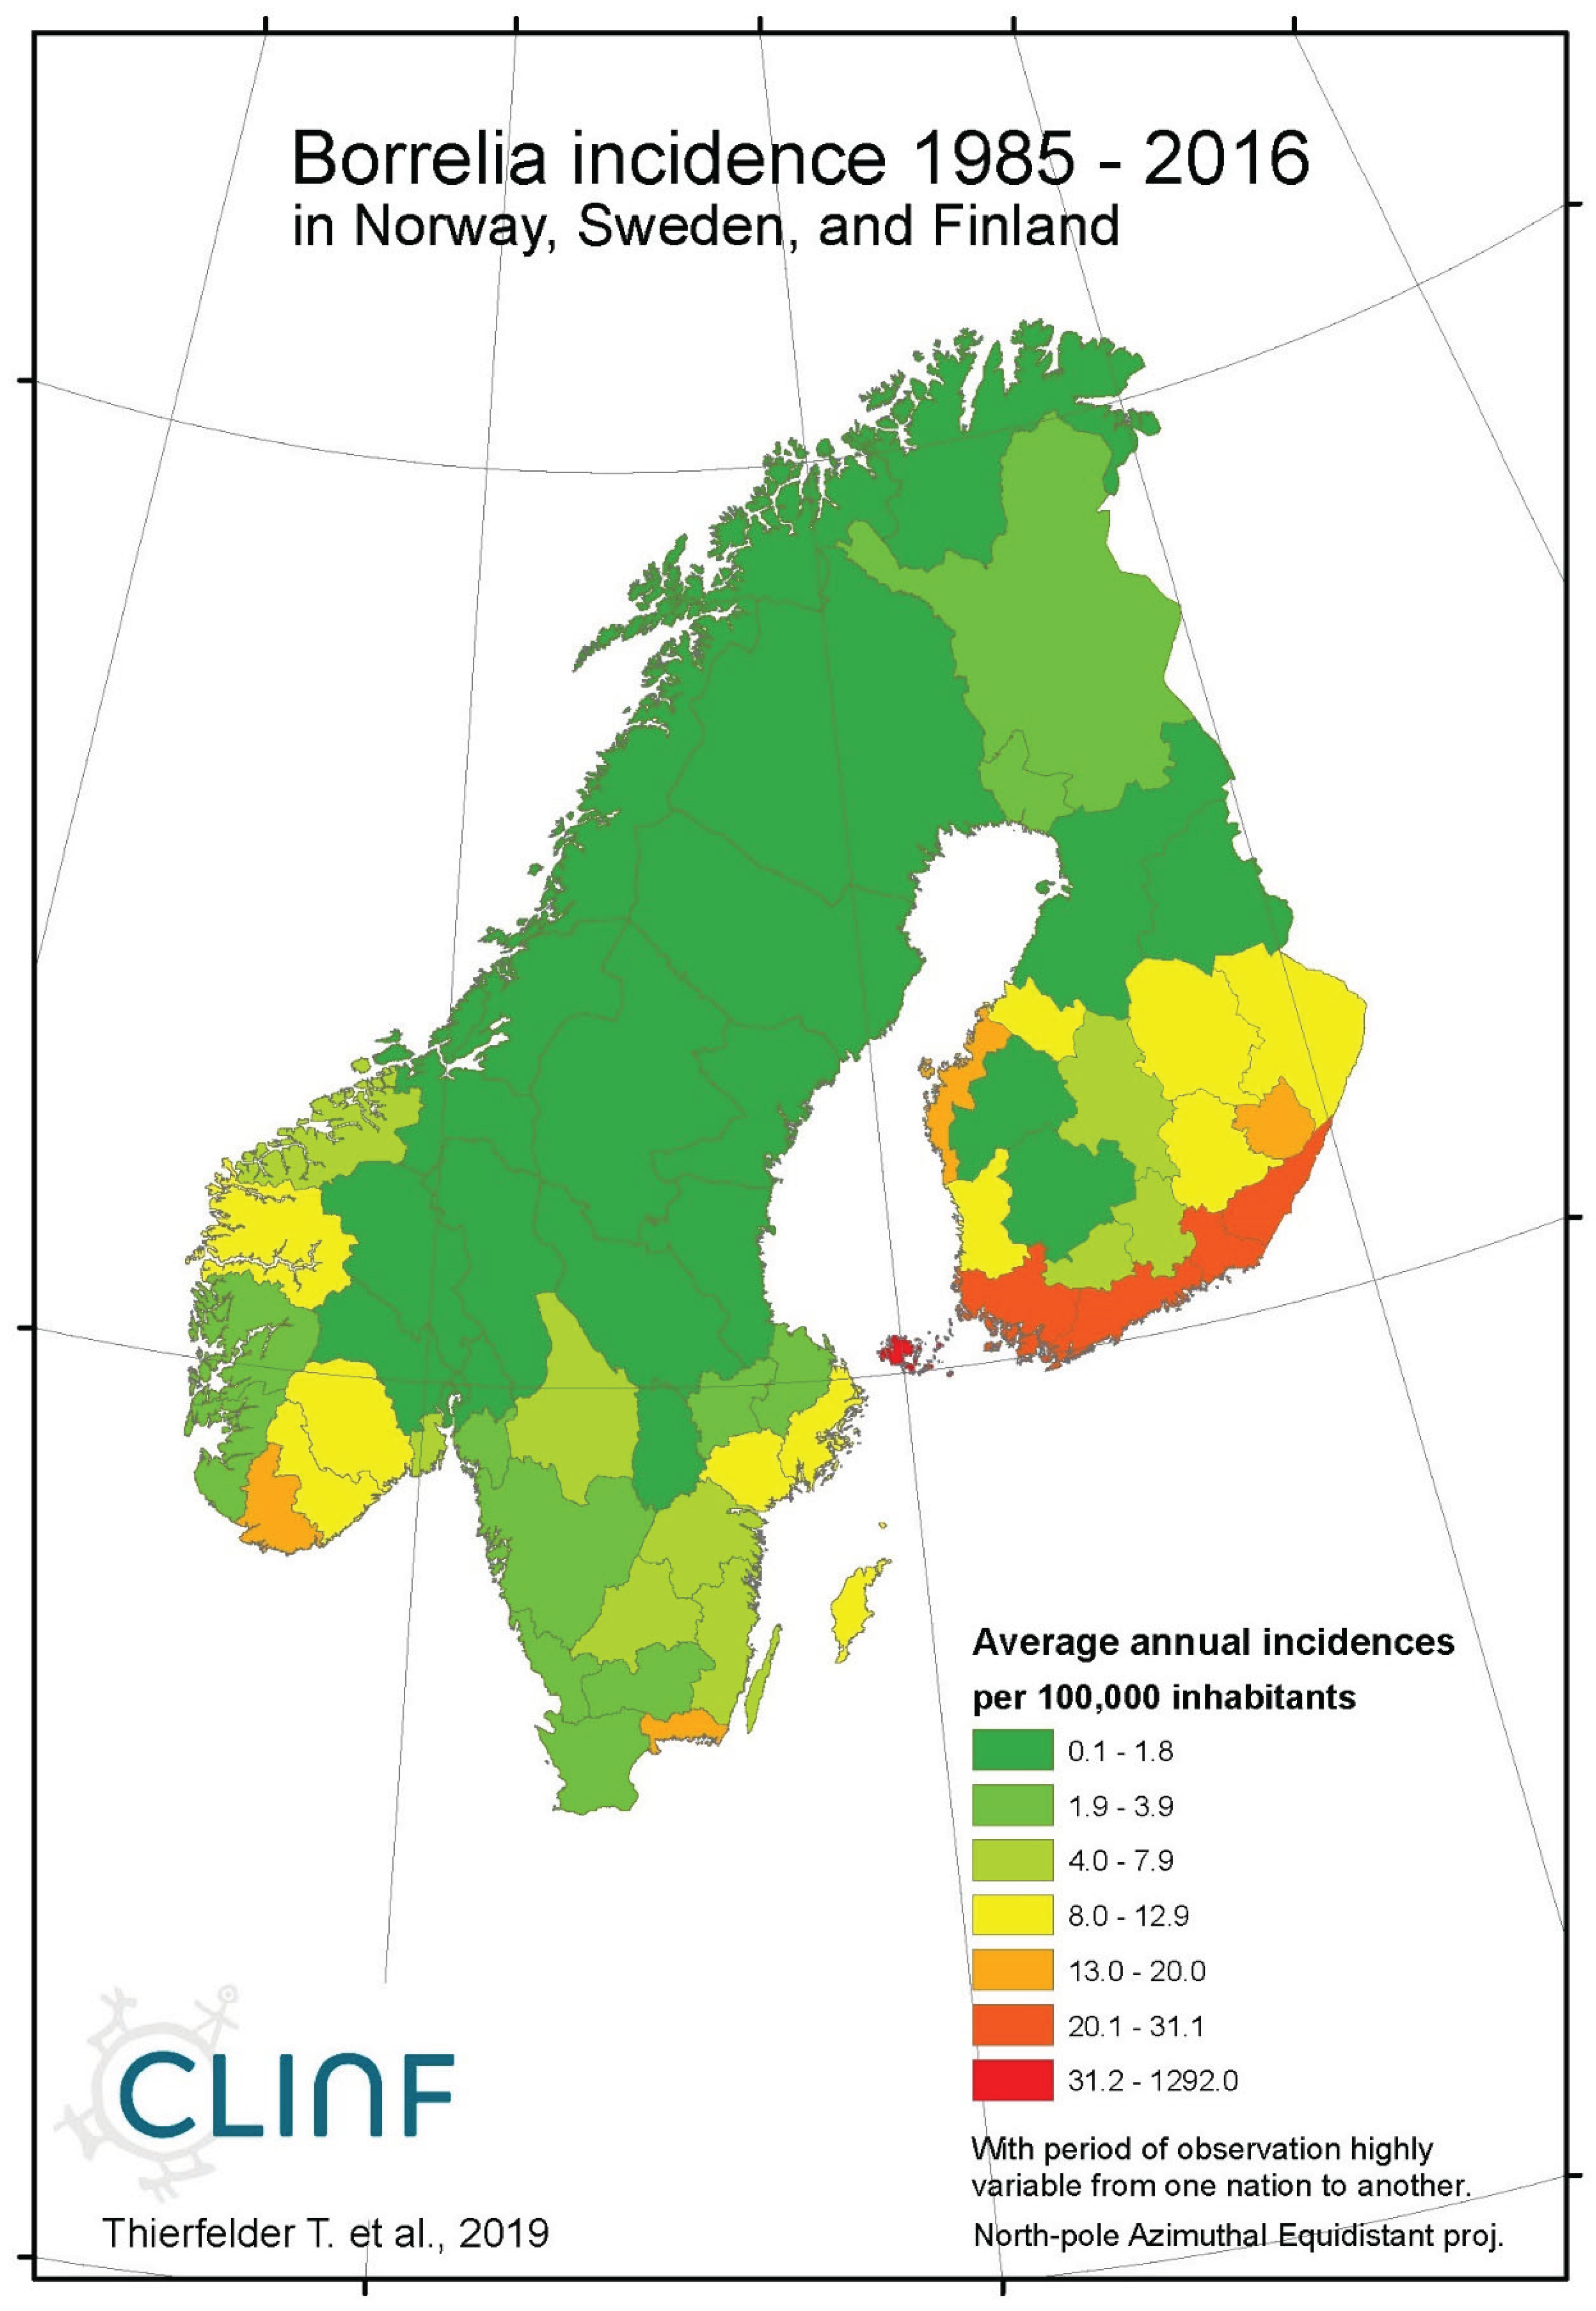
Borreliosis constitutes a classic reportable disease in most Northern nations, with the rather curious exception of Sweden. When depicted (Appendix 2), the average annual incidences therefore cover a relatively long period of time everywhere except in Sweden, where the disease was reportable only through the period of 1985 to 1994. In the Northern international perspective, borreliosis incidences demonstrate an exceptional maximum at the southwest Finnish archipelago of Ahvenanmaa (Aland), where the average incidence is 85 times higher than in the rest of the study region (289 and 3.4 respectively). These high incidences spill into the north-shore districts of the Gulf of Finland, and locally onto the shores of the nearby coasts of Sweden. In 2016, Ahvenanmaa reported a borreliosis incidence of 2098, which is another way of saying that 2.1 percent of the human population was infected this particular year. As a result of the extreme average Ahvenanmaa incidence, the generic population of borreliosis incidences, as depicted in appendix 2, is highly skewed and biased outside the district of Ahvenanmaa. As a consequence, the median and the interquartile range (IQR) are more robust comparative descriptives of borreliosis populations than highly sensitive descriptives such as arithmetic means and/or standard deviations. The comparative descriptives of Northern borreliosis populations are provided in Table 2 and Table 3, where the Aland population is included in the former table but excluded in the latter.
Although borreliosis not is a reportable disease in Sweden, the geographic northward translation of the Swedish tick population has been thoroughly demonstrated by Jaenson et al. (2012) and Grandi et al. (2020). When inferred with respect to linear stationary as well as longitudinal and latitudinal trends (Table 12), borreliosis incidences have been significantly increasing in Norway and Finland while they significantly translate towards the North in Norway, (Sweden), Finland, Asian Russia, and Finland + European Russia. In addition to the latitudinal component, as illustrated with borreliosis in Norway (Figure 2), a longitudinal component seems to be generally pointing away from coastal environments, towards the inland, in Norway and Finland + European Russia. In Asian Russia, borreliosis seem to prevail mainly in southern inlands and slowly translate towards the north and the Pacific coast. In these regions, borreliosis seems to have started its journey towards the North in the early nineties, with maximum translation velocity through the nineteen-nineties and the twenty-hundreds. In the case of Norway (Figure 2), as an example, the inland translation seems to have preceded the northward expansion of the borreliosis population with approximately ten years. Based on the general coherence across observed borreliosis translation patterns and climate gradient directions, it may be suggested that borreliosis is a potential climate sensitive infection.
4.2. Brucellosis
Brucellosis is a reportable disease in all nations covered with CLINF data but hasn’t been observed in Greenland or Iceland. It is scarcely occurring with an average incidence of 0.17 reported cases per 100,000 inhabitants, with non-zero observations scattered across the CLINF study region (appendix 2, Table 4). Brucellosis incidences are significantly higher in Russia than elsewhere in the CLINF study region, particularly in Asian Siberia.
With brucellosis occurring at relatively low rates, reported mainly with zero incidences through the Fennoscandian nations (appendix 2), it is not meaningful to infer eventual trends except in Russia (Table 12, Figure 3). Here, brucellosis incidences seem to have increased significantly while the disease has spread towards the Russian north and northeast until the 1980’s, whereafter it has been turning back towards the southwest. The north/northeast translation trend seems to have been conditioned by rather dramatically increasing brucellosis incidences, which have given way for decreasing incidences ever since. Provided the quite different climate gradients of western and eastern Russia, having longitudinal components that basically point in opposite directions, it may be suggested that the geographic translation of brucellosis is regulated by other factors then those associated with landscape effects of climate-change and, hence, that brucellosis not may be considered as being a climate sensitive infection. Although the geographic translation of brucellosis is exemplified with the case of Asian Russia in Figure 3, similar patterns apply also to Western Russia. When parameterised into linear interpolation, the overall trend is balancing between the different trends prior to and after the 1980’s. As illustrated with Table 12, the trends after the 1980’s are dominating everywhere except in the case of latitudinal trends of Western Russia, where the balance is symmetrical enough to produce a non-significant overall linear translation trend.
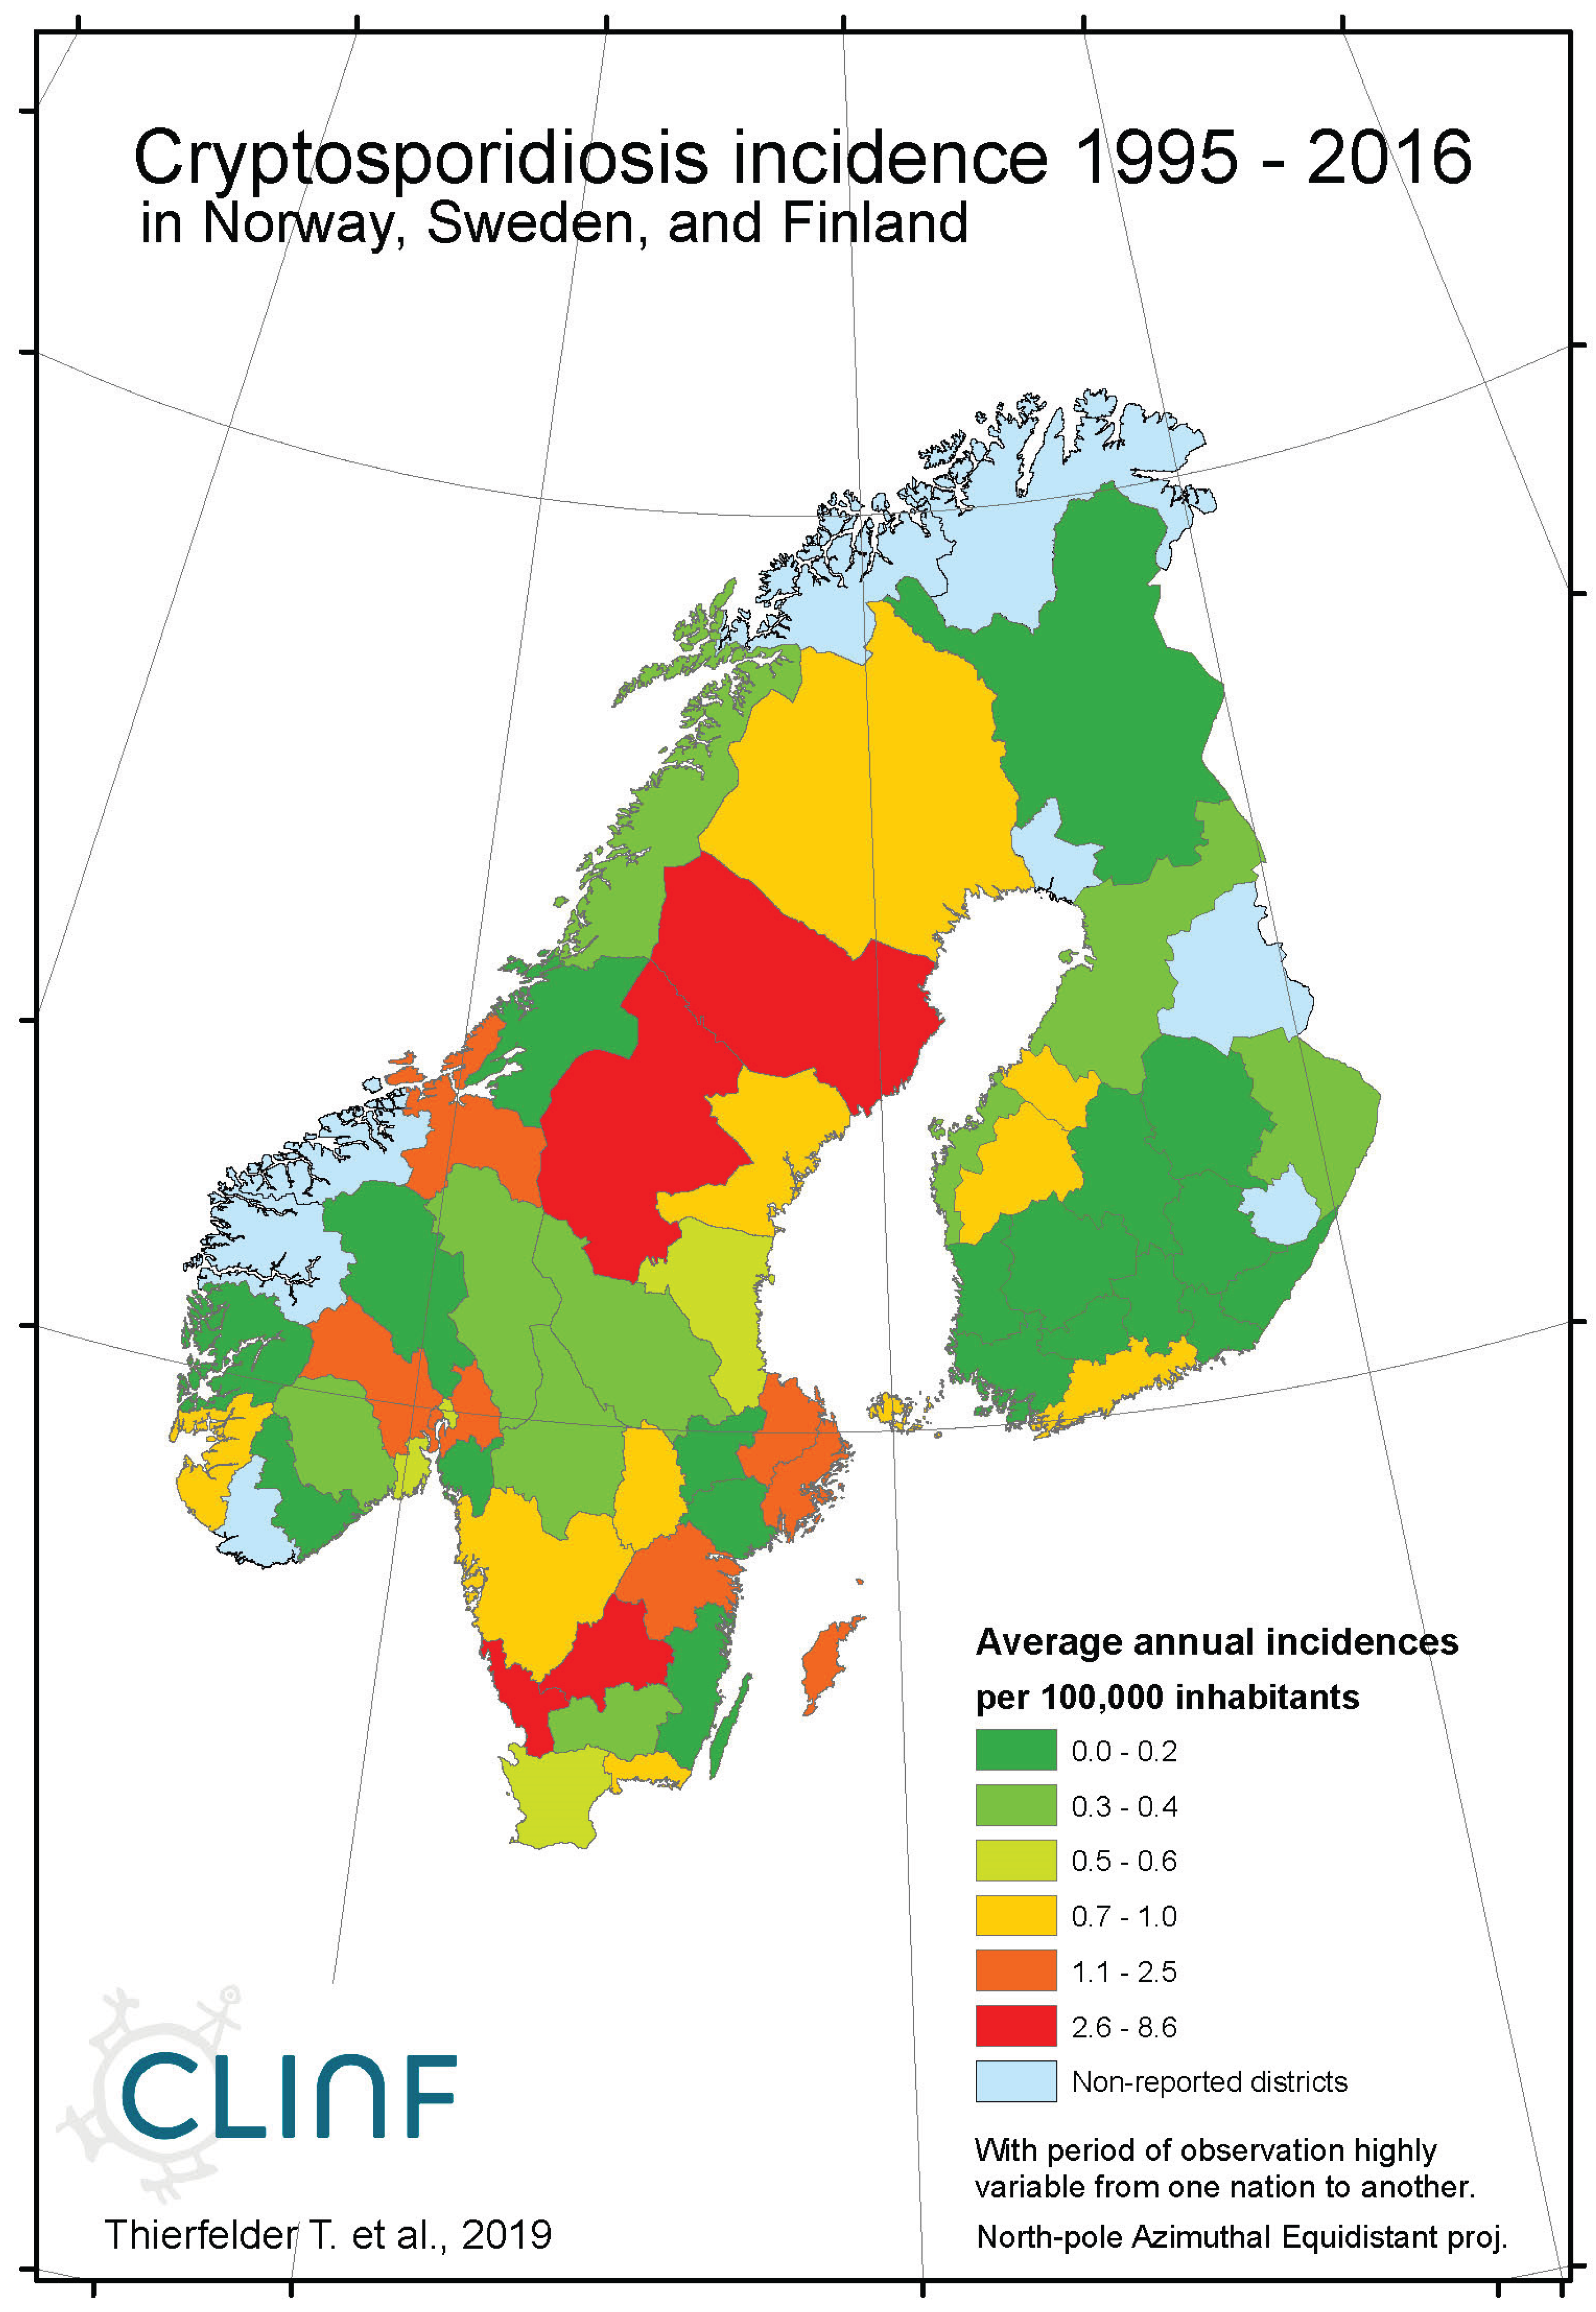
4.3. Cryptosporidiosis
Cryptosporidiosis is a reportable disease across the CLINF study region, with the important exception of Russia. With rather short records in Iceland and Norway, reports stretch back to 2004 in Sweden and to 1995 in Finland. When depicted and inferred for climate-induced geographic translation trends, only Norway, Sweden, and Finland are hence included (Table 5). Cryptosporidiosis incidences differ significantly with respect to mean values as well as to standard deviations across the Fennoscandian nations, with relatively high incidences reported in Sweden during the observed period of time. When inferred for stationary effects and/or geographic translation trends (appendix 2, Table 12), increasing incidences are observed at levels of strong significance in all the inferred regions. Significant translation trends are revealed when the Fennoscandian nations are combined, that are rendered non-significant when individual nations are inferred. Provided the short reporting period of Norway, only the combination of Sweden and Finland provides a long enough period of time for secure inference. Here, a significant trend towards the east prevails. However, since it is difficult to comprehend how this translation trend complies with regional climate gradients, it is suggested that it is regulated by other factors than those associated with climate-induced landscape change. Nevertheless, considering the significantly increasing incidence levels observed throughout Fennoscandia, it is suggested that cryptosporidium should be considered as being a potentially climate sensitive infection.
4.4. Hantavirus Haemorrhagic Fever with Renal Syndrome (HFSR/NE)
In northern Europe and Russia, NE is the predominant form of HFRS with average and maximum annual incidences of 11.4 and 309.3 respectively through the observed period of time (Table 6), and with case fatality-rates approaching 1 percent. As a result, NE is a classic reportable disease in the northern nations addressed with this study, although not officially reportable in Norway and Finland until 1991 and 1995 respectively. NE has not been officially reported in Greenland or Iceland through the studied period of time.
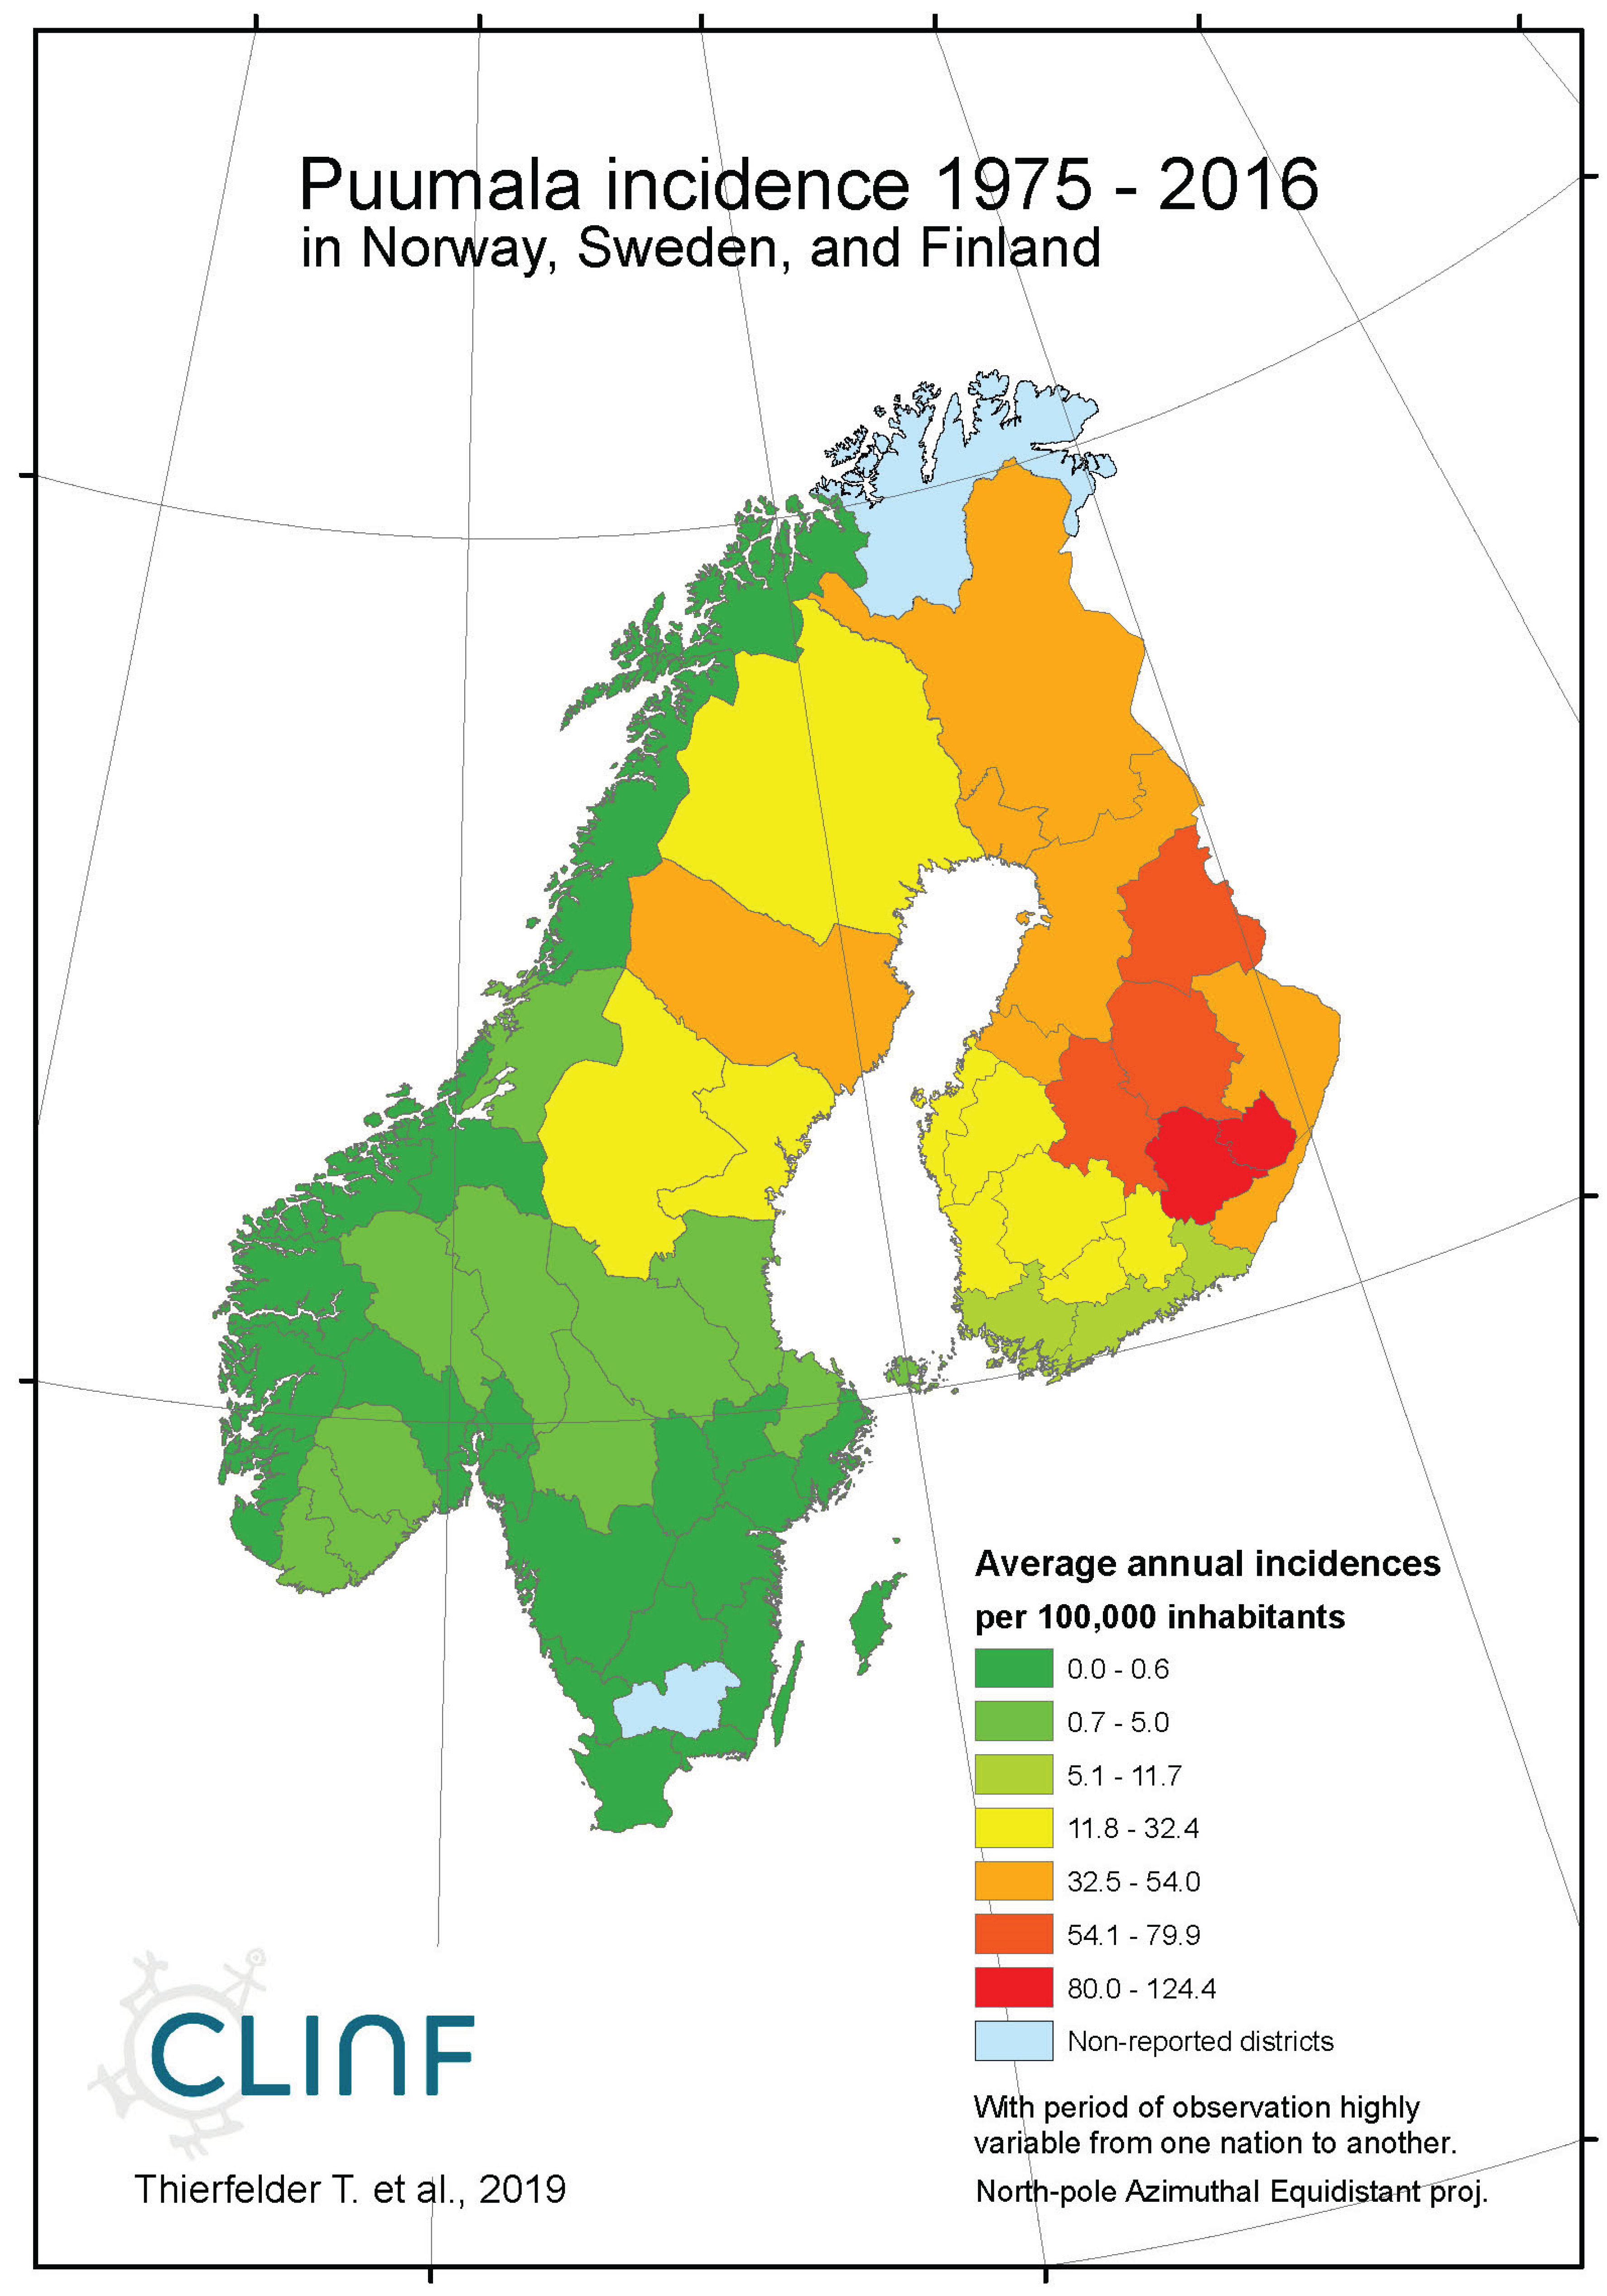
When tested for linear trends in the spatiotemporal domain (appendix 2, Table 12), NE seems to have stayed at roughly constant incidence levels throughout the studied period of time everywhere except in European Russia, where the trend was steadily increasing. In this approximate steady-state situation, NE seems to have translated geographically in all the studied regions except Asian Russia. There is an overall geographic trend towards the south in all nations except Russia (Figure 4, left), whereas European Russian NE incidences have increased significantly through time without displaying much latitudinal translation (Figure 4, right). In Sweden, the southward translation trend is remarkably strong whereas longitudinal trends across regions seem uncorrelated with climate
gradients. No spatiotemporal trends may be found in Asian Russia. It may be concluded that NE cannot be ruled out from responding to climate-change effects, and that it hence should be considered as being a potentially climate sensitive infection.
4.5. Leptospirosis
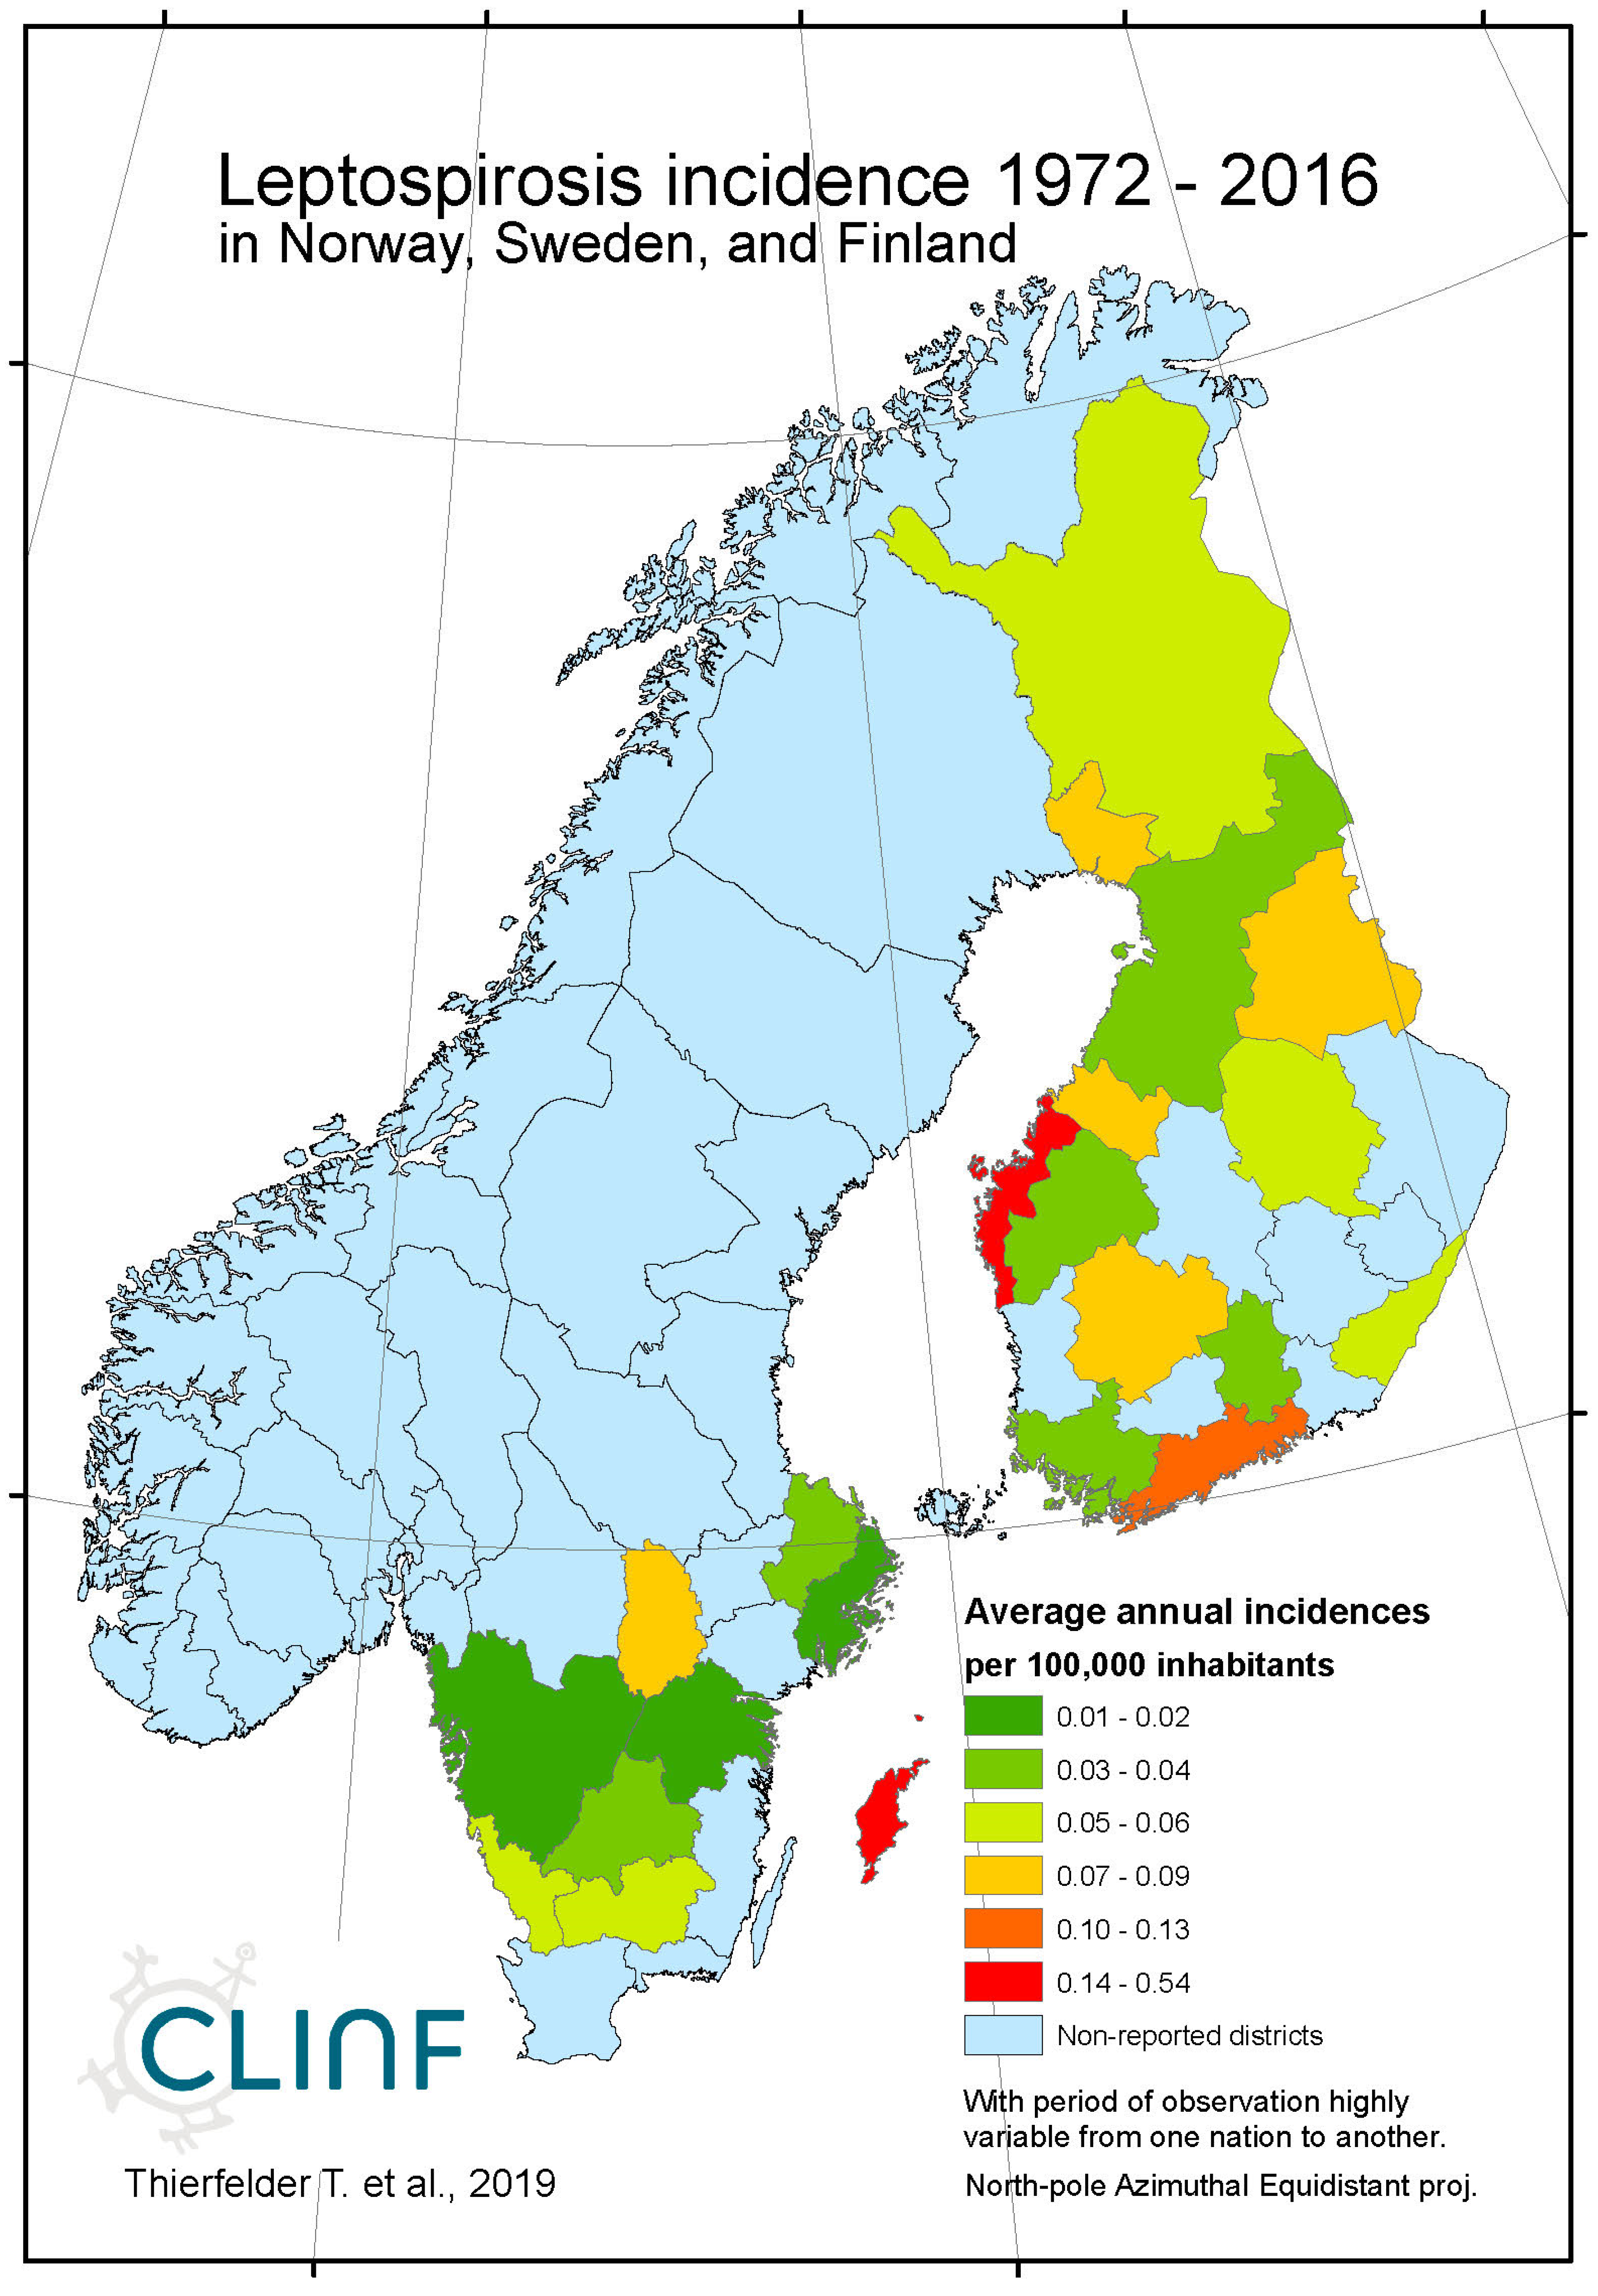
Leptospirosis occur at relatively low incidence rates in the North, and is not defined as a reportable disease in Norway (Table 7). With Norway excluded, the average and maximum incidence observed in this study are 0.51 and 12.0 (European Russia) respectively. Leptospirosis incidences vary significantly more in European Russia as compared with the rest of the study region. Leptospirosis is not reported in Greenland, Iceland, or Norway, rarely reported in Sweden, but more commonly present in Finland and Russia with a northern stronghold in the south-western parts of European Russia (appendix 2). When tested for spatiotemporal trends (Table 12, Figure 5), Finland and European Russia should therefore be focused upon although the rather late Finnish 1995 inclusion of leptospirosis in their national list of reportable diseases constrains such testing. As a result (Figure 5), leptospirosis incidences seem to have had a maximum around 1985 through Finland and European Russia, with geographic translation trends vaguely pointing in the north-east direction. The European-Russian incidence peak around 1985 seems to have protruded geographically from the Baltic coast towards the east, and thereafter withdrawn back to the coast. It may be concluded that general spatiotemporal trends seem to lack in the case of leptospirosis, although the Finnish-Russian trends should be handled with some reservation. Despite the latter recommendation, leptospirosis hardly meets the criteria of being considered to be a climate sensitive infection.
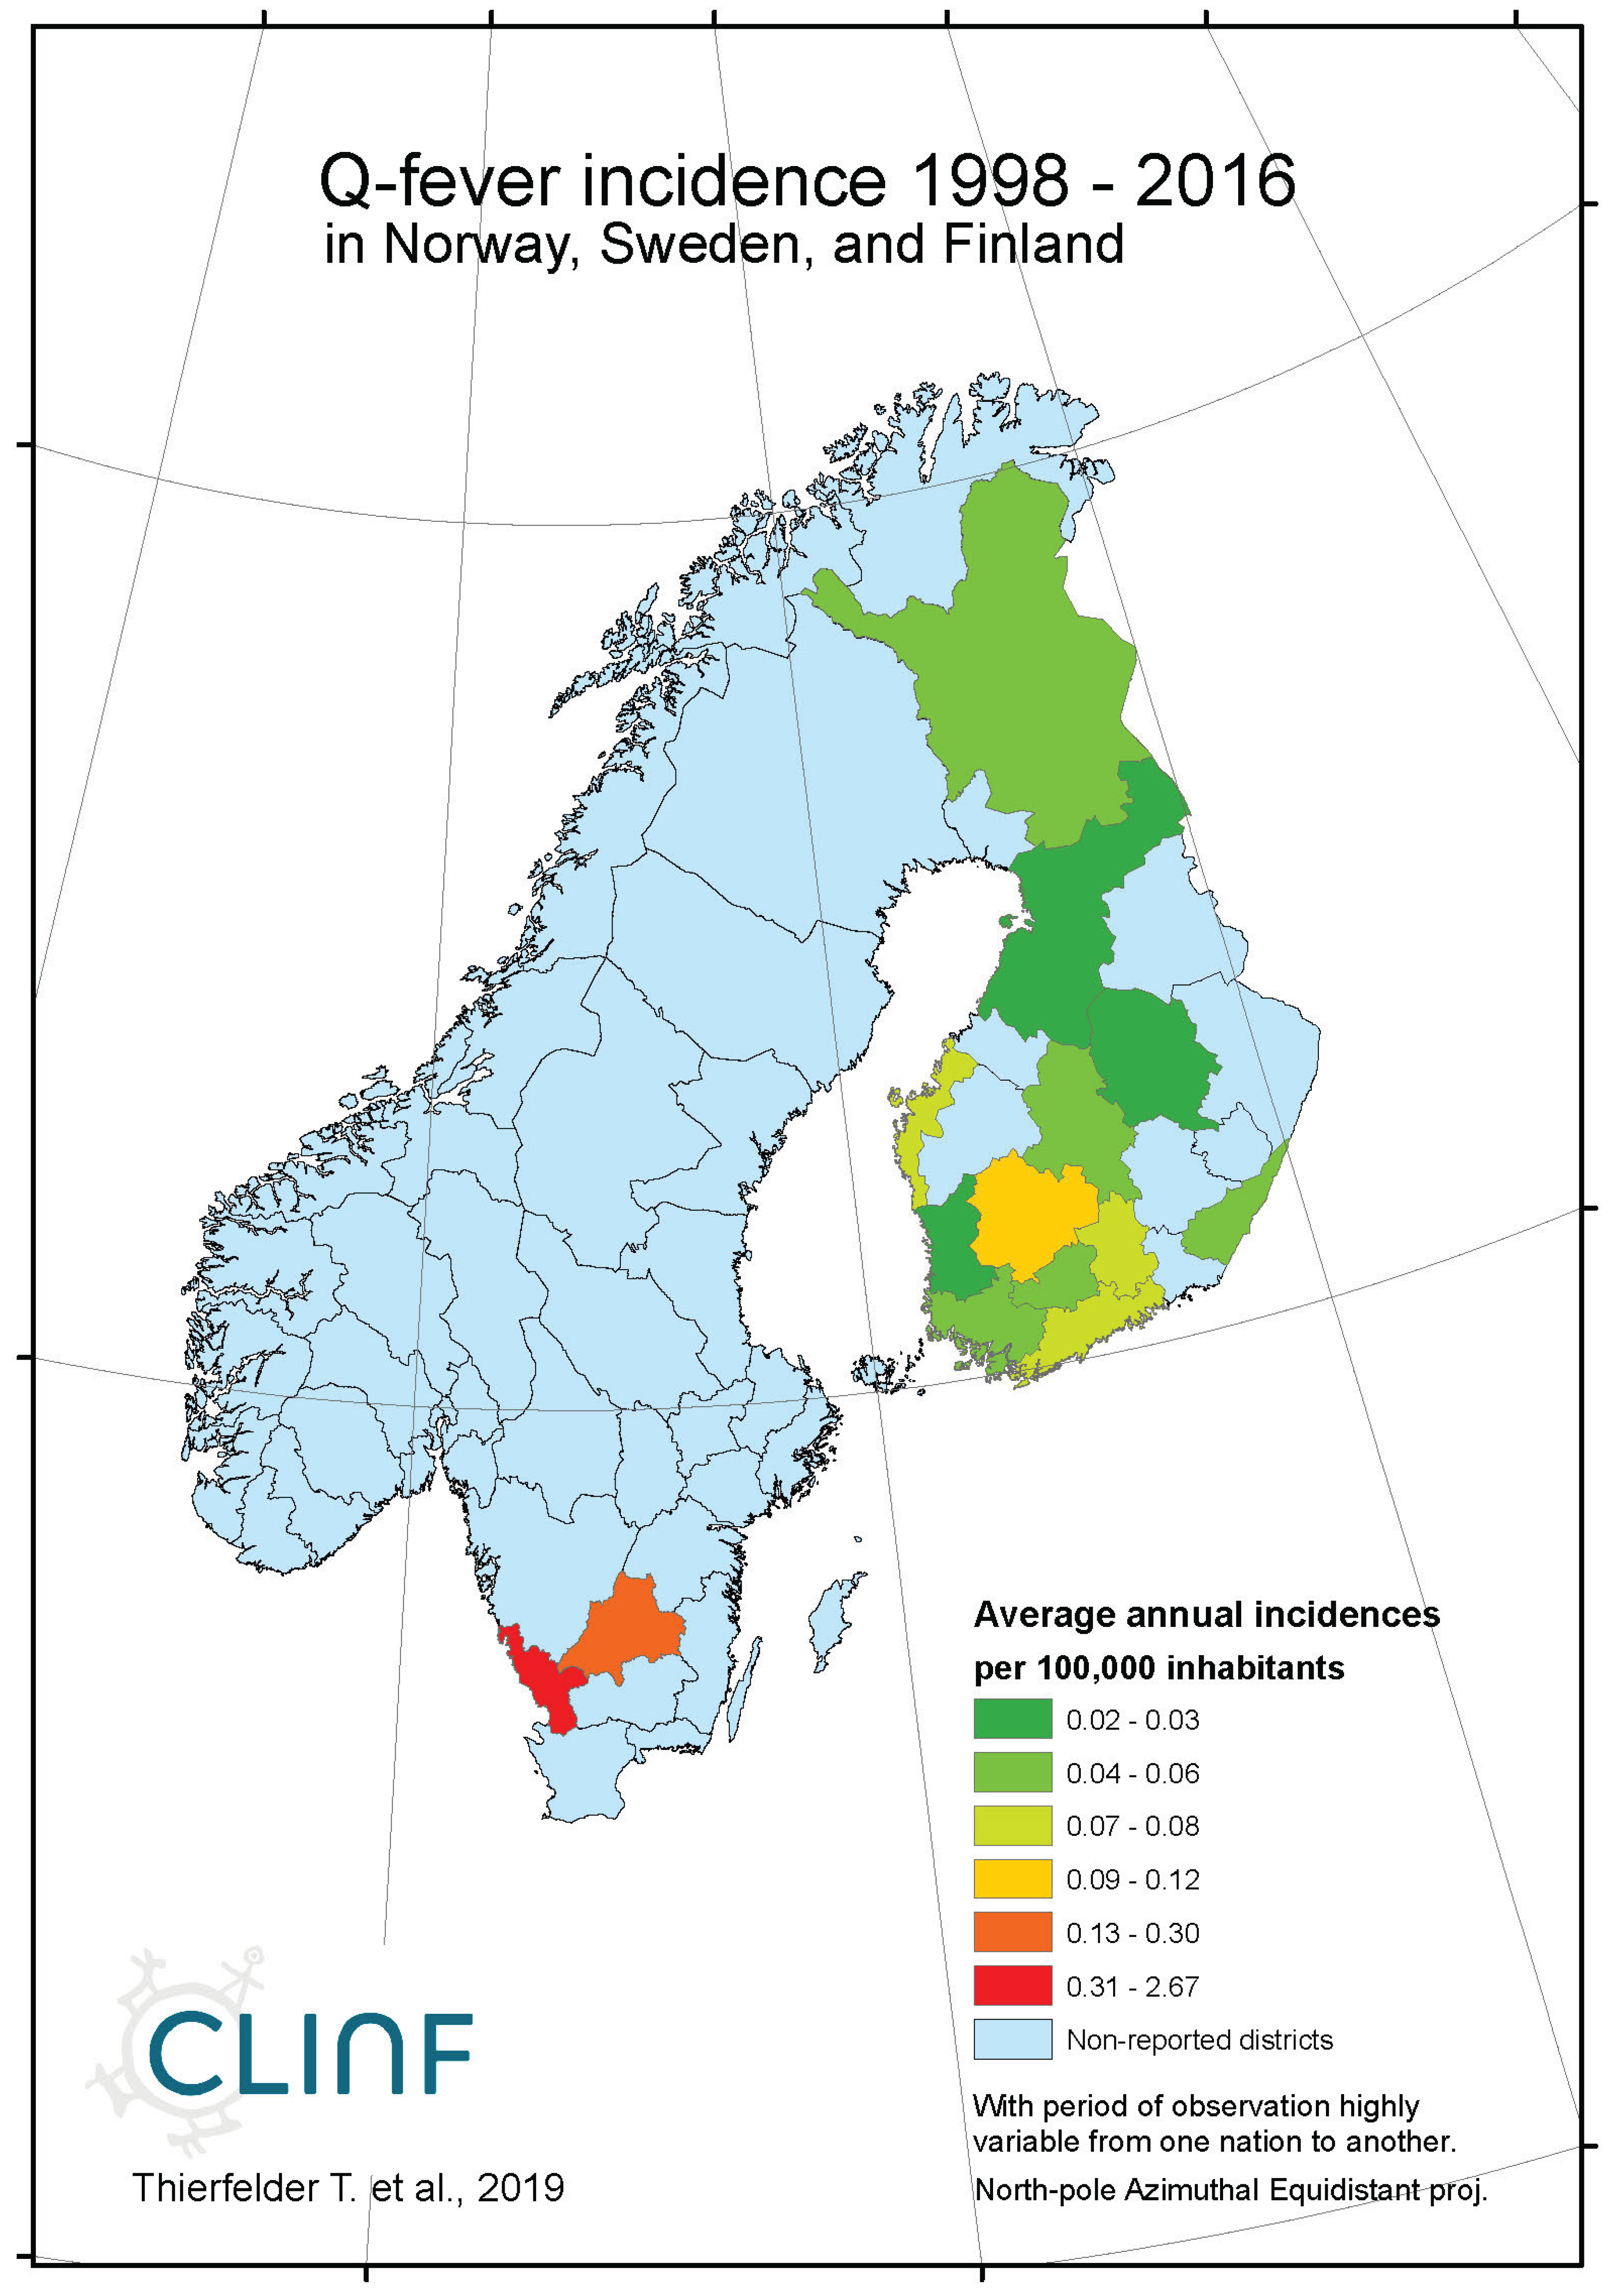
4.6. Q Fever
Throughout the CLINF study area, Q fever persists at relatively low incidence rates mainly in Finland and Russia whereas its occurrence in Sweden is more sporadic and local (appendix 2). It has been reported with a single case from Greenland through the studied period of time and is not reportable in Norway. In the Q fever summaries provided with Table 8, Sweden is represented with a significantly higher average incidence rate than other nations, which emanates from intense but short-lived outbreaks in a few report districts. With an insufficient number of reported cases (N, Table 8), Sweden should therefore be excluded from statistical tests concerning eventual spatiotemporal trends. This leaves Finland and Russia to be tested for such trends, and to be included in the associated Table 12. As best illustrated with the nation of Finland (Figure 6), there is a tendency for northward migration through the observed period of time while incidence rates stay generally constant. In Russia, the corresponding tendencies are too contradictory for safe interpretation. It may hence be concluded that Q fever should be regarded as being potentially climate sensitive at least in Finland, and that the correlations between climate-change effects and the spatiotemporal distribution of the Finnish Q fever population needs to be further investigated.
4.7. Tick-Born Encephalitis
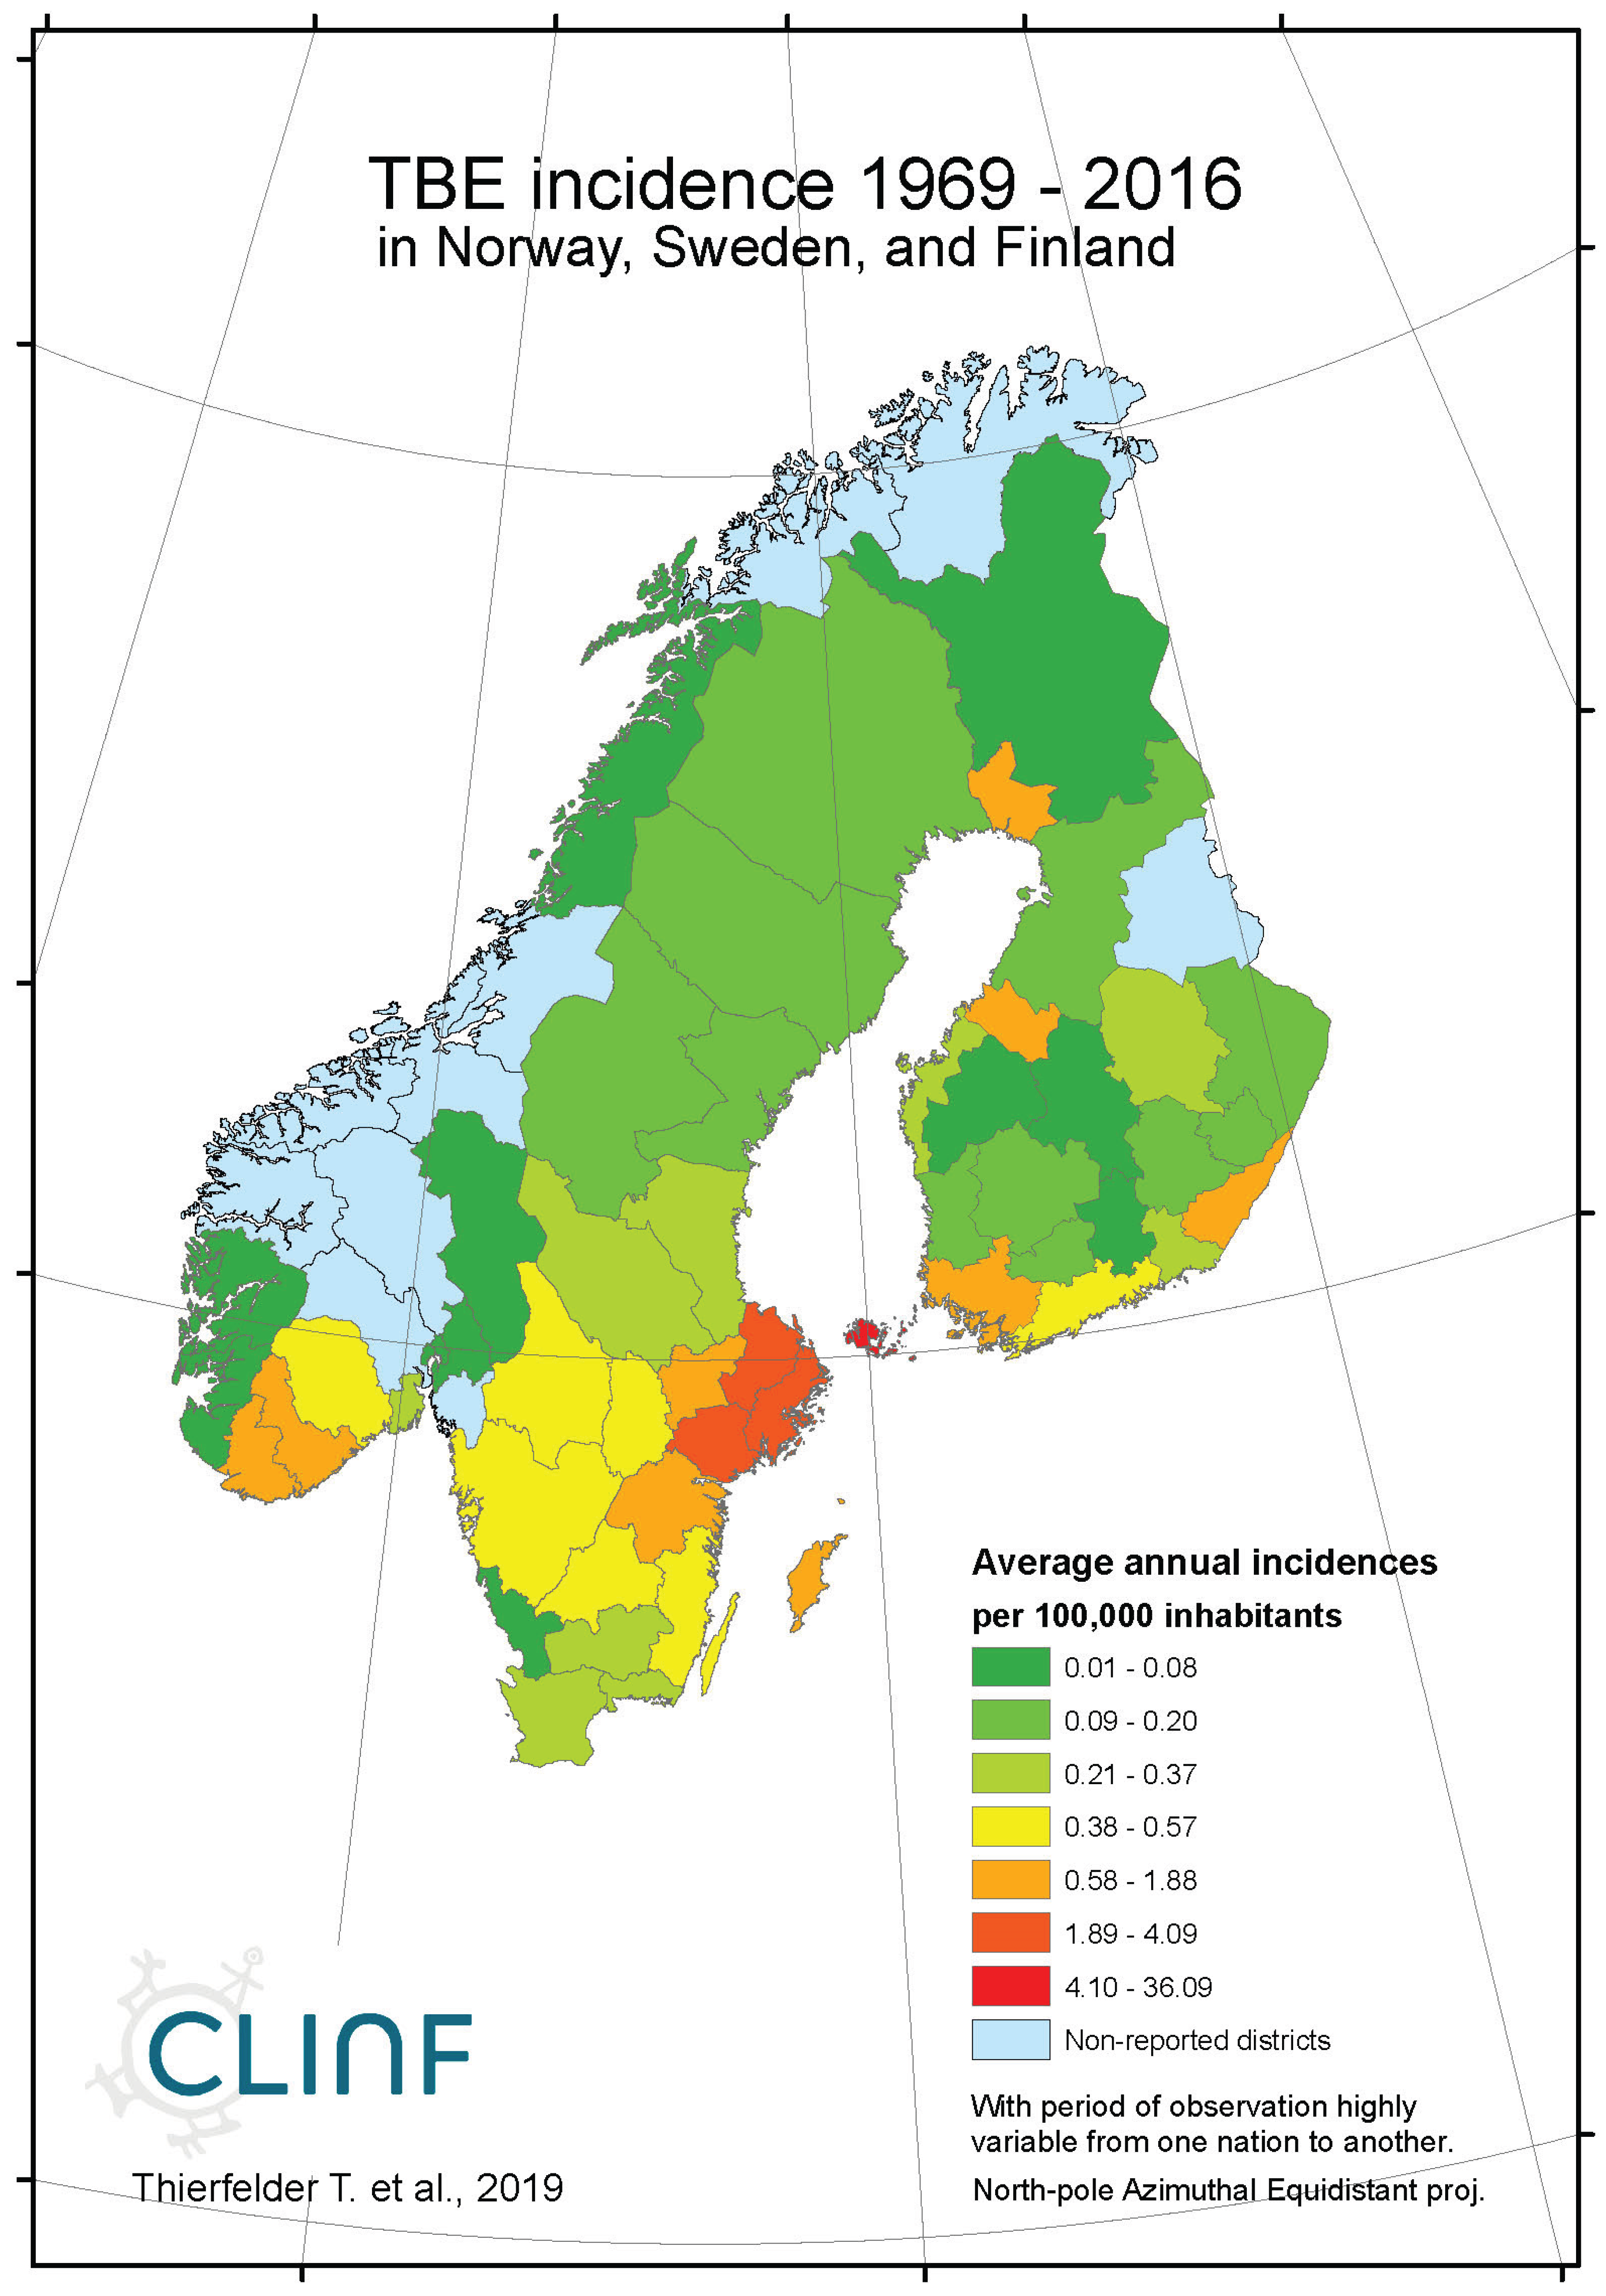
With TBE and borreliosis sharing the I. ricinus vector, the TBE natural foci coincides with that of borreliosis. Just like discussed in the above section concerning the borreliosis disease, this natural foci is likely to expand towards the North with climate-change effects, and it therefore seems plausible to assume that TBE is a potential climate sensitive infection. TBE has a stronghold in the northern nations covered with this study and is therefore a classic reportable disease throughout the North. With an abundance of ticks characterising the infectious scenario of the Aland region in south-western Finland (Ahvenanmaa), TBE incidence rates probably reaches an international maximum in the region. Just like in the case of borreliosis, this spills into the surrounding regions along the Finnish south-coast as well as onto the neighbouring archipelago of the Swedish east-coast (Figure 7, appendix 2). Like in the case of borreliosis, the extreme Aland TBE incidences bias the wider Nordic perspective enough to motivate two separate tables of TBE descriptives, one including the Aland diseases report district (Table 9) and the other excluding the district (Table 10). As illustrated with these tables, Russian TBE incidence rates dominate at large geographic scales, particularly in the Ural region. The disease is not reported in Greenland or Iceland and persists at relatively modest incidence rates through Norway and Sweden (excluding the east-coast archipelago).
When tested for spatiotemporal trends (Table 12), it may be concluded that TBE population dynamics are generally dominated by temporally increasing incidence rates and significantly flat geographic trends. This is best illustrated with the case of Sweden (Figure 7), where incidence rates have increased significantly while the disease slowly spreads from the coast towards the inland north. This applies more or less to all the studied nations and/or regions, as illustrated in Table 12, except Asian Russia where TBE seems to slowly spread towards the northeast and the Pacific coast.
When the spatiotemporal dynamics of the Northern TBE population are compared with the dynamics of borreliosis, it may be concluded that the two diseases respond similarly to the rapid warming of their shared natural foci, although with different geographic rates. At different rates, they seem to literally follow the geographic expansion of tick populations. It may hence be concluded that TBE should be defined as a potential climate sensitive infection that more or less coheres with the climate-change dynamics of the borreliosis population.
4.8. Tularaemia
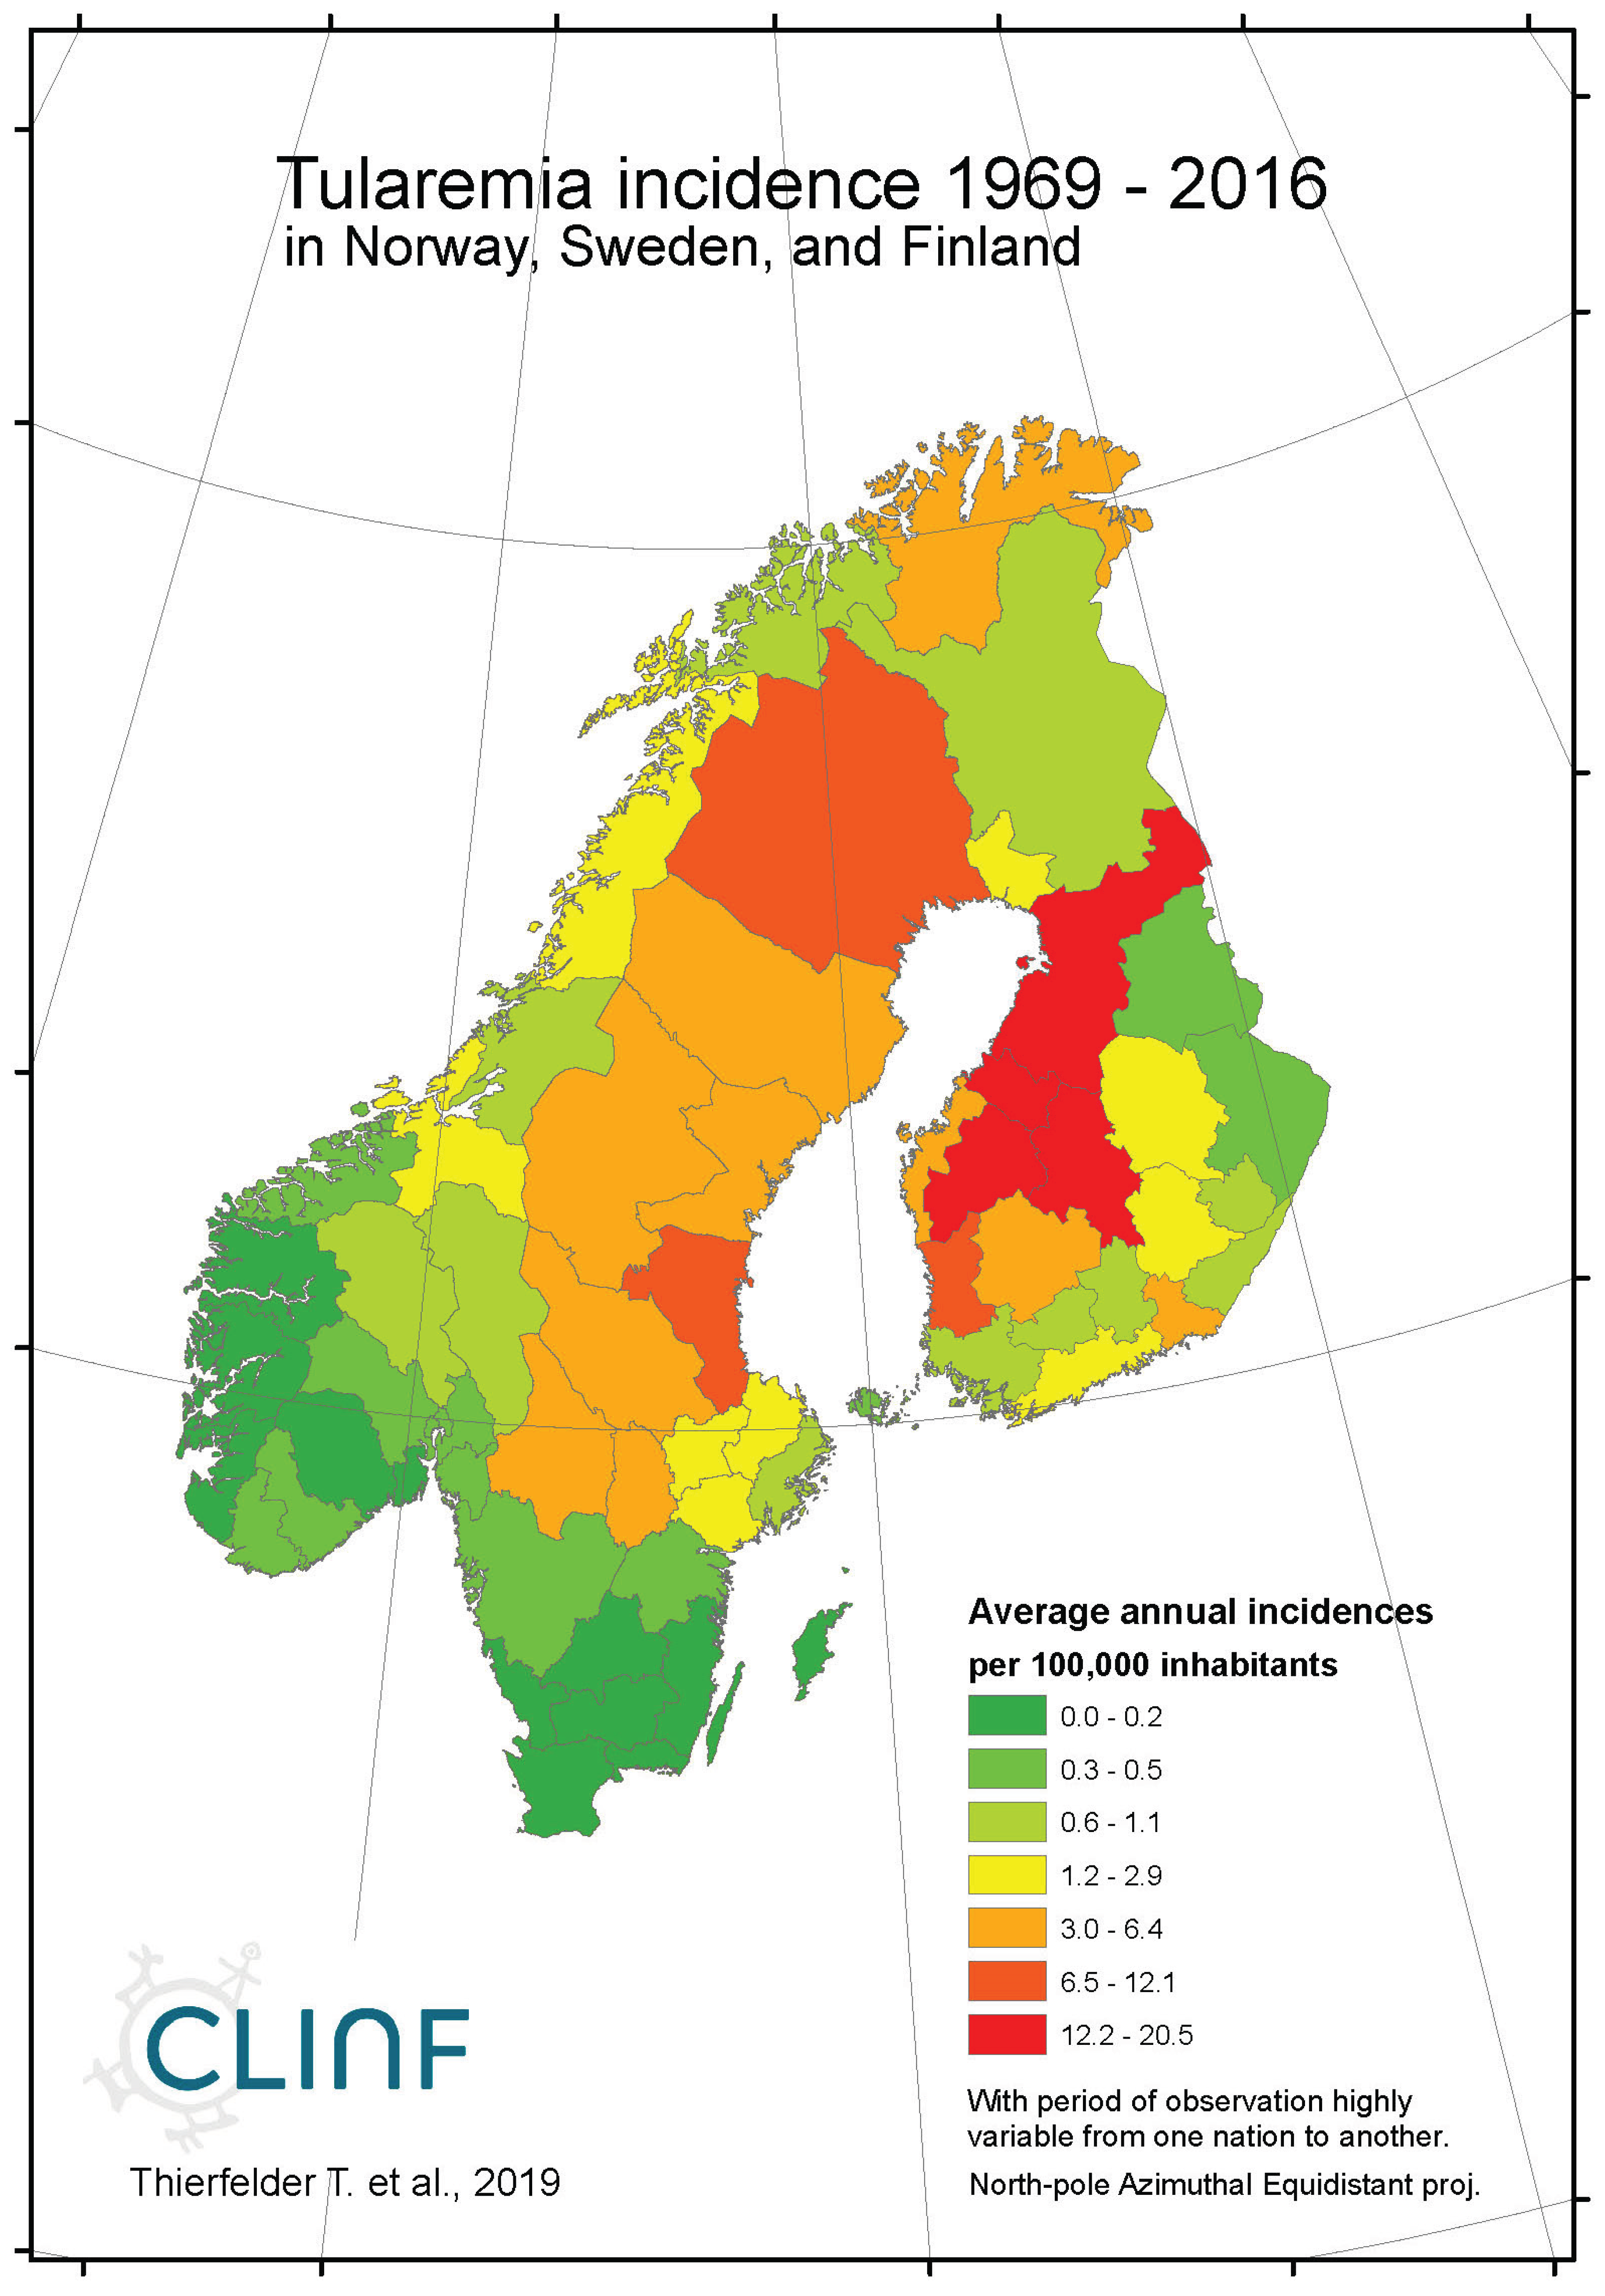
Across the spatiotemporal domain covered with this study, Tularaemia has a classic stronghold in Sweden and Finland (Figure 8, appendix 2). This is clearly illustrated with Table 11, where Sweden and Finland display significantly higher mean- and maximum incidence rates as compared with other parts of the study region. It may also be noted that Sweden and Finland display significantly lower coefficients of incidence variation. One possible interpretation of this is that the rather rare occasions of tularaemia infection outside Sweden and Finland occur by outbreak, whereas the infection is more steadily present in Sweden and Finland. When inferred for spatiotemporal trends (Table 12, Figure 8), tularaemia population dynamics seem to resemble what just has been discussed for TBE. Hence, significantly flat geographic trends prevail while incidences are strongly increasing. As a matter of fact, the test statistics of tularaemia incidences increasing while translating southwards are extremely high in Sweden where the presently (2018) ongoing outbreak in the far-north probably sets an all-time-high record. In general, while incidences increase, tularaemia populations seem to slowly advance towards the south. The Russian tularaemia population prevails more at a spatiotemporal status quo, although slowly increasing in Europe and slowly translating towards the north in Asia. Mainly based on observations made through Fennoscandia, it may be suggested that the tularaemia population is under dynamic change, and that the infection should be defined as being potentially climate sensitive.

Table 11.
Comparative descriptives of the Northern tularaemia population (primary incidences). N denotes the number of reports, where a typical report may contain many cases.
Table 11.
Comparative descriptives of the Northern tularaemia population (primary incidences). N denotes the number of reports, where a typical report may contain many cases.
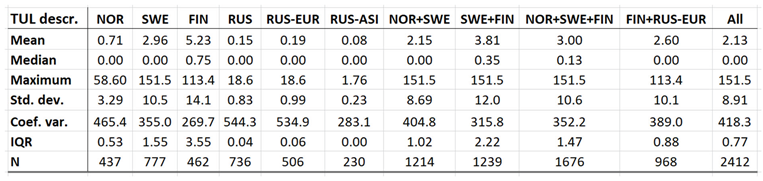 |
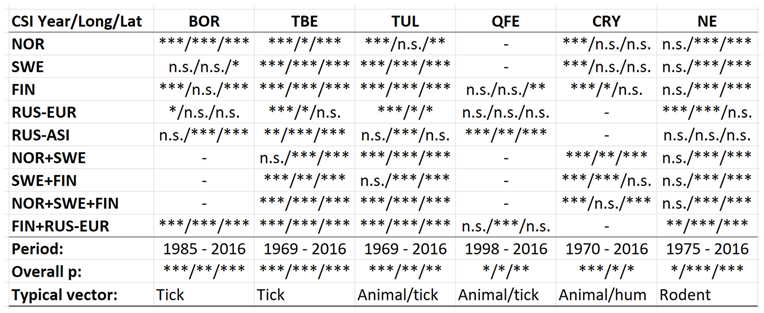
Table 12.
Likelihood type 3 test statistics regarding geographically stationary and/or longitudinal and/or latitudinal translation trends (Year/Long/Lat) in observations of CSI incidences. Compilation across functional study regions, overall period of observation, overall type 3 value p’s, and typical vector organisms.
 |
5. Conclusions
Out of the eight infections inferred with this study, borreliosis, cryptosporidiosis, nephropathia epidemica (NE), Q fever, TBE, and tularaemia may be suggested to be potentially climate sensitive (Table 12). This equals 88 percent of the chosen diseases which, possibly, may be considered as a quite worrying estimate of the generic proportion of potential CSI’s. Borreliosis seems to follow the migratory paths of its main vector organism, the I. ricinus tick, within a habitat that is generally expanding inlands and towards the North with climate change. TBE shares the I. ricinus vector with borreliosis and displays similar population dynamics through the observed spatiotemporal domain. However, where borreliosis seem to literally follow the geographic expansion of tick populations, TBE responds with significantly increasing incidences while translating geographically at slower rates. It may be concluded that the two prime tick-borne infections borreliosis and TBE follow the paths of landscapes that transform with climate-change, and that they hence are to be considered as being climate sensitive infections.
Tularaemia population dynamics seem to resemble the slowly translating dynamics of the TBE population, with which it shares the tick vector. It has a classic stronghold in Sweden and Finland and seems to generally increase with respect to incidence rates everywhere except in Asian Russia. It may be concluded that tularaemia is an infection under dynamic change and that it must be considered as being potentially climate sensitive.
Cryptosporidiosis incidence rates are generally increasing in the Nordic nations, with tendencies of slow geographic translation to be observed. Since these translation patterns contradict regional climate gradients, it may be concluded that geographic cryptosporidium fluctuations are regulated by other factors than those associated with climate-change. Nevertheless, considering the significantly increasing incidence levels observed throughout Fennoscandia, it is suggested that cryptosporidiosis should be considered as being a potentially climate sensitive infection.
NE seems to have stayed at roughly constant incidence levels throughout the studied period of time everywhere except in European Russia, where the trend is steadily increasing. In this approximate steady-state situation, NE seems to have translated southwards from classical northern foci in all the studied regions except Russia, whereas the longitudinal trends seem uncorrelated with regional climate gradients. It may be concluded that NE should be considered as being a potentially climate sensitive infection.
Q fever is too sparsely occurring for safe inference everywhere except in Finland where there is a tendency for northward migration through the observed period of time while incidence rates stay generally constant. It may be concluded that Q fever should be regarded as being potentially climate sensitive at least in Finland, and that the correlations between climate-change effects and the spatiotemporal distribution of the Finnish Q fever population needs to be further investigated.
6. Discussion
In the above assessment of potential CSI’s, not only the spatiotemporal dynamics of selected infectious diseases have been inferred, but also an inferential methodology adapted to the respective national programmes of health survey across the North. This is a typical task of biometry, where the “inferential scenario” has been parametrised to fit standard models of statistical inference and hypothesis testing. Hence, the parameterisation of possible CSI effects into linear trends of geographic translation and/or expansion (+/-), and/or stationary incidence effects, is basically a parameterisation into the minimalistic inferential equations 1, 2 and 3. A similar biometric concept applies to the shift from considering diseases incidences to be generically normal distributed, in favour of an ordinal Poisson approach. With the diseases scenario spatiotemporally parametrised into annual accumulations across county-sized spatial units, zero incidences dominate the scale. This basic fact is best illustrated with diseases such as anthrax, that occur via “outbreaks” rather than being manifested with a varying continuum in the spatiotemporal domain. In the ordinal approach, such abundances of zeros are easily categorised and contrasted with non-zero categories at the different levels of observed incidence intensity. In the temporal domain, national health data are usually available at the date whereupon individual cases were reported to the health authorities. With “incidence” being defined as the number of new cases through some period of time (and across some spatial domain), such primary data require temporal accumulation into some arbitrary unit of time. The choice of setting this unit to annual cumulations, like in the prevailing study, was based on the typical rate with which the observed diseases populations change in the spatiotemporal domain, and is hence another instance of biometric parametrisation. After having assessed the observed CSI scenario, a consensus was reached where the annual approach was considered to best match typical CSI dynamics through the thirty-year climate window.
The spatial resolution of the study was provided á priori but has been parametrised into regions that fulfil the above-mentioned criteria of national interests as well as of approximately homogeneous climate gradients. There is, however, one important exception that contrasts with the basic county-sized resolution that spatially underpins the study. With its enormous eastern regions, Siberian health data are reported by spatial units that typically dwarf its western equivalents. From “Nuuk to Yakutsk”, there is a tendency of increasing spatial size towards the East (which is balanced with decreasing population densities) that introduces a bias to CSI studies across the Northern realm. The prevailing study was well underway into breaking a selection of huge Siberian report districts down into the sub-district scale, when Russia assaulted Ukraine in early 2022 and all Nordic-Russian science collaboration came to an abrupt end.
As the North is in significant lack of international compatibility with respect to standardised national schemes of health survey, and to the corresponding dissemination of health data, it is keenly suggested that the above schemes of parameterisation are implemented nationally across nations (of the North). The method of achieving this is via science diplomacy as pointed out by authors such as Evengård & Thierfelder, (2021) and Evengård et al. (2021).
Among the possible CSI effects discussed above, the geographic expansion of diseases populations has a special bearing on Siberia. With its 13.1 M sqr.km., as compared with the approximately 0.8 M sqr.km. that applies to the Nordic region above 55 degrees North, Siberia holds a potential of CSI habitat that more or less dwarfs’ other parts of the Eurasian North. There is well-known remotely sensed evidence (Ohta et al., 2019) that vast areas of Siberia are greening and wettening as a consequence of climate change, which invites CSI vector and reservoir organisms to migrate along the associated climate gradients by law of nature. Since this threatens to multiply the sheer mass of threatening pathogens, it is vitally important to keep track not only with landscape transitions visible from space, but with Siberian CSI dynamics observed in situ. And with the probability of globally eradicating infectious diseases being principally proportional to pathogen mass (Daley & Gani, 2005), the current ban of scientific exchange with Russia constitutes a global OneHealth threat. And again, science diplomacy may offer a solution.
The notion of a “potential” CSI is important since a mere indication of “pathogens on the move” is not enough to prove that the observed effects are caused by climate-change. There may be many other complexly dynamic reasons for such CSI variations. The corroboration of linkages between spatiotemporal CSI variations and climate-change effects requires statistical inference at quite another scale as compared with the spatiotemporal inference presented here (Destouni et al., 2021). As part of producing biometric recommendations, we hence suggest that the term “potential CSI” is used to distinguish between observed spatiotemporal CSI variations and a generic link to climate-change effects.
Acknowledgments
This publication is issued under the auspices of the CLINF Nordic Network of Excellence (Climate-change effects on the epidemiology of infectious diseases and the impacts on Northern societies: www.clinf.org). CLINF has been generously financed by NordForsk and the Nordic Council of Ministries through the period of 2016 – 2024, under their joint Nordic initiative “Responsible Development of the Arctic: Opportunities and Challenges – Pathways to Action”.
Appendix A. Diseases Report Districts
| Nation | District | Distr_code | Long | Lat |
| FIN | Ahvenanmaa | Ahv | 20.0 | 60.2 |
| FIN | Etelä-Karjalan | Ete-Kar | 28.4 | 61.2 |
| FIN | Etelä-Pohjanmaan | Ete-Poh | 23.0 | 62.7 |
| FIN | Etelä-Savon | Ete-Sav | 27.2 | 62.1 |
| FIN | Helsingin ja Uudenmaan | Hel-Uud | 23.6 | 60.6 |
| FIN | Itä-Savon | Itä-Sav | 27.0 | 62.5 |
| FIN | Kainuun | Kai | 28.7 | 64.5 |
| FIN | Kanta-Hämeen | Kan-Häm | 24.3 | 60.9 |
| FIN | Keski-Pohjanmaan | Kes-Poh | 24.1 | 63.6 |
| FIN | Keski-Suomen | Kes-Suo | 25.5 | 62.6 |
| FIN | Kymenlaakson | Kym | 27.0 | 60.5 |
| FIN | Lapin | Lap | 22.9 | 61.4 |
| FIN | Länsi-Pohjan | Län-Poh | 21.5 | 63.1 |
| FIN | Pirkanmaan | Pir | 23.9 | 61.7 |
| FIN | Pohjois-Karjalan | Poh-Kar | 29.9 | 62.9 |
| FIN | Pohjois-Pohjanmaan | Poh-Poh | 25.1 | 64.8 |
| FIN | Pohjois-Savon | Poh-Sav | 27.5 | 63.2 |
| FIN | Päijät-Hämeen | Päi-Häm | 25.8 | 61.2 |
| FIN | Satakunnan | Sat | 21.6 | 61.5 |
| FIN | Vaasan | Vaa | 22.0 | 63.0 |
| FIN | Varsinais-Suomen | Var-Suo | 22.4 | 60.2 |
| GRE | Greenland | Gre | -49.5 | 63.2 |
| ICE | Iceland | Ice | -19.1 | 64.3 |
| NOR | Akershus | 2 | 10.8 | 60.1 |
| NOR | Aust-Agder | 9 | 8.4 | 58.7 |
| NOR | Bergen | 13 | 3.4 | 60.3 |
| NOR | Buskerud | 6 | 9.1 | 60.3 |
| NOR | Finnmark | 20 | 23.9 | 70.7 |
| NOR | Hedmark | 4 | 11.4 | 61.5 |
| NOR | Hordaland | 12 | 5.8 | 60.2 |
| NOR | Møre og Romsdal | 15 | 7.7 | 62.9 |
| NOR | Nordland | 18 | 15.1 | 68.0 |
| NOR | Nord-Trøndelag | 17 | 11.5 | 64.6 |
| NOR | Oppland | 5 | 9.3 | 61.4 |
| NOR | Oslo | 3 | 10.7 | 60.0 |
| NOR | Rogaland | 11 | 5.8 | 59.2 |
| NOR | Sogn og Fjordane | 14 | 6.7 | 61.2 |
| NOR | Sør-Trøndelag | 16 | 9.5 | 63.5 |
| NOR | Telemark | 8 | 8.5 | 59.5 |
| NOR | Troms | 19 | 19.1 | 69.6 |
| NOR | Vest-Agder | 10 | 7.2 | 58.5 |
| NOR | Vestfold | 7 | 10.3 | 59.2 |
| NOR | Østfold | 1 | 11.0 | 59.1 |
| RUS | Arkhangelsk | Ark | 53.31 | 73.99 |
| RUS | Chukotka | Chu | 176.52 | 69.56 |
| RUS | Irkutsk | Irk | 105.87 | 56.48 |
| RUS | Kaliningrad | Kal | 21.45 | 54.71 |
| RUS | Kamchatka | Kam | 160.21 | 57.94 |
| RUS | Karelia | Kar | 33.23 | 65.05 |
| RUS | Kemerovo | Kem | 87.17 | 54.50 |
| RUS | Khakassia | Khak | 90.00 | 53.28 |
| RUS | Khantia-mansia | Khan | 70.43 | 61.68 |
| RUS | Komi | Kom | 54.77 | 64.13 |
| RUS | Krasnoyarsk | Kra | 101.57 | 74.52 |
| RUS | Leningrad | Len | 28.52 | 59.93 |
| RUS | Magadan | Mag | 154.04 | 62.71 |
| RUS | Murmansk | Mur | 33.39 | 68.93 |
| RUS | Nenetsia | Nen | 53.97 | 68.49 |
| RUS | Novgorod | Novg | 32.56 | 58.28 |
| RUS | Novosibirsk | Novo | 79.77 | 55.27 |
| RUS | Pskov | Psk | 29.26 | 57.22 |
| RUS | Sakha | Sak | 137.06 | 73.47 |
| RUS | St Petersburg | Pet | 29.96 | 59.94 |
| RUS | Tiumen | Tiu | 68.81 | 57.59 |
| RUS | Tomsk | Tom | 81.53 | 58.78 |
| RUS | Vologda | Vol | 40.52 | 59.97 |
| RUS | Yamalia | Yam | 73.53 | 66.12 |
| SWE | Blekinge | K | 15.5 | 56.1 |
| SWE | Dalarna | W | 14.4 | 61.0 |
| SWE | Gotland | I | 19.0 | 57.9 |
| SWE | Gävleborg | X | 16.3 | 61.4 |
| SWE | Göteborgs och Bohus | O | 11.7 | 58.3 |
| SWE | Halland | N | 12.9 | 56.9 |
| SWE | Jämtland | Z | 14.3 | 63.3 |
| SWE | Jönköping | F | 14.4 | 57.5 |
| SWE | Kalmar | H | 16.6 | 57.5 |
| SWE | Kristianstad | L | 13.9 | 56.1 |
| SWE | Kronoberg | G | 14.6 | 56.8 |
| SWE | Malmöhus | M | 13.4 | 55.7 |
| SWE | Norrbotten | BD | 21.2 | 65.7 |
| SWE | Skaraborg | R | 13.8 | 58.4 |
| SWE | Skåne | M | 13.1 | 55.9 |
| SWE | Stockholm | AB | 18.6 | 59.4 |
| SWE | Södermanland | D | 17.3 | 58.9 |
| SWE | Uppsala | C | 18.2 | 60.2 |
| SWE | Värmland | S | 13.2 | 59.8 |
| SWE | Västerbotten | AC | 20.9 | 65.0 |
| SWE | Västernorrland | Y | 17.8 | 62.7 |
| SWE | Västmanland | U | 16.3 | 59.8 |
| SWE | Västra Götaland | O | 12.0 | 58.1 |
| SWE | Älvsborg | P | 12.7 | 58.4 |
| SWE | Örebro | T | 15.0 | 59.4 |
| SWE | Östergötland | E | 16.6 | 58.3 |
Appendix B. The Geography of Northern Infectious Diseases
Appendix B1. Borreliosis
Figure 1a.
Average annual Borreliosis incidences as observed through the approximate thirty-year climate reference period, across the entire CLINF study region. Borreliosis incidences are extremely high at the Finnish/Baltic archipelago of Ahvenanmaa (Aland).
Figure 1a.
Average annual Borreliosis incidences as observed through the approximate thirty-year climate reference period, across the entire CLINF study region. Borreliosis incidences are extremely high at the Finnish/Baltic archipelago of Ahvenanmaa (Aland).
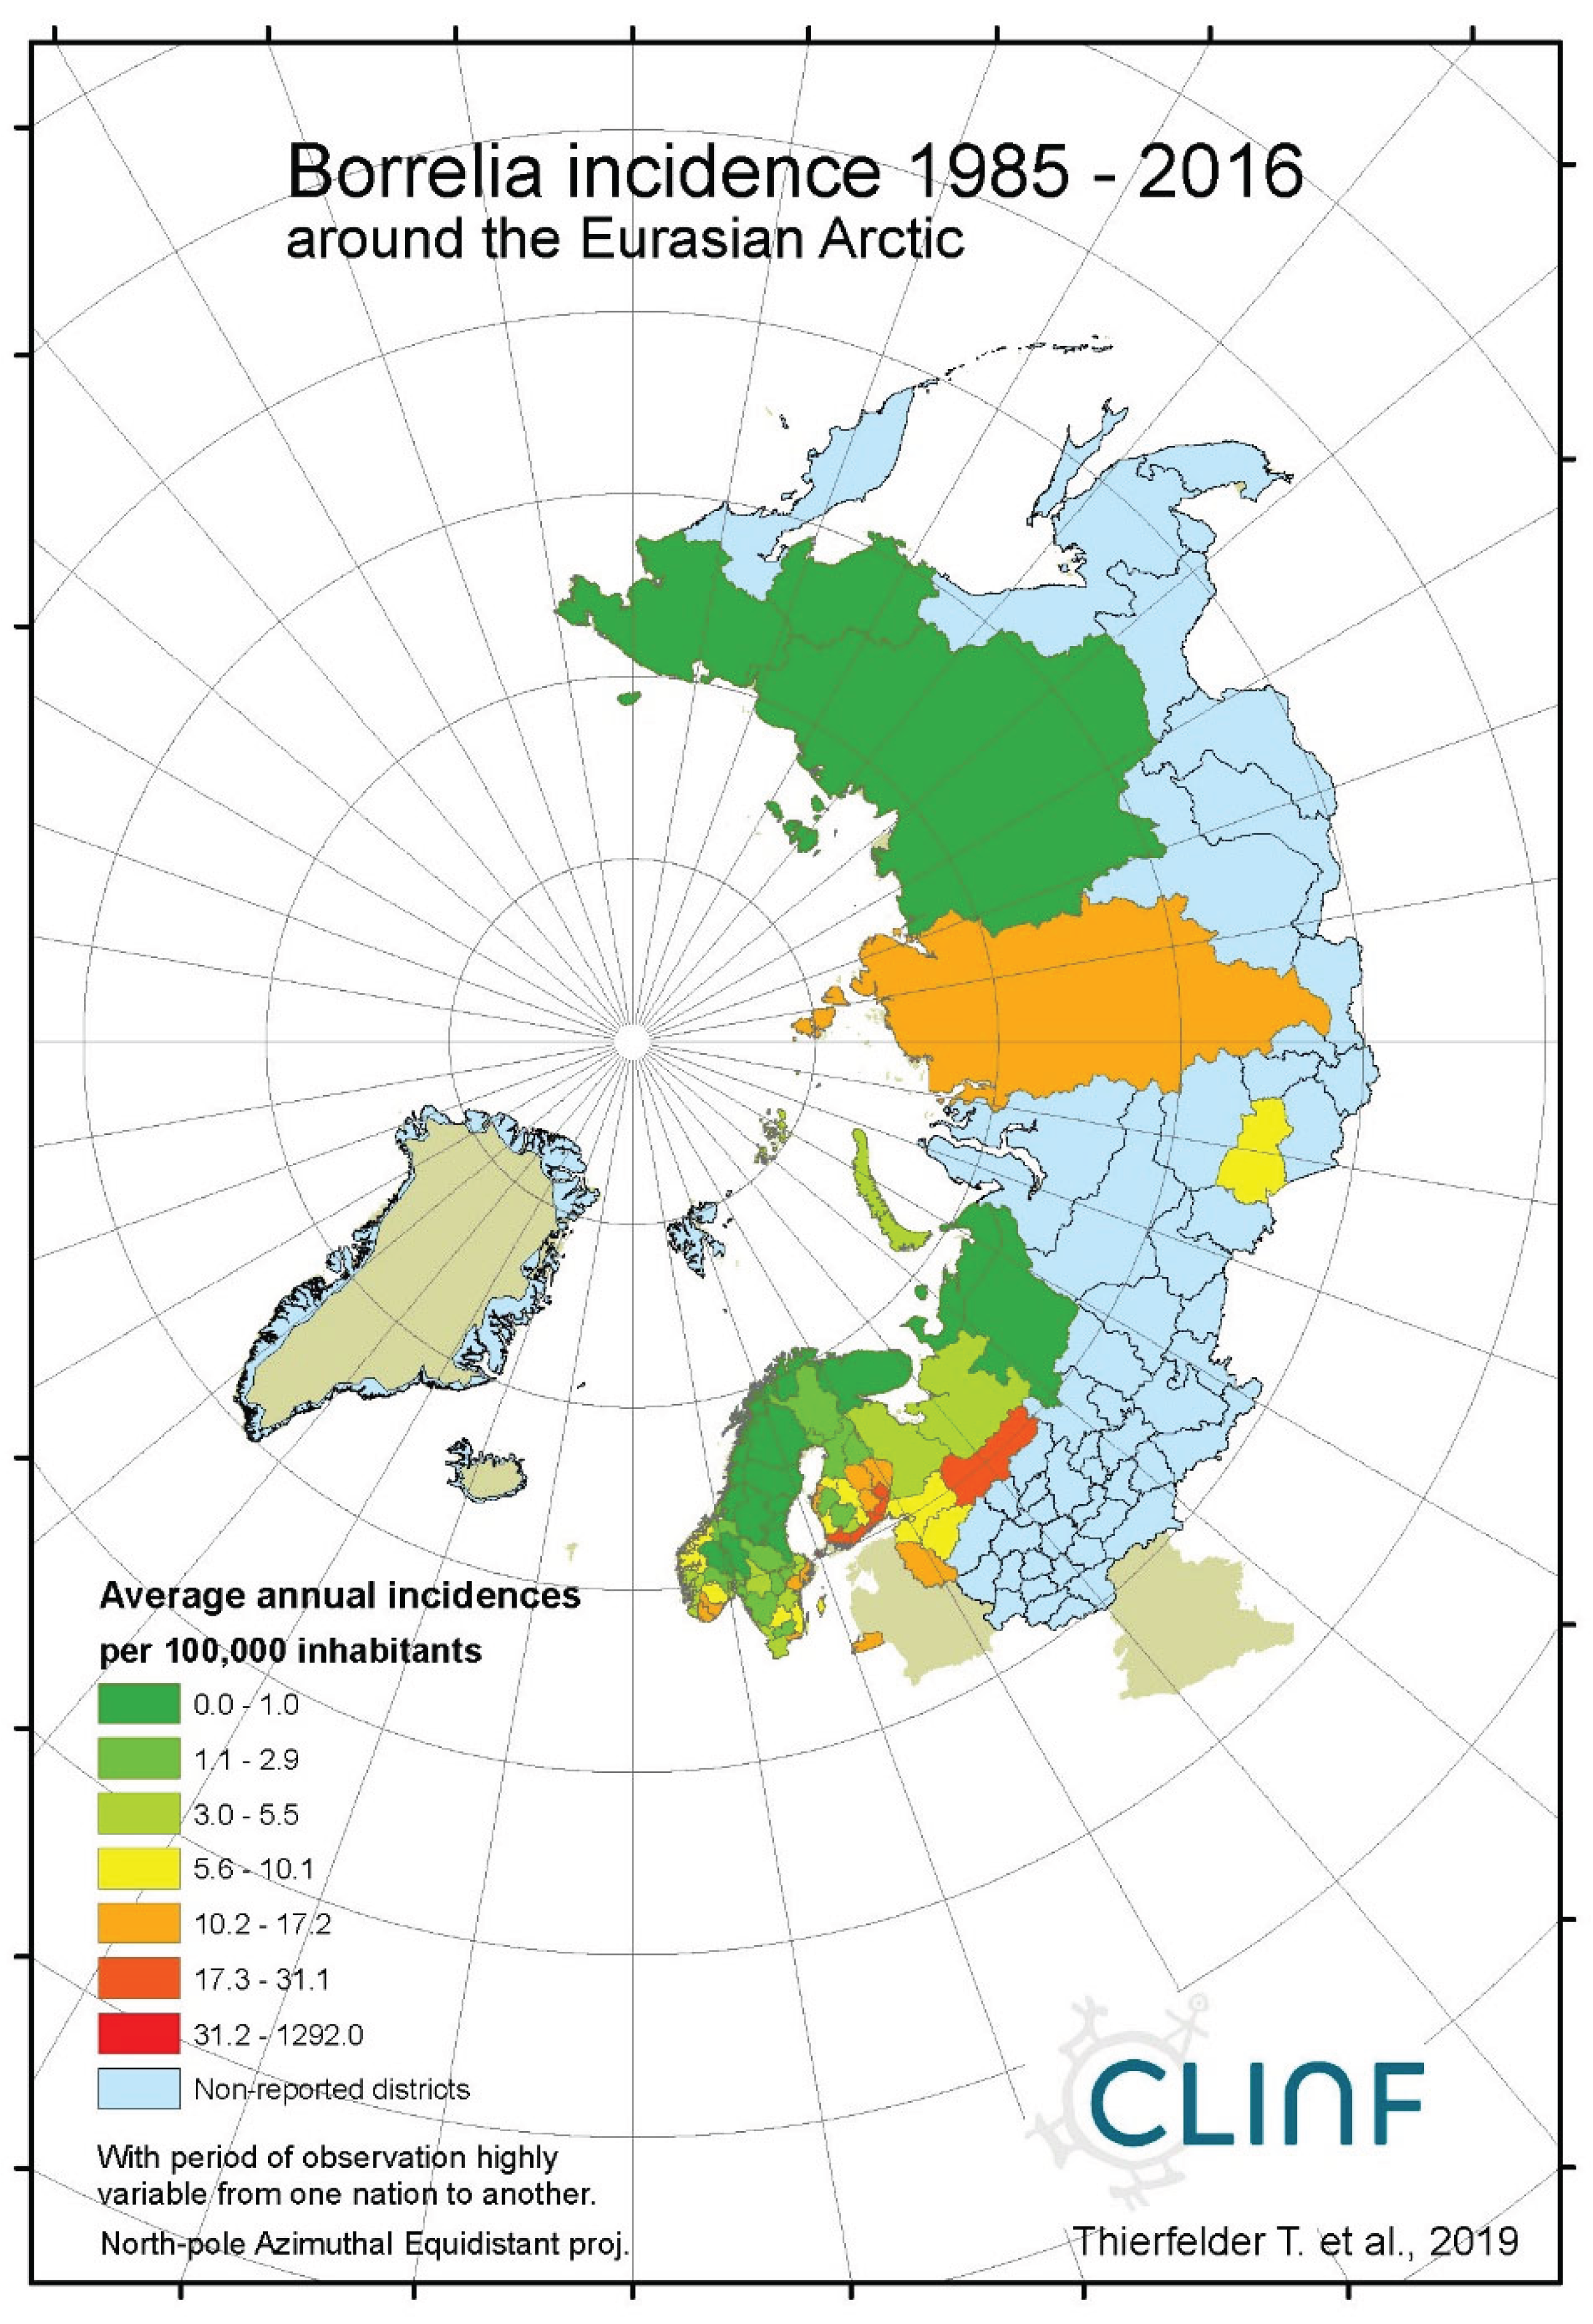
Figure 1b.
Average annual Borreliosis incidences as observed through the approximate thirty-year climate reference period, across continental Europe. Borreliosis incidences are extremely high at the Finnish/Baltic archipelago of Ahvenanmaa (Aland).
Figure 1b.
Average annual Borreliosis incidences as observed through the approximate thirty-year climate reference period, across continental Europe. Borreliosis incidences are extremely high at the Finnish/Baltic archipelago of Ahvenanmaa (Aland).
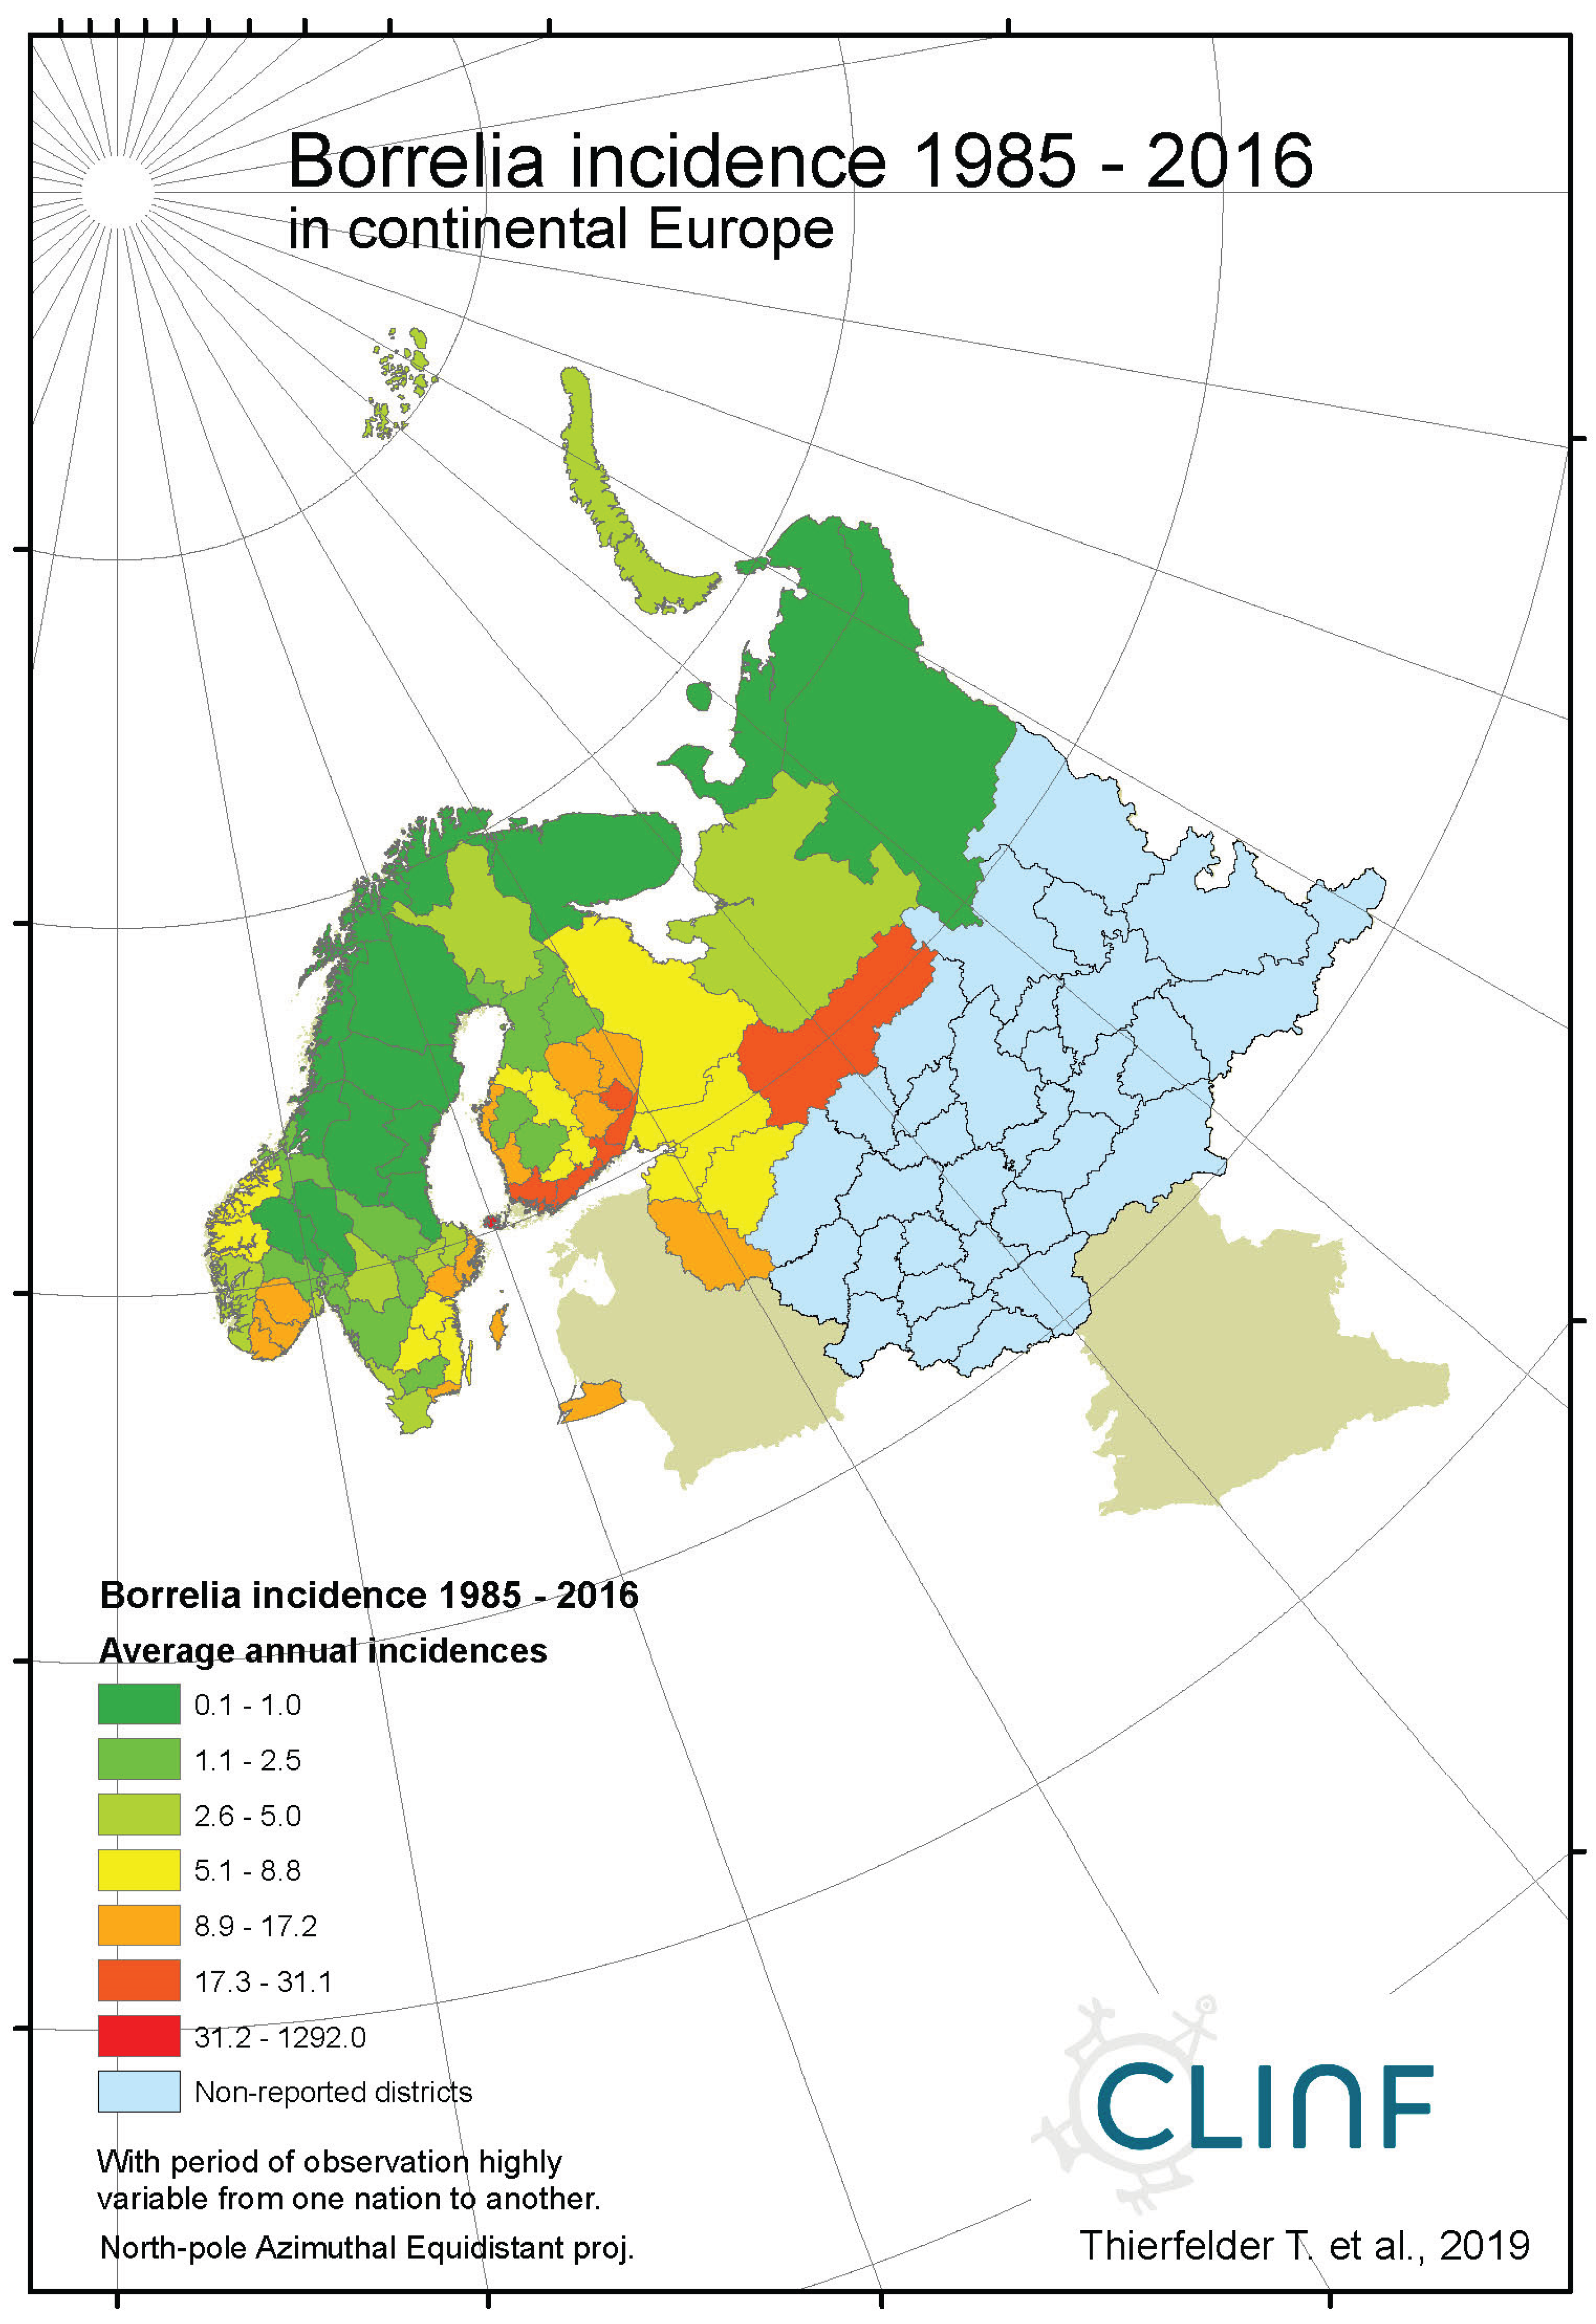
Figure 1c.
Average annual Borreliosis incidences as observed through the approximate thirty-year climate reference period, across Norway, Sweden, and Finland. Borreliosis incidences are extremely high at the Finnish/Baltic archipelago of Ahvenanmaa (Aland).
Figure 1c.
Average annual Borreliosis incidences as observed through the approximate thirty-year climate reference period, across Norway, Sweden, and Finland. Borreliosis incidences are extremely high at the Finnish/Baltic archipelago of Ahvenanmaa (Aland).
Appendix B2. Brucellosis
Figure 2a.
Average annual Brucellosis incidences as observed through the approximate thirty-year climate reference period, across the entire CLINF study region.
Figure 2a.
Average annual Brucellosis incidences as observed through the approximate thirty-year climate reference period, across the entire CLINF study region.
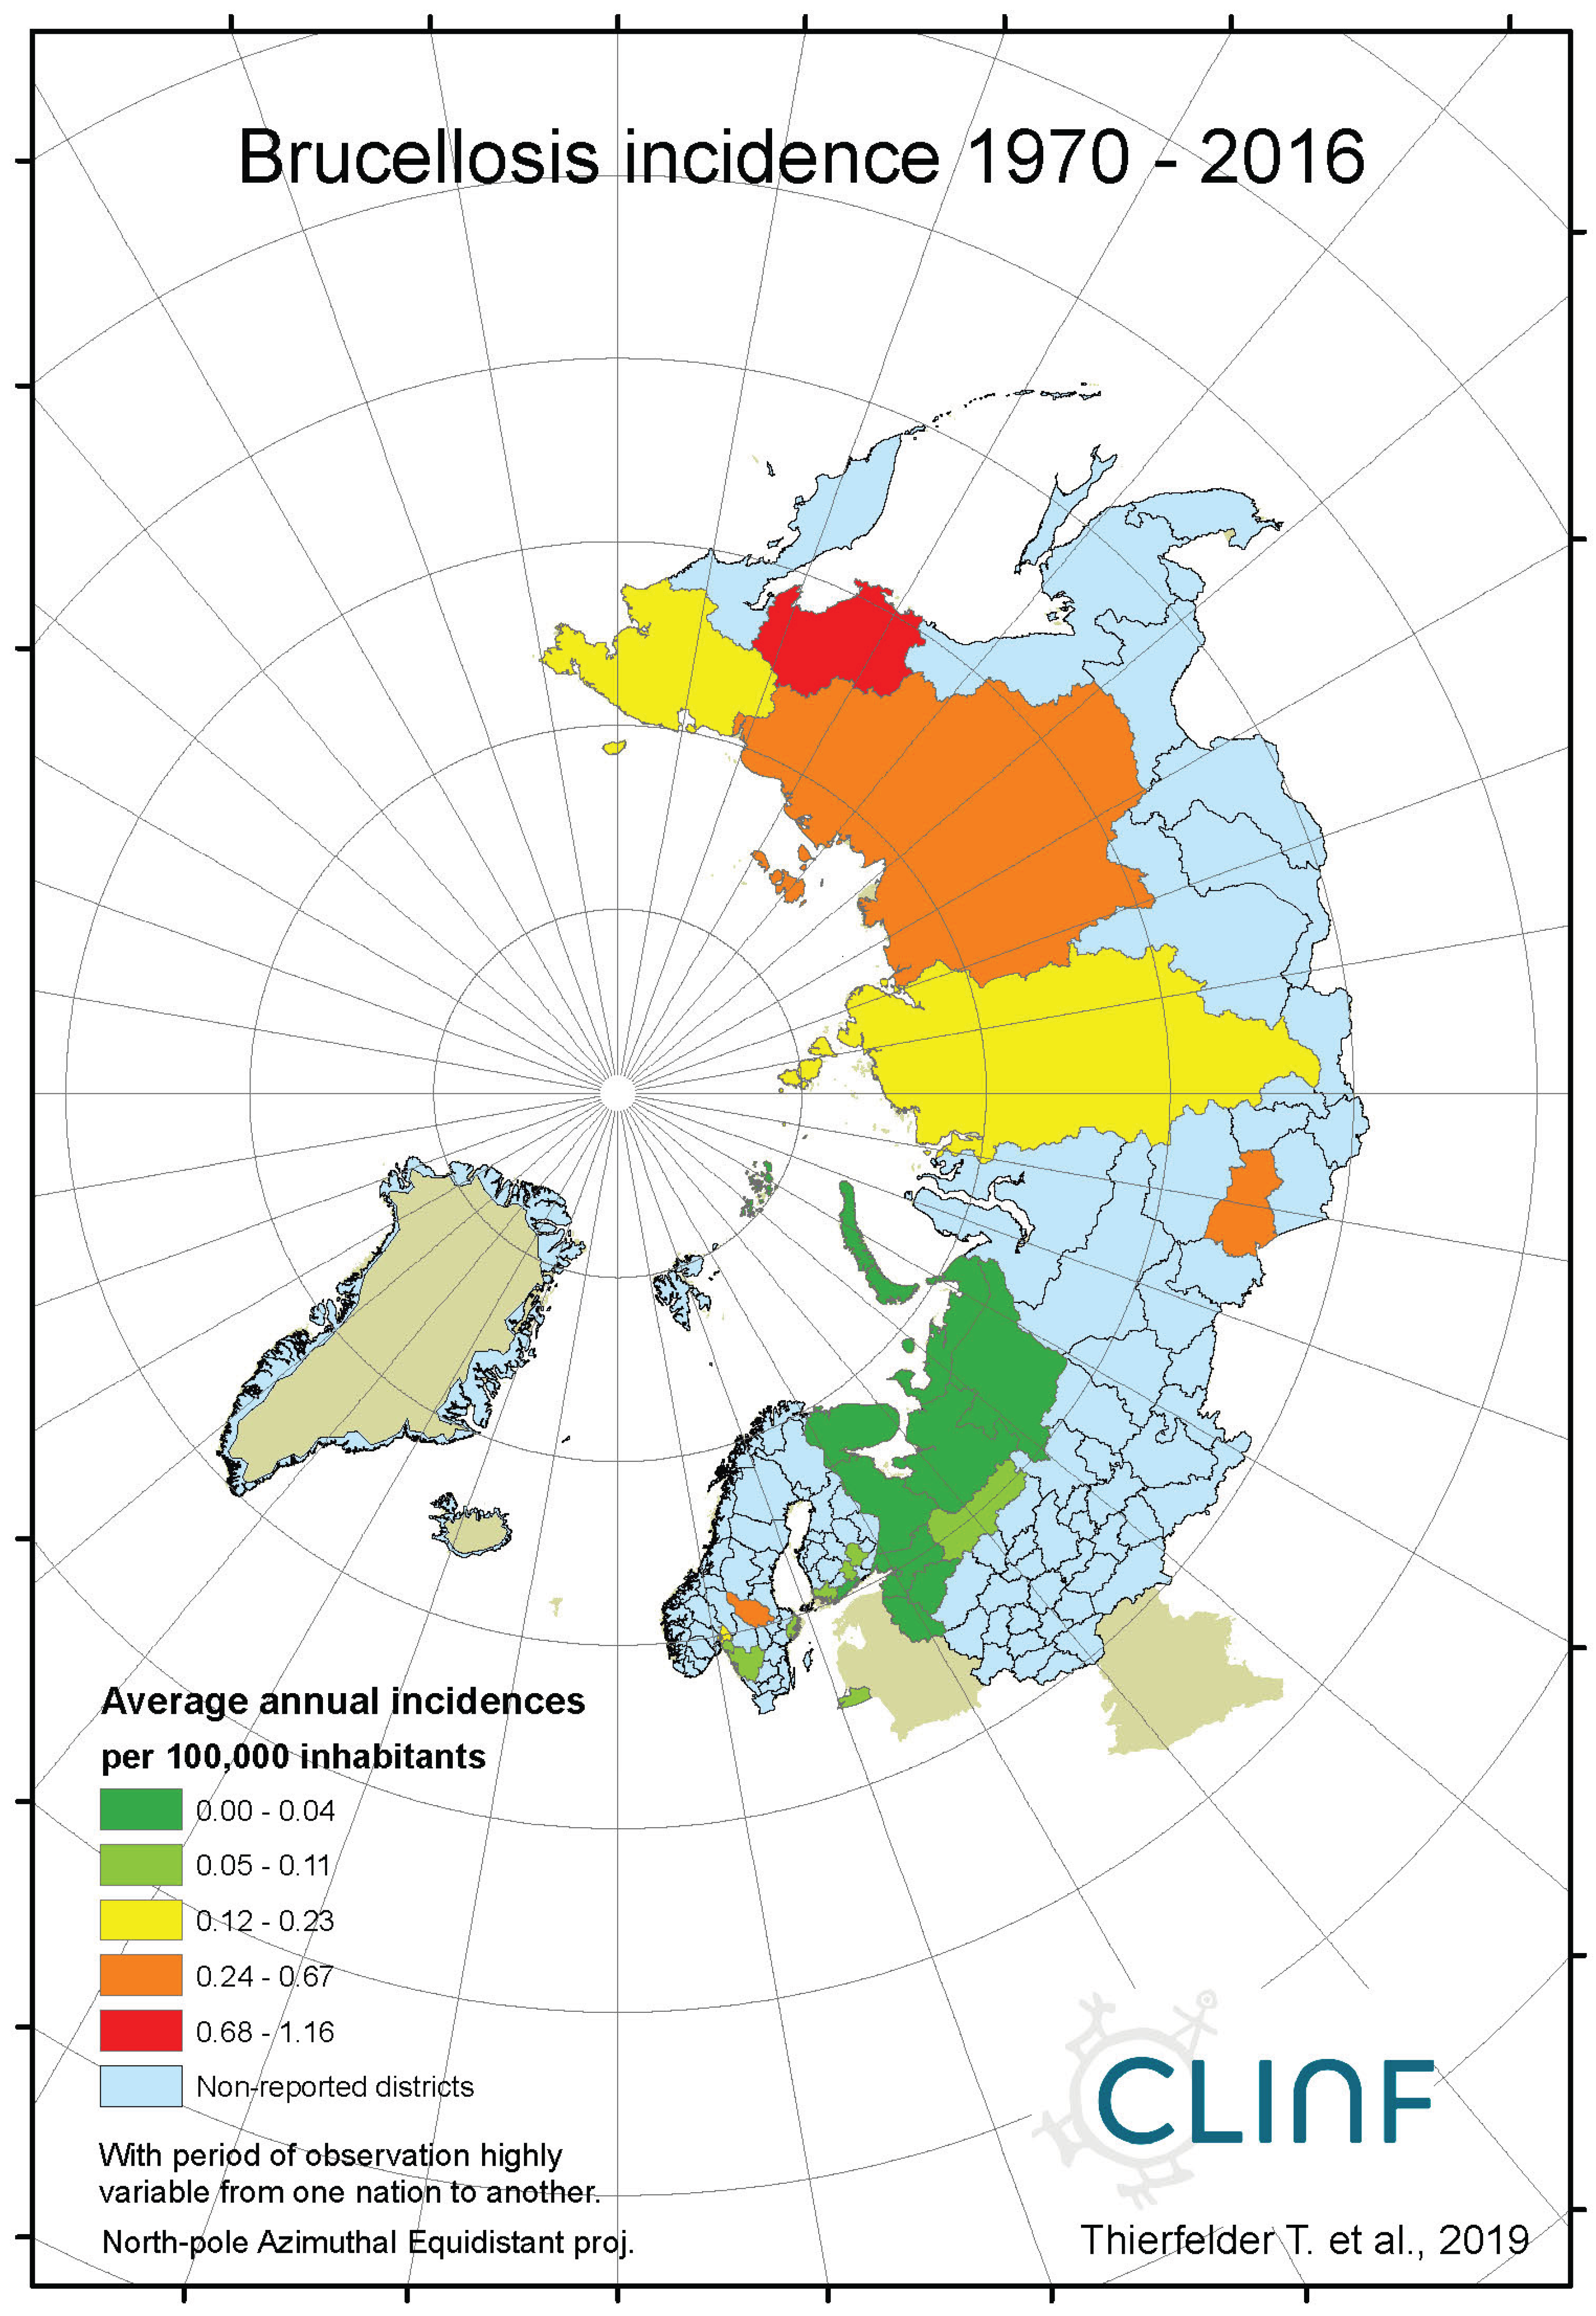
Figure 2b.
Average annual Brucellosis incidences as observed through the approximate thirty-year climate reference period, across continental Europe.
Figure 2b.
Average annual Brucellosis incidences as observed through the approximate thirty-year climate reference period, across continental Europe.
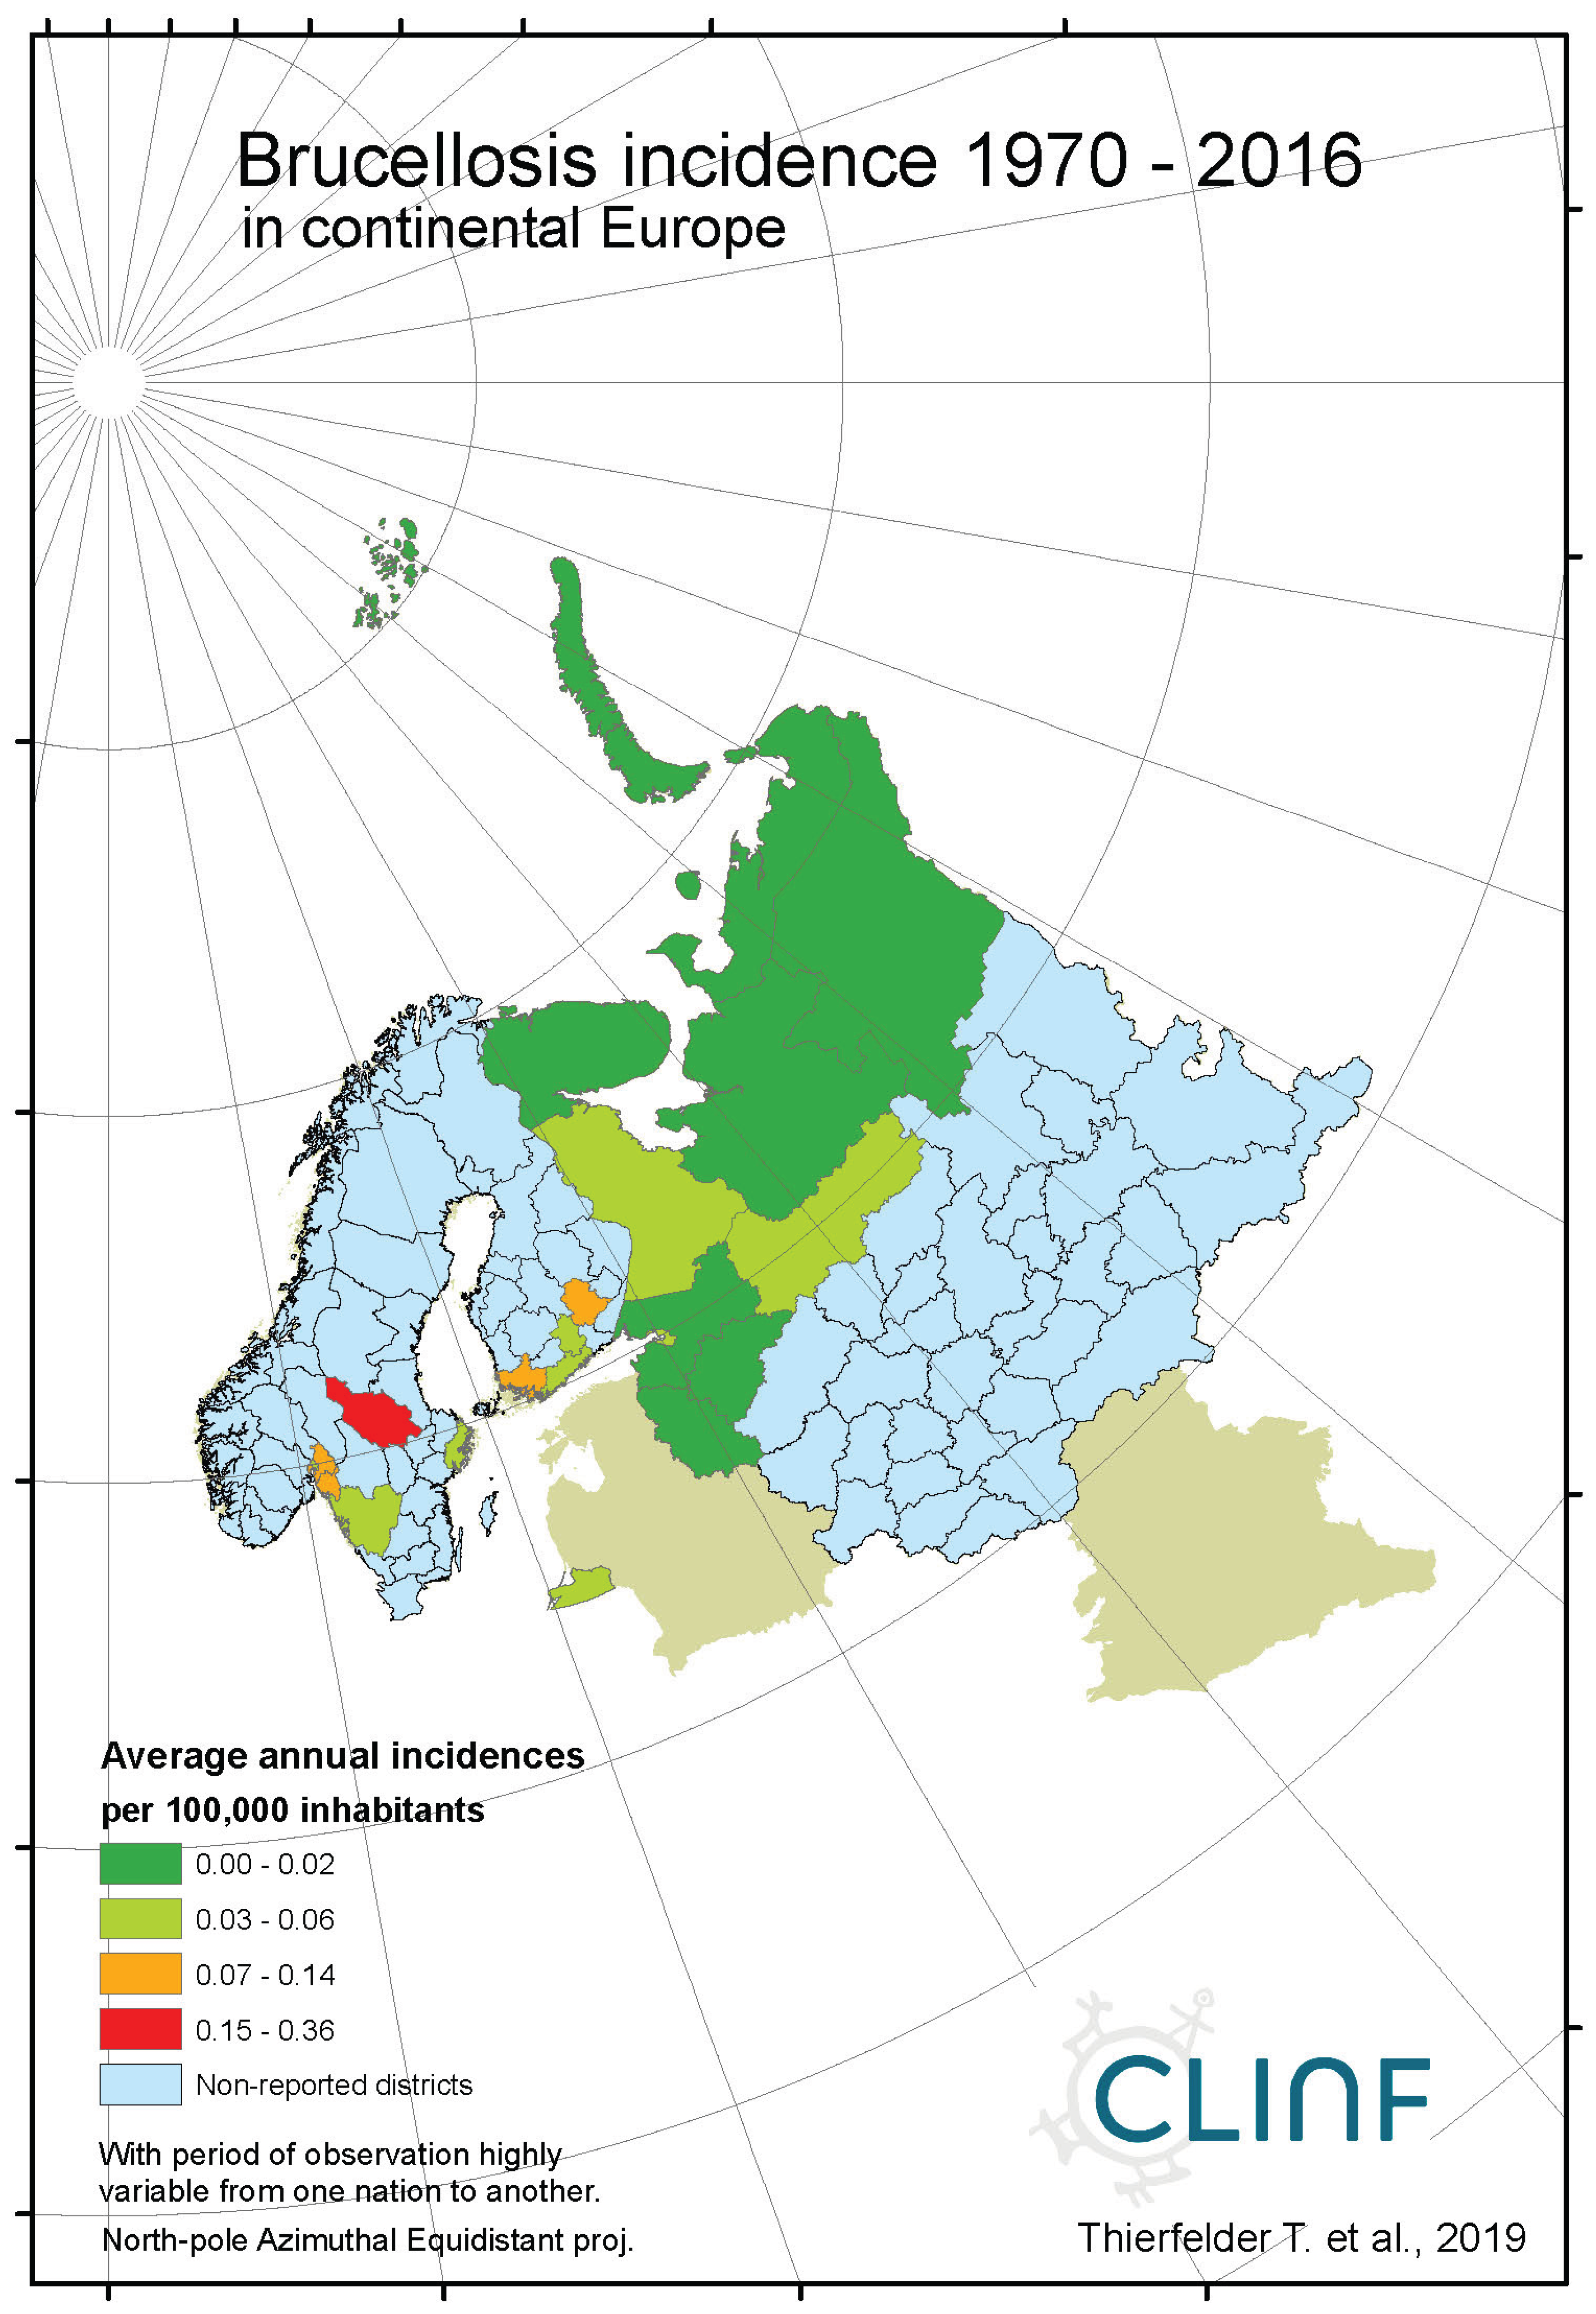
Figure 2c.
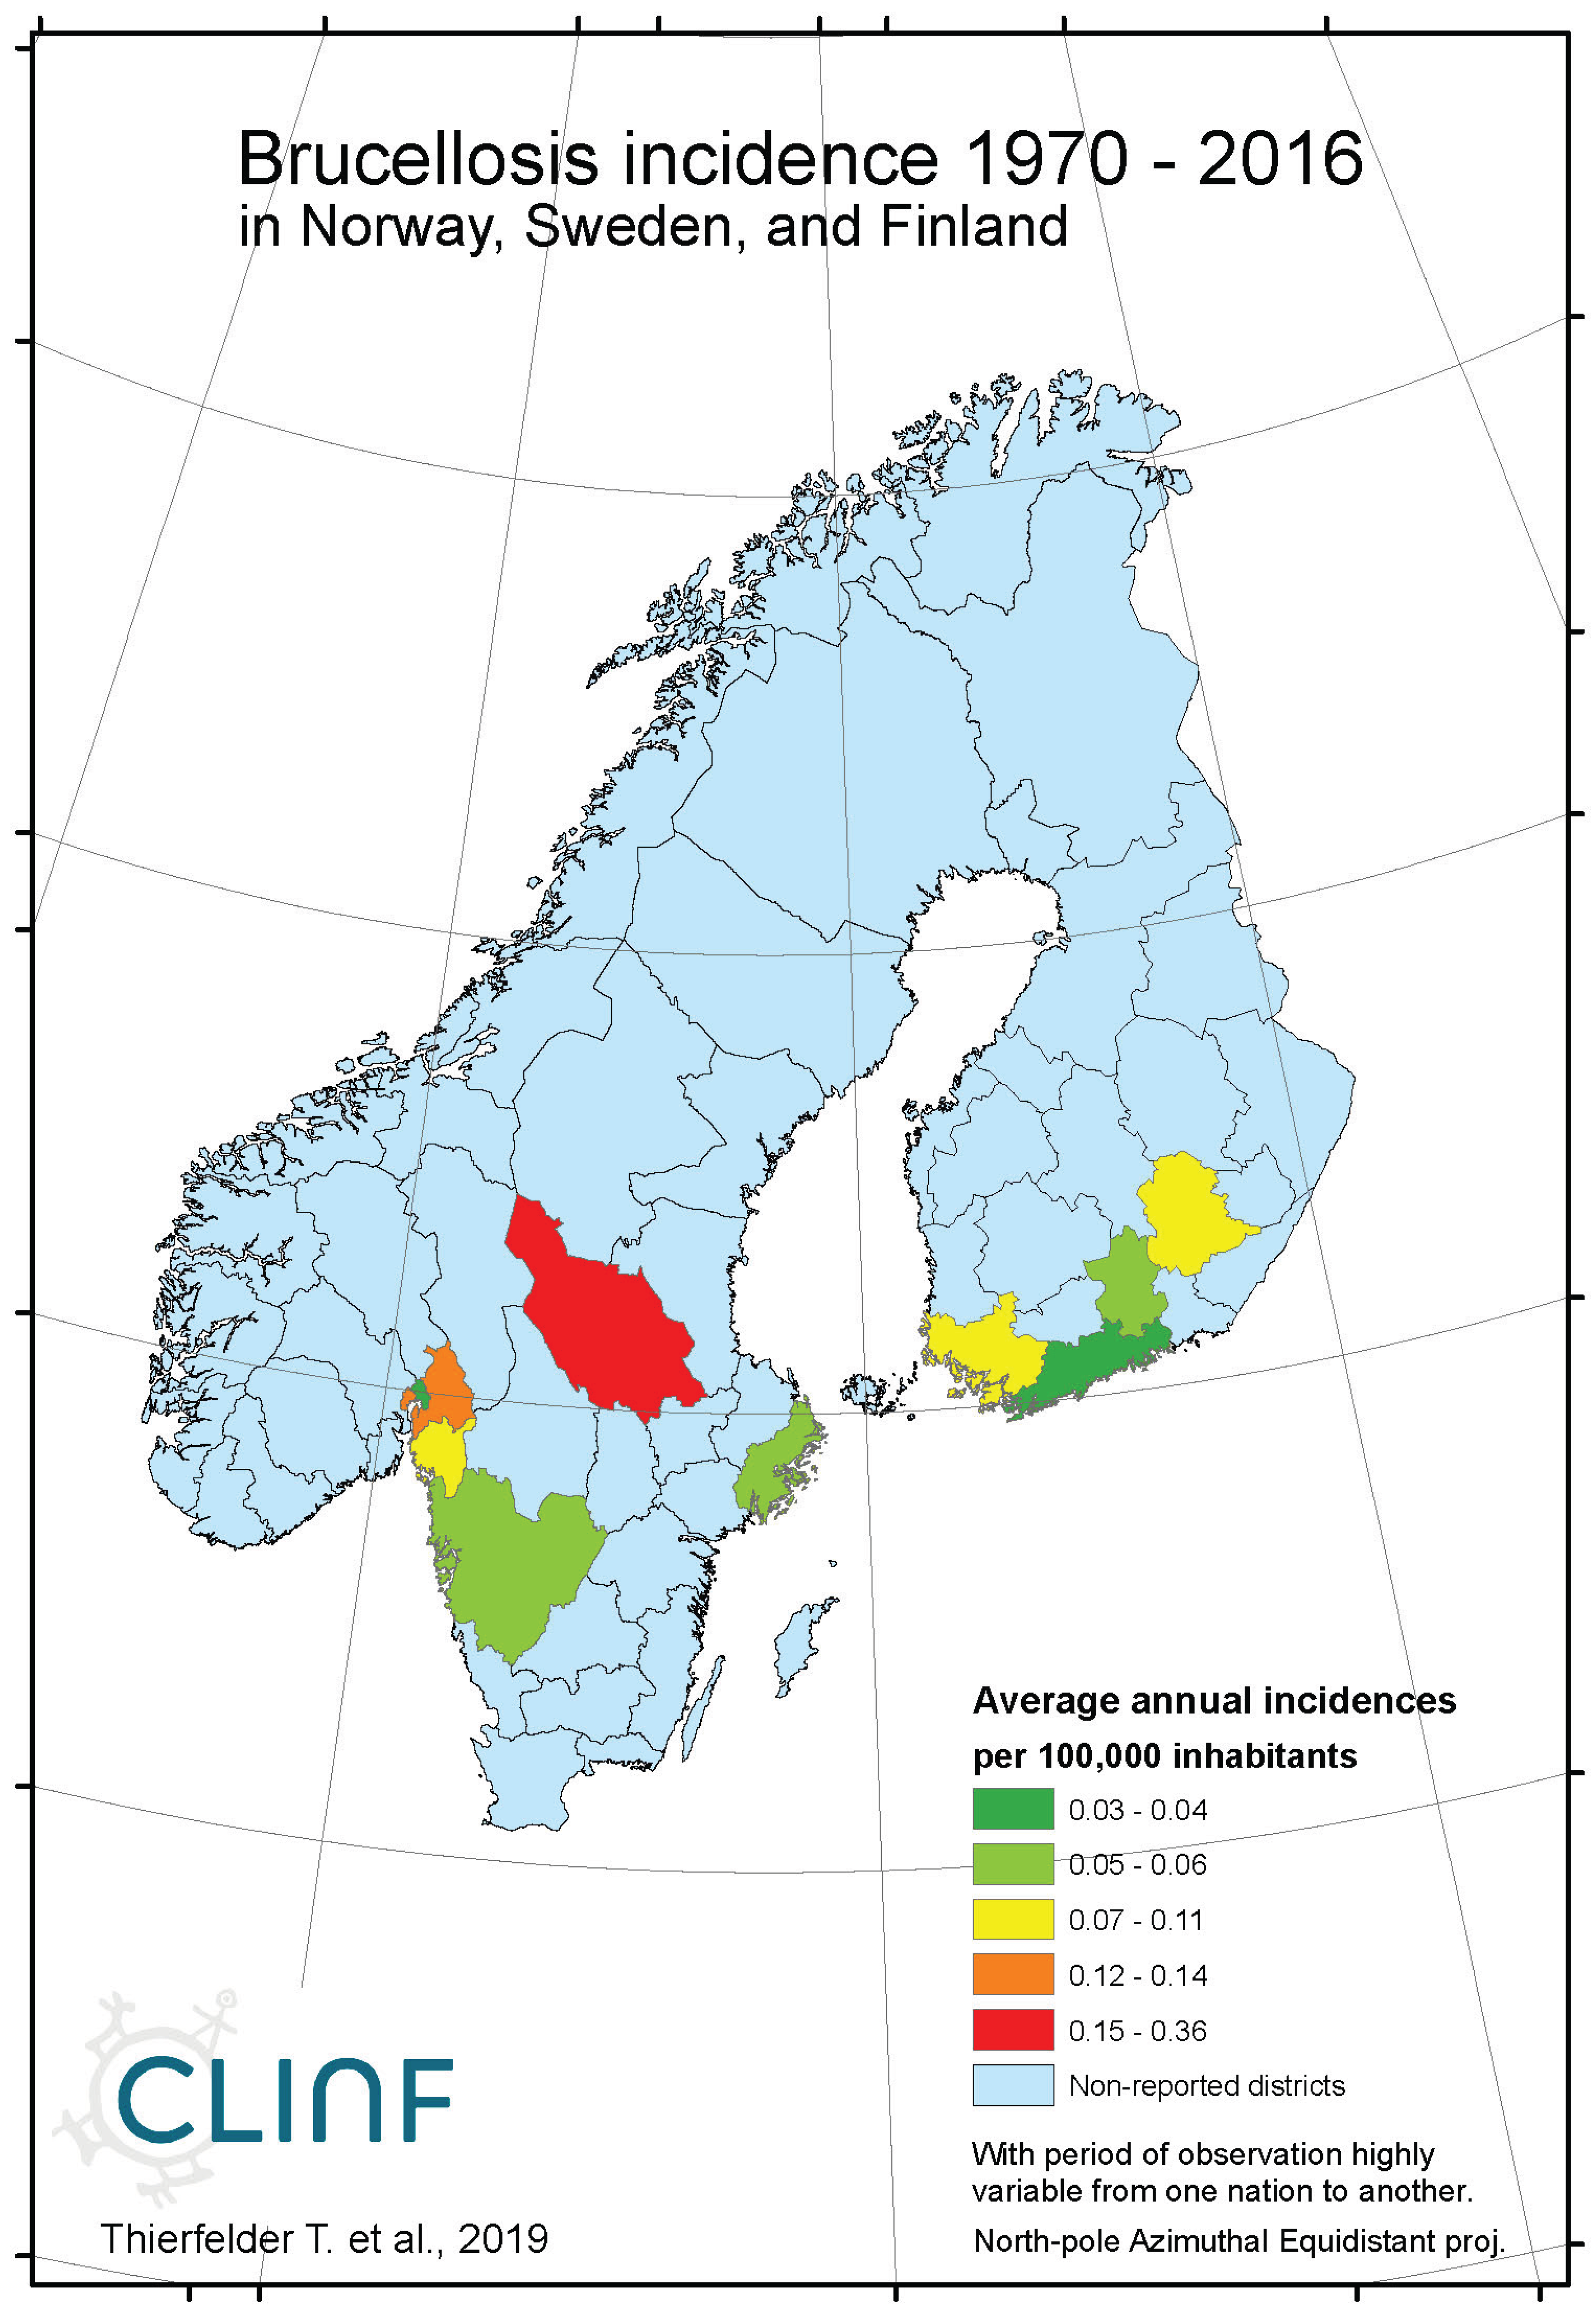
Average annual Brucellosis incidences as observed through the approximate thirty-year climate reference period, across Norway, Sweden, and Finland.
Figure 2c.
Average annual Brucellosis incidences as observed through the approximate thirty-year climate reference period, across Norway, Sweden, and Finland.
Appendix B3. Cryptosporidiosis
Figure 3.
Average annual Cryptosporidiosis incidences as observed through the approximate thirty-year climate reference period, across Norway, Sweden, and Finland.
Figure 3.
Average annual Cryptosporidiosis incidences as observed through the approximate thirty-year climate reference period, across Norway, Sweden, and Finland.
Appendix B4. Hantavirus Haemorrhagic Fever with Renal Syndrome (Puumala Fever)
Figure 4a.
Average annual Puumala incidences as observed through the approximate thirty-year climate reference period, across the entire CLINF study region.
Figure 4a.
Average annual Puumala incidences as observed through the approximate thirty-year climate reference period, across the entire CLINF study region.
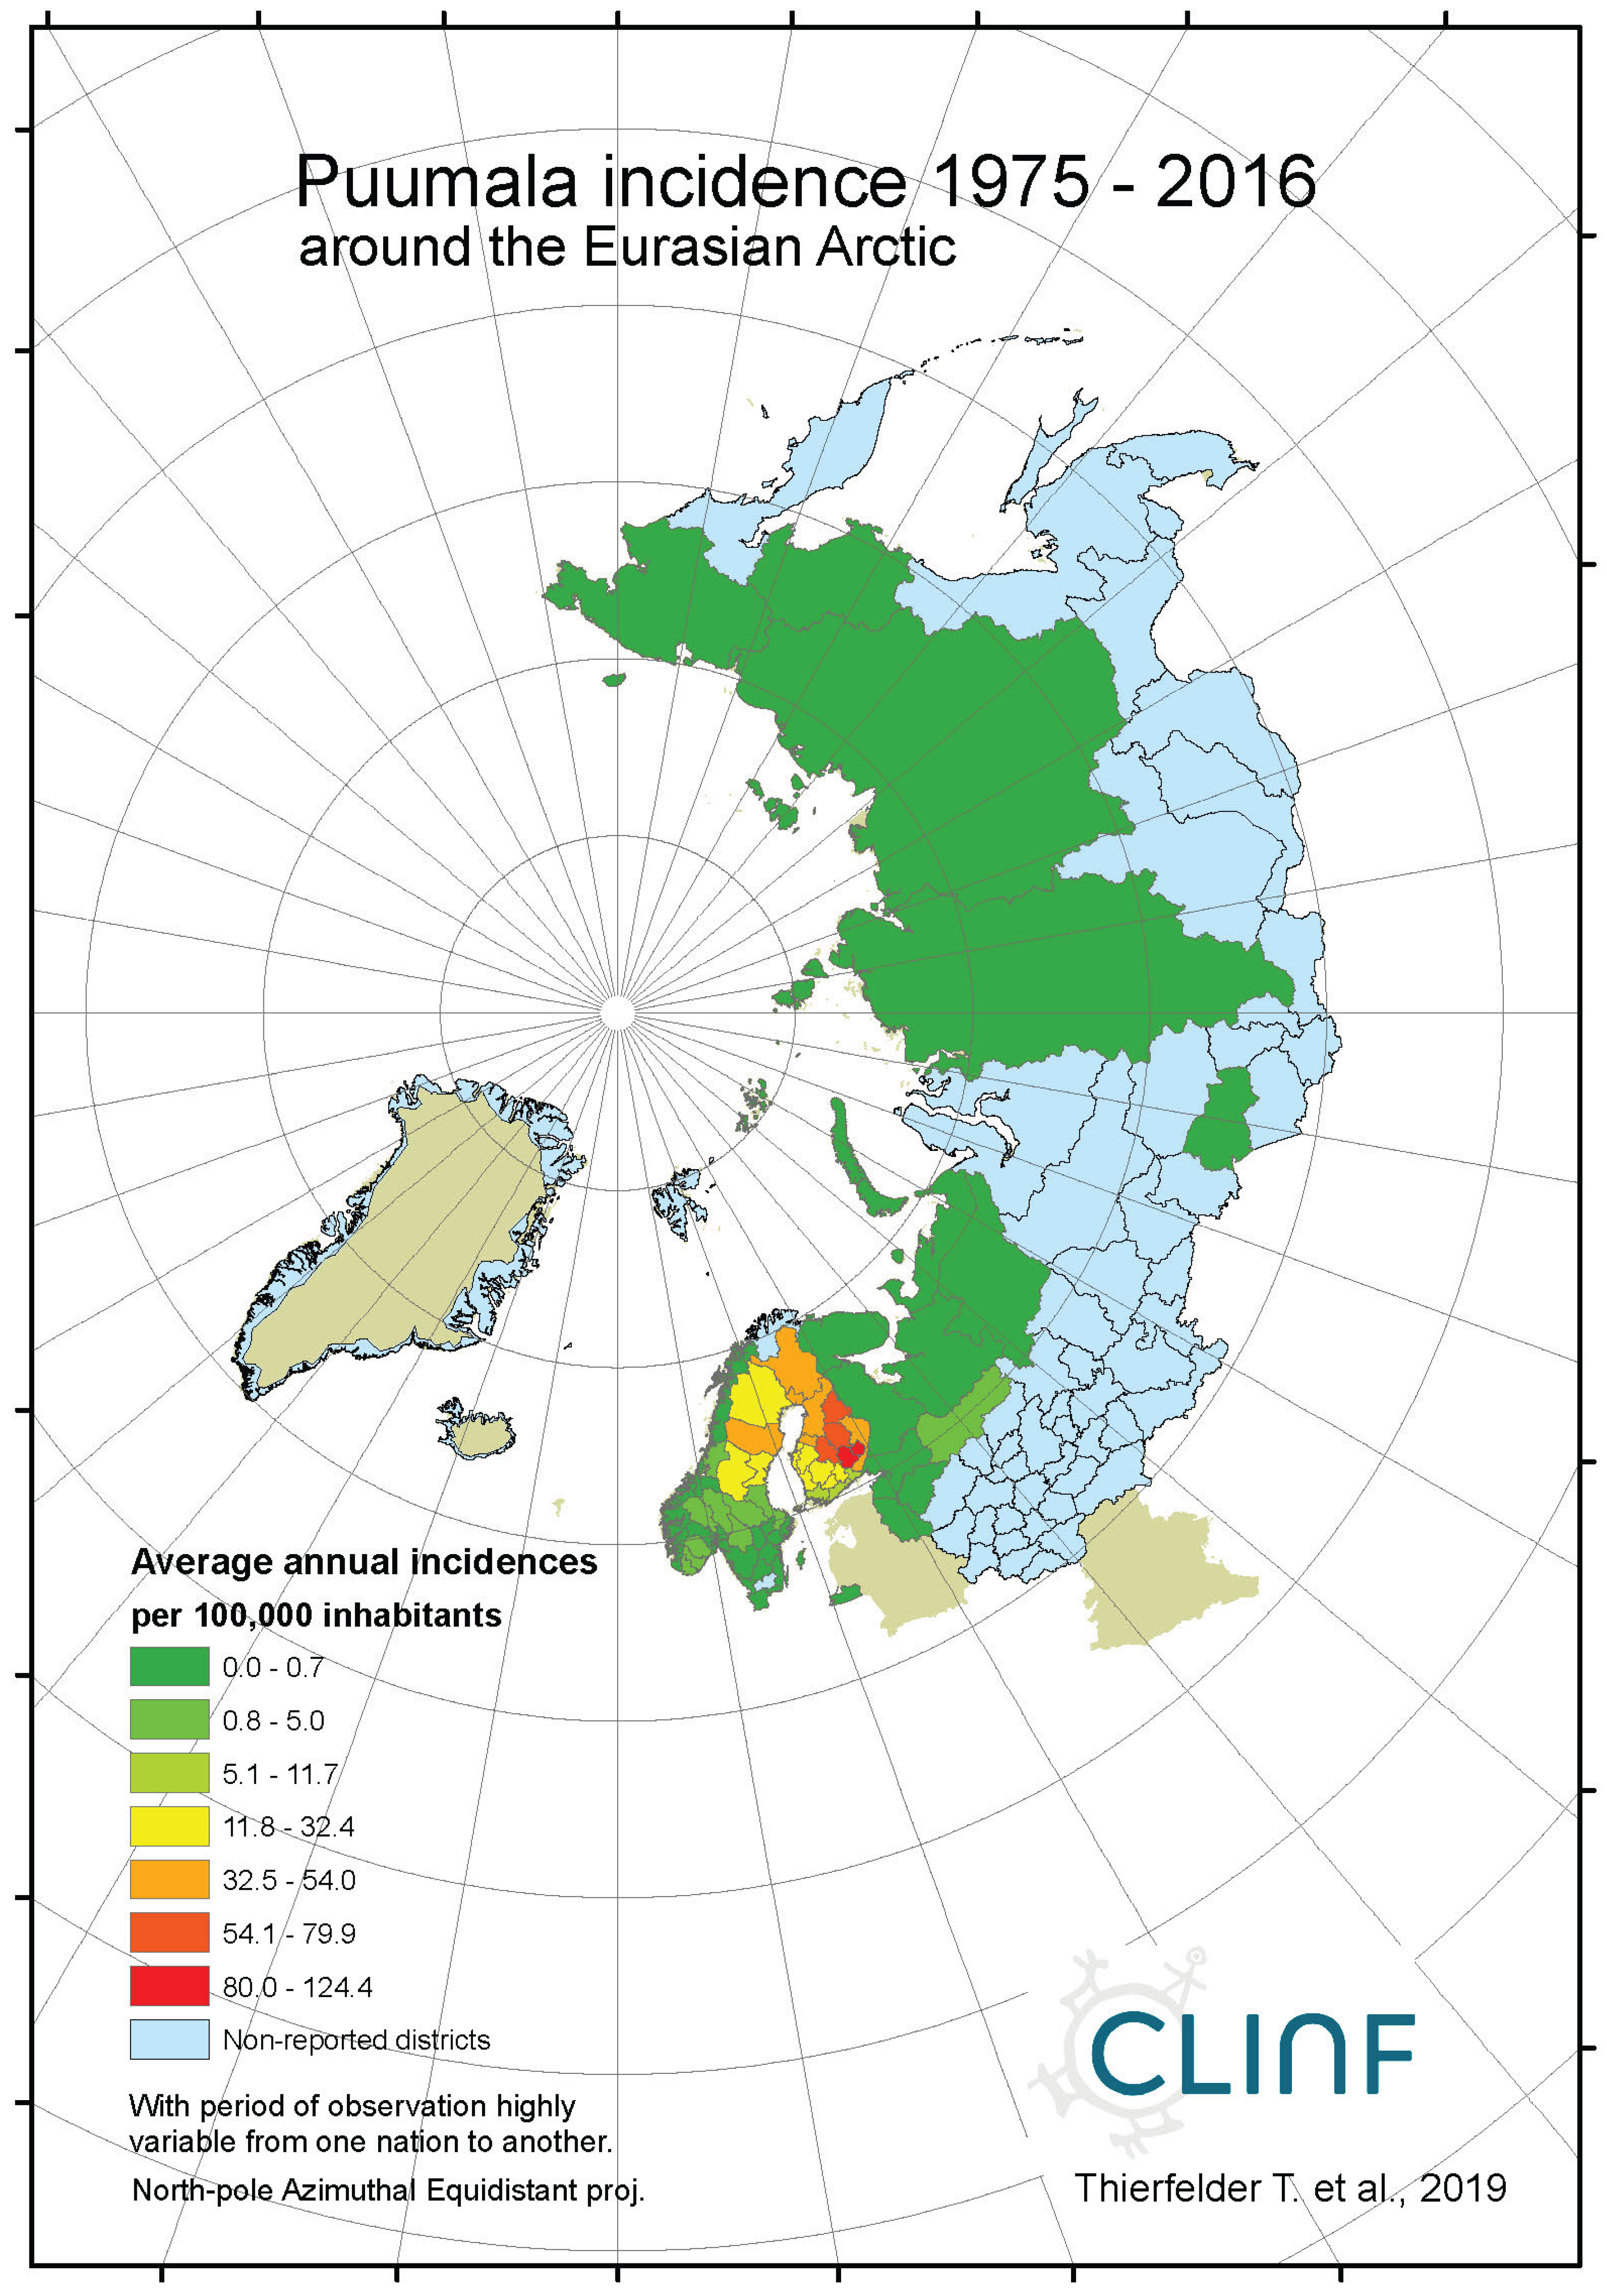
Figure 4b.
Average annual Puumala incidences as observed through the approximate thirty-year climate reference period, across continental Europe.
Figure 4b.
Average annual Puumala incidences as observed through the approximate thirty-year climate reference period, across continental Europe.
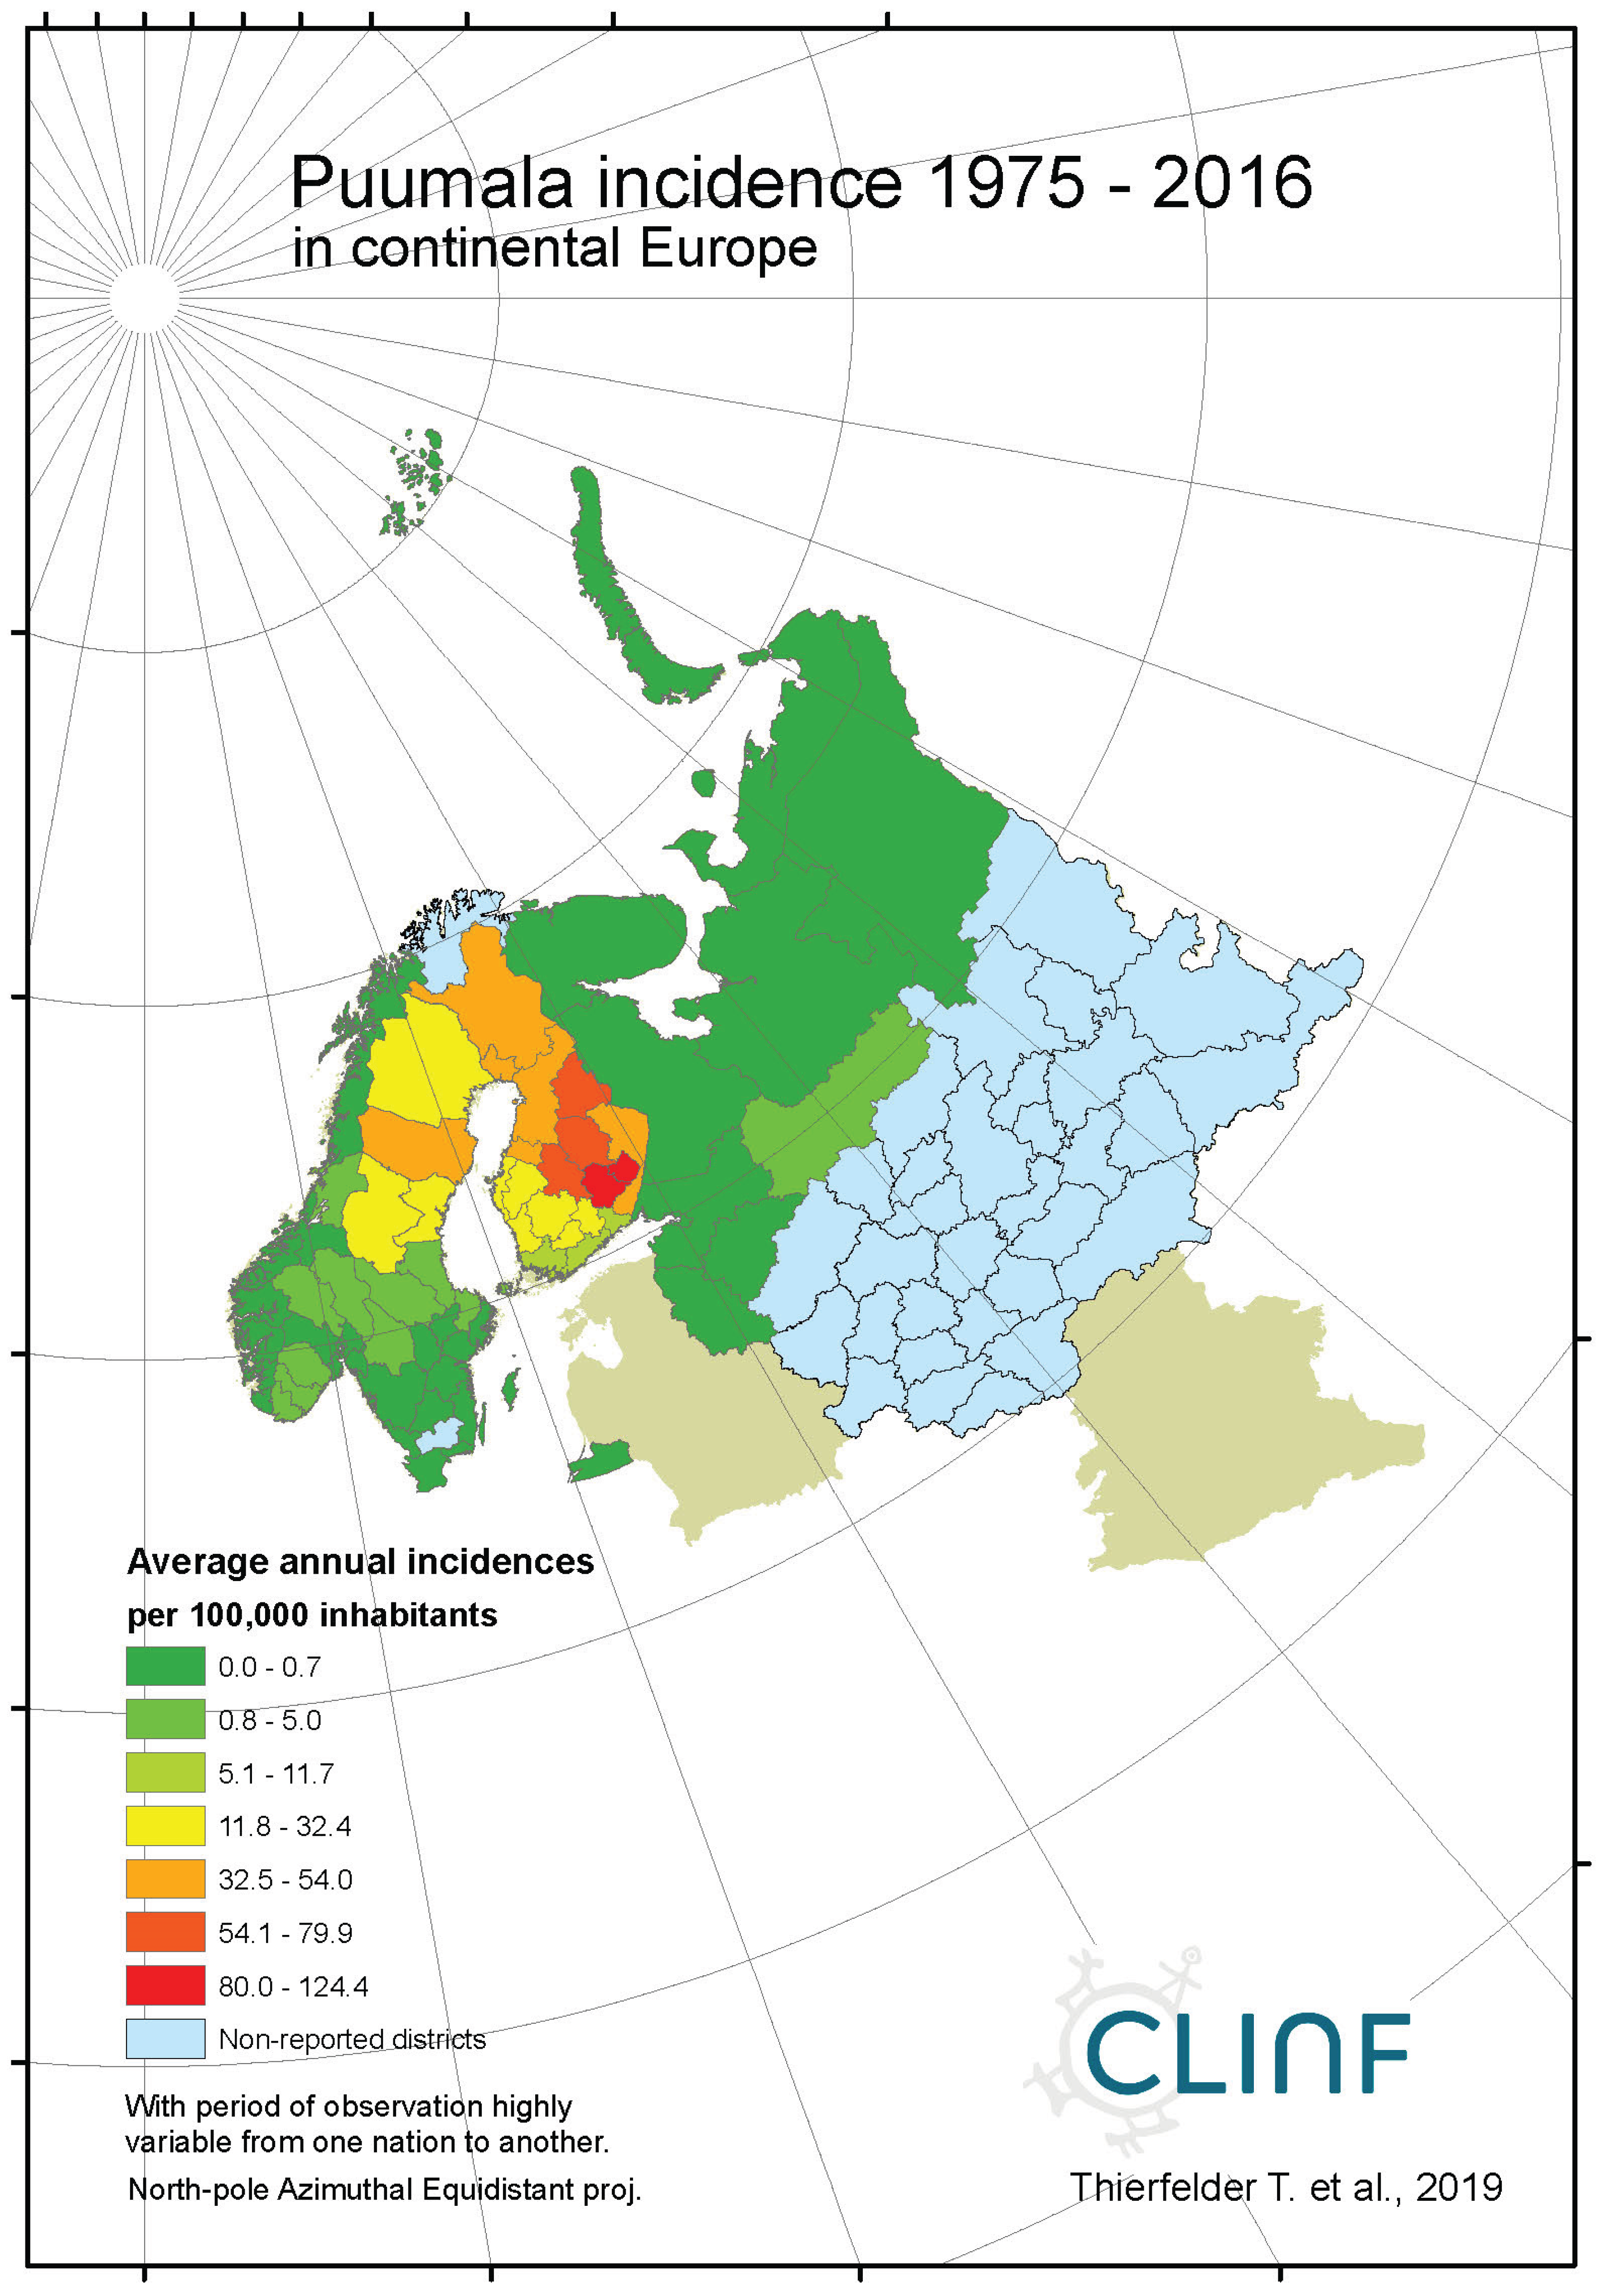
Figure 5c.
Average annual Puumala incidences as observed through the approximate thirty-year climate reference period, across Norway, Sweden, and Finland.
Figure 5c.
Average annual Puumala incidences as observed through the approximate thirty-year climate reference period, across Norway, Sweden, and Finland.
Appendix B5. Leptospirosis
Figure 5a.
Average annual Leptospirosis incidences as observed through the approximate thirty-year climate reference period, across the entire CLINF study region.
Figure 5a.
Average annual Leptospirosis incidences as observed through the approximate thirty-year climate reference period, across the entire CLINF study region.
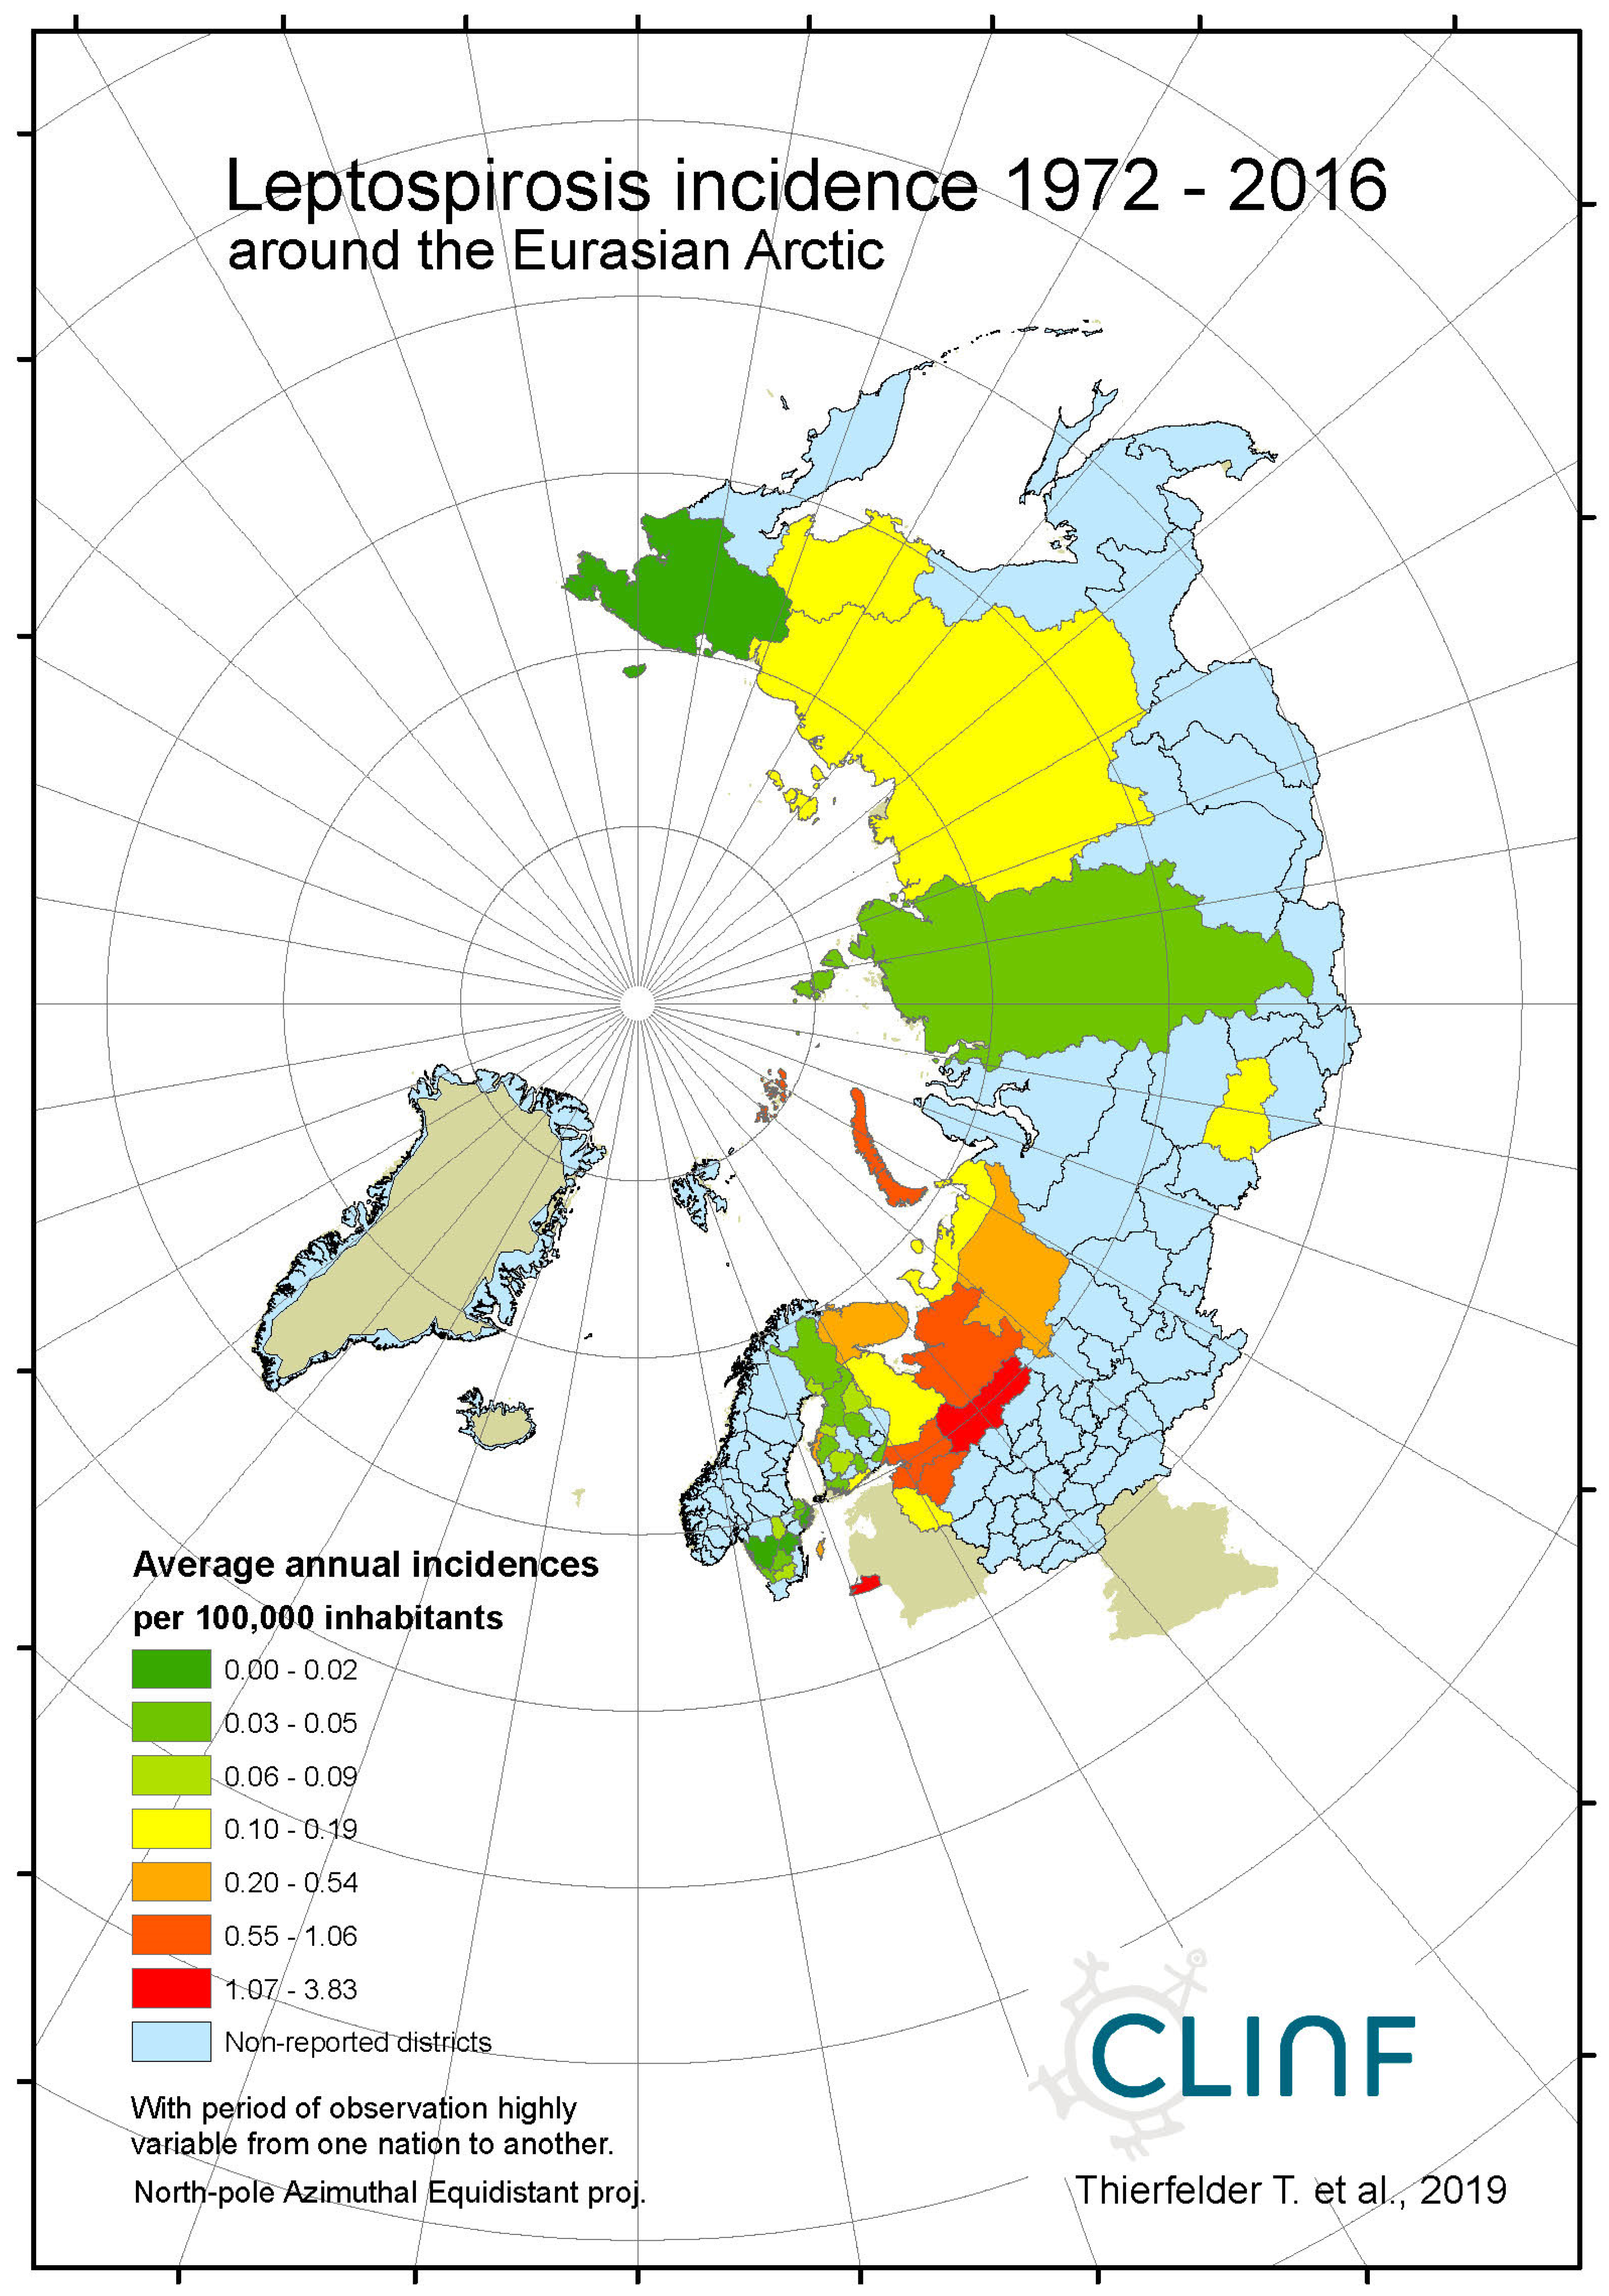
Figure 5b.
Average annual Leptospirosis incidences as observed through the approximate thirty-year climate reference period, across continental Europe.
Figure 5b.
Average annual Leptospirosis incidences as observed through the approximate thirty-year climate reference period, across continental Europe.
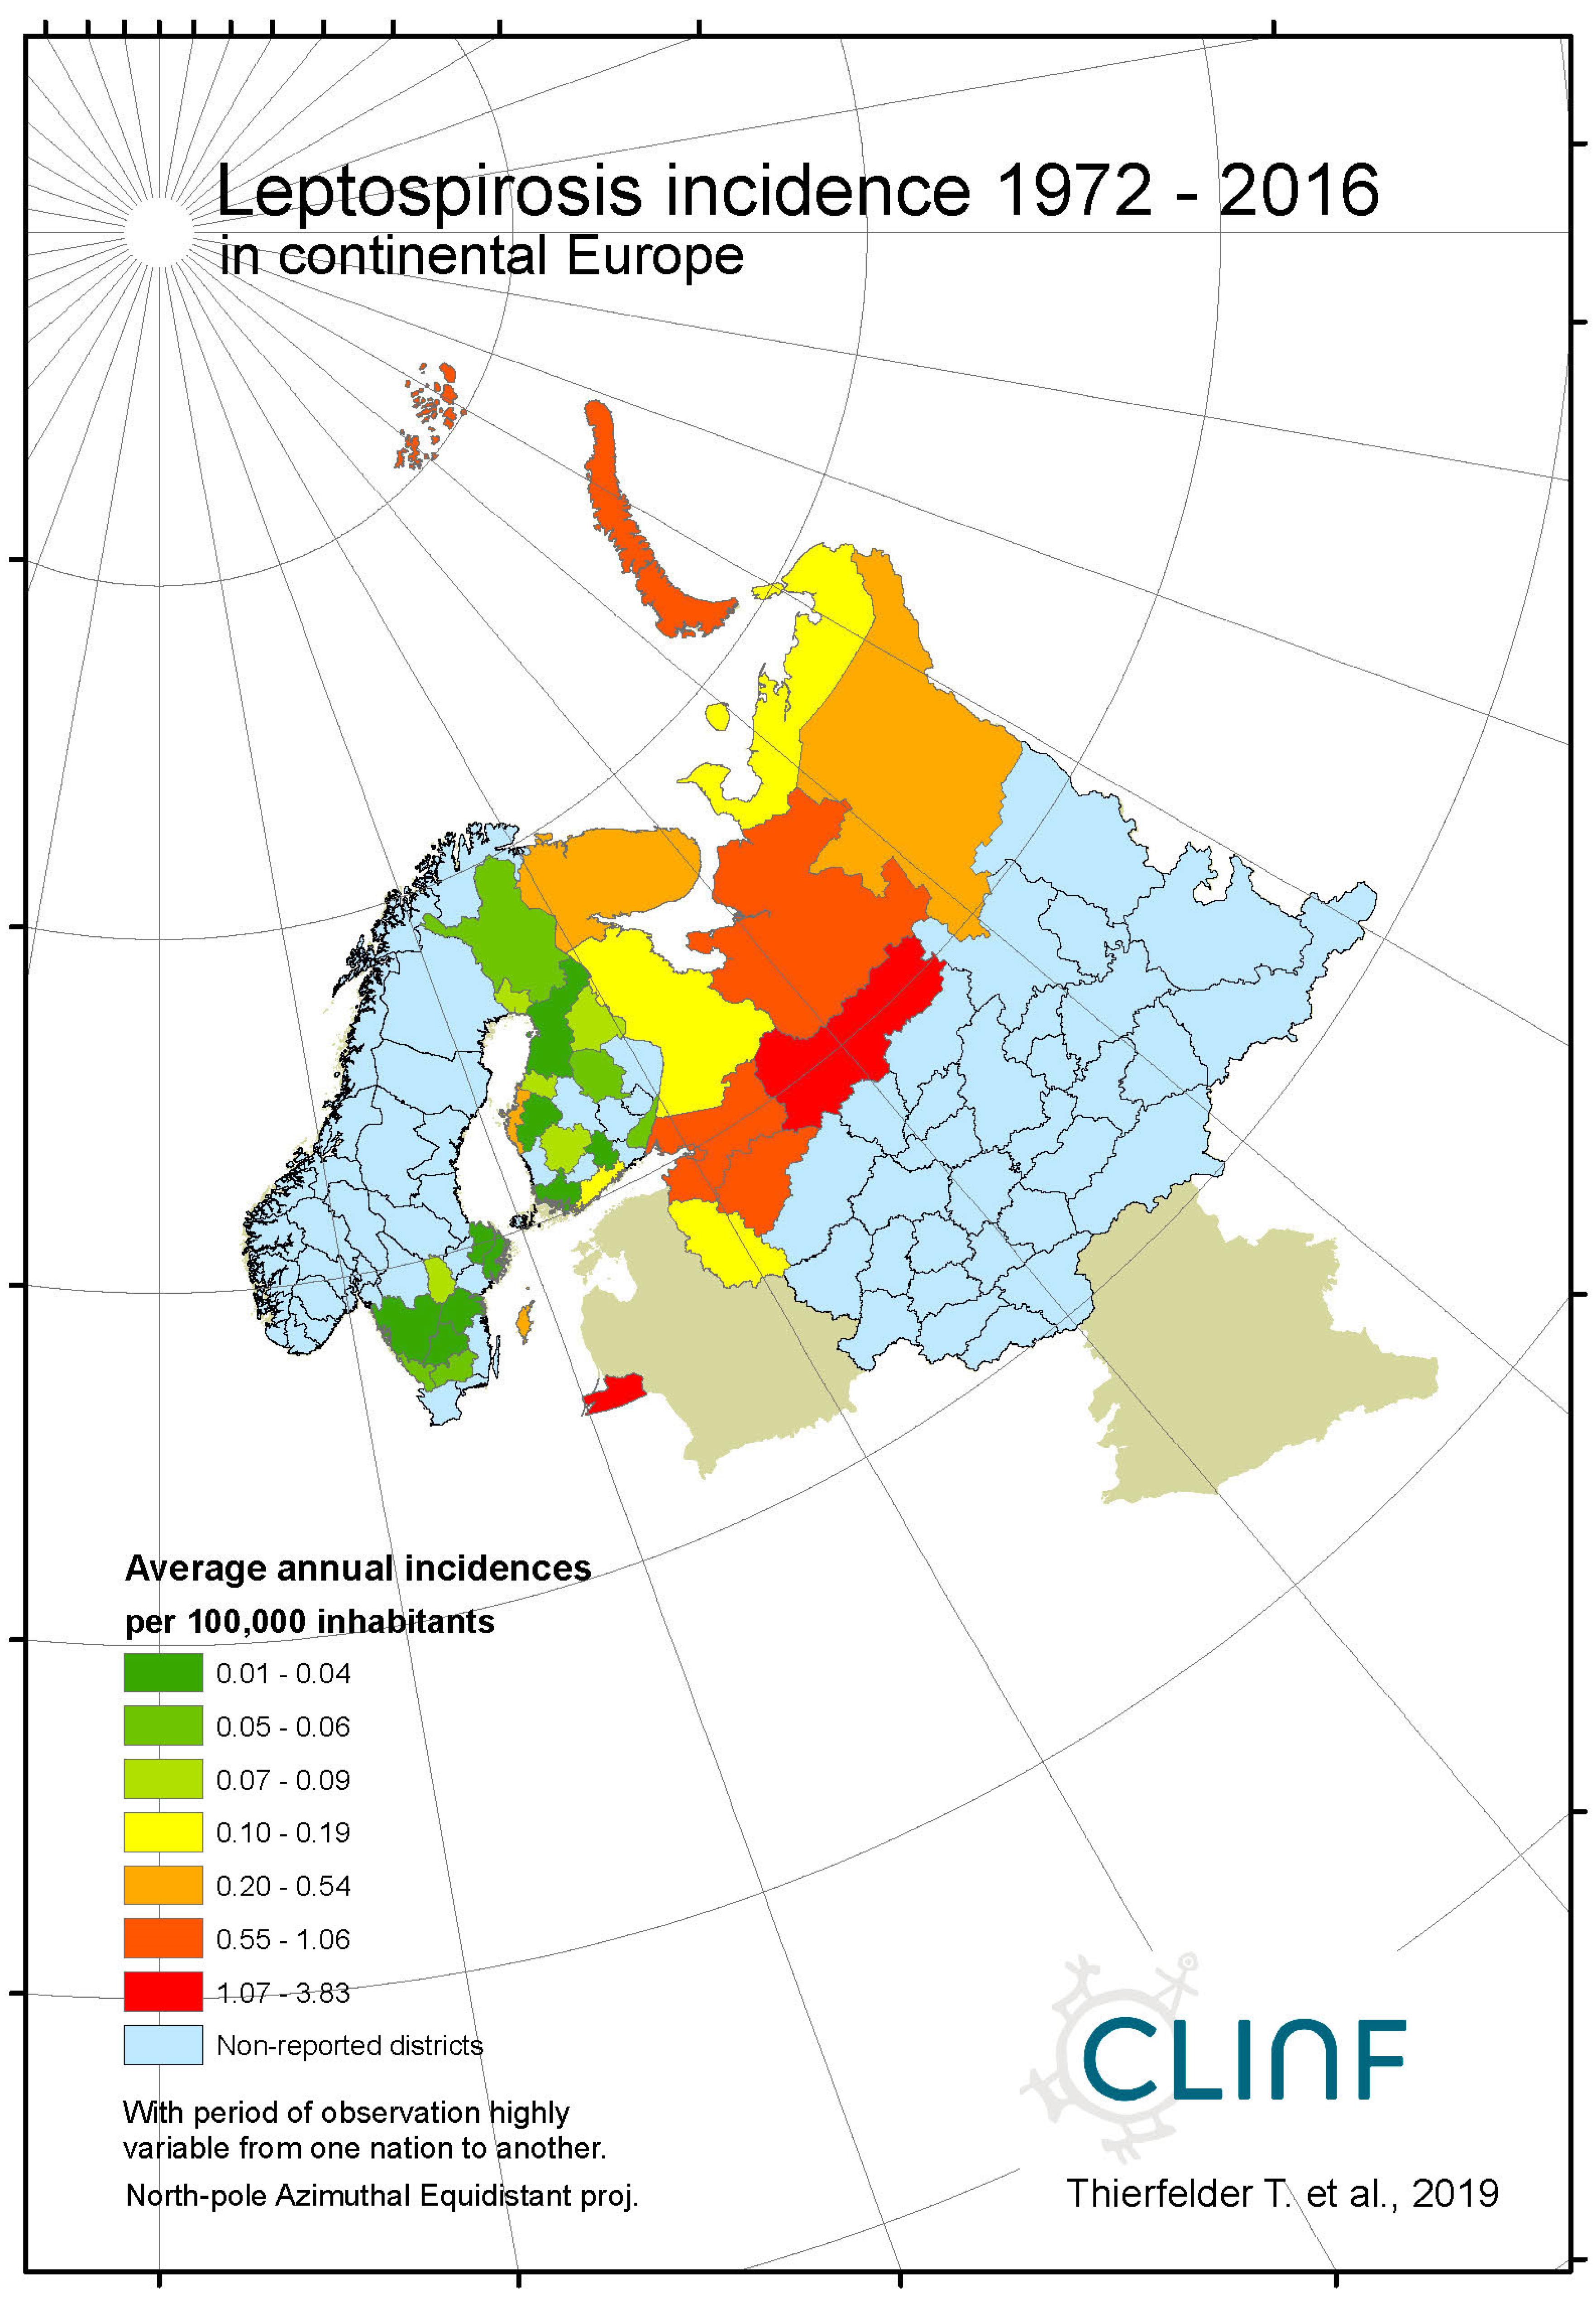
Figure 5c.
Average annual Leptospirosis incidences as observed through the approximate thirty-year climate reference period, across Norway, Sweden, and Finland.
Figure 5c.
Average annual Leptospirosis incidences as observed through the approximate thirty-year climate reference period, across Norway, Sweden, and Finland.
Appendix B6. Q-Fever
Figure 6a.
Average annual Q fever incidences as observed through the approximate thirty-year climate reference period, across the entire CLINF study region.
Figure 6a.
Average annual Q fever incidences as observed through the approximate thirty-year climate reference period, across the entire CLINF study region.
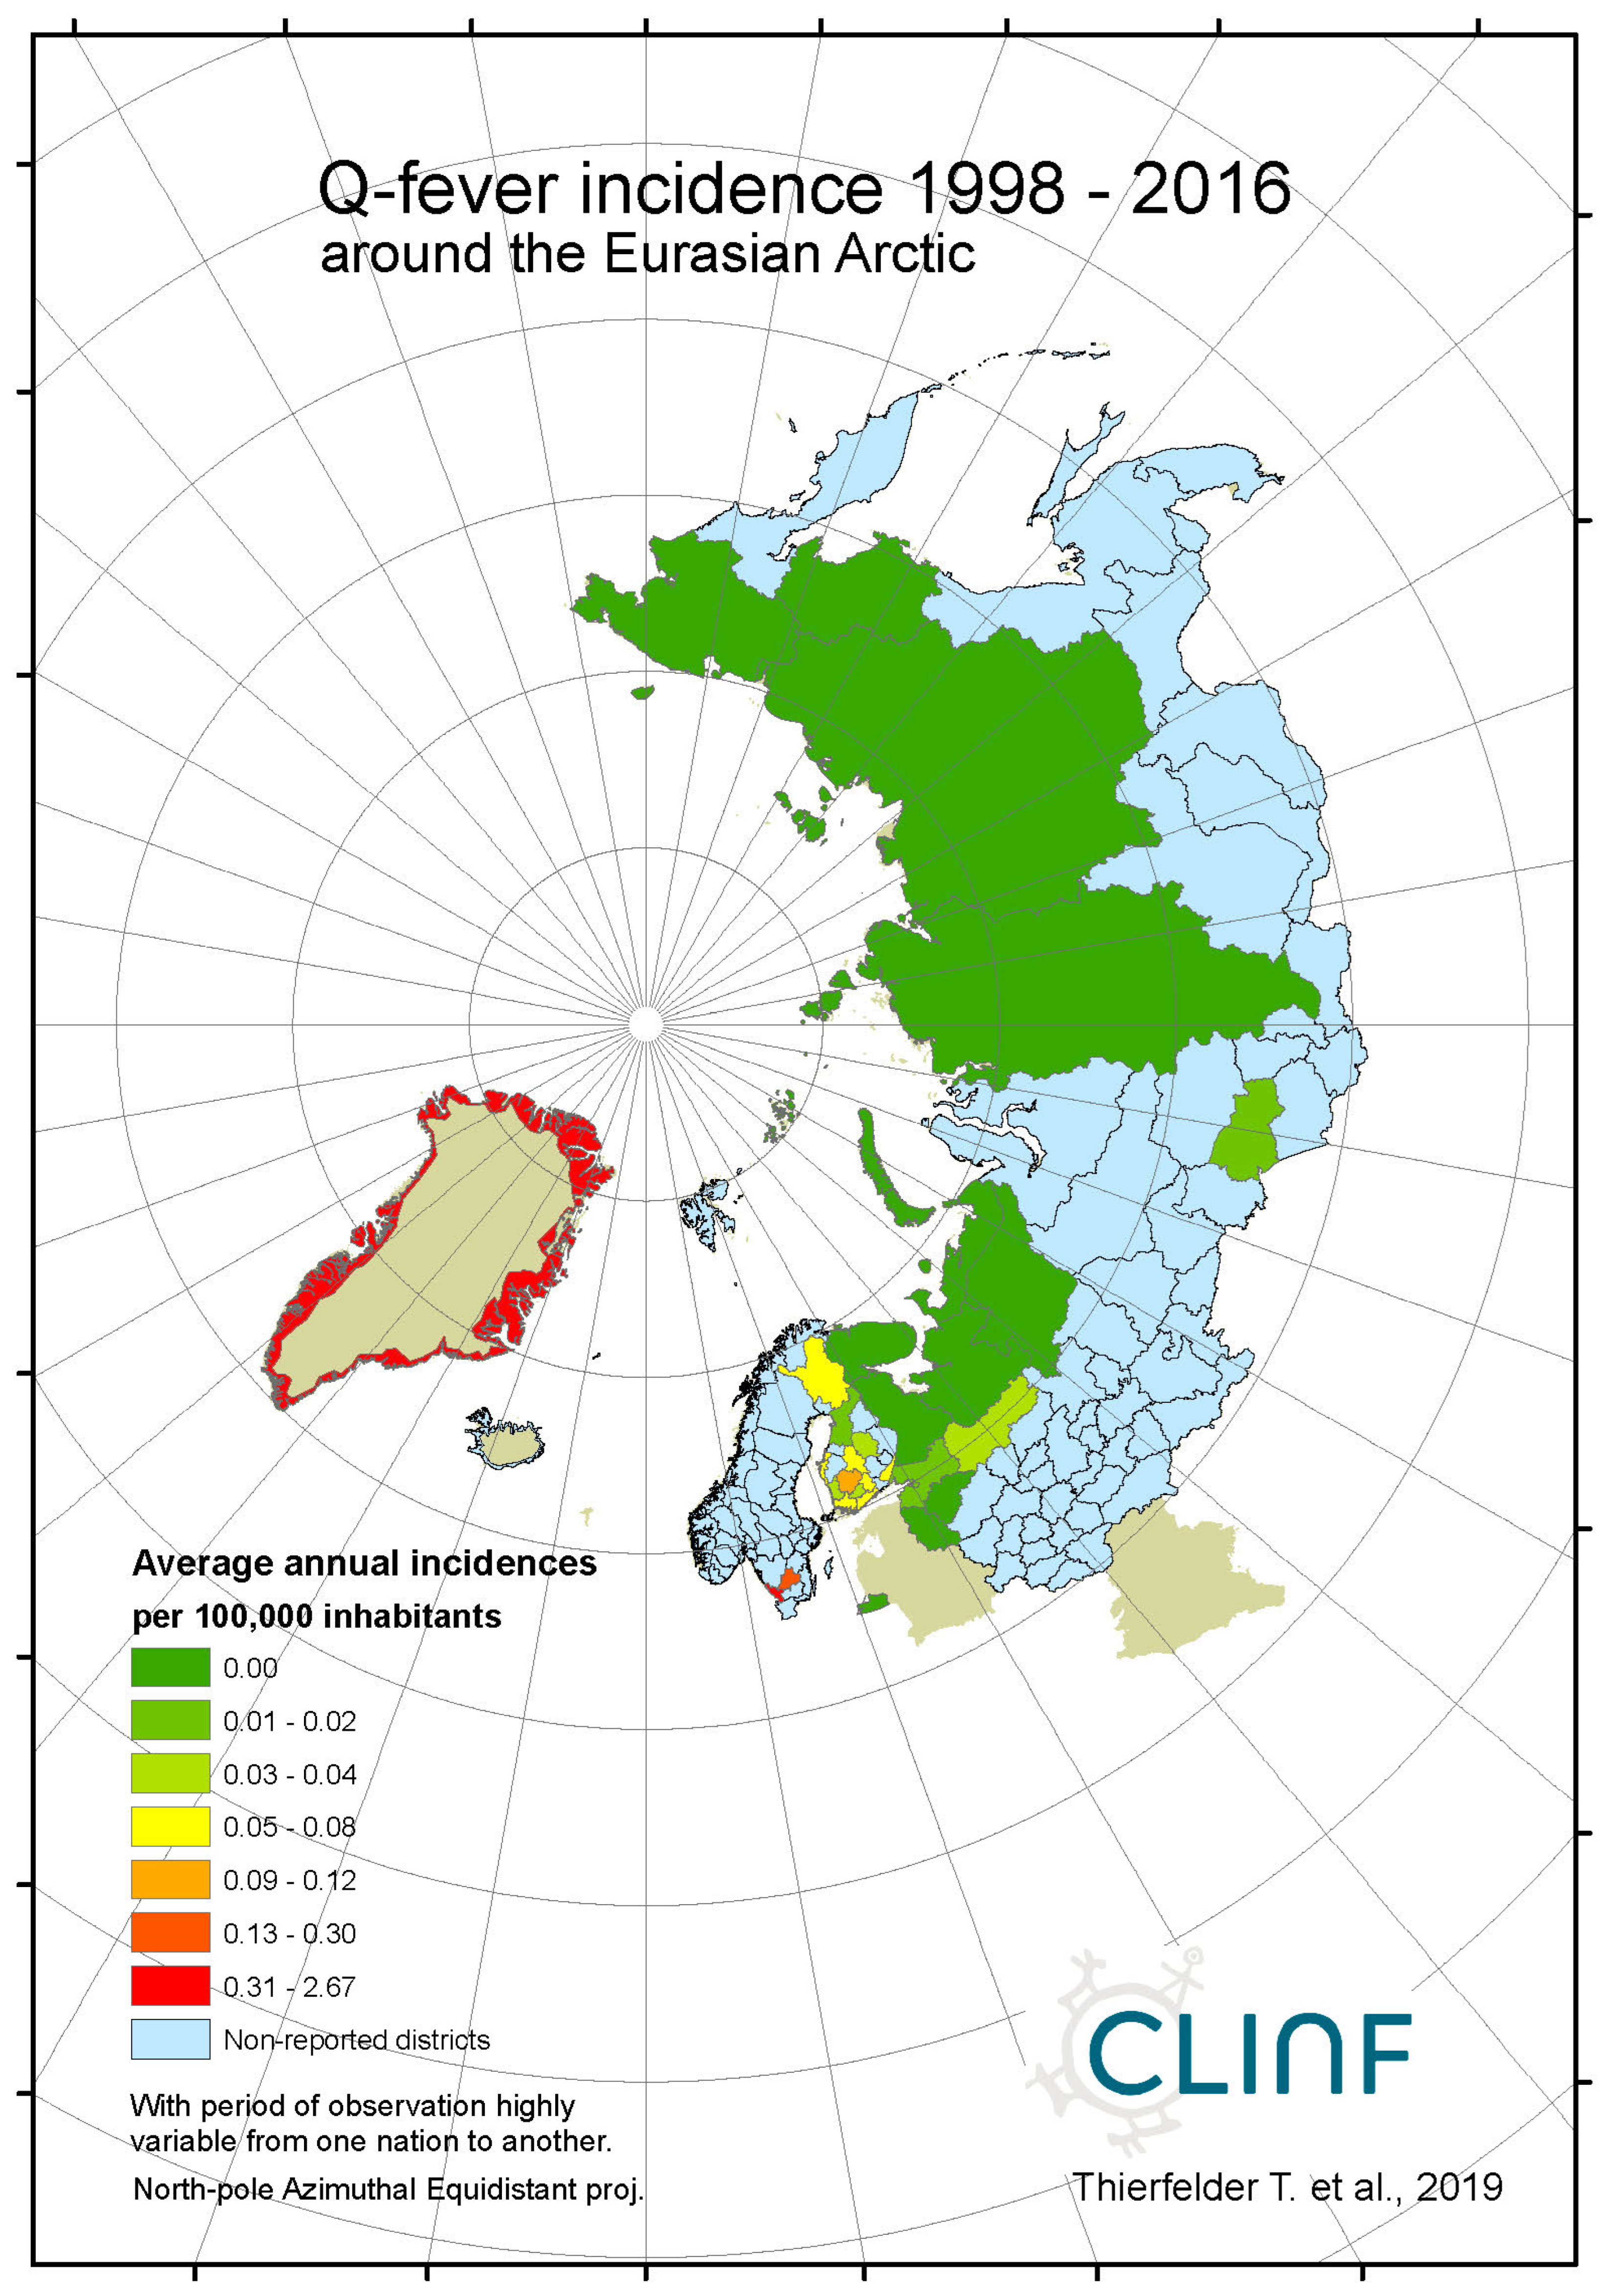
Figure 6b.
Average annual Q fever incidences as observed through the approximate thirty-year climate reference period, across continental Europe.
Figure 6b.
Average annual Q fever incidences as observed through the approximate thirty-year climate reference period, across continental Europe.
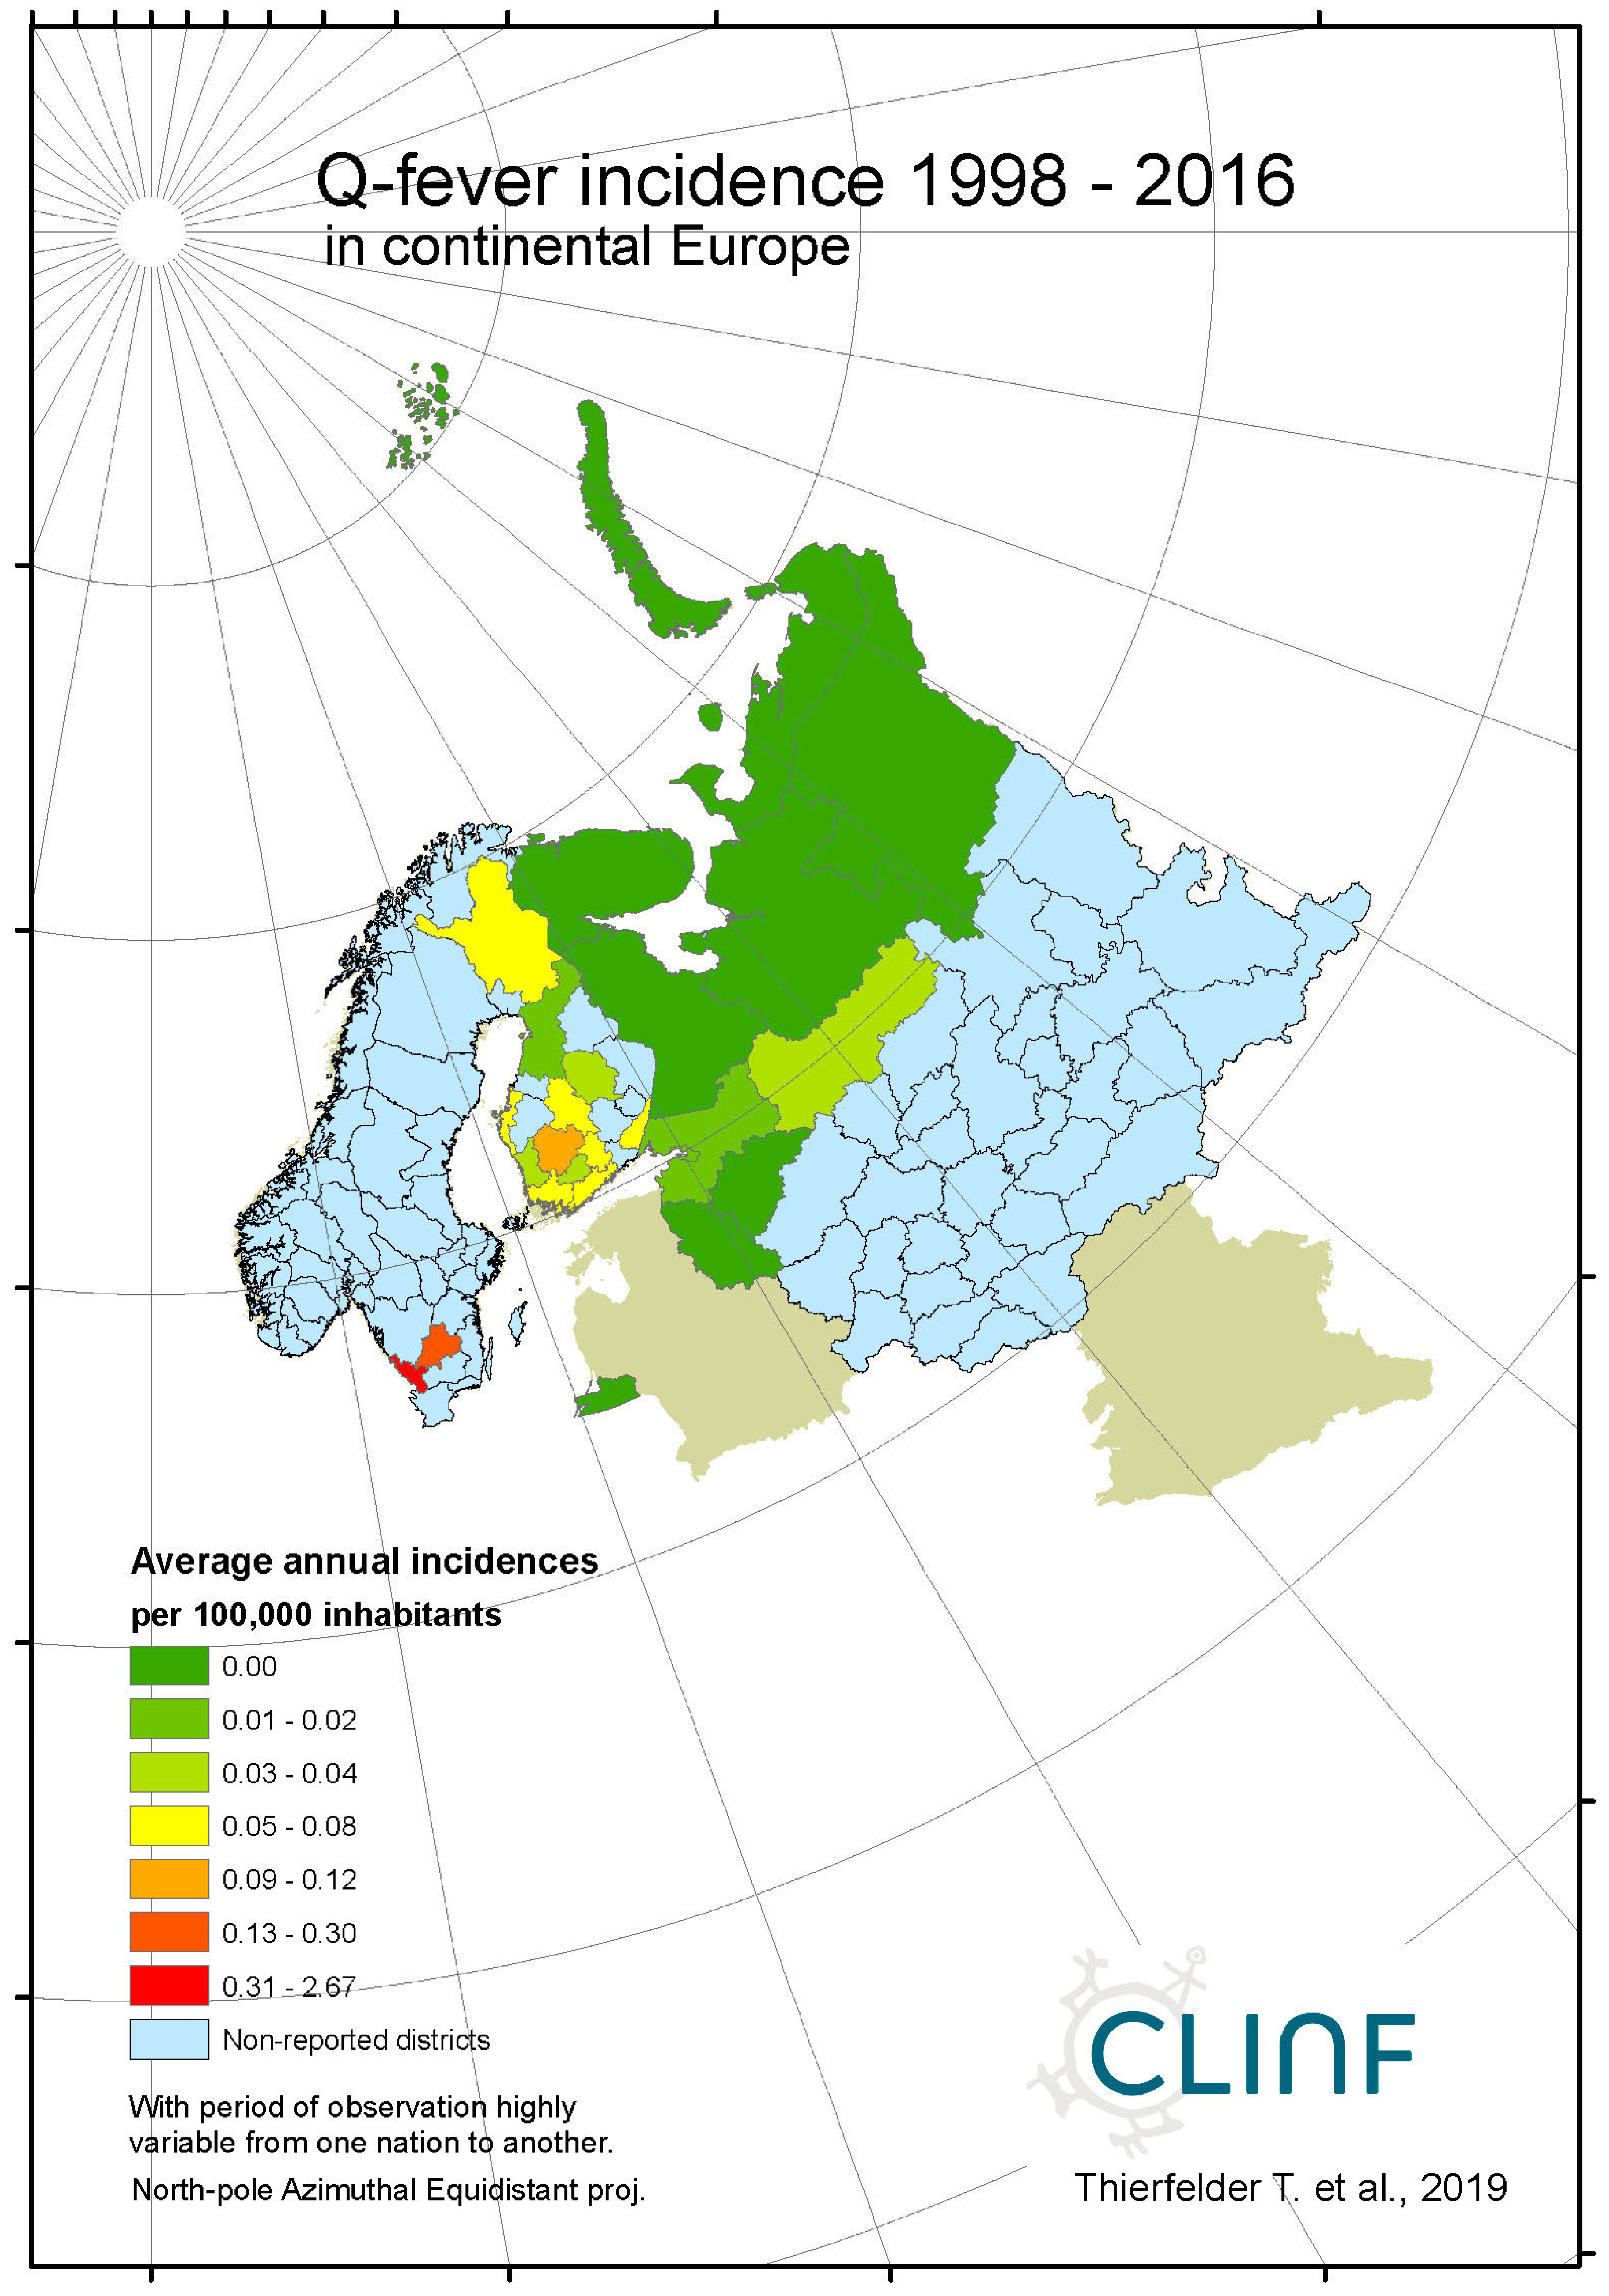
Figure 6c.
Average annual Q fever incidences as observed through the approximate thirty-year climate reference period, across Norway, Sweden, and Finland.
Figure 6c.
Average annual Q fever incidences as observed through the approximate thirty-year climate reference period, across Norway, Sweden, and Finland.
Appendix B7. Tick-Borne Encephalitis (TBE)
Figure 7a.
Average annual TBE incidences as observed through the approximate thirty-year climate reference period, across the entire CLINF study region.
Figure 7a.
Average annual TBE incidences as observed through the approximate thirty-year climate reference period, across the entire CLINF study region.
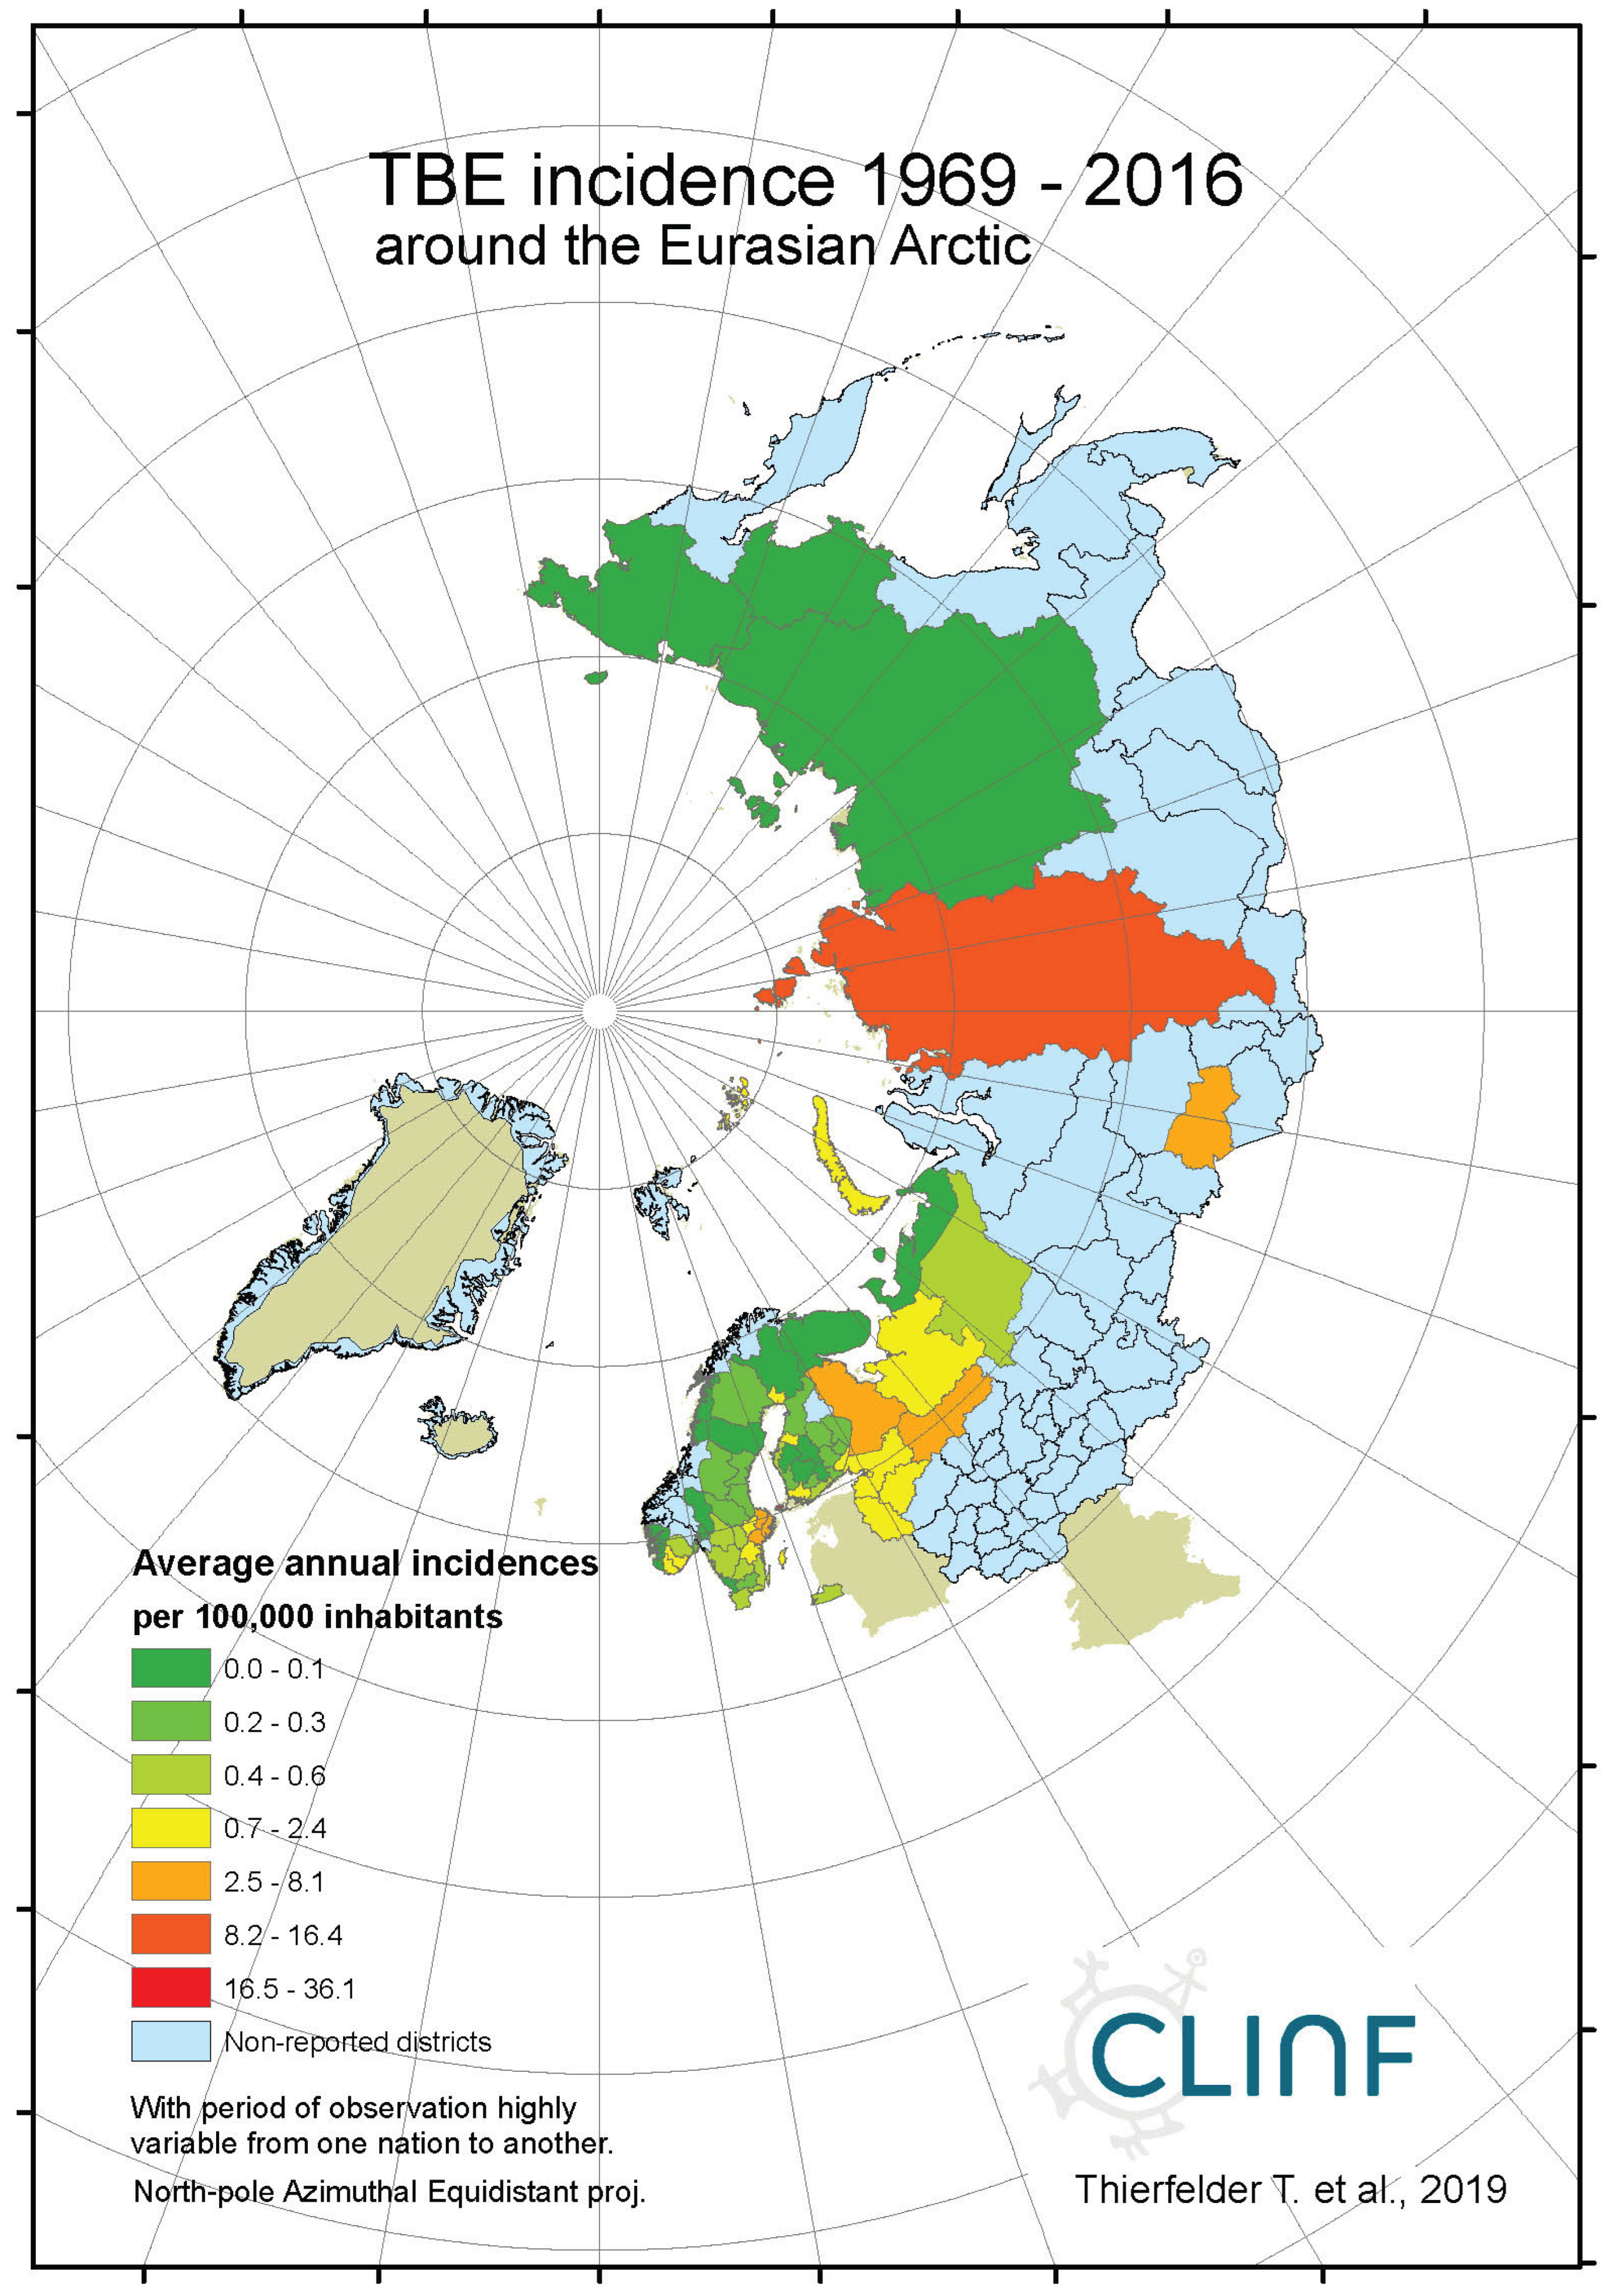
Figure 7b.
Average annual TBE incidences as observed through the approximate thirty-year climate reference period, across continental Europe.
Figure 7b.
Average annual TBE incidences as observed through the approximate thirty-year climate reference period, across continental Europe.
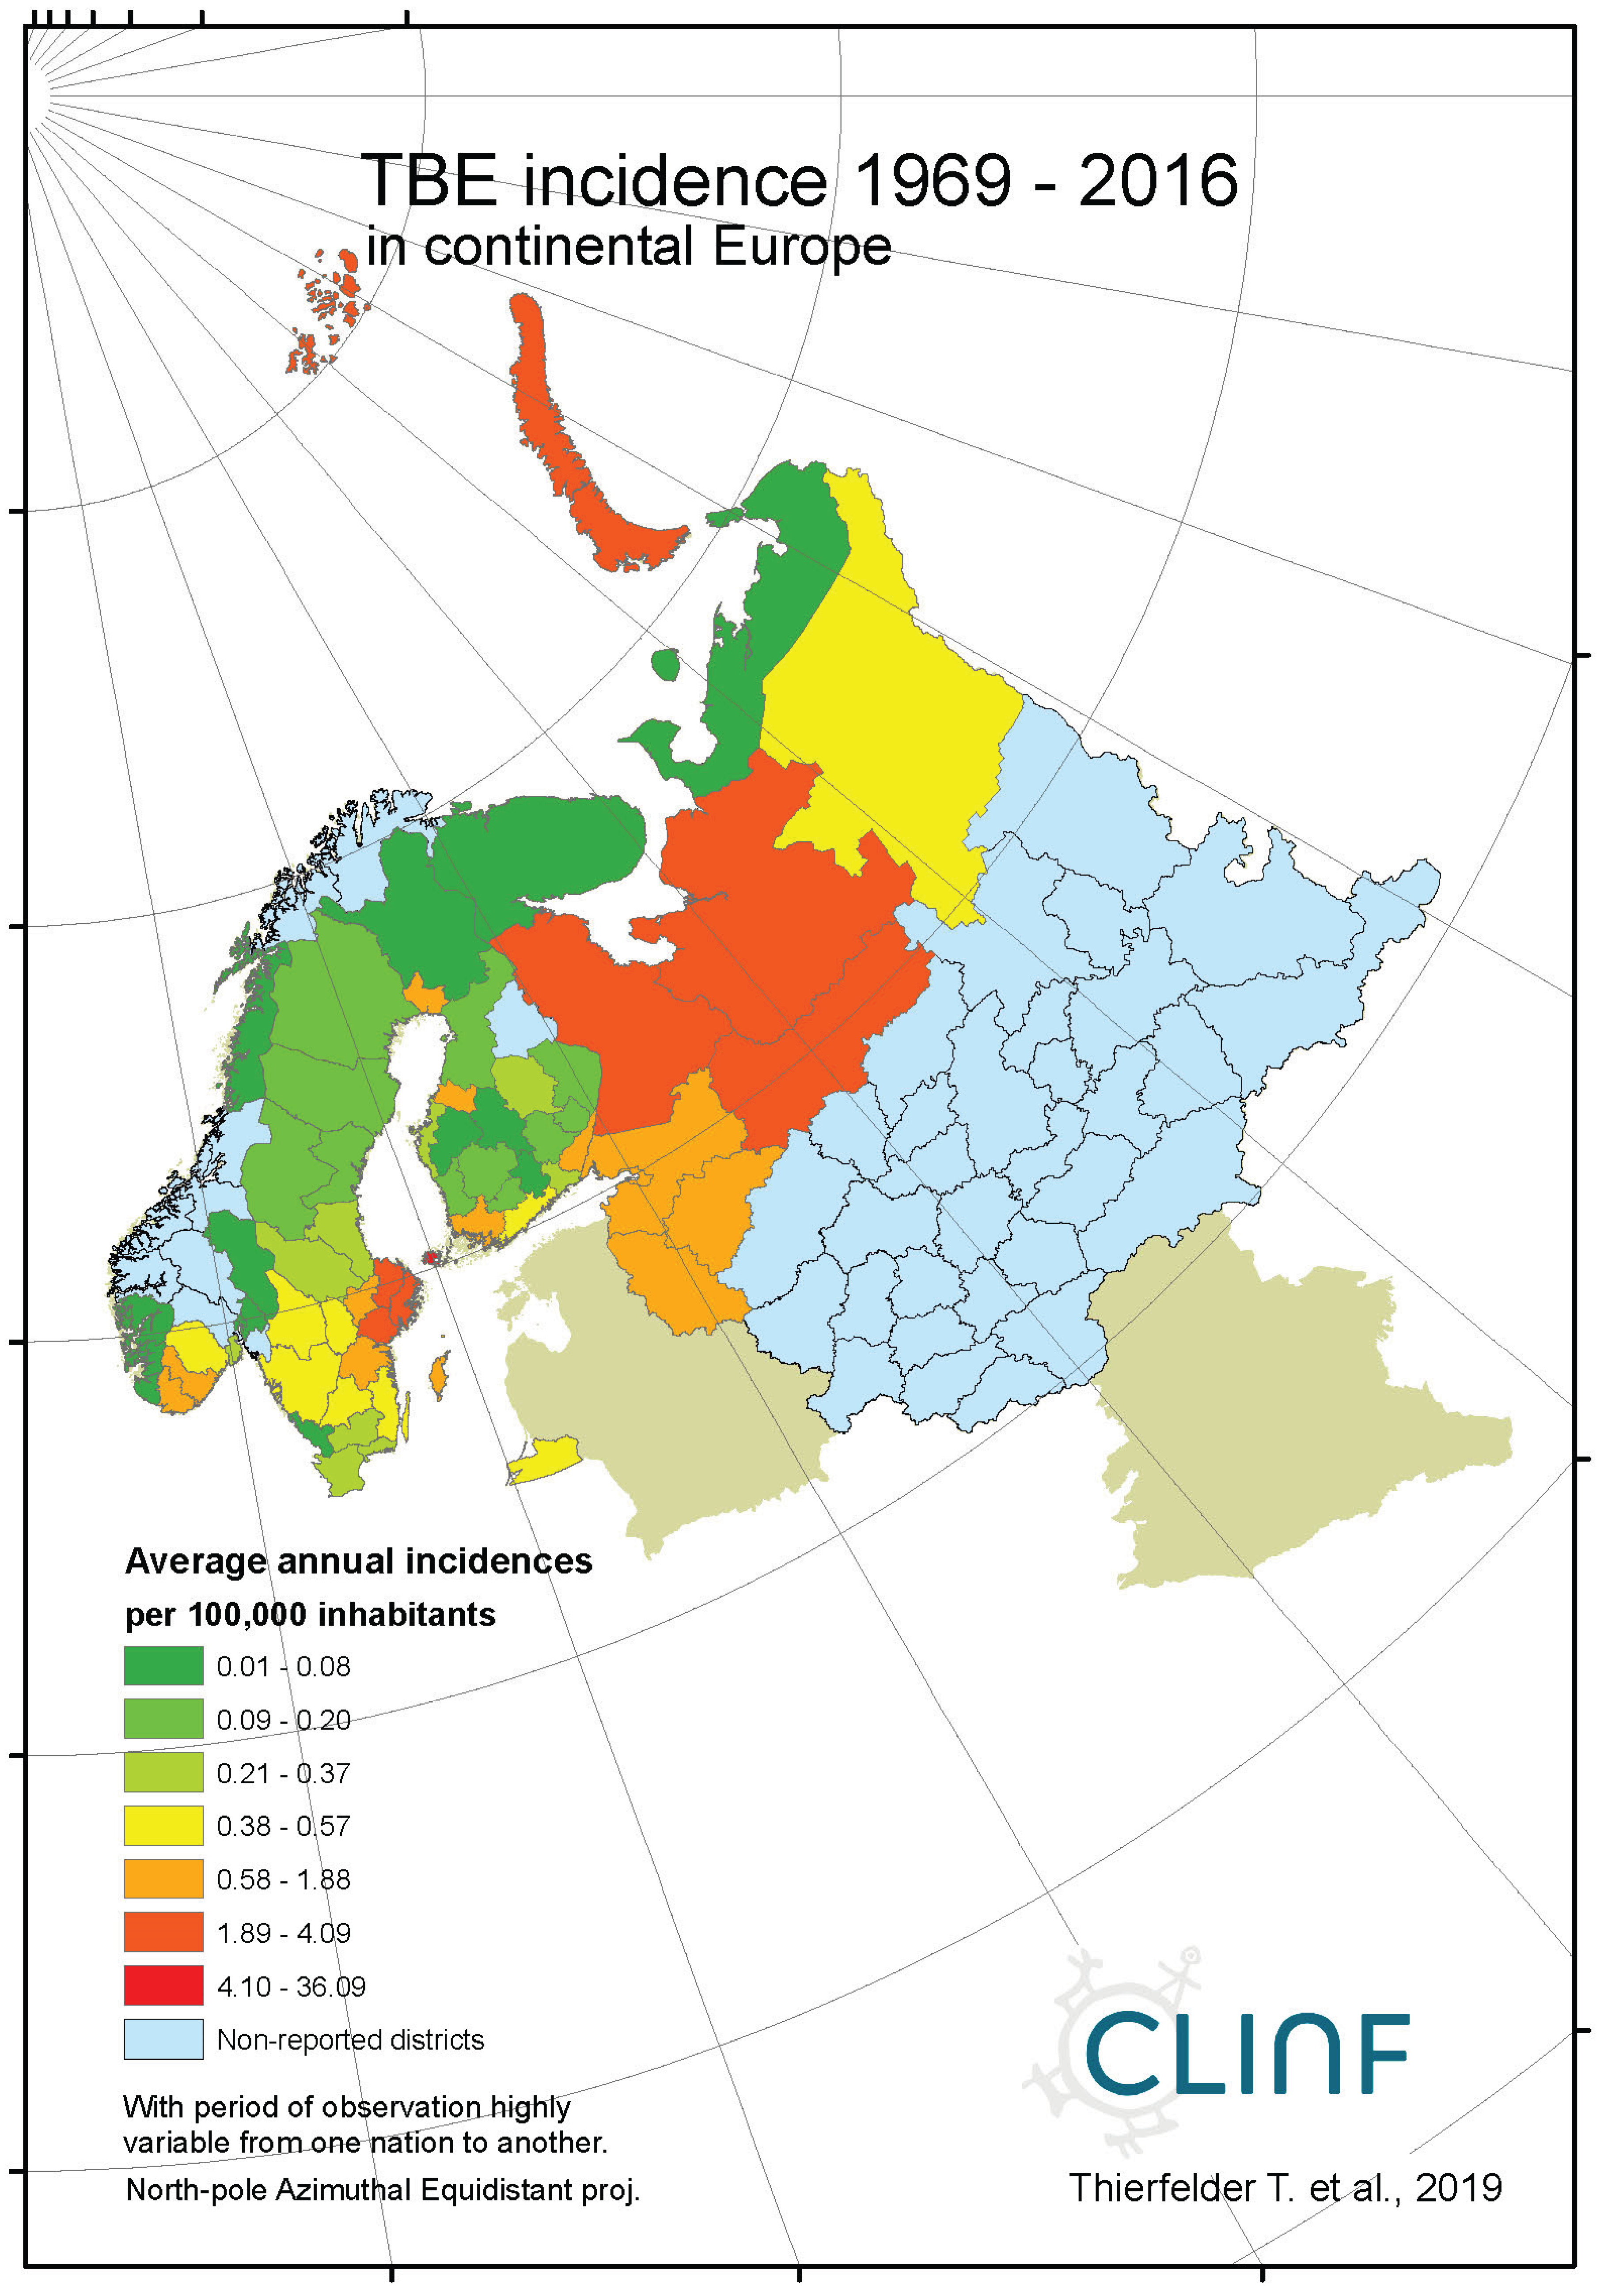
Figure 7c.
Average annual TBE incidences as observed through the approximate thirty-year climate reference period, across Norway, Sweden, and Finland.
Figure 7c.
Average annual TBE incidences as observed through the approximate thirty-year climate reference period, across Norway, Sweden, and Finland.
Appendix B8. Tularaemia
Figure 8a.
Average annual tularaemia incidences as observed through the approximate thirty-year climate reference period, across the entire CLINF study region.
Figure 8a.
Average annual tularaemia incidences as observed through the approximate thirty-year climate reference period, across the entire CLINF study region.
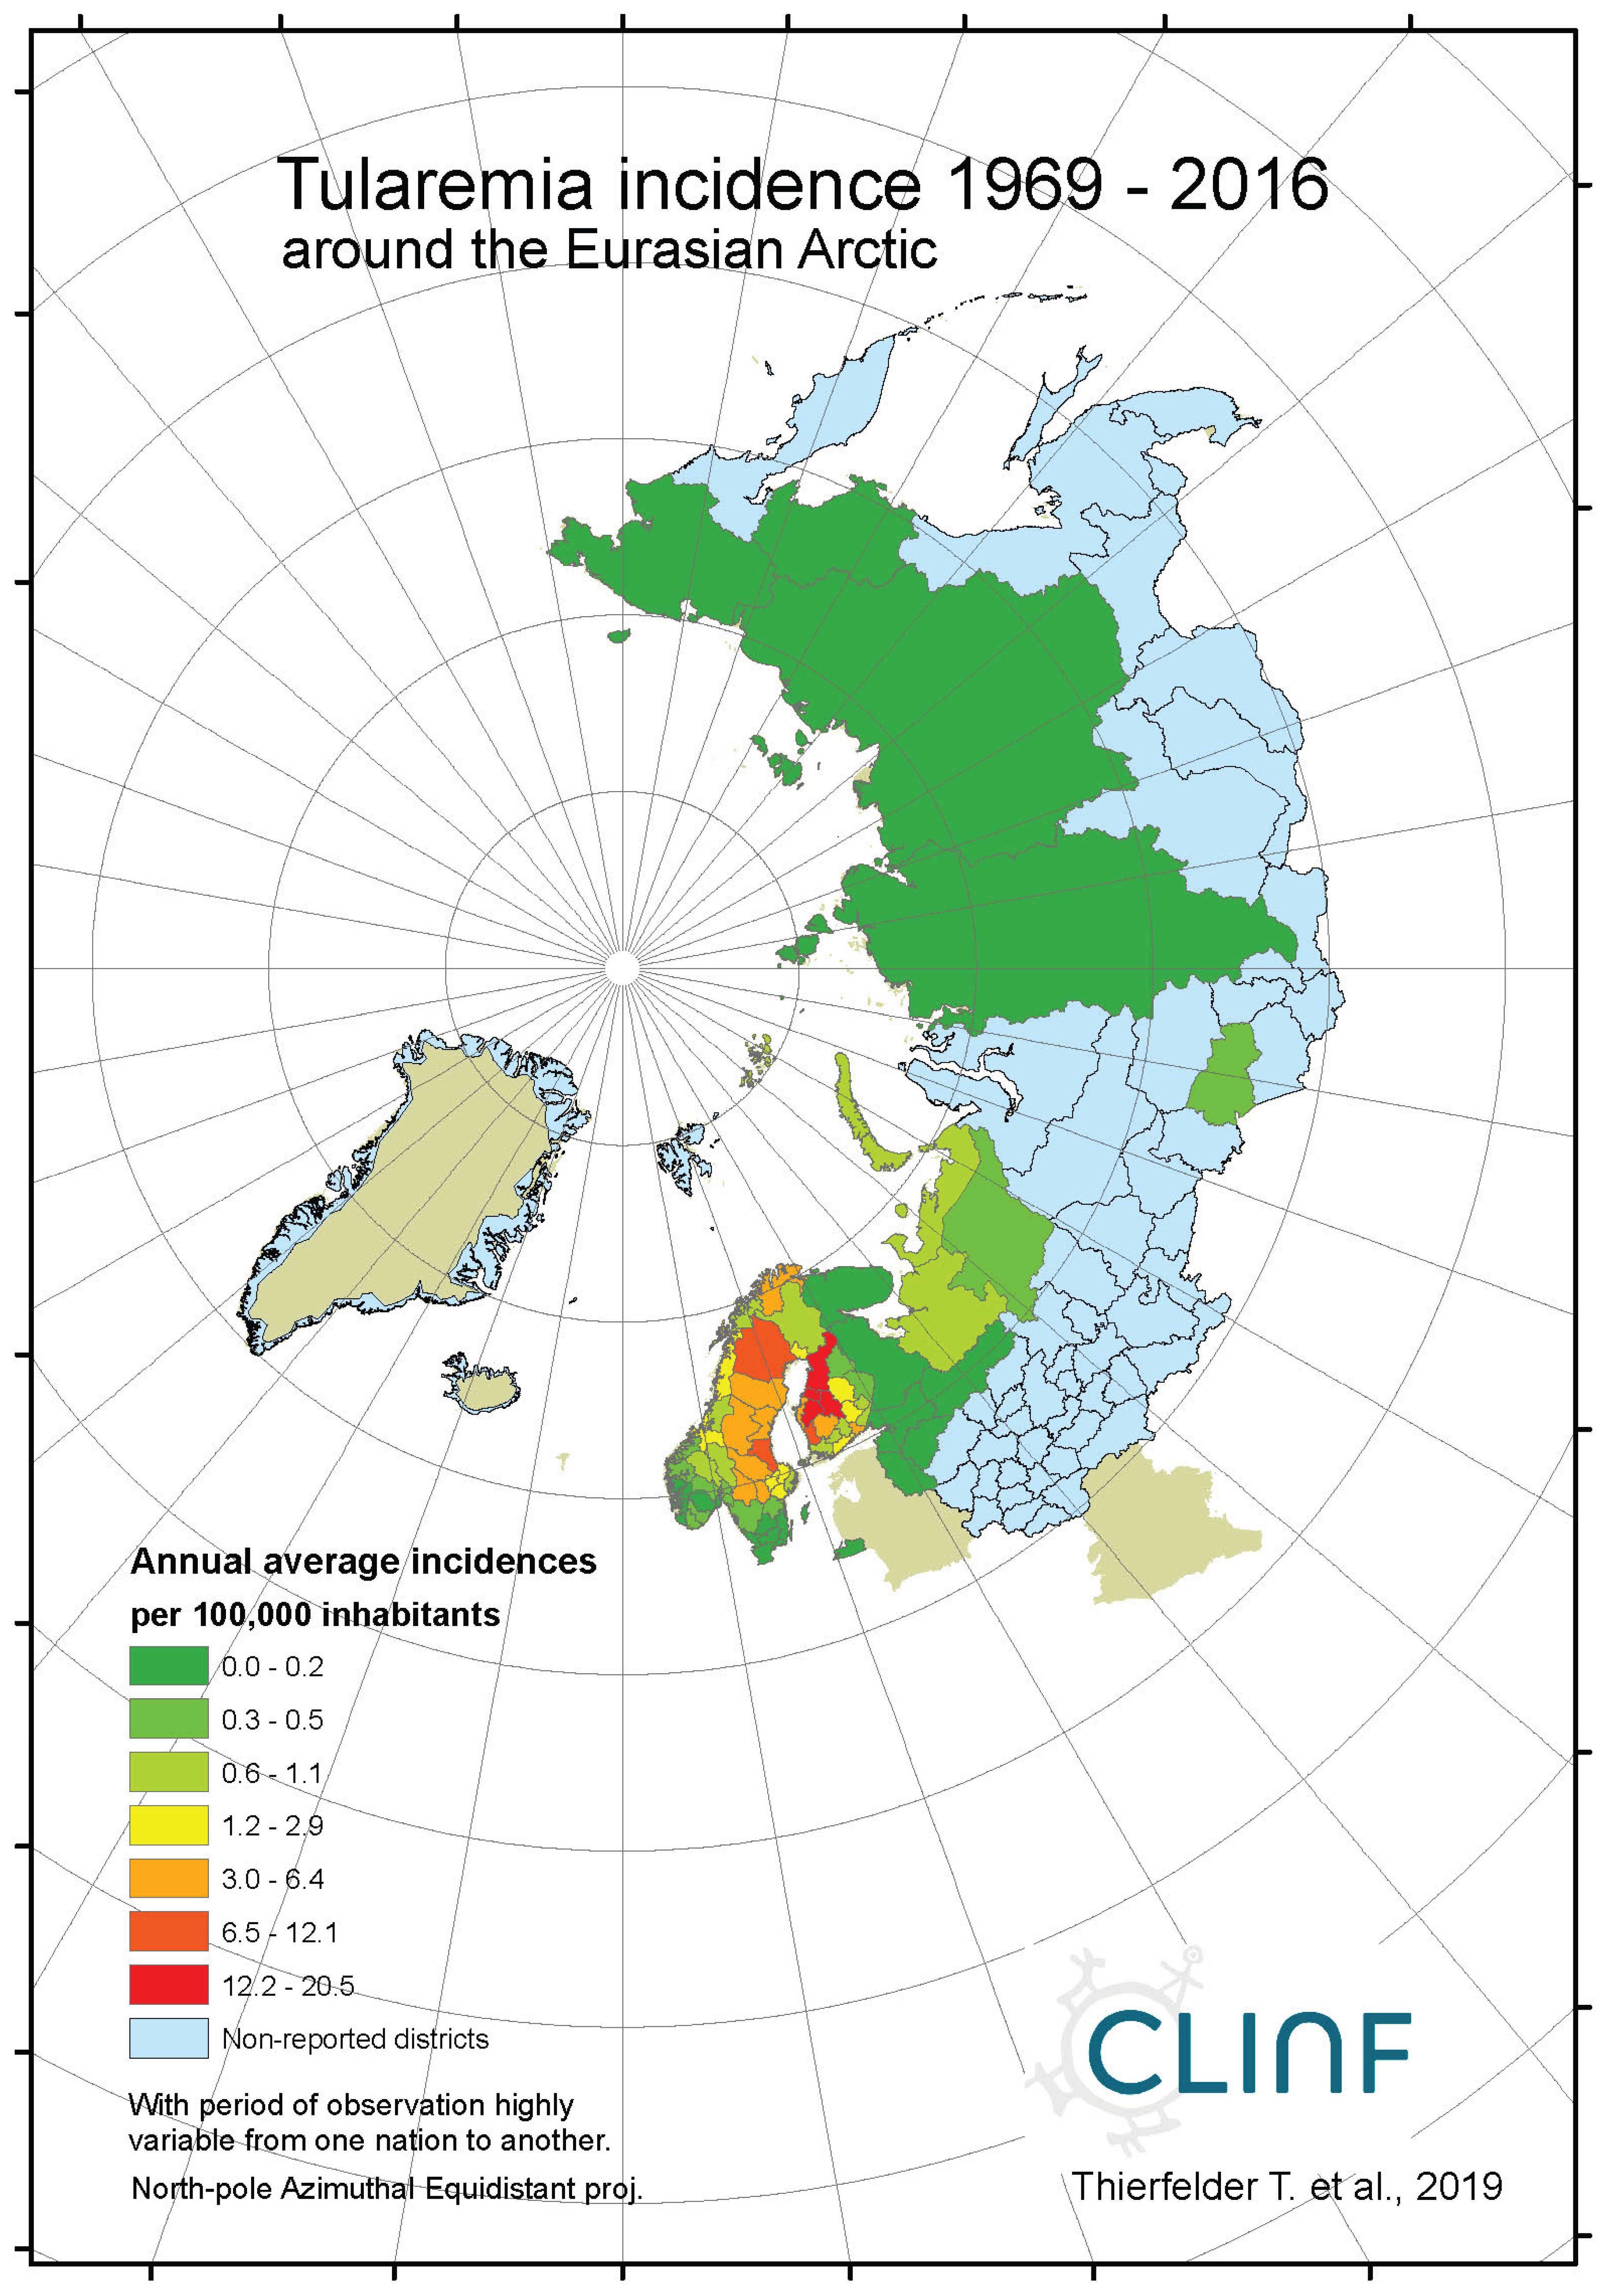
Figure 8b.
Average annual tularaemia incidences as observed through the approximate thirty-year climate reference period, across continental Europe.
Figure 8b.
Average annual tularaemia incidences as observed through the approximate thirty-year climate reference period, across continental Europe.
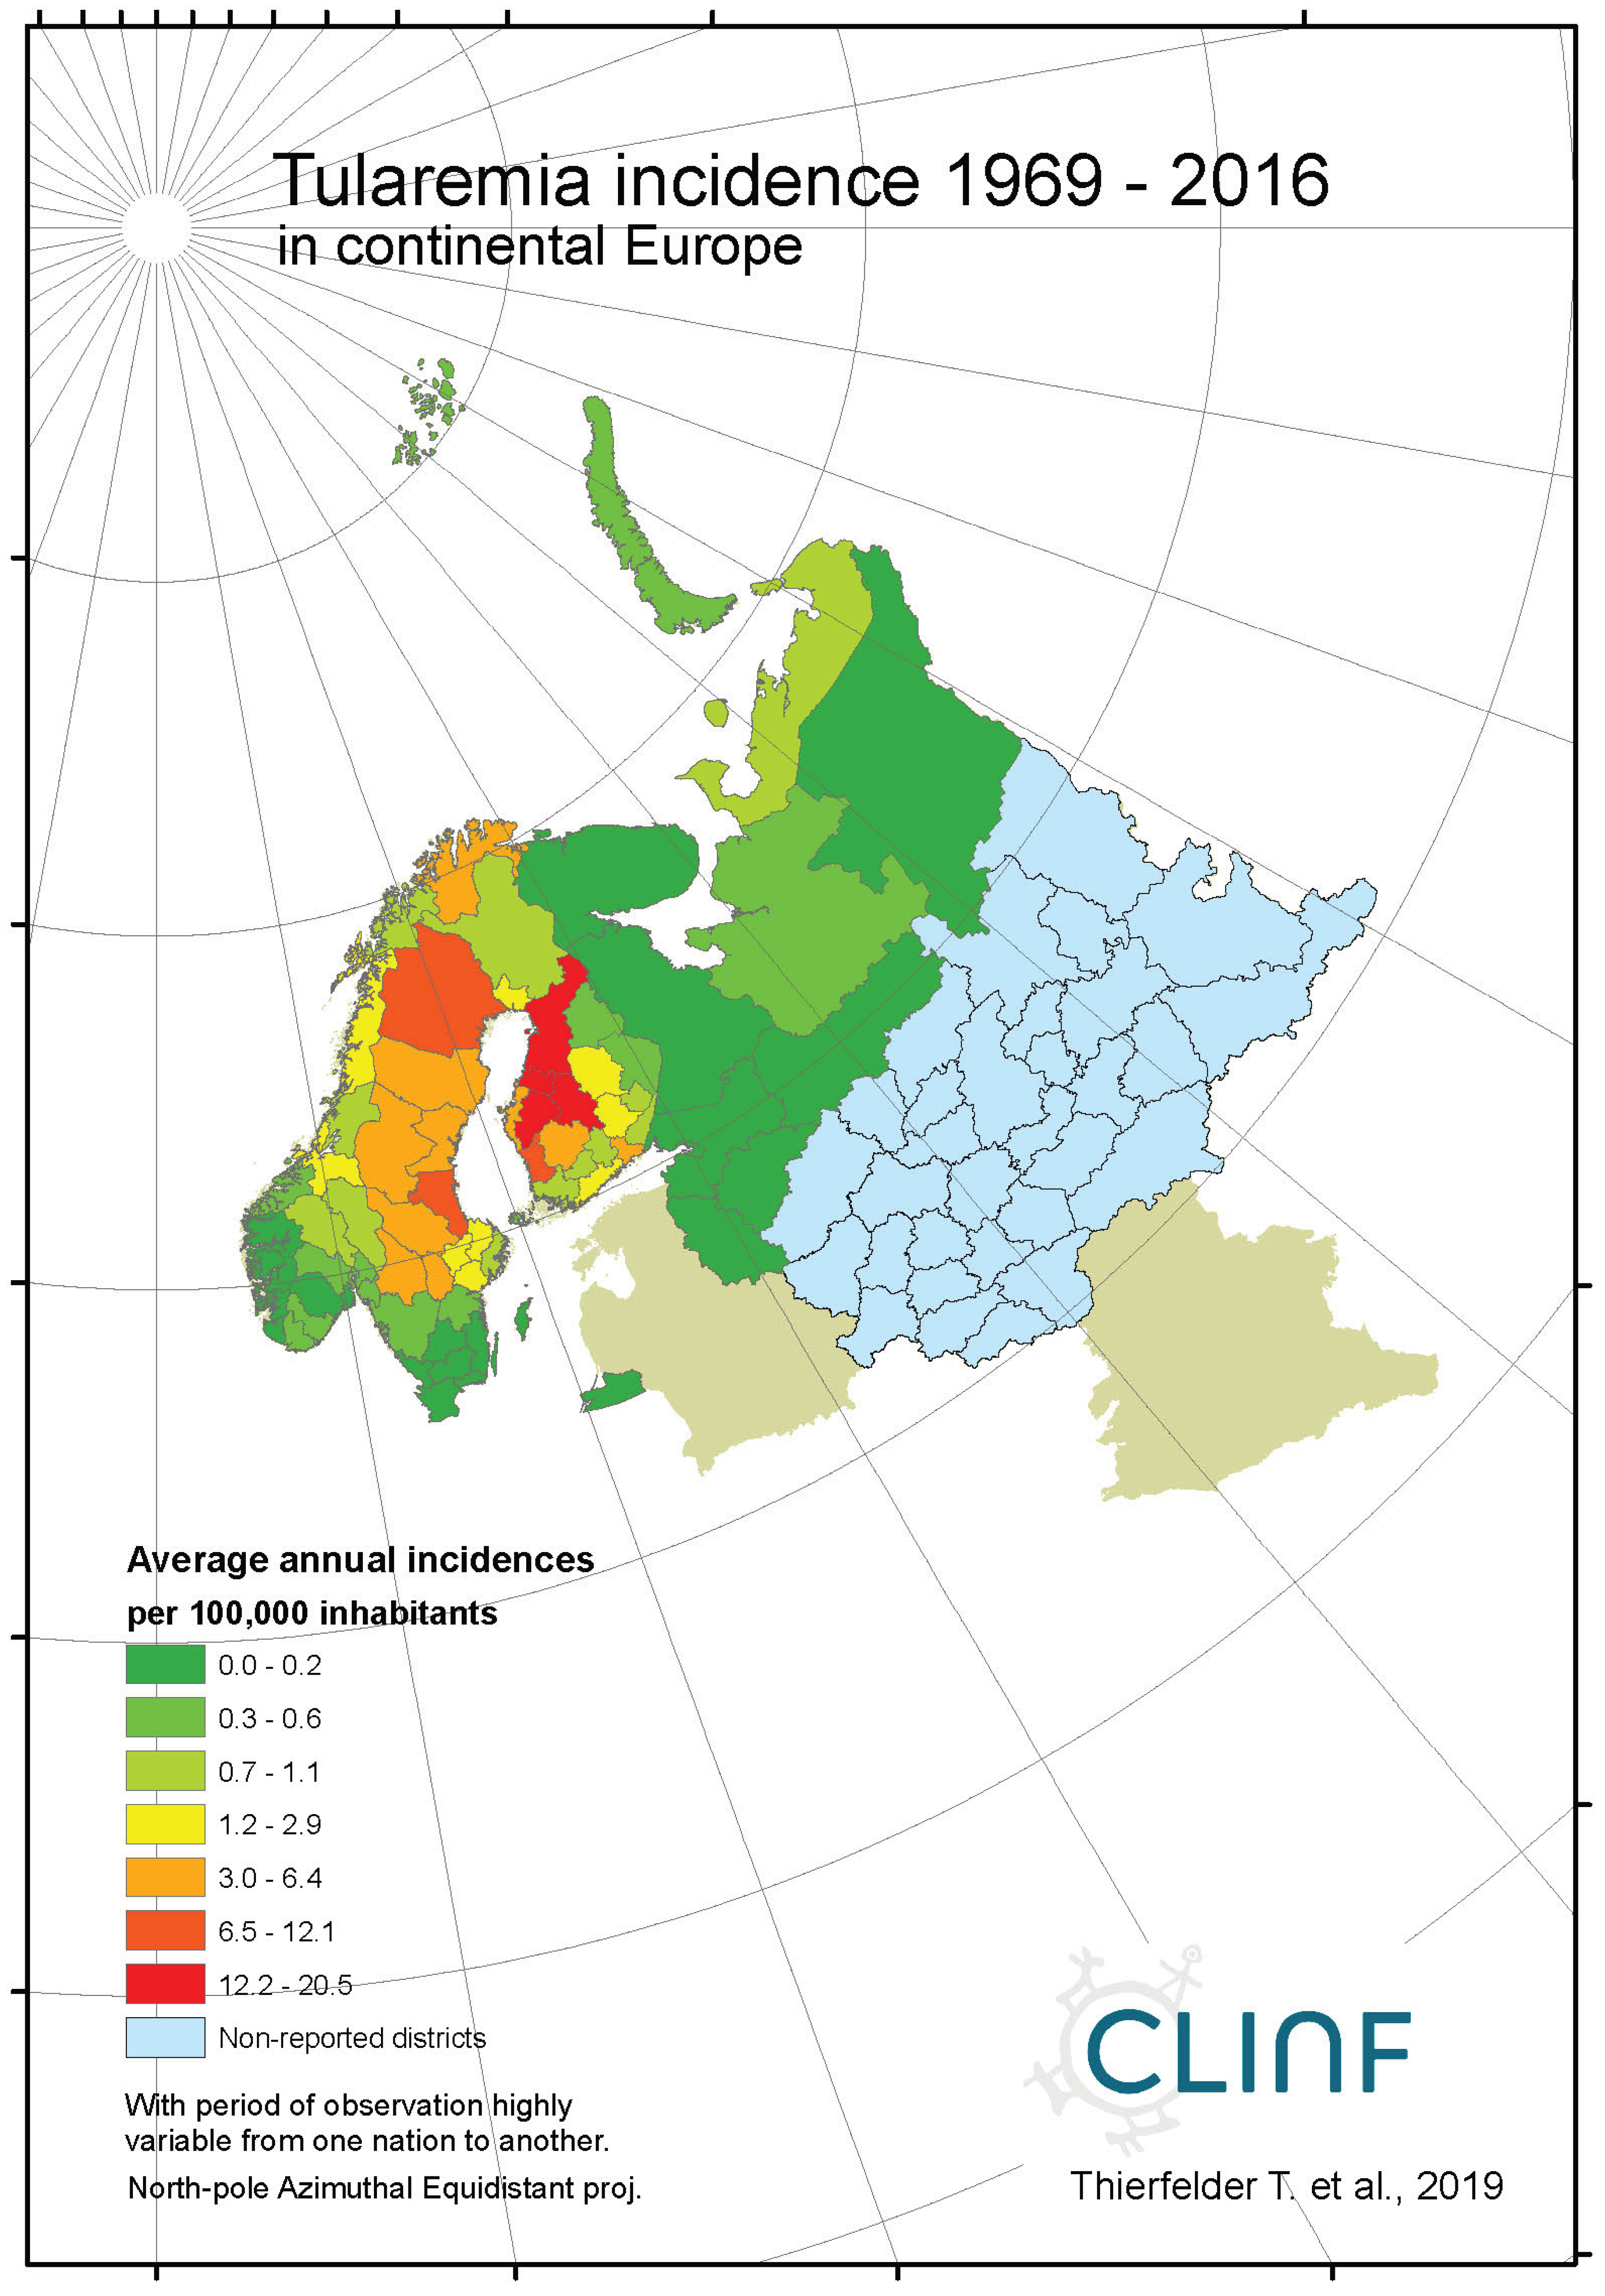
Figure 8c.
Average annual tularaemia incidences as observed through the approximate thirty-year climate reference period, across Norway, Sweden, and Finland.
Figure 8c.
Average annual tularaemia incidences as observed through the approximate thirty-year climate reference period, across Norway, Sweden, and Finland.
Appendix C. General Information Regarding the Chosen Diseases, as Quoted from ECDC: European Centre for Disease Prevention and Control—www.ecdc.europa.eu
Appendix C1. Borreliosis
Borreliosis, also known as Lyme disease, is a tick-transmitted bacterial infection caused by spirochetes Borrelia burgdorferi sensu lato. It is transmitted to humans by the bite of infected ticks, and can be found mainly in Europe, North America, and temperate Asia. Neuroborreliosis is the main complication, which may be found in approximately 10% of all infected cases. Although most of these can be treated successfully, the infection may become severe if left untreated.
Ticks become infected when they feed on birds or mammals that carry the bacterium in their blood. Usually, smaller mammals are preferred for the larvae and nymphs to feed on, while adult ticks feed of larger mammals like deer. Optimal habitats are e.g. mixed woodlands, heathland, open grassy meadows, and urban parklands. If and when these habitats expand towards the North with climate change, there is a potential for borrelia to spread accordingly.
Appendix C2. Brucellosis
Brucellosis is a highly contagious zoonotic infection, transmitted to humans via contact with fluids from infected animals (sheep, cattle, etc), or derived from food products such as unpasteurized milk and cheese, and from undercooked meat. Brucellosis occurs worldwide, endemically in the Mediterranean region, and is also known as undulant fever, Malta fever, and Mediterranean fever. Brucella spp are small intracellular bacilli, and Brucellosis may hence be prevented via vaccination of animals or by pasteurization of milk. The associated case mortality rates are probably less than 2%.
Appendix C3. Cryptosporidiosis
Cryptosporidiosis is a disease caused by the parasite Cryptosporidium. It lives in the intestines of infected humans or animals, and may be found in soil, food, water, or at surfaces that have been contaminated with the faeces from infected humans or animals. Cryptosporidium is a leading cause of waterborne disease among humans in the United States, where approximately 30% of the adult population are seropositive. Several community-wide outbreaks of cryptosporidiosis have been linked to contaminated municipal drinking or recreational waters. Although patients normally recover spontaneously from cryptosporidiosis, it may prove fatal for immunocompromised individuals.
Appendix C4. Hantavirus Haemorrhagic Fever with Renal Syndrome (HFSR/NE)
HFRS is a group of clinically similar illnesses caused by different species of hantaviruses from the family Hantaviridae, in the order Bunyavirales. It is also known as Korean haemorrhagic fever and epidemic haemorrhagic fever. The species that cause HFRS include Hantaan orthohantavirus, Dobrava-Belgrade orthohantavirus, Saaremaa virus, Seoul orthohantavirus, Puumala orthohantavirus and other orthohantaviruses. It is found in Europe, Asia, and Africa. Of these species, Hantaan River virus and Dobrava-Belgrade virus cause the most severe form of the syndrome and have the highest morbidity rates. When caused by the Puumala virus, it is also called nephropathia epidemica (NE) with syndromes called Puumala fever. Hantaviruses are carried and transmitted by rodents and occur by seasonal outbreaks. Humans are infected via aerosols of rodent excreta, i. e. urine or saliva. In local languages, NE syndromes are known as “sorkfeber” in Swedish and “myyräkuume” in Finnish (vole fever), whereas it is called “musepest” in Norwegian (mouse plague).
Appendix C5. Leptospirosis
Leptospirosis is a bacterial zoonotic infection caused by spirochetes that is distributed worldwide, although with a stronghold in tropical climates. The organism infects mammals, especially rodents, which shed the organism with their urine, and hence contaminate the environment. Humans may be infected after exposure to soils or waters contaminated with urine – rice-paddy and sugar cane workers are at particular risk. Human-to-human transmission is rare. The classic form of severe leptospirosis, known as Weil’s disease, is characterised by liver damage (causing jaundice), kidney failure and bleeding, which happens in 5 - 10% of infected cases. Lung and brain damage can also occur. The case fatality-rate for leptospirosis is approximately 5 - 15% among patients with severe illness but exceeds 50% among patients with severe pulmonary haemorrhagic syndrome.
Appendix C6. Q Fever
Q fever (Query fever), caused by Coxiella burnetii, is a bacterial zoonosis with a wide clinical spectrum that can be life-threatening and, in some cases, may become chronic. Most infections are due to inhalation of aerosols or dust contaminated with dried birth fluids or excreta from infected animals. Less frequent routes of infection include ingesting contaminated milk, tick bite, or fomite transmission. Person-to-person and mother-to-fetus transmission has been reported. The most common symptoms of acute Q fever are high fever, severe headache, myalgia, chills, and cough. It may also be associated with pneumonia or hepatitis. In persons with a predisposition, the infection may evolve to a chronic form (< 5% of cases) months or years after initial infection. Acute Q fever is often a mild or self-limiting illness with a low case mortality rate, whereas untreated chronic Q fever endocarditis or vascular infection often is fatal. In treated patients with chronic Q fever endocarditis, the 10-year mortality rate is 19%. People in direct contact with animals during birthing, such as veterinarians and farmers, may be at particular risk for infection. C. burnetii can survive for long periods of time in the environment and may be carried long distances by wind. The bacterium has been described as a potential bioterrorism agent.
Appendix C7. Tick-Born Encephalitis
Tick-borne encephalitis (TBE) is caused by an arbovirus of the Flaviviridae family (tick-borne encephalitis virus, TBEV), transmitted principally by the bite of the Ixodes ricinus tick. The symptomology is biphasic, with the initial phase being associated with a flu-like illness and the second phase (occurring in less than 10% of patients) with symptoms of meningitis or, more rarely, meningoencephalitis. Natural foci include most European countries and Asia, wherein less than 1% of I. ricinus carry the TBEV. The case mortality rate is between 1 and 2%. Travellers involved in outdoor activities in forested areas are at risk, including campers, hikers, and hunters. Brushing against vegetation or walking in city parks known to have infected ticks can also put a person at risk. Transmission season is typically from March to November. Approximately one-third of patients develop severe symptoms after the first phase of the illness where the virus causes meningitis and/or encephalitis. Some patients may experience long-term complications. The infection is effectively impeded by vaccination, whereas treatment of an acute infection includes supportive care of symptoms.
Appendix C8. Tularaemia
Tularaemia, also known as rabbit fever, is a zoonotic infection caused by the bacterium Francisella tularensis. It is characterised by six major clinical presentations that may include fever, skin ulcers, and enlarged lymph nodes. Occasionally, a form that results in pneumonia or a throat infection occurs, that may evolve into severe systemic disease with neurological symptoms. Untreated, tularaemia has a case mortality rate of 5 to 15 percent, which can be lowered to about 1% by the usage of appropriate antibiotics. The bacterium is typically spread by ticks, deer flies, or contact with infected animals such as rabbits and hares. It may also be spread by drinking contaminated water or breathing in contaminated dust. It doesn’t seem to spread directly between humans. Tularaemia typically occurs by outbreaks that seems to correlate with the population dynamics of its vector and reservoir organisms.
Tularaemia is most common in the Northern Hemisphere, including North America and parts of Europe and Asia. Incidence rates are today less than 1 per one million in the United States and approximately 1.9 cases per 100,000 persons in parts of northern Europe. Being a rather classic Northern disease, it is classified as being reportable in all nations covered with this study. The bacterium is considered to be a potential bioterrorism agent.
References
- Abass K., Waits A., Emelyanova A., Miettinen I., Lavikainen A., Rautio A., Oksanen A., 2019: One Arctic - One Health, Finnish Food Authority Research Reports 3, Helsinki, Finland.
- Aiken L. S., West S. G., 1991: Multiple regression: Testing and interpreting interactions. – Sage Publications.
- AHDR (Arctic Human Development Report) 2004. Karla Jessen Williamson K. J., Hoogensen G., Lotherington A. T., Hamilton L. H., Savage S., Koukarenko N., Kalinina M., Limstrand I., Stemland M., Irbacher Fox S., Kafarowski J., Sloan L., Poppel M. - Gender Issues. Chapter 11, pp. 187 – 205 in Akureyri: Stefansson Arctic Institute.
- Alempic J-M, Lartigue A., Goncharov A. E., Grosse G., Strauss J., Tikhonov A. N., Fedorov A. N., Poirot O., Legendre M., Santini S., Abergel C., Claverie J-M, 2023: An Update on Eukaryotic Viruses Revived from Ancient Permafrost. - Viruses 18;15(2): 564. [CrossRef]
- Andersen-Ranberg E., Nymo I. H., Jokelainen P., Emelyanova A., Jore S., Laird B., Davidson R. K., Ostertag S., Bouchard E., Fagerholm F., Skinner K., Acquarone M., Tryland M., Dietz R., Abass K., Rautio A., Hammer S., Evengård B., Thierfelder T., Stimmelmayr R., Jenkins E., Sonne C., 2024: Environmental stressors and zoonoses in the Arctic: Learning from the past to prepare for the future. - Science of The Total Environment 957 (176869). [CrossRef]
- (https://www.sciencedirect.com/science/article/pii/S0048969724070268).
- Arctic Human Development Report (AHDR), 2007: Gender Issues. Chapter 11, pp. 187 – 205.
- Asokan G. V., Kasimanickam R. K, Asokan V., 2013: Surveillance, response systems, and evidence updates on emerging zoonoses: the role of one health. Infection Ecology & Epidemiology 3: 10.3402/iee.v3i0.21386. [CrossRef]
- Bonebrake T. C., Brown C. J., Bell J. D., Blanchard J. L., Chauvenet A., Champion C., Chen I. C., Clark T. D., Colwell R. K., Danielsen F., Dell A. I., Donelson J. M., Evengård B., Ferrier S., Frusher S., Garcia R. A., Griffis R. B., Hobday A. J., Jarzyna M. A., Lee E., Lenoir J., Linnetved H., Martin V. Y., McCormack P. C., McDonald J., McDonald-Madden E., Mitchell N., Mustonen T., Pandolfi J. M., Pettorelli N., Possingham H., Pulsifer P., Reynolds M., Scheffers B. R., Sorte C. J. B., Strugnell J. M., Tuanmu M. N., Twiname S., Vergés A., Villanueva C., Wapstra E., Wernberg T., Pecl G. T., 2018: Managing consequences of climate-driven species redistribution requires integration of ecology, conservation, and social science. - Biological Reviews, Cambridge Philosophical Society 93 (1): 284-305. [CrossRef]
- Chen, I. C., Hill, J. K., Ohlemüller, R., Roy, D. B., Thomas, C. D., 2011: Rapid Range Shifts of Species Associated with High Levels of Climate Warming. - Science 333, 1024-1026. [CrossRef]
- Daley D. J., Gani, J., 2005: Epidemic Modelling: An Introduction. - Cambridge University Press, NY.
- Destouni G., Kalantari Z., Quegan S., Leibovici D., Lemmetyinen J., Ikonen J., 2021: Modelling Climate Sensitive Infectious Diseases in the Arctic. – In Nord D. C. (ed.): Nordic Perspectives on the Responsible Development of the Arctic: Pathways to Action, Springer Polar Sciences, Springer International Publishing; pp. 93–111, ISBN 978-3-030-52324-4.
- ECDC: European Centre for Disease Prevention and Control – www.ecdc.europa.eu.
- European Centre for Disease Prevention and Control (ECDC), 2008: Surveillance of communicable diseases in the European Union - A long-term strategy: 2008-2013. – EU corporate publication.
- European Commission, Policy and Legislation, 2019: Recommendation on a European Electronic Health Record exchange format. – C (2019) 800 of 6 February 2019. https://digital-strategy.ec.europa.eu/en/library/recommendation-european-electronic-health-record-exchange-format.
- Evengård B., Destouni G., Kalantari Z., Albihn A., Björkman C., Bylund H., Jenkins E., Koch A., Kukarenko N., Leibovici D., Lemmityinen J., Menshakova M., Mulvad G., Nilsson L. M., Omazic A., Pshenichnaya N., Quegan S., Rautio A., Revich B., Rydén P., Sjöstedt A., Tokarevich N., Thierfelder T., Orlov D., 2021: Healthy ecosystems for human and animal health: Science diplomacy for responsible development in the Arctic. - Polar Record 57(e39): 1–. [CrossRef]
- Evengård B., Thierfelder T., 2021: CLINF. Climate-Change Effects on the Epidemiology of Infectious Diseases, and the Associated Impacts on Northern Societies. - In Nord D. C. (ed.): Nordic Perspectives on the Responsible Development of the Arctic: Pathways to Action, Springer Polar Sciences, Springer International Publishing, pp. 49–70, ISBN 978-3-030-52324-4.
- Evengård B., McMichael A., 2011: Vulnerable populations in the Arctic. - Global Health Action 4:3-5. [CrossRef]
- Fitzmaurice G. M., Laird N. M., Ware J. H., 2004: Applied Longitudinal Analysis – Wiley Series in Probability and Statistics, John Wiley & Sons., USA.
- Grandi G., Chitimia-Dobler L., Choklikitumnuey P., Strube C., Springer A., Albihn A., Jaenson T.G.T., Omazic A., 2020: First records of adult Hyalomma marginatum and H. rufipes ticks (Acari: Ixodidae) in Sweden. – Ticks and Tick-borne Diseases 11, 3.
- IPCC, 2000: Emission Scenarios. – Nakicenovic N., Swart R. (eds.), Cambridge University Press, Cambridge, England.
- IPCC, 2014: Climate Change 2014: Synthesis Report. Contribution of Working Groups I, II and III to the Fifth Assessment Report of the Intergovernmental Panel on Climate Change; Intergovernmental Panel on Climate Change (IPCC): Geneva, Switzerland, 2014; pp. 117–130.
- IPCC, 2018: Summary for Policymakers. Global Warming of 1.5◦C. An IPCC Special Report on the Impacts of Global Warming of 1.5◦C above Pre-Industrial Levels and Related Global Greenhouse Gas Emission Pathways, in the Context of Strengthening the Global Response to the Threat of Climate Change, Sustainable Development, and Efforts to Eradicate Poverty; Intergovernmental Panel on Climate Change (IPCC): Geneva, Switzerland, 2018.
- IPCC, 2000: Emission Scenarios. – Nakicenovic N., Swart R. (eds.), Cambridge University Press, Cambridge, England.
- IPCC, 2021: Climate Change 2021. The Physical Science Basis. Contribution of Working Group I to the Sixth Assessment Report of the Intergovernmental Panel on Climate Change [Masson-Delmotte, V., P. Zhai, A. Pirani, S.L. Connors, C. Péan, S. Berger, N. Caud, Y. Chen, L. Goldfarb, M.I. Gomis, M. Huang, K. Leitzell, E. Lonnoy, J.B.R. Matthews, T.K. Maycock, T. Waterfield, O. Yelekçi, R. Yu, and B. Zhou (eds.)]. Cambridge University Press, Cambridge, United Kingdom and New York, NY, USA, 2391 pp. [CrossRef]
- IPCC, 2022: Climate Change 2022: Impacts, Adaptation and Vulnerability. Contribution of Working Group II to the Sixth Assessment Report of the Intergovernmental Panel on Climate Change [H.-O. Pörtner, D.C. Roberts, M. Tignor, E.S. Poloczanska, K. Mintenbeck, A. Alegría, M. Craig, S. Langsdorf, S. Löschke, V. Möller, A. Okem, B. Rama (eds.)]. Cambridge University Press. Cambridge University Press, Cambridge, UK and New York, NY, USA, 3056 pp. [CrossRef]
- Jaenson T.G.T., Jaenson D.G.E., Eisen L., Petersson E., Lindgren E., 2012: Changes in the geographical distribution and abundance of the tick Ixodes ricinus during the past 30 years in Sweden. – Parasit Vectors 2012, 5:8. [CrossRef]
- Leibovici D. G., Bylund H., Björkman C., Tokarevich N., Thierfelder T., Evengård B., Quegan S., 2021: Associating Land Cover Changes with Patterns of Incidences of Climate-Sensitive Infections: An Example on Tick-Borne Diseases in the Nordic Area. – International Journal of Environmental Research and Public Health 18, 10963. [CrossRef]
- Jones K. E., Patel N. G., Levy M. A., Storeygard A., Balk D., Gittleman G. L., Daszak P., 2008: Global trends in emerging infectious diseases. - Nature, 451 (21), pp. 990-994.
- Ma Y., Vigouroux G., Kalantari Z., Goldenberg R., Destouni G., 2020: Implications of Projected Hydroclimatic Change for Tularemia Outbreaks in High-Risk Areas across Sweden. - International Journal of Environmental Research and Public Health 17, 6786. [CrossRef]
- Ma Y., Destouni G., Kalantari Z., Omazic A., Evengård B., Berggren C., Thierfelder T., 2021: Linking climate and infectious disease trends in the Northern/Arctic region. – Nature, Scientific Reports 11, 20678. [CrossRef]
- Mackenzie J. S., Jeggo M., 2019: The One Health Approach - Why Is It So Important? – Tropical Medicine and Infectious Disease 4(2), 88. [CrossRef]
- Malkhazova S., Mironova V., Shartova N., Orlov D., 2019: Mapping Russia’s Natural Focal Diseases. History and Contemporary Approaches. – Global perspectives on Health Geography, Springer.
- Oechel W., Vourlitis G., 2014: The Effects of Climate Change on Land—Atmosphere Feedbacks in Arctic Tundra Regions. - Trends in Ecology & Evolution 9, p. 324-329. [CrossRef]
- Ohta, T., Hiyama, T., 2019: Water and Carbon Dynamics in Eastern Siberia: Concluding Remarks. In: Ohta, T., Hiyama, T., Iijima, Y., Kotani, A., Maximov, T. (eds) Water-Carbon Dynamics in Eastern Siberia. Ecological Studies, vol 236. Springer, Singapore. [CrossRef]
- Omazic A., Berggren C., Thierfelder T., Koch A., Evengård B., 2019a: Discrepancies in data reporting of zoonotic infectious diseases across the Nordic countries; a call for action in the era of climate change. – International Journal of Circumpolar Health 78:1. [CrossRef]
- Omazic A., Bylund H., Boqvist S., Högberg A., Björkman C., Tryland M., Evengård b., Koch A., Berggren C., Malogolovkin A., Kolbasov D., Pavelko N., Thierfelder T., Albihn A., 2019b: Identifying climate-sensitive infectious diseases in animals and humans in Northern regions. – Acta Veterinaria Scandinavica 61, 53. [CrossRef]
- Orlov D., Menshakova M., Thierfelder T., Zaika Y., Böhme S., Evengard B., Pshenichnaya N., 2020: Healthy Ecosystems Are a Prerequisite for Human Health. A Call for Action in the Era of Climate Change with a Focus on Russia. - International Journal of Environmental Research and Public Health 17, 8453.
- Palmer S. R., Soulsby L., Torgerson P., Brown D. (eds.), 2011: Oxford Textbook of Zoonoses: Biology, Clinical Practice, and Public Health Control (2 ed.). – Oxford University Press. [CrossRef]
- Poloczanska E., Brown C., Sydeman W., et al., 2013: Global imprint of climate change on marine life. - Nature Climate Change 3, 919–925. [CrossRef]
- Rantanen M., Karpechko A. Y., Lipponen, A. et al., 2022: The Arctic has warmed nearly four times faster than the globe since 1979. Nature Communications, Earth & Environment 3, 168. [CrossRef]
- Rasmussen R. O., 2009: Gender and Generation: Perspectives on Ongoing Social and Environmental Changes in the Arctic. - Signs, 34 (3), pp. 524 – 532. [CrossRef]
- Riseth J. Å., Tømmervik H., Helander-Renvall E., Labba N., Johansson C., Malnes E., Bjerke J. W., Jonsson C., Pohjola V., Sarri L-E, Schanche A., Callaghan T. V., 2011: Sámi traditional ecological knowledge as a guide to science: snow, ice and reindeer pasture facing climate change. - Polar Record, 47: 202-217.
- Sorte C. J. B., Williams S. L., Carlton J. T., 2010: Marine range shifts and species introductions. Comparative spread rates and community impacts. - Global Ecology and Biogeography 19, 303–316. [CrossRef]
- Sustainable Development Working Group, 2017 – 2019: One Health. Activities and Achievements - http://hdl.handle.net/11374/2384.
- Sustainable Development Working Group, 2017: One Health. Operationalizing One Health in the Arctic. - http://hdl.handle.net/11374/1956.
- Taylor L. H., Latham S. M., Woolhouse M. E., 2001: Risk factors for human disease emergence. - Philosophical Transactions of the Royal Society of London, Ser. B, 356, pp. 983-990. [CrossRef]
- Tronin A., Tokarevich N., Blinova O., Gnativ B., Buzinov R., Sokolova O., Evengard B., Pahomova T., Bubnova L., Safonova O., 2020: Study of the Relationship between the Average Annual Temperature of Atmospheric Air and the Number of Tick-Bitten Humans in the North of European Russia. – International Journal of Environmental Research and Public Health 17(21), 8006. [CrossRef]
- US Institute of Medicine, Forum on Microbial Threats, 2008: Vector-Borne Diseases. Understanding the Environmental, Human Health, and Ecological Connections, Workshop Summary. - Washington DC, National Academies Press. https://www.ncbi.nlm.nih.gov/books/NBK52941/. [CrossRef]
- Waits A., Emelyanova A., Oksanen A., Abass K., Rautio A., 2018: Human Infectious Diseases and the Changing Climate in the Arctic. - Environment International 121, 703–713. [CrossRef]
- World Health Organization (WHO), 1984: Health promotion. A discussion document on the concept and principles of health. – Summary report of the Working Group on Concept and Principles of Health Promotion, Copenhagen, Denmark.
- World Health Organization (WHO), 2017: OneHealth – https://www.who.int/features/qa/one-health/en/.
- WMO Climate Normals, NOAA National Centres for Environmental Information. - https://www.ncei.noaa.gov/products/wmo-climate-normals.
Figure 1.
Through Finland and European Russia, borrelia (incidence per 100,000 inhabitants) has significantly translated towards northern latitudes through the 30-year climate reference period. Four-degree polynomial (left) and linear (right) interpolations, including interpolation artefacts (like negative incidences).
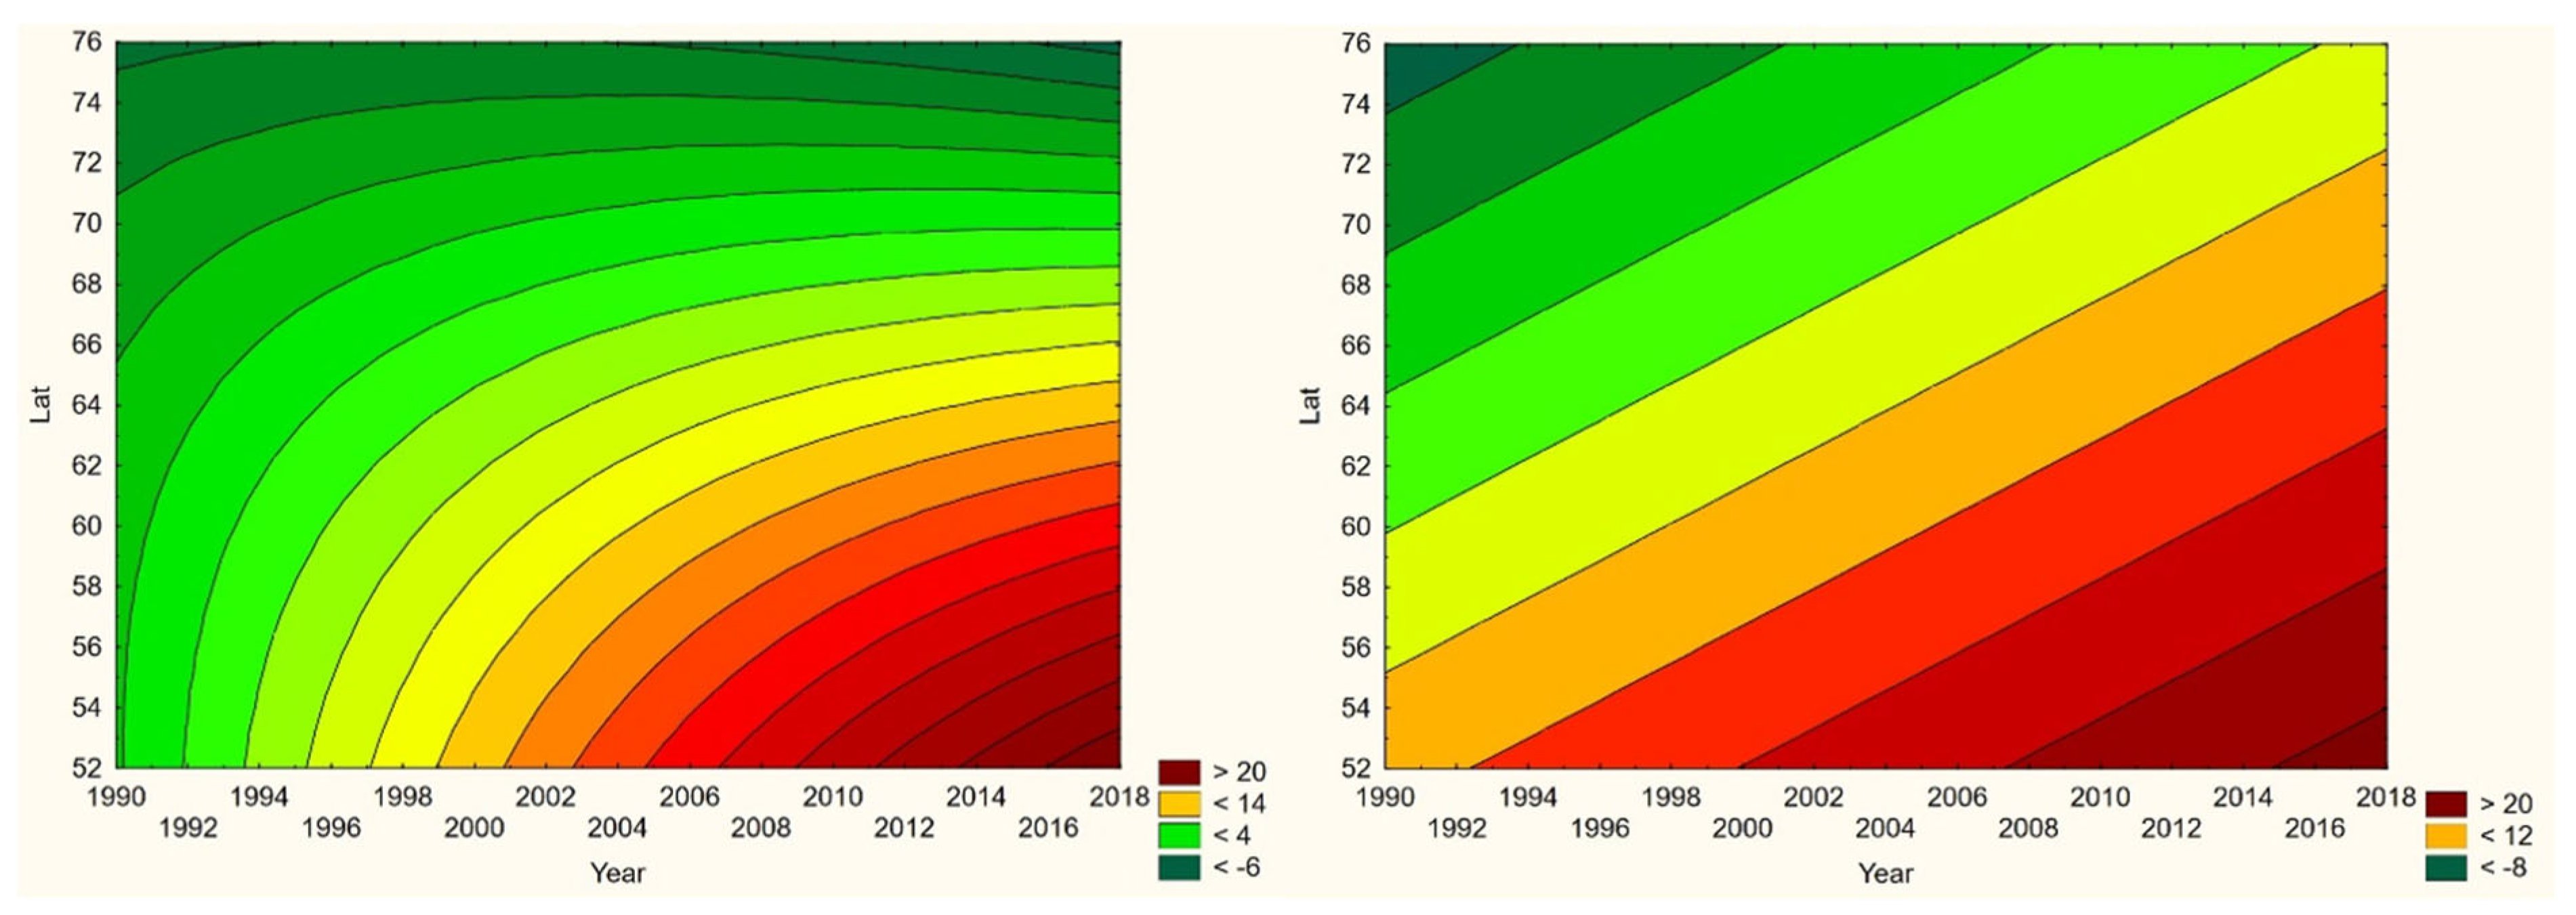
Figure 2.
Through Norway, borrelia (incidence per 100,000 inhabitants) has significantly translated towards the northern inland through the 30-year climate reference period. Third-degree spline interpolations, including interpolation artefacts (like negative incidences).
Figure 2.
Through Norway, borrelia (incidence per 100,000 inhabitants) has significantly translated towards the northern inland through the 30-year climate reference period. Third-degree spline interpolations, including interpolation artefacts (like negative incidences).
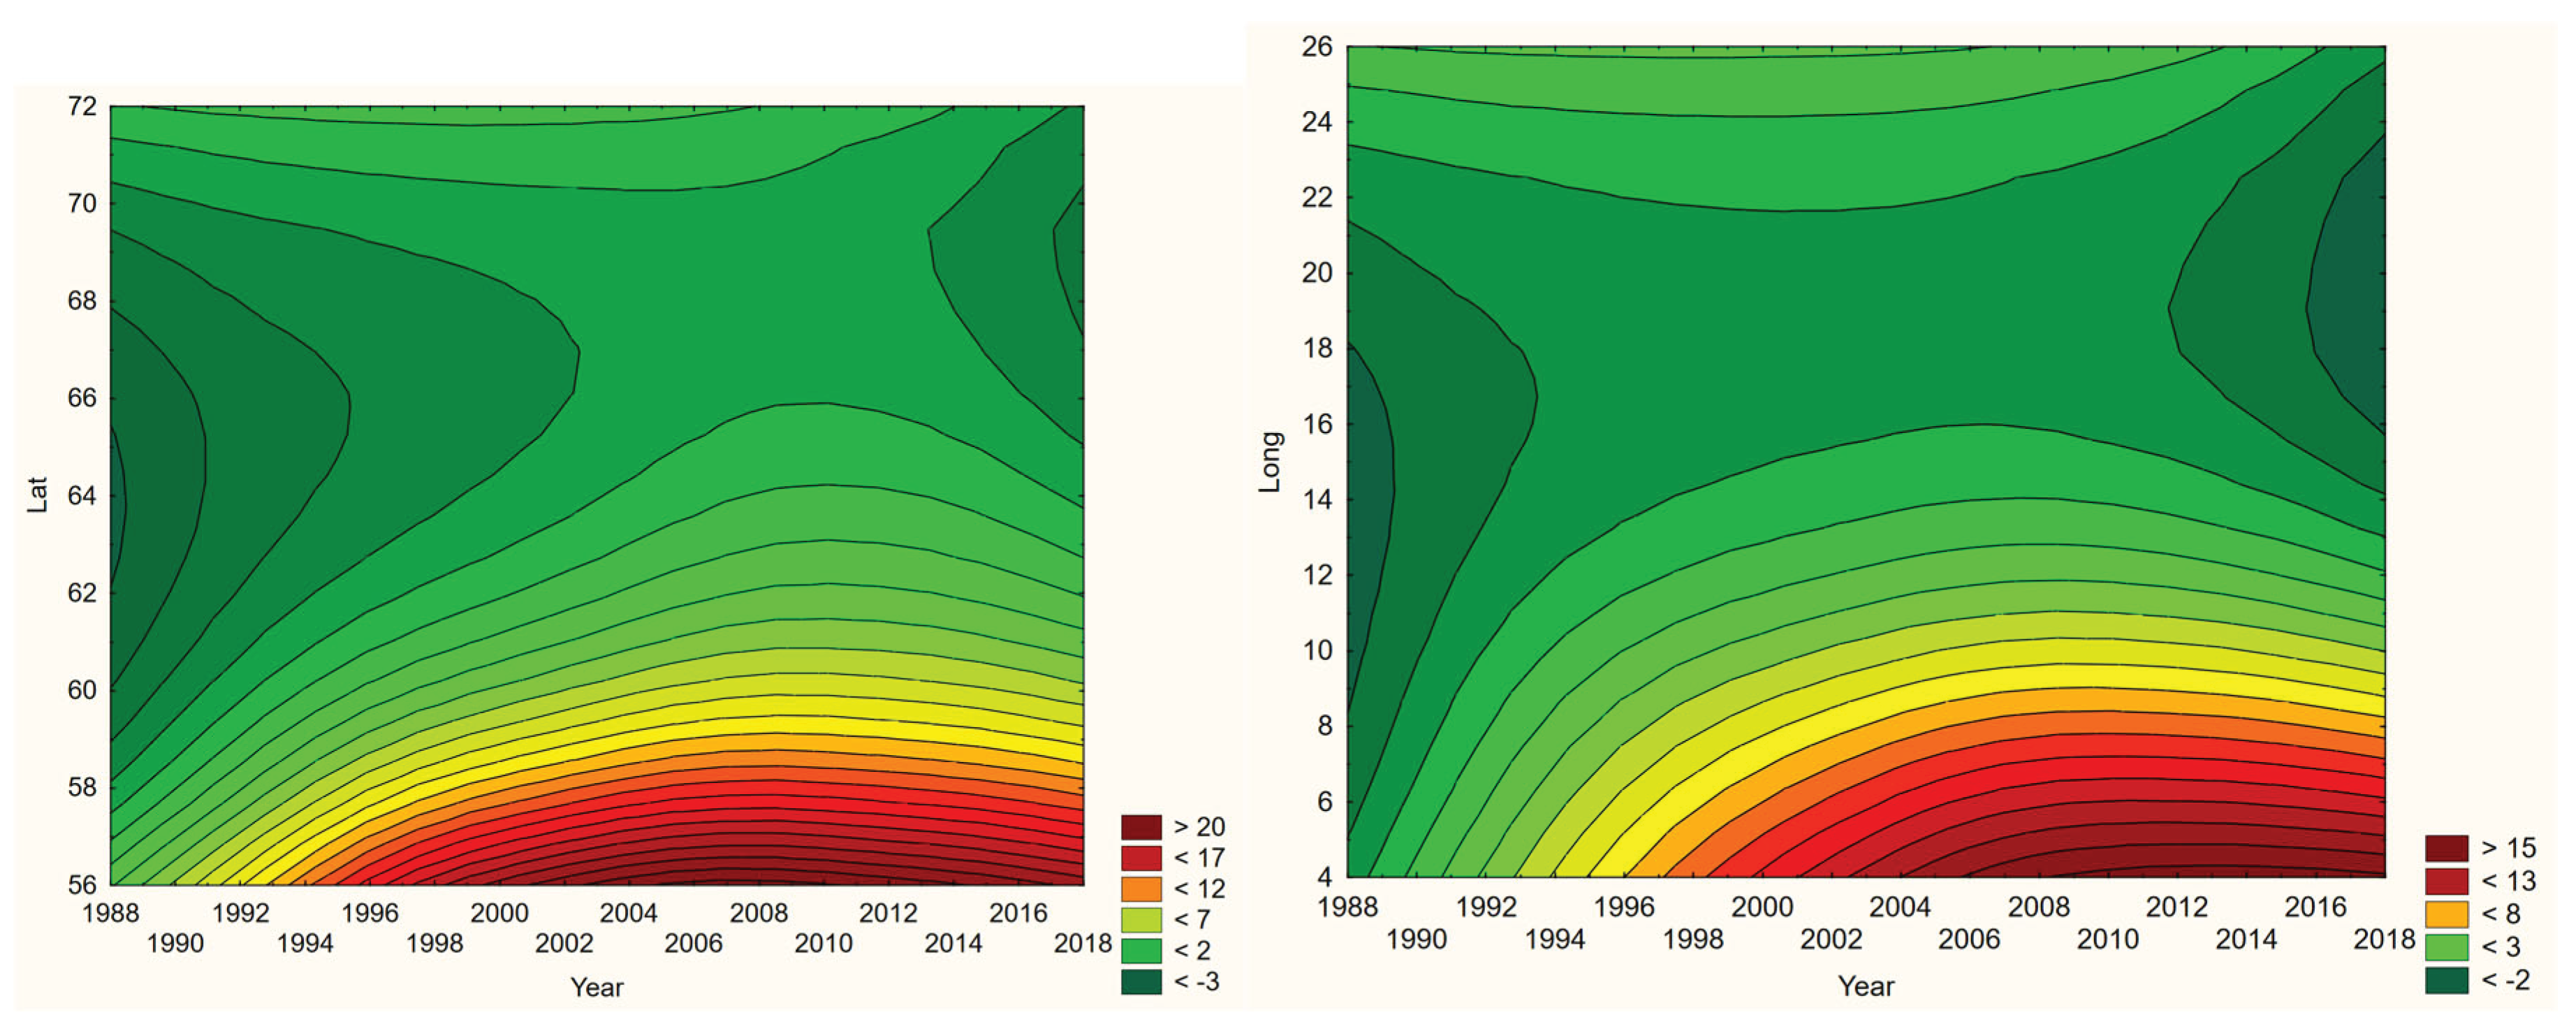
Figure 3.
Through Russia, here illustrated with Asian Siberia, the brucellosis population (ordinal incidences) reached maximum latitudes as well as longitudes around the 1980’s. Third-degree spline interpolations including interpolation artefacts (like negative incidences).
Figure 3.
Through Russia, here illustrated with Asian Siberia, the brucellosis population (ordinal incidences) reached maximum latitudes as well as longitudes around the 1980’s. Third-degree spline interpolations including interpolation artefacts (like negative incidences).

Figure 4.
As illustrated with Sweden (left, primary incidences), NE populations have migrated southwards while incidences have stayed rather unchanged through the observed period of time. In European Russia (right, ordinal incidences), the NE population has stayed latitudinally stationary while incidences have increased. Third-degree spline interpolations including interpolation artefacts (like negative incidences).
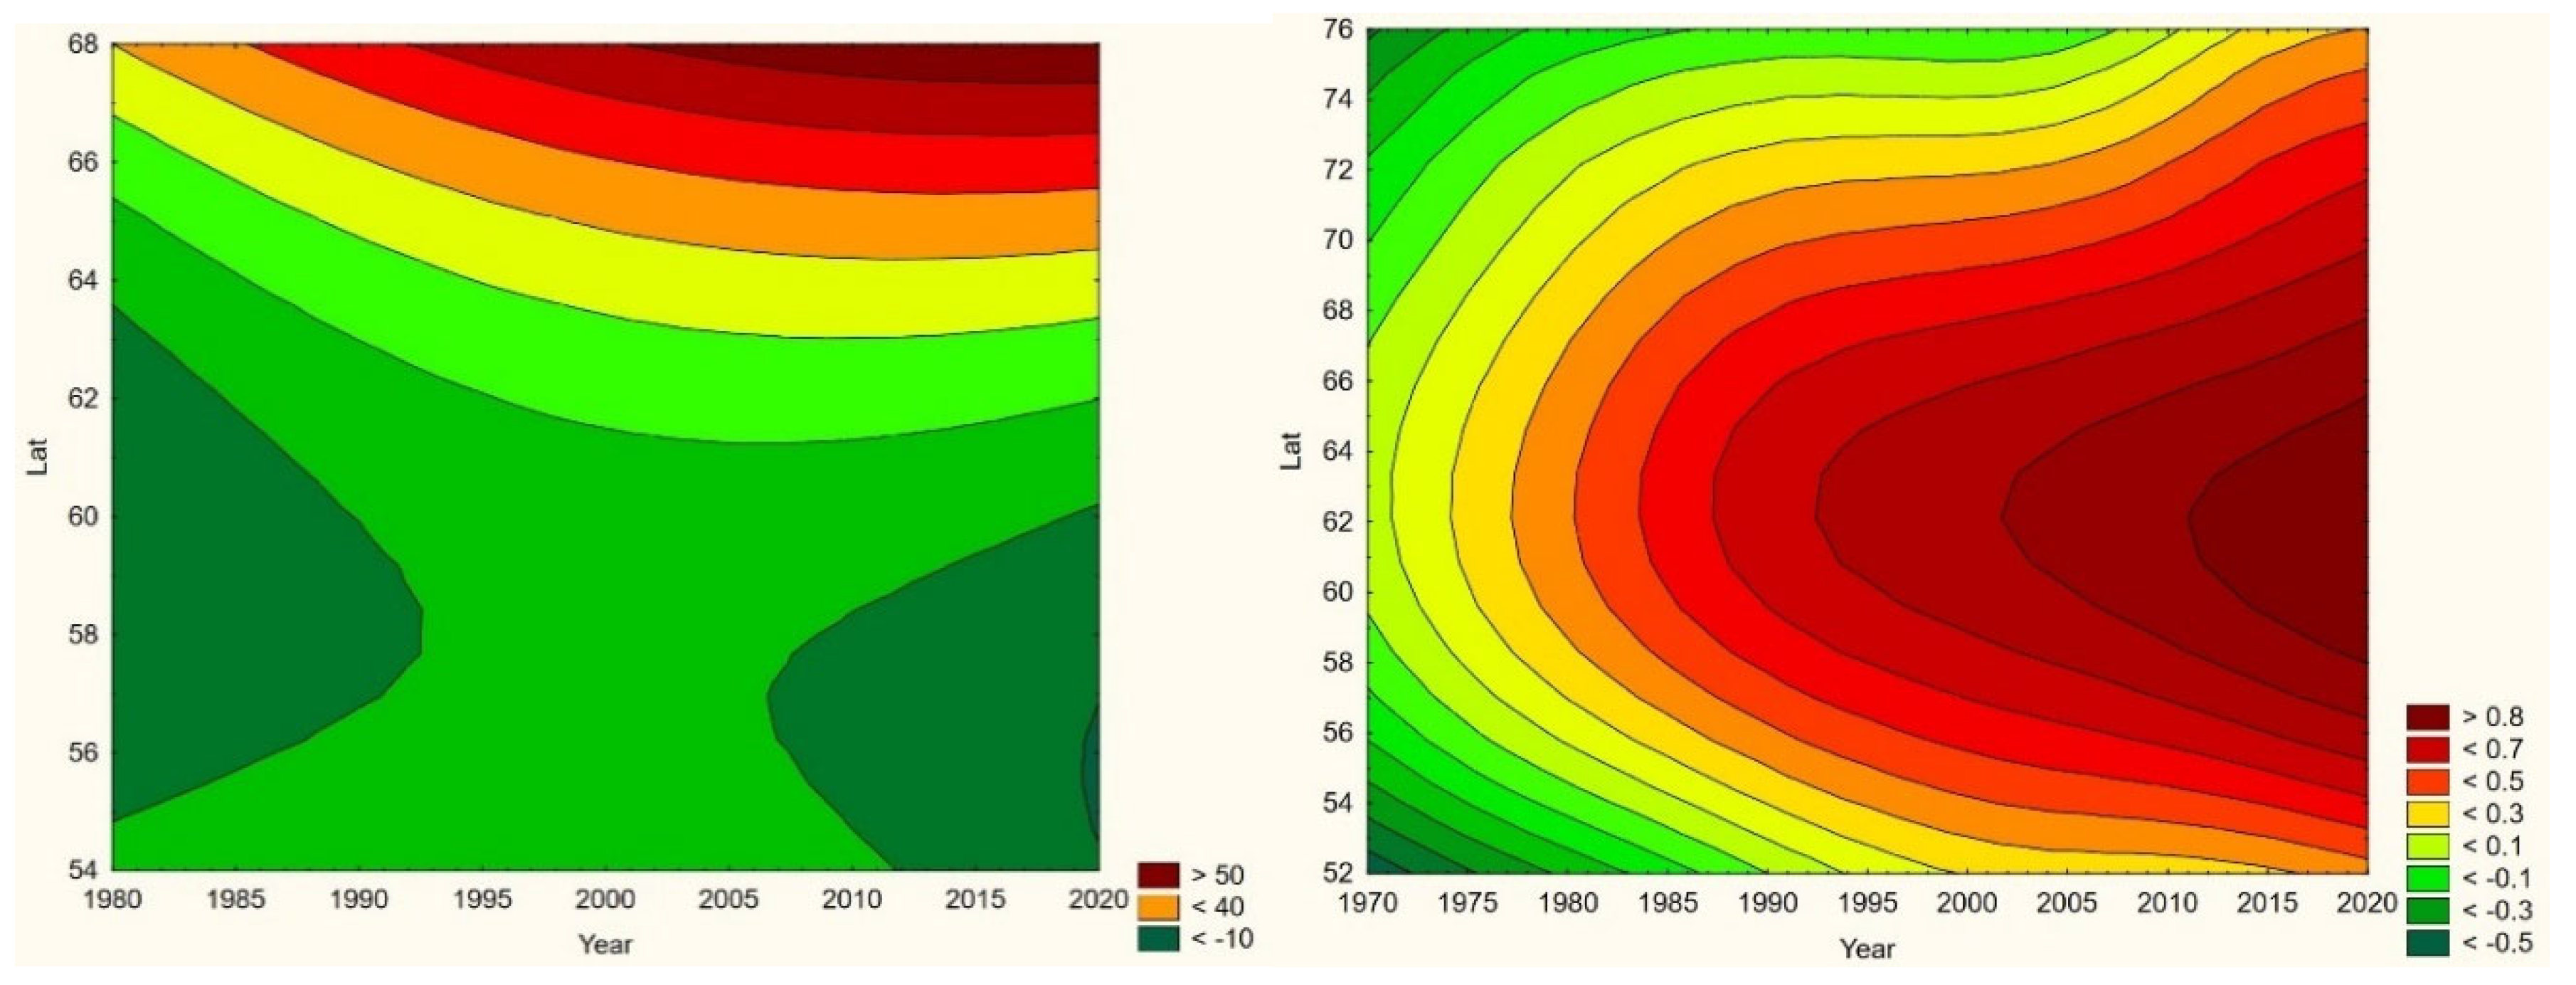
Figure 5.
As illustrated with Finland + European Russia (left, nominal incidences), the leptospirosis population has largely stayed geographically stationary through the observed period of time, although with incidence rates peaking around 1985. In European Russia (right, primary incidences), an incidence peak protruding towards the east around 1990 dominates northern population dynamics, prior to retreating back towards the southwest. Third-degree spline interpolations including interpolation artefacts (like negative incidences).
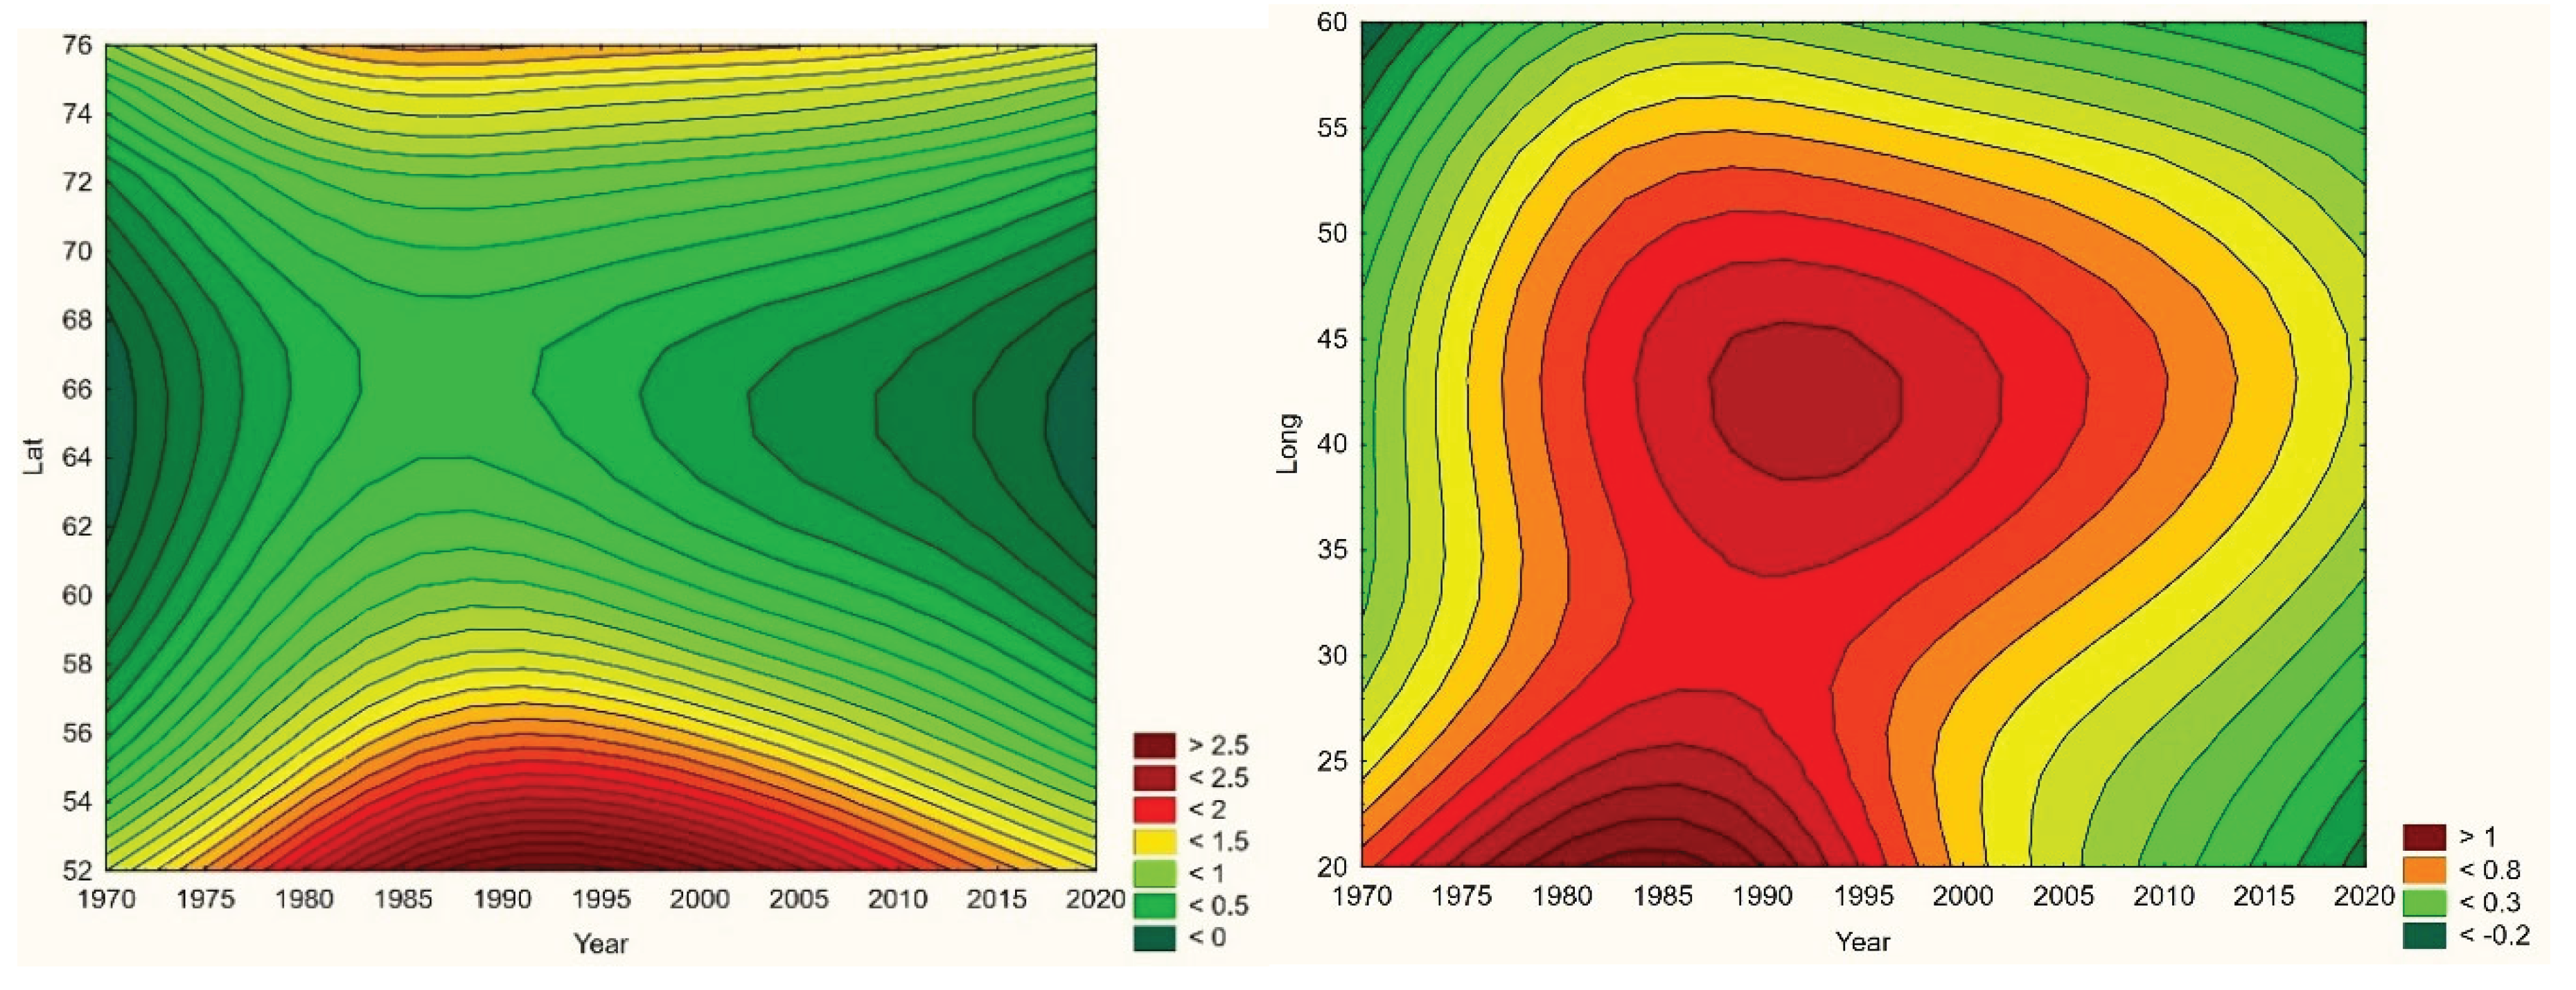
Figure 6.
As illustrated with Finland (latitude vs. year, primary incidences), the Q fever population displays a tendency of migrating northwards through the observed period of time, while incidence rates stay generally constant. Third-degree spline interpolations including interpolation artefacts (like negative incidences).
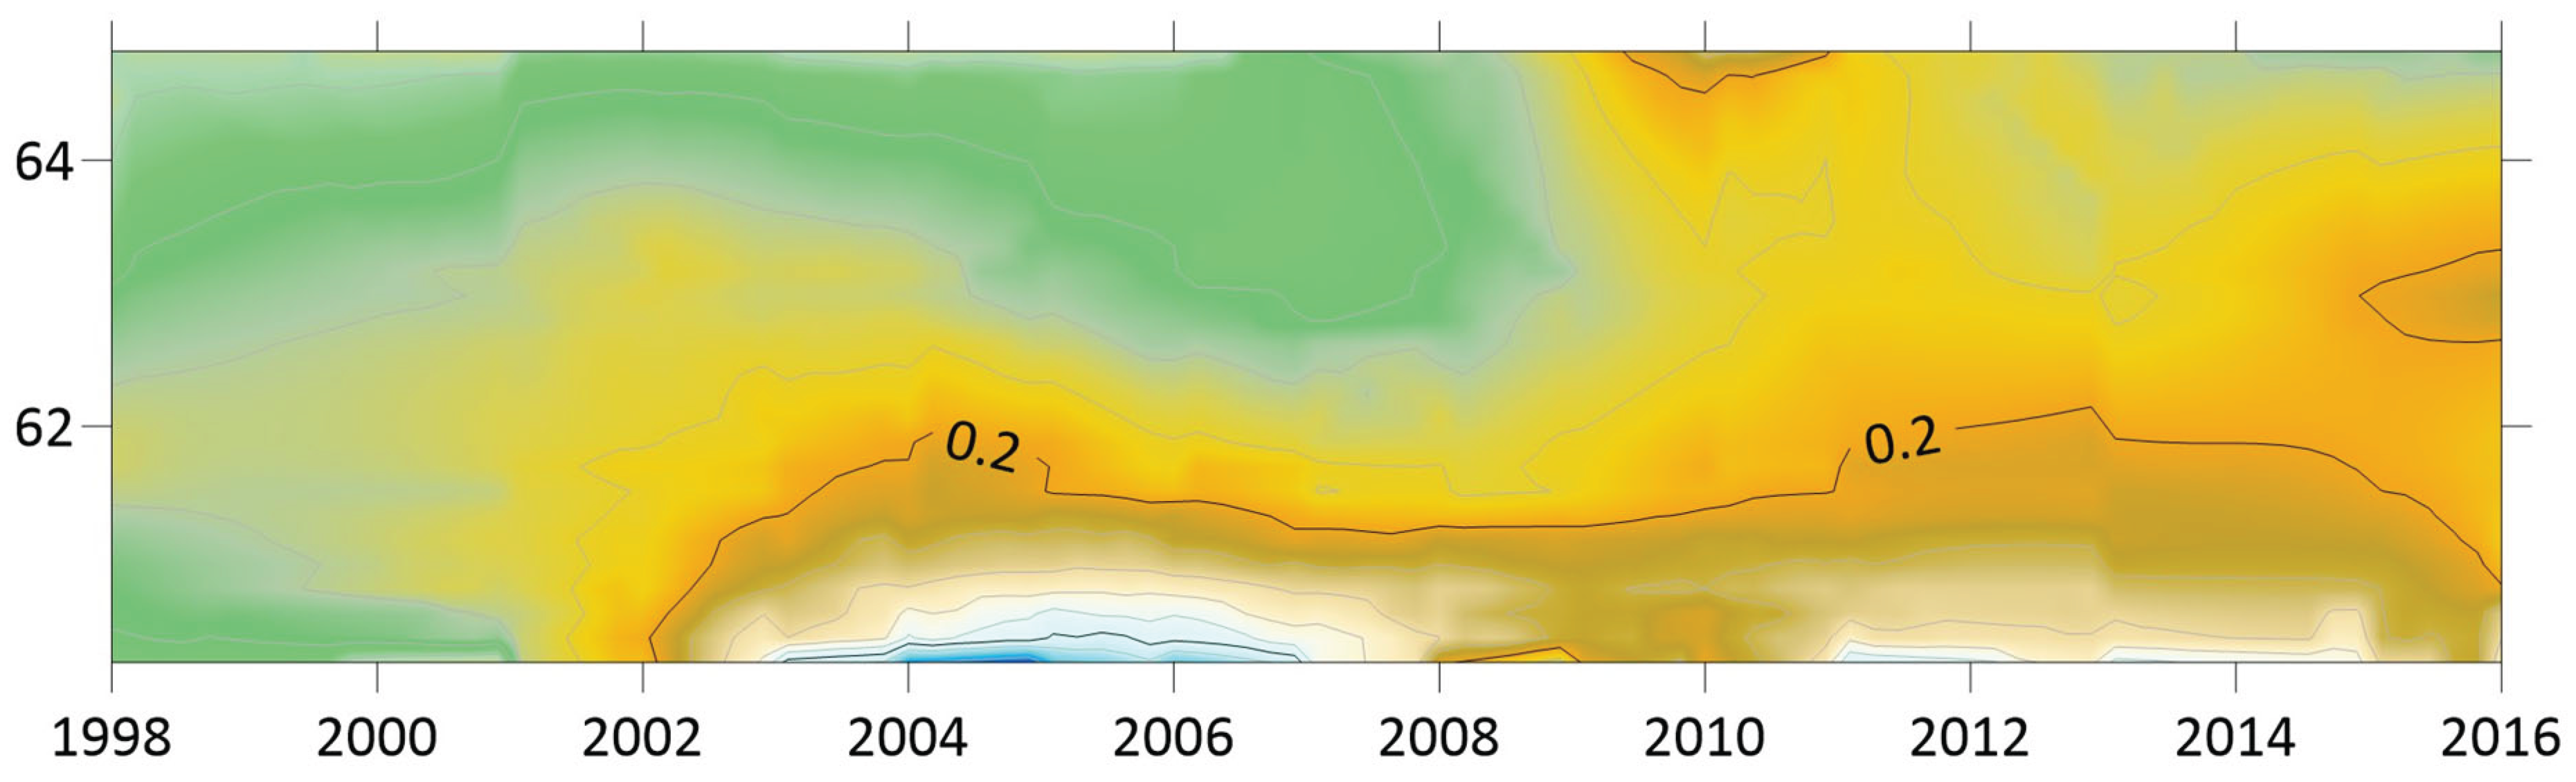
Figure 7.
As illustrated with Sweden (year and latitudes on top, longitudes below, primary incidences), the TBE population translates slowly across the mid-east, while incidence rates are significantly increasing. Third-degree spline interpolations including interpolation artefacts (like negative incidences).
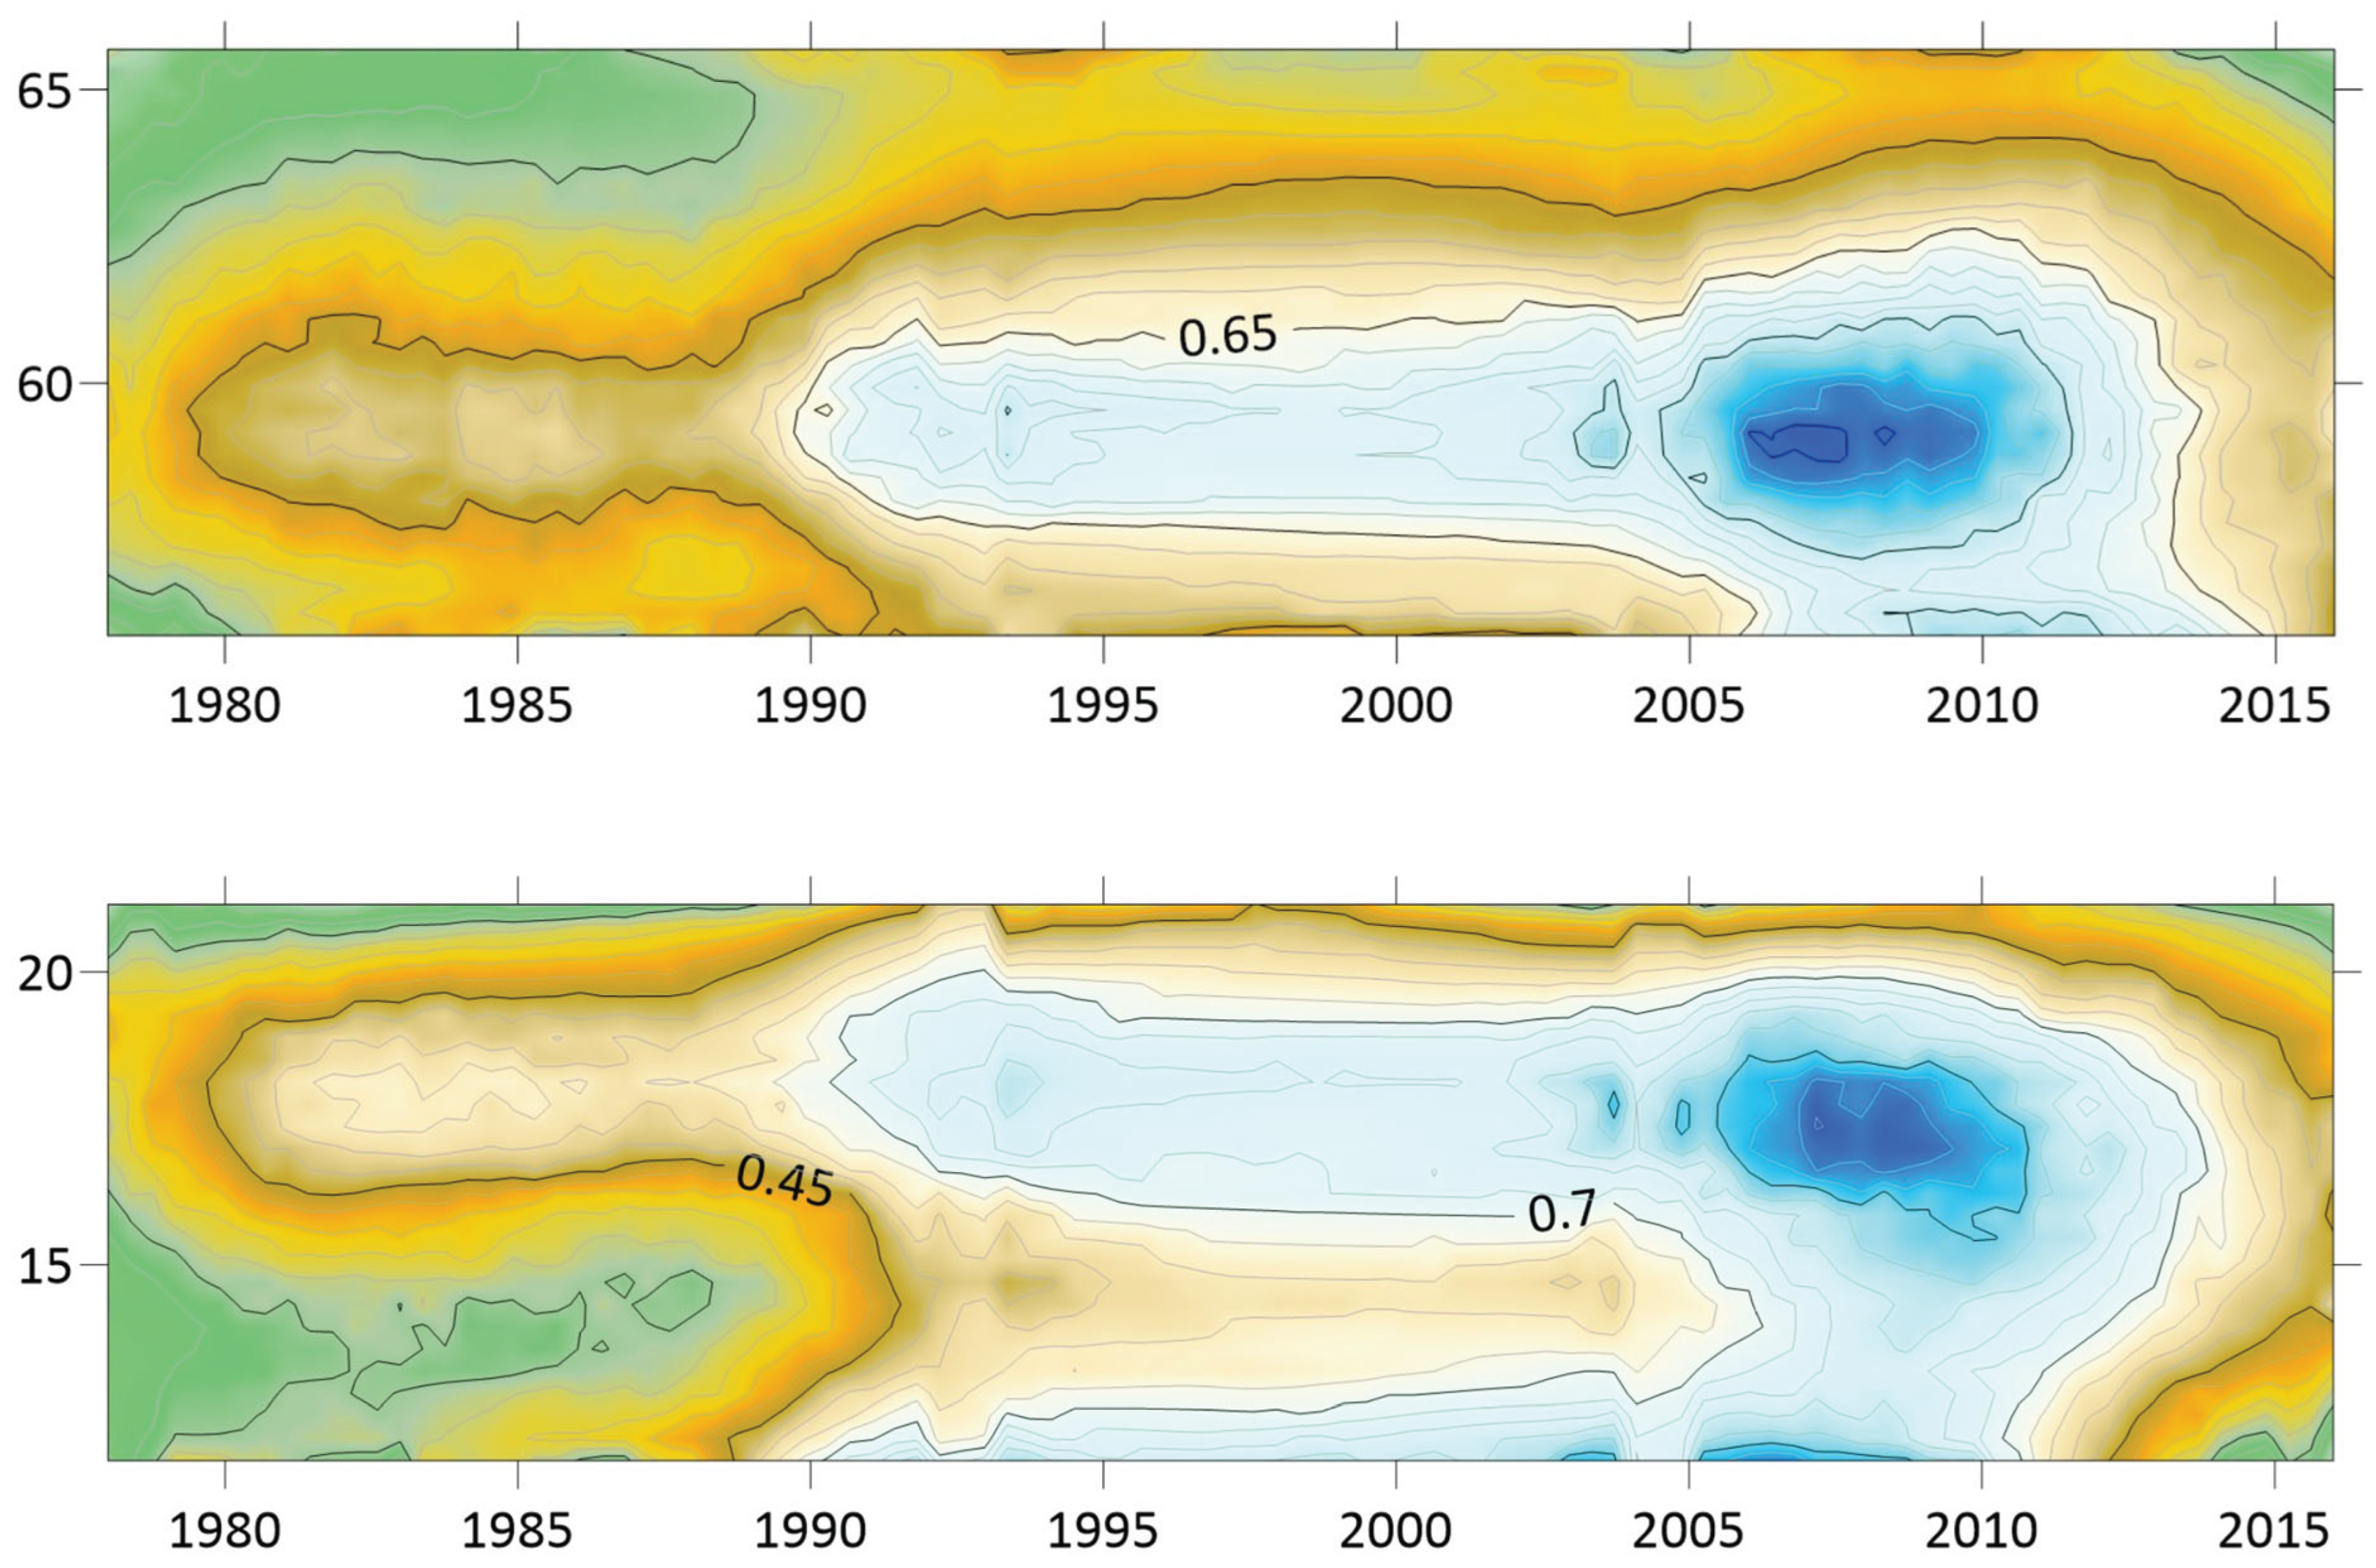
Figure 8.
As illustrated with Sweden (latitudes left, longitudes right, ordinal incidences), the tularaemia population slowly translates towards the south while incidence rates are increasing. The overall westbound trend was preceded with eastward translation until the late 1980’s, and the current outbreak seem to have started at high latitudes around year 2000. Third-degree spline interpolations including interpolation artefacts (like negative incidences).
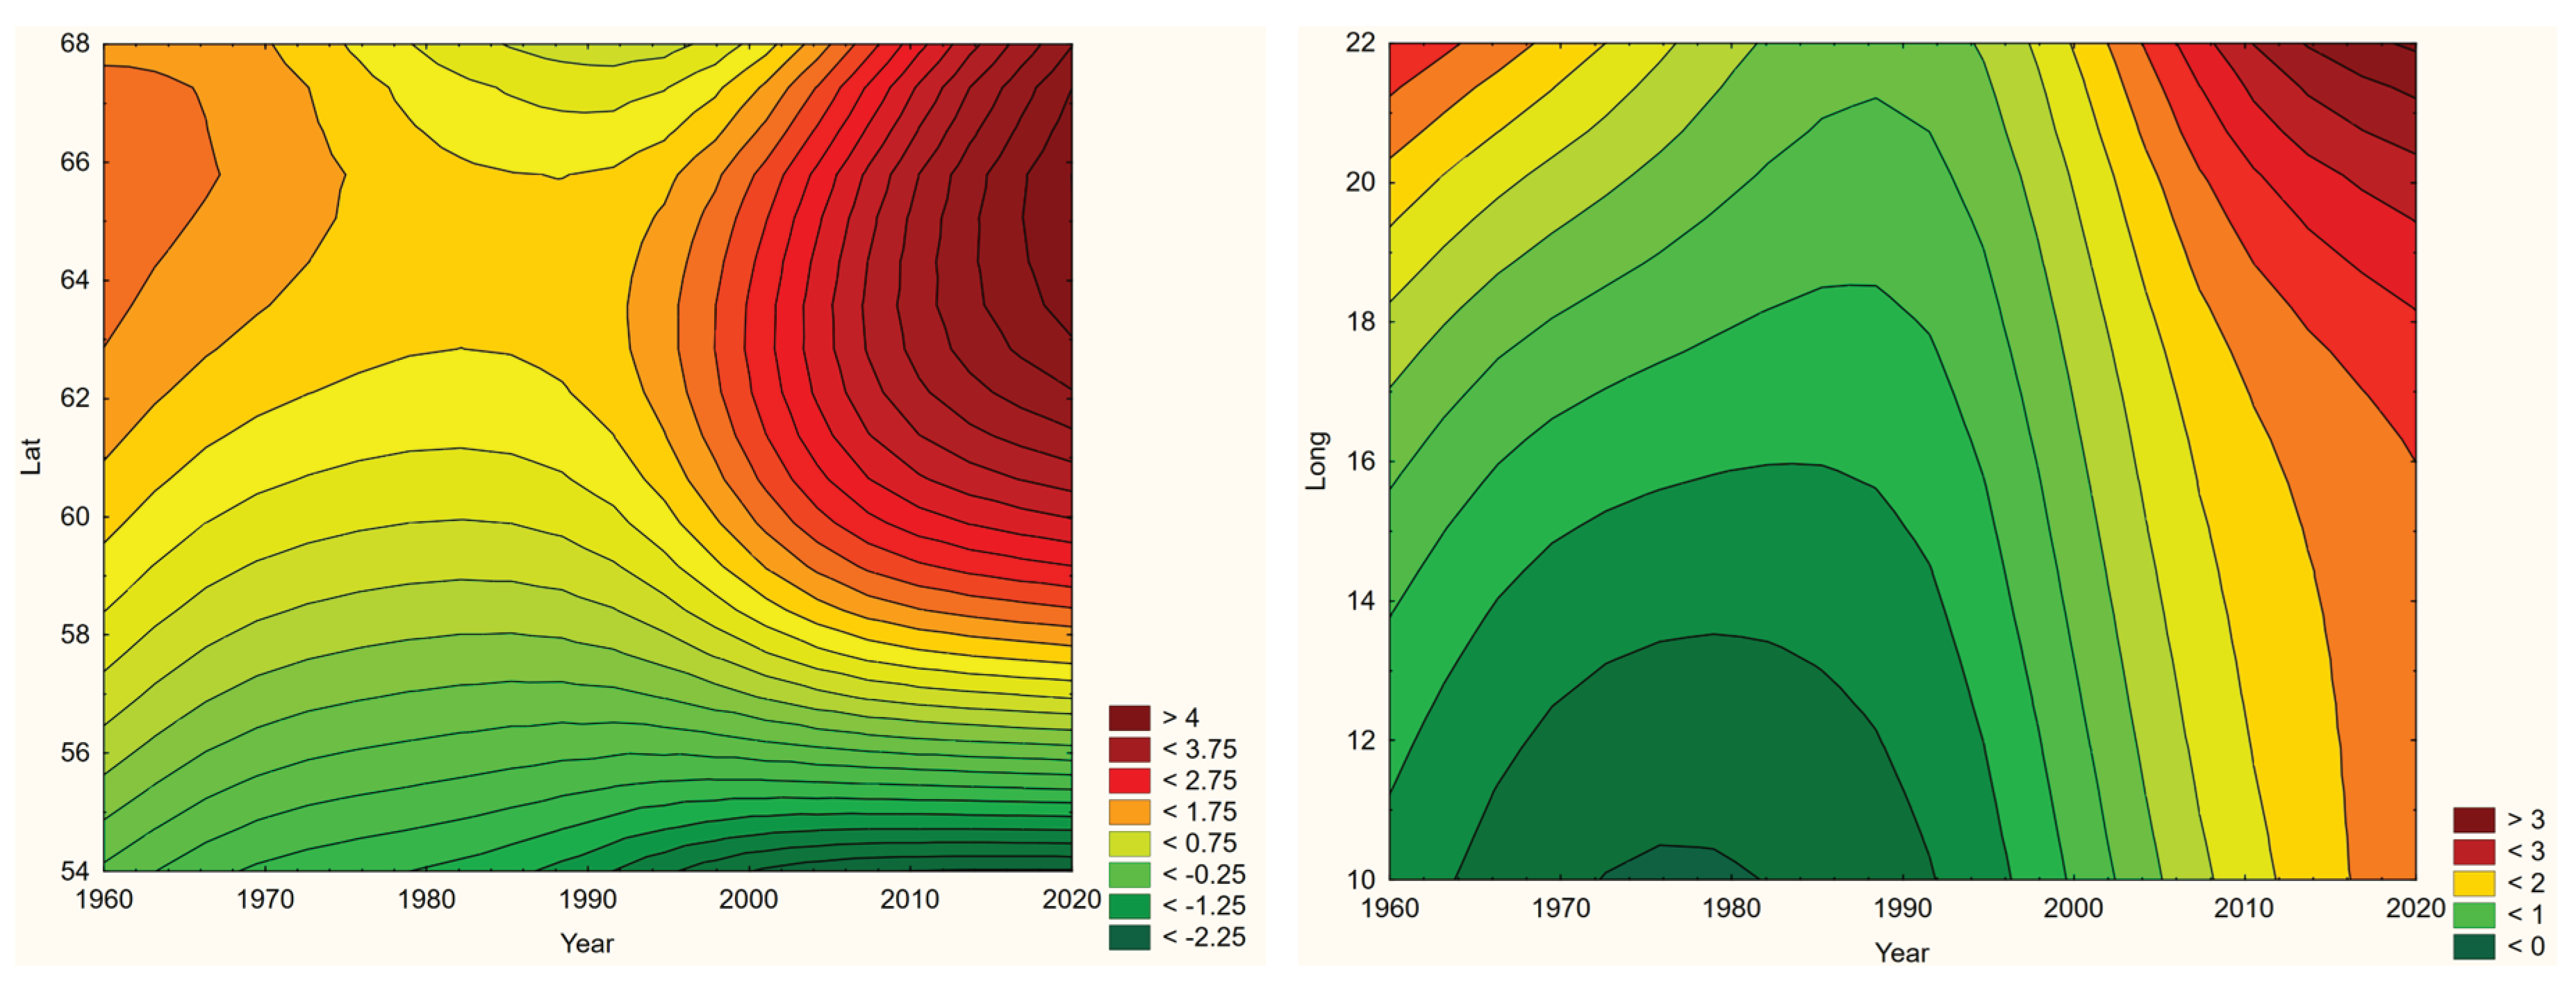
Table 1.
Temporal coverage of CLINF diseases data per nation and disease. Where not applicable (n/a), the diseases have not been reported. * = A single case of QFE reported in Greenland 2007.
Table 1.
Temporal coverage of CLINF diseases data per nation and disease. Where not applicable (n/a), the diseases have not been reported. * = A single case of QFE reported in Greenland 2007.
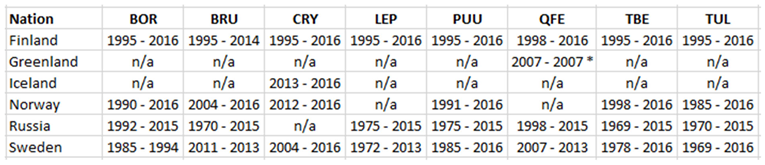 |
Table 2.
Comparative descriptives of the Northern borreliosis population (primary incidences), including the Aland population. N denotes the number of reports, where a typical report may contain many cases.
Table 2.
Comparative descriptives of the Northern borreliosis population (primary incidences), including the Aland population. N denotes the number of reports, where a typical report may contain many cases.
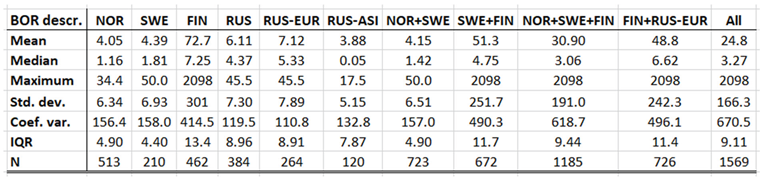 |
Table 3.
Comparative descriptives of the Northern borreliosis population (primary incidences), excluding the Aland population. N denotes the number of reports, where a typical report may contain many cases.
Table 3.
Comparative descriptives of the Northern borreliosis population (primary incidences), excluding the Aland population. N denotes the number of reports, where a typical report may contain many cases.
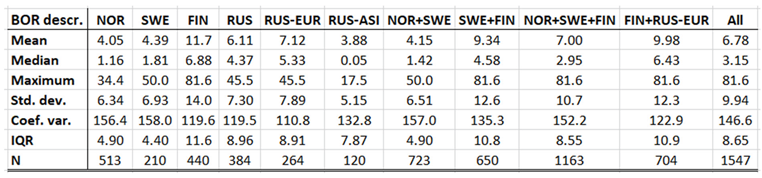 |
Table 4.
Comparative descriptives of the Northern brucellosis population (primary incidences) . N denotes the number of reports, where a typical report may contain many cases.
Table 4.
Comparative descriptives of the Northern brucellosis population (primary incidences) . N denotes the number of reports, where a typical report may contain many cases.
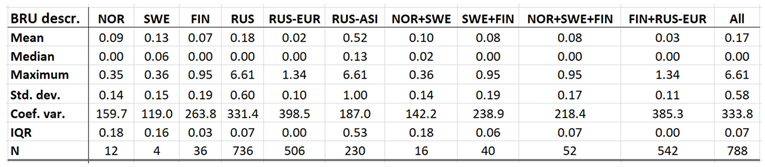 |
Table 5.
Comparative descriptives of the Northern cryptosporidiosis population (primary incidences). N denotes the number of reports, where a typical report may contain many cases.
Table 5.
Comparative descriptives of the Northern cryptosporidiosis population (primary incidences). N denotes the number of reports, where a typical report may contain many cases.
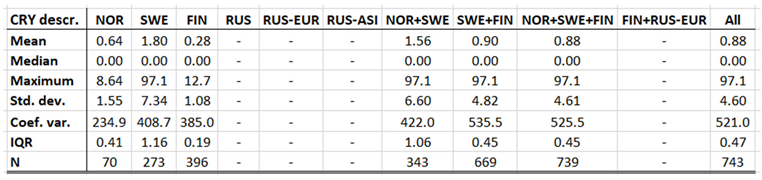 |
Table 6.
Comparative descriptives of the Northern NE population (primary incidences). N denotes the number of reports, where a typical report may contain many cases.
Table 6.
Comparative descriptives of the Northern NE population (primary incidences). N denotes the number of reports, where a typical report may contain many cases.
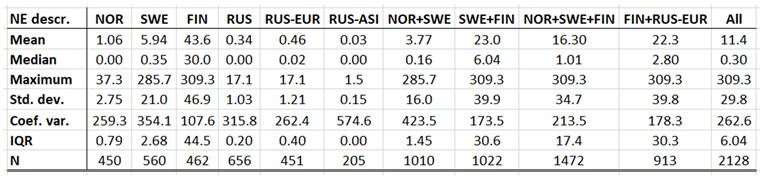 |
Table 7.
Comparative descriptives of the Northern leptospirosis population (primary incidences). N denotes the number of reports, where a typical report may contain many cases.
Table 7.
Comparative descriptives of the Northern leptospirosis population (primary incidences). N denotes the number of reports, where a typical report may contain many cases.
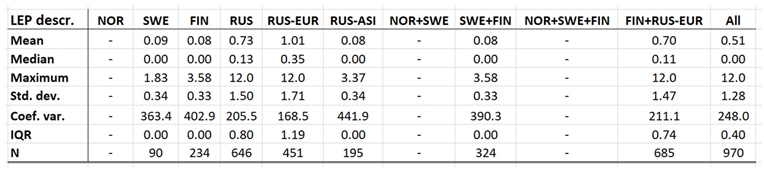 |
Table 8.
Comparative descriptives of the Northern Q fever population (primary incidences). N denotes the number of reports, where a typical report may contain many cases.
Table 8.
Comparative descriptives of the Northern Q fever population (primary incidences). N denotes the number of reports, where a typical report may contain many cases.
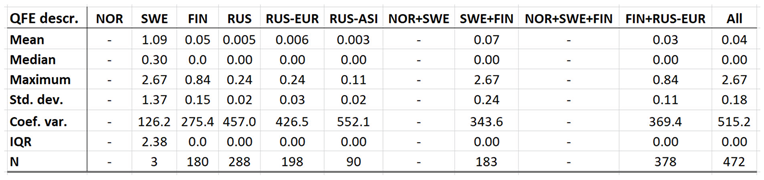 |
Table 9.
Comparative descriptives of the Northern TBE population (primary incidences), including the Aland population. N denotes the number of reports, where a typical report may contain many cases.
Table 9.
Comparative descriptives of the Northern TBE population (primary incidences), including the Aland population. N denotes the number of reports, where a typical report may contain many cases.
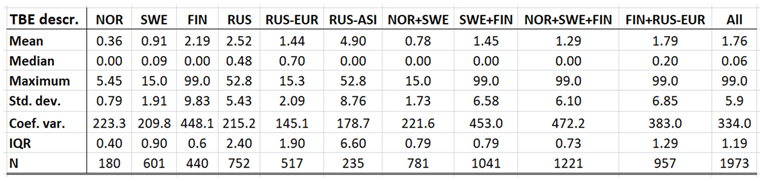 |
Table 10.
Comparative descriptives of the Northern TBE population (primary incidences), excluding the Aland population. N denotes the number of reports, where a typical report may contain many cases.
Table 10.
Comparative descriptives of the Northern TBE population (primary incidences), excluding the Aland population. N denotes the number of reports, where a typical report may contain many cases.
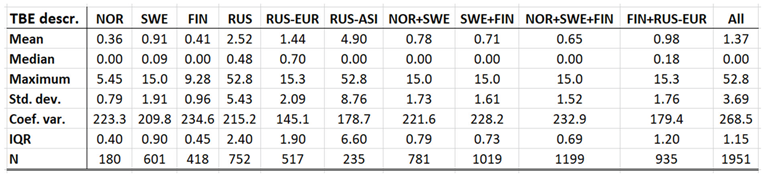 |
Disclaimer/Publisher’s Note: The statements, opinions and data contained in all publications are solely those of the individual author(s) and contributor(s) and not of MDPI and/or the editor(s). MDPI and/or the editor(s) disclaim responsibility for any injury to people or property resulting from any ideas, methods, instructions or products referred to in the content. |
© 2025 by the authors. Licensee MDPI, Basel, Switzerland. This article is an open access article distributed under the terms and conditions of the Creative Commons Attribution (CC BY) license (http://creativecommons.org/licenses/by/4.0/).
Copyright: This open access article is published under a Creative Commons CC BY 4.0 license, which permit the free download, distribution, and reuse, provided that the author and preprint are cited in any reuse.


