
Submitted:
26 May 2025
Posted:
03 June 2025
You are already at the latest version
Abstract
The Internet of Things (IoT) has enabled the development of various applications for energy, exploiting unprecedented data collection, multi stage data processing, enhanced awareness and control of the physical environment. In this context, availability of tools for efficient development is paramount. This paper explores and validates in the energy field the use of a generic, flexible, open source measurement oriented data collection framework for IoT, namely Measurify. Based on a literature analysis, we have spotted three domains (namely, vehicular batteries, low voltage (LV) test feeder and home energy management system) and defined for each one of them an application (namely: range prediction, power flow analysis and appliance scheduling), to verify the impact given by the use of the proposed IoT framework. We modelled each one of them with Measurify, mapping the energy field items into the abstract resources provided by the framework. From our experience in the three applications, we highlight the generality of Measurify, with straightforward modeling capabilities and rapid deployment time. We thus argue for the importance for practitioners of using powerful big data management development tools to improve efficiency and effectiveness in the life-cycle of IoT applications, also in the energy domain.
Keywords:
IoT
; measurement
; cloud
; energy
; battery management system
; smart grid
; building energy
1. Introduction
A Measurement-Oriented Data Management Framework systematically collects, processes, and stores Internet of Things (IoT) sensor-based data to ensure accuracy, consistency, and usability for analytics. Such a framework encompasses data acquisition, preprocessing, storage, and retrieval, facilitating real-time monitoring and informed decision-making like in human cognition-inspired condition management systems [1]. State of the art condition monitoring assesses system health by continuously measuring structural, environmental, and operational attributes of equipment and infrastructure. It relies on structured data pipelines and real-time analytics to derive meaningful insights. In this context, a measurement-oriented framework enables the efficient deployment of IoT services and modules such as fault detection, failure diagnostics, and prognostics for optimized maintenance [2,3,4,5]. These capabilities are especially relevant in the energy domain, where IoT technologies are widely applied to improve monitoring, efficiency, and decision-making. Literature reports several applications of IoT technologies in the energy sector, many of which concern power grid management. A cloud based IoT solution for fault detection and localization was used in power distribution systems in [6]. In [7], dynamic pricing under thresholding policies was used to reduce the peak consumption and better match the demand to supply smart grids. Energy consumption of residential buildings accounts for around 30–40% of the total energy use all over the world [8]. Therefore, home energy management systems (HEMS) can be a useful tool for significant electricity expenses reduction. Energy-efficient scheduling algorithm for demand-side management in smart grids achieved significant monetary savings in [9]. How dynamic electricity tariffs and grid charge designs influence residential consumer savings, tariff choices, and low-voltage grid reinforcement needs to support renewable energy integration was presented in [10]. Two-stage home energy management system, utilizing day-ahead electricity pricing tariffs, achieves an average cost reduction of 8.7%, as demonstrated in [11]. LSTM-based sequence-to-sequence model for appliance-level short term load forecasting in residential buildings was proposed in [12].
As energy-related applications are gaining ever more relevance, there is a growing need for tools that enable efficient and effective development of applications leveraging the vast data generated by the IoT [13,14,15]. Insights derived from IoT-connected devices are being utilized to develop new services, enhance real-time decision-making, improve efficiency, address critical challenges, and create innovative user experiences. Additionally, IoT applications can provide significant benefits to energy-intensive manufacturing enterprises by optimizing energy consumption, reducing operational costs, and improving overall sustainability.
For instance, in [16], an Elman recurrent neural network, was utilized to estimate the state of charge (SOC) and state of health (SOH) of lithium-ion batteries, leveraging its contextual memory for improved prediction accuracy. Wei et al. developed an online model to estimate the remaining driving range using real-world BEV data from Beijing, analyzing driving cycles and energy consumption to identify an optimal driving speed for maximum efficiency in [17]. Cloud-based battery condition monitoring platform was used to improve scalability, cost effectiveness, safety, reliability, and optimal operation of the large-scale battery energy storage systems in [18]. A cloud based IoT-enabled dynamic wireless charging metering service for electrical vehicles was realized in [19,20].
In such a variety of domains, problems, and technological solutions, we notice the lack of literature on works considering the efficient development of cloud-based solutions for seamless management of energy IoT data. This paper thus investigates the usefulness of a generic, cloud-based, measurement-oriented data collection system. We argue that the concept of measurement is at the very basis of the IoT paradigm and that collecting and managing data through a tool built on such a concept can enhance the development of applications. Based on a preliminary literature survey, we focused our research on three major energy application domains: vehicular batteries, low voltage (LV) test feeders and home energy management. As a tool, we use Measurify (previously known as Atmosphere), a non-vendor-locked, open source measurement oriented framework for managing smart things in IoT ecosystems [21]. The tool has been developed and tested in the automotive [20,22,23], human activity [24], sports activity [25] and health domains [26], and we are interested in understanding its effectiveness in the wider energy domain. Measurify provides a RESTful Application Programming Interface (API) [27] coded in Node.js. Node.js avoids the multi-threading burden by employing a non-blocking single-thread pattern and is able to efficiently serve multiple concurrent clients by operating asynchronously, employing the event-loop mechanism. For data management, the framework exploits the underlying MongoDB database and its seamlessly utilizable Mongoose persistence layer. A workflow for optimizing the integration of CSV files into MongoDB storage within the Measurify IoT application framework, facilitating the creation of application-specific resources, was proposed in [28] and evaluated in [29]. From an architectural point of view, the main requirements concern scalability, reusability, ease of deployment, and preservation of data integrity, and cross-domain standard IoT terminology. Measurify supports custom resource-type design, user/group, and right management.
The remainder of the paper is structured as follows: Section 2 characterizes the three targeted energy IoT application domains, based on literature analysis. For each one of these domains, an IoT data-rich service is chosen as an exemplary application, and Section 3 presents the modeling of those services through the Measurify framework. Experimental results are presented in Section 4. Section 5 draws the conclusions and indicates possible future work.
2. Energy Data Characterization in the Three Target Domains
IoT environments produce and use huge amounts of data. Handling this data effectively and gaining meaningful intuitions from them needs a deep understanding of their domains. To this end, we performed an extensive literature research and analyzed publicly available datasets. As anticipated, we focus on applications in three major energy domains: vehicular batteries, smart grids and building management.
2.1. Vehicular Batteries
Among the market available batteries for electric vehicles (EV), lithium-ion batteries feature high energy density, high power density, long service life, fast charging, lower self-discharge rate, and environmental friendliness and thus have found wide application in the area of consumer electronics [30]. State estimation of batteries in EVs is essential to optimize energy management strategy, extend the life cycle, reduce cost, and safeguard a safe application of batteries in EVs [31]. The main purpose of a battery management system (BMS) is to ensure safe and optimal use of the battery energy and provide accurate battery state information for the EV’s overall energy management. Alongside this, the BMS should have the capability to give proper interventions for the battery system if it is working in an abnormal condition such as over-charging or over-discharging. Overcharging of batteries can bring safety issues and generate chemistry degradation and short circuits that lead to fire and gas hazards. In a similar way, the over-discharging can damage the battery and shorten its lifetime by more than 50%. Precise battery measurement focuses on smaller unit measurement millivolt and milliamp accuracy and time synchronizing these voltages and current [32]. Precise and reliable battery state estimation is a critical tool for boosting the lifespan of the battery packs from 10 years to 20 years in the best case and generally result in a 30% lifetime improvement [33].
BMSs are well-established in portable electronic devices like cellular phones and notebooks. However, the implementation of BMS in EVs is still in the early stage because the number of cells in an EV is a hundred times higher than on portable devices. EV battery banks are designed to provide high voltage, current, and power, which makes BMS more complex than portable electronics. Figure 1 shows a typical EV BMS. The functional module consists of hardware as well as software components to collect data. The hardware structure consists of many kinds of sensors, actuators, controllers, cloud storage, and signal lines, whereas the software perspective contains measurement data parameters, states calculating algorithm (analytics tools) and methods, user interface (visualization), fault detection, and monitoring mechanism. Typical measured data for BMS consists of bus voltage, total current, cell voltage, temperature detection, and smoke detection. After sampling and preprocessing, measured data is forwarded to the control circuit as well as the cloud server. As a sample service implementation in this area, exploiting the Measurify IoT data framework, Section 3.1 analyze a module for the estimation of the battery SoC and EV range prediction.
2.2. LV Test Feeder
A LV feeder is a part of the electrical distribution system that delivers power from a distribution transformer to end-users, such as homes, businesses, or small industrial facilities. Structure of a low-voltage distribution grid connected to the medium-voltage grid through a transformer is presented in Figure 2. Smart meters are used as a sensor to measure household or small commercial loads. The sensor measures the energy usage data and forwards it to cloud storage. The measurements collected from an LV feeder are then used to feed services for power flow analysis. The LV test feeder is a radial distribution system operating at a base frequency of 50 Hz [34]. It is connected to the medium voltage network via a substation transformer, which steps down the voltage from 11 kV to 416 V. Both the main feeder and its laterals operate at 416 V.
Data collected from the LV feeder distributor can be used to generate insights on market trends, consumer behavior, system health, and critical alarms. By leveraging those dataset, various researchers modeled real-world scenarios, optimize grid efficiency, and enhance voltage stability [35,36]. These analysis are crucial to improving the reliability of the distribution system, integrating renewable energy sources, and ensuring the smooth operation of the feeders. Interactive information sharing between feeder distributors and consumers allows better scheduling and energy management. Among those services we choose power flow analysis because it enables the simulation of voltage drops, power losses, and load distribution in feeder networks, helping engineers assess system performance under different operating conditions. Section 3.2 presents stepwise functional methodology to calculate power loss in the LV feeder.
2.3. Home Energy Management System (HEMS)
A HEMS is a smart system that monitors, controls, and optimizes energy usage in a household. It integrates various devices such as smart meters, appliances, renewable energy sources, energy storage systems, and demand-side management strategies to improve energy efficiency and reduce costs [37]. HEMS typically uses automation, data analytics, and machine learning to schedule appliance operation, balance power consumption, and take advantage of time-of-use electricity pricing. It can also enhance grid stability by coordinating energy consumption with supply fluctuations. According to Ruano et. al. HEMS can be managed in four stages [38]. The first stage collects data, the electrical readings such as current, voltage and power, measured by smart meters/acquisition boards or by using specific sensors. In the second stage, namely the event detection, any change in the state of an appliance over time was noticed through thresholding based on historical data. In the third stage, feature extraction of each appliance based on the load signature was performed. Finally, in the fourth stage, the load was identified by using the extracted features.
The introduction of smart metering produces fine-grained energy consumption data allowing for the extraction of more valuable information of energy demand and production compared to having only an energy balance over an extended period of time. A precise demand-response functionality is expected to benefit from a much finer granularity of information, like appliance load monitoring [39]. The appliance load monitoring focuses on implementing detailed energy sensing and delivering information on the breakdown of the energy spent. There are two major appliance load monitoring approaches namely Intrusive Load Monitoring (ILM) and Non-Intrusive Load Monitoring (NILM), based on the number of sensors used. ILM, also referred to as distributed sensing, performs different activities such as occupancy detection, behavior monitoring, contextual sensing. In NILM, on the other hand, only power consumption by appliance as a single measurement is sensed. The ILM method is more accurate in measuring appliance-specific energy consumption, but less widespread, because of some practical difficulties, such as multiple sensor configuration, high costs, complex multimodal analysis and decision making.
A typical NILM data collection framework for HEMS is depicted in Figure 3. Electrical appliances such as computers, ovens, and washing machines are monitored using sensors or meters for electrical quantities (e.g., current, voltage, power). These measurements are influenced by parameters like sampling rate and accuracy. Data is transmitted via communication protocols (e.g., ZigBee, MQTT, HTTP) to a central server, stored in various file formats (e.g., CSV, HDF5, WAVE), and used for HEMS analytics including appliance scheduling and load forecasting.
The HEMS should offer advantages to both residential occupants and electricity suppliers for better exploitation of the power sources. For electricity suppliers, two-way communication allows a better organization of the network and the implementation of several mechanisms known as demand response to dynamically control load based on capacity analysis, emergency demand response, and supplementary service analysis by suppliers. Nowadays, dynamic electricity retail tariffs are commonly used to support renewable energy integration, allowing residential occupants to reduce their electricity costs by scheduling appliance usage efficiently. Section 3.3 presents an appliance scheduling method to recommend optimum hours for high electricity-consuming appliances.
3. Services Based on IoT Measurements
In this section, for each one of the domains described above, vehicular batteries, LV feeder, and HEMS, we deal with a significant problem and see how a relevant cloud-based service, that we draw from the literature, can be built exploiting a measurement-oriented framework such as Measurify.
Before going in the detail, we briefly present the generic design workflow supported by Measurify. The first step in the workflow consists of domain modeling, where the domain field objects are mapped to the Measurify API’s resources, each one with its own schema, that are accessible through the API routes. Table 1 provides an outlook of the main Measurify resources. Once a Measurify installation is configured with the domain-specific instantiation of the configuration resources (i.e., Features, Things, Devices and Tags), the system is ready to receive data (i.e., Measurements) in json format from the field through the common RESTful APIs. For the sake of data integrity verification, Measurify is in charge of checking that each received Measurements is formatted according to its corresponding. Measurify is in charge of verifying. More information can be found in [21].
For the reader’s convenience, Section 3.4 Table 2 provides a synopsys of three IoT services EV range prediction, power flow analysis and appliance scheduling, and Table 3) provides data characterization and mapping with Measurify resources.
3.1. Range Prediction
Range prediction is a complex and difficult problem and depends on a lot of influence factors. A data-driven energy consumption prediction method for EVs, developed in [40] for energy-efficient routing, has demonstrated both high prediction accuracy and ease of use. There are many different parameters that influence the range of vehicles such as SoC, ambient temperature, driving behavior, route and traffic as shown in Figure 4. The weightage of influencing parameters on EV range prediction have following values 54% SoC, 25% Ambient temperature, 10% Driver behavior, 6% Route, 5% Traffic, acording to [41]. Accuracy of estimated range for an EV mainly depends on the accuracy of the SoC estimation. The driving range depends upon both estimating the remaining energy in the battery and predicting the future energy consumption pattern of the remaining trip.
The SoC of a battery shows the level of charge remaining capacity in percentage compared with its maximum available capacity. It is a crucial parameter for the charging/discharging strategies to protect the battery from overcharging/over discharging. In [42], the authors critically analyzed the various algorithms to estimate the li-ion battery SoC. The real-time, accurate estimation of SoC in EVs is challenging because of the strong time-variables and nonlinear characteristics with the driving loads, operational conditions [31]. Open-circuit voltage (OCV) profiles play a crucial role in SoC estimation as they provide a direct relationship between voltage and battery capacity. During charging and discharging, the OCV changes with SoC due to battery chemistry, hysteresis effects, and aging, making accurate profiling essential for precise estimation. By leveraging OCV-SoC characteristics, BMS can improve SoC accuracy. To see the characteristics OCV during charging and discharging we can gain the relationship between voltage range and SoC as in Figure 5. The fifth cycle of charging and discharging from the Li-ion battery B0005, taken from the battery aging datasets, is used to visualize the graph [43]. The maximum charging voltage reaches 4.2V, while the discharge voltage drops to 2.7V. The charging OCV is higher than the discharging OCV due to voltage hysteresis, internal resistance, and electrochemical reaction dynamics, causing polarization effects and ion transport limitations.
It is a complete case for SoC estimation from BMS as in [18], but we move further to predict range of EV. Most studies regarding range estimation are focused on the prediction of the variable energy consumption and assume the remaining energy in the battery, in the form of SoC and SoH. Tannahill et al. proposed a range estimation method incorporating environmental and behavioral factors, along with SoC and vehicle efficiency, yielding greater accuracy than traditional SoC-based approaches [44]. A data-driven approach integrates real-world driving, geographical, and weather data to predict energy consumption across a road network. This method reduces error in multiple linear regression models to 12–14% of average trip consumption, with 7–9% attributed to SoC estimation [40].
The force required to move the electric vehicle, also known as the tractive force, is given by Equation (1) as the sum of the gravitational force, aerodynamic drag, and rolling resistance.
Where m is the mass of the vehicle, g is the gravitational acceleration, is the air density, is the drag coefficient, A is the vehicle’s frontal area, v is the speed, is the frontal wind speed and cr is the rolling resistance coefficient. The necessary power delivered by an engine (dE) to travel a (ds) distance while the vehicle maintains a desired acceleration and speed is given by the following Equation (2).
For simplicity we assume in a first order the rolling resistance coefficient, drag coefficient, air density and vehicle mass are constant, and the energy consumption can be described as a linear combination of the kinematic parameters ds, v2 ds, (dv/dt)ds, and h = ds sin as in [45]. To represent the consumption of the auxiliaries, the formula was then extended with a time-linear, temperature-scaled term.
Block diagram of range prediction system’s workflow is illustrated in Figure 6. The methodology employed in this study integrates real-world physics-based computations to analyze vehicle energy consumption, incorporating aerodynamic drag, rolling resistance, and inertial forces. A data-driven approach utilizing linear regression is applied to predict future range and energy depletion based on historical trip data. Furthermore, the methodology includes visualization techniques to assess trip efficiency, enabling a comprehensive evaluation of energy usage patterns for electric vehicle performance analysis. It begins by defining EV and environmental constants while loading trip data, including battery and drive cycle data. The data undergoes preprocessing (resampling and imputation), followed by computing elevation, time difference, and distance. Aerodynamic and inertial forces are then calculated, leading to the computation of overall energy consumption, including regenerative braking effects. The system generates time-series data for SoC, distance, and energy, which is then used to train linear regression models and predicts range. Modeling of the range prediction service to a Measurify model is straightforward and mapped as in Table 3.
3.2. Power Flow Analysis
The global electrical power industry faces challenges like generation diversification, asset optimization, energy conservation, demand response, and carbon footprint reduction. Efficient energy monitoring and control are crucial for maximizing renewable energy benefits. Power (Sometimes called as Load ) flow analysis is a crucial method for examining power system operation and planning by determining node voltages and branch power flow based on a given generation state and network structure [46]. It provides a steady-state solution without considering transient processes, formulating the problem as a nonlinear algebraic equation derived from Kirchhoff’s Current Law (KCL) at each bus. The Newton-Raphson (NR) method solves these equations using iterative linearization based on Taylor series expansion. The general form of the power flow equations is given as follows:
where: are Voltage magnitudes at buses i and j, are Conductance and susceptance between buses i and j, and = Phase angle difference between buses i and j. After that, NR solves the nonlinear power flow equations iteratively by linearizing them using the Jacobian matrix until the error is within an acceptable threshold.
Figure 7 depicts a block diagram of power flow analysis to calculate power losses in feeder to know the congestion time (overload time ) to reducing energy wastage for distribution system operators. It uses the Newton-Raphson method for power system studies. It begins with the load measurement data of the feeder, including bus data, line data, and load profiles. The next step involves mapping the power grid model, incorporating a slack bus and multiple load buses to represent the network structure. Then, power loss results are initialized, and the Newton-Raphson method is used to iterate over multiple time steps, solving power flow equations dynamically. The computed results help in analyzing power losses, which are crucial for identifying periods of high congestion. Finally, these insights help indicate congestion times, enabling effective load management strategies to improve system efficiency and reliability. The application domain can be easily mapped to the Measurify framework as in Table 3.
3.3. Appliances scheduling
Cost-reflective grid tariff designs encourage consumers to reduce peak demand by adjusting their electricity usage patterns, helping to balance the grid more efficiently [47]. As a result, power suppliers implement dynamic electricity tariffs, where prices vary based on demand, promoting cost-effective and sustainable energy consumption. Appliance scheduling services aim to get the most economical operational schedule of a set of appliances to achieve a minimum expenditure in electricity, for those appliances that have flexibility in starting time and/or other features, the operation dependence of inter-appliance and intra-appliance is scheduled to further exploit the price variation. The scheduling algorithm changes the power mode of each electric device dynamically. We follow a model predictive control method that uses a building energy management controller (BEMC), as in [48]. The timeline is divided into fixed-size schedulable slots. The BEMC gets the instant electricity price, operational time and the power consumption rating of each appliance for each time slot, and then solves an optimization problem to minimize the energy cost of electrical appliances over all available time-slot. The problem can be formulated as an optimization model with the objective of minimizing the total electricity cost over a given scheduling horizon.
Where: is the electricity price at time t, is a appliance signature representing state of load i at time t, is the power consumption of load i. This formulation helps in cost savings of residential occupants by shifting energy-intensive tasks to periods of lower electricity prices.
The methodology for appliance scheduling is based on a combination of descriptive analytics, time series analysis, cost optimization, and decision support systems (DSS) to recommend the most cost-effective hours for using high-power appliances as shown in Figure 8. Initially, the system aggregates household energy consumption data on an hourly basis and analyzes fluctuations in electricity prices to identify cost variations throughout the day. By multiplying hourly energy consumption by corresponding electricity prices, the system calculates the total cost of running appliances at different times. A rule-based decision-making approach is then employed, where hours with the lowest cost per kWh are recommended for operating energy-intensive appliances. This optimized scheduling helps in minimizing electricity bills and improving overall energy efficiency by shifting appliance usage to off-peak hours with lower rates. The appliance scheduling service seamlessly integrates with the Measurify framework, allowing for efficient mapping and utilization of its features as in Table 3.
3.4. Synopsis
This sub-section synthetizes the characterization of the three services presented above through three synoptical tables. First, Table 2 provides an outlook of the three energy IoT services, where the metamodeling illustrates inputs, outputs, data processing algorithms, stakeholders, benefits and constrains. Then, Table 3 summarizes the main data characteristics and its mapping to Measurify resource types.

Table 2.
Synopsys of the investigated IoT services.
| Range prediction from BMS data | Power flow analysis from LV feeder data | Appliance scheduling from HEMS data | |
|---|---|---|---|
| Goal of service | Predict travel distance from remaining SoC | Analyze feeder power losses | Recommend optimum hours for using high-power appliances. |
| Inputs | Environmental, vehicle and battery data | Load data | Power data |
| Output | SoC, Driving range | Power loss | Optimum schedule |
| Computation algorithm | Data-Driven Method for range prediction | Newton-Raphson method | Descriptive analytics and cost optimization techniques |
| Service stakeholders | Driver, battery supplieer and vehicle manufacturer | Power distributor | Residential customer, Power supplier |
| Benefits | Drivers can easily plan destinations and safe charging zones | Optimize energy distribution | Electricity cost reducing for residents |
| Constraint | Accurate range prediction requires minimum uncertainties in modeling battery limits, vehicle dynamics, environmental factors, and driving behavior. | Association between load dynamics and renewable energy integration | Some appliances must run immediately based on user needs |
Table 3.
Characteristics of IoT services and mapping with Measurify resources.
| Range prediction from BMS data | Power flow analysis from LV feeder data | Appliance scheduling from HEMS data | |
|---|---|---|---|
| Things | Battery cell and driving context | LV test feeder | Electrical appliance in house |
| Devices | Battery measurement emulator (ISL78714) other sensor | Smart meters | Plugwise Kit |
| Measurements | Environmental data, Vehicle data, Battery data | Feeder load of nodes | Power consumption data |
| Features | Temperature, elevation, speed, throttle, voltage, current, SoC, etc. | Load | Active Power |
| Sensitivity /accuracy of measurement | Device accuracy: ±2.5mV | Voltage measurement error smaller than 0,1% | of measurement reading ± 0,5 W |
| Representation of data | Time-series representation in CSV format | Time-series representation in CSV format | Time-series representation in CSV format |
The widespread use of IoT for data measurement, combined with the long-term accumulation and large-scale analysis of such data, requires careful definition of sampling rates (typically ranging from a few Hz to several kHz) to avoid both redundancy and the loss of transient, potentially valuable events. Heterogeneity in the measured sensors data is frequent, and can be due to different data sources, network and spatial distribution across the monitored area. These factors introduce synchronization challenges and variability in data collection intervals especially in dynamic environments or under unreliable network conditions. Such inconsistencies, caused by different sampling rates, node failures, packet loss, or measurement precision, can compromise data quality and hinder effective analysis. To address this, Measurify assigns an individual timestamp to every single sample within a measurement, ensuring accurate temporal alignment across heterogeneous data streams. Moreover, each measurement is linked to its source device, which allows spotting and keeping into account individual effects (e.g., drift).
4. Experimental result and Analysis
This section presents the case studies three services presented in Section 3. Table 4 summarizes the data sources, formats, computational platforms, and previous use of each dataset in similar IoT applications. All computations were carried out using Python within Jupyter Notebooks. Further details for each analysis are provided in the following subsections.
4.1. Range Prediction
This service validates range prediction of EV by using data-driven energy consumption model explained in Section 3.1. The energy consumption over road segments is estimated by linking the energy consumption with microscopic driving parameters environmental data (temperature, elevation); vehicle data (speed, throttle, motor Torque, longitudinal acceleration, regenerative braking signal); and battery data (voltage, current, temperature, SoC). We use TripA01 battery and heating data in real driving cycles from [49]. The trip was conducted on June 25, 2019, in the Munich East area under sunny weather conditions. The journey covered a distance of 7.43 km in 16.82 minutes. The battery temperature increased from 21.0°C to 22.0°C, while the SoC dropped from 86.3% to 80.3%. The ambient temperature at the start was 25.5°C, with a target cabin temperature of 23.0°C. The vehicle’s fan operated in automatic mode at Level 1, ensuring optimal cabin conditions throughout the trip. The vehicle specification, driving cycle information and others factor used for range prediction models are provided in Table A1 of Appendix A.
The SoC of the battery pack versus the driving range and energy depleted of EV looks like a straight line in (Figure 9). The blue line represents the actual traveled distance in proportion to the decrease in SoC. The red line shows actual energy depletion based on mechanical calculations. Due to variations in elevation and the effects of regenerative braking, the battery recharges at certain points, causing deviations from a perfectly straight line. However, the yellow dashed line represents the estimated remaining range, which follows a straight-line approximation for generalization. The graph shows a nearly linear trend, indicating a consistent energy consumption pattern throughout the trip. The estimated range based on SoC depletion closely aligns with the actual traveled distance, while the predicted range and energy depletion closely match real-world data, demonstrating the accuracy of the prediction model. This confirms that range estimation is reliable for trip planning, making it valuable for EV drivers.
4.2. Power Flow Analysis
The power flow analysis utilizes time-series load shapes for the 55 loads served by the test feeder, with a one-minute time resolution over a one-day period, enabling a detailed assessment of load variations and their impact on grid performance. Figure 10 illustrates the power profile of the Modified European LV test system, showing variations in power multiplier values (in kW) across different load profile nodes over a 24-hour period (measured in minutes). The 3D plot highlights fluctuations in power demand across the network. The X-axis represents the load profile across distribution nodes, the Y-axis captures power consumption dynamics over time, and the Z-axis indicates power demand intensity at specific nodes and intervals KW. The residential power consumption remains zero before 300 minutes, indicating minimal load before 5 AM. Identifying peak demand periods helps in implementing demand-side management strategies to enhance grid stability.
Figure 11 shows the variation of total power losses (in MW) over a 24-hour period. The red plot highlights the power loss trend, helping to analyze system efficiency and performance variations over time. A spike in power loss despite no load at feeder nodes before 1 AM could be caused by reactive power flow, transformer/core losses, leakage currents, or system imbalances. Factors like capacitor switching, no-load transformer excitation, or sudden voltage fluctuations may also contribute to these losses. The fluctuations in power losses indicate varying load conditions throughout the day after 6 AM, with noticeable peaks during certain time intervals.
Overall, the power loss plot from the load profile analysis provides insights into the variation of power losses over time, highlighting the impact of fluctuating load demand on the distribution system. Peaks in power losses correspond to high-demand periods, indicating increased stress on the network, while lower losses suggest periods of reduced load. Analyzing these trends helps assess system efficiency, identify potential congestion or inefficiencies, and optimize load management strategies to minimize losses and enhance grid performance.
4.3. Appliance Scheduling
Figure 12 illustrates the daily electricity consumption pattern of nine electrical appliances—fridge, dishwasher, microwave, water kettle, washing machine, radio with amplifier, dryer, kitchenware, and bedside light—over a weekday in Building1, a single-floor apartment in Klagenfurt occupied by a young couple who are mostly away on weekdays and spend evenings and weekends at home. Each appliance is represented by a different color, showing its electrical power usage in watts over time. The data reveals distinct usage signatures, where some appliances operate periodically with sharp peaks (e.g., blue), indicating cyclical or automated use, likely corresponding to devices such as a fridge, while others (e.g., pink, orange, and purple) display sporadic high-power consumption, suggesting short bursts of activity, which is typical of electric kettles, washing machines, dishwashers, and kitchenware. The naming format appears to be a MAC address-like device ID, commonly used in Zigbee-based smart home energy monitoring systems for wireless communication with a central hub. Among high-power-consuming appliances, 000D6F00029C2BD7, 000D6F0003562C48, and 000D6F000353AE51 correspond to the water kettle, dishwasher, and kitchenware (oven), respectively. The pink power pattern, with a short, high-power spike, aligns with a kettle used around 7 AM for breakfast preparation. The orange pattern, characterized by an initial high-power phase, a lower-power cycle, and a final high-power phase, corresponds to a washing machine, suggesting operation during off-peak hours to optimize electricity costs. The purple pattern, marked by an initial surge above 2 kW followed by a steady draw of about 200W, is typical of an oven, likely used for evening meal preparation, aligning with typical household cooking routines.
These distinct appliance signatures provide insights into daily household energy usage, helping to identify energy-intensive devices and opportunities for optimizing electricity consumption, such as shifting appliance use to off-peak hours or integrating smart energy management systems.
Furthermore, to recommend the optimum hours, we use rule-based descriptive analytics as presented in Section 3.3. The prerequisite criteria for appliance scheduling is the day-ahead price and follows a dynamic structure set daily by the energy market, and this study uses the same price data as in [11]. Based on the power ratings of household appliances, their operating durations, and the electricity tariff structure, the analysis suggests that the five optimum recommended hours for electricity usage are 2 AM, 3 AM, 4 AM, 1 AM, and 5 AM, in descending order. These hours likely correspond to off-peak periods, where electricity demand is lower, leading to reduced tariffs, making them optimal for operating high-power appliances such as washing machines, ovens, or water heaters to minimize overall energy costs.
4.4. Measurify Data Uploading
The experimental evaluation of the three energy IoT services aims at assessing reliability and applicability of the Measurify framework in managing heterogeneous sensor data across various domains. To ensure consistency in latency measurements and eliminate variability caused by network transmission, all tests were performed by deploying a local instance of Measurify directly on the host machine. This set-up avoids the influence of external communication delays, that depend on specific network configurations and hardware, and cannot be generalized a priori. All experiments were carried out on a mid-range laptop equipped with an 11th Gen Intel(R) Core(TM) i7-11800H @ 2.30GHz CPU, 16 GB of RAM, and an NVIDIA RTX 3050 Ti Laptop GPU. This hardware configuration represents a balanced and accessible development environment, suitable for evaluating lightweight IoT middleware like Measurify. In addition to performance metrics, Table 5 summarises the structural characteristics of the datasets used in the three domains, reporting the number of files, columns, total rows, and total file size. This comparison highlights the variety of the datasets and the scalability of the framework.
Using Jupyter Notebooks, we performed automated data uploading of the datasets (batch upload), and measured the average latency per file. Additionally, Docker Desktop tool was used to measure CPU and RAM utilization for each domain. Table 6 reports the average latency and resource usage observed during the experiments.
Results, presented in Table 6, highlight some correlations in the observed performance metrics. First, the observed latency per row depends on the number of columns in each CSV file. For example, the vehicular batteries dataset, despite its relatively modest size in rows, reached the highest latency due to its 38-column structure. In contrast, the LV test feeder dataset, with only 2 columns per file, had the lowest latency. However, in all tested domains, the measured latencies remain within the range of 90–190 microseconds per row, aligning well with the requirements of real-time processing scenarios.
RAM usage was mostly affected by the total number of rows, particularly in the HEMS dataset, which required more than 3 GB of memory. This is a natural consequence of bulk uploading and processing large time-series data. Anyways, this remains acceptable compared to the capacity of a 16 GB of RAM computer. CPU usage remains low and relatively constant in all applications, never exceeding 7% on average, confirming the lightweight nature of the Measurify architecture.
Beside testing real-time reception of the data, we also performed streaming tests by sending single measurements at controlled frequencies of 1 Hz, 10 Hz, 1,000 Hz and 10,000 Hz. Given Measurify’s fast response time (in the order of a few hundred microseconds), no performance degradation nor data loss was observed, even at the highest frequency. We omit results in terms of latency, CPU and RAM usage since they are similar to those in Table 6 for batch upload. These results further confirm the suitability of the framework for real-time monitoring, where handling of high frequency and low-latency data is essential.
Overall, the experimental results validate the suitability of a measurement-oriented approach for practical energy-related IoT applications. Measurify’s structured data modeling, RESTful architecture, and automatic schema validation allow for fast prototyping, efficient error handling, and seamless integration with real-world datasets. Its ability to operate within low latency and low resource constraints, demonstrated in these experiments under realistic workloads, confirms its potential for use in production-grade, real-time IoT systems.
4.5. Discussion
The experimental results demonstrate that Measurify is a robust and flexible platform for integrating and managing various types of IoT measurement data in energy-related applications. While the previous sub-section focused on low-level performance metrics, this discussion highlights the broader implications of adopting a measurement-oriented framework and compares Measurify with other state-of-the-art solutions.
Compared to general-purpose IoT architectures, such as OpenIoT, Web of Things, and commercial platforms like AWS IoT and Azure IoT, Measurify offers a lightweight, fully open-source solution that excels in flexibility and semantic clarity. As shown in Table 7, Measurify supports fine-grained modeling of field entities as RESTful web resources, which simplifies integration and encourages modular development. This design enables developers to focus on the application logic, while the framework handles data structure validation, access control, and real-time API exposure.
Unlike other platforms that prioritize high-level service interoperability or rely on tightly coupled vendor ecosystems, Measurify provides developers with full control over the data model and resource hierarchy. Its measurement-oriented paradigm, where domain objects, features, and measurements are explicitly defined, proves particularly well-suited to domains characterized by heterogeneous, high-frequency, and time-sensitive data streams, such as battery monitoring, power grid diagnostics, and smart home automation.
One notable advantage is the reduced development overhead. Thanks to its modular API design and automatic data validation mechanisms, Measurify supports rapid prototyping and minimizes the debugging effort. Our experience showed that developers can deploy structured applications within hours, rather than days, and seamlessly scale across multiple devices and sensors. Additionally, recent work described and tested the CSV-based workflow for data integration with MongoDB through Measurify, which improves flexibility and error handling compared to native mongoimport tools [29].
From a scalability perspective, Measurify successfully managed large datasets (including over 18 million rows) and high-frequency data streams (up to 10,000 Hz) without performance degradation. This confirms its potential as a foundational layer for real-time, data-intensive IoT services in the energy domain and beyond.
Nevertheless, the current study has some limitations. The experiments were conducted using a local instance of Measurify, and further validation in distributed or cloud-hosted deployments would provide more general insights into network-related scalability and multi-user performance. Additionally, while Measurify enables effective data modeling and uploading, advanced features such as automated analytics pipelines, anomaly detection modules, or predictive capabilities remain external to the framework and must be developed on top of its APIs.
In summary, efficient development of data-driven energy applications requires a tools, like Measurify, able to support accurate time-stamped measurements, flexible modeling, scalable real-time data handling, and easy, open deployment.
5. Conclusions and Future Work
As IoT energy data offers a huge potential for new services, suitable application programming interfaces (APIs) for visualization, querying and exploration, are needed for building powerful energy management applications. Open source IoT platforms promise to foster a broad range of IoT application services, on top of a hardware basis of various sensing and actuation devices. In this context, we have assessed the support to effective and efficient development by a state of the art measurement-oriented modeling and execution framework, such as Measurify. Modelling involves mapping the domain-specific field objects to the Measurify API’s resources. To validate the framework, we have chosen three energy domains, such as vehicular batteries, LV feeder and HEMS. Thus, we have modeled the three data sources and their measurement contexts onto the five essential resources (Thing, Feature, Service, Device, and Measurement) of Measurify, assessing its validity in supporting efficient development. Our experience showed that Measurify can seamlessly support a variety of IoT services, providing benefits in terms of effectiveness and efficiency, as its resources support a structured and modular approach to application modeling and development. As for future work is concerned, we argue that key improvements for an efficient measurement-oriented framework include effective data inputation and seamless integration of edge artificial intelligence, particularly unsupervised machine learning, leveraging the power of data, minimizing the labelling costs.
Author Contributions
Conceptualization, H.D., F.B. and R.B.; methodology, H.D., F.B., M.F., P.D. and R.B; software, H.D., P.D. and M.F.; validation, H.D., and M.F.; formal analysis, H.D., F.B., M.F. and R.B; investigation, H.D., F.B.; resources, H.D. and M.F.; data curation, H.D., writing—original draft preparation, H.D., F.B., M.F., P.D. and R.B; writing—review and editing, H.D., F.B., M.F., P.D. and R.B; visualization, H.D., M.F. and P.D.; supervision, F.B. and R.B.; project administration, F.B. and R.B.
Funding
This research received no external funding.
Institutional Review Board Statement
Not applicable.
Informed Consent Statement
Not applicable.
Data Availability Statement
This research uses a publicly available dataset, accessible here: https://catalog.data.gov/dataset/li-ion-battery-aging-datasets (accessed on 24 Jan 2025). https://ieee-dataport.org/open-access/battery-and-heating-data-real-driving-cycles (accessed on 24 Jan 2025). https://ieee-dataport.org/open-access/paper-reduced-electrically-equivalent-model-ieee-european-low-voltage-test-feeder (accessed on 24 Jan 2025). https://www.andreatonello.com/greend-energy-metering-data-set/ (accessed on 24 Jan 2025).
Acknowledgments
The authors thank Maneesh Singh, Knut Øvsthus, and Anne-Lena Kampen for their valuable discussions.
Conflicts of Interest
The authors declare no conflict of interest.
Appendix A
The range prediction model for electric vehicles (EVs) estimates the driving distance based on energy consumption, vehicle dynamics, environmental conditions, and efficiency factors. This appendix outlines key specifications and constant values used in the prediction calculations.
Table A1.
Vehicle Parameters and Efficiency Factors
| Parameter | Symbol | Value | Unit | Description |
|---|---|---|---|---|
| Gravity | g | 9.81 | m/s² | Acceleration due to gravity |
| Rolling Resistance Coefficient | f | 0.01 | – | Resistance between tires and road |
| Aerodynamic Drag Coefficient | 0.3 | – | Drag coefficient of the vehicle | |
| Frontal Area | A | 2.2 | m² | Vehicle’s frontal cross-sectional area |
| Air Density | 1.225 | kg/m³ | Density of air at sea level | |
| Vehicle Mass | m | 1500 | kg | Total mass of the EV |
| Rotational Equivalent Mass | kg | Effective mass considering rotating components | ||
| Headwind Velocity | 0 | m/s | Assumed zero for prediction | |
| Drivetrain Efficiency | 0.9 | – | Efficiency of power transfer from battery to wheels | |
| Regenerative Braking Efficiency | 0.7 | – | Efficiency of energy recovery during braking |
References
- Singh, M.; Øvsthus, K.; Kampen, A.L.; Dhungana, H. Development of a human cognition inspired condition management system for equipment. International Journal of System Assurance Engineering and Management 2024 2024, 1, 1–10. [CrossRef]
- Dhungana, H. Rule-Based Decision Making in Biologically Inspired Condition Management System. International Conference on Agents and Artificial Intelligence 2024, 2, 1245–1254. [CrossRef]
- Dhungana, H. Case based Decision Making in Biologically Inspired Condition Management System. 7th International Conference on Inventive Computation Technologies, ICICT 2024 2024, pp. 335–339. [CrossRef]
- Dhungana, H.; Mukhiya, S.K.; Dhungana, P.; Karic, B. Deep learning-based fault identification in condition monitoring. arXiv preprint arXiv:2410.05889. 2024.
- Dhungana, H.; Rykkje, T.; Lundervold, A.S. Bearing Prognostics Using the PRONOSTIA Data: A Comparative Study. IEEE Access 2025.
- Ul Mehmood, M.; Ulasyar, A.; Khattak, A.; Imran, K.; Zad, H.S.; Nisar, S. Cloud Based IoT Solution for Fault Detection and Localization in Power Distribution Systems. Energies 2020, Vol. 13, Page 2686 2020, 13, 2686. [CrossRef]
- Almahmoud, Z.; Crandall, J.; Elbassioni, K.; Nguyen, T.T.; Roozbehani, M. Dynamic Pricing in Smart Grids under Thresholding Policies. IEEE Transactions on Smart Grid 2019, 10, 3415–3429. [CrossRef]
- Zoha, A.; Gluhak, A.; Imran, M.A.; Rajasegarar, S. Non-Intrusive Load Monitoring Approaches for Disaggregated Energy Sensing: A Survey. Sensors 2012, Vol. 12, Pages 16838-16866 2012, 12, 16838–16866. [CrossRef]
- Chen, X.; Wei, T.; Hu, S. Uncertainty-aware household appliance scheduling considering dynamic electricity pricing in smart home. IEEE Transactions on Smart Grid 2013, 4, 932–941. [CrossRef]
- Stute, J.; Klobasa, M. How do dynamic electricity tariffs and different grid charge designs interact? - Implications for residential consumers and grid reinforcement requirements. Energy Policy 2024, 189, 114062. [CrossRef]
- Tezde, E.I.; Okumus, H.I.; Savran, I. Two-Stage Energy Management of Multi-Smart Homes With Distributed Generation and Storage. Electronics 2019, Vol. 8, Page 512 2019, 8, 512. [CrossRef]
- Razghandi, M.; Zhou, H.; Erol-Kantarci, M.; Turgut, D. Short-Term Load Forecasting for Smart Home Appliances with Sequence to Sequence Learning. IEEE International Conference on Communications 2021. [CrossRef]
- Zanella, A.; Bui, N.; Castellani, A.; Vangelista, L.; Zorzi, M. Internet of things for smart cities. IEEE Internet of Things Journal 2014, 1, 22–32. [CrossRef]
- Shrouf, F.; Miragliotta, G. Energy management based on Internet of Things: practices and framework for adoption in production management. Journal of Cleaner Production 2015, 100, 235–246. [CrossRef]
- Dhungana, H. A machine learning approach for wind turbine power forecasting for maintenance planning. Energy Informatics 2024 8:1 2025, 8, 1–25. [CrossRef]
- Miranda, M.H.; Silva, F.L.; Lourenço, M.A.; Eckert, J.J.; Silva, L.C. Particle swarm optimization of Elman neural network applied to battery state of charge and state of health estimation. Energy 2023, 285, 129503. [CrossRef]
- Wei, H.; He, C.; Li, J.; Zhao, L. Online estimation of driving range for battery electric vehicles based on SOC-segmented actual driving cycle. Journal of Energy Storage 2022, 49, 104091. [CrossRef]
- Adhikaree, A.; Kim, T.; Vagdoda, J.; Ochoa, A.; Hernandez, P.J.; Lee, Y. Cloud-based battery condition monitoring platform for large-scale lithium-ion battery energy storage systems using internet-of-things (IoT). 2017 IEEE Energy Conversion Congress and Exposition, ECCE 2017 2017, 2017-January, 1004–1009. [CrossRef]
- Kobeissi, A.; Bellotti, F.; Berta, R.; De Gloria, A. Towards an IoT-enabled dynamic wireless charging metering service for electrical vehicles. 2019 AEIT International Conference of Electrical and Electronic Technologies for Automotive, AEIT AUTOMOTIVE 2019 2019. [CrossRef]
- Cirimele, V.; La Ganga, A.; Colussi, J.; Gloria, A.D.; Diana, M.; Bellotti, F.; Berta, R.; Sayed, N.E.; Kobeissi, A.; Guglielmi, P.; et al. The Fabric ICT Platform for Managing Wireless Dynamic Charging Road Lanes. IEEE Transactions on Vehicular Technology 2020, 69, 2501–2512. [CrossRef]
- Berta, R.; Kobeissi, A.; Bellotti, F.; De Gloria, A. Atmosphere, an Open Source Measurement-Oriented Data Framework for IoT. IEEE Transactions on Industrial Informatics 2021, 17, 1927–1936. [CrossRef]
- Bellotti, F.; Osman, N.; Arnold, E.H.; Mozaffari, S.; Innamaa, S.; Louw, T.; Torrao, G.; Weber, H.; Hiller, J.; De Gloria, A.; et al. Managing Big Data for Addressing Research Questions in a Collaborative Project on Automated Driving Impact Assessment. Sensors 2020, 20. [CrossRef]
- Capello, A.; Fresta, M.; Bellotti, F.; Haghighi, H.; Hiller, J.; Mozaffari, S.; Berta, R. Exploiting Big Data for Experiment Reporting: The Hi-Drive Collaborative Research Project Case. Sensors 2023, 23. [CrossRef]
- Fresta, M.; Dabbous, A.; Bellotti, F.; Capello, A.; Lazzaroni, L.; Pighetti, A.; Berta, R. Low-Cost, Edge-Cloud, End-to-End System Architecture for Human Activity Data Collection. In Proceedings of the Applications in Electronics Pervading Industry, Environment and Society; Bellotti, F.; Grammatikakis, M.D.; Mansour, A.; Ruo Roch, M.; Seepold, R.; Solanas, A.; Berta, R., Eds., Cham, 2024; pp. 444–449. [CrossRef]
- Fresta, M.; Bellotti, F.; Capello, A.; Dabbous, A.; Lazzaroni, L.; Ansovini, F.; Berta, R. End-to-End Dataset Collection System for Sport Activities. Electronics 2024, 13. [CrossRef]
- Monteriù, A.; Prist, M.R.; Frontoni, E.; Longhi, S.; Pietroni, F.; Casaccia, S.; Scalise, L.; Cenci, A.; Romeo, L.; Berta, R.; et al. A Smart Sensing Architecture for Domestic Monitoring: Methodological Approach and Experimental Validation. Sensors 2018, Vol. 18, Page 2310 2018, 18, 2310. [CrossRef]
- Ehsan, A.; Abuhaliqa, M.A.M.E.; Catal, C.; Mishra, D. RESTful API Testing Methodologies: Rationale, Challenges, and Solution Directions. Applied Sciences 2022, 12. [CrossRef]
- Fresta, M.; Bellotti, F.; Capello, A.; Cossu, M.; Lazzaroni, L.; De Gloria, A.; Berta, R. Efficient Uploading of.Csv Datasets into a Non-Relational Database Management System. In Proceedings of the Applications in Electronics Pervading Industry, Environment and Society; Berta, R.; De Gloria, A., Eds., Cham, 2023; pp. 9–15. [CrossRef]
- Fresta, M.; Capello, A.; Bellotti, F.; Lazzaroni, L.; Cossu, M.; Berta, R. Supporting a .csv-based Workflow in MongoDB for Data Analysts. IEEE International Symposium on Industrial Electronics 2023, 2023-June. [CrossRef]
- Lu, L.; Han, X.; Li, J.; Hua, J.; Ouyang, M. A review on the key issues for lithium-ion battery management in electric vehicles. Journal of Power Sources 2013, 226, 272–288. [CrossRef]
- Xiong, R.; Cao, J.; Yu, Q.; He, H.; Sun, F. Critical Review on the Battery State of Charge Estimation Methods for Electric Vehicles. IEEE Access 2017, 6, 1832–1843. [CrossRef]
- Lyne, N. Optimizing Precision Cell Measurement Accuracy in Automotive Battery Management Systems, 2020.
- Gallinaro, S. Higher Reliability, Safety, and 30% Longer Lifetime with Advanced Battery Management in Healthcare Energy Storage Systems, 2019.
- Schneider, K.P.; Mather, B.A.; Pal, B.C.; Ten, C.W.; Shirek, G.J.; Zhu, H.; Fuller, J.C.; Pereira, J.L.; Ochoa, L.F.; De Araujo, L.R.; et al. Analytic Considerations and Design Basis for the IEEE Distribution Test Feeders. IEEE Transactions on Power Systems 2018, 33, 3181–3188. [CrossRef]
- Wagle, R.; Sharma, P.; Sharma, C.; Amin, M. Optimal power flow based coordinated reactive and active power control to mitigate voltage violations in smart inverter enriched distribution network. International Journal of Green Energy 2024, 21, 359–375. [CrossRef]
- Ni, F.; Nguyen, P.H.; Cobben, J.F.; Van den Brom, H.E.; Zhao, D. Three-phase state estimation in the medium-voltage network with aggregated smart meter data. International Journal of Electrical Power & Energy Systems 2018, 98, 463–473. [CrossRef]
- Himeur, Y.; Alsalemi, A.; Bensaali, F.; Amira, A. Smart non-intrusive appliance identification using a novel local power histogramming descriptor with an improved k-nearest neighbors classifier. Sustainable Cities and Society 2021, 67, 102764. [CrossRef]
- Ruano, A.; Hernandez, A.; Ureña, J.; Ruano, M.; Garcia, J. NILM Techniques for Intelligent Home Energy Management and Ambient Assisted Living: A Review. Energies 2019, Vol. 12, Page 2203 2019, 12, 2203. [CrossRef]
- Hart, G.W. Nonintrusive Appliance Load Monitoring. Proceedings of the IEEE 1992, 80, 1870–1891. [CrossRef]
- De Cauwer, C.; Verbeke, W.; Coosemans, T.; Faid, S.; Van Mierlo, J. A Data-Driven Method for Energy Consumption Prediction and Energy-Efficient Routing of Electric Vehicles in Real-World Conditions. Energies 2017, Vol. 10, Page 608 2017, 10, 608. [CrossRef]
- Varga, B.O.; Sagoian, A.; Mariasiu, F. Prediction of Electric Vehicle Range: A Comprehensive Review of Current Issues and Challenges. Energies 2019, Vol. 12, Page 946 2019, 12, 946. [CrossRef]
- Hannan, M.A.; Lipu, M.S.; Hussain, A.; Mohamed, A. A review of lithium-ion battery state of charge estimation and management system in electric vehicle applications: Challenges and recommendations. Renewable and Sustainable Energy Reviews 2017, 78, 834–854. [CrossRef]
- Saha, B.; Goebel, K. Battery Data Set, 2007.
- Tannahill, V.R.; Muttaqi, K.M.; Sutanto, D. Driver alerting system using range estimation of electric vehicles in real time under dynamically varying environmental conditions. IET Electrical Systems in Transportation 2016, 6, 107–116. [CrossRef]
- De Cauwer, C.; Verbeke, W.; Van Mierlo, J.; Coosemans, T. A Model for Range Estimation and Energy-Efficient Routing of Electric Vehicles in Real-World Conditions. IEEE Transactions on Intelligent Transportation Systems 2020, 21, 2787–2800. [CrossRef]
- Wang, X.F.; Song, Y.; Irving, M. Load Flow Analysis. Modern Power Systems Analysis 2008, pp. 71–128. [CrossRef]
- Hofmann, M.; Bjarghov, S.; Sæle, H.; Lindberg, K.B. Grid tariff design and peak demand shaving: A comparative tariff analysis with simulated demand response. Energy Policy 2025, 198, 114475. [CrossRef]
- Chen, C.; Wang, J.; Heo, Y.; Kishore, S. MPC-based appliance scheduling for residential building energy management controller. IEEE Transactions on Smart Grid 2013, 4, 1401–1410. [CrossRef]
- Steinstraeter, M.; Buberger, J.; Trifonov, D. Battery and Heating Data in Real Driving Cycle, 2020. [CrossRef]
- Khan, M.A.; Hayes, B.P. For paper "A Reduced Electrically-Equivalent Model of the IEEE European Low Voltage Test Feeder", 2020. [CrossRef]
- Monacchi, A.; Egarter, D.; Elmenreich, W.; D’Alessandro, S.; Tonello, A.M. GREEND: An energy consumption dataset of households in Italy and Austria. 2014 IEEE International Conference on Smart Grid Communications, SmartGridComm 2014 2015, pp. 511–516. [CrossRef]
- Steinstraeter, M.; Buberger, J.; Minnerup, K.; Trifonov, D.; Horner, P.; Weiss, B.; Lienkamp, M. Controlling cabin heating to improve range and battery lifetime of electric vehicles. eTransportation 2022, 13, 100181. [CrossRef]
- OpenIoT.
- Home - Web of Things (WoT).
- Introduction - BIG IoT.
- IoT Edge, Open Source Edge - AWS IoT Greengrass - AWS.
- Azure IoT – Internet of Things Platform | Microsoft Azure.
Figure 1.
General function of a battery management system.
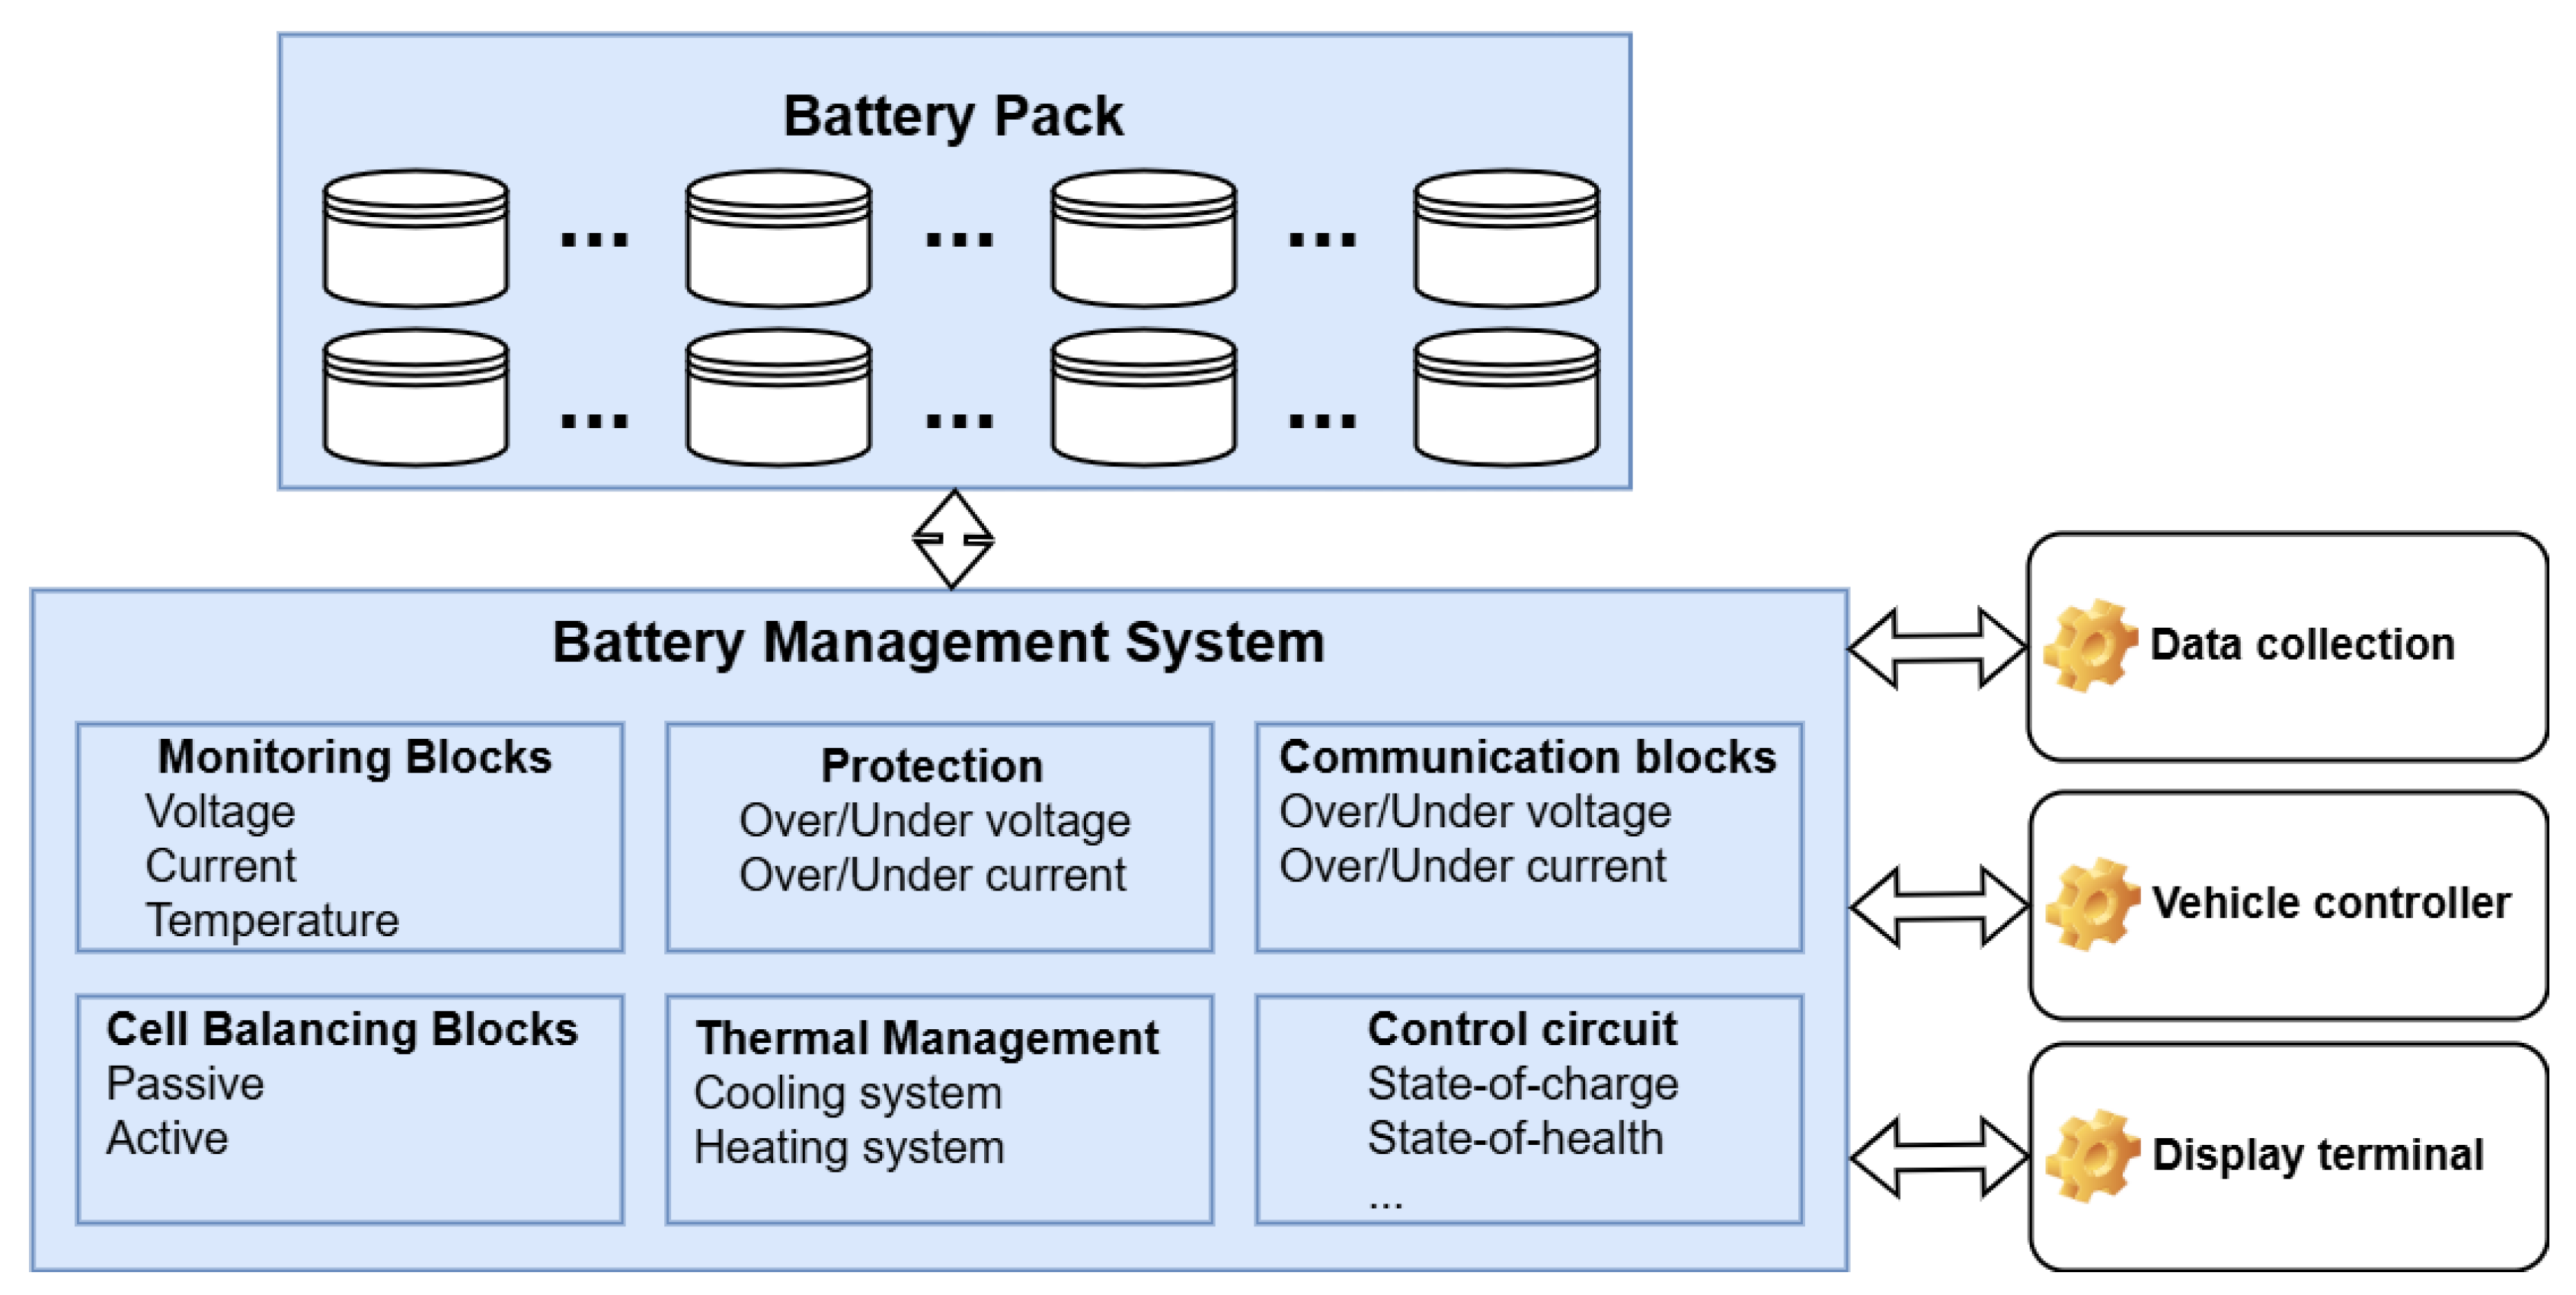
Figure 2.
The low-voltage grid supplies electricity to various consumer types, including apartments, residential houses, government buildings, small businesses, and small industries.
Figure 2.
The low-voltage grid supplies electricity to various consumer types, including apartments, residential houses, government buildings, small businesses, and small industries.
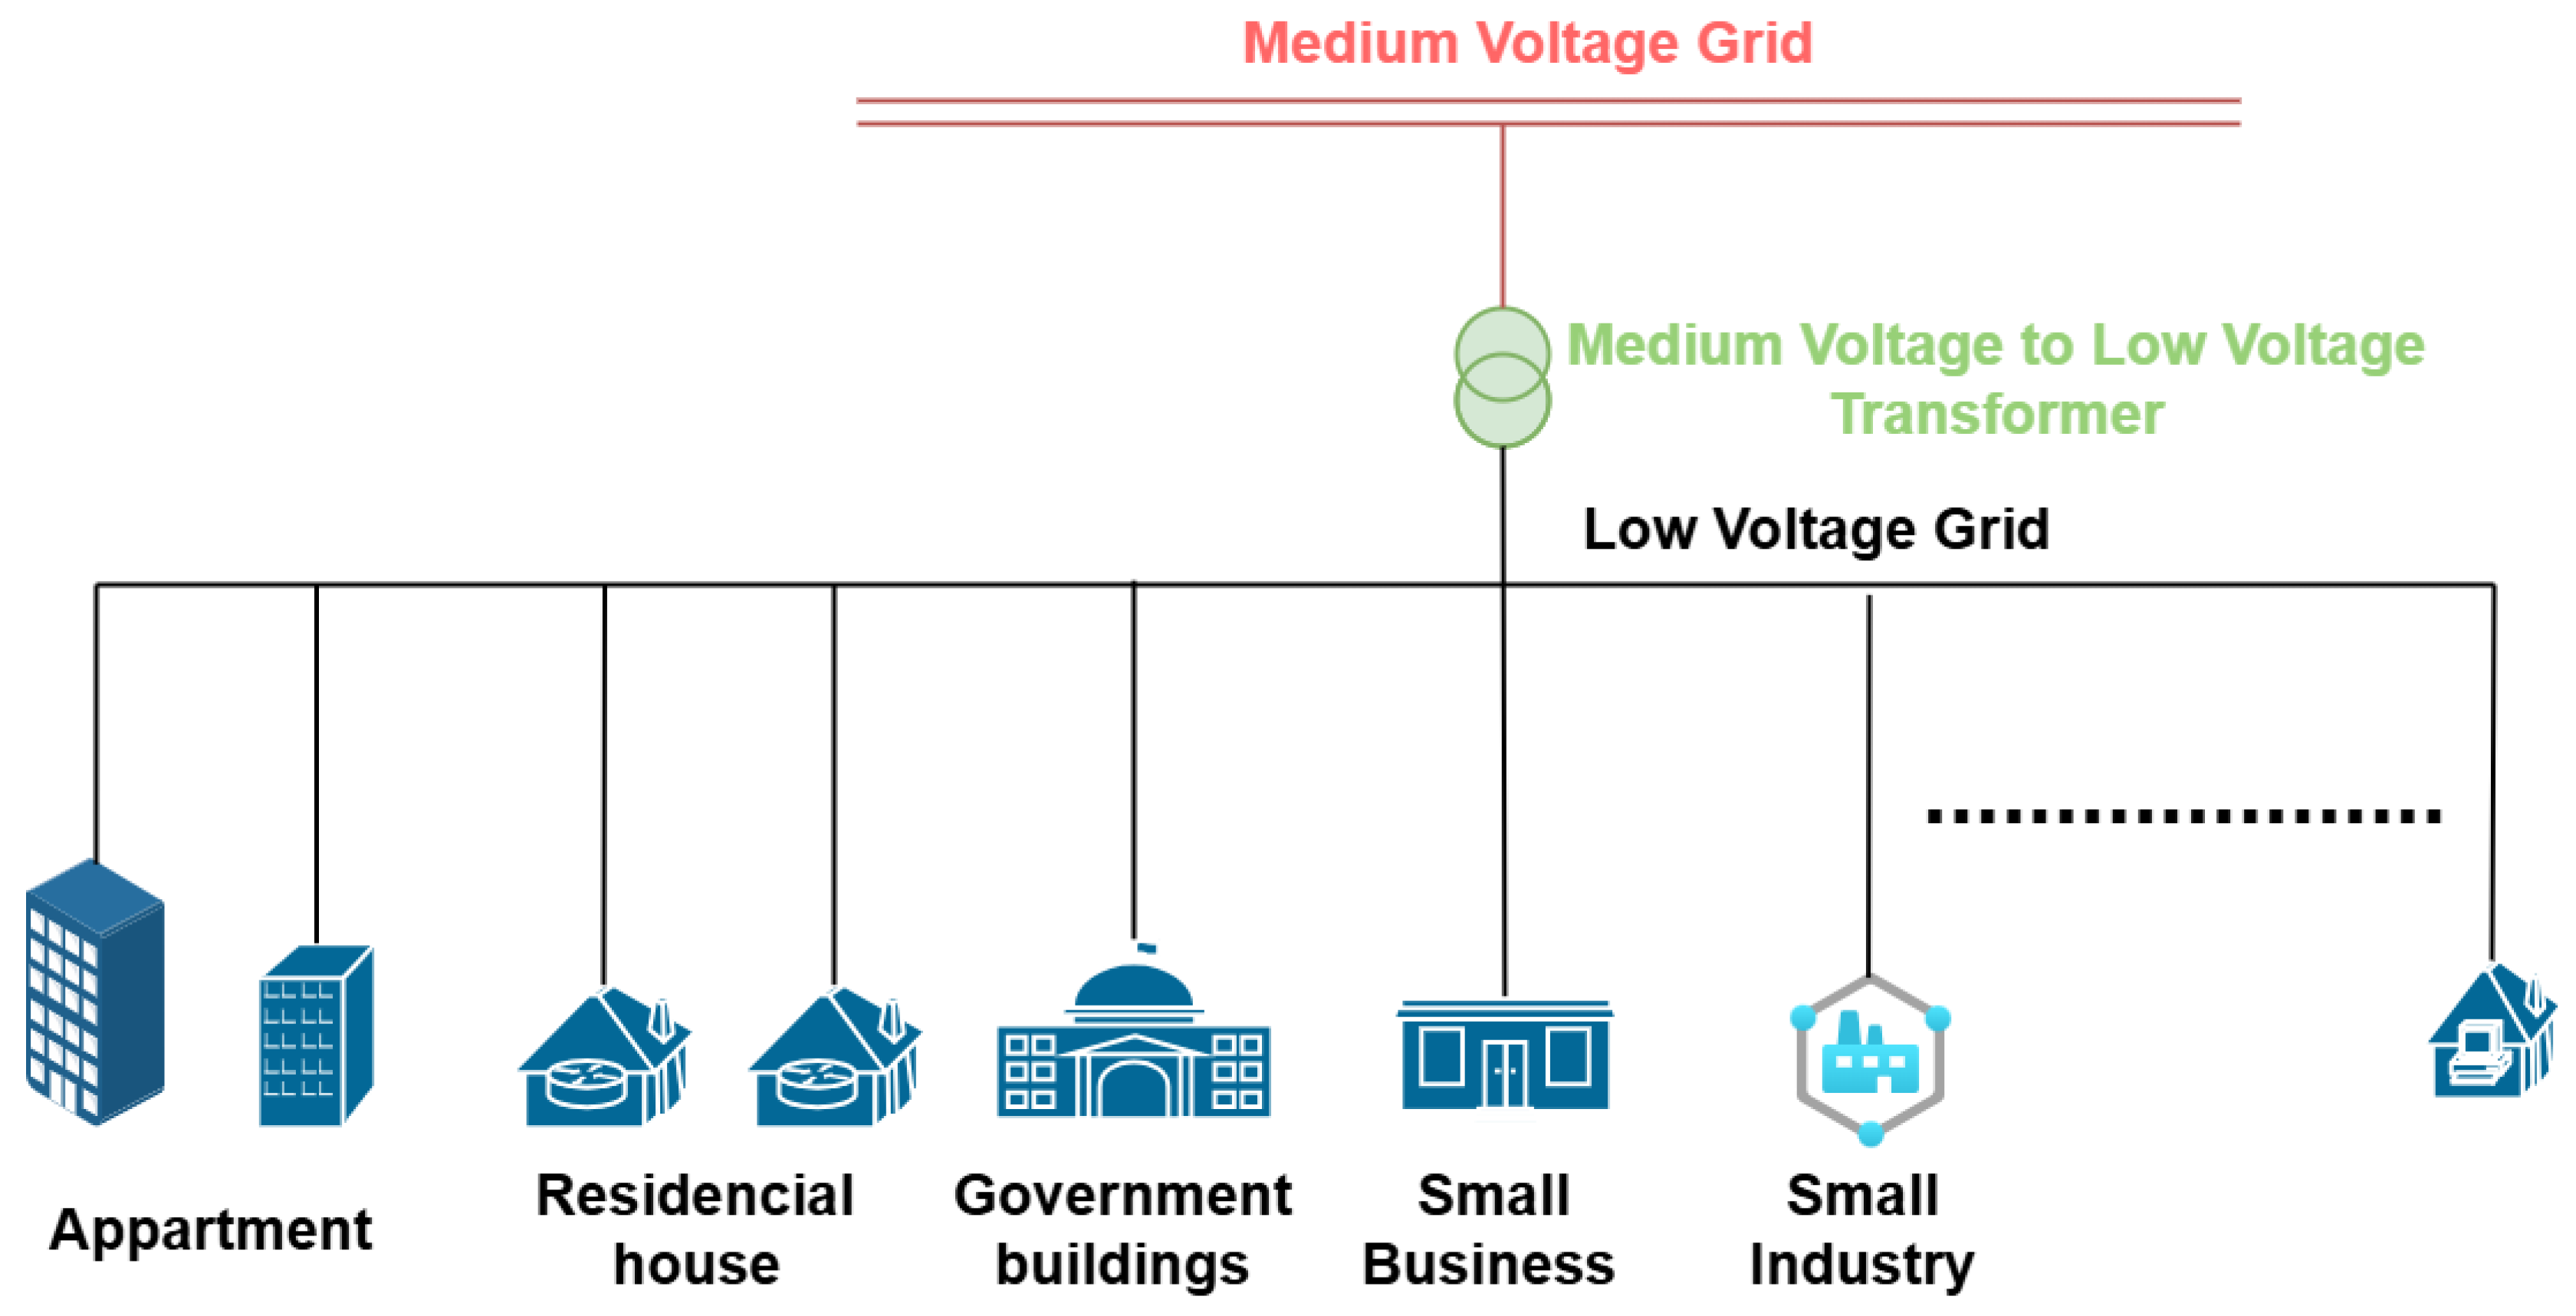
Figure 3.
Overview of a Home Energy Management System (HEMS) architecture for appliance-level monitoring and analytics
Figure 3.
Overview of a Home Energy Management System (HEMS) architecture for appliance-level monitoring and analytics
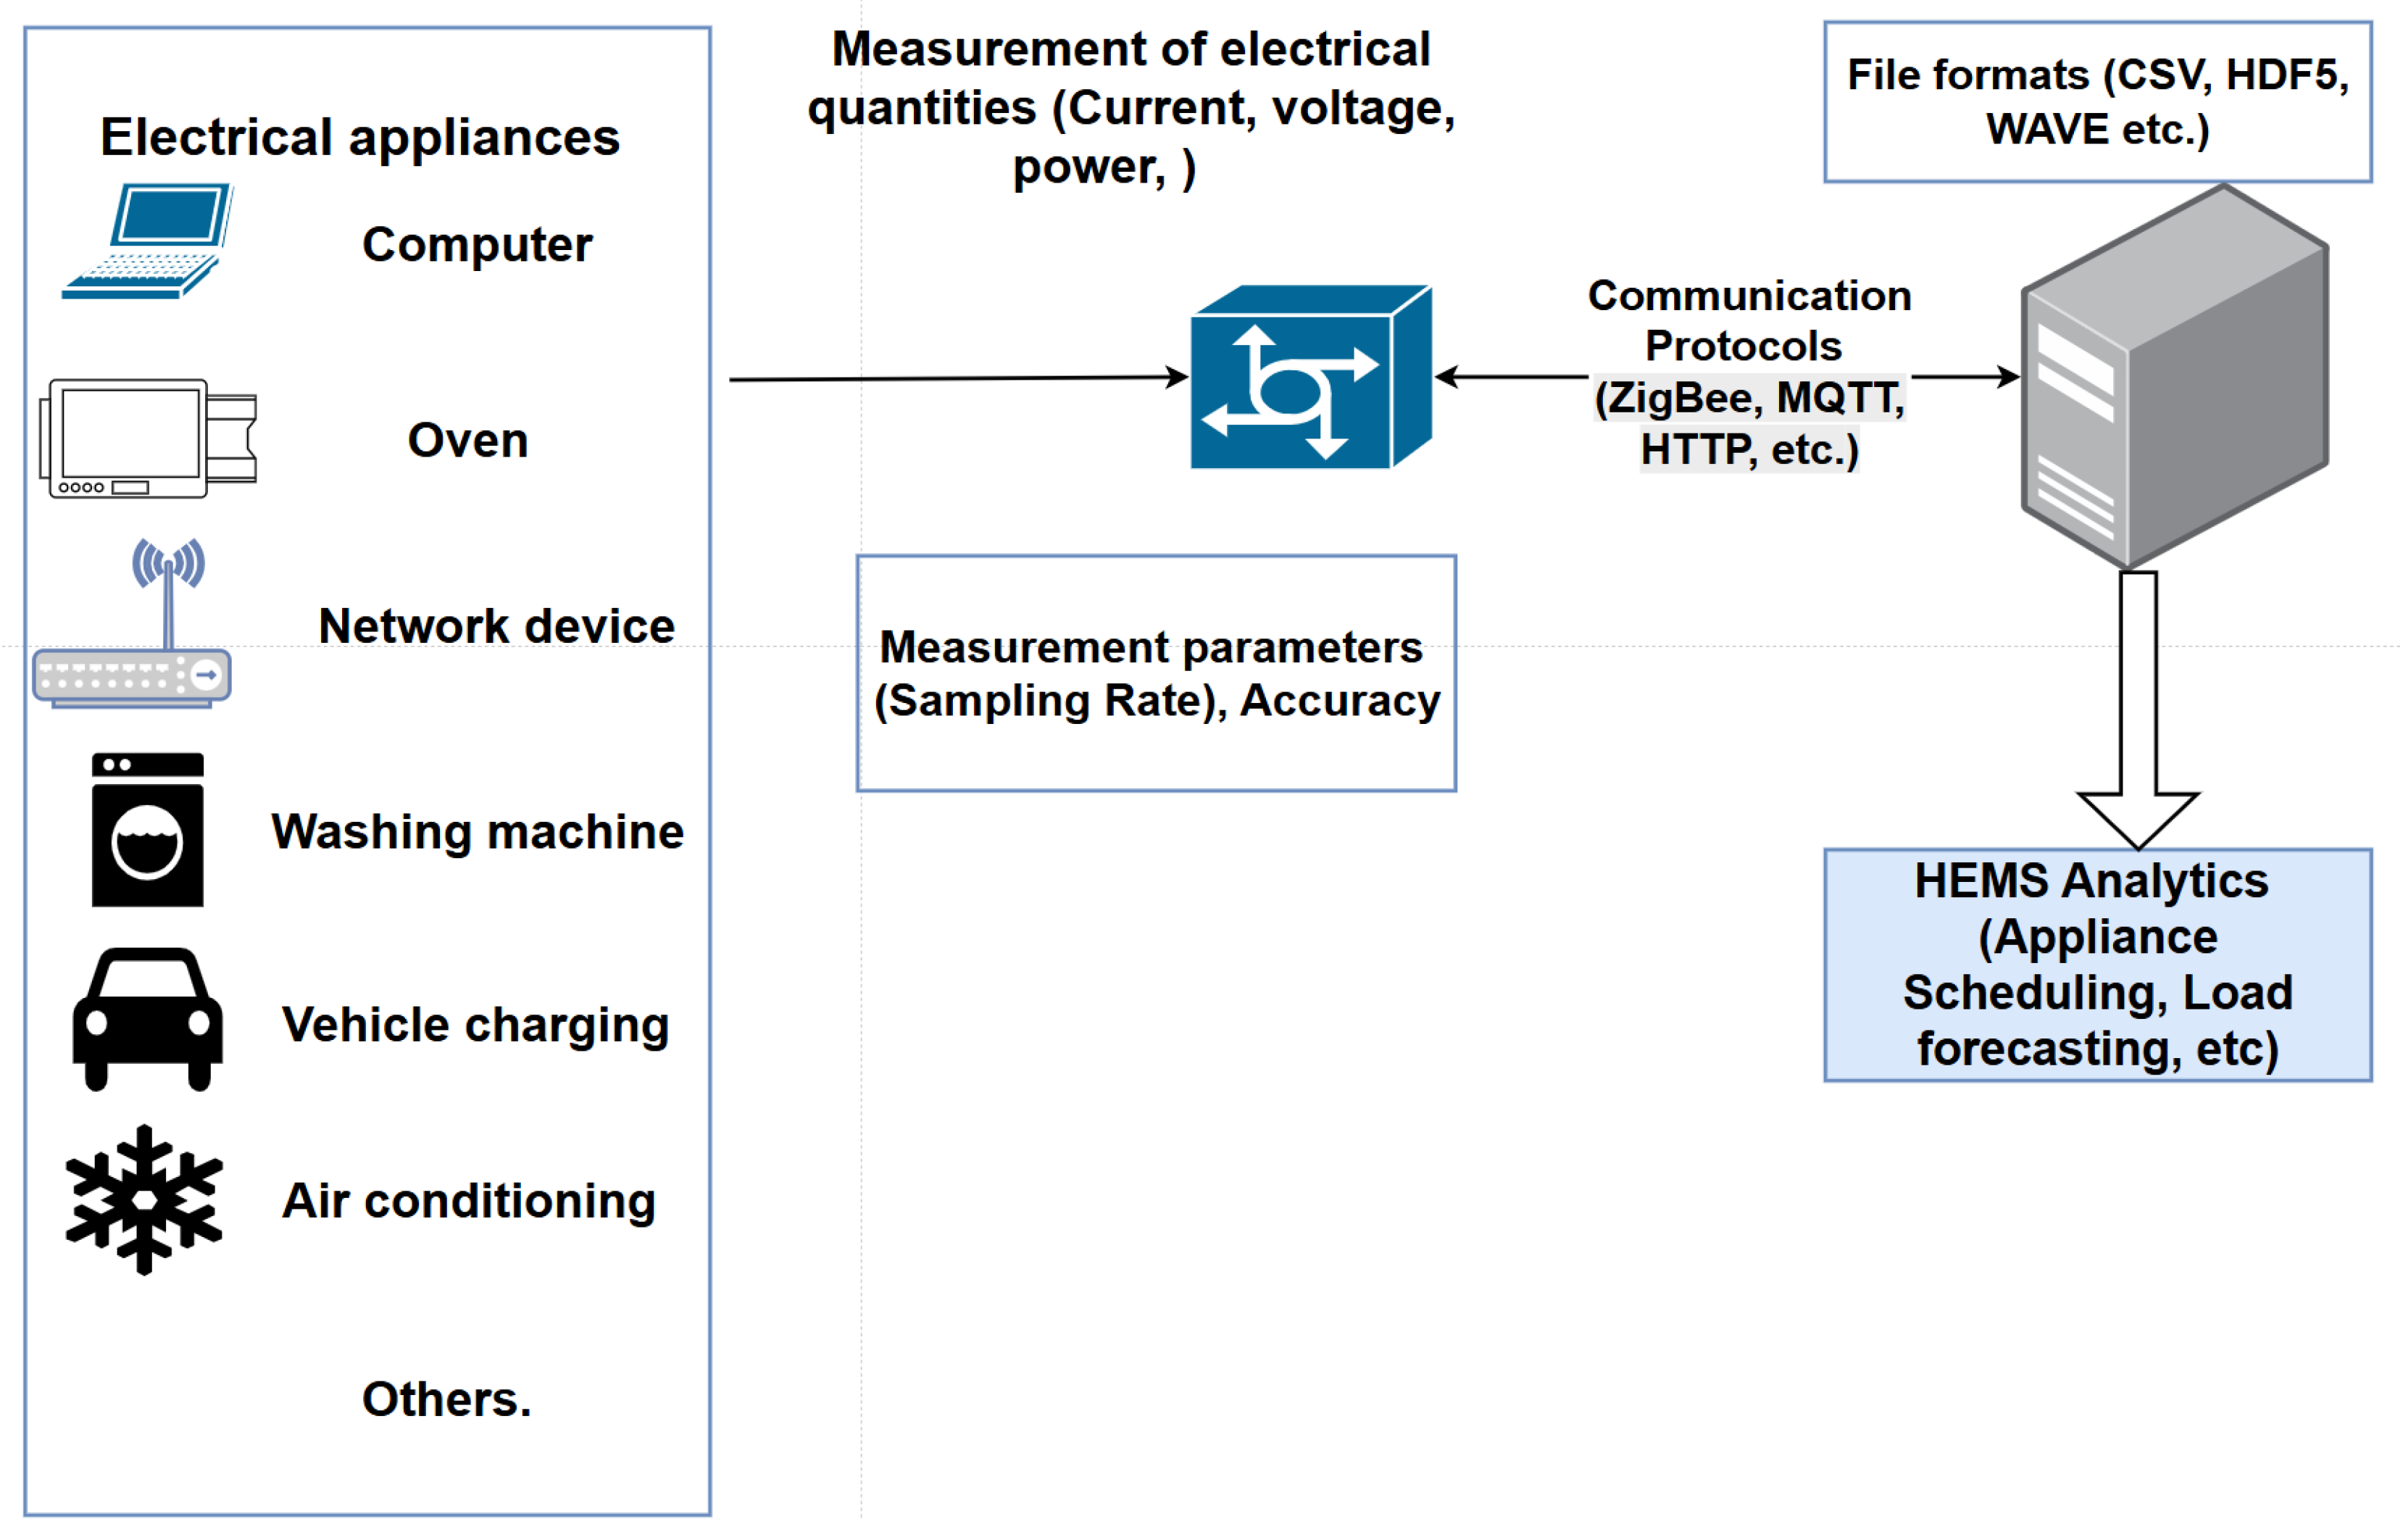
Figure 4.
The main influence factors on EV’s range (constants and variables).
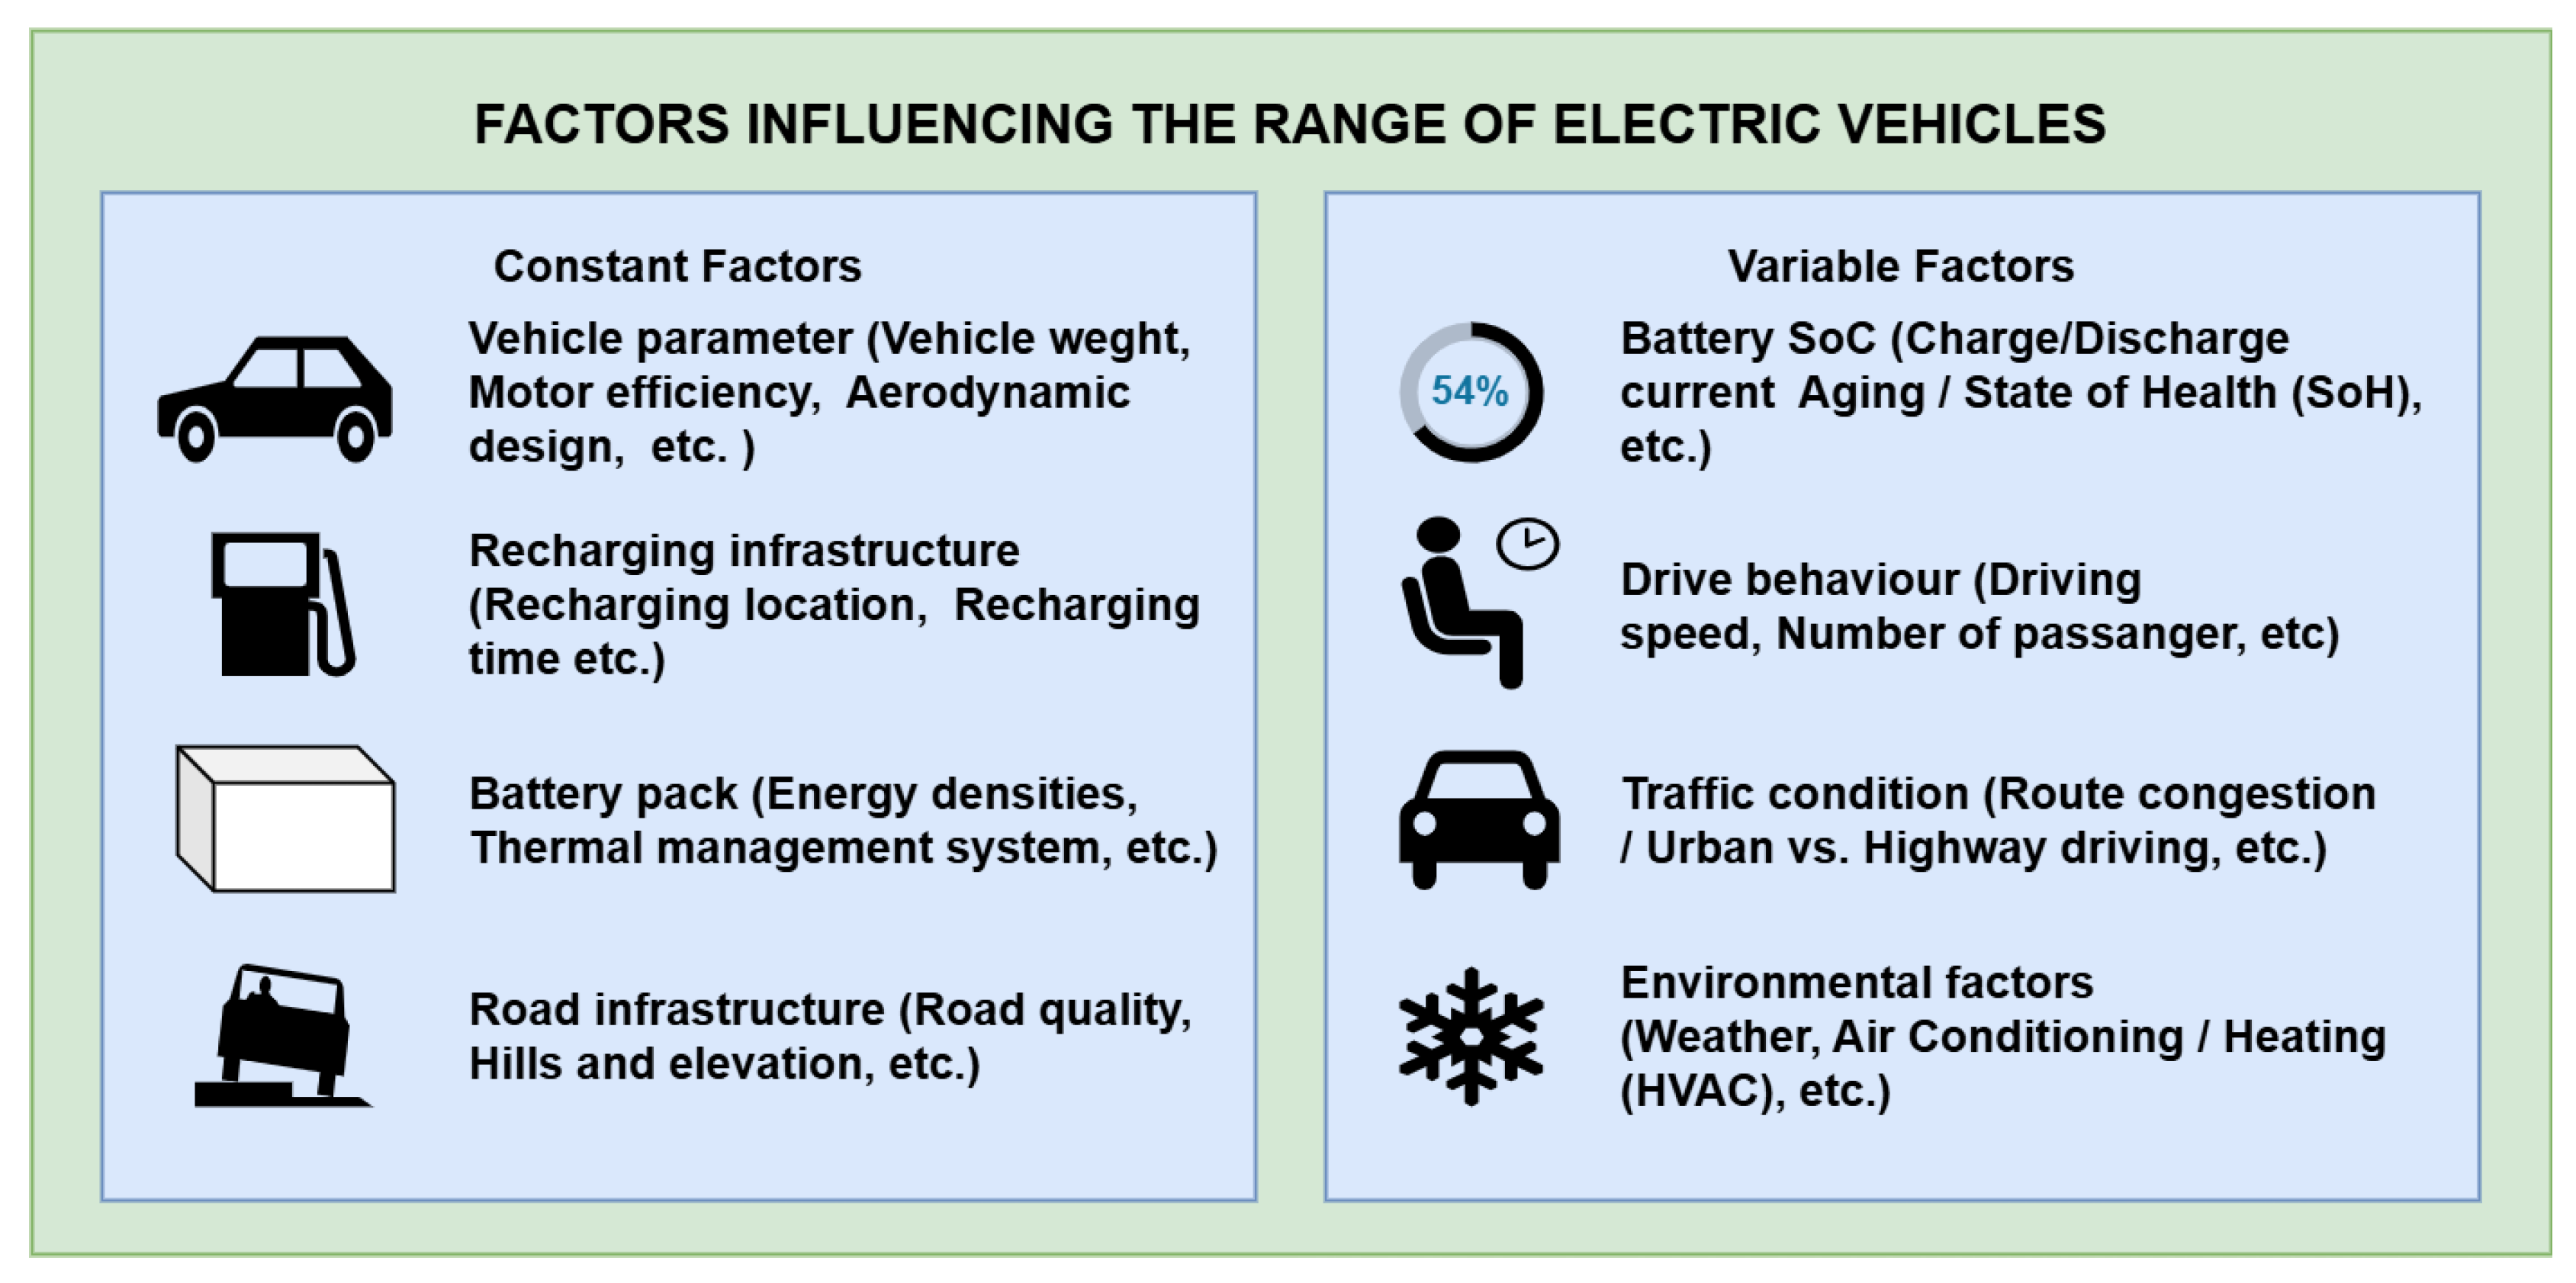
Figure 5.
Open-circuit voltage profiles of a lithium-ion B0005 battery during the fifth cycle of charging and discharging at room temperature.
Figure 5.
Open-circuit voltage profiles of a lithium-ion B0005 battery during the fifth cycle of charging and discharging at room temperature.
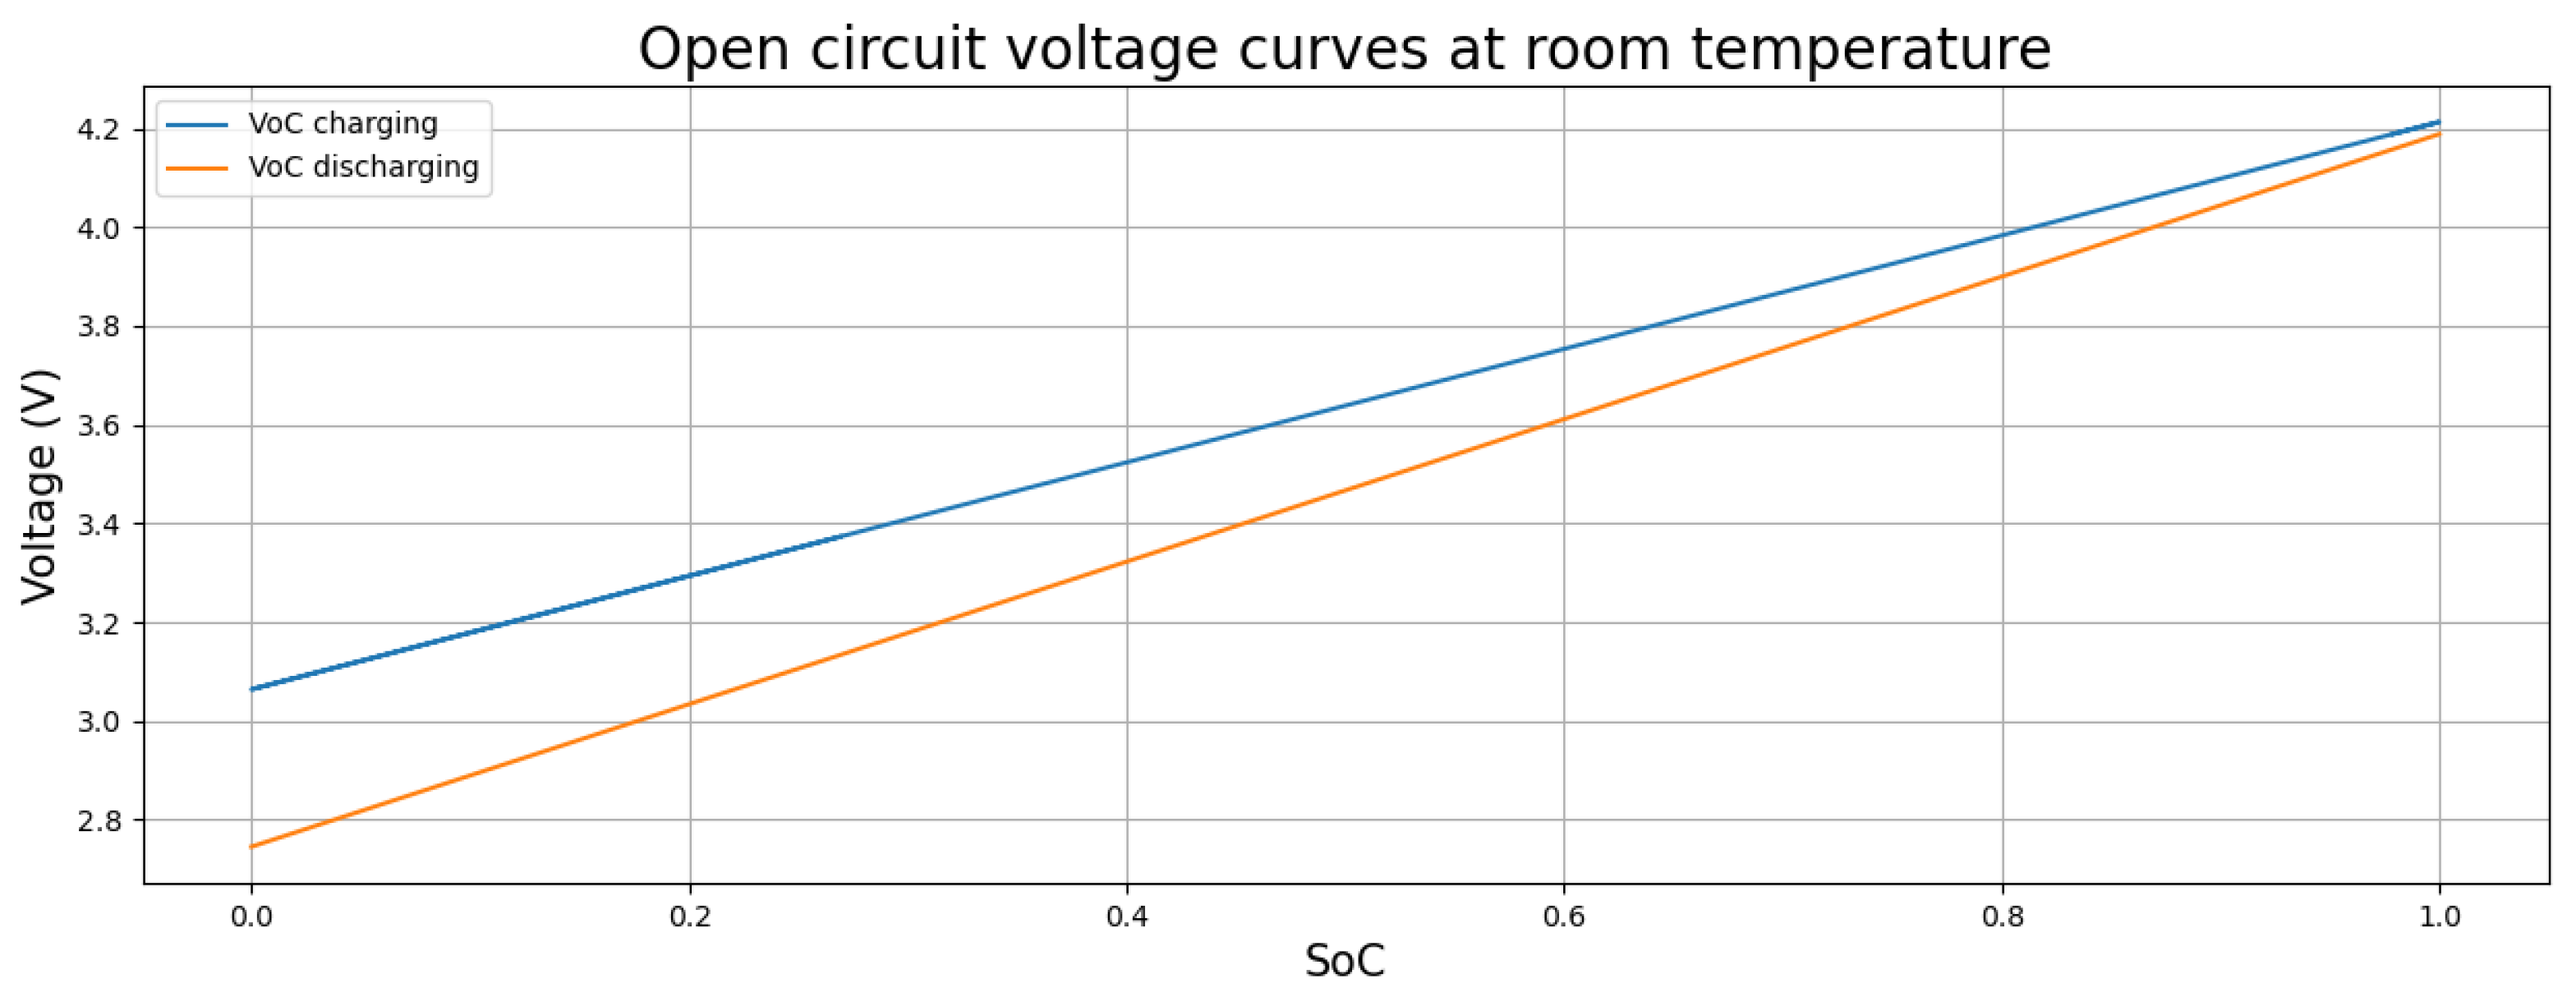
Figure 6.
System Architecture and data flow of the driving range prediction system.
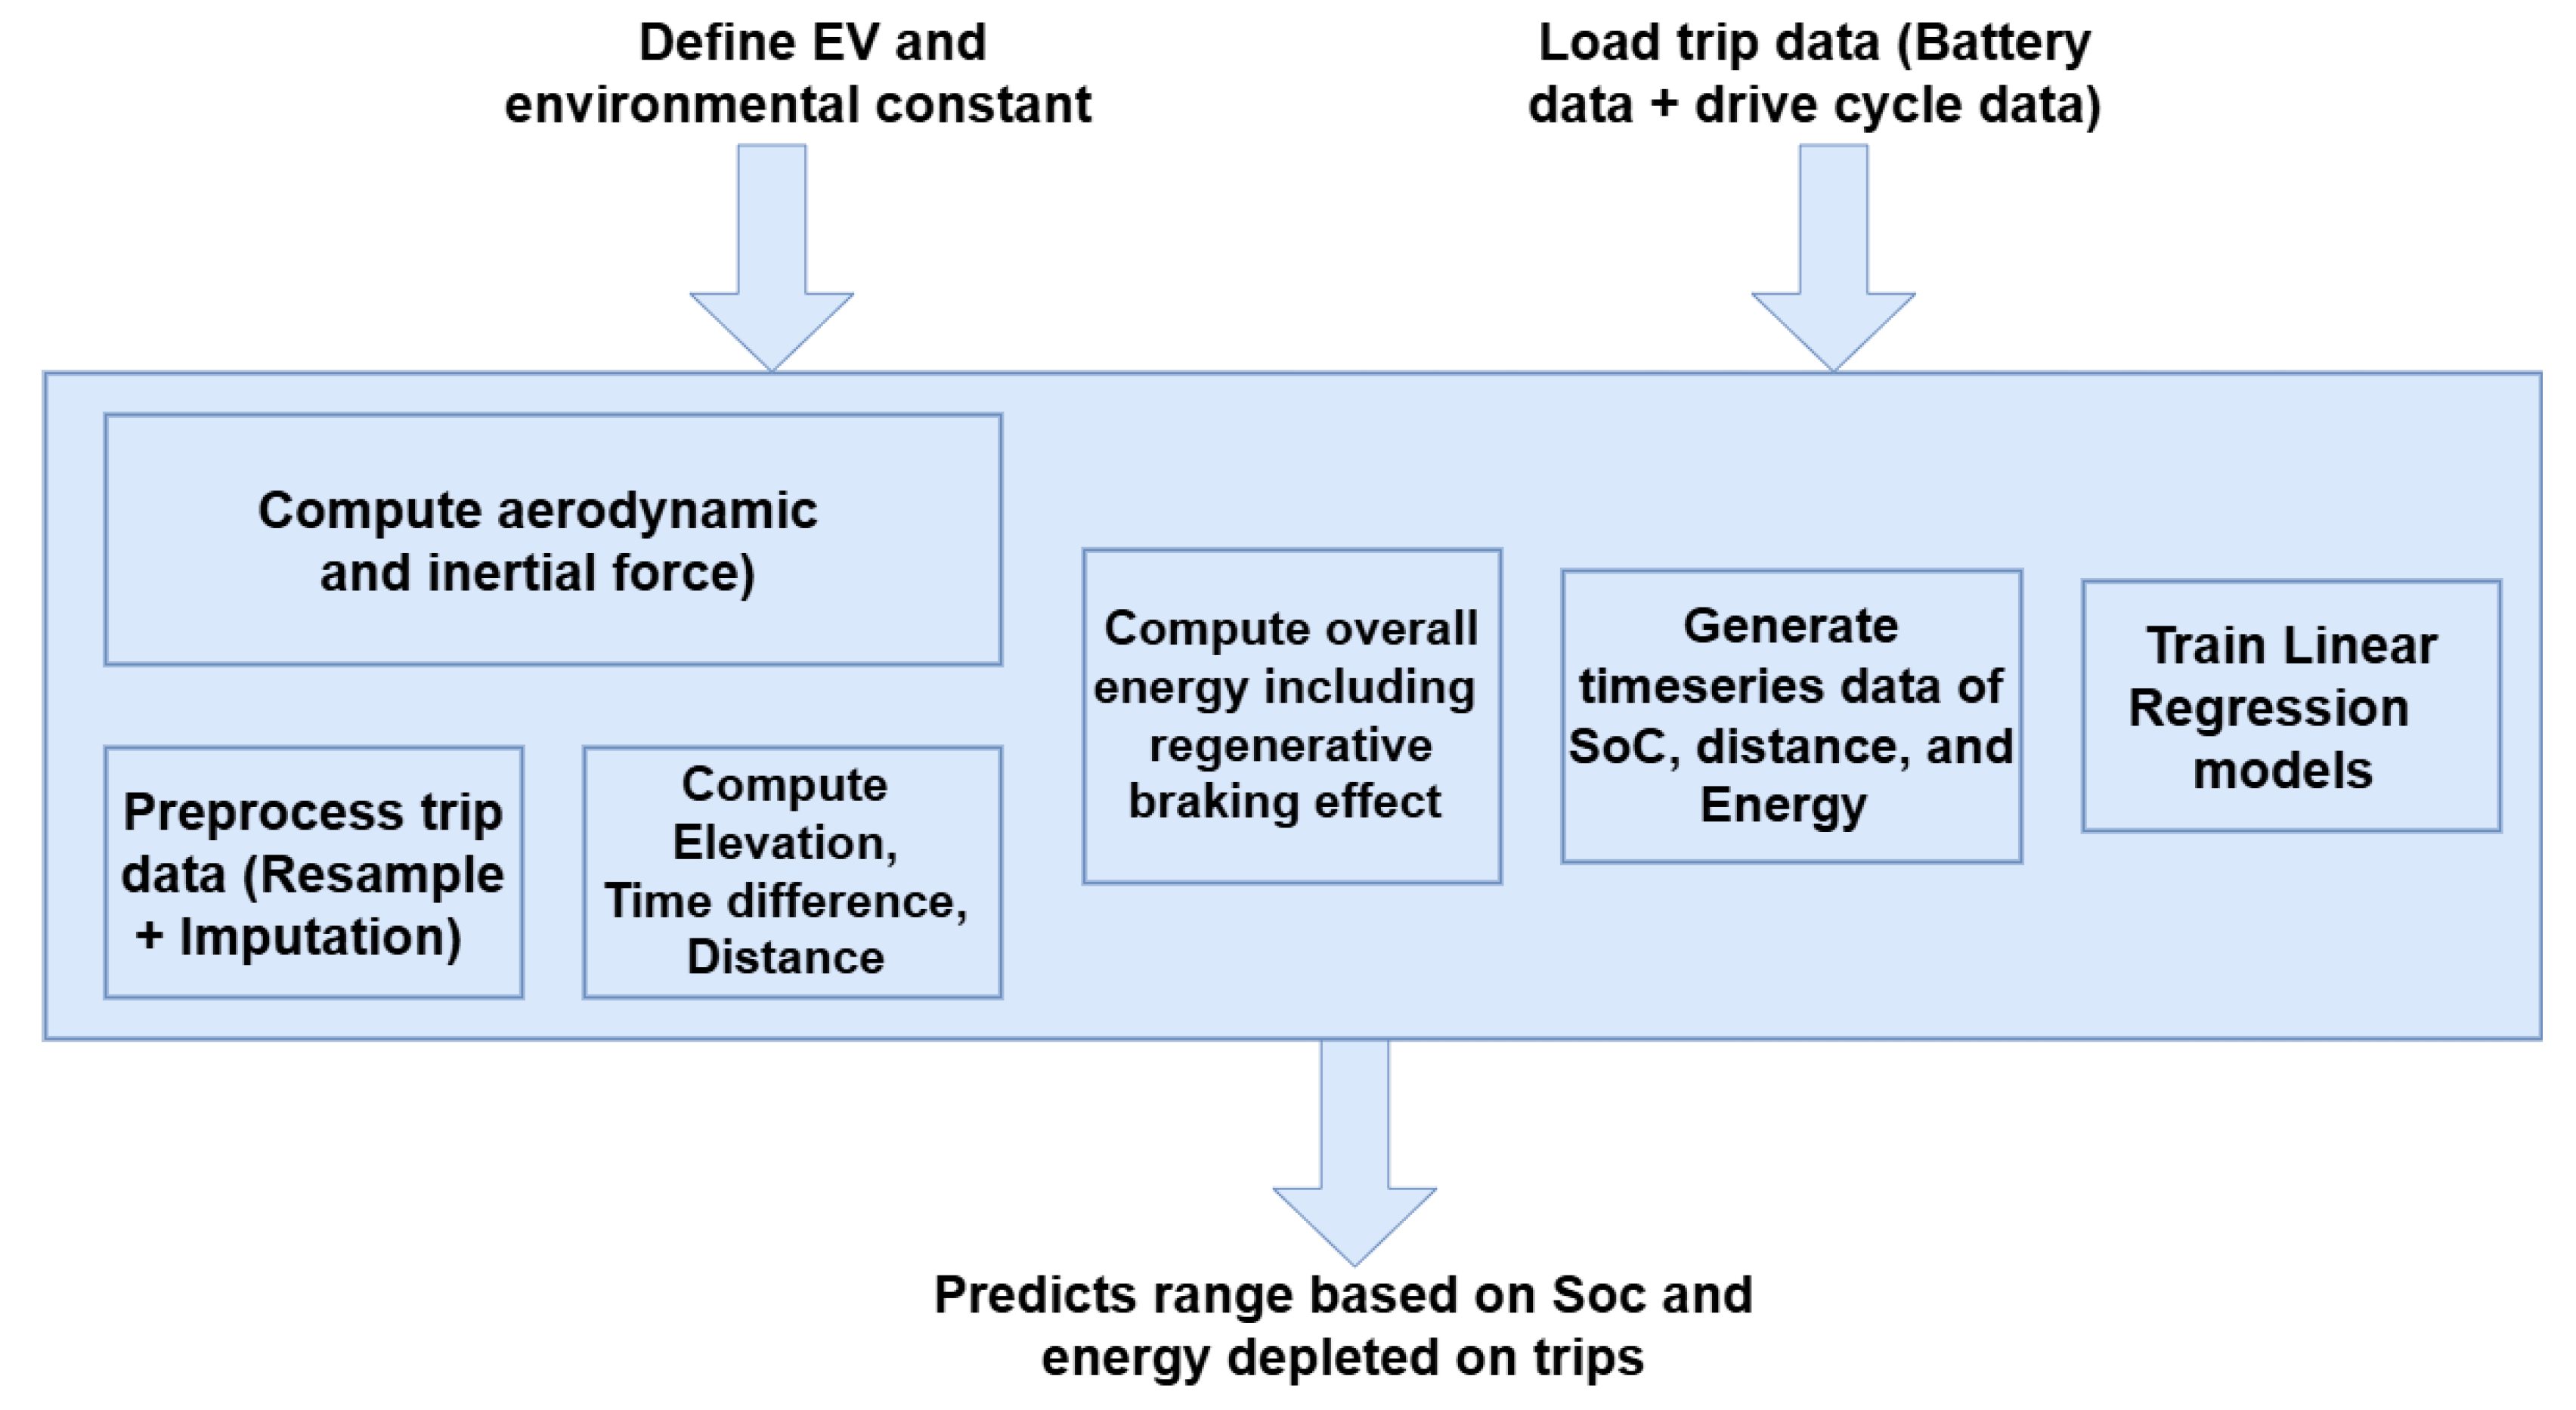
Figure 7.
Power flow analysis for losses calculation.
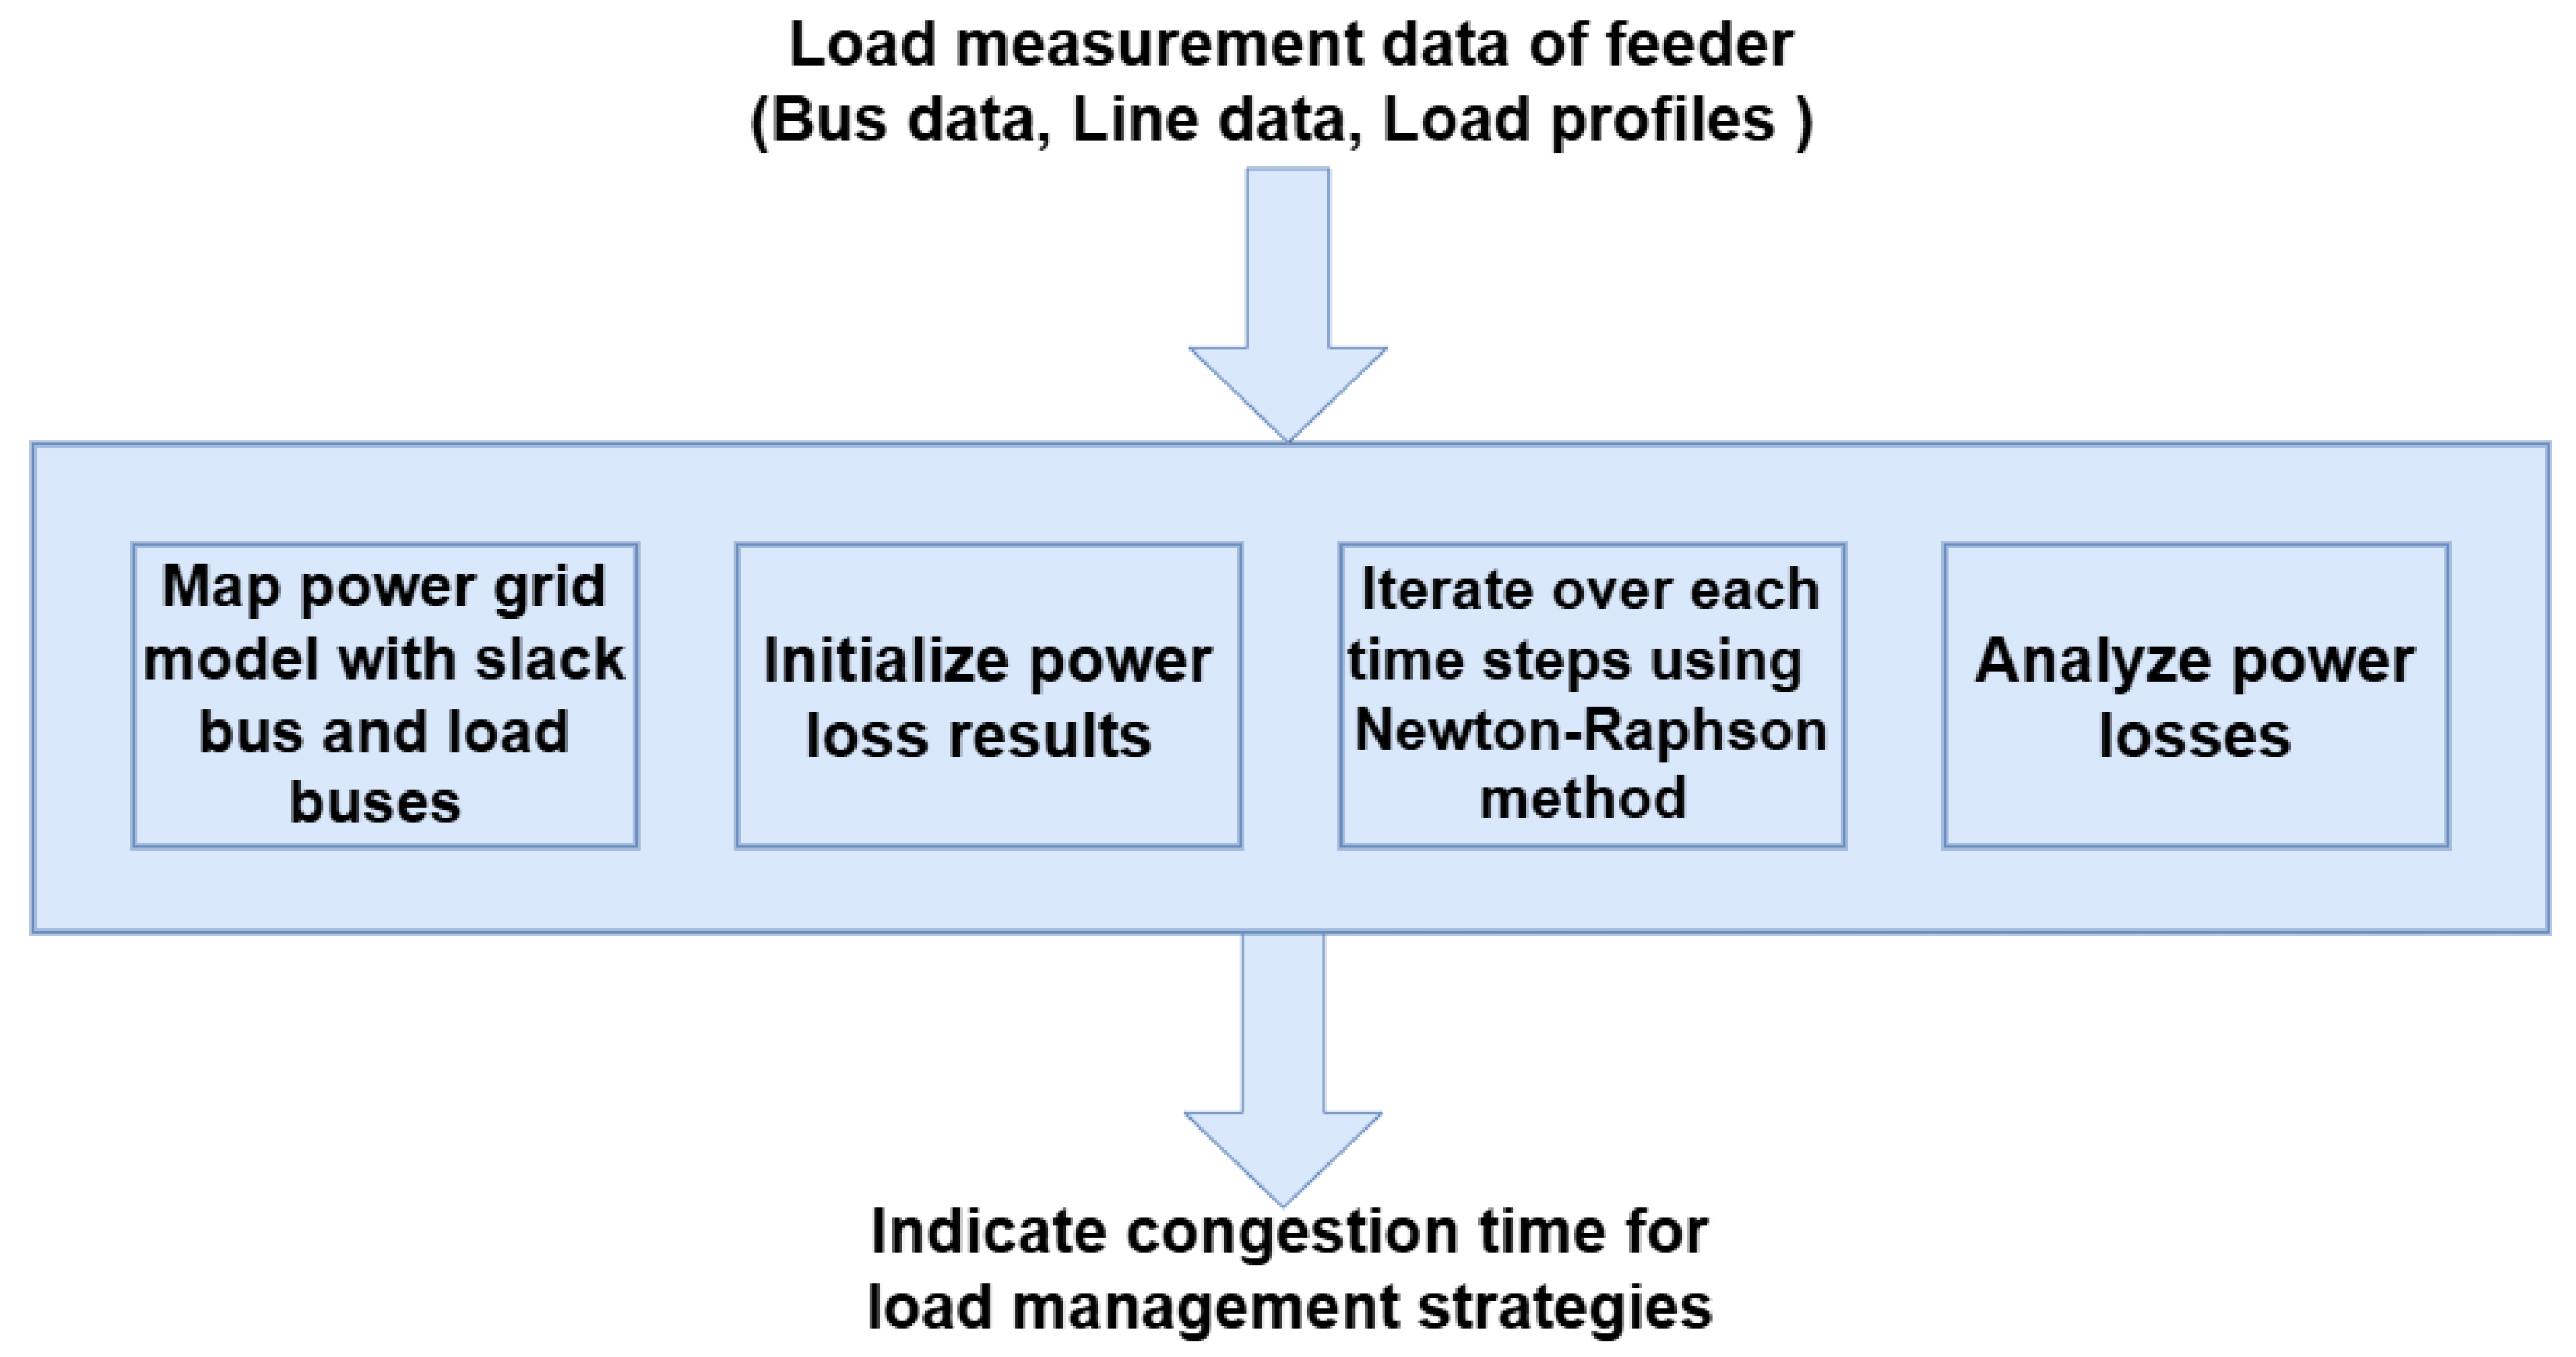
Figure 8.
Structure of appliance schedule model.
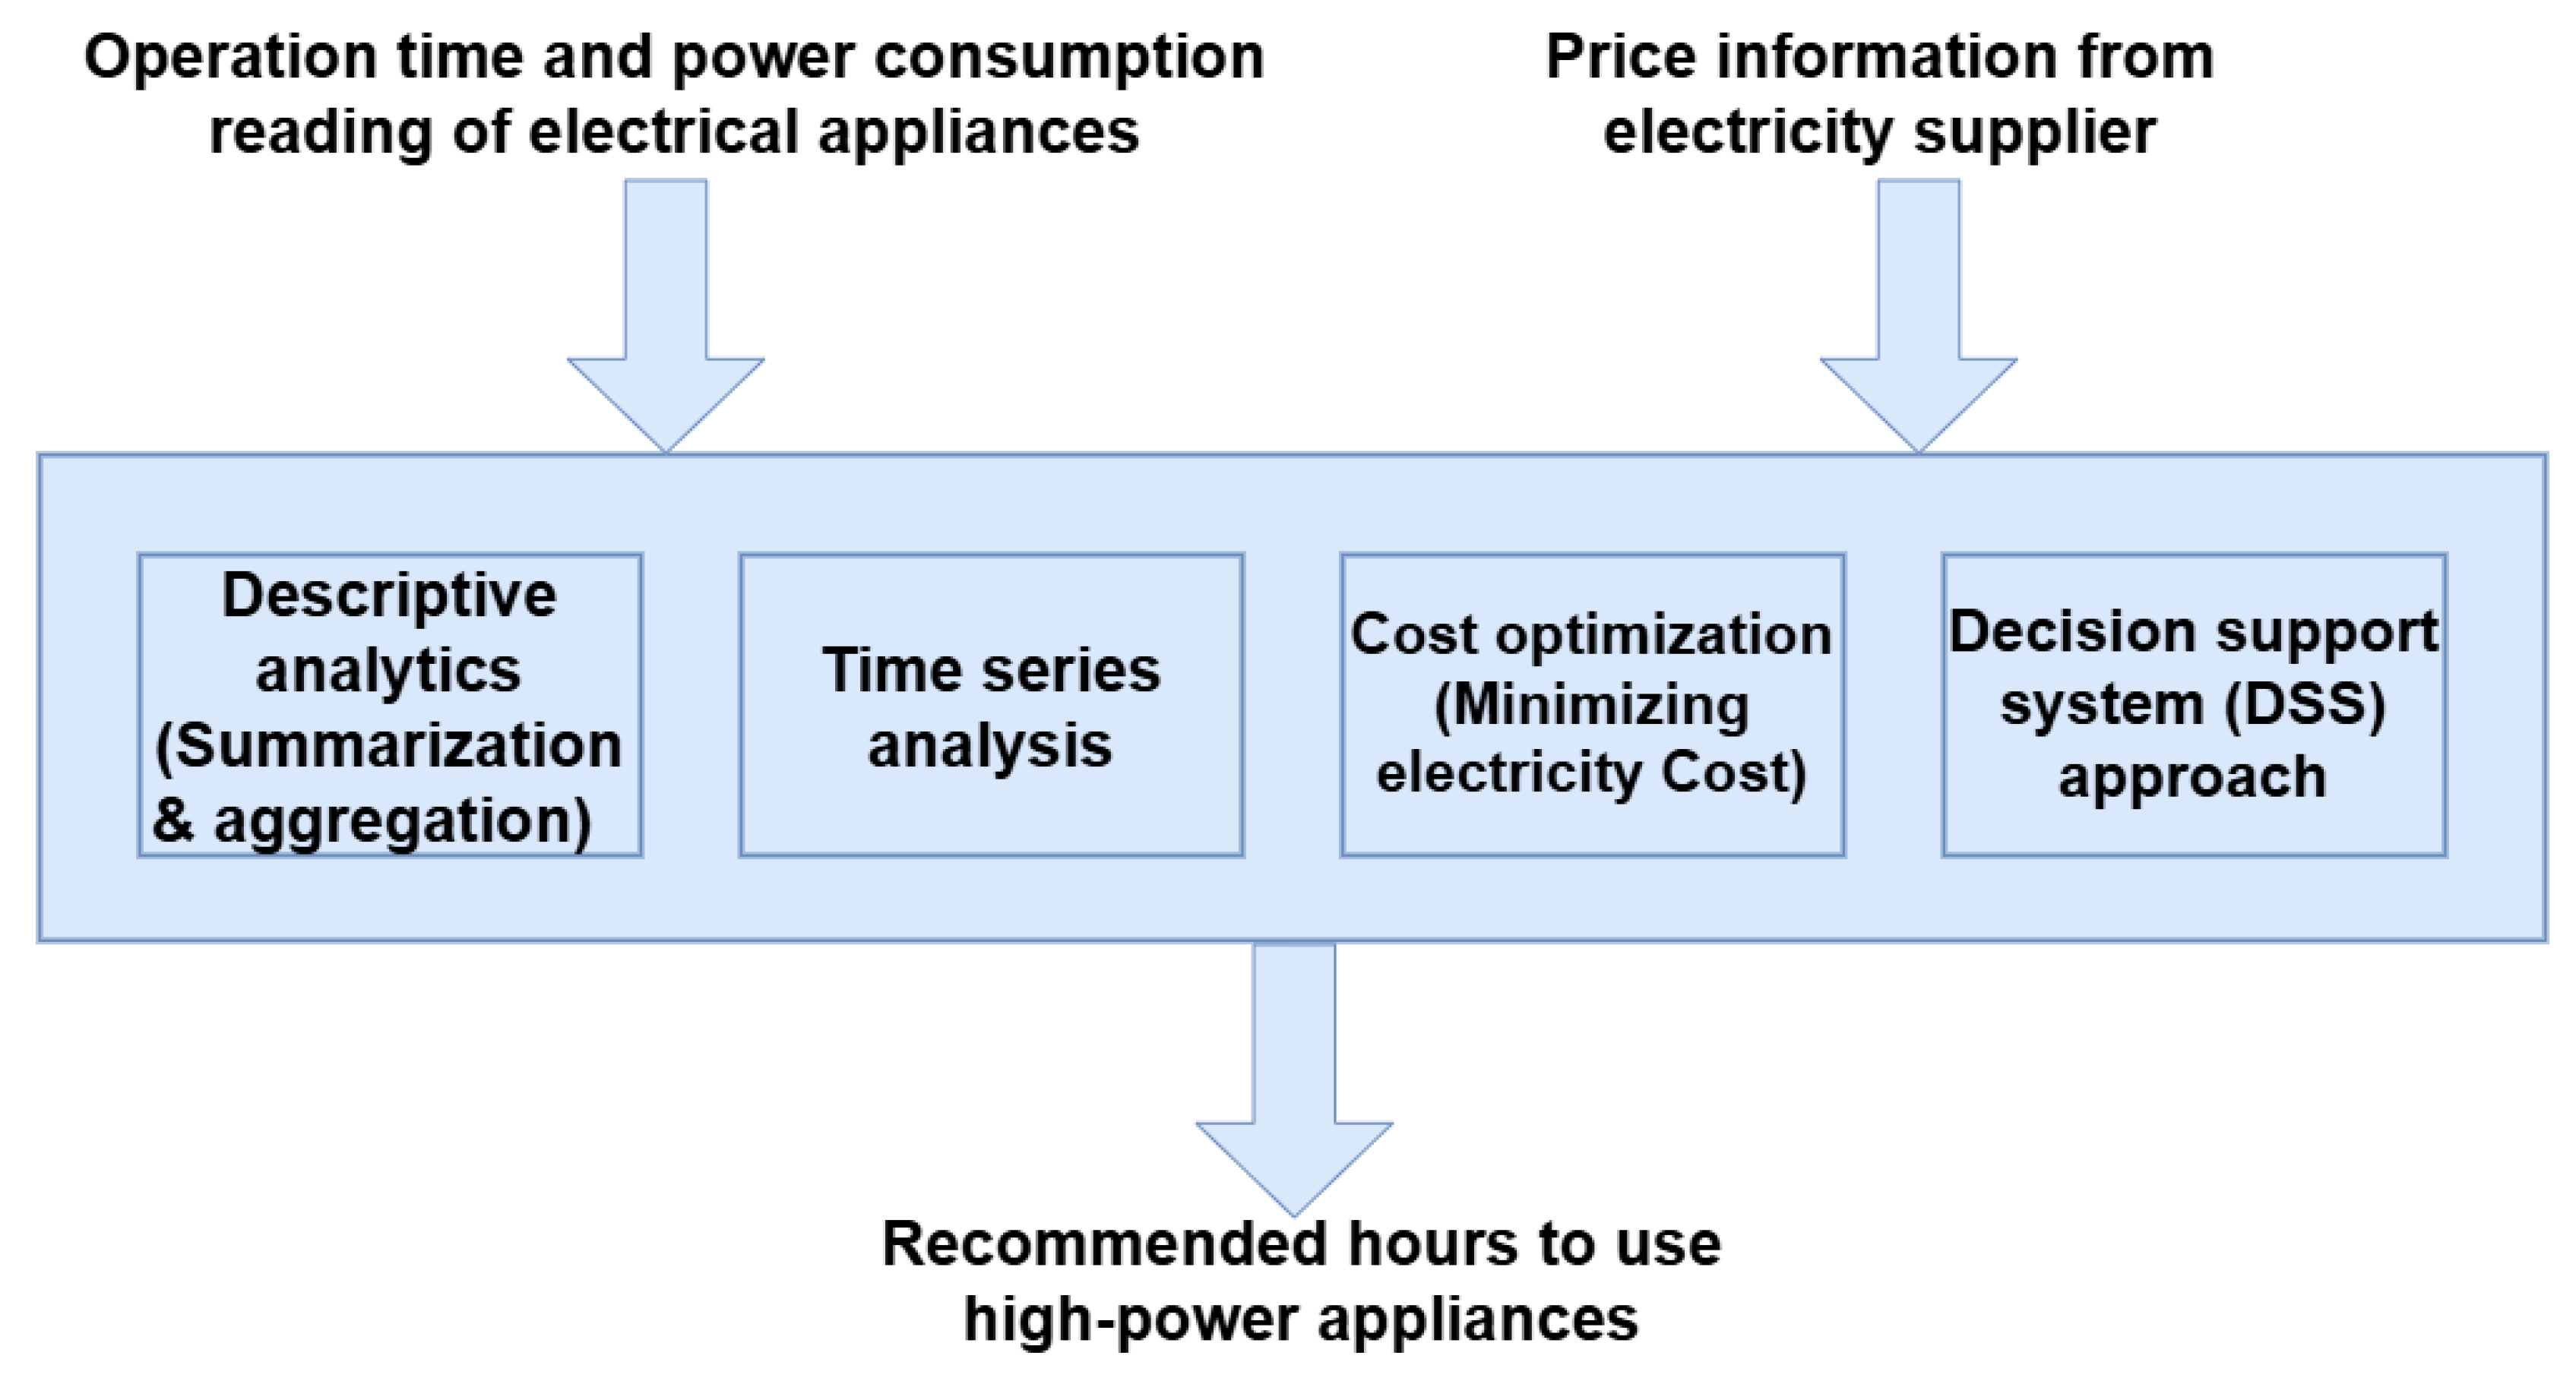
Figure 9.
The relationship between battery SoC, distance traveled, and energy depletion, highlighting the near-linear energy consumption pattern and the accuracy of the predicted range estimation for efficient EV trip planning
Figure 9.
The relationship between battery SoC, distance traveled, and energy depletion, highlighting the near-linear energy consumption pattern and the accuracy of the predicted range estimation for efficient EV trip planning
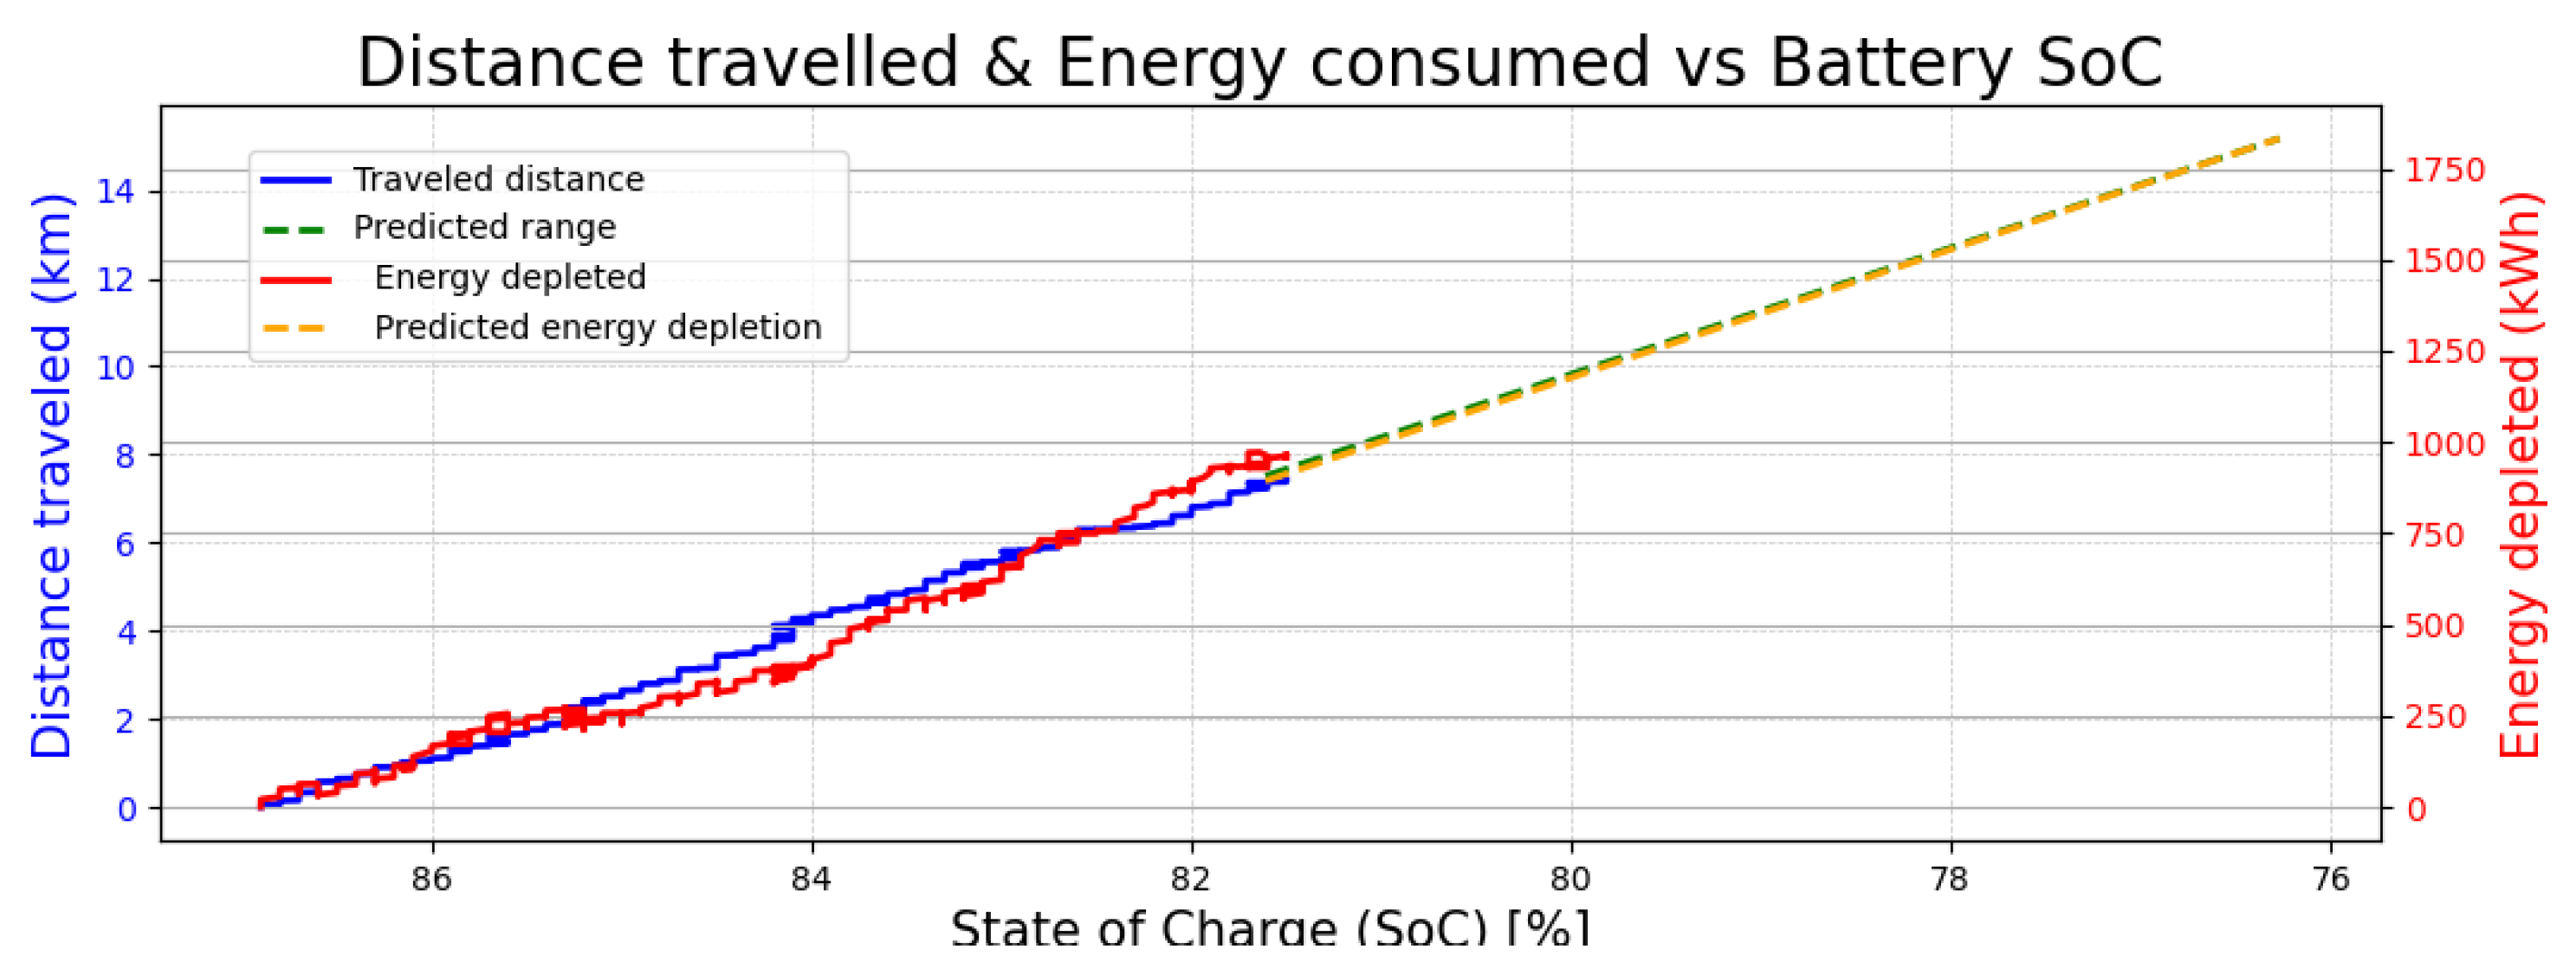
Figure 10.
Load profile of modified European LV test data
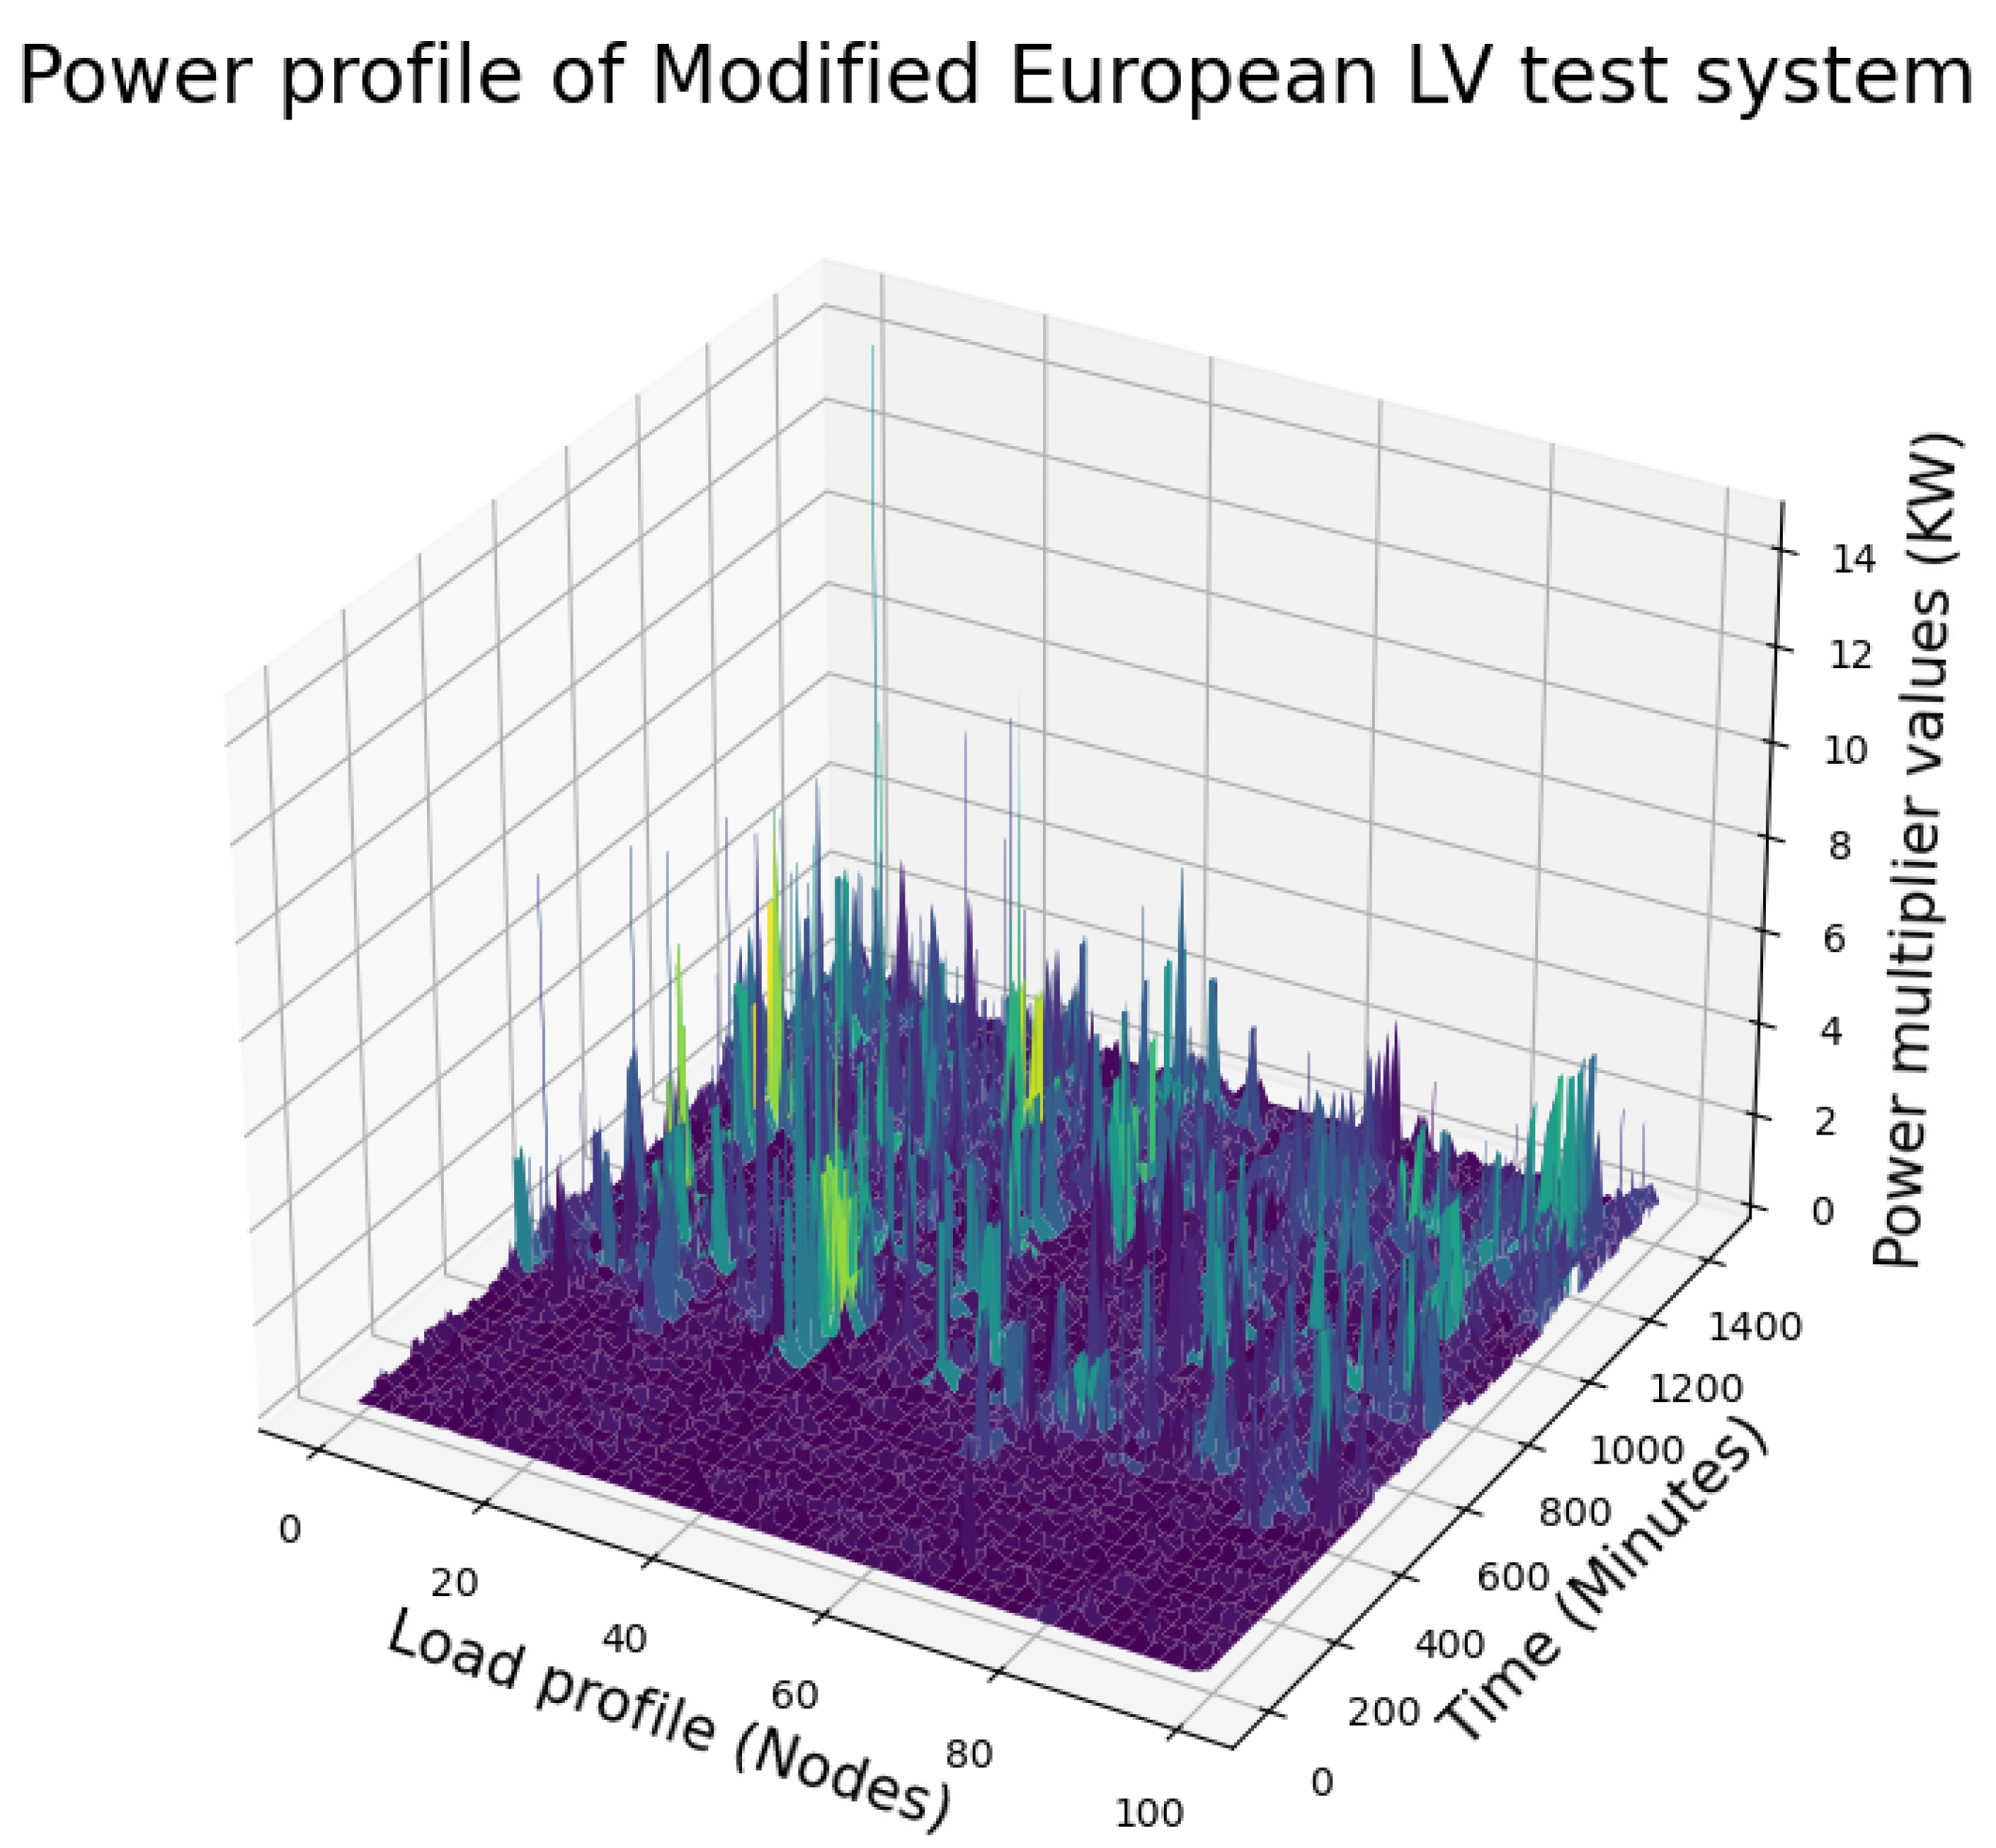
Figure 11.
Daily power losses with one-minute resolution
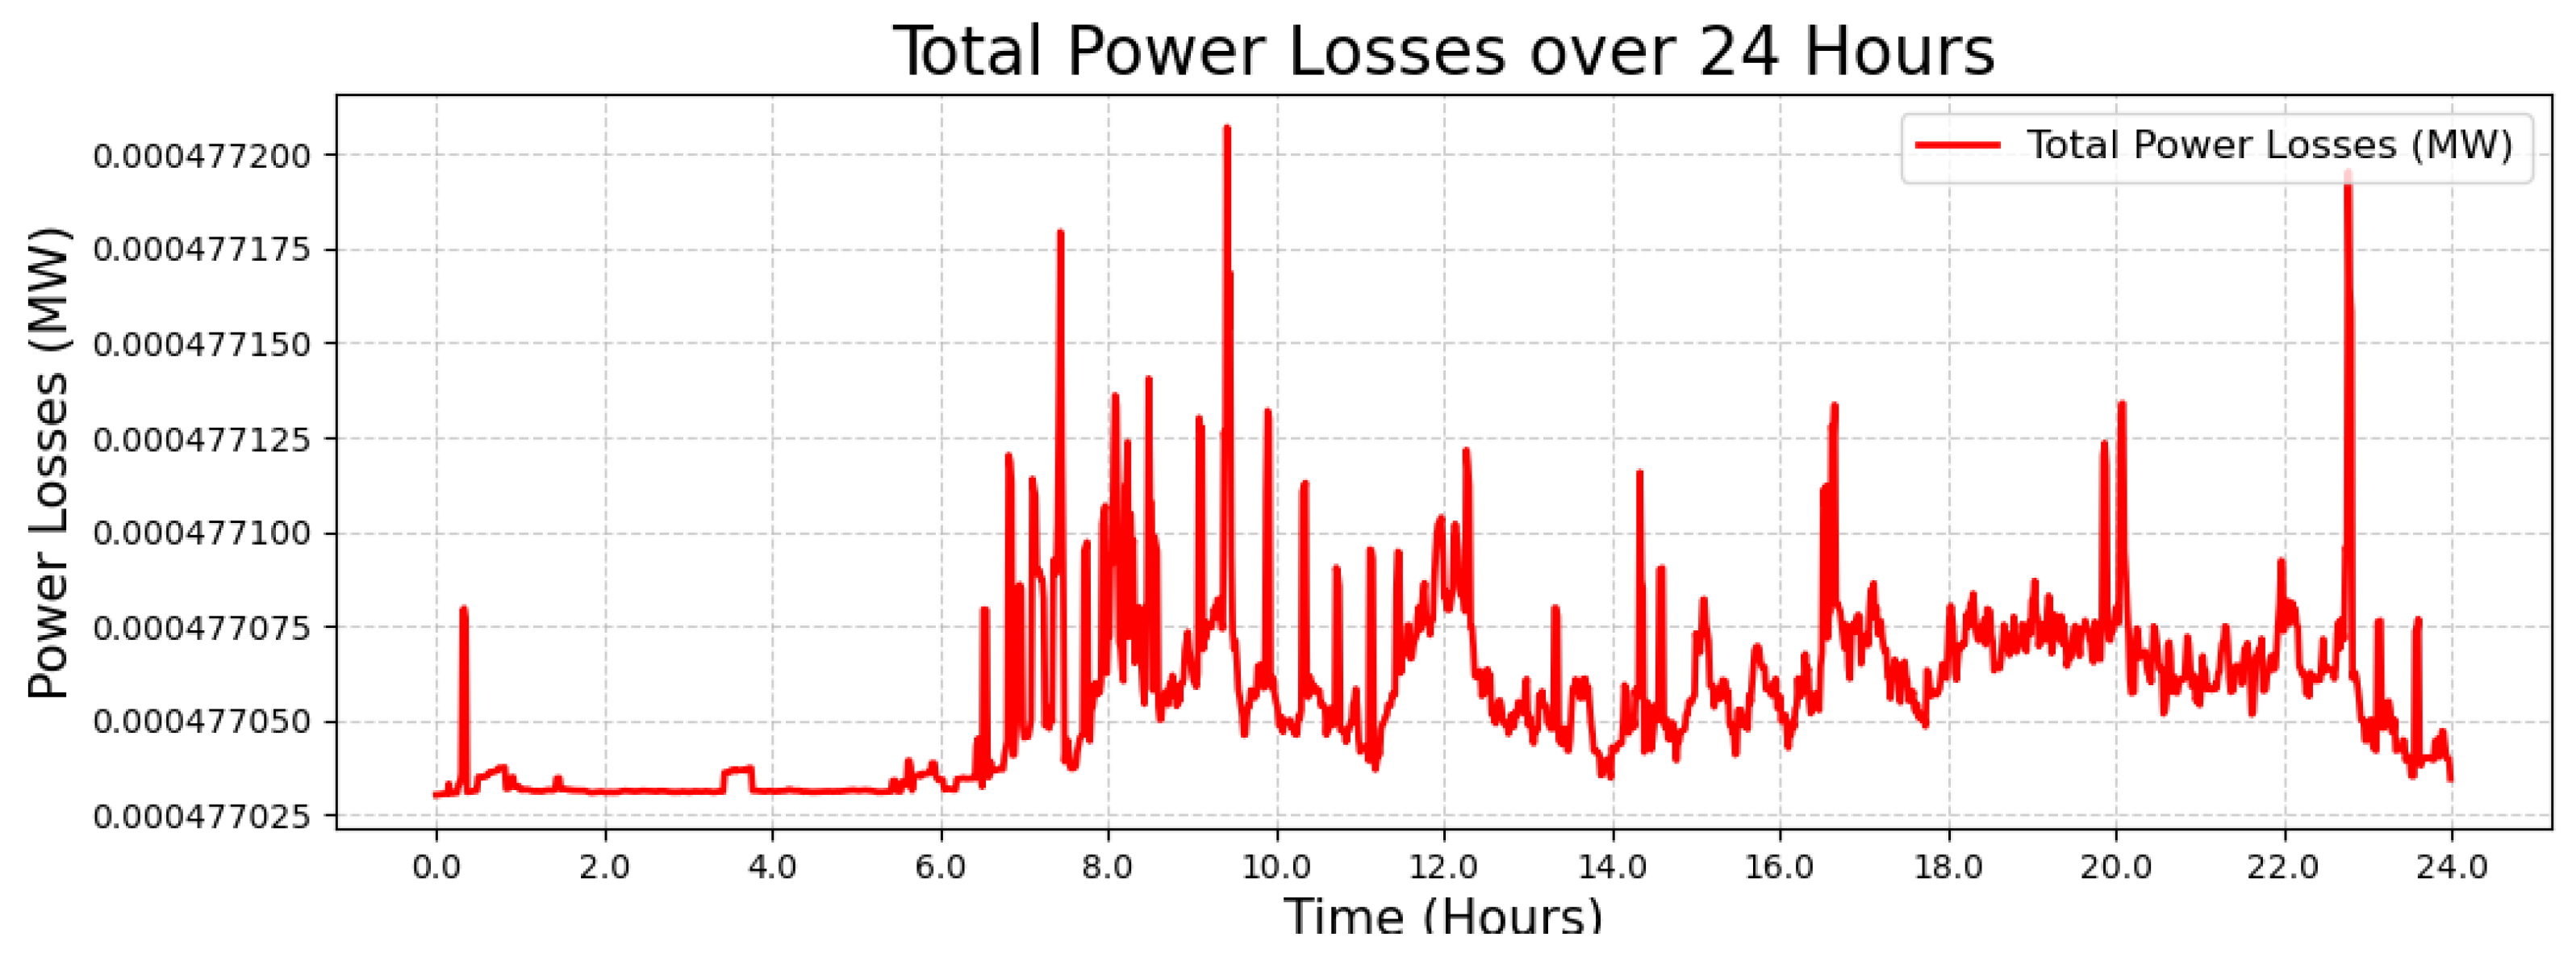
Figure 12.
Energy consumption visualization on house seven in the GREEEND dataset. Diurnal power variation by different electrical appliances over of Building1 on 2014-03-13 .
Figure 12.
Energy consumption visualization on house seven in the GREEEND dataset. Diurnal power variation by different electrical appliances over of Building1 on 2014-03-13 .
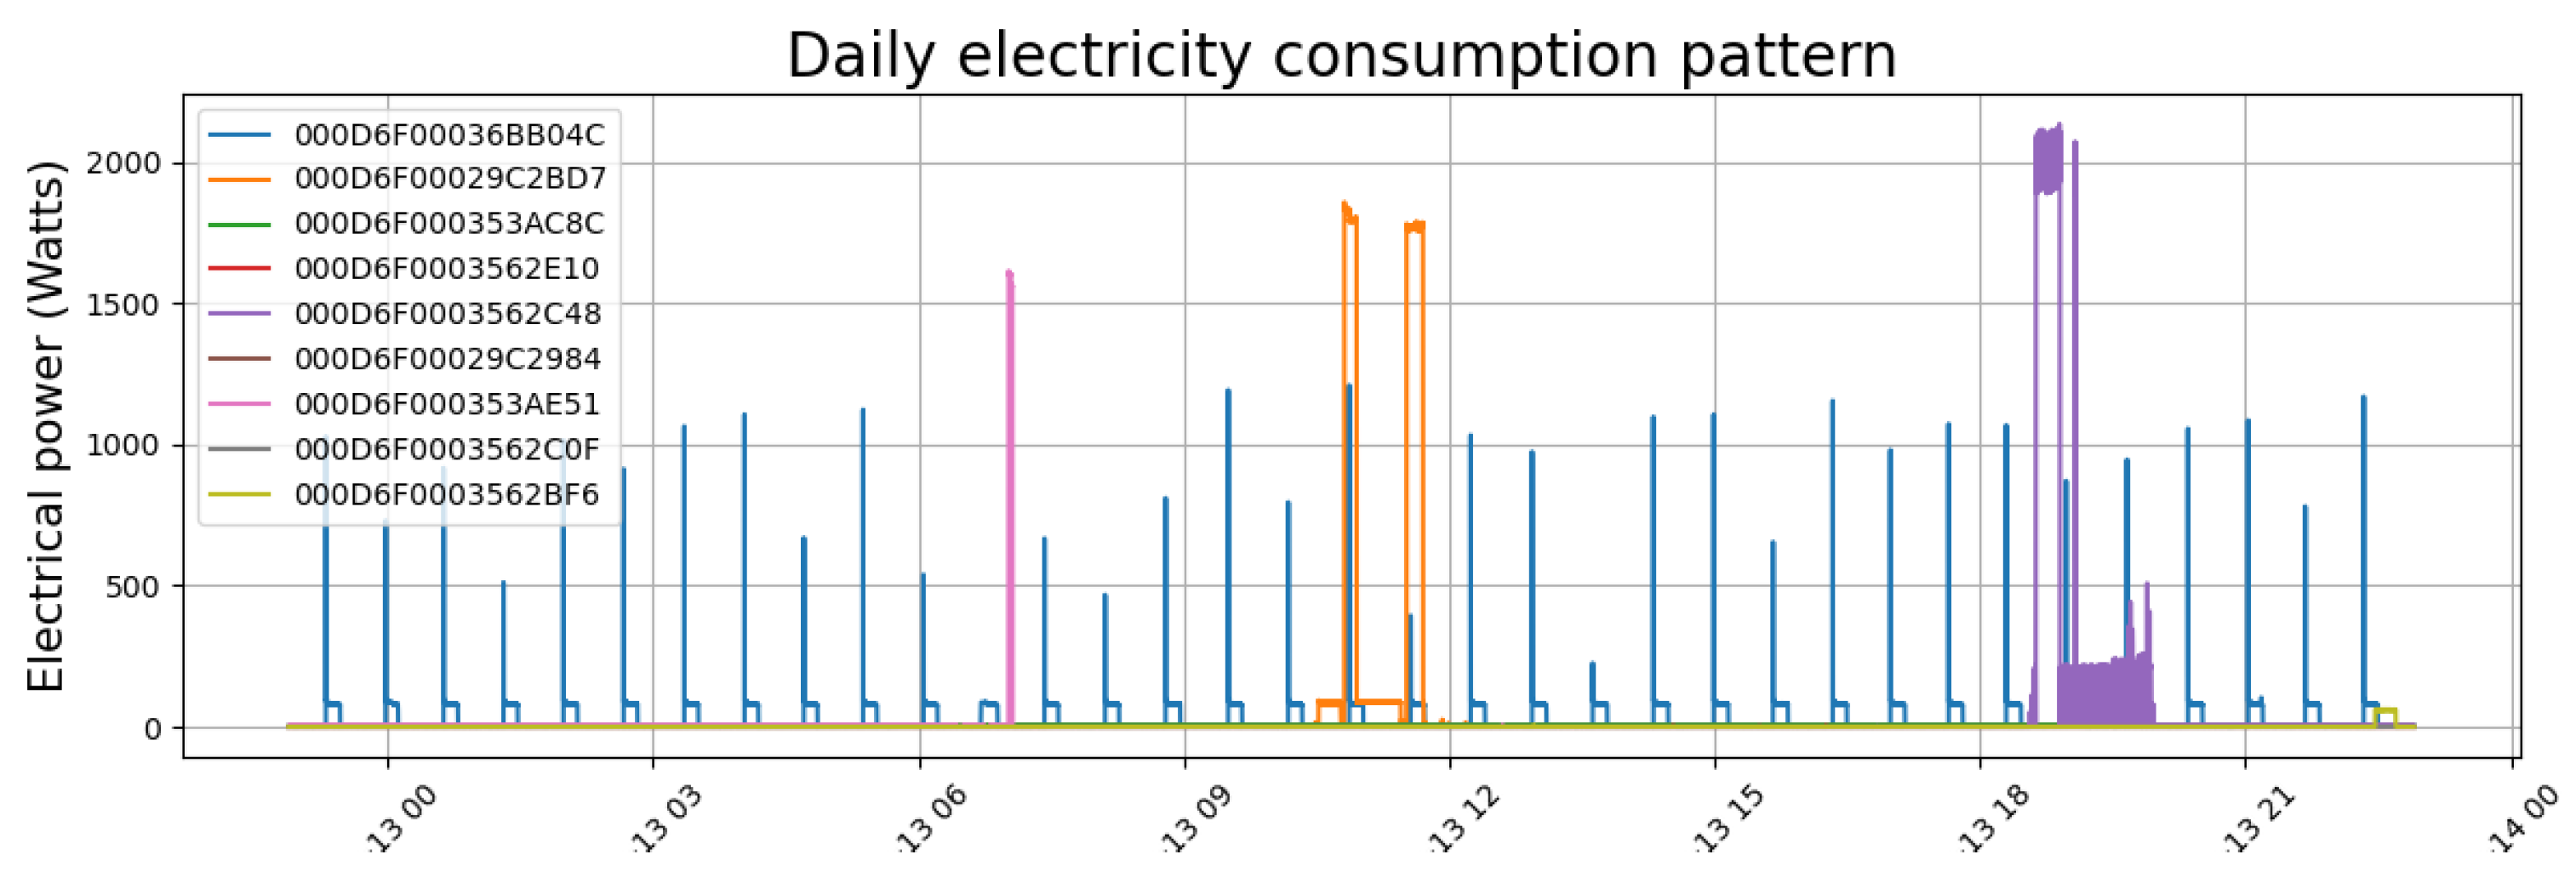
Table 1.
Outlook of the Measurify resource types
| Resource type | Description |
|---|---|
| Measurement | Single measure sent from the field to the cloud. Each measurement can contain more than one sample, each one time-stamped. |
| Feature | Definition of the type of a measurement (could be multi-dimensional, with different data types and orders in the dimensions). |
| Thing | The subject of the measure. |
| Device | The measuring device. |
| Tag | Tag information attachable to other resources for characterizing them for proper processing. |
Table 4.
Outlook of experimental tools and conditions.
| Feature Description | Range prediction from vehicular batteries | Power flow analysis from LV feeder data | Appliance scheduling from HEMS |
|---|---|---|---|
| Data sources | Battery and Heating Data in Real Driving Cycle [49] | IEEE LV test feeder [50] | GREEND: An Energy Consumption Dataset of Households in Italy and Austria [51] |
| Data format | CSV format (time series) | CSV format (time series load power) | CSV format(time series active power & appliance signature) |
| Measurement range | — | 0-6 kW | 0-3 kW |
| Measuring frequency | 10 Hz | 1/60 Hz | 1 Hz |
| Computational frameworks | Python script | Python script | Python script |
| Previously built IOT services from data sources | SoC and SoH prediction of battery [16] , Cabin heating controlling [52] | Power flow based coordinated power control [35], State estimation in medium voltage distribution networks [36] | Appliance identification [37], Load forecasting [12] |
| Constraint | Different cycles (urban, highway, mixed) have different power consumption patterns | Newton-Raphson method requires Jacobian matrix inversion, which can be computationally intensive for large networks | Descriptive analytics relies on past power consumption patterns only |
| How could it be improved? | Assign weight to each cycle based on typical driving behavior | Using iterative methods like Gauss-Seidel with appropriate preconditioning | Combining machine learning models can recomend better scheduling decisions |
Table 5.
Overview of dataset structure across the three application domains
| Domain | # Files | CSV Columns | Total Rows | Total Files Size (MB) |
|---|---|---|---|---|
| Vehicular Batteries | 33 | 38 | 157.114 | 48 |
| LV Test Feeder | 100 | 2 | 144.000 | 3 |
| HEMS | 231 | 10 | 18.288.288 | 1.400 |
Table 6.
Measured latency and system resource usage for each IoT service (batch upload)
| Application | Avg. Latency per row (µs) | Avg. CPU Usage (%) | Avg. RAM Usage (MB) |
|---|---|---|---|
| Vehicular Batteries | 189 | 5.4 | 775 |
| LV Test Feeder | 92 | 3.8 | 675 |
| HEMS | 115 | 6.7 | 3.100 |
Table 7.
Representative projects proposing general-purpose and open source IoT architectures/platforms
Table 7.
Representative projects proposing general-purpose and open source IoT architectures/platforms
| Publicly available open source IoT projects | Measurify framework [21] |
|---|---|
| OpenIoT [53]: IoT middleware supporting semantic data modeling, service discovery, and cloud integration. It is designed mainly for smart city applications and academic use. Interoperability is achieved at the service level via the Global Sensor Network, but the system is relatively complex and not tailored to lightweight measurement-centric deployments. | Focused on measurement-oriented modeling with lightweight RESTful APIs and fine-grained resource definitions. It offers fast deployment, simplified schema configuration, and efficient time-series management. More suitable for real-time sensor data workflows and modular integration. |
| Web of Things/Objects [54]: Conceptual framework developed by W3C to enable semantic interoperability across smart devices using standard web technologies. It provides a unified description of Things via Thing Descriptions, focusing on metadata, discoverability, and linking capabilities. However, it lacks a concrete implementation for full-stack data collection, storage, and processing. | Provides a complete implementation for measurement-based IoT systems, including structured data acquisition, storage (MongoDB), and access via REST APIs. It offers practical, application-ready semantics for measurement features, devices, and entities, optimized for quick integration and prototyping. |
| BIG IoT [55]: A project aimed at enabling interoperability across IoT platforms through a common Web API and a service marketplace. It focuses on high-level service registration, discovery, and monetization, primarily in smart city scenarios. While it fosters platform-to-platform integration, it does not define low-level data models or provide concrete tools for measurement acquisition and storage. | Targets the full measurement lifecycle: data acquisition, modeling, storage, and access. It enables fine-grained control over IoT resources without relying on centralized marketplaces. Designed for bottom-up integration of sensors and measurements with native REST APIs and time-series support, rather than top-down service abstraction. |
| IoTAWS [56]: A cloud-based platform by Amazon Web Services offering scalable, secure IoT services including device management, data ingestion, analytics, and integration with other AWS services. While powerful, it is tightly coupled to the AWS ecosystem, often requiring complex configuration and limiting transparency and customization for smaller or domain-specific deployments. | Offers an open-source, vendor-neutral alternative focused on flexibility and clarity in data modeling. Suitable for lightweight, domain-specific solutions where developers require full control over data structure and system behavior without vendor lock-in or high cloud overhead. Easily deployable on local or hybrid infrastructures. |
| MS Azure [57]: A highly integrated cloud platform offering end-to-end IoT services including device provisioning, data streaming, analytics, digital twins, and machine learning integration. While feature-rich, it introduces complexity and cost, with limited transparency in internal workflows and strong dependence on Microsoft infrastructure and cloud services. | Provides a minimal, transparent framework for modeling and managing IoT measurement data. Its lightweight design and full control over data flow make it ideal for scenarios requiring low latency, rapid prototyping, or offline deployment. It avoids cloud dependencies, enabling cost-effective and customizable solutions. |
Disclaimer/Publisher’s Note: The statements, opinions and data contained in all publications are solely those of the individual author(s) and contributor(s) and not of MDPI and/or the editor(s). MDPI and/or the editor(s) disclaim responsibility for any injury to people or property resulting from any ideas, methods, instructions or products referred to in the content. |
© 2025 by the authors. Licensee MDPI, Basel, Switzerland. This article is an open access article distributed under the terms and conditions of the Creative Commons Attribution (CC BY) license (http://creativecommons.org/licenses/by/4.0/).
Copyright: This open access article is published under a Creative Commons CC BY 4.0 license, which permit the free download, distribution, and reuse, provided that the author and preprint are cited in any reuse.


