
Submitted:
16 November 2023
Posted:
17 November 2023
You are already at the latest version
Abstract
The Internet of Things (IoT) is experiencing exponential growth, revolutionizing various industries with its ability to connect devices and enable advanced applications. In the realm of energy production, IoT offers significant potential for optimizing processes and improving efficiency. This study presents a comprehensive monitoring and energy management strategy for the University of Cuenca's microgrid photovoltaic (PV) system, utilizing IoT and ThingSpeak as key technologies. The proposed strategy leverages intelligent environments and utilizes ThingSpeak as a robust platform for data presentation and analysis. By integrating IoT devices and sensors, real-time monitoring of PV system parameters such as solar radiation and temperature is achieved. The collected data is then analyzed using advanced algorithms and visualized through ThingSpeak, enabling effective energy management and decision-making. The developed monitoring system was rigorously tested in a laboratory microgrid setting, where the PV system is interconnected with other generation and storage systems, as well as the electrical grid. Through the seamless integration of these components, the monitoring system provides enhanced visibility and control over the microgrid's energy production. The results demonstrate the successful implementation of the monitoring system, showcasing its ability to improve the supervision, automation, and analysis of daily energy production. By leveraging IoT technologies and ThingSpeak, stakeholders can access real-time data, analyze performance trends, and optimize energy resources.
Keywords:
IoT
; energy monitoring
; energy management
; ThingSpeak
; photovoltaic
; microgrid.
1. Introduction
The Internet of Things (IoT) has been a catalyst for advancements across various sectors, including education, industry, and energy. By enabling seamless data transfer and exchange over the Internet, IoT has played a pivotal role in driving innovation. In particular, the utilization of IoT technology facilitates the collection of data from interconnected devices, paving the way for its subsequent interpretation and optimization of processes. One notable application of this technology is the monitoring of energy generation, which holds significant importance in mitigating excessive energy costs and fostering sustainability through renewable sources like photovoltaic (PV) energy. Nevertheless, while the progress of IoT is commendable, its full potential may be impeded by limited accessibility for users to connect remotely. Hence, there arises a pressing need for the development of user-friendly tools that enable seamless remote connectivity from any location.
Within the realm of academic literature, several IoT applications have been documented, allowing for remote access to meteorological parameters such as temperature, humidity, dew point, light intensity, atmospheric pressure, precipitation, and smoke percentage [1]. Notably, authors in [2] have devised a prototype system utilizing an Arduino controller to remotely monitor room temperature and humidity. While the outcomes appear promising, the study also acknowledges certain limitations stemming from the technological capacity of the Arduino controller. Similarly, a low-cost monitoring system for off-grid PV systems is presented in [3], where in a precise and straight forward fault diagnostic algorithm is integrated into a cost-effective microcontroller for real-time validation. Rigorous evaluations under specific weather conditions have demonstrated the algorithm's proficiency in accurately detecting and identifying various examined faults. However, this approach overlooks the real-time monitoring of PV variations based on current weather conditions, a factor that can significantly impact future energy system planning.
Some authors developed smart meters, [4] developed low-cost measurement equipment in photovoltaic installations in homes that allows obtaining consumption profiles with high resolutions. Furthermore [5] proposed a methodology to analyze the influence of data granularity using period grams together with autocorrelation analyzes that describe the characteristics of the consumption load profile of households with a high sampling frequency (>4 Hz). And [6] presented a web platform based on a cloud system that allows analysis of data captured by IoT devices from smart homes with photovoltaic systems and electric vehicles in real time.
Through the use of algorithms the system is optimized, [7] proposed TLBO to optimize the power factor of electrical installations, and [8] presented a Lora network with an ABC algorithm that optimizes the communications network and obtains load profiles in homes.
Furthermore, ThingSpeak, an online platform closely associated with IoT, emerges as a key player by providing a seamless means to collect, store, and analyze data generated by IoT devices. Acting as a web service, ThingSpeak acts as a host for various sensors, facilitating cloud-based data monitoring through MATLAB integration [3]. Through the integration of ThingSpeak, one can plot daily and yearly load profiles using advanced data analysis techniques while monitoring real-time variables [9]. In parallel, monitoring PV systems assumes critical significance in enhancing energy production rates and demand management. However, monitoring the conditions of a PV system necessitates an extensive repository of measured data and software tools [10]. Notably, S. Kang and I. Lee have proposed a Python-based methodology for monitoring solar power plants and analyzing monitoring data [11]. Similarly, an intelligent monitoring technique for photovoltaic systems is introduced in [12]. Nonetheless, these studies fall short in terms of readily accessible online monitoring capabilities across various devices. An IoT-enabled intelligent solar water heater system employing the ThingSpeak IoT platform is presented in Ref. [13]. This system, designed and operated using open-source hardware and IoT frameworks, exhibits considerable potential in enhancing water heater efficiency through real-time system observations. However, it is worth noting that the authors fail to incorporate a more advanced and robust monitoring system, thereby limiting the scope of their results. Hence, the authors neglect more stringent monitoring tests.
Similarly, authors in [14] propose an IoT-based technique to simultaneously monitor key values characterizing a solar panel, employing an Esp32 microcontroller. Real-time values are graphically displayed on the free ThingSpeak platform, appearing on both an LCD screen and the microcontroller's serial monitor. The proposed system has undergone successful testing, albeit focusing solely on the behavior of isolated PV systems. Presently, PV systems operate within microgrids encompassing multiple energy flows, thereby posing a significant challenge to the proper functioning of PV system monitoring—an aspect overlooked in [14]. The monitoring of PV systems through IoT and ThingSpeak entails connecting the system components to the ThingSpeak platform via IoT devices. ThingSpeak facilitates data analysis and processing through its integration with MATLAB. Consequently, this enables the application of advanced algorithms and techniques to extract meaningful insights from the collected data, including fault detection, trend analysis, and performance optimization. By harnessing the power of IoT and ThingSpeak, efficient real-time monitoring of photovoltaic systems becomes attainable. This, in turn, augments energy generation visibility, enables timely anomaly detection, and facilitates informed decision-making processes to optimize solar energy performance and management.
Despite the literature review encompassing current advancements, only a limited number of studies have explored the fusion of IoT and ThingSpeak in PV monitoring. The majority of existing studies primarily focus on isolated PV systems while overlooking the complexities associated with multiple energy flows within a microgrid. While some studies, such as [3], conduct several tests to validate their models, and [14] carry out comprehensive tests to validate their data, none of them tackle monitoring in the context of a PV system connected to a microgrid or incorporate robust machine learning techniques to validate performance. Consequently, a significant gap exists in the literature that necessitates addressing.
Henceforth, this study aims to present a comprehensive strategy for enhancing the visibility of PV generation data on the web through the utilization of the ThingSpeak platform. Furthermore, this study goes beyond conventional approaches by introducing a performance evaluation framework based on machine learning-driven linear regression models, significantly improving the monitoring and supervision of PV systems. As a result, the cloud-based monitoring system derived from this study not only reduces operational costs but also enables accurate photovoltaic management across diverse regions by leveraging available meteorological parameters. The concept of remote microgrid is introduced for energy dispatch in the national interconnected system, where energy resources are optimized through a renewable energy system in different areas not close to the place of demand consumption. Additionally, it facilitates the optimization of productivity and collaboration on a global scale through Internet connectivity.
2. Methodology
2.1. Monitoring and data acquisition
Devices and equipment connected in IoT networks transfer their data unnecessarily in person-to-person or person-to-computer interaction. That is, the communication is carried out through the gateways of the physical servers. This data is filtered and later transmitted to other devices and software applications [15]. This section presents the methodology and data acquisition approach proposed for this study. Initially, data acquisition is conducted utilizing a Supervisory Control and Data Acquisition (SCADA) system, employing a LabVIEW data logger and a dedicated weather station. This enables the collection of data, which is subsequently recorded in the primary server of the microgrid. Within the server, the SCADA system assumes responsibility for the following essential processes:
- -
- Retrieval of data from the Modbus TCP/IP communication protocol.
- -
- Storage of acquired data in a Citadel database.
- -
- Visualization of the recorded data through a tailored SCADA configuration.
The SCADA main interface empowers users to actively monitor and exercise control over the operational states of the entire power system, including individual equipment components within the installation. Additionally, it facilitates the supervision and regulation of pivotal actions such as the opening and closing of primary switches. However, due to security considerations, external network monitoring of the microgrid is strictly prohibited.
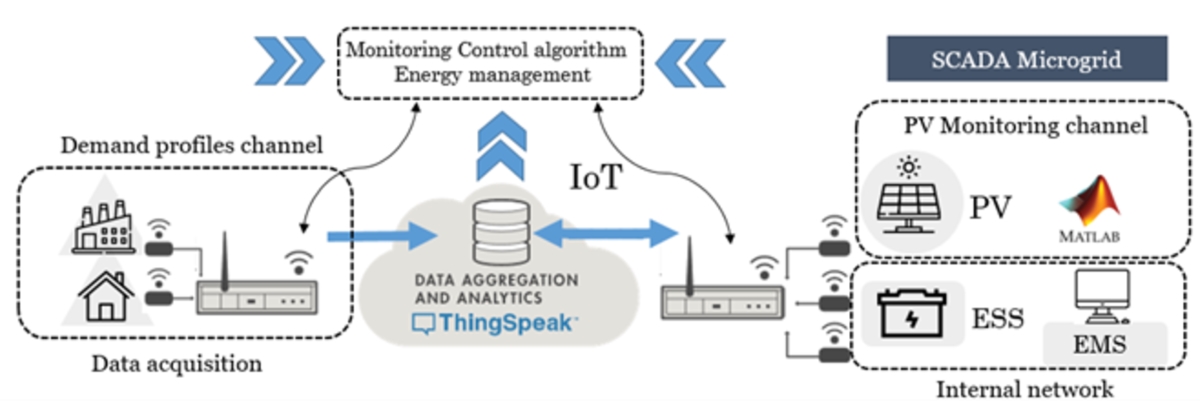
Consequently, this study endeavors to offer a compelling solution to circumvent this prevailing limitation. Figure 1 exemplifies the proposed diagram, outlining an effective monitoring framework for the PV system by leveraging the remarkable capabilities of ThingSpeak. In this context, a parallel program is strategically deployed to seamlessly acquire data from the SCADA system via MATLAB, leveraging the Modbus communication protocol as an intermediary conduit. Subsequently, this acquired data is effectively transmitted to the IoT web platform, augmenting the overall monitoring capability and enhancing data accessibility [16]. This setup establishes three communication channels through the ThingSpeak open access platform. In the first instance, the data are obtained from the meteorological station to later establish online monitoring of the photovoltaic system of the microgrid on channel two. The third channel establishes a data acquisition of energy consumption demand profiles of a home. Which is located in a different area and far from the microgrid.
It should be noted that the transfer of data information is established in an external network of the microgrid through an access point, which allows the visualization and monitoring of the data from any Internet connection point. However, it is limited for operation and control due to safety issues. The algorithm for the control and management of the microgrid can be programmed in the internal code of the microgrid.
2.2. PV system supervision
The fluctuation of PV power generation is influenced by several environmental factors, including temperature, irradiance, relative humidity, and geographical location. By considering these factors, it becomes possible to estimate the behavior of PV power [17]. A predictive approach for PV power estimation is based on a machine learning-driven linear regression model, enabling the monitoring of PV systems [18]. This model utilizes parameters such as solar radiation and ambient temperature, and it is mathematically represented by the following Equation (1) [19]:
where is the value resulting from the model, ambient temperature and the solar radiation during a time . This value is compared with the photovoltaic power obtained in real time from the microgrid. In which, a comparison is automatically generated with the linear regression model of equation 1. This information is recorded in the ThingSpeak IoT platform in real time and allows optimal monitoring of the generation and supervision of the microgrid.
2.3. Monitoring Energy Demand Consumption
The Pzem004t energy monitor acquires data from the loads connected to the terminals, including values of power (W), voltage (V), current (A), energy (kWh), frequency (Hz) and power factor. This device also includes a TC voltage and current sensor that allows measurements of 127/220 V voltage and current up to 100A. This tool was assisted by the ESP32 module to monitor electrical energy consumption [20,21,22]. In site monitoring, the I2C serial communication protocol is used to display on an LCD screen. Additionally, the parameters mentioned above are sent to the ThingSpeak server via Wi-Fi for monitoring. Figure 2 presents the schematic diagram for data acquisition from the demand side through the ESP32 microcontroller that functions as an access point for sending IoT data to the network.
2.4. Energy management model for a remote microgrid
Because most renewable resources are not always close to the place of consumption of energy demand. A remote microgrid strategy is proposed, which is integrated into the national interconnected system. In this way, resources and energy dispatch can be optimized through information processing in real-time. The information obtained from different IoT devices on renewable generation and energy consumption demand in different parts can be managed through a data communication algorithm to take advantage of the generation and consumption during different hours of the day. Strategic planning is important for the management of resources in demand, which is why energy storage systems can contribute in case of excess or lack of generation. In the following equation, storage based on demand can be managed.
where is the reference power to the batteries, photovoltaic power generated from the microgrid, power consumed from demand. Based on the requirement of energy demand, the batteries can supply active or reactive power. The values of the state of charge SoC of the battery are controlled by the maximum and minimum limits. In this way, if it is outside the established range, I return the reference value as 0. In Equations 3 and 4, this characteristic of the battery is expressed. reference power for batteries:
A negative reference power value is assigned when PV generation exceeds demand and is allowed by charging the batteries in excess of generation. On the contrary, if the generation is less than the demand, a positive power value is assigned to discharge the batteries towards the grid. During this process, control of the SOC of the batteries oscillating around 50% is maintained. Which implies maintaining a balance of generation and demand autonomously.
3. Case Study
This section presents an experimental case study aimed at validating the proposed algorithm. The study was conducted at the Microgrids Laboratory of the University of Cuenca (CCTI-B), utilizing a state-of-the-art testbed comprising a 15 kWp polycrystalline solar panel system. The system consists of 60 polycrystalline panels arranged in a 15x4 configuration (parallel-series) and is seamlessly integrated with an independent two-level GPTech inverter featuring advanced maximum power point tracking capabilities, as detailed in Table 1 [16,23]. It should be emphasized that the inverter operates at a distinct voltage level (440 VAC) compared to the primary electrical grid (220 VAC). All interconnected components are seamlessly synchronized with the public distribution grid, ensuring reliable and efficient power flow. Moreover, to facilitate comprehensive monitoring and analysis, a dedicated weather station located within the laboratory premises effectively captures crucial environmental parameters such as solar radiation, temperature, humidity, wind speed, and wind direction. The microgrid configuration and key equipment installations are visually depicted in Figure 3, providing a holistic view of the system under investigation.
The algorithm designed for the comprehensive monitoring of the PV system was meticulously implemented using advanced script code in MATLAB. The algorithm initiates by activating a timer to ensure the periodic execution of essential processes. Subsequently, a robust Modbus communication framework is established, enabling seamless retrieval of the designated power value from the communication port. Simultaneously, leveraging a sophisticated serial communication protocol, the algorithm efficiently acquires crucial data pertaining to solar radiation and temperature from the dedicated weather station, effectively interfacing with the SCADA system. The acquired data is meticulously fed into a meticulously crafted linear equation model, specifically tailored for precise estimation of the PV power. Finally, to facilitate streamlined data management and dissemination, the algorithm seamlessly transmits the processed data to the designated ThingSpeak channel, ensuring a seamless and reliable data flow. The intricate implementation and workflow of the algorithm exemplify the technical prowess and meticulous attention to detail that underpins its superior performance and reliability.
| Algorithm: PV System online monitoring |
|
Start TimerVal=tic 1. Modbus communication whilet=1:N iterations m=modbus(Transport,, 'Port',Name,Value) Ppv=read(m,'holdingregs',address1,count) 2. Weather station data Reading data=textread('data.csv','','delimiter',',','emptyvalue',NaN) sr(t)=str2num(data{position 1}) tp(t)=str2num(data{position 2}) 3. Linear Regression Model Equation Ppvm=0.0118tp(t)+0.0999sr(t)1.1393 4. IoT communication thingSpeakWrite(channelID,data,'WriteKey',writeKey) break end |
The algorithm for the channel for the energy management model is described below as indicated in Section 2.4.
| Strategy 1: Energy management model |
|
1. Data Input: , while t=1:N iterations 2. Start TimerVal=tic 3. Start Modbus communication m = modbus(Transport,'Port',Name,Value) 4. Read data from a Modbus server read(m,target,address,count,serverId,precision) 5. Write data to a ThingSpeak Channel 1 thingSpeakWrite(channelID,data,'WriteKey',writeKey) 6. Read data stored in ThingSpeak Channel 2 thingSpeakRead(channelID, 'Fields',[1,4], ReadKey='channel Read API key') 7. Execution of MATLAB script Control algorithm If else end 8. Perform a write operation to the connected Modbus server SC value write(m,target,address,values,serverId,'precision') end |
On this SCADA screen there is the general synoptic of the microgrid through which the user can monitor and command the operating states of total powers of each of the equipment in the installation, also monitor and command the opening and closing of the switches main. On the other hand, in the communications panel there is the communications synoptic in which the connection and disconnection states of all the equipment connected to the Modbus TPC/IP network can be monitored. The aforementioned algorithm is implemented as pseudocode in the MATLAB script and seamlessly integrated with the laboratory's SCADA system for rigorous testing and evaluation. Figure 4 visually presents a screenshot of the SCADA system's main menu, prominently displaying the successful implementation of the algorithm [16]. This integration show cases the robustness and versatility of the algorithm, enabling effective communication and interaction between the PV system and the SCADA infrastructure. The pseudocode implementation, coupled with its seamless integration into the SCADA system, exemplifies the meticulous attention to detail and technical proficiency employed in this advanced and sophisticated framework.
4. Results and Discussion
This section presents the outcomes of the proposed experiment. Initially, the data acquired from the meteorological station is gathered and stored in a database. These data are illustrated in Figure 5, revealing the maximum solar irradiance value, which can reach up to 1200 W/m2, and the temperature range of 12 to 20 °C. It is noteworthy to mention that the case study is situated in close proximity to the equator, where distinct seasons do not exist throughout the year. Consequently, the behavior of solar irradiance and ambient temperature remains relatively constant. To perform the monitoring of the PV system, we set up 4 channels on the ThingSpeak platform, displaying solar irradiance (W/m2), ambient temperature (°C), model PV power (kW) generated by the monitoring model from equation (1), and real PV power (kW) generated in the laboratory, as shown in Figure 5.
To conduct a more rigorous validation of the model, a comparison of three randomly selected days of stable PV generation is performed. It is observed that the supervision model can be effectively validated and represented by employing the linear regression model for the generated power (Figure 6a) and the power output derived from the model (Figure 6b). These findings substantiate that the behavior of a PV system can be accurately characterized and managed through the utilization of a model, thus enabling effective internet-based monitoring and control. Ultimately, Figure. 6c exhibits a significant correlation between the model derived from Eq. (1) and the observed real-world behavior. These highly promising outcomes signify a substantial advancement, paving the way for more stringent and resilient methodologies capable of facilitating real-time analysis of microgrid management and demand via network-based systems.
6. Conclusions
In this study, a comprehensive monitoring system for a PV system using IoT and ThingSpeak has been presented. This system was developed and tested in a laboratory microgrid setting, where the PV system is integrated with other generation and storage systems, as well as the electrical grid. By leveraging IoT technologies and the capabilities of ThingSpeak, real-time monitoring and data acquisition from the PV system and its interconnected components were achieved.
The monitoring system allows for the seamless integration of the PV system with other energy generation and storage systems, enabling efficient management and control of the entire microgrid. Through the use of ThingSpeak, data from the PV system, including solar radiation, temperature, and power generation, can be collected, analyzed, and visualized in a user-friendly manner.
This case study demonstrates the practical application of IoT and cloud-based platforms, such as ThingSpeak, in the monitoring and management of PV systems within a microgrid context. The integration of multiple energy sources and the electrical grid presents a complex operational environment, and the developed monitoring system provides valuable insights into the performance and behavior of the PV system in this context.
By utilizing IoT and ThingSpeak, the monitoring system offers enhanced visibility, real-time data analysis, and remote accessibility, facilitating efficient decision-making, optimization of energy resources, and proactive maintenance of the PV system. Such monitoring systems have the potential to contribute to the advancement of renewable energy integration and the effective management of remote microgrids.
Further research and development in this field are essential to explore additional functionalities, improve system reliability, and validate the scalability of the monitoring system for real-world applications.
Author Contributions
Conceptualization, P.A, D.B. and E. V.-A; data curation, A. C. and F. S.-S.; formal analysis, P.A., and D.B.; funding acquisition, P.A.; investigation, E. V.-A, P.A., and D.B.; methodology, E. V.-A., P.A., and F. S.-S.; project administration, P.A.; resources, A. C.; software, D.B., and P.A.; supervision, D.B.; visualization, F. S.-S. and E. V.-A; writing – original draft, D.B., P.A. and A. C.; writing – review & editing, P.A., D.B. and F. S.-S.
Funding
This research received no external funding.
Acknowledgments
The authors thank Universidad de Cuenca for easing access to the facilities of the Microgrid Laboratory of the Centro Científico Tecnológico y de Investigación Balzay (CCTI-B), for allowing the use of its equipment, and for authorizing its staff the provision of technical support necessary to carry out the experiments described in this article.
The author Paul Arévalo thanks the Call for Grants for the Requalification of the Spanish University System for 2021-2023, Margarita Salas Grants for the training of young doctors awarded by the Ministry of Universities and financed by the European Union – NextGenerationEU.
Conflicts of Interest
The authors declare no conflict of interest.
References
- N. Kumari, Sakshi, S. Gosavi, and S. S. Nagre, “Real-Time Cloud based Weather Monitoring System,” 2nd Int. Conf. Innov. Mech. Ind. Appl. ICIMIA 2020 - Conf. Proc., pp. 25–29, Mar. 2020. [CrossRef]
- M. A. A. Razali, M. Kassim, N. A. Sulaiman, and S. Saaidin, “A ThingSpeak IoT on Real Time Room Condition Monitoring System,” 2020 IEEE Int. Conf. Autom. Control Intell. Syst. I2CACIS 2020 - Proc., pp. 206–211, Jun. 2020. [CrossRef]
- G. Chandrasekaran, N. S. Kumar, A. Chokkalingam, V. Gowrishankar, N. Priyadarshi, and B. Khan, “IoT enabled smart solar water heater system using real time ThingSpeak IoT platform,” IET Renew. Power Gener., 2023. [CrossRef]
- F. Sanchez-Sutil, A. Cano-Ortega, J. C. Hernandez, and C. Rus-Casas, “Development and Calibration of an Open Source, Low-Cost Power Smart Meter Prototype for PV Household-Prosumers,” Electron. 2019, Vol. 8, Page 878, vol. 8, no. 8, p. 878, Aug. 2019. [CrossRef]
- J. C. Hernandez, F. Sanchez-Sutil, A. Cano-Ortega, and C. R. Baier, “Influence of Data Sampling Frequency on Household Consumption Load Profile Features: A Case Study in Spain,” Sensors 2020, Vol. 20, Page 6034, vol. 20, no. 21, p. 6034, Oct. 2020. [CrossRef]
- A. Cano-Ortega, M. A. García-Cumbreras, F. Sánchez-Sutil, and J. C. Hernández, “A Platform for Analysing Huge Amounts of Data from Households, Photovoltaics, and Electrical Vehicles: From Data to Information,” Electron. 2022, Vol. 11, Page 3991, vol. 11, no. 23, p. 3991, Dec. 2022. [CrossRef]
- A. C. Ortega, F. J. Sánchez Sutil, and J. de la C. Hernández, “Power Factor Compensation Using Teaching Learning Based Optimization and Monitoring System by Cloud Data Logger,” Sensors 2019, Vol. 19, Page 2172, vol. 19, no. 9, p. 2172, May 2019. [CrossRef]
- A. Cano-Ortega and F. Sánchez-Sutil, “Performance Optimization LoRa Network by Artificial Bee Colony Algorithm to Determination of the Load Profiles in Dwellings,” Energies 2020, Vol. 13, Page 517, vol. 13, no. 3, p. 517, Jan. 2020. [CrossRef]
- J. R. K. K. Dabbakuti and B. Ch, “Ionospheric monitoring system based on the Internet of Things with ThingSpeak,” Astrophys. Space Sci., vol. 364, no. 8, pp. 1–7, Aug. 2019. [CrossRef]
- M. Gautam, S. Raviteja, S. Sivanesh, and R. Mahalakshmi, “Data Acquisition for Residential Energy Management Employing IoT Using ThingSpeak,” Proc. 2019 IEEE Reg. 10 Symp. TENSYMP 2019, pp. 272–276, Jun. 2019. [CrossRef]
- P. Kala, P. Joshi, S. Agrawal, L. K. Yadav, and M. Joshi, “Introduction to Condition Monitoring of PV System,” Adv. Intell. Syst. Comput., vol. 1096, pp. 169–187, 2020. [CrossRef]
- S. Kang and I. Lee, “Implementation of PV Monitoring System Using Python,” Int. Conf. Adv. Commun. Technol. ICACT, vol. 2019-Febru, pp. 453–455, Apr. 2019. [CrossRef]
- A. Hamied, A. Mellit, M. Benghanem, and S. Boubaker, “IoT-Based Low-Cost Photovoltaic Monitoring for a Greenhouse Farm in an Arid Region,” Energies 2023, Vol. 16, Page 3860, vol. 16, no. 9, p. 3860, Apr. 2023. [CrossRef]
- Z. Didi and I. El Azami, “Experimental Analysis and Monitoring of Photovoltaic Panel Parameters,” Int. J. Adv. Comput. Sci. Appl., vol. 14, no. 2, pp. 151–157, Dec. 2023. [CrossRef]
- “Paessler - The Monitoring Experts.” Accessed: Nov. 12, 2023. [Online]. Available: https://www.paessler.com/.
- J. L. Espinoza, L. G. Gonzalez, and R. Sempertegui, “Micro grid laboratory as a tool for research on non-conventional energy sources in Ecuador,” 2017 IEEE Int. Autumn Meet. Power, Electron. Comput. ROPEC 2017, vol. 2018-Janua, pp. 1–7, Jan. 2018. [CrossRef]
- E. R. E. Kelebekler, “A wireless monitoring system for monocrystalline PV system,” Adv. Energy Res., vol. 7, no. 2, pp. 123–134, 2020. [CrossRef]
- P. Arévalo, D. Benavides, M. Tostado-Véliz, J. A. Aguado, and F. Jurado, “Smart monitoring method for photovoltaic systems and failure control based on power smoothing techniques,” Renew. Energy, vol. 205, pp. 366–383, Mar. 2023. [CrossRef]
- D. Benavides et al., “Method of monitoring and detection of failures in PV system based on machine learning,” Rev. Fac. Ing. Univ. Antioquia, no. 102, pp. 26–43, 2022. [CrossRef]
- “2018 16th International Conference on ICT and Knowledge Engineering (ICT&KE),” 2018 16th Int. Conf. ICT Knowl. Eng., 2018.
- M. F. Akbar et al., “The assembling of electrical socket for electricity usage monitor and electronic device control with ESP8266 microcontroller basis,” AIP Conf. Proc., vol. 2169, no. 1, Nov. 2019. [CrossRef]
- J. Varela-Aldás, S. Silva, and G. Palacios-Navarro, “IoT-Based Alternating Current Electrical Parameters Monitoring System,” Energies 2022, Vol. 15, Page 6637, vol. 15, no. 18, p. 6637, Sep. 2022. [CrossRef]
- D. Benavides, F. Jurado, and L. G. González, “Data analysis and tools applied to modeling and simulation of a PV system in Ecuador,” Enfoque UTE, vol. 9, no. 4, pp. 1–12, Dec. 2018. [CrossRef]
Figure 1.
Representative diagram of microgrid online monitoring.
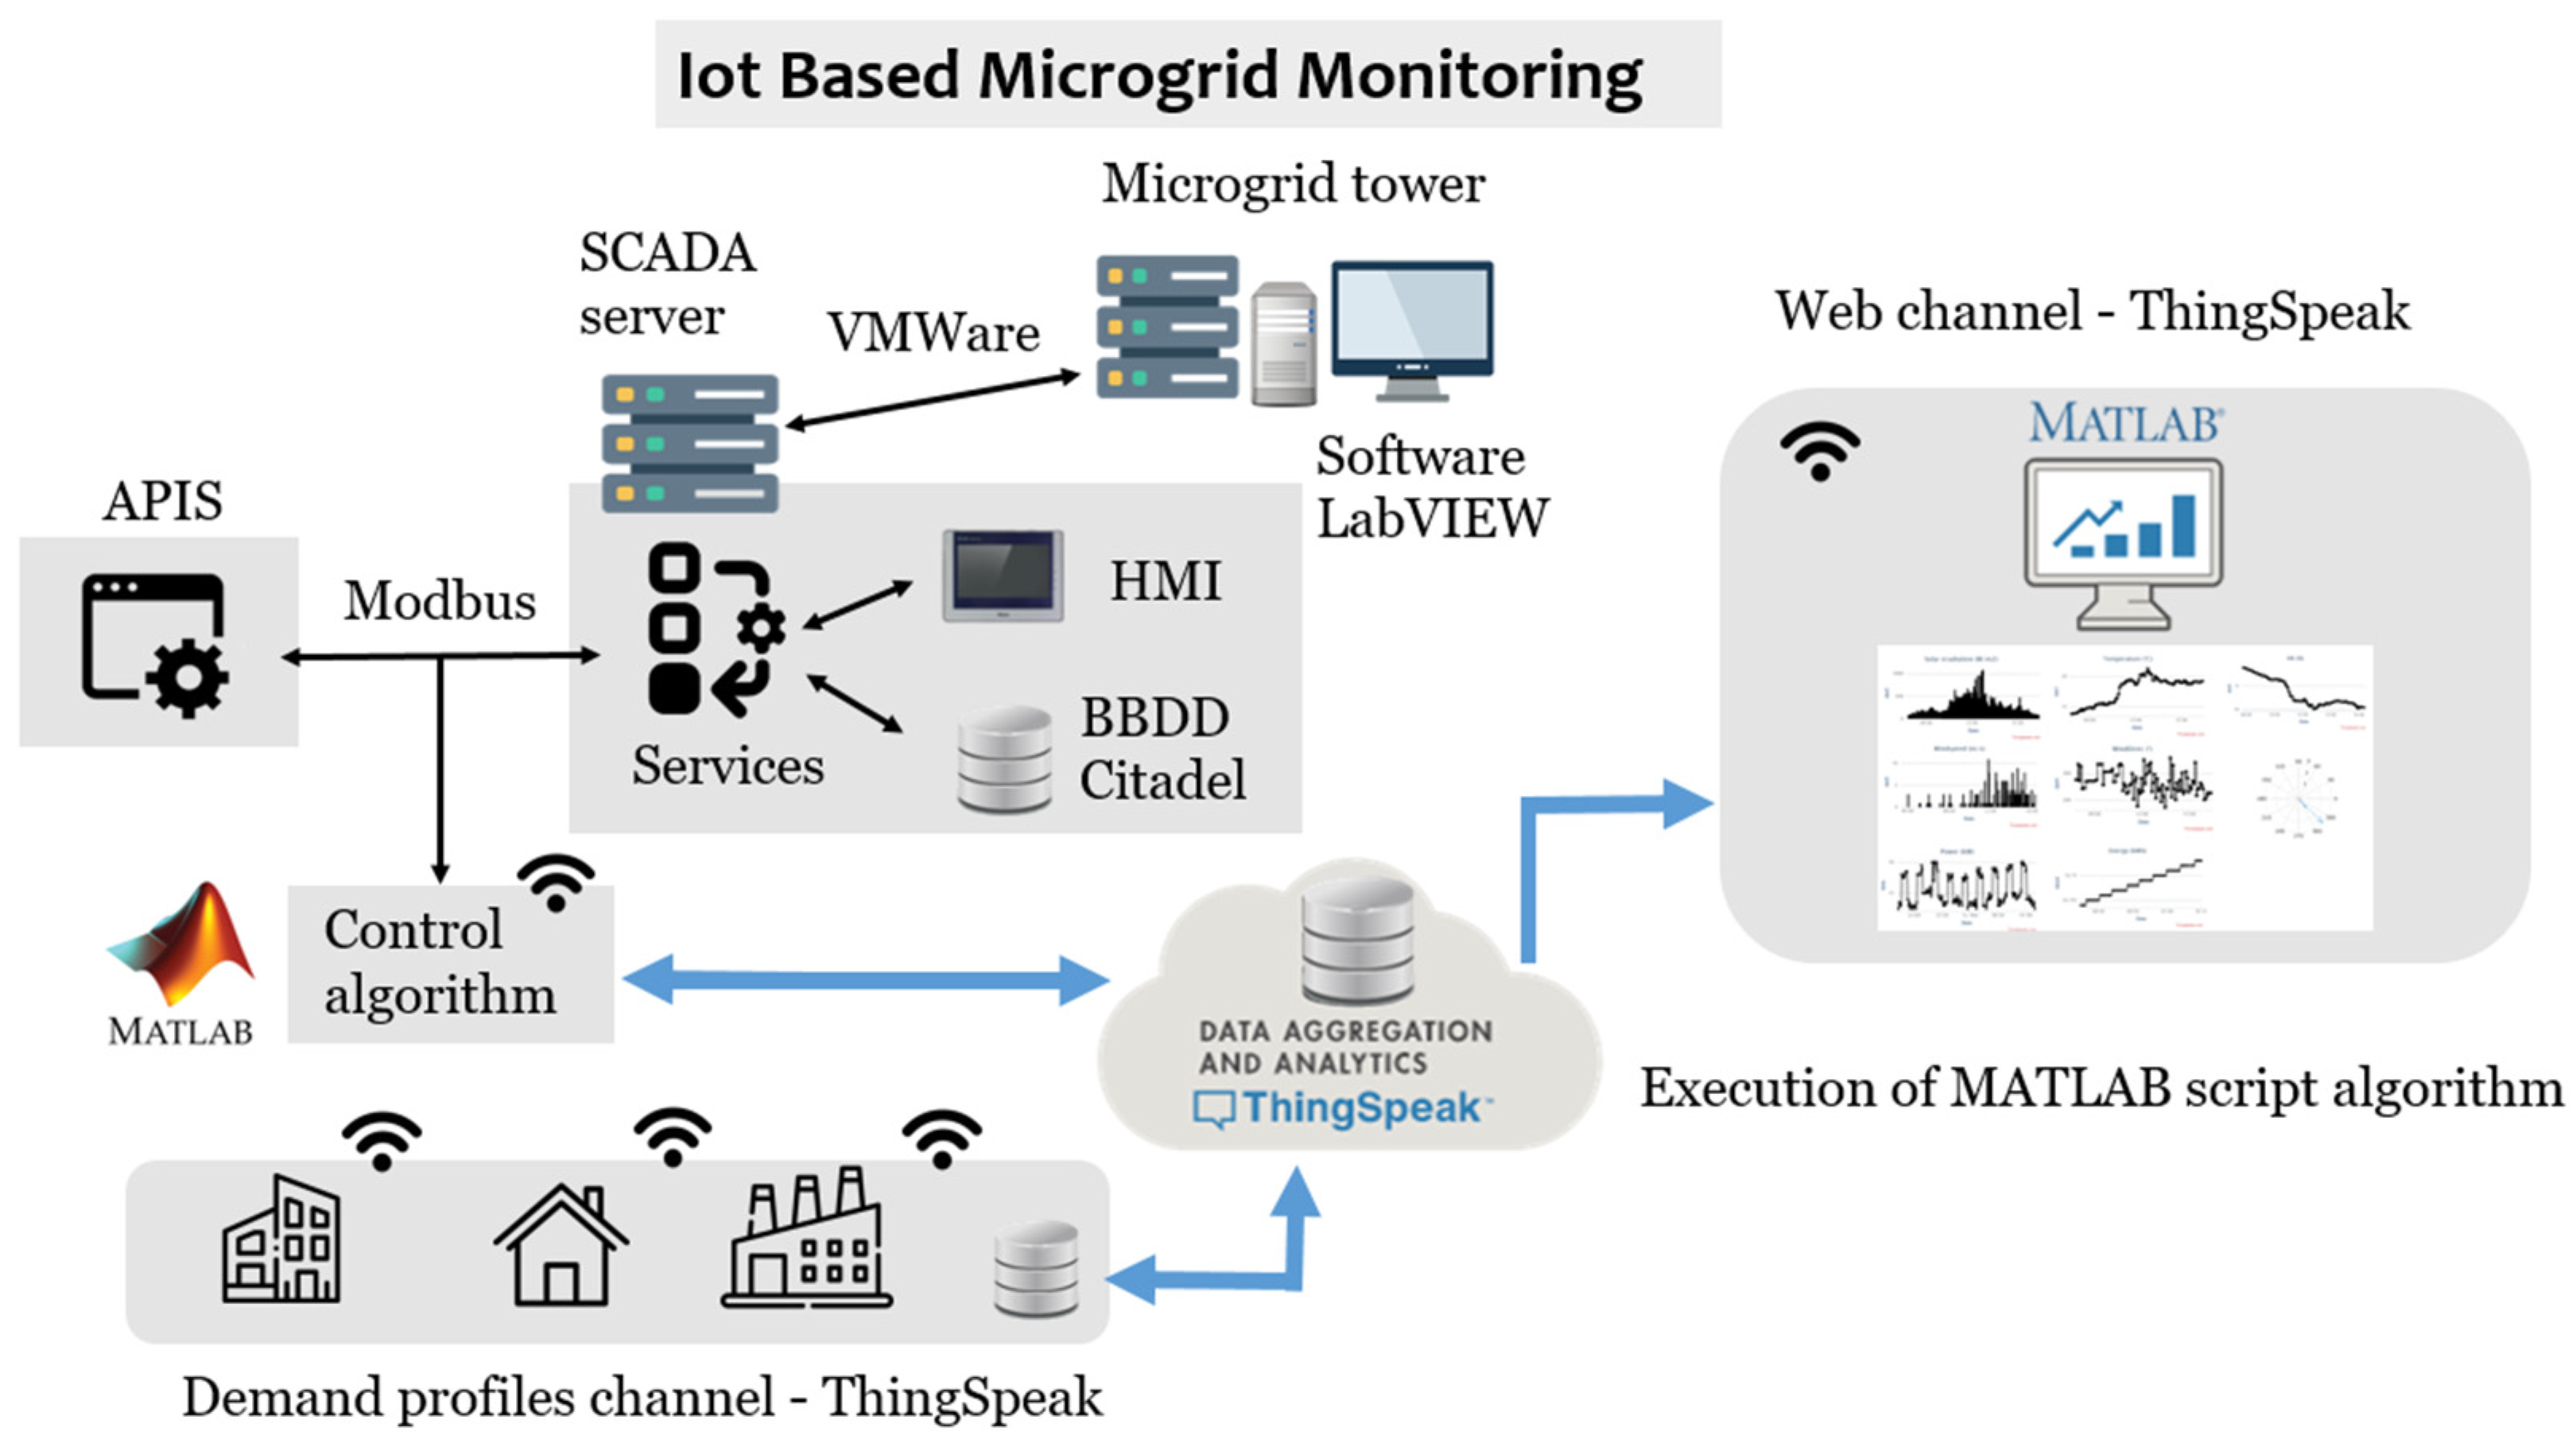
Figure 2.
Data acquisition for real-time demand consumption.
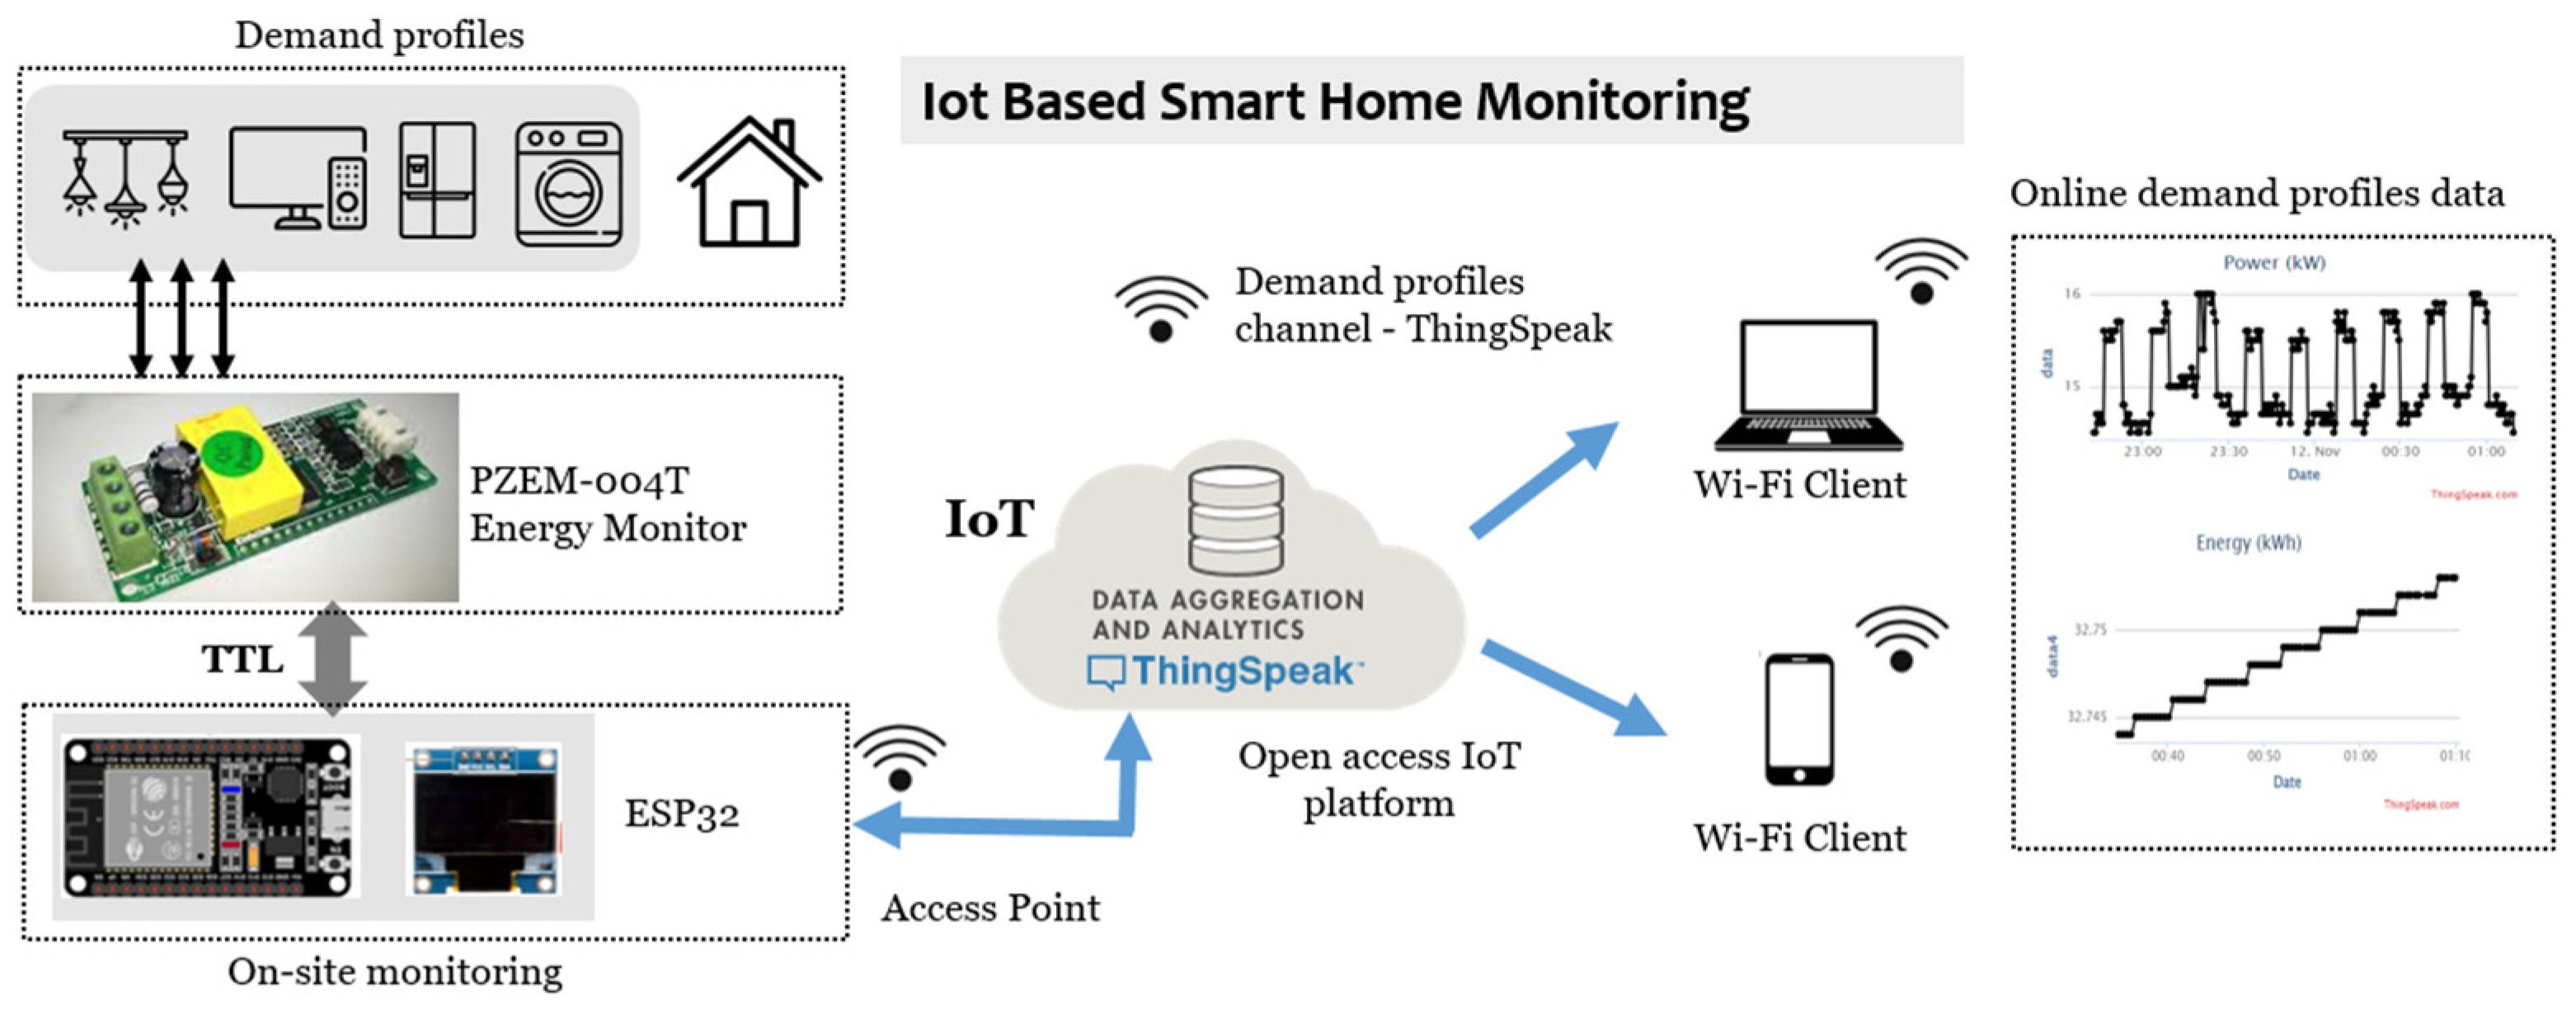
Figure 3.
Case Study: (a) Internal and external network configuration, (b) Microgrid Equipment.
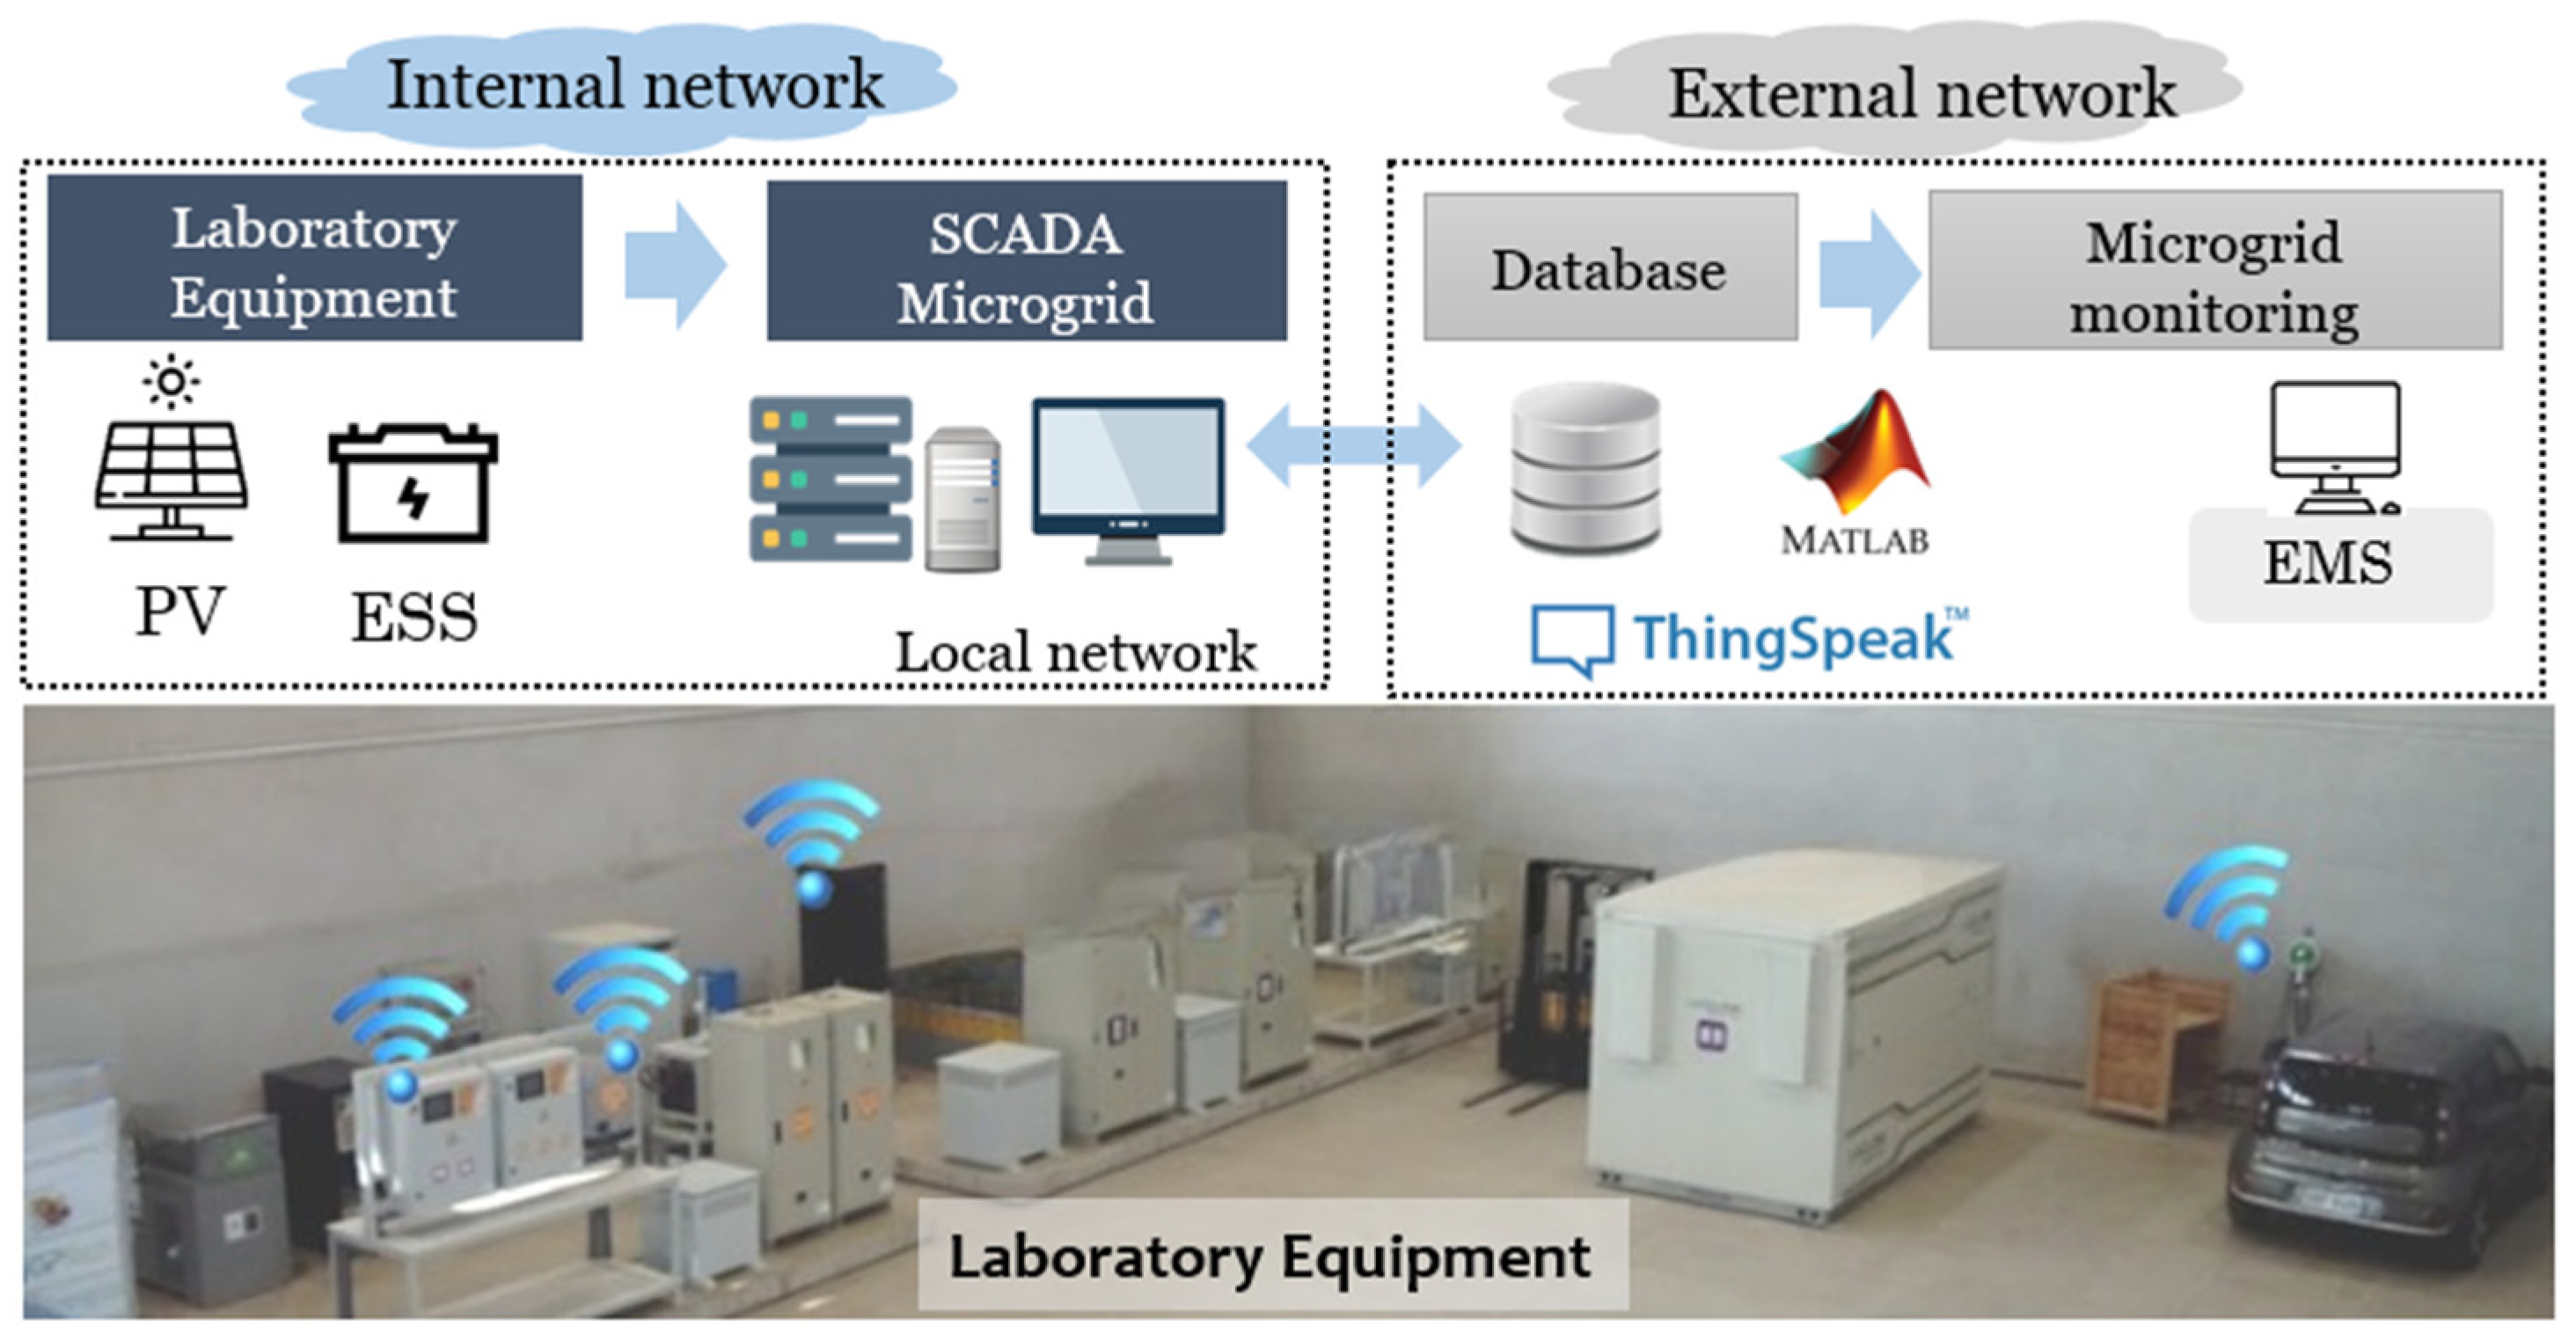
Figure 4.
Print screen HMI SCADA Control Center LabVIEW (a) General Symptom Microgrid (b) Communications Symptom.
Figure 4.
Print screen HMI SCADA Control Center LabVIEW (a) General Symptom Microgrid (b) Communications Symptom.
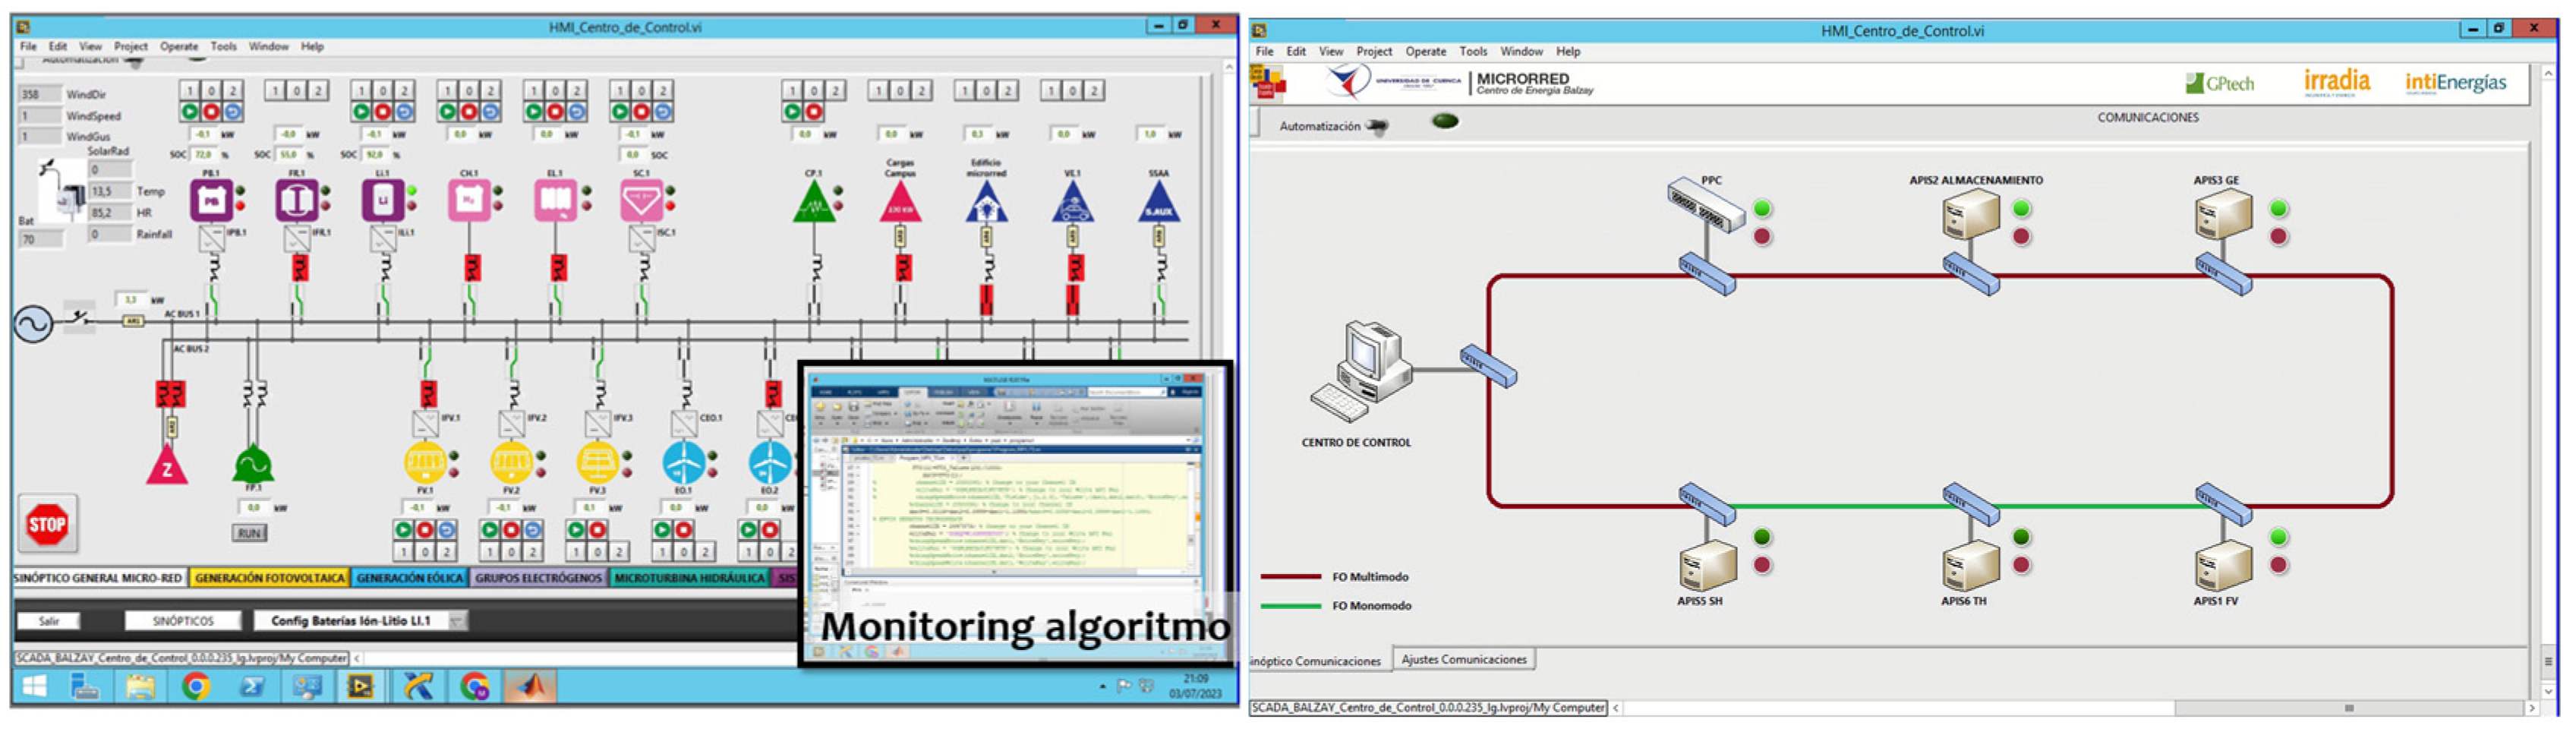
Figure 5.
Results of photovoltaic monitoring in real-time online.
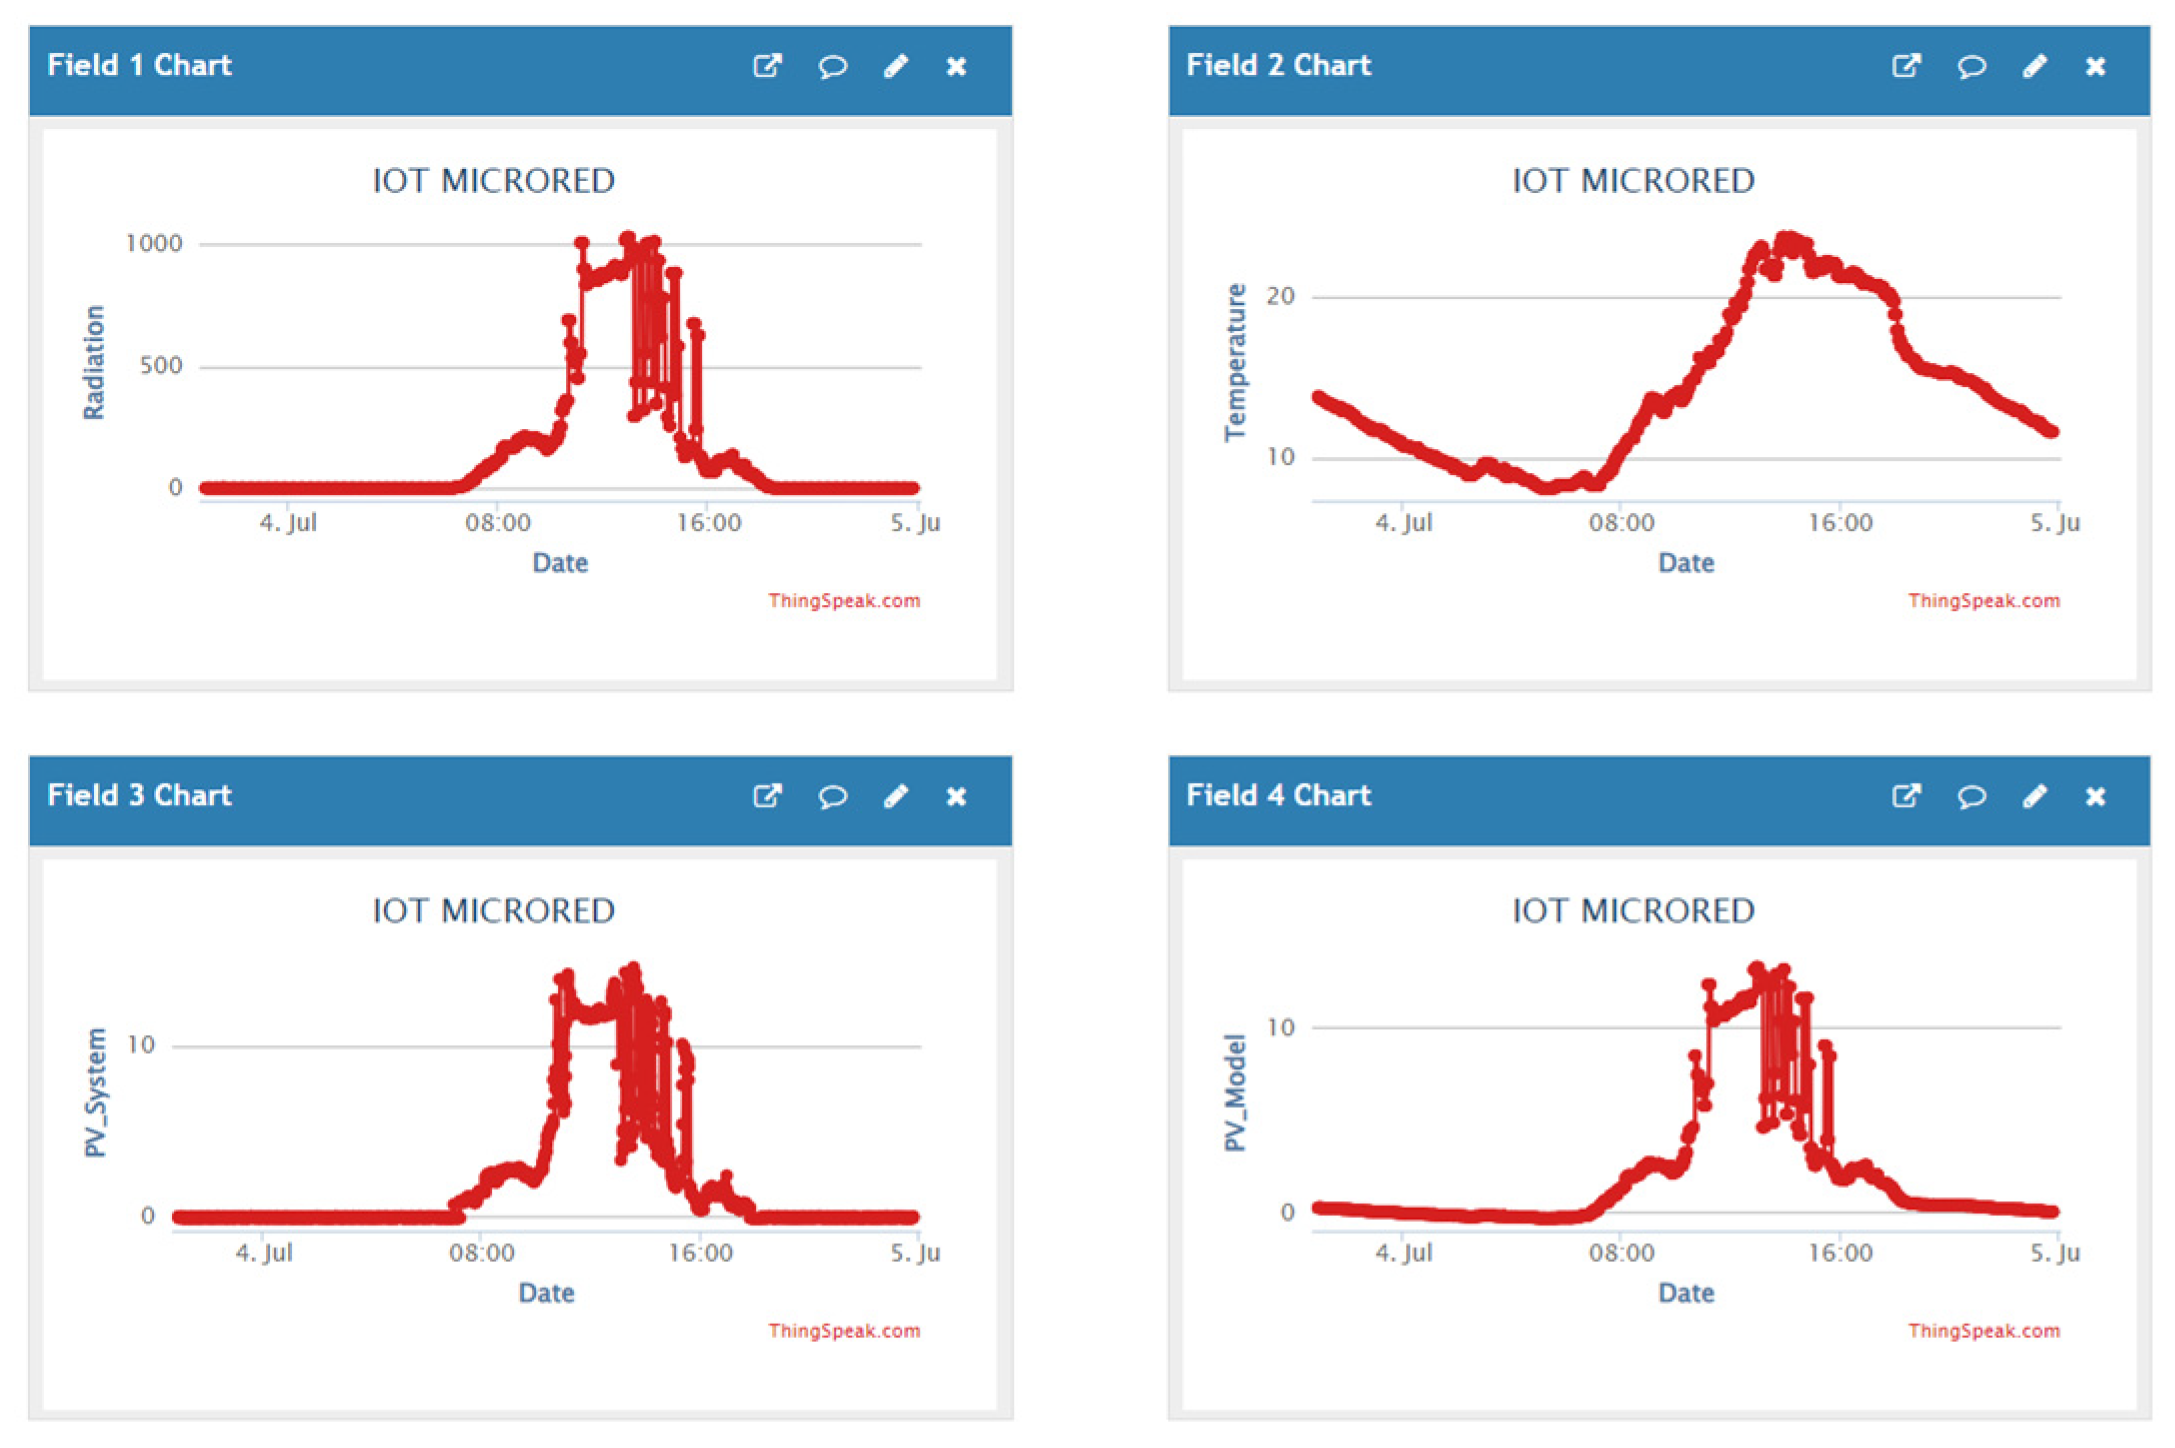
Figure 6.
Comparative result of three days actual PV generation (a) Real-time data, (b) Model data, (c) Model for daily supervision of PV systems.
Figure 6.
Comparative result of three days actual PV generation (a) Real-time data, (b) Model data, (c) Model for daily supervision of PV systems.
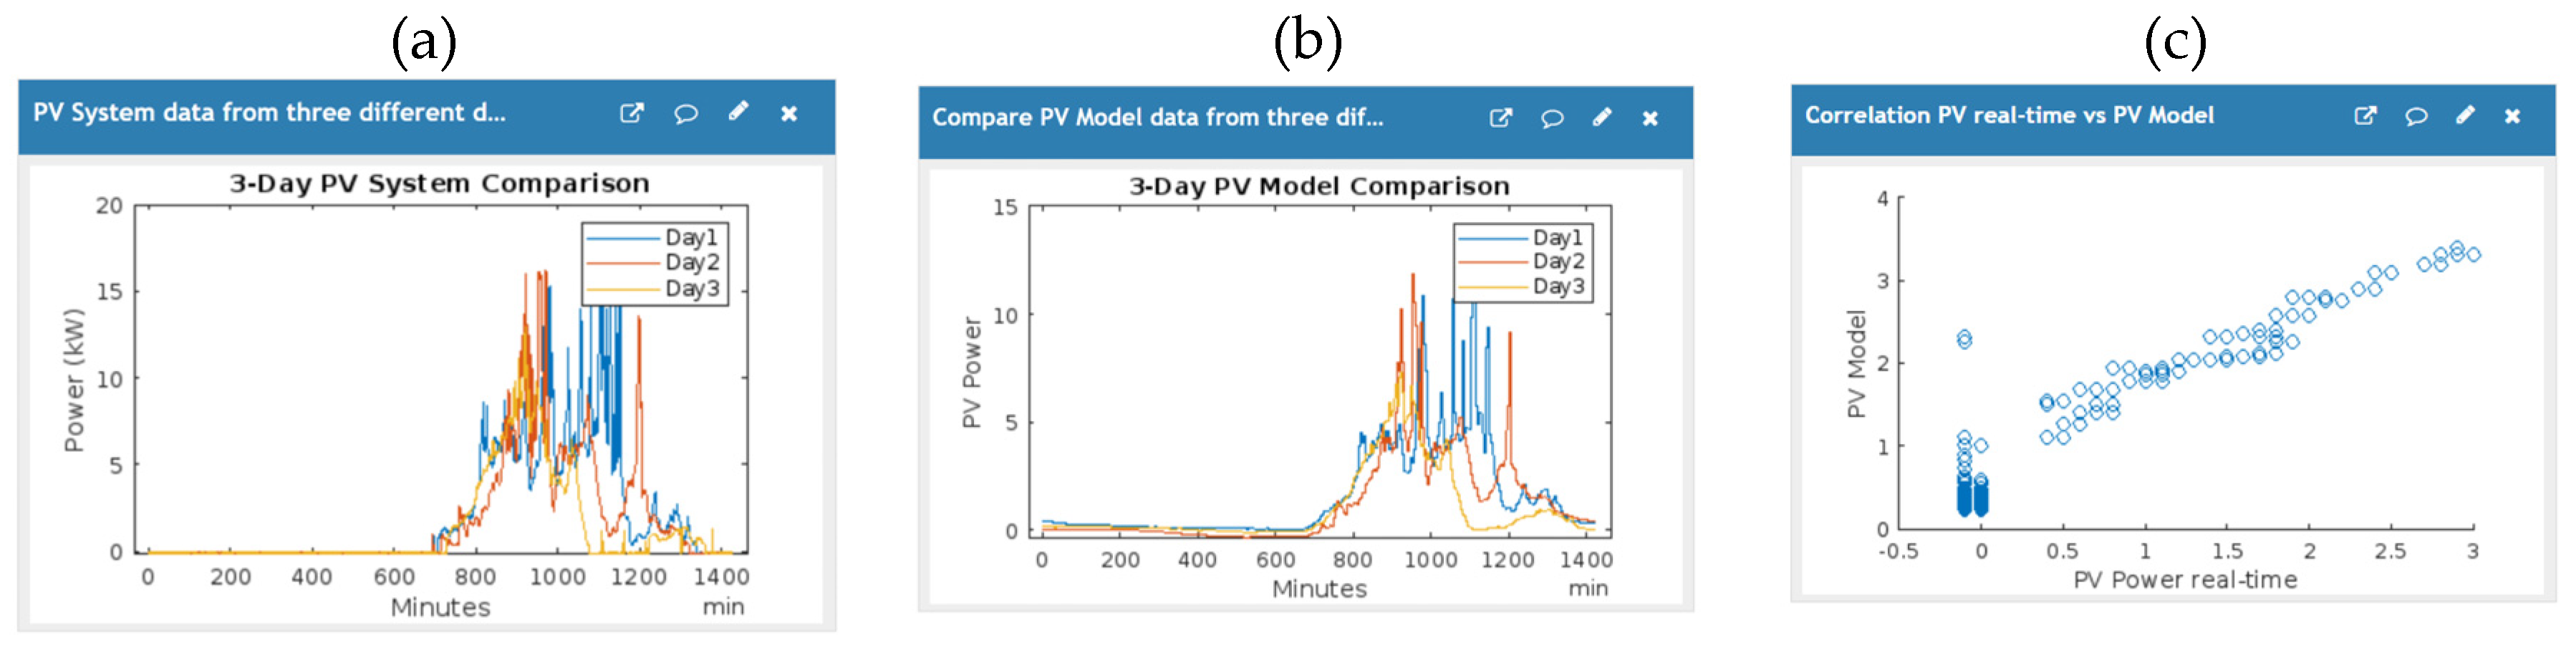
Figure 7.
IoT monitoring weather station variables in real-time: (a) Solar Irradiation, (b) Temperature, (c) HR, (d) Windspeed, (e), (f) WindDirection, (g) Demand, (h) Energy, (i) PV monitoring.
Figure 7.
IoT monitoring weather station variables in real-time: (a) Solar Irradiation, (b) Temperature, (c) HR, (d) Windspeed, (e), (f) WindDirection, (g) Demand, (h) Energy, (i) PV monitoring.
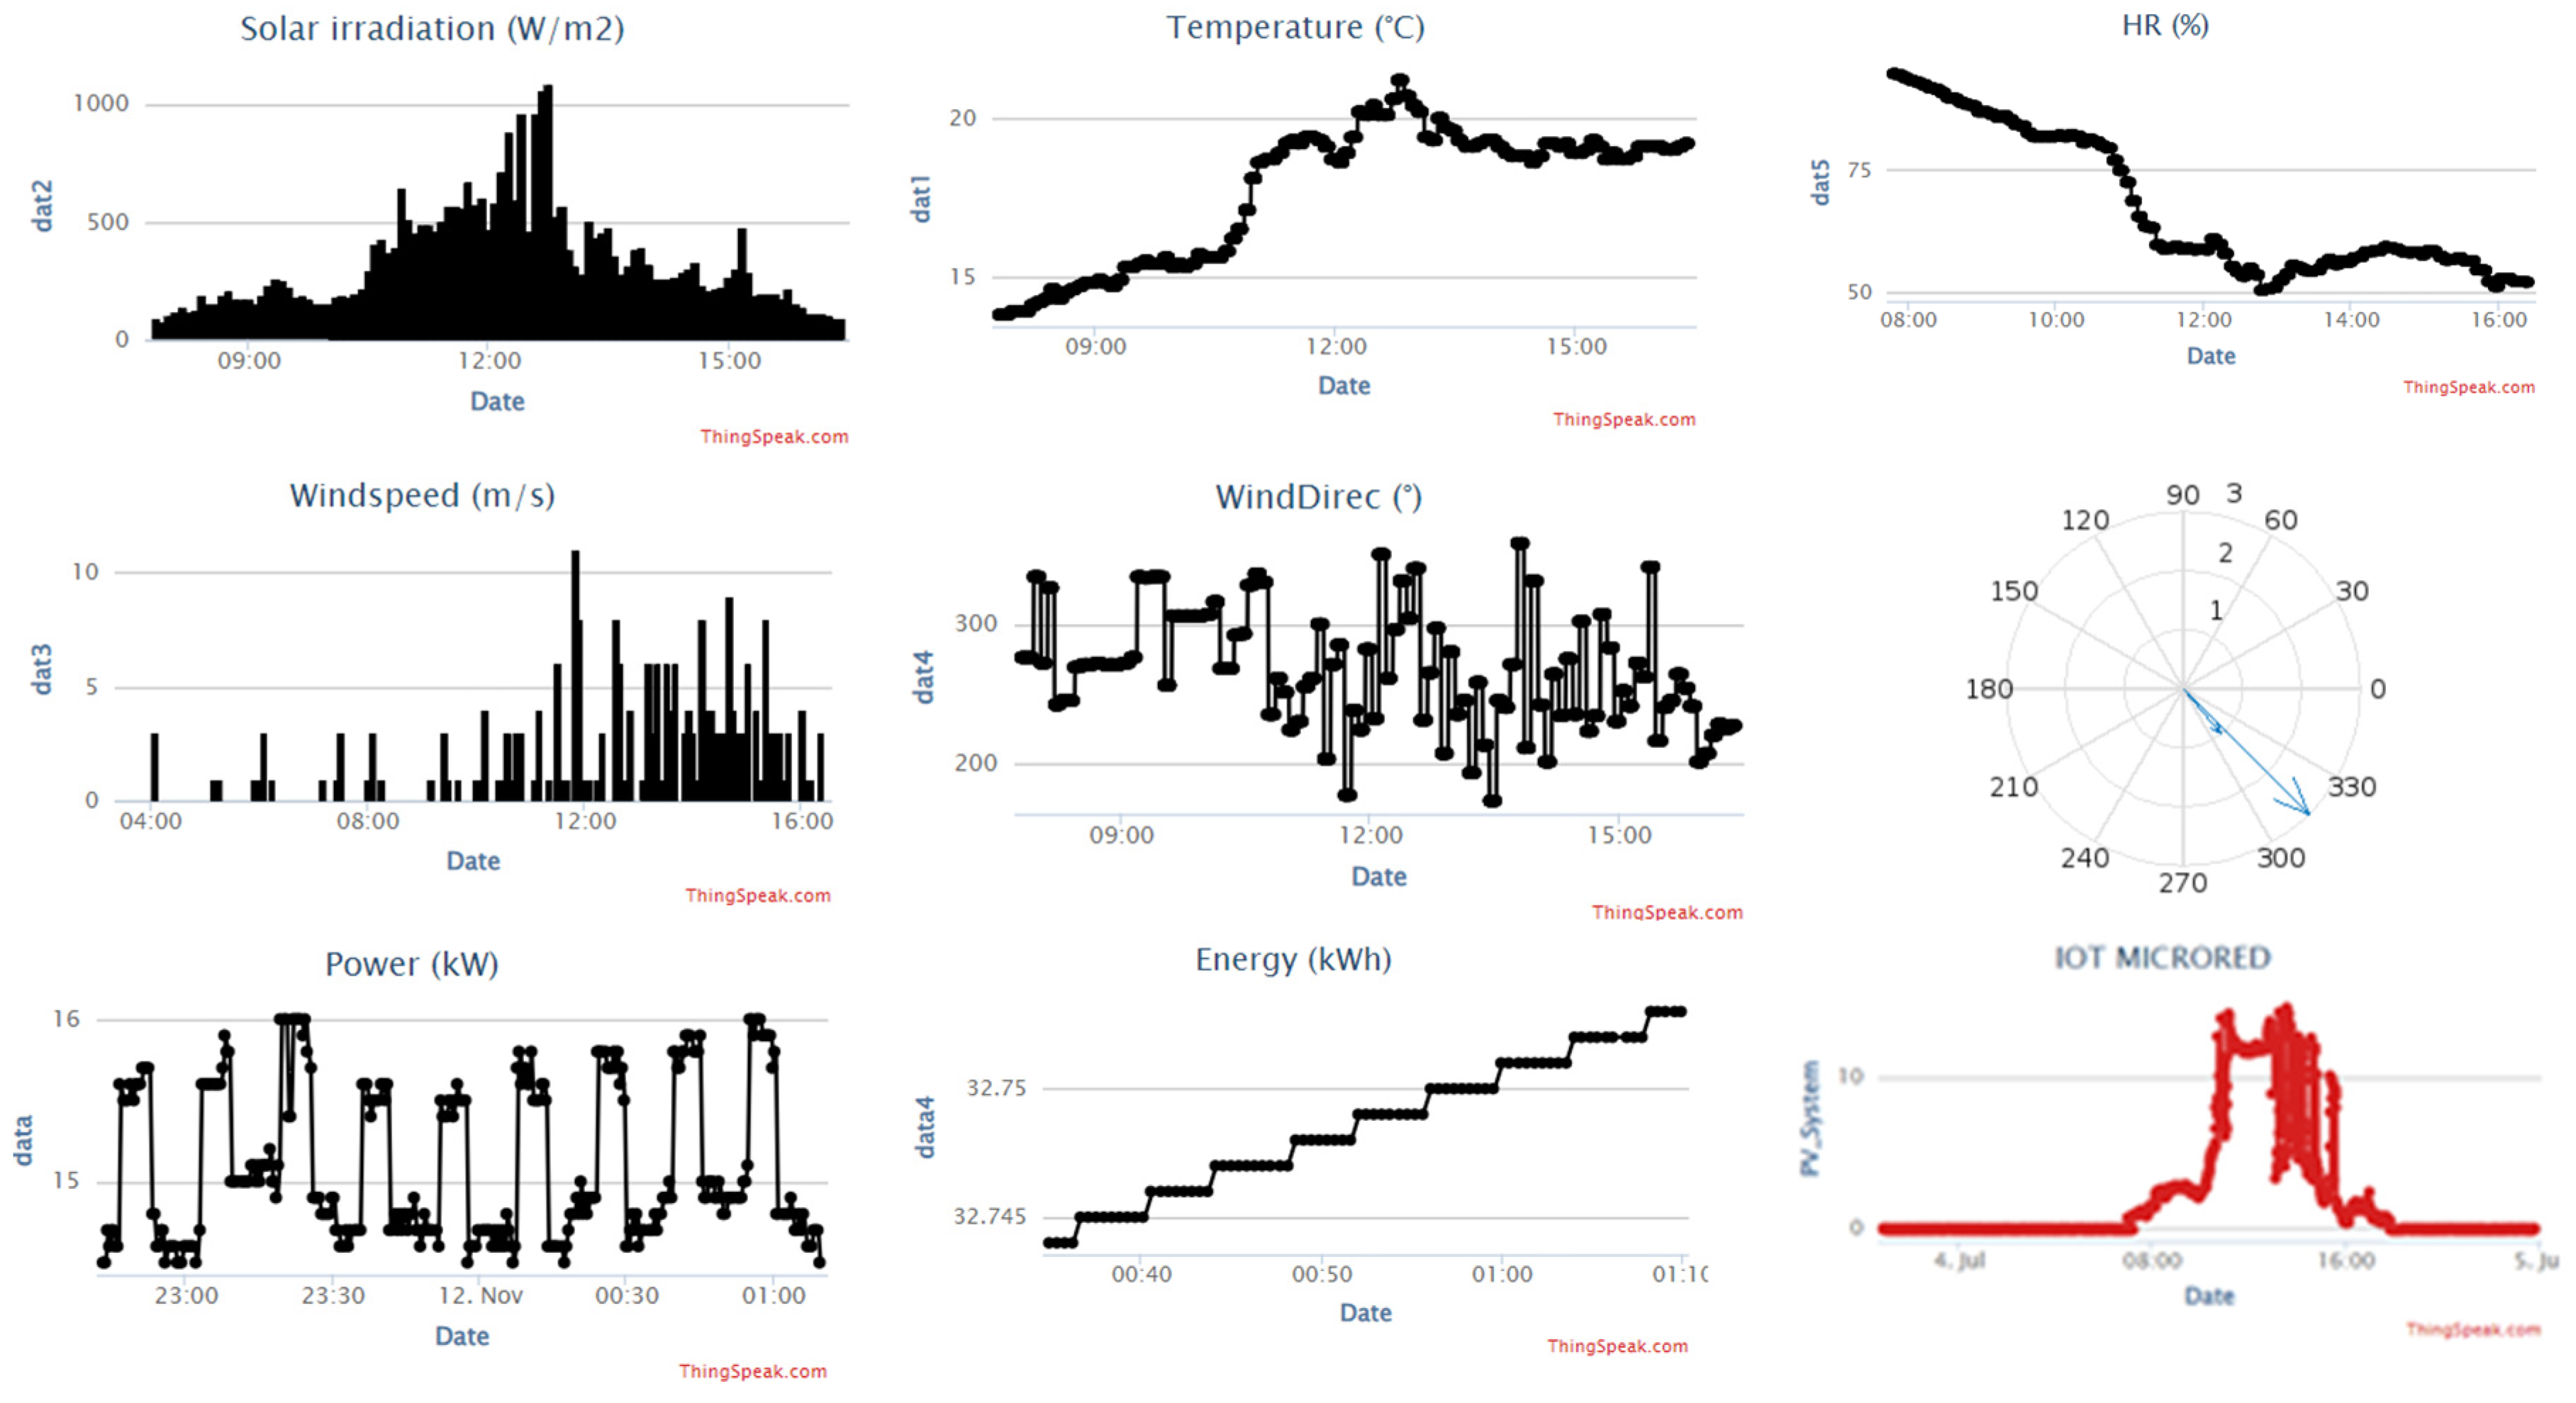

Table 1.
Characteristics of photovoltaic systems and energy storage system.
| Description | Panels | Model | Max. Current |
Max. Voltage |
Max. Power |
|---|---|---|---|---|---|
| PVS1 | 60 (15x4) Series-parallel |
Atersa A-250P |
35.78A | 553V | 15kW |
| Lithium Ion Battery |
11 cells | Samsung ELPT392 -0002 |
68.30A | 642V | 44kWh |
Disclaimer/Publisher’s Note: The statements, opinions and data contained in all publications are solely those of the individual author(s) and contributor(s) and not of MDPI and/or the editor(s). MDPI and/or the editor(s) disclaim responsibility for any injury to people or property resulting from any ideas, methods, instructions or products referred to in the content. |
© 2023 by the authors. Licensee MDPI, Basel, Switzerland. This article is an open access article distributed under the terms and conditions of the Creative Commons Attribution (CC BY) license (http://creativecommons.org/licenses/by/4.0/).
Copyright: This open access article is published under a Creative Commons CC BY 4.0 license, which permit the free download, distribution, and reuse, provided that the author and preprint are cited in any reuse.


