Submitted:
01 August 2025
Posted:
06 August 2025
You are already at the latest version
Abstract
Dynamic demand response (DDR) is the process of shifting power consumption towards periods of lower demand based on real-time energy pricing data. It is a flexibility measure utilised in the decarbonisation of the UK’s power system to reduce peak demand. Dynamic time-of-use (dTOU) tariffs, such as Agile Octopus, incentivise DDR by providing half-hourly electricity prices for each day. Through this incentive, households are offered the opportunity to reduce their energy costs by applying DDR to energy-intensive, deferrable loads. This paper presents an open-source, Internet of Things (IoT)-based system designed to automate DDR and streamline its implementation. The system identifies the period of lowest electricity prices and activates a relay during this period each day. For validation, the system was tested over a one-month experiment, which showed that, in a favourable scenario, it could reduce an appliance’s electricity costs by up to 44%. These results highlight the system’s potential to deliver substantial energy cost savings, while also encouraging households to participate in flexibility measures that alleviate pressure on the National Grid.
Keywords:
flexible demand
; demand-side response
; dynamic demand response
; dynamic pricing
; energy management
; IoT-based automation
; time-of-use tariffs
1. Introduction
Acknowledging the widespread losses to the environment resulting from human-caused climate change [1], the Paris Agreement [2] was established to limit global warming to 1.5°C – a threshold at which multiple climate tipping points (CTPs) are predicted to be triggered [3]. Such CTPs are environmental mechanisms that accelerate warming through positive feedback loops, thereby posing the risk of intensifying unpredictable climate change.
In recognition that this warming threshold could be exceeded by around 2040 [4] and to mitigate the risk of inducing CTPs, the UK aims to develop a fully decarbonised power system by 2035 and attain net-zero carbon emissions by 2050 [5]. Achieving these targets entails the deployment of low-carbon flexibility measures to manage and utilise an increasing number of intermittent, renewable energy sources, such as wind power [6,7], to keep the grid balanced with fluctuating demands.
One of these measures is a process called flexible demand. This is a form of demand response (DR) that is used to shift electricity usage towards periods of lower demand, often at times of greater renewable energy generation, to attenuate peak demand and ease pressure on the National Grid [8].
Methods of implementing flexible demand include preheating prevalent appliances such as conventional boilers and storage heaters [9] during times of greater energy surplus or by deferring mobile electrical demands [10], such as electric vehicle (EV) charging.
Dynamic demand response (DDR) builds upon flexible demand, offering improved adaptability to intermittent energy generation [11]. Whereas flexible demand is often implemented for static schedules that approximate periods of lower demand, DDR proactively manages energy consumption in response to real-time data, facilitating quicker responses to fluctuations in energy availability [12].
Driven by support and encouragement from regulatory frameworks such as the Office of Gas and Electricity Markets (Ofgem)’s smart meter rollout [13], dynamic time-of-use (dTOU) tariffs like Agile Octopus [14] financially incentivise the adoption of DDR amongst the population. In the application of DDR for households, it is typically used to manage loads in response to the half-hourly electricity rates provided by dTOU tariffs.
Amidst the UK’s ongoing cost-of-living crisis, which is compounded by rising energy prices, this incentive provides an opportunity for households to reduce their electricity costs by applying DDR to deferrable energy loads.
In making DDR more accessible, a key consideration is how the process can be implemented into a household without placing a burden on residents [15], as low-price periods for DDR are highly fluctuating in contrast to those of flexible demand. The solution presented in this paper is to automate DDR, facilitating energy loads to be shifted to periods of low demand at times when residents are unavailable.
Timed relays represent the first step towards automating DDR by providing a method of managing appliances while absent. They can either be scheduled regularly to provide power at the lowest electricity prices or to activate during a period when there is often low demand. Timed relays are straightforward to implement; however, they compel users to choose between convenience and optimal cost savings, as configuration of the relays to activate during low demand would require frequent manual input.
For a system to fully automate DDR, it must therefore be capable of processing real-time energy pricing data from dTOU tariffs and determining an optimal period for when an appliance should be activated. This multi-faceted function, which substitutes manual input with autonomous data acquisition, can be implemented through a dedicated Internet of Things (IoT)-based system – a network of interconnected devices [16].
The exact form of an IoT-based system is flexible, as identical processes can be driven by a range of components and software. However, fundamentally, an IoT-based system designed to automate DDR must include a computer that can actuate a relay in response to tariff data. Such systems can be integrated into an appliance’s internal power management architecture or implemented as a standalone unit that supplies power externally.
This paper showcases the latter form factor, which is suitable for automating existing appliances. For this purpose, commercially available electronics such as single-board computers (SBCs) and Wi-Fi-enabled smart relays present an accessible pathway to building a modular IoT-based system.
This paper proposes that implementing DDR can generate cost savings for households on dTOU tariffs while also supporting the decarbonisation of the National Grid. Subsequently, an IoT-based system was developed using commercially available electronics to provide a practical solution for households to automate DDR. Potential applications include the automation of conventional boilers, storage heaters, EV charging, Heating, Ventilation, and Air Conditioning (HVAC) systems, and battery storage. The system was validated over a one-month experiment, which showed that under favourable conditions, it could reduce an appliance’s electricity costs by up to 44%. These results highlight the system’s potential to deliver appreciable cost savings, while encouraging households to participate in flexibility measures that alleviate pressure on the National Grid.
2. Design
Figure 1 illustrates a diagram of the IoT-based system developed to automate DDR. This system’s form consisted of a control and a relay subsystem, each housing their main components, the SBC and smart relay, with their dedicated circuits, respectively.
The subsystems were designed to be physically separate and communicate through the Shelly Cloud. This preserved the option of operating multiple relay subsystems at different locations with one control subsystem, enabling cost-effective expansion of the system for multiple automated energy loads. Figure 2 and Figure 3 display the subsystems in their respective enclosures with a picture and a 3D render of the relay subsystem’s development circuit.
2.1. Process Overview
Calculations for the optimal period were executed by the control subsystem. It queried electricity prices from the Agile Octopus tariff’s API and processed them. It would then request the relay subsystem to provide power based on whether it was currently the period of lowest demand. In its secondary processes, the control subsystem also hosted a system interface, which was accessible through the local area network (LAN), and wrote to a display to show its status.
As the software required for these processes was designed to be undemanding, the control subsystem’s SBC only needed support for Python, internet connectivity, and a set of General-Purpose Input/Output (GPIO) pins for the display.
2.2. Control Subsystem Hardware Overview
For the control subsystem’s hardware, a Raspberry Pi 4B and, subsequently, a Pi Zero 2 W were evaluated, where the Pi Zero 2 W was found to be a more cost-effective SBC that retained full functionality. Other SBCs, such as the Radxa Zero 3W [18], emerged as viable alternatives to the Raspberry Pi models due to the system’s flexible hardware requirements.
2.3. Relay Subsystem Overview
Options for the relay subsystem’s components were also available, providing a choice between two configurations. For the first configuration, a Shelly 1PM Gen3 was utilised for its power monitoring capability and its integration with the Shelly Cloud. Its function was showcased while embedded into the circuit of a UK electrical socket, which presented a method of automating an existing outlet in a form factor fully contained within the outlet. In this first configuration, the relay system is identified as the Shelly relay and the circuit of the electrical socket that it is wired into.
The second configuration provided a more accessible pathway for deploying a relay subsystem, as its method of implementation does not require wiring. In this configuration, the Shelly smart relay is replaced by the Shelly Plus Plug, which can interface with electrical sockets without modification.
Comparing the two configurations, the relay subsystem in configuration 1 is entirely contained within the electrical socket; however, it requires wiring to the mains, reducing its accessibility and portability. In contrast, the relay subsystem for configuration 2 is a standalone component that is more portable and does not require wiring; however, it is external to the electrical socket. Ultimately, both configurations present suitable methods of automating an appliance and can be interchanged based on what is required from the system.
3. Build Instructions
The following instructions offer guidance on recreating configuration 1 of the IoT-based system, which utilised the main components shown in Table 1. This includes using the Raspberry Pi Zero 2 W for the control subsystem due to its lower cost, and the Shelly smart relay.
A guide to configuration 1 is presented as it requires additional build steps compared to configuration 2, involving wiring a smart relay into an electrical circuit. For clarity, the guide is divided into two sections, which focus on hardware and software, respectively.
3.1. Control Subsystem Hardware Build Instructions
In Figure 5, the control subsystem’s components are mounted to the 3D-printed enclosure using eight M2 screws. An SD card preloaded with Raspberry Pi OS is then loaded into the Pi.
Next, the components are wired according to the connections in Table 3.
After the components are connected, the enclosure is folded inward along its live hinges, and the endcaps are press-fitted to both ends of the enclosure.
3.2. Relay Subsystem Hardware Build Instructions
The Shelly relay is integrated into the circuit of an electrical socket according to the wiring diagram displayed in Figure 6.
3.3. Software Build Instructions
Scripts for the software are provided as Supplementary Materials. After enabling I2C for the Raspberry Pi, the following commands are used to install the software from the Shelly-Automated-Agile-Octopus GitHub repository.
- chmod +x Install.sh
- sudo ./Install.sh
- cd /home/pi/shelly
- nano config.ini
- Shelly Cloud and tariff details are to be entered into the config.ini. The length of the optimal period may also be configured.
- 6.
- sudo systemctl daemon-reload
- 7.
- sudo systemctl restart shellycontrol.service webgraph.service
After this process, the OLED display is illuminated, and a system interface is accessible on the local network (http://’Raspberry Pi’s Private IP Address’:8080). The relay subsystem will also be automated based on daily energy pricing data.
4. Validation
To validate the IoT-based system’s function and gain perspective on potential cost savings, the system was configured to power a load during the cheapest half-hour period each day for a total of 31 days. Figure 7 displays the power consumption of the appliance, where the total energy usage for each day was 155 Wh on average.
Using historical pricing data from the Agile Octopus tariff, the cost savings that would have been achieved from shifting the appliance’s energy usage to the period of lowest demand were estimated to be approximately 44%.
Based on this percentage, Figure 8 plots the theoretical increase in gross cost savings that were attainable during the experiment from shifting increasing amounts of energy consumption per day. An overview of this calculation is provided in Appendix A.
The predicted savings are shown to increase from 38 pence at 155 Wh of shifted energy consumption to £17.94 at 7400 Wh, the average daily electricity usage for a medium UK household [21]. This plot displays that DDR generates greater cost savings when optimising larger energy loads, such as those from boilers, storage heaters, and EV charging.
5. Conclusions and Future Work
An IoT-based system was developed to provide an accessible method of automating DDR, aiming to streamline household engagement with flexibility measures. Its operation controlled a relay in response to real-time energy pricing data, shifting power consumption towards times of lower demand to achieve cost savings. For validation of its function, the system was configured to automate an appliance for half-hour periods over the course of 31 days. Using historical pricing data for the Agile Octopus tariff, it was estimated that the system would have reduced the energy costs for the appliance by 44%, which demonstrated its potential to generate significant cost savings for energy-intensive loads. The system’s design and build instructions are presented in this paper and hosted on GitHub under the MIT license, where it serves as a reference for reproduction, modification, and further development.
Building upon this work, the IoT-based system could be integrated with a platform such as Home Assistant, a widely used, open-source platform for home automation that helps unify and manage IoT devices. By utilising the Home Assistant’s host device to also serve as the control subsystem, the overall IoT-based system would become more practical and cost-effective to implement. The system could also be expanded for homes with on-site energy generation and storage facilities, enabling appliances to be controlled based on real-time production and storage data. For example, in a household with solar panels and batteries, energy-intensive loads could be deferred to periods of maximum generation, reducing storage-related losses and improving the household’s efficiency. This process could help reduce the reliance of homes on the power grid, thereby alleviating pressure on it during peak demand. Through the improvement of the household’s efficiency, there is also potential for households to achieve greater cost savings compared to automating DDR alone. Other opportunities for future work include expanding the system’s compatibility to a wider range of tariffs and relays, and further improving the system's accessibility for households to implement.
To conclude, if IoT-based devices, such as the system presented, are used to implement DDR on a broader scale in the UK, their ability to assist the grid may increase as power consumption and demand are granted improved mobility. This would facilitate highly influential applications for DDR, such as the stabilisation of the power grid’s frequency during times of fluctuating demand and generation. Subsequently, these applications could enhance the robustness of the UK’s power system as renewable energy sources are further integrated in the decarbonisation of the National Grid.
Supplementary Materials
The following supporting information can be downloaded at: https://github.com/abasituk/Shelly-Automated-Agile-Octopus/tree/main.
| Name | Type | Description |
| S1 | Build Instructions (.md) | BOM and build guide |
| S2 | Scripts (.py, .sh, .html) | Installation and software scripts |
| S3 | Enclosures (.stl, .step) | Printable enclosure parts |
Author Contributions
Conceptualization, A.B. and S.L.; methodology, A.B.; software, A.B.; validation, A.B.; formal analysis, A.B.; investigation, A.B.; resources, S.L.; data curation, A.B.; writing—original draft preparation, A.B.; writing—review and editing, S.L.; visualization, A.B.; supervision, S.L.; project administration, S.L.; funding acquisition, S.L. All authors have read and agreed to the published version of the manuscript.
Funding
This research was funded by The Royal Society (ICA\R1\231038, IES\R2\232123).
Institutional Review Board Statement
Not applicable.
Informed Consent Statement
Not applicable.
Data Availability Statement
The authors confirm that the data supporting the findings of this study are available within the article and its supplementary materials.
Acknowledgements
We acknowledge the support from The Royal Society (ICA\R1\231038, IES\R2\232123).
Conflicts of Interest
The authors declare no conflict of interest.
Appendix A

Table A1.
Processed power consumption data from the validation experiment.
| Date | Daily Power Consumption (Wh) | Price at Optimal period (p) | Average Price (p) | Average Energy Costs (p) | Optimised Energy Costs (p) |
| 02/04/2025 | 155 | 4 | 17 | 2.635 | 0.62 |
| 03/04/2025 | 155 | -0.1 | 17 | 2.635 | -0.0155 |
| 04/04/2025 | 155 | 3 | 18 | 2.79 | 0.465 |
| 05/04/2025 | 155 | -3.8 | 14 | 2.17 | -0.589 |
| 06/04/2025 | 155 | 3 | 16.6 | 2.573 | 0.465 |
| 07/04/2025 | 155 | 13.7 | 20.6 | 3.193 | 2.1235 |
| 08/04/2025 | 155 | 14.8 | 20.1 | 3.1155 | 2.294 |
| 09/04/2025 | 155 | 15.1 | 19.8 | 3.069 | 2.3405 |
| 10/04/2025 | 155 | 13.4 | 19.4 | 3.007 | 2.077 |
| 11/04/2025 | 155 | 13.3 | 18.8 | 2.914 | 2.0615 |
| 12/04/2025 | 155 | 8.4 | 17.9 | 2.7745 | 1.302 |
| 13/04/2025 | 155 | 9.2 | 17.1 | 2.6505 | 1.426 |
| 14/04/2025 | 155 | 13.9 | 18.7 | 2.8985 | 2.1545 |
| 15/04/2025 | 155 | 13.3 | 19.2 | 2.976 | 2.0615 |
| 19/04/2025 | 155 | 11 | 17.7 | 2.7435 | 1.705 |
| 20/04/2025 | 155 | 14.8 | 20.3 | 3.1465 | 2.294 |
| 21/04/2025 | 155 | 15.1 | 19.6 | 3.038 | 2.3405 |
| 22/04/2025 | 155 | 14.1 | 19.9 | 3.0845 | 2.1855 |
| 23/04/2025 | 155 | 15 | 19.9 | 3.0845 | 2.325 |
| 24/04/2025 | 155 | 14.9 | 18.9 | 2.9295 | 2.3095 |
| 25/04/2025 | 155 | 14 | 18.9 | 2.9295 | 2.17 |
| 26/04/2025 | 155 | 14.1 | 18.2 | 2.821 | 2.1855 |
| 27/04/2025 | 155 | -1.9 | 11.9 | 1.8445 | -0.2945 |
| 28/04/2025 | 155 | 11.9 | 17.8 | 2.759 | 1.8445 |
| 29/04/2025 | 155 | 12.6 | 18.5 | 2.8675 | 1.953 |
| 30/04/2025 | 155 | 13.3 | 18.6 | 2.883 | 2.0615 |
| 01/05/2025 | 155 | 12.4 | 18.7 | 2.8985 | 1.922 |
| 02/05/2025 | 155 | 12.6 | 17.7 | 2.7435 | 1.953 |
| 03/05/2025 | 155 | 0 | 12.7 | 1.9685 | 0 |
| 04/05/2025 | 155 | 1.5 | 10.3 | 1.5965 | 0.2325 |
| 05/05/2025 | 155 | 13.4 | 18.6 | 2.883 | 2.077 |
| Average Power Consumption (Wh) | Average Optimal Price (p/kWh) | Average Price (p/kWh) | Total Unoptimized Costs (£) | Total Optimised Costs (£) | Cost Savings (£) | Cost Savings (%) |
| 155 | 10.00 | 17.82 | 0.86 | 0.48 | 0.38 | 43.88 |
Table A2.
Theoretical cost savings for scaled shifted power consumption.
| Scaled Power Consumption (Wh) | Scaled Cost Savings (£) |
| 0 | 0.00 |
| 500 | 1.21 |
| 1000 | 2.42 |
| 1500 | 3.64 |
| 2000 | 4.85 |
| 2500 | 6.06 |
| 3000 | 7.27 |
| 3500 | 8.48 |
| 4000 | 9.70 |
| 4500 | 10.91 |
| 5000 | 12.12 |
| 5500 | 13.33 |
| 6000 | 14.54 |
| 6500 | 15.76 |
| 7000 | 16.97 |
| 7400 | 17.94 |
| 7500 | 18.18 |
| 8000 | 19.39 |
References
- IPCC. Climate Change 2023: Synthesis Report. Contribution of Working Groups I, II and III to the Sixth Assessment Report of the Intergovernmental Panel on Climate Change; Core Writing Team, H., Romero, J., Eds.; IPCC: Geneva, Switzerland, 2023. [Google Scholar]
- United Nations Framework Convention on Climate Change (UNFCCC). Key Aspects of the Paris Agreement; UNFCCC: Bonn, Germany, 2015. [Google Scholar]
- Armstrong McKay, D.I.; Staal, A.; Abrams, J.F.; Winkelmann, R.; Sakschewski, B.; Loriani, S.; Fetzer, I.; Cornell, S.E.; Rockström, J.; Lenton, T.M. Exceeding 1.5°C Global Warming Could Trigger Multiple Climate Tipping Points. Science 2022, 377, eabn7950. [Google Scholar] [CrossRef] [PubMed]
- IPCC. Global Warming of 1.5°C: An IPCC Special Report on the Impacts of Global Warming of 1.5°C above Pre-industrial Levels and Related Global Greenhouse Gas Emission Pathways; World Meteorological Organization: Geneva, Switzerland, 2018. [Google Scholar]
- Department for Business, Energy & Industrial Strategy. Net Zero Strategy: Build Back Greener; UK Government: London, UK, 2021. [Google Scholar]
- Stadler, I. Power Grid Balancing of Energy Systems with High Renewable Energy Penetration by Demand Response. Utilities Policy 2008, 16, 90–98. [Google Scholar] [CrossRef]
- Office of Gas and Electricity Markets (Ofgem). Insights Paper on Households with Electric and Other Non-Gas Heating; Ofgem: London, UK, 2015. [Google Scholar]
- Department for Energy Security and Net Zero; Ofgem; Department for Business, Energy & Industrial Strategy. Transitioning to a Net Zero Energy System: Smart Systems and Flexibility Plan; UK Government: London, UK, 2021. [Google Scholar]
- Sinha, R.; Bak-Jensen, B.; Radhakrishna Pillai, J.; Zareipour, H. Flexibility from Electric Boiler and Thermal Storage for Multi Energy System Interaction. Energies 2020, 13, 98. [Google Scholar] [CrossRef]
- Golmohamadi, H.; Golestan, S.; Sinha, R.; Bak-Jensen, B. Demand-Side Flexibility in Power Systems, Structure, Opportunities, and Objectives: A Review for Residential Sector. Energies 2024, 17, 4670. [Google Scholar] [CrossRef]
- Short, J.A.; Infield, D.G.; Freris, L.L. Stabilization of Grid Frequency Through Dynamic Demand Control. IEEE Trans. Power Syst. 2007, 22, 1284–1293. [Google Scholar] [CrossRef]
- New York State Energy Research and Development Authority (NYSERDA). Real-Time Energy Management (RTEM) Network. Available online: https://nyserda.ny.gov/All-Programs/Programs/Real-Time-Energy-Management (accessed on 15 July 2024).
- Office of Gas and Electricity Markets (Ofgem). Smart Meter Rollout: Open Letter on Energy Suppliers' Progress, Future Plans and Regulatory Obligations; Ofgem: London, UK, 2020. [Google Scholar]
- Octopus Energy. Agile Octopus API Documentation. Available online: https://developer.octopus.energy (accessed on 15 July 2024).
- Althaher, S.; Mancarella, P.; Mutale, J. Automated Demand Response From Home Energy Management System Under Dynamic Pricing and Power and Comfort Constraints. IEEE Transactions on Smart Grid 2015, 6, 1874–1883. [Google Scholar] [CrossRef]
- Rose, K.; Eldridge, S.; Chapin, L. The internet of things: An overview. The internet society (ISOC) 2015, 80, 1–7. [Google Scholar]
- Shelly. Shelly 1PM Smart Relay - Technical Specifications. Available online: https://shellystore.co.uk/product/shelly-1pm-gen3/ (accessed on 15 July 2024).
- Radxa. Radxa ZERO 3W Product Specifications. Available online: https://radxa.com/products/zeros/zero3w/ (accessed on 15 July 2024).
- Raspberry Pi Foundation. Raspberry Pi Zero 2 W Product Documentation. Available online: https://www.raspberrypi.com/products/raspberry-pi-zero-2-w/ (accessed on 15 July 2024).
- Adafruit Industries. SSD1306 0.96" OLED Display Datasheet. Available online: https://www.adafruit.com/product/326 (accessed on 15 July 2024).
- Office of Gas and Electricity Markets (Ofgem). Average Gas and Electricity Usage Explained. Available online: https://www.ofgem.gov.uk/information-consumers/energy-advice-households/average-gas-and-electricity-use-explained (accessed on 15 July 2024).
Figure 1.
System diagram of the IoT-based system.
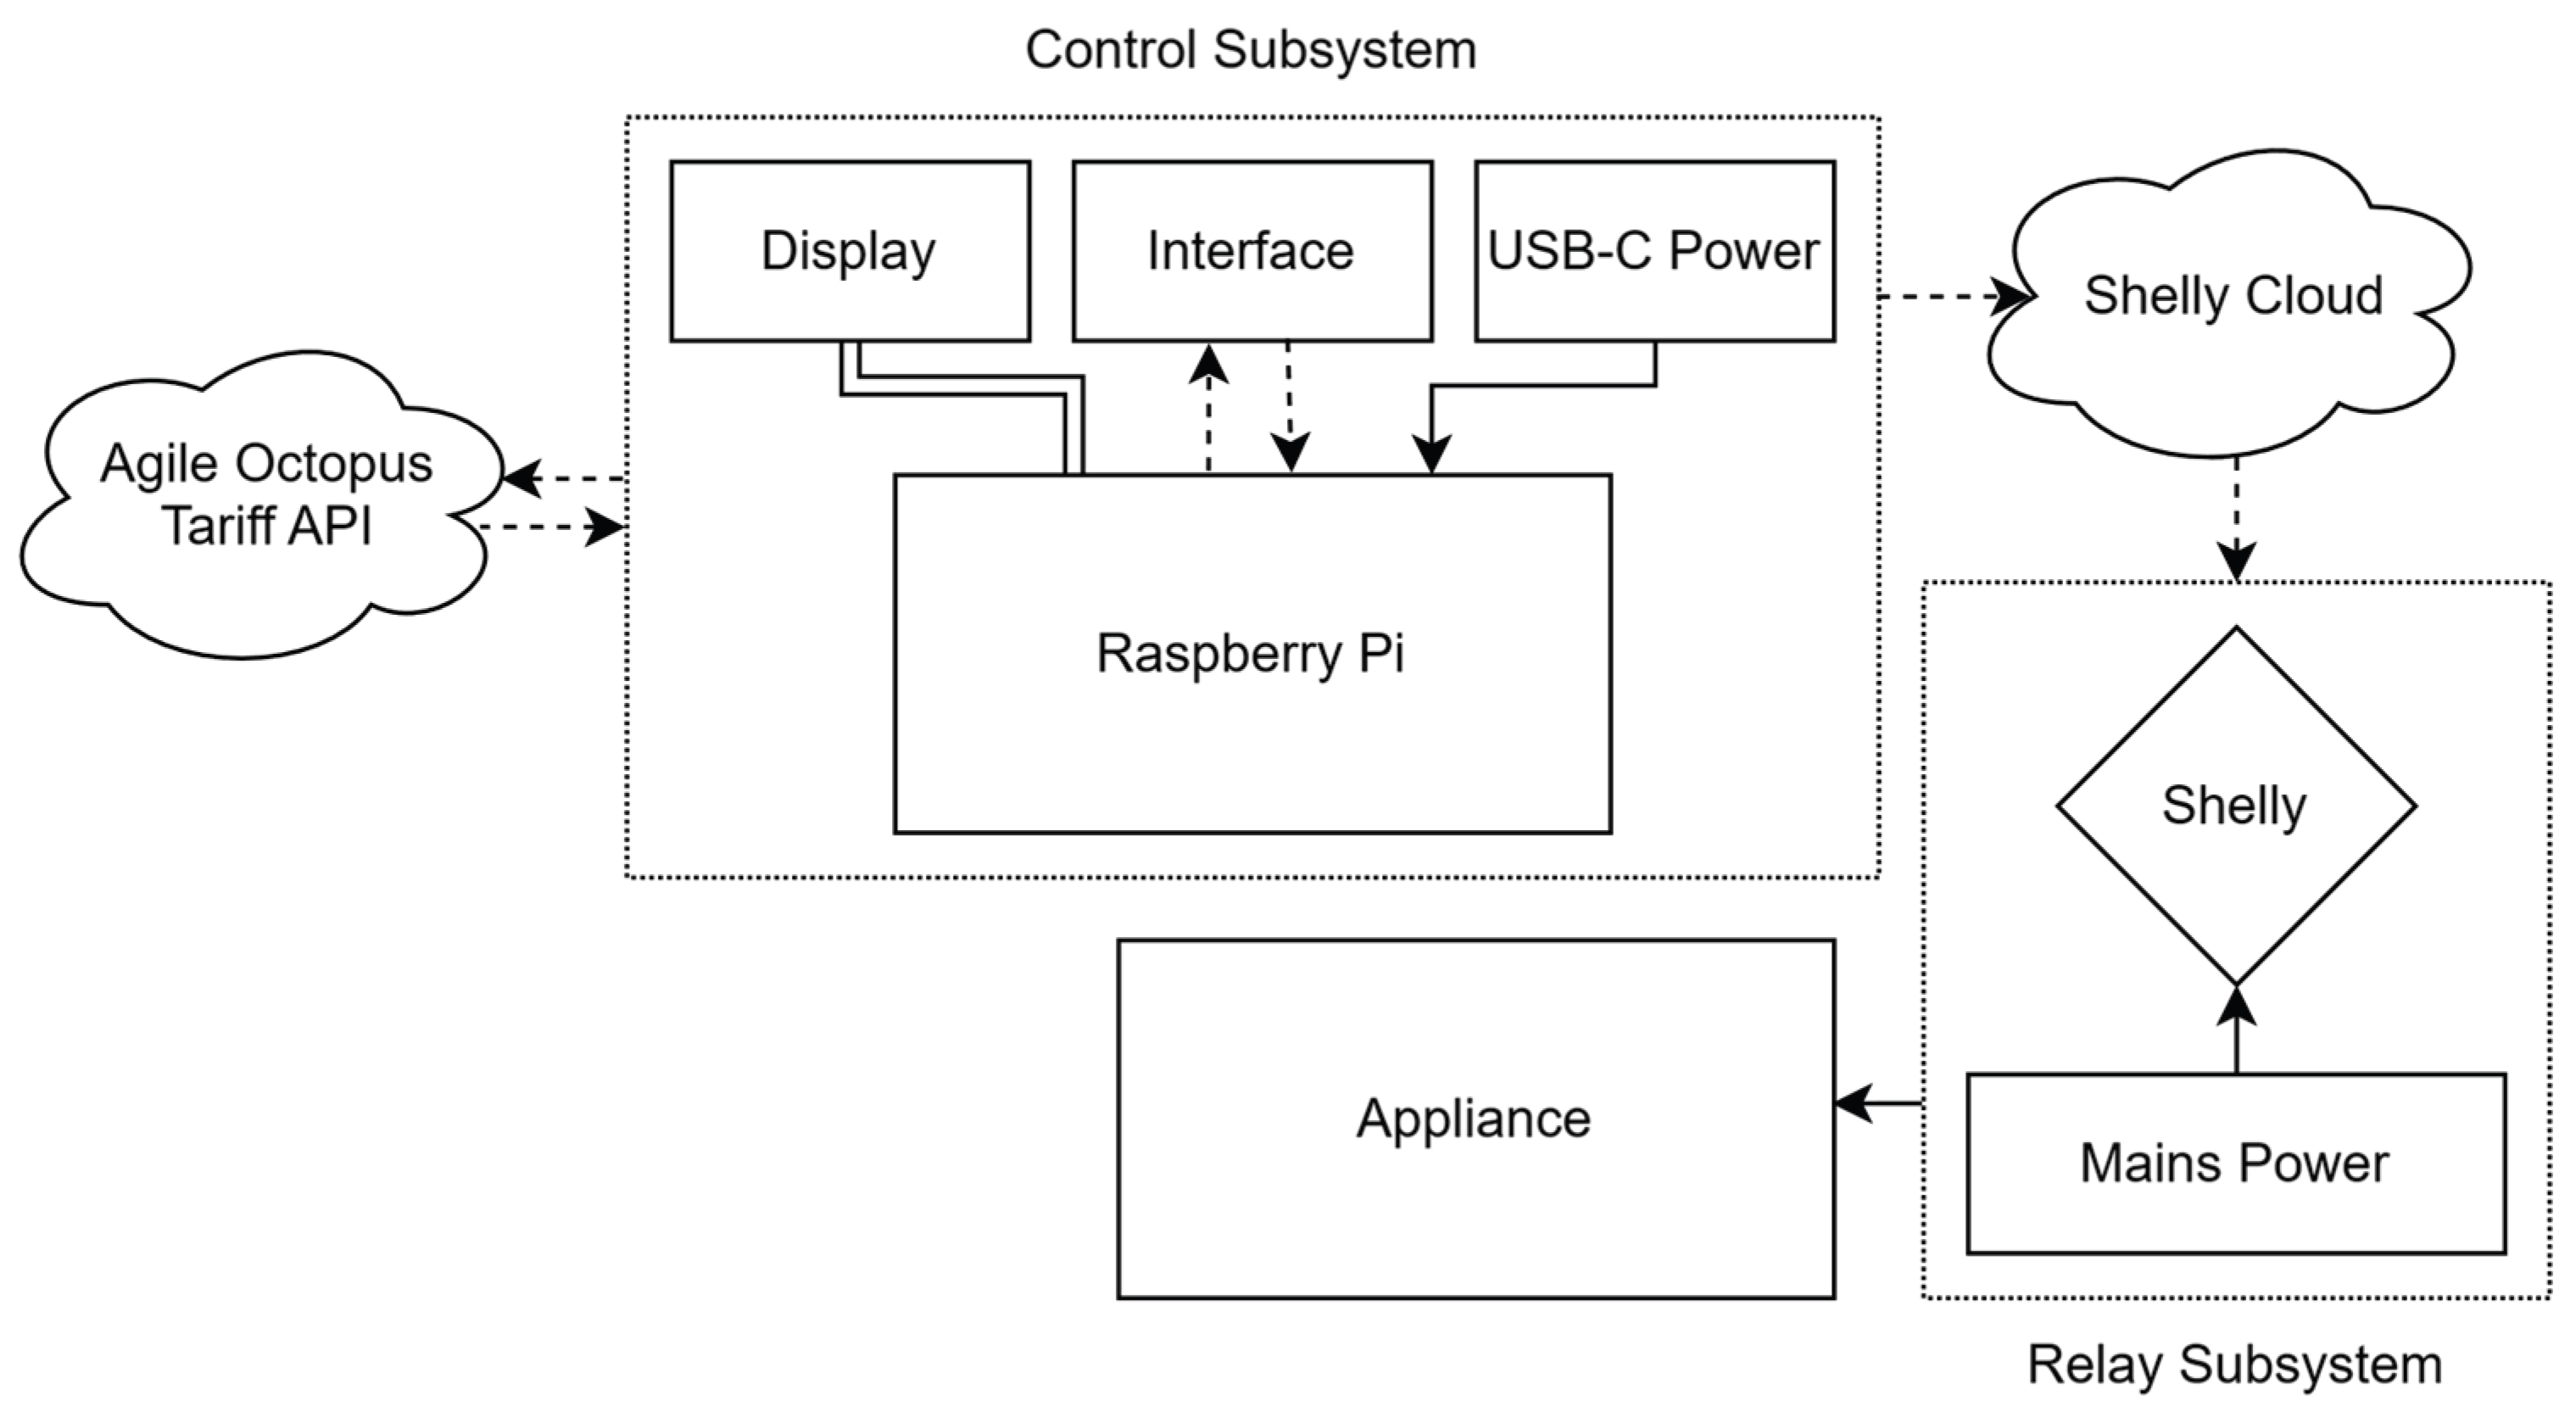
Figure 2.
Pictures of the control subsystem in its enclosure with the lid open (left) and closed (right). Here, a Raspberry Pi 4B was utilised, demonstrating the system’s flexible hardware requirements.
Figure 2.
Pictures of the control subsystem in its enclosure with the lid open (left) and closed (right). Here, a Raspberry Pi 4B was utilised, demonstrating the system’s flexible hardware requirements.
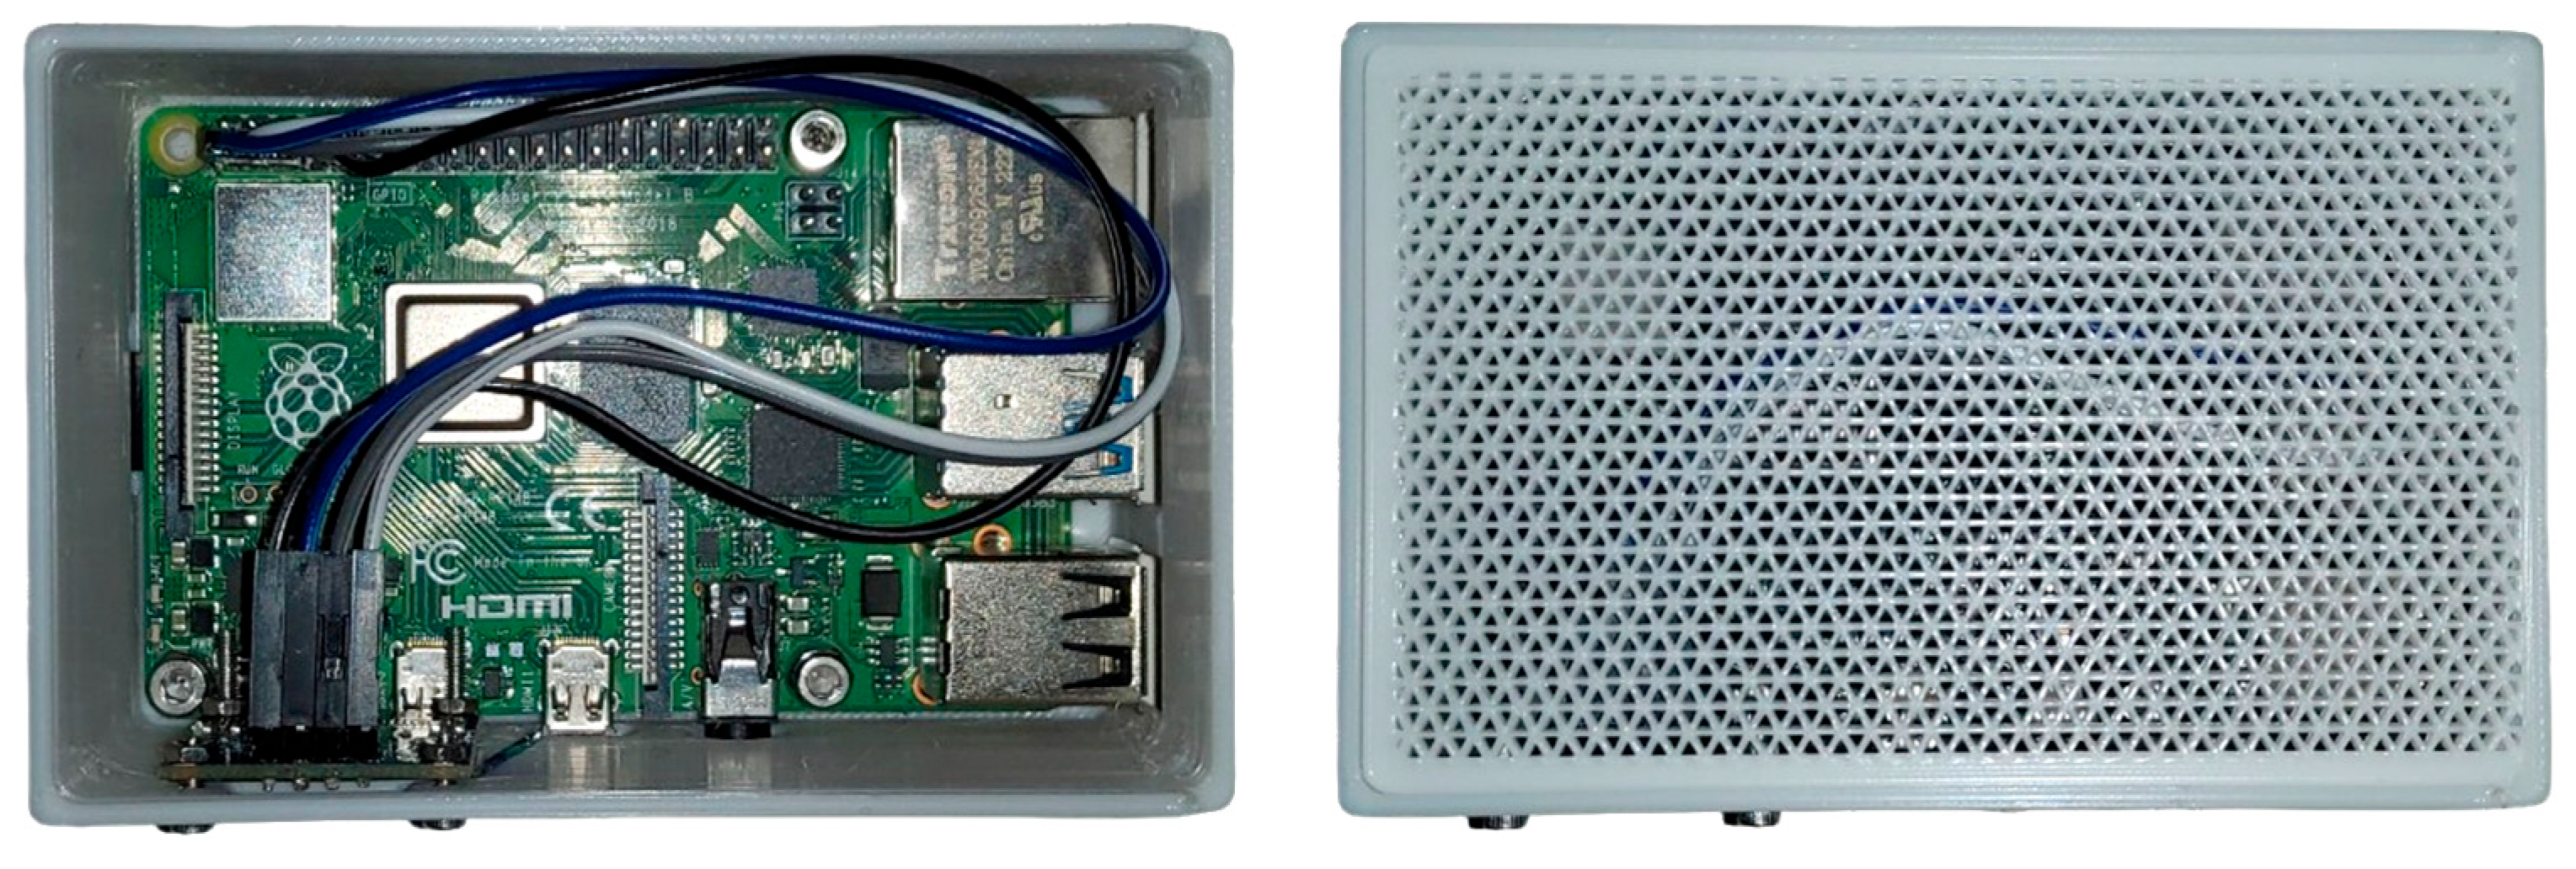
Figure 3.
3D render (left) and actual picture (right) of the relay subsystem assembled in a development circuit. Shelly 1PM model sourced from [17].
Figure 3.
3D render (left) and actual picture (right) of the relay subsystem assembled in a development circuit. Shelly 1PM model sourced from [17].

Figure 4.
Renders of the control subsystem that utilised the Raspberry Pi Zero 2 W. The models for the Zero 2 W, and the display were sourced from [19] and [20], respectively.
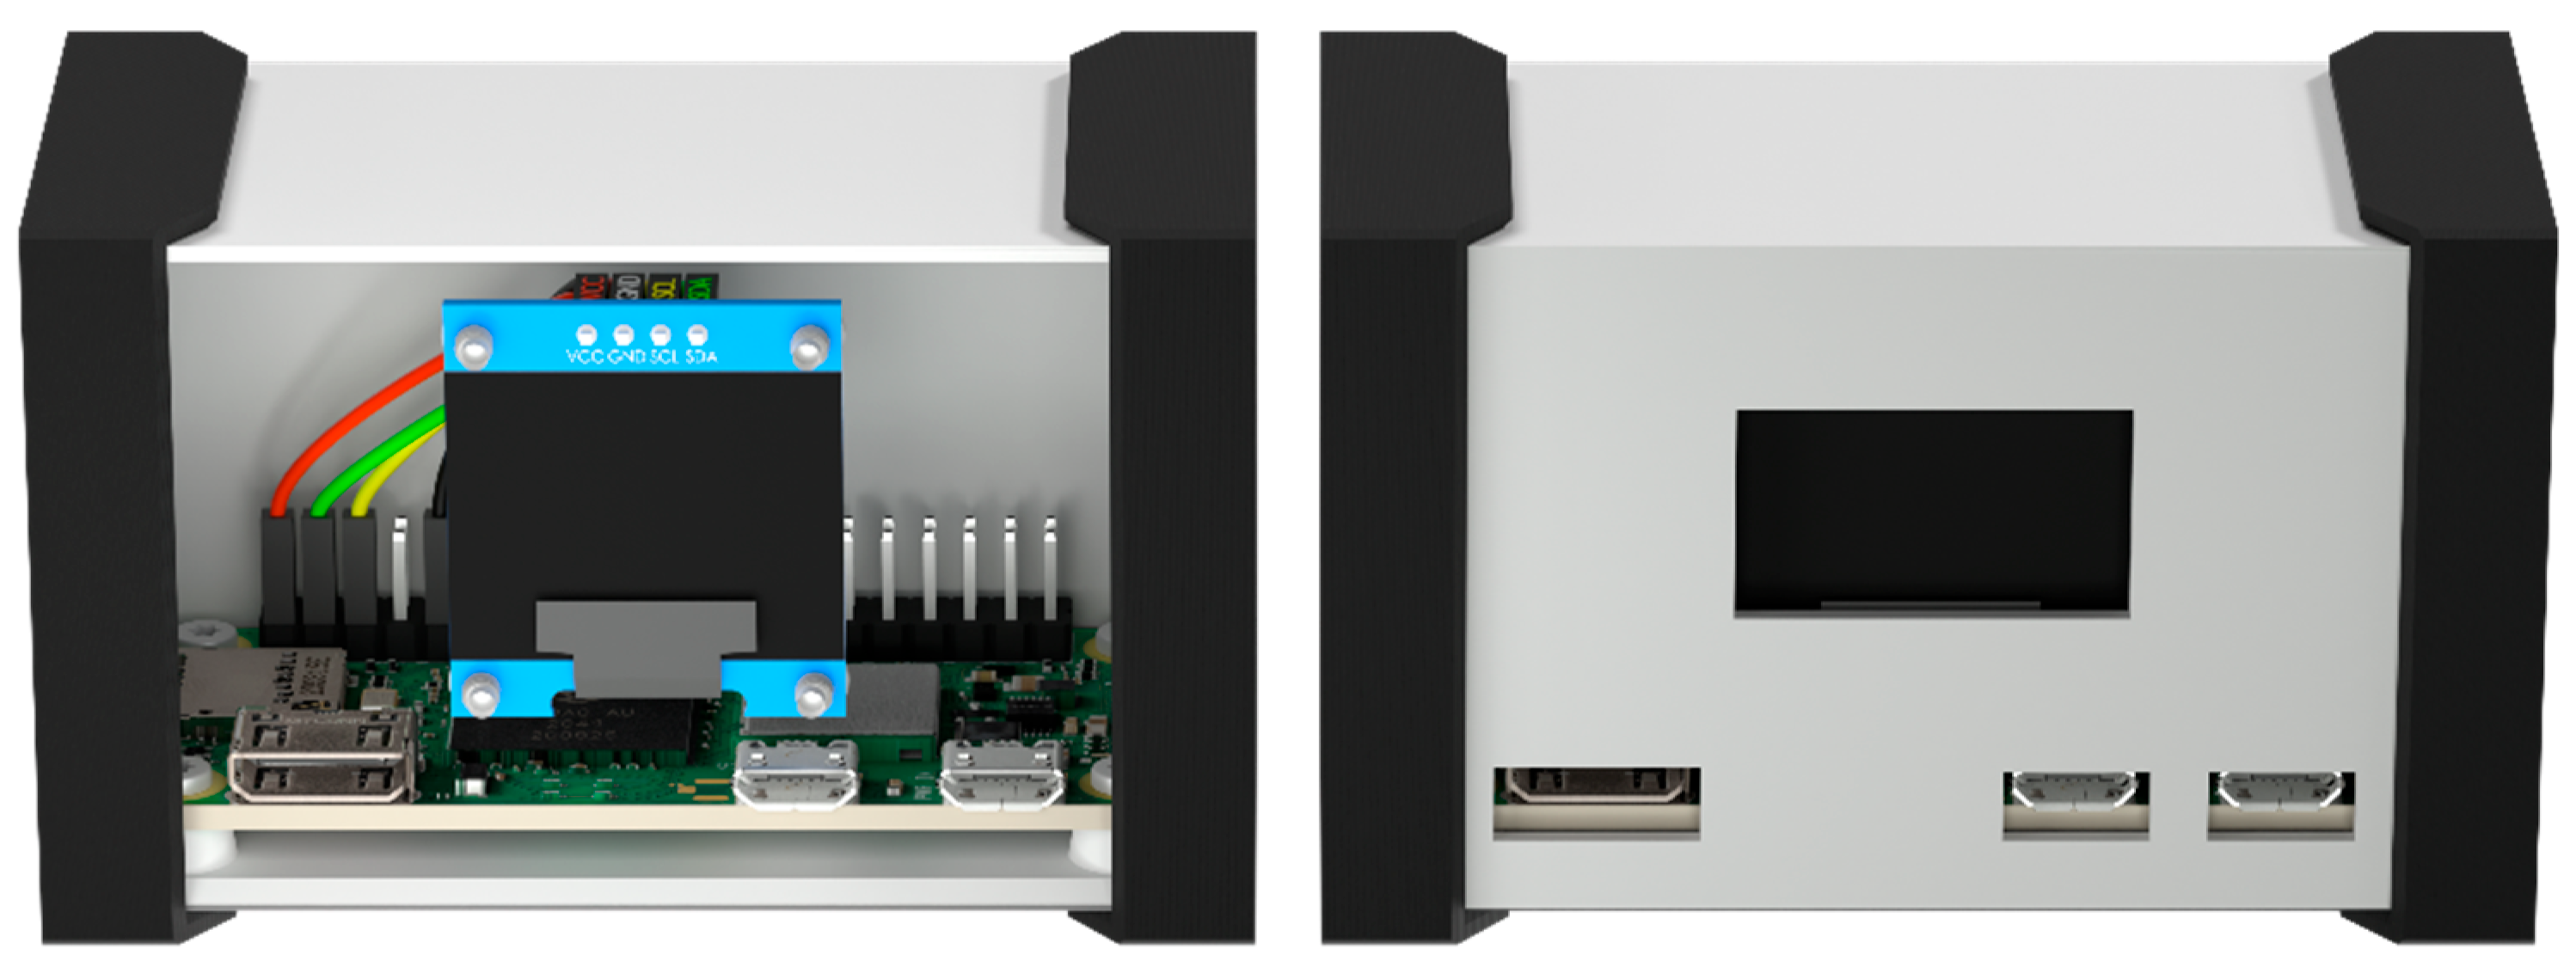
Figure 5.
Installation of the control subsystem’s components in its enclosure.

Figure 6.
Wiring diagram for configuration 1 of the relay subsystem.
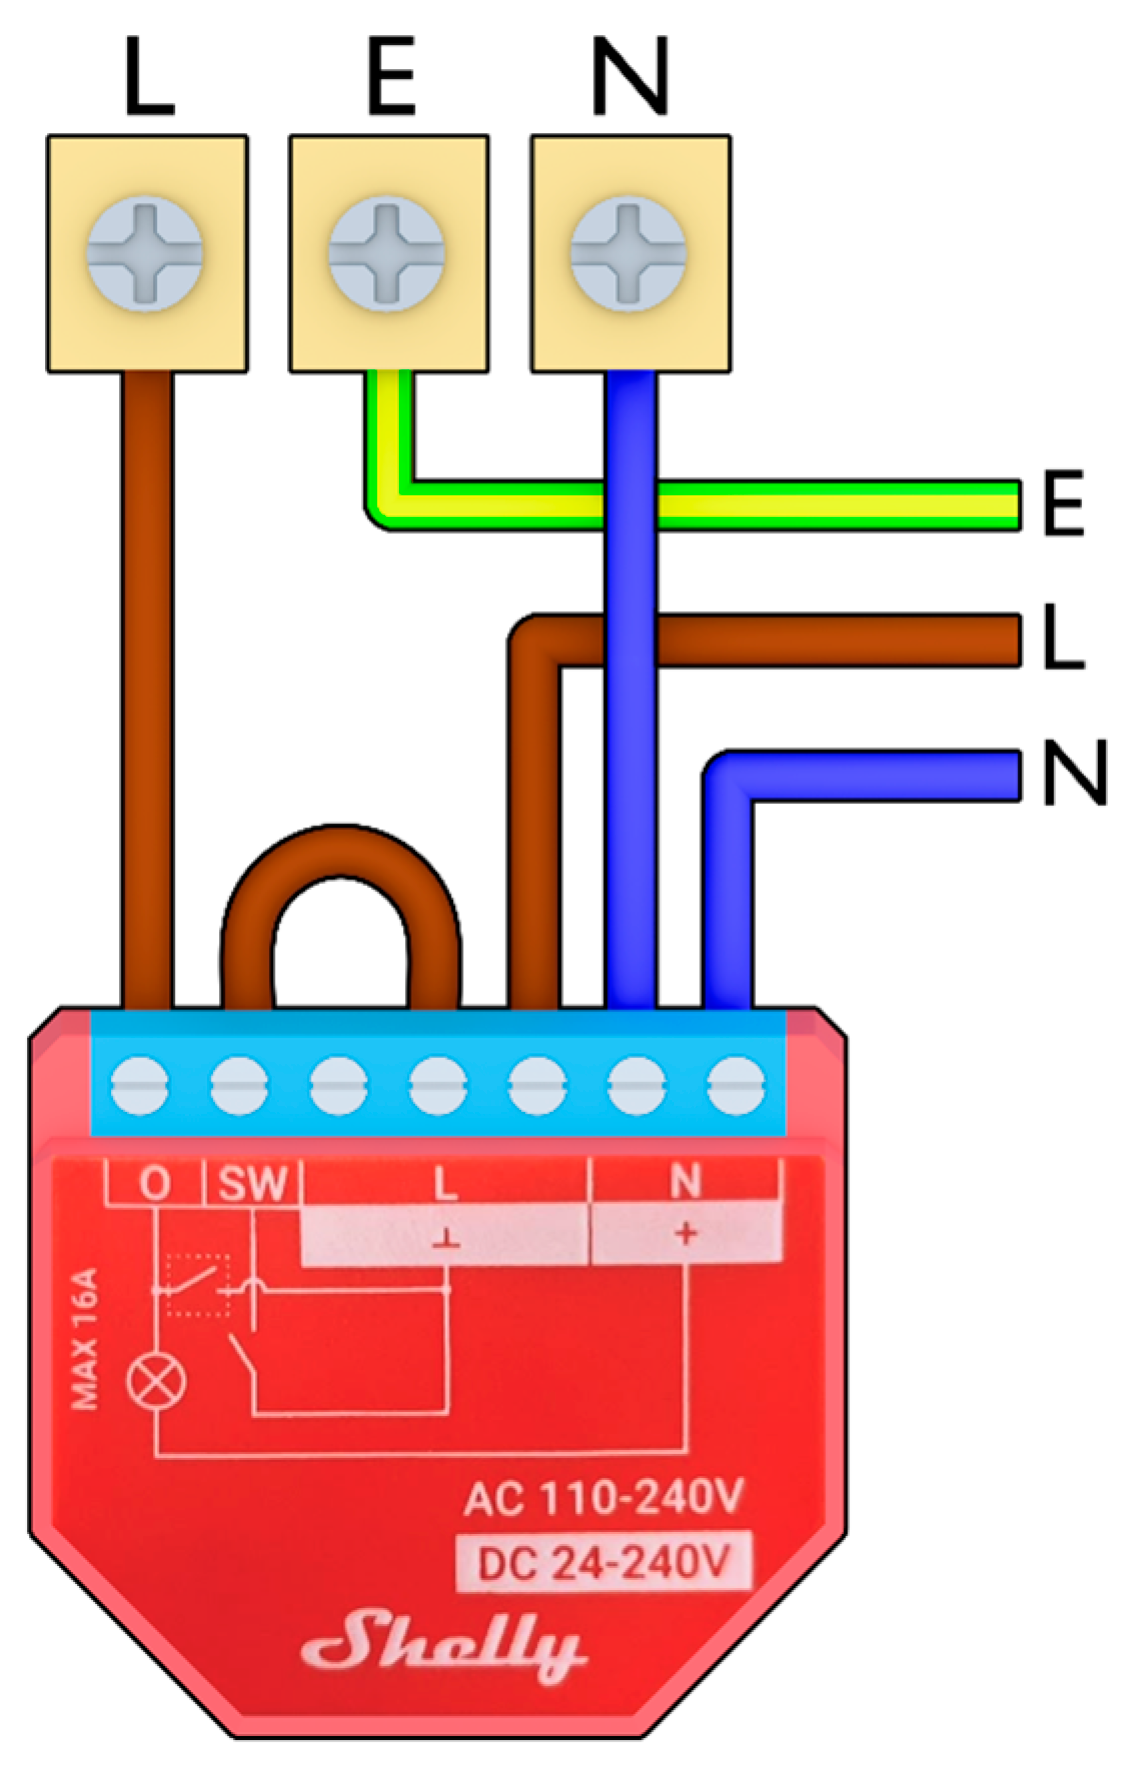
Figure 7.
Power consumption of an automated appliance with a sample rate of 5 seconds. Power to both subsystems was interrupted from the 16th to the 18th of April, 2025, simulating a power disruption.
Figure 7.
Power consumption of an automated appliance with a sample rate of 5 seconds. Power to both subsystems was interrupted from the 16th to the 18th of April, 2025, simulating a power disruption.
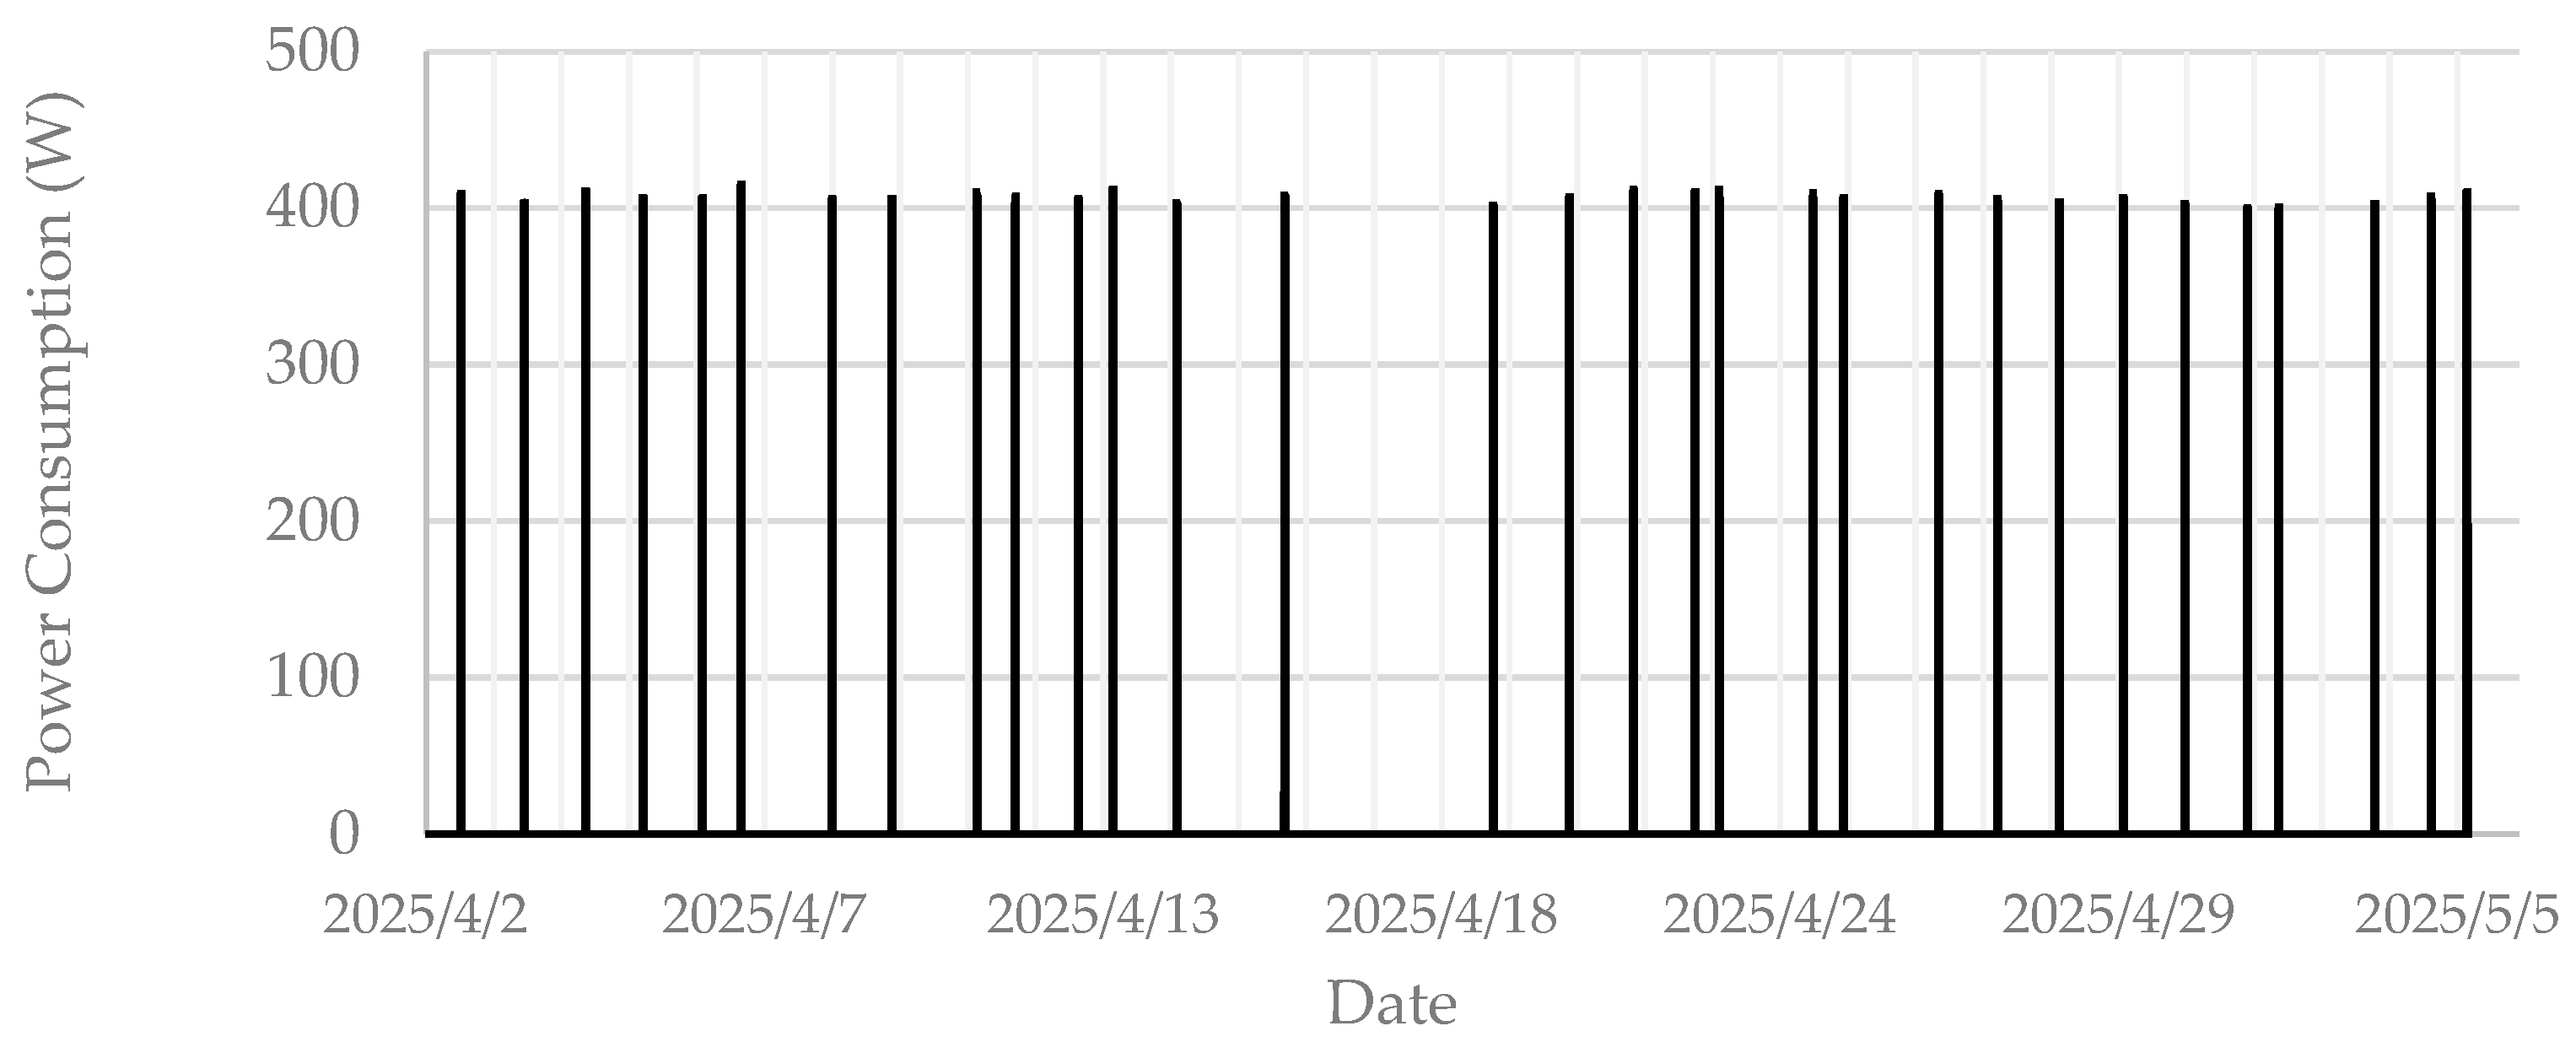
Figure 8.
Cost savings that were attainable from shifting loads of varying power consumption during April 2025. Key daily power consumption figures of 1500 Wh and 7400 Wh are labelled.
Figure 8.
Cost savings that were attainable from shifting loads of varying power consumption during April 2025. Key daily power consumption figures of 1500 Wh and 7400 Wh are labelled.
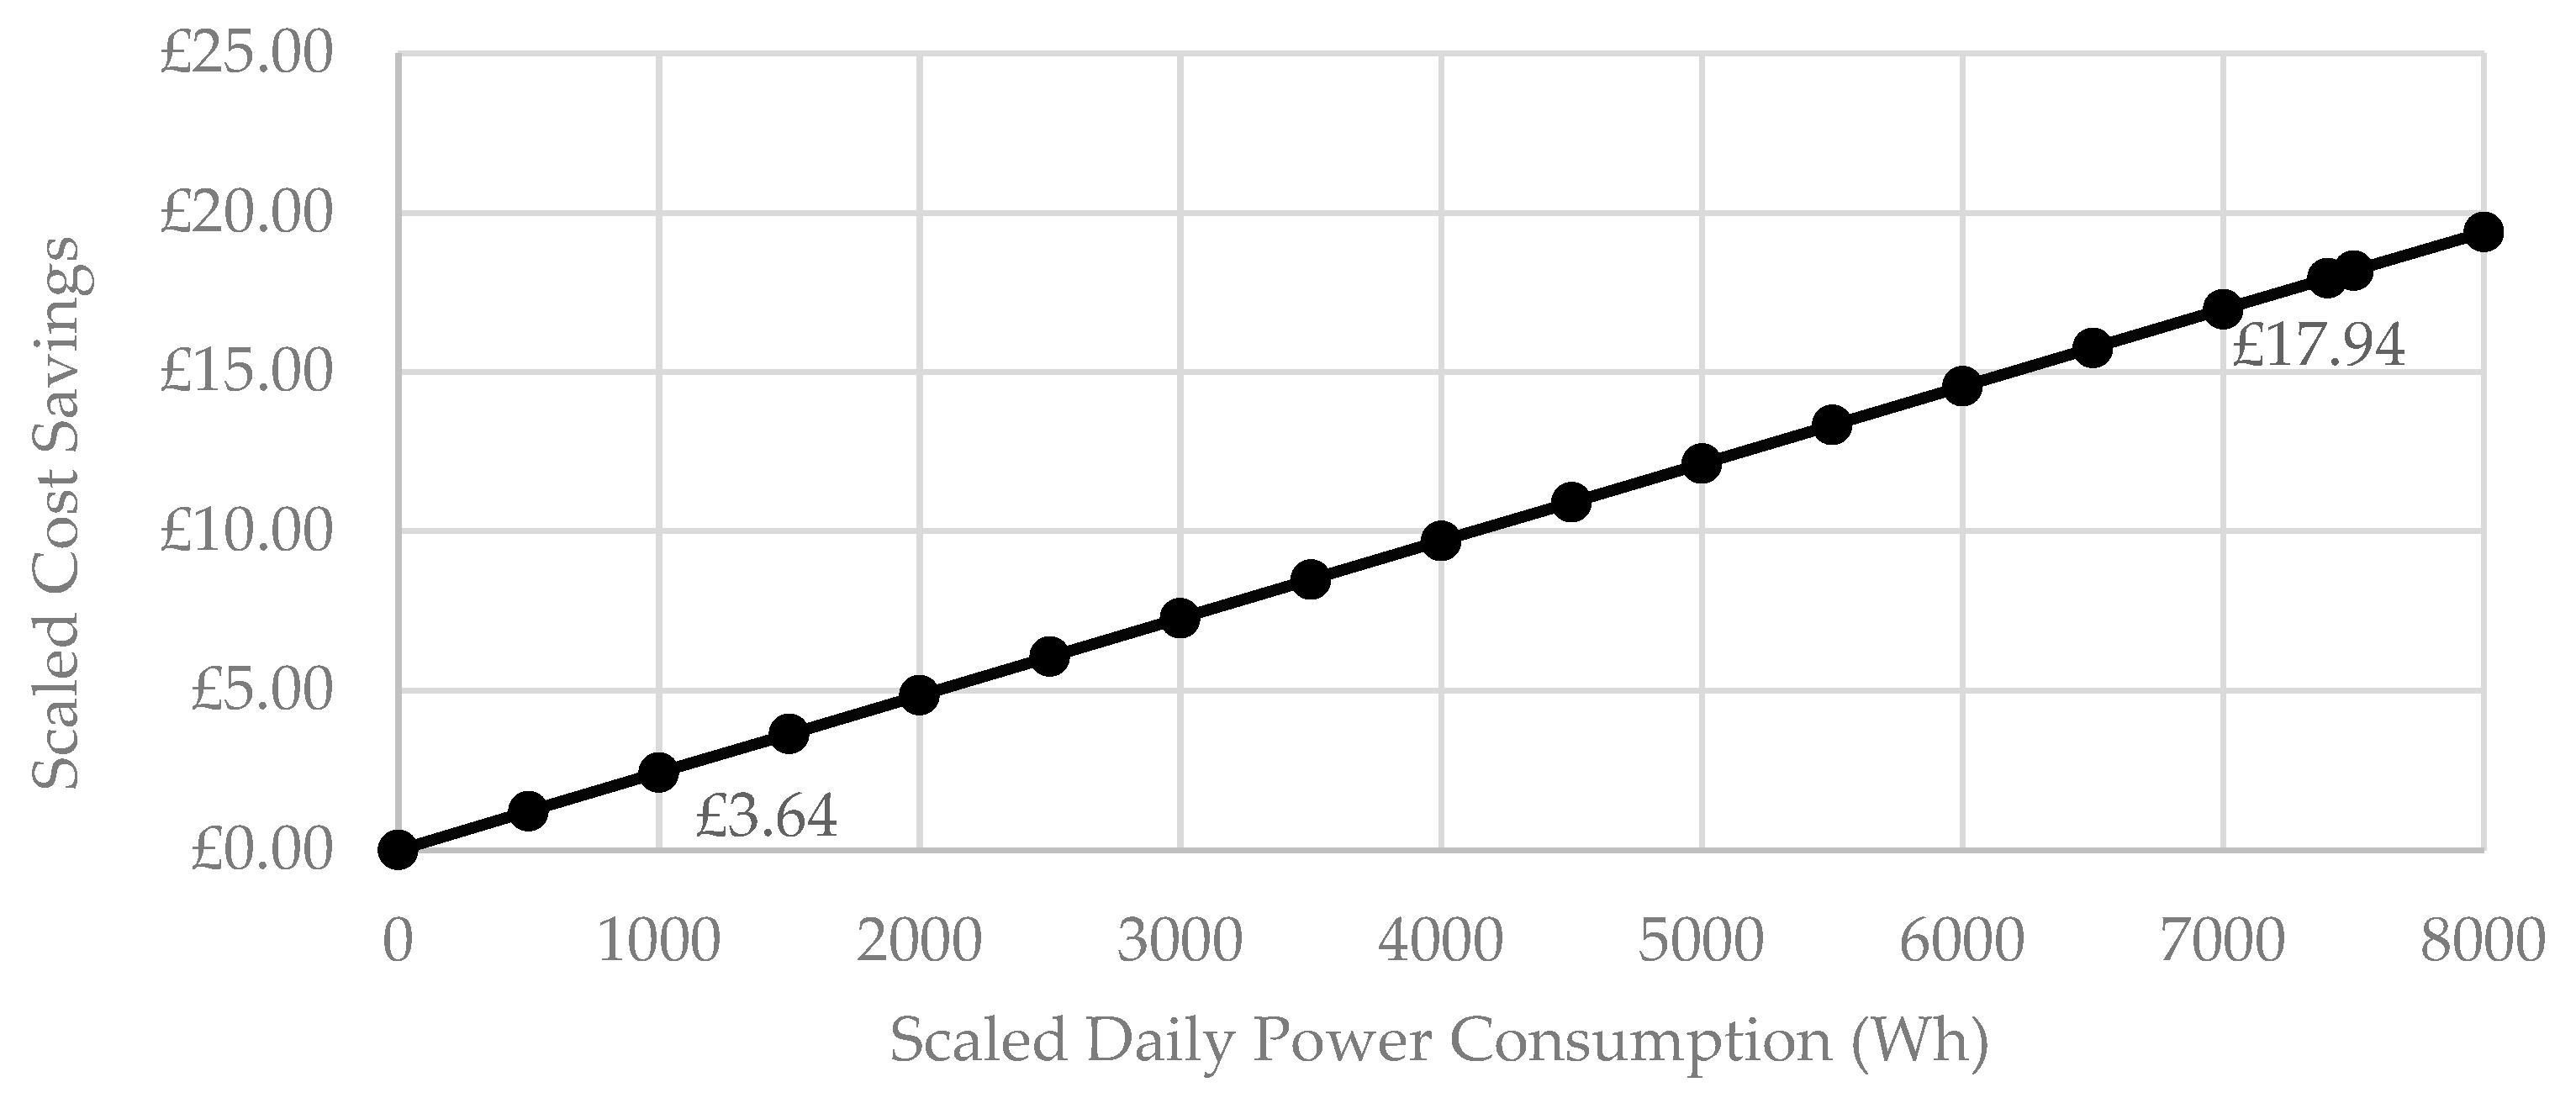
Table 1.
Bill of Materials for configuration 1 of the IoT-based system, costing £46.98.
| Identifier | Component | Quantity | Component Cost [GBP] | Source |
| SBC | Raspberry Pi Zero 2W | 1 | £16.98 | ThePiHut |
| Display | 0.96" OLED Display Module | 1 | £4.00 | ThePiHut |
| SBC Power | Raspberry Pi 12.5W Power Supply | 1 | £7.50 | ThePiHut |
| Smart Relay | Shelly 1PM Gen3 | 1 | £18.50 | ThePiHut |
Table 2.
Bill of Materials for configuration 2 of the IoT-based system, costing £49.48.
| Identifier | Component | Quantity | Component Cost [GBP] | Source |
| SBC | Raspberry Pi Zero 2W | 1 | £16.98 | ThePiHut |
| Display | 0.96" OLED Display Module | 1 | £4.00 | ThePiHut |
| SBC Power | Raspberry Pi 12.5W Power Supply | 1 | £7.50 | ThePiHut |
| Smart Relay | Shelly Plus Plug | 1 | £21.00 | ThePiHut |
Table 3.
Connections for the control subsystem’s components.
| Raspberry Pi Zero 2 W GPIO | OLED Display |
| 3V3 | VCC |
| GND | GND |
| GPIO2/SDA1 | SCL |
| GPIO3/SCL1 | SDA |
Disclaimer/Publisher’s Note: The statements, opinions and data contained in all publications are solely those of the individual author(s) and contributor(s) and not of MDPI and/or the editor(s). MDPI and/or the editor(s) disclaim responsibility for any injury to people or property resulting from any ideas, methods, instructions or products referred to in the content. |
© 2025 by the authors. Licensee MDPI, Basel, Switzerland. This article is an open access article distributed under the terms and conditions of the Creative Commons Attribution (CC BY) license (http://creativecommons.org/licenses/by/4.0/).
Copyright: This open access article is published under a Creative Commons CC BY 4.0 license, which permit the free download, distribution, and reuse, provided that the author and preprint are cited in any reuse.


