1. Introduction
Mitigating the concerns associated with climate change, the green energy transition has been associated with a mass transition from carbon based fuels towards renewable, environmentally friendly, green energy. The latter has resulted in the proliferation of DER’s (i.e. roof-top solar panels, electrical vehicles, warm water heating etc), at scale, which have challenged the traditional manner in how energy is distributed in the energy sector and how energy infrastructure aught to be operated efficiently. These DER’s are often characterized by some form of flexibility in their effect and time of when to either consuming and/or produce energy. Several public datasets have been made available to study the characteristics of DER’s [
1] and power grids [
2]. Despite the comprehensive nature of the aforementioned datasets, often presented datasets only supply partial information of data required to solve more involved energy management problems such as presented in [
3]. In principle, problems characterized by those presented in [
3] are in particular concerned with how DER’s (often flexible energy resources) aught to be orchestrated in a grid-aware context which necessitates both model and data-based solutions. The motivation for this brief is to facilitate further studies in how DER’s aught to be orchestrated given the current network conditions. The goal for this dataset is to enable researches to analyse actual network operational conditions (in context of i.e., [
2]), subject to network constraints, which when associated with realistic load profiles, may provide additional insight on what quantity energy flexility is required from DER’s (in context of [
1]). The aim here is to promote further innovation in activating and leveraging distributed energy flexibility in support of grid operation in aim of postponing expensive grid reinforcements, often required to deal with short term temporal grid violations (i.e., peak-loads or voltage problems due to excessive energy production).
2. Data Description
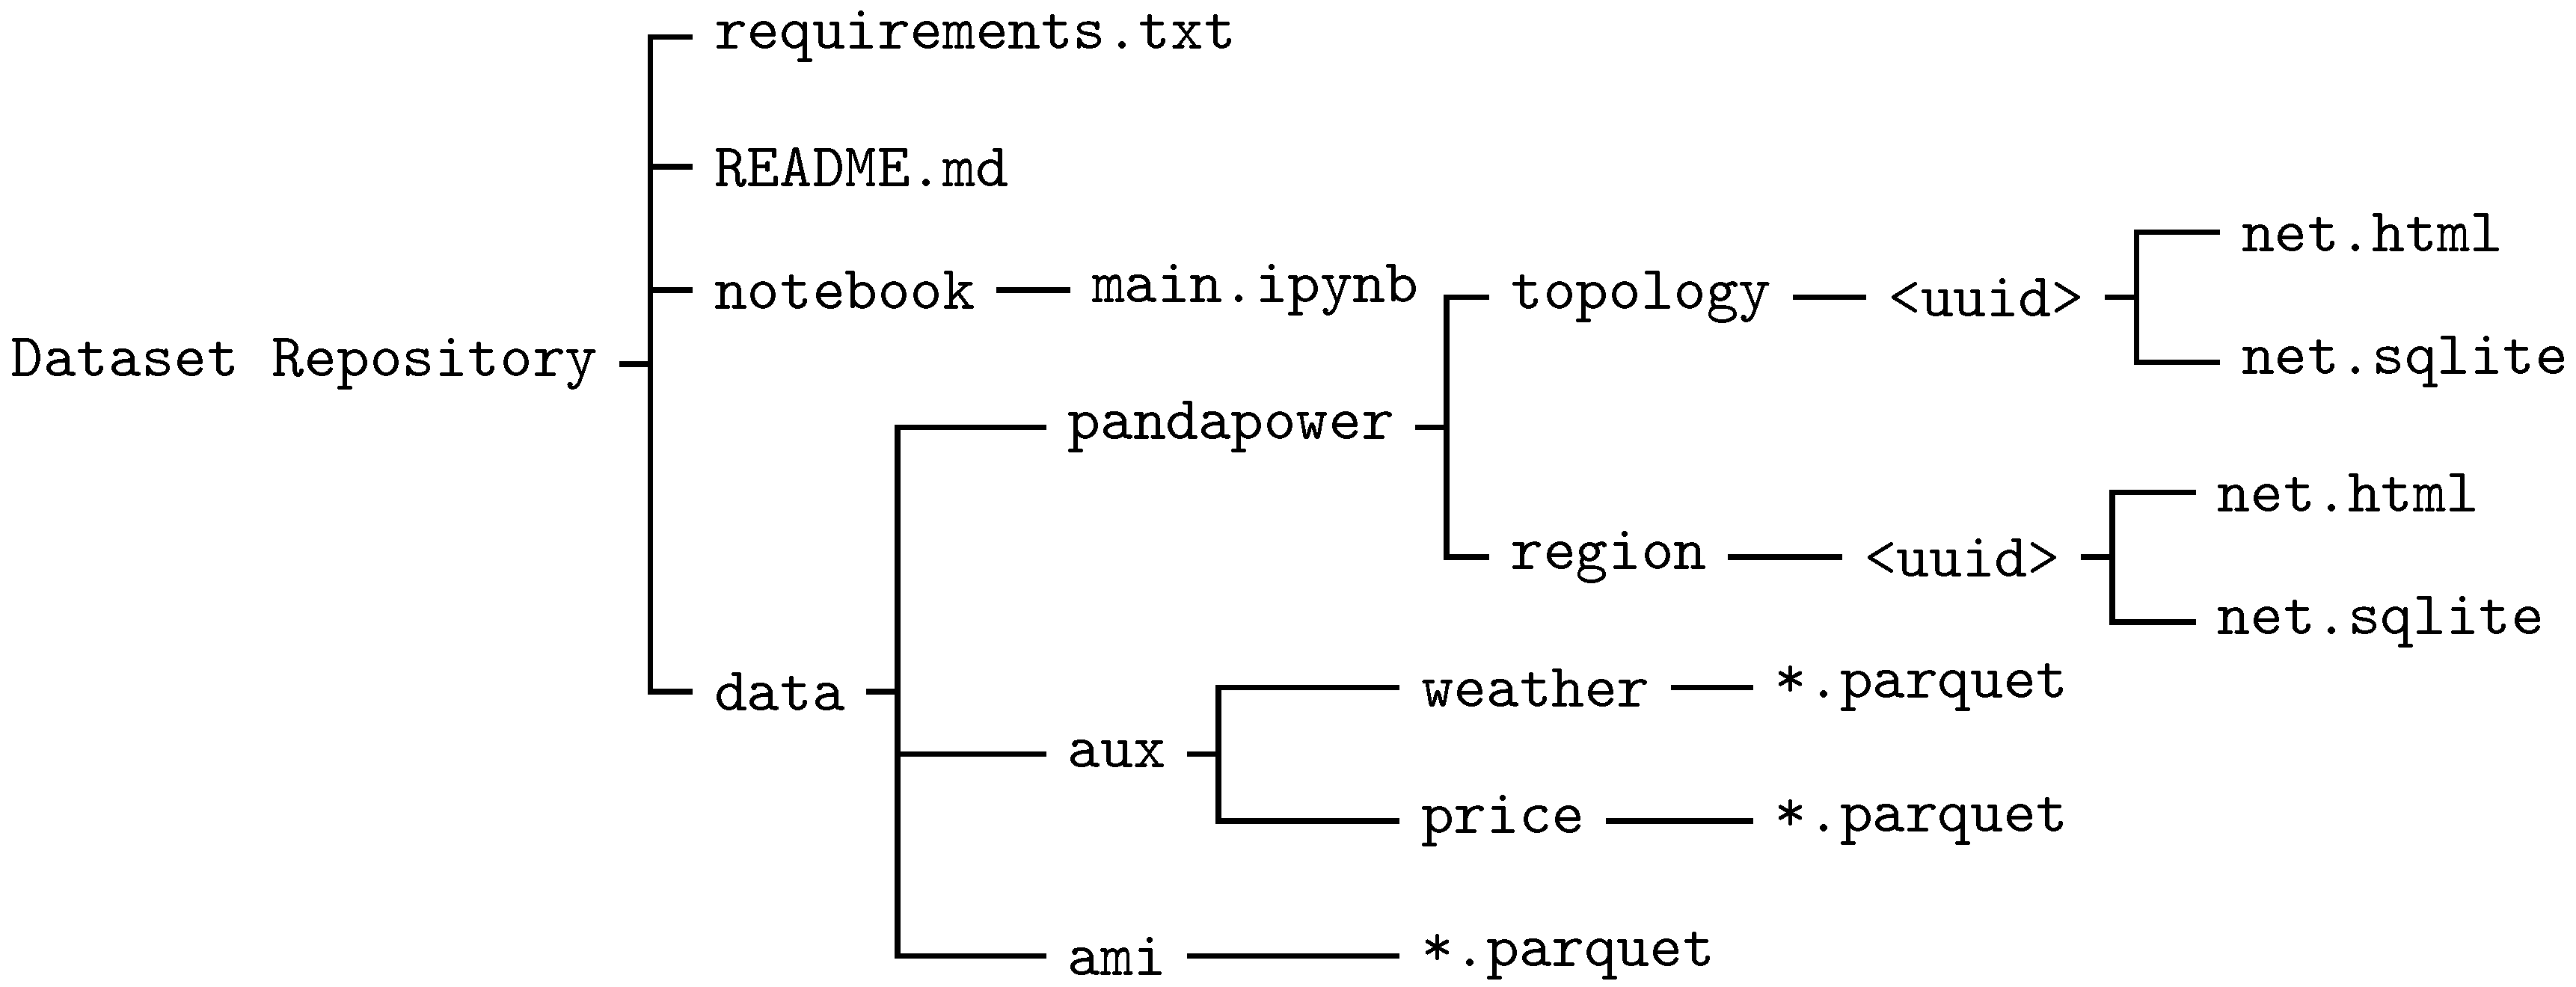
Figure 1 depicts the folder structure layout of for the repository [
4]. As starting point, it is recommended consulting the
README.md which provide general instructions on getting started and usage. Supplementary to the provided data, the
notebook folder contains a Jupiter Notebook
main.ipynb which provides a low threshold entry to visually inspecting the data and also run an elementary load flow analysis on the provided network model. The
requirements.txt list the required dependencies for running the notebook. All data for this dataset is located in the data folder which differentiate between three types of data formats:
*.parquet ,
*.sqlite and
*.html, respectively. All sensor and auxiliary data are using the
*.parquet since it allows efficient columnar storage that promote increased efficient storage, faster query performance and strong schema support. Network models, which differentiates among region and topology models, are stored in the
*.sqlite format which conforms with data the structure advocated by Pandapower [
5]. The respective regional and topology models include power flow interactive figures (
*.html) which allows the user for a graphical inspection of network composition and power flow given a zero-load profile configuration.
2.1. Data Structures
2.1.1. Network Models
From
Figure 1, the network regional and topology network model datasets are found in the
pandapower folder using
*.sqlite format. The regional model is a comprehensive network model which include both low- and medium voltage network segments. The regional network consists of 185 low voltage network topologies also referred to as energy communities. The latter can but analysed on an isolated basis when referring to the models listed in the
pandapower/topology folder. The data structure of the network models, outlined in
Table 1, conform to the
net data-structure as stipulated by [
5] apart from minor additions in terms of Universally Unique Identifier (UUID) identifier tags.
2.1.2. Smart Meter Sensor Data
The smart meter sensor data is listed in the
ami folder using
mrid.parquet format. The respective
mrid.parquet files are partitioned and named according to the
mrid of the respective
load elements defined in
Table 2 which defines the data structure for the smart meter sensor data.
2.1.3. Auxiliary Sensor Data
The auxiliary sensor data, as listed in the
aux folder consists of both historical energy spot price data and weather data. Historical energy spot price data, located in the subfolder
aux.price, contains one file that contain the regional price data applicable for the network model of interest.
Table 3 defines the data structure of the respective dataset on price data. The historical weather datasets,
uuid.parquet, located in the subfolder
aux.weather, are partitioned and named according to the
uuid of the respective energy community the weather data is applicable to.
There is no consensus in the scientific community on what the definition of energy communities entail. In line of [
6], we define an energy community as a community of local energy prosumers (energy customers with potential both small-scale production and/or consumption capabilities), that receives energy from distribution transformers on the edge of the energy community. The
uuid of the respective energy community has previously been defined in the
trafo and
trafo3w, referring to the respective
uuid field.
Table 4 defines the data structure of the respective dataset on weather data.
3. Experimental Design, Materials and Methods
All data in this brief has been acquired by means of the Spark Ecosystem [
7]. The Spark Ecosystem defines a set of Application Programming Interface (API)’s which primarily target two end user groups in aim of ingesting their respective data into the Spark Ecosystem cloud storage. End user groups of interest here are Grid Partners which are typically associated with DSO’s; and, Energy Resource Partners which foremost are aggregators for DER’s, or in a more abstract sense, are any smart sensors that communicate data that can potentially enrich the process of grid aware energy management solutions.
3.1. Grid Partners (DSO’s)
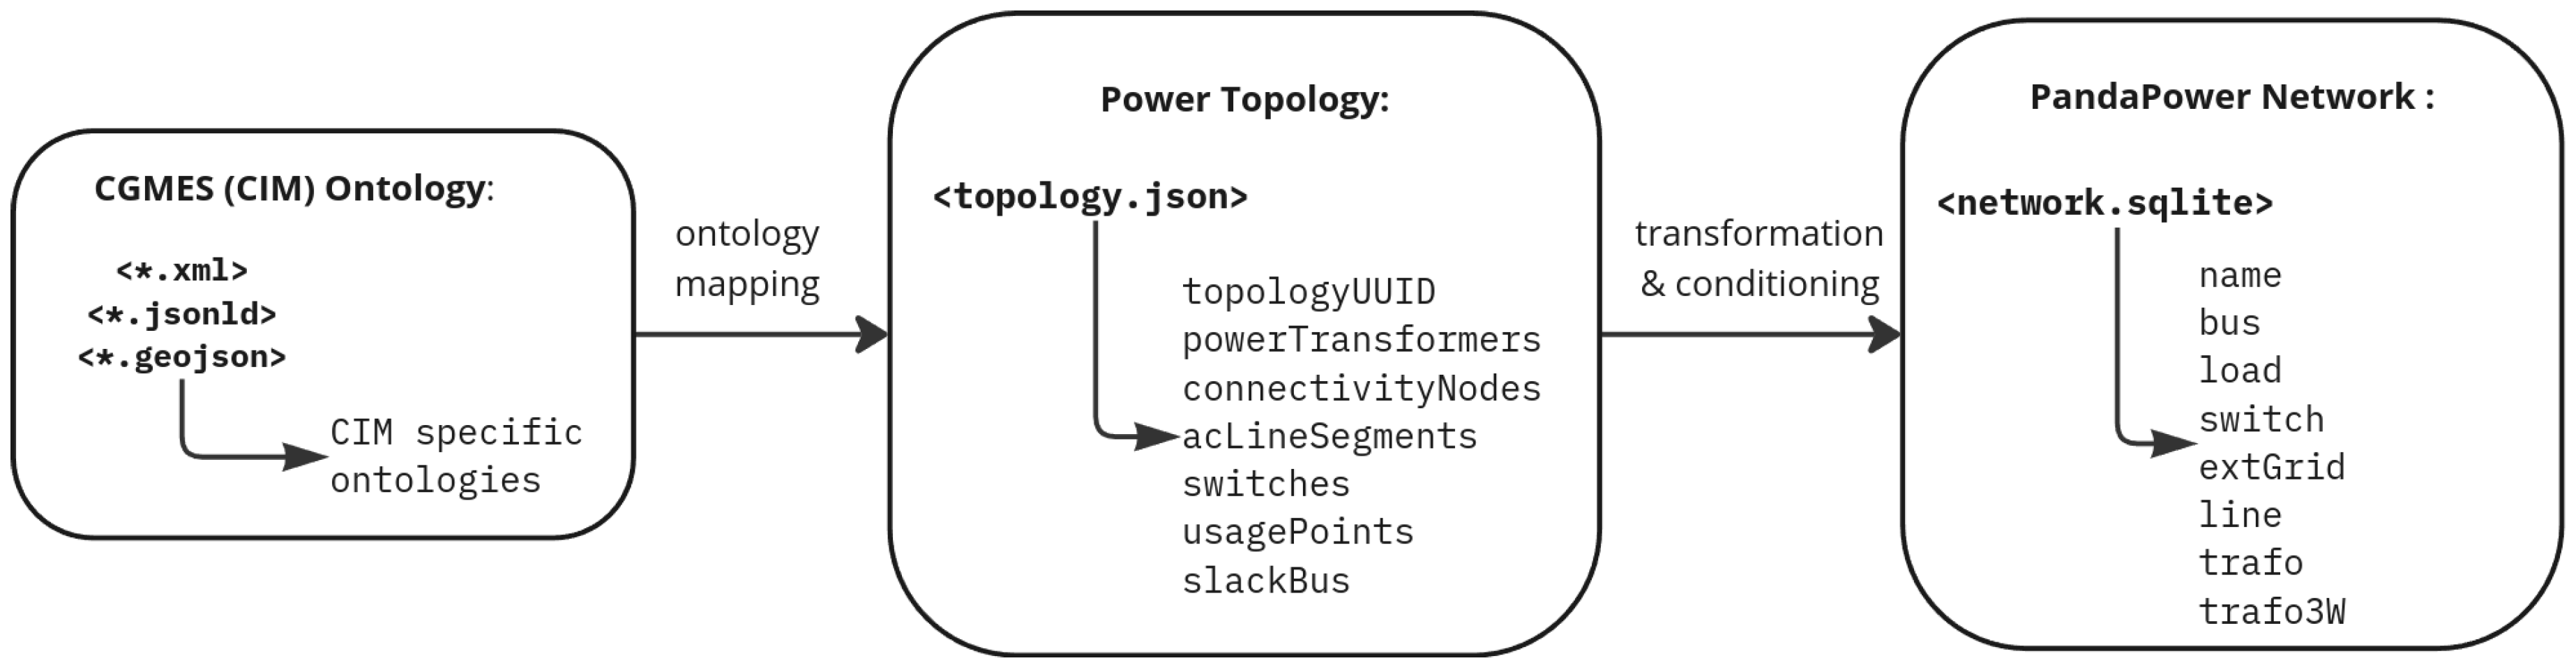
The first primary group of interest are Grid Partners (DSO’s) who, via the Spark Ecosystem, acquire the means to upload network grid documentation primarily in raw format defined according to the Common Grid Model Exchange Standard (CGMES) library [?]. The transformation of ingested network documentation into network models
*.sqlite, elaborated on in
Table 1, has a data workflow as depicted by
Figure 2:
From
Figure 2, CGMES is based on the Common Information Model (CIM) ontology [
8] and primarily uses
*.xml to represent electrical network data. During ingestion, data can be ingested incrementally which may vary among several data formats that can range from
cim.xml,
cim.jsonld to
cim.geojson etc.. After ingestion, the Spark Ecosystem apply CGMES ontology specific mapping rules which allows transforming the ingested CIM data into several structured data topology structures, formatted as (
topology.json), which represents a power system topology. A power system topology in this context defines the connectivity among power components, typically associated with a single energy community, which include power transformers, switches and transmission lines, and loads. At this stage in the process, incomplete data resulting from incremental data ingestion necessitate that some form of data processing is done to condition the power topology data prior to compiling PandaPower network models
network.sqlite.
Data Conditioning for Grid Models
Data contained on the
topology.json data structure may be incomplete due to the incremental data ingestion process used in
Figure 2. The minimum requirement for any
topology.json structure is that we need information on connectivity and loads. The latter, in principle, will allow some rudimentary analysis of electrical connectivity and how the loads are mapped to the network of interest. Information on connectivity and loads can be inferred by having complete information on the
acLineSegments (actual electrical cables and their characteristics such as length, resistance and reactance),
usagePoints (energy loads or connection points where energy can either be consumed or produced), and
connectivityNodes (the network buses at the respective ends of the
acLineSegments elements).
Topologies missing either of these critical components are rejected for further processing. Next, conditioning of
acLineSegments are required where electrical characteristics on resistance and reactance are of particular importance in the context of electrical load flow analysis. Unrealistically small or large values can result in poorly condition
R/X ratios for the energy network which imply the algorithms used for load flow analysis will have difficulty in converging [
5]. The work of [
9] provide guidelines in how to choose appropriate values for the
acLineSegments resistance and reactance, if those values evaluated after ingestion are poorly conditioned and is outlined in Algorithm 1 how it can be applied. Another poorly conditioned value in the context of electrical connectivity can be related to rated bus voltage defined for the respective
connectivityNodes. During ingestion, rated bus voltages are often not defined for all
connectivityNodes elements which implies one has to conduct a recursive backwards search of the topology to determine if rated bus voltages can be inferred from neighbouring buses that have valid rated bus voltages. The latter procedure, in addition, allows the detection of potential conflicting bus voltages which may necessitate further inspection on data quality of raw ingested inputs.
|
Algorithm 1: Algorithm tocondition <R;X> for all acLineSegments. |
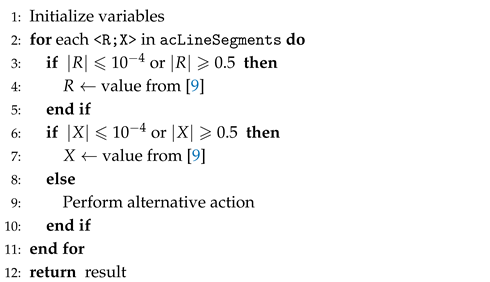 |
Algorithm 2 provides an outline to voltage recovery for the respective buses. The algorithm assumes full connectivity and that at least one bus has a valid defined voltage. Conflicting bus voltages can be observed in particular where the transformer winding has a rated voltage slightly higher defined than the rated voltage on the respective buses. The latter is acceptable to within reasonable bounds of to allow for voltage drop in real operation due to high loads at the edge of the network.
|
Algorithm 2: Bus voltagere covery by recursive search for all connectivityNodes. |
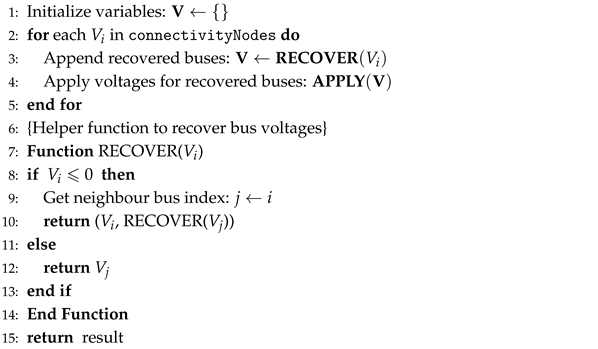 |
3.2. Energy Resource Partners (DER’s)
The second user group that is enabled for ingesting data into the Spark Ecosystem are broadly classified as DER partners who, in principle, are aggregators of DER assets. In the context of AMI assets, the latter can be classified as a smart sensor that serves as a portal (or interface) to the aggregate of energy resources that operate behind the meter. Smart meter sensor data, as measured by locally installed AMI devices, communicate energy consumer load profiles on a temporal resolution of one hour.
Data Conditioning for Sensor Data
The energy load profile data, as measured and communicated by locally installed AMI smart meters, is confidential and need to be anonymized prior to post processing. The geographical location and Automated External Defibrillator (AED) serial number of the smart meter is important as it provides information on how the metering device is tied into the electrical grid infrastructure. The former, however, need to be omitted for the sake of GDPR concerns. The association between smart meters and grid connection points are established by a randomly generated unique
mrid UUID serial number, which replaces the AED serial number. Geographical data are omitted and the interested user is suggested to consult [
10] for plotting the energy network in a Thevenin impedance distance transformation.
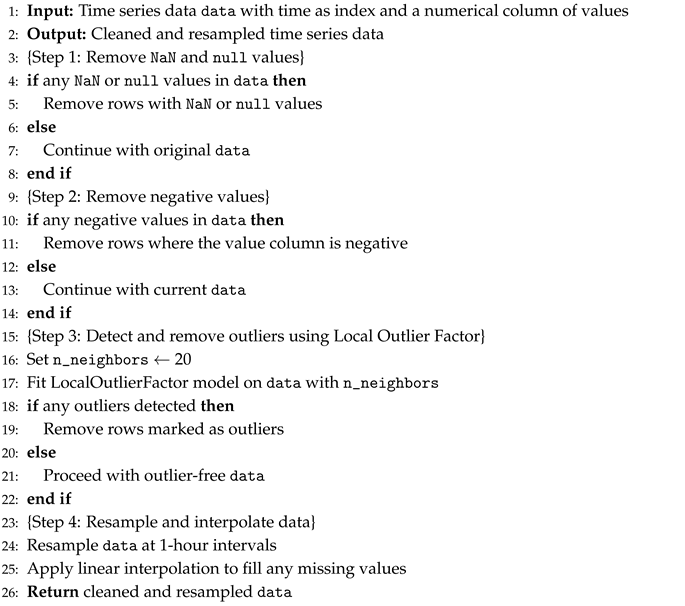
Post-processing of sensor data follows similar data preparation principles one would apply in data science. That is, the data is cleaned from any data outliers (using Python processing libraries such as
sklearn.preprocessing. StandardScaler), poorly defined data fields such as
NAN or
Null entries, and negative values (since active and reactive power are always measured as positive). To account for missing data, some form of interpolation / extrapolation has to be done prior to resampling the data in a uniform one hour resolution. The aim in this brief was to transform the original data in the least amount possible, hence, it is advisable that further processing may be required. Algorithm 3 provides a pseudo outline to processing the smart meter timeseries data. It should be noted that this processing is applied for each column in
Table 3.
|
Algorithm 3: Preprocess Time Series Data. |
 |
3.3. Auxiliary Sensor Data
The addition of auxiliary data, supplied in this dataset, supplements the sensor data in
Section 3.2. Since the data in
Section 3.2 have been anonymized to conform to GDPR concerns, it is impossible for third parties to source weather and price data, applicable for the network of concern, without geographical information. Consequently, energy spot price data has been queried for the region and time-frame of interest by using the Price API supplied by [
11]. The Price API supplied by [
11] provides historical price data in
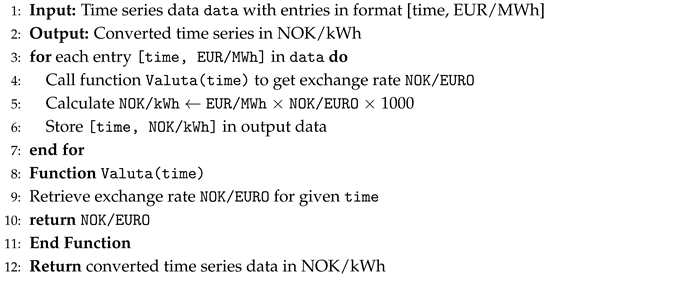
Euro/MWh and therefore need to be converted to
NOK/kWh by using the appropriate valuta exchange rate that was relevant for the time of interest. Historical valuta exchange rates have been obtained from the Norwegian Federal bank
1 and subsequently used in the conversion. Algorithm 4 provides a sketch on how the price data has been prepared for this data set.
The weather dataset, similar to the price dataset, is dependent on geographical location data. As discussed in
Section 2.1.3 weather data has been queried on an energy community level. That is, for every transformer that distribute energy to a subset of loads (energy consumers), weather data specific to the location of the transformer of interest have been queried. To such an extent, we have utilized Visual Crossing API weather service [
12]
2 to query weather data. One can argue that energy communities close in geographical location will share near identical weather data, hence as for the price data, one could have supplied only one weather dataset. That being said, it my be useful in the context of further ML related tasks, to have a refined resolution on weather data which may differ for energy communities on the outer edges of the distribution grid.
|
Algorithm 4: Convert Time Series from EUR/MWh to NOK/kWh. |
 |
4. Limitations
In terms of the supplied network models, no information has been supplied on the rated capacities of the line segments. The latter will be required for more interesting optimal power flow simulations in Pandapower for example. It is however reasonable to assume some standard line specifications which is well documented in [
5] and can readily be used to modify the supplied
network.sqlite models.
5. Conclusion
This dataset provides a comprehensive foundation for analysing medium to low voltage energy distribution networks. By incorporating both network grid data and smart sensor measurements, it enables a deeper understanding of energy flow dynamics, particularly in relation to distributed energy resources (DERs). The inclusion of historical data spanning from 2022 to 2024 allows for robust scenario planning and flexible energy management analysis. The dataset facilitates interdisciplinary research aimed at improving grid operation while promoting sustainability. By making high-quality, structured data available, we support advancements in grid-aware orchestration of DERs, ultimately aiding in the postponement of costly infrastructure reinforcements. Furthermore, the dataset’s structured storage formats and supplementary tools, such as Jupyter notebooks for interactive exploration, ensure ease of use for researchers and practitioners. Future work can leverage this dataset to refine predictive models, assess real-time flexibility in energy networks, and explore optimal strategies for energy distribution. As the energy sector continues its transition toward sustainability, data-driven insights from this resource can contribute significantly to enhancing grid resilience and efficiency.
Author Contributions
Johannes Maree: Conceptualization, Methodology, Software, Formal analysis; Ola Hendseth: Conceptualization, Validation, Resources, Supervision, Funding acquisition; Ivan Schytte: Conceptualization, Validation, Resources, Writing - Review and Editing.
Funding
This work formed part of the Next Generation Virtual Power Plant (NextGenVpp) Skagerak Pilot-e with project nr. 670022. This project has been a research initiative between Volue AS and Skagerak Energy AS under the auspices of Innovation Norge.
Acknowledgments
The authors would like to acknowledge the contributions from both Lede AS and Spark development teams who were primarily concerned with sourcing and ingesting raw network and sensor data prior to further processing.
Data Availability Statement
The data as presented in this brief can be accessed at
Mendeley data repository [
4] with comprehensive reproducibility and user instructions.
Conflicts of Interest
The authors declare no conflicts of interest.
Abbreviations
The following abbreviations are used in this manuscript:
| CGMES |
Grid Model Exchange Specification |
| AMI |
Advanced Metering Infrastructure |
| DER |
Distributed Energy Resources |
| UUID |
Universally Unique Identifier |
| AED |
Automated External Defibrillator |
| GDPR |
General Data Protection Regulation |
References
- Sørensen, Å.L.; Sartori, I.; Lindberg, K.B.; Andresen, I. Electric vehicle charging dataset with 35,000 charging sessions from 12 residential locations in Norway. Data in Brief 2024, 57, 110883. [Google Scholar] [CrossRef] [PubMed]
- Sandell, S.; Bjerkehagen, D.; Birkeland, B.; Sperstad, I.B. Dataset for a Norwegian medium and low voltage power distribution system with industrial loads. Data in Brief 2023, 48, 109121. [Google Scholar] [CrossRef] [PubMed]
- Maree, J.P.; Zaferanlouei, S. A Model Predictive Control Volt/VAr Management System for the Froan network. In Proceedings of the 2021 IEEE PES Innovative Smart Grid Technologies-Asia (ISGT Asia). IEEE; 2021; pp. 1–5. [Google Scholar]
- Maree, J. Energy distribution models with AMI smart meter sensor dataset, 2025. [CrossRef]
- Thurner, L.; Scheidler, A.; Schäfer, F.; Menke, J.; Dollichon, J.; Meier, F.; Meinecke, S.; Braun, M. pandapower — An Open-Source Python Tool for Convenient Modeling, Analysis, and Optimization of Electric Power Systems. IEEE Transactions on Power Systems 2018, 33, 6510–6521. [Google Scholar] [CrossRef]
- de São José, D.; Faria, P.; Vale, Z. Smart energy community: A systematic review with metanalysis. Energy Strategy Reviews 2021, 36, 100678. [Google Scholar] [CrossRef]
- Volue Spark. Volue Spark: Solutions for Energy and Utility Optimization. https://www.voluespark.com/, 2024. Accessed: 2024-10-28.
- Gaha, M.; Zinflou, A.; Langheit, C.; Bouffard, A.; Viau, M.; Vouligny, L. An ontology-based reasoning approach for electric power utilities. In Proceedings of the International Conference on Web Reasoning and Rule Systems. Springer; 2013; pp. 95–108. [Google Scholar]
- Zecchino, A.; Marinelli, M.; Træholt, C.; Korpås, M. Guidelines for Distribution System Operators on Reactive Power Provision by Electric Vehicles in Low Voltage Grids. CIRED-Open Access Proceedings Journal 2017, 2017, 1787–1791. [Google Scholar] [CrossRef]
- Cuffe, P.; Keane, A. Visualizing the electrical structure of power systems. IEEE Systems Journal 2015, 11, 1810–1821. [Google Scholar] [CrossRef]
- Volue Insight. Volue Insight: Energy Market Analytics and Forecasting. https://volueinsight.com/en/, 2024. Accessed: 2024-10-28.
- Visual Crossing. Visual Crossing: Weather Data and Weather API. https://www.visualcrossing.com/, 2024. Accessed: 2024-10-28.
|
Disclaimer/Publisher’s Note: The statements, opinions and data contained in all publications are solely those of the individual author(s) and contributor(s) and not of MDPI and/or the editor(s). MDPI and/or the editor(s) disclaim responsibility for any injury to people or property resulting from any ideas, methods, instructions or products referred to in the content. |
© 2025 by the authors. Licensee MDPI, Basel, Switzerland. This article is an open access article distributed under the terms and conditions of the Creative Commons Attribution (CC BY) license (http://creativecommons.org/licenses/by/4.0/).