
Submitted:
28 May 2025
Posted:
28 May 2025
You are already at the latest version
Abstract
Thirty two healthy adult dogs (16 males and 16 females) were fed control kibble diets for one month, followed by six months (weeks 0 to 25) of diets containing either 0, 4, 6, or 8% cultured protein derived from Methylococcus capsulatus (FeedKind Pet®, FK), then fed control diets (0% FK) for a further two months (weeks 25 to 34). Diets were isonitrogenous, isolipidic and isocaloric and stage and age specific. Dogs were assessed for overall health, weight gain, and body condition score (BCS). Blood samples were collected 1 week prior to randomization, during acclimation, then in weeks 5, 13, 25, 30, 32 and 34 for hematology, coagulation, and clinical chemistry; urine was collected to the same time schedule for urinalysis. Feces were assessed for parasite load and presence of occult blood during weeks 5, 9, 13, 17, 21 and 25. Fecal samples were collected during acclimation and weeks 25 and 34 for fecal microbiome analysis and in week 25 for apparent total gastrointestinal tract digestibility (ATTD). All dogs maintained a healthy weight and BCS throughout the study. Hematology parameters were within normal limits at the end of each phase of the study. With the exception of a decrease in sera phosphorus level and in urine pH in all groups at the end of the study, urine and sera chemistry results were within normal limits at the end of each phase. ATTD values for organic matter, protein and energy exceeded 80%, whilst digestibility values for copper were around 20%. The fecal microbiome was dominated by Firmicutes. Alpha diversity increased during the safety phase before returning to baseline levels during the washout phase. The dominant genera in all groups were Megamonas, Peptoclostridium, Turicibacter, Catenibacterium, Fusobacterium, Romboutsia, and Blautia. The study has shown that inclusion of cultured protein in adult dogs at up to 8% of the total diet can provide sufficient nutrition for growth and is safe with no long term effects on a range of health parameters.
Keywords:
target animal safety
; single cell protein
; microbial protein
; postbiotic
; nutrition
; diet formulation
; microbiome
; digestibility
1. Introduction
There is a steady increase in demand for high-quality protein sources in pet food from pet parents, creating competition with the human food system and challenging our current food structure sustainability [1]. It is estimated that by 2050, the population will have increased by 35%, causing the need for food to increase by 70% and meat production to increase by 100% from needs in 2010 [2,3]. This is further exacerbated by using protein resources to feed companion animals. In 2020, it was estimated that the mean annual global land use to produce dry pet food was 49 megahectare (Mha). This is approximately twice the land area of the United Kingdom [4]. To help alleviate these strains on the food system, there is an opportunity for the pet food industry to explore alternative protein sources that are both nutritionally appropriate and sustainable. Full nutrition profiles that include macro- and micro-nutrient profiles including amino acids, digestibility testing, target animal safety testing, and palatability studies are a few important considerations when evaluating alternative protein sources for pet food. This will help to ensure that a complete and balanced food can be properly formulated. We hypothesize that cultured protein is a safe, sustainable, and environmentally friendly alternative protein source for complete and balanced dog food. By integrating cultured protein into dog food formulations, we aim to create nutritionally complete and balanced diets that support pet health while addressing the pressing environmental challenges associated with traditional protein sources.
A well-established alternative to traditional meat-based proteins in pet food are plant protein sources [5]. Unfortunately, plant protein is not always a complete protein. For example, it does not supply any significant amount of the amino acid taurine which is an essential nutrient for cats, so diets made with plant proteins must be fortified properly to make them complete and balanced for pets [6]. Plant proteins also can be lacking in other essential sulfur containing amino acids such as cystine and methionine. Several studies have shown that commercial plant-based pet foods may not be complete and balanced even though they claim to be and require fortification to sustain their limitation in minerals and amino acids [7,8]. Other studies have shown that properly formulated plant-based protein diets are a viable alternative protein source for dogs [9,10]. Plant proteins may be more environmentally sustainable than traditional animal proteins [11]. However, a potential downfall is that they may not match the nitrogen metabolism of animal proteins, they may require complementary proteins to supplement to meet all amino acid requirements, and the variability in amino acid digestibility requires that they are carefully formulated to avoid deficiencies [12,13,14,15].
Insects appear to be a promising alternative as their life cycle is short, and they have a high turnover and biomass conversion rate [16]. In addition they have been shown to be a highly palatable alternative to traditional protein sources in dog food [17,18]. Several studies have demonstrated that dogs not only accept insect protein well but that insect protein can have high digestibility and good amino acid composition when compared to traditional animal proteins [17,19,20,21]. Yet the production of insect protein and its use in the pet food industry is still faced with some challenges, more notably is customer perception. However, there are also ethical aspects like species-specific killing methods, mass-rearing conditions, and transportation [22]. The risk of foodborne microbial contamination, allergenic responses, palatability, and long-term safety in pets still need to be demonstrated [23,24].
Single-cell organisms such as bacteria, yeasts, fungi, and microalgae [25] are gaining more and more acceptance as protein sources, known as single cell proteins (SCP). Due to its high productivity and its approval by the Food and Drug Administration (FDA) and the World Health Organization (WHO) for human consumption, SCP have emerged as a promising alternative protein source for animal feed that scientists believe will play a vital role in altering the traditional food supply chain [26,27,28] by providing alternative sustainable sources [29]. Cultured protein, derived from Methylococcus capsulatus, has an amino acid profile suitable for fish, livestock as well as companion animals and can be used as a substitution for more conventional protein sources like fishmeal [30,31,32,33]. Cultured protein has been shown to be a safe alternative to fishmeal protein in numerous aquaculture species [34,35,36,37,38,39]. Additionally, it has demonstrated safety in feeding terrestrial species such as pigs [40,41,42,43,44,45], chickens [32,33,46,47,48], mink [32,49,50,51], and foxes [52,53].
FeedKind® Pet, FK (Calysta Inc., CA, USA) is composed of approximately 90% of a methanotroph bacteria Methylococcus capsulatus Bath, alongside Aneuribacullis danicus, Brevibacillus agri and Cupriavidus cauae that is grown on methane gas involving aerobic fermentation, processed using centrifugation, heat inactivation, and spray drying into a highly concentrated protein source [54,55]. These microorganisms as a protein source offer several advantages to traditional proteins, with rapid growth and high protein content within a short time frame compared to traditional livestock farming. FeedKind has a high protein value (>65% protein, 5% fat, and 12% ash).
It is economical to use gas fermentation to produce protein because of its reasonable cost, low transportation cost, and sufficient supply [56]. Cultured protein production systems require significantly less land and water compared to conventional protein sources. Cultured protein can be a rich source of essential amino acids, vitamins, minerals, and other vital nutrients crucial for canine health with a balanced amino acid profile with high amino acid (AA) digestibility and DIAAS-like values >100 [57]. In addition, cultured protein has numerous bio-active cofactors present and offers a clear opportunity for value addition to the ingredient [58]. Some of these are well-known (e.g., n-3 LC-PUFA, nucleotides, or peptidoglycans), while others are less known [59]. Cultured protein potential as a pet food ingredient is promising based on results in mink and fox with regard to digestibility and palatability, but more studies are needed in dogs.
Despite these advantages, the use of cultured protein in pet food remains a relatively new concept and requires further research. The aim of this study was to evaluate the safety, bioavailability, digestibility, and microbiome effects of FeedKind cultured protein as an alternative protein source of nutrition when administered to male and female adult dogs via diet at 4%, 6%, and 8% dietary inclusions over a 6 month period with a 2 month period of recovery. We hypothesized that cultured protein is a safe, sustainable, and environmentally friendly alternative protein source for complete and balanced dog food. By integrating cultured protein into dog food formulations, we aim to create nutritionally complete and balanced diets that support pet health while addressing the pressing sustainability challenges associated with traditional protein sources.
2. Materials and Methods
2.1. Diets
The four test diets had the following FeedKind® (FK) percent inclusions and diet designations: 0% (FK0), 4% (FK4), 6% (FK6), or 8% (FK8). The FK mainly replaced the soybean meal component of the diet. Nutrient composition of FK is shown in Table 1 and proximate composition and formulation of the test diets are shown in Table 2. Crude protein, crude fat, crude fiber, and ash concentrations were formulated to be the same among all diets and each diet met the Association of American Feed Control Officials (AAFCO) requirements for all life stages of the dog [60]. Extruded kibble diets were produced on the same production line at Kansas City Treats (Kansas City, KS USA). Diets were stored at 18-24°C until the study commenced.
2.2. Animal Selection and Housing
Charles River Laboratories (Ashland, OH, USA) Animal Care and Use Committee approved all animal care procedures before animal experimentation. All methods adhered to the United States Public Health Service Policy on Humane Care and Use of Laboratory Animals. Dogs were immunized against parvovirus, distemper, adenovirus type 2, parainfluenza, Leptospirosis, Bordetella, and rabies prior to arrival at the testing facility. Thirty-six purebred beagles (5.8 to 10.4 kg) were acclimated for twenty-six days (Day -26 to Day -1). Four dogs (2 males and 2 females) were alternates for this study. Thirty-two intact adult dogs (16 males and 16 females) that were individually identified with an ear tattoo and a subcutaneously implanted electronic identification chip were included in the study (Day 1). Males and females were housed in separate rooms that were maintained at 19-24°C with a relative humidity of 30-70% and a lighting regimen of 12L:12D. Mean age was 13-14 months on day 1.
2.3. Feeding Trial
Body weights (BW) were measured in kilograms to 1 decimal point one week prior to the start of the study and subsequently on a weekly basis (± 2 days). Dogs were assigned a body condition score (BCS) on a scale ranging from 1 to 5 (where 1 was thin, 2 was lean, 3 was optimal, 4 was heavy and 5 was very obese) which were conducted one week prior to randomization, on the day of randomization, on Day -1, then every 4 weeks until end of the study. Dogs with low food consumption or in poor body condition were excluded, after which the statistician randomly assigned the remaining animals into one of the four dietary treatment groups (stratified by sex). Animals were then assigned to pairs within the same sex and treatment group and then randomly assigned to adjacent cages. The randomization was performed using SAS Release 9.4 (SAS Institute, Cary, NC). Pair socialization occurred daily for 2-4 hours within assigned pairs following the end of the daily feeding period.
Prior to acclimation (Day -26 to Day -1), dogs were offered 300g each of a standard lab diet then transitioned to a 50:50 mix of standard diet and control diet (FK0) for one week before being fed only FK0 diet based on the desired kcal/day requirements (approximately 2.5-3.0% body weight per day) for the remainder of the acclimation period. Starting on Day 1 (study start), 8 dogs (4 males and 4 females) continued on the control kibble (FK0), and the remaining dogs were fed test diets containing either 4% (FK4), 6% (FK6) or 8% (FK8) cultured protein for 180 days (safety phase). Each of the study groups eating the test diets including FeedKind contained 4 males and 4 females. On Day 181 (recovery / washout period), the FK feeding was discontinued and all dogs were fed the FK0 kibble until Day 239 when the dogs were transferred to the Charles River Ashland animal colony. The dogs were provided with weighed food once daily at approximately 8:00 am beginning on Day -26 to the end of the study. Any food remaining after at least three hours was removed, weighed and recorded. To ensure that all the dogs were offered enough food to maintain their ideal BW, the desired kcal/day for each dog was calculated using the resting energy requirement for dogs [61], as per equation 1, as below:
70 × [(BW in kg)0.75 ×2]
The diet amounts were adjusted weekly with the aim of maintaining an acceptable BCS and a body weight within 10% of each dog’s body weight at the beginning of the study. Feed conversion ratios (FCR) were calculated using equation 2, as below:
Food Consumed (kg) / [(Final Weight (kg) – Initial Weight (kg)]
FCRs were calculated for the whole study (day 0 to day 239), for the safety phase (day 0 to 180), and for the recovery phase (day 181 to 239). Weight gain (WG) (expressed as a %) was calculated using equation 3, as below:
((Final Weight (kg) – Initial Weight (kg)) / Initial Weight (kg)) × 100
WG values were calculated for the same time periods as FCR. Fresh, clean water was available at all times. If necessary, due to clinical signs such as prolonged inappetence, supplemental diet (e.g. canned food) or added water was provided to individual animals as recommended by the clinical veterinarian. Provision of supplemental feed was considered as a reason to exclude that animal from the study. Study staff were blinded to dose group assignments throughout the study.
2.4. Clinical Examinations
Cage side observations were performed by technicians at least twice daily (prior to feeding and again in the afternoon) throughout the study and included but were not limited to general condition, general attitude, cognition, presence of emesis or abnormal urine or feces. Detailed clinical observations were performed by technicians weekly throughout the study and included but were not limited to evaluation of excreta, reaction to touch, muscle tone, respiration, coat, skin, eyes, ears, nose, mouth, genitals, anus and any visible or palpable masses. Complete veterinary physical examinations by a licensed clinical veterinarian were performed one week prior to randomization, one week prior to day 1 of the study, and during weeks 5, 13, 25, 30 and 34 of the study. Examinations included evaluations of the ocular, musculoskeletal, cardiovascular, respiratory, nervous, integumentary, lymphatic, genitourinary and gastrointestinal systems as well as the general behavior and gait of the animal. Evaluation (normal/abnormal) of the cardiovascular and respiratory systems included thoracic auscultation, heart rate, respiratory rate, mucous membrane color, and evaluation of capillary refill time. The examination of the integumentary system included an otoscopic exam and evaluations of skin and hair coat. Lymphatic system evaluation included palpation of submandibular, prescapular, popliteal, and inguinal lymph nodes. Body temperature was also taken.
A complete ophthalmic examination was conducted on all dogs by a board-certified ophthalmologist prior to selection for study and during week 25. The ophthalmic exam included use of an indirect ophthalmoscope and slit lamp biomicroscope. Prior to each exam, each dog was treated with 1% tropicamide. Neurologic examinations were conducted on all dogs prior to selection for study, and in weeks 25, 30 and 34. These neurologic exams were conducted by a clinical veterinarian and included general attitude, behavior and muscle function. Proprioception and postural reactions were evaluated via proprioceptive positioning, hemi-hopping, hemi-standing, wheelbarrowing, hooping, placing reactions (tactile), extensor thrust, placing reactions (visual), righting reactions and eye tracking. Cranial nerves were evaluated via head movement, head symmetry, pupil symmetry, vestibular nystagmus, eye position, head muscle tone, palpebral reflex, pupillary light reflex, eye menace reflex, jaw tone, tongue test and pharynx test. Spinal nerves were evaluated via muscle tone, flexor reflex, perineal reflex, panniculus reflex and patellar reflex.
2.5. Sample Collection
Fasting blood samples were collected via venipuncture from the jugular vein. Two mL of blood was placed in a potassium EDTA blood tube for CBC analyses, two mL of blood was placed in a sodium citrate blood tube to isolate plasma for coagulation analyses and 1.5 mL of blood was placed in a serum separator blood tube for serum chemistry profile analyses. Blood samples were collected 1 week prior to rando-00mization, in week -1 during acclimation, then in weeks 5, 13, 25, 30, 32 and 34.
In addition to general daily and weekly fecal assessments as described above, fecal samples from individual dogs were collected and assessed for presence of parasites and / or their eggs, and for the presence of occult blood one week prior to randomization, during week -1 of acclimation, and during weeks 5, 9, 13, 17, 21 and 25. At day -10 (during acclimation), day 178 and day 235 a target weight of 5 (+/-2)g of fresh feces from each dog was collected and placed in a single collection unit per subject. Samples were stored in a freezer set to maintain -70°C before being shipped in a single batch to the University of Illinois for fecal microbiome analysis. From days 176-180, dogs in all four study groups were individually housed and all feces collected and weighed. After weighing, feces from each dog was placed in sealed, labelled containers and stored at -20°C until required for the determination of apparent total tract digestibility.
Urine from all dogs was collected overnight using urine collection pans at week -1 during acclimation, then weeks 5, 13, 25, 30, 32 and 34.
2.6. Analytical Methods
2.6.1. Proximates
Third-party laboratory testing (Midwest Laboratories, Omaha, NE) was conducted on the finished test diets at the end of the study (20 months after production) (Table 3). Values were determined using AOAC methods [117] as follows: moisture (AOAC 930.15), amino acids (AOAC 994.12), cysteine and methionine (AOAC 994.12), tryptophan (AOAC 988.15), fatty acids (AOAC 996.06), crude protein (AOAC 990.03), acid hydrolysis fat (AOAC 954.02), crude fiber (AOAC Ba 6a-05), ash (AOAC 942.05), water soluble vitamins [120], and peroxide values determined using HPLC. Heavy metals (arsenic, cadmium, lead, mercury) and aromatic hydrocarbons in the cultured protein source were determined using ICP-MS.
2.6.2. Hematology and Coagulation
Complete blood count (CBC) analyses for each dog at each timepoint was performed using an Advia 2120i (Siemens Healthineers, USA) and included: red blood cell count (106/µL), hemoglobin concentration (g/dL), hematocrit (%), mean corpuscular volume (fL), red blood cell distribution width (%), mean corpuscular hemoglobin concentration (g/dL), mean corpuscular hemoglobin (pg), reticulocyte count (109/L), platelet count (103/µL), mean platelet volume (fL), white blood cell count (103/ µL), neutrophil count (103/ µL), lymphocyte count (103/ µL), monocyte count (103/ µL), eosinophil count (103/ µL), basophil count (103/ µL), and large unstained cells (103/ µL).
Coagulation blood parameters were analyzed using Stago STA Compact Max Coagulation (Stago, USA) and included: activated partial thromboplastin time (seconds), fibrinogen (mg/dL) and prothrombin time (sec). All data were compared with in-house (Charles River Laboratories (CRL), unpublished) reference ranges for males and females older than 12 months.
2.6.3. Clinical Chemistry
Serum clinical chemistry profiles were analyzed by an Advia 1800 (Siemens Healthineers, USA) and included: alanine aminotransferase (ALT) (U/L), aspartate aminotransferase (AST) (U/L), alkaline phosphatase (U/L), gamma-glutamyltransferase (U/L), creatine kinase (U/L), total bilirubin (mg/dL), blood urea nitrogen (mg/dL), creatinine (mg/dL), calcium (mg/dL), phosphorus (mg/dL), bicarbonate (mEq/L), bile acids (mg/dL), lactate dehydrogenase (U/L), total protein (g/dL), albumin (g/dL), globulin (g/dL), albumin/globulin ratio (A/G), glucose (mg/dL), cholesterol (mg/dL), triglycerides (mg/dL)), sodium (mEq/L), potassium (mEq/L) and chloride (mEq/L). All data were compared with in-house (CRL, unpublished) reference ranges for males and females older than 12 months.
2.6.4. Urinalysis
Urinalysis parameters, obtained with the Advia 1800 (Siemens Healthineers, USA), included color, appearance/clarity, specific gravity (via refractometer), pH (via electrode measure), microscopy (including crystals, casts, red blood cells, white blood cells, and epithelial cells), volume, protein, glucose, bilirubin, ketones, and presence or absence of blood. All data were compared with the test facility’s historical control reference ranges for males and females older than 12 months.
2.6.5. Fecal Analysis and Digestibility Calculations
At the end of the study, the stored frozen fecal samples along with 250 grams of each of the four test diets were sent to the University of Illinois for analyses. Fecal samples were dried at 55 °C in a forced-air oven. Composite samples of the diet and dried fecal material from each animal were separately ground using a 2-mm screen in a Wiley Mill (Model 4, Thomas Scientific, Swedesboro, NJ, USA). Dry ice was incorporated during the grinding process to minimize nutrient degradation. The ground diet and fecal samples were analyzed for dry matter (DM) and ash content following the methods specified by the Association of Official Analytical Chemists {117] (DM: method 934.01; ash: method 942.05), with organic matter (OM) calculated accordingly.
Total lipid content was determined using acid hydrolysis and extraction methods facilitated by ANKOM Technology equipment (Hydrolysis System, XT15 Extractor, and RD Dryer; Macedon, NY, USA). Crude protein (CP) content was derived from total nitrogen values obtained via a Leco analyzer (TruMac N, Leco Corporation, St. Joseph, MI, USA; [117]. Gross energy was assessed using an oxygen bomb calorimeter (Model 6200, Parr Instruments, Moline, IL, USA). Total dietary fiber (TDF) content of the diets was measured using the method outlined by Prosky et al. [119]. Finally, copper content was analyzed according to AOAC [118](method 968.08). Briefly, dry ashed diet and fecal samples were solubilized in a 20% HCl solution and then quantified using flame atomic absorption spectroscopy (PerkinElmer, Shelton, CT, USA).
Data from fecal and feed analysis in conjunction with the total amount of diet eaten and feces produced during the collection period by each dog were used to determine apparent total tract macronutrient digestibility (ATTD) values using the equation 4, as below:
[[nutrient intake (g per day) – fecal output (g per day)] / nutrient intake (g per day)] × 100
Dietary nitrogen-free extract (NFE), expressed as a percentage, was calculated using equation 5, as below:
100 – [Fat (%) + Crude Protein (%) + Ash (%) + Total Dietary Fiber (%)]
2.6.6. Fecal Microbiota Analysis
Total DNA from feces was extracted using DNeasy Powersoil Pro Kit (Qiagen, Carlsbad, CA, USA). The concentration of extracted DNA was quantified using a Qubit 3.0 Fluorometer (Life Technologies, Grand Island, NY). 16S rRNA gene amplicons were generated using a Fluidigm Access Array (Fluidigm Corporation, South San Francisco, CA) in combination with Roche High Fidelity Fast Start Kit (Roche, Indianapolis, IN). The primers 515F (5′-GTGCCAGCMGCCGCGGTAA-3′) and 806R (5′-GGACTACHVGGGTWTCTAAT-3′) target a 252 bp-fragment of the V4 region of the 16S rRNA gene that were used for amplification (primers synthesized by IDT Corp., Coralville, IA, USA) according to [62]. CS1 forward tag and CS2 reverse tag were added according to the Fluidigm protocol. The quality of the amplicons was assessed using a Fragment Analyzer (Advanced Analytics, Ames, IA) to confirm amplicon regions and sizes. A DNA pool was generated by combining equimolar amounts of the amplicons from each sample. The pooled samples were size selected on a 2% agarose E-gel (Life technologies, Grand Island, NY, USA) and extracted using a Qiagen gel purification kit (Qiagen, Valencia, CA, USA). Cleaned size-selected pooled products were run on an Agilent Bioanalyzer to confirm the appropriate profile and average size. Illumina sequencing was performed on a MiSeq using v3 reagents (Illumina Inc., San Diego, CA, USA) at the Roy J. Carver Biotechnology Center at the University of Illinois. Fluidigm tags were removed using the FASTX-Toolkit (version 0.0.14), and sequences were analyzed using QIIME 2, version 2023.7 [63] and DADA2 (version 1.14) [64]. High quality (quality value ≥ 20) sequence data derived from the sequencing process were demultiplexed. Data were then denoised and assembled into amplicon sequence variants (ASV) using DADA2 [64]. Taxonomy was assigned using the Naive Bayes classifiers trained on the Silva database (v.138) [65,66,67]. Singletons (ASV that are observed fewer than two times) and ASV that have <0.1% of total observations were discarded. An even sampling depth was used to assess alpha diversity and beta diversity measures. Beta diversity was assessed using weighted and unweighted UniFrac distance [68] measures and presented using principal coordinates analysis (PCoA) plots.
2.6.7. Statistical Analysis
All animal data were summarized through descriptive statistics or frequency counts at each time interval with mean and standard deviation and/or incident counts (categorical variables) calculated for each endpoint. Data were analyzed using SAS Release 9.4 (SAS Institute, Cary, NC, USA). Body temperature, respiration rate, heart rate, body weight, hematology, coagulation, clinical chemistry, and urinalysis were analyzed by Repeated Measures Analysis of Covariance (RMANCOVA) with the fixed effects: treatment (TRT), time (TIME), sex (SEX); the 2-way interactions TRT•SEX, TRT•TIME, and TIME•SEX; and the 3-way interaction TRT•TIME•SEX and a covariate all as fixed effects [69]. BCS, food consumption and neurological examinations were analyzed by Repeated Measures Analysis of Variance (RMANOVA) with TRT, TIME, and SEX, the 2-way interactions TRT•TIME, TRT•SEX, and SEX•TIME, and the 3-way interaction (TRT•TIME•SEX) all as fixed effects. Digestibility endpoints were analyzed by Analysis of Variance (ANOVA) using a model that included terms for TRT, SEX, and TRT•SEX interaction. As the only endpoints that fell in this category were ratios, a generalized linear model was used. Differences in all tests were considered significant when P < 0.10. Phyla and genus relative abundance of microbiome data were analyzed using the mixed model procedure of SAS (SAS Institute, Inc., Cary, NC, USA). The fixed effects of treatment (TRT), day, and their interaction (TRT*Day) were tested. Animals were considered a random effect. Least-squares means were calculated for each variable across time points, with post-hoc pairwise comparisons adjusted using Tukey’s method. Statistical significance was determined at a threshold of P < 0.05.
3. Results
3.1. Proximate Analysis and Feed Quality
Nutrient concentrations of each diet were similar in composition with a lower ash and protein content in the FK0 diet compared with the test diets. All other measures, including gross energy, fats and fiber, were similar across all feeds. Minor differences in proximate components between samples analyzed prior to start of study (Table 2), at the end of the study (Table 3) and data used to calculate digestibility data (Table 4) reflect use of different analytical labs. All diets had complete AAFCO nutrient profile analyses performed and all diets met the AAFCO recommendations for adult dog maintenance [60} and Table 3. Additionally, testing of feed samples for proximates, minerals, fatty acids, amino acids and vitamins B2 and B5, 20 months after production confirmed that all diets still met AAFCO guidelines (Table 3). Hexanal levels were below level of quantification (LOQ) whilst peroxide values were 14.5, 17.8, 19.1 and 17.9 meq/kg fat for FK0, 4, 6 and 8 respectively 20 months after production. Values for heavy metals (arsenic, cadmium, lead, and mercury) and aromatic hydrocarbons in the cultured protein were also <LOQ.
3.2. Food Consumption and Body Weight
Whilst food offered was adjusted to maintain body weight and BCS through the study, food consumption was unaffected by treatment group. A statistically significant F test for TRT•TIME interaction was found (P = 0.0436) due to an increase in daily consumption by week through the study. A concomitant increase in body weight was noted as a result (Table 5). However, this increase was within the ±10% difference in body weight planned as part of the study design.
Whilst FCR increased with increasing FK inclusion during the safety phase of the study, this trend was not reflected during the recovery phase, with the lowest FCR noted in the FK8 group. This pattern was also noted in FCR values for the whole study with the lowest FCR values in the FK0 group, increasing with increased inclusion levels. Weight gain rate showed a reduction with increasing FK inclusion during the safety phase as well as over the whole study but an increase in weight gain with increasing FK inclusion during the recovery phase.
BCS were maintained between 2.0 and 3.5 for all groups with no statistically significant differences in BCS between groups or in individuals throughout the study.
3.3. Clinical Observations and Treatments
A small number of clinical observations were noted infrequently in both control and treatment groups which were not considered to be related to the diet and were common findings for laboratory dogs of this age and breed. No statistical differences in body temperature, heart rate, respiration rate, or behavior, between controls and treatment groups were noted at any time point. Additionally, no differences were noted in ophthalmology or neurology observations, although a few findings were noted. One FK0 female had absent righting reactions (failure to regain upright position when placed on side) during the recovery phase. One female and 1 male in the FK4 group and 1 male in the FK8 group showed decreased menace reflex (no blink response when eye approached with a hand) during the recovery phase which were considered incidental. Also, during the recovery phase, one female in the FK4 group had a decreased flexor reflex (reduced withdrawal of limb away from stimulus) and one female in the FK0 group had an absent perineal reflex (lack of anal sphincter contraction and tail flexion).
Veterinary treatments included the administration of 50-75mg of carprofen for up to 3 days for two dogs respectively in each of the FK0, FK4, FK6 and FK8 treatment groups. One female in the FK4 group was noted with a small ranula under the tongue prior to the start of the study. On day 92, this was excised under anesthesia with the dog being given 0.3 mL buprenorphine (0.3 mg/mL) for two days post surgery and amoxicillin trihydrate and clavulanate potassium tablet daily for 7 days post-surgery. This female recovered uneventfully. One female dog in the FK8 treatment group was given supplemental feed in the form of canned food starting at day 29 for one week at the request of the veterinarian due to inappetence. As this was one of the exclusion criteria for the study, she was not subject to further analysis but was kept in the study to minimize any welfare issues for her pair housed partner.
Finally, all dogs were treated for a suspected nematode infection with 5 mg/kg pyrantel on days 72 and 93.
3.4. Hematology and Coagulation
This dog population was highly variable, leading to many differences in blood parameters over time and among diets (Table 6). No significant treatment or treatment interaction F tests were noted for red blood cell count, mean corpuscular hemoglobin concentration or mean platelet volume. A significant three-way interaction F test was noted for mean corpuscular volume (P = 0.0116), mean corpuscular hemoglobin (P = 0.0359), red blood cell distribution width (P = 0.0768) and platelet count (P = 0.0033). Significant F tests for the time by treatment interaction were found for hemoglobin (P = 0.0548), and hematocrit (P = 0.0563), whilst reticulocyte count had a statistically significant main effect of treatment F test (P = 0.0336). However, all of these measures remained within normal limits and followed a similar pattern, irrespective of inclusion level. Full data for males, females and males and females combined are available in Supplementary Table S1.
For white blood cells, no significant treatment or treatment interaction F tests were noted for lymphocyte counts, basophil counts, or large unstained cells. Significant F tests for the time by treatment interaction were found for white blood cells (P = 0.0004), neutrophil count (P = 0.0005), monocyte count (P = 0.0155) and eosinophil count (P = 0.0006). Values for white blood cell count, neutrophil count, and monocyte count showed a similar pattern, irrespective of dose, with an increase up to day 85 in all groups, a decline up to day 220 and a subsequent increase on day 232. Values for white blood cell count, neutrophil count, and monocyte count were above normal limits on day 85 for FK6 (white blood cell count: P = 0.0008; neutrophil count: P = 0.0007; monocyte count: P = 0.0005) and FK8 (white blood cell count: P = 0.0003; neutrophil count: P = 0.0002; monocyte count: P = 0.0033) but had returned to normal limits by the next sample point (day 169). Eosinophil counts remained within normal limits throughout the study for all groups.
Minor differences in activated partial thromboplastin time and prothrombin time were not statistically significant and, as they did not show a dose response, were considered normal (Table 7). An increase in fibrinogen in both males and females in FK4, FK6 and FK8 was noted up to day 85, after which it declined up to day 220. Whilst this increase showed a statistically significant (P = 0.0431) time by treatment interaction, it was still within normal limits for dogs at this stage and age, with the exception of the FK6 diet on day 85 (P = 0.0005), driven by a value of 316 mg/dL in the fibrinogen values for females (max value in reference range 300 mg/dL. A slight increase was noted in all groups at day 232 during the recovery phase. Full data for males, females and males and females combined are available in Supplementary Table S2.
3.5. Clinical Chemistry
Ten of the chemistry endpoints had no significant treatment or treatment interactions including gamma-glutamyltransferase, creatine kinase, creatinine, bicarbonate, bile acids, lactate dehydrogenase, cholesterol, triglycerides, sodium and chloride (Table 8). In addition, four endpoints had significant three-way interactions at the α =0.05 level of significance and were thus excluded from pair-wise comparisons. These were AST (P = 0.0339), total bilirubin (P = 0.0417), blood urea nitrogen (P = 0.0275) and albumin (P = 0.0068). Significant time by treatment F tests were seen for ALT (P = 0.0100), alkaline phosphatase (P = 0.0093), calcium (P = 0.0749), total protein (P = 0.0832), albumin/globulin ratio (P = 0.0667), glucose (P = 0.0188) and potassium (P = 0.0236). One analyte, phosphorus, showed a statistically significant F test for the sex by treatment interaction (P = 0.0914) with the difference being noted only in the females. Globulin had a statistically significant F test for the main effect of treatment (P = 0.0413). Changes in the various clinical chemistry endpoints showed a similar pattern, irrespective of dose. All those showing a statistically significant interaction maintained values within normal range with two exceptions – ALT with a value just above the normal range for FK8 on day 29, and phosphorus with values just below the normal range on days 169, 220, and 232 for FK0, FK6, and FK8. Full data for males, females and males and females combined are available in Supplementary Table S3.
3.6. Urinalysis
Occasional differences in individual and mean urine volume, specific gravity, and pH that were not considered biologically meaningful were noted (Table 9). Urine volume had no statistically significant treatment related effects or interactions. There was a statistically significant time by treatment F test for urine specific gravity (P = 0.0415), which was explained by males and females showing a change in specific gravity tested during the recovery phase (d204) in the FK6 group compared with the FK0 (P = 0.0028); values remained within normal limits. For urine pH, a significant treatment main effect was found (P = 0.0945). Pair-wise comparisons of treated group means to controls showed an increase in pH in males and females FK4 (P = 0.0426) and in males and females in FK6 (P = 0.0331). There were some variations between dosed groups among physical (appearance), biochemical (occult blood, protein, etc.), and microscopic urinary components (red and/or white blood cells, bacteria, crystals, etc.); however, these findings were considered sporadic, consistent with biologic and procedure-related variation, and/or negligible in magnitude, and not related to treatment. Full data for males, females and males and females combined are available in Supplementary Tables S4 and S5.
3.7. Apparent Total Tract Digestibility (ATTD)
Apparent total tract digestibility measurements of macronutrients and energy showed similar results irrespective of inclusion level with organic matter, protein and energy having ATTD values above 80%, whilst ATTD values for fat exceeded 90% (Table 10). Although crude protein digestibility was not statistically significant between groups, there was a statistically significant F-test for the interaction between sex and treatment (P = 0.0376) which was explained by lower ATTD values for females in the FK4 group (ATTD = 79.51%, P = 0.0046) and the FK8 group (ATTD = 80.43%, P = 0.059), compared with the FK0 group (ATTD = 82.41%). Statistically significant differences were noted for organic matter (P = 0.0066), fat (P = 0.0067), and gross energy (P = 0.0012) were noted. For organic matter, fat, and gross energy, these were driven by marginally lower ATTD values in the FK4 and FK8 groups compared with control. Copper digestibility was lower in treatment groups compared with control at around 20% compared to 23.28% in FK0 but this was not statistically significant.
3.8. Fecal Microbiome
Fecal alpha diversity was not significantly influenced by dietary treatment, time point, or their interaction (Figure 1, Figure 2 and Figure 3), although there was a general increase in all groups at the end of the safety phase, followed by a return to baseline at the end of the recovery phase. In contrast, beta diversity analysis using unweighted UniFrac distances showed distinct clustering patterns. Despite the lack of strong clustering, baseline (D0) and day 178 (Figure 4) were different. FK0 was different from FK6 and FK8, but remained similar to FK4 (Figure 5). However, there was no significant effect of the interaction between dietary treatment and time point on beta diversity (Figure 6).
The relative abundances (% of sequences) of predominant fecal bacterial phyla and genera of dogs in each dietary treatment across time points is presented in Figure 7. Fecal microbiota were dominated by Firmicutes in all groups, accounting for >75% of sequences on average across all time points and in all groups. Bacteroidota and Fusobacteria each accounted for ~10% of sequences. Euryarchaeota occurred in 3 dogs (at baseline day 0, in FK8 on day 178, and FK6 on day 235) at a relative abundance of less than 1%. The predominant genera included Megamonas, Peptoclostridium, Turicibacter, Catenibacterium, Fusobacterium, Romboutsia, and Blautia that occurred in almost all samples. Lactobacillus, Bacteroides, and Allobaculum occurred less frequently. The phylum Actinobacteria and its genus Bifidobacterium exhibited a significant interaction effect between dietary treatment and time point (TRT × Day). Specifically, FK6 had a lower abundance at D178 and a higher abundance at D235, however, it did not significantly differ from the other dietary treatments throughout the study (Figure 8). Additionally, Figure 9 highlights a significant dietary treatment effect for the Prevotellaceae Ga6A1 group and Sutterella. FK0 displayed a higher relative abundance of the Prevotellaceae Ga6A1 group compared to FK6, while Sutterella was more abundant in FK0 than in FK8 and FK6. An interaction effect was also observed in Figure 9, the relative abundance of Lactobacillus in FK6 was lower at D178 and higher at D235, however, it was not significantly different from the other dietary treatments throughout the study. Furthermore, Faecalibaculum abundance in FK6 at D235 was significantly higher than in all other dietary treatments. Full phyla and genera data for all dogs are available in Supplementary Tables S6 and S7.
4. Discussion
Previous studies in aquatic species, pigs, poultry, mink and foxes have shown that whilst cultured protein derived from Methylococcus capsulatus is safe for use as an alternative protein source, the maximum inclusion level is species dependent with differential health and growth outcomes occurring with differing amounts of cultured protein in the diets. In the current study, all biomarkers for hematology, clinical chemistry and urinalysis were within normal limits at the end of the safety phase for all groups with two exceptions, namely a decrease in phosphorus levels in the FK0, 6, and 8 groups, and a reduction in urine pH in all groups. Given their ubiquity in all groups, including the controls, they are considered as normal for this group of dogs. As with other animal models, the current study has reaffirmed that cultured protein, in the form of FeedKind Pet, is safe for use in dog foods at up to 8% of the total diet.
Reduced feed intake in fish has been noted at high inclusion levels of cultured protein in the diet, limiting the maximum uptake of the protein in these animals [70]. In the current study, the four isonitrogenous, isolipidic and isoenergetic diets containing increasing inclusions of the FeedKind Pet were readily accepted by the dogs with no reductions in feed intake throughout the study. This ensured that the dogs received sufficient cultured protein to observe any potential effects over the six-month exposure period. Furthermore, the feed quality remained high as tested 20 months after production and whilst the peroxide values were elevated (14.5-19.1 meq/kg fat), these occurred in all diets suggesting that this was not due to the inclusion of FeedKind Pet, rather that it is a function of the oxidation of the poultry fat.
Although overall feed intake increased during the study, interpretation was complicated by adjustments in feed offered based on individual weight changes. Interestingly, whilst all groups gained weight over the study, dogs fed kibble containing cultured protein showed a lower weight gain compared with the control group over the safety phase and an increase in weight gain once they were transferred to control diets during the recovery phase, partly attributed to higher FCR values in the cultured protein groups during the safety phase. These data are in contrast to those of [52] who showed that up to 12% cultured protein in diets had no effect on body weight gain over the course of four months but did increase growth rates in blue foxes (Vulpes lagopus) that they attributed to improved FCR values. It is important to recognize that the current study was designed to assess safety over the study period, unlike typical nutrition studies where one of the main objectives is to maximize growth with the lowest FCR values. The reductions in weight gain rate in the FK groups were not reflected in lower body condition scores suggesting, at least based on weight and BCS, that the dogs were not unduly affected by the inclusion of cultured protein in the diets. Other than the significant statistical difference between start and end weights in all groups, there was no statistically significant difference in weights between groups over the study, confirming that assertion.
Digestibility values, particularly for dry matter, organic matter and energy, were broadly comparable to those for other protein ingredient sources and are considered acceptable for dogs [71,72,73]. Digestibility coefficients for protein for cultured protein in the current study were comparable with that of soybeans [74], lower than that of brewed lamb protein [75], duckweed [73], and plasma [71], and higher than that of black soldier fly larvae [76] and shrimp hydrolysate [72]. Differences in total tract protein digestibility of cultured protein has been noted in pigs (85%) [55], foxes (84%) [53], and mink (78%) [51], but are broadly in line with the results from the current study. In a previous study, digestibility of indispensable and non-indispensable amino acids in FK exceeded 85% and 80% respectively [57]. Using AAFCO guidelines, DIASS-like scores were >100 for adult dogs and when combined with the current data for ATTD for macronutrients and energy, it demonstrates that cultured protein is a high quality protein, able to meet the needs of a range of species, including dogs.
Concerns around the concentration and bioavailability of copper in dog foods have been raised as a result of apparent copper-associated hepatopathy (CAH) [77,78,79,80]. It is recognized that copper is an essential nutrient and is involved in a range of physiological processes as well as being immunomodulatory. Although there are minimum recommended levels of dietary copper of between 6 and 12 ppm total diet for dogs, there are no upper tolerable limits defined [60,81]. Some insect-based dog foods can contain up to 29.75 mg/kg copper [82], similar to the maximum copper concentration in the current formulations of 29.5 mg/kg in the FK8 diet, above the minimum recommended. FeedKind Pet contains around 83.67 mg/kg copper, contributing approximately 6.69 mg/kg of copper in the FK8 formulation. With an ATTD for copper of approximately 20%, the maximum copper intake in the current study would therefore be around 6 mg/kg feed, close to the minimum recommended values. Copper digestibility in other species fed diets containing 8-9% FK varies from 26.3% in Atlantic halibut [83], 65.8% in largemouth bass [84], and 40.9% in cats (Calysta, unpublished data), demonstrating that copper digestibility is likely species dependent, requiring additional studies to determine values across the range of animal models. Despite levels of dietary copper in the current study of between 25-32 mg/kg DM this did not appear to elicit a host response with values for AST, alkaline phosphatase, and gamma-glutamyl transferase remaining within normal limits with no marked differences in values between the different formulations, demonstrating a lack of liver effect normally associated with CAH in the short term [77,78,79]. A marginal increase above normal baseline in ALT values in the FK8 group on day 29 was considered transient as values returned to baseline by the following sample point and unlikely related to copper levels.
Measuring hematological parameters provides useful insights into potential effects on immune responses in animals exposed to potential toxicants, including those in new and novel food sources. In the current study, red blood cell parameters followed similar patterns across all groups, and although there was a statistically significant effect noted for hemoglobin, hematocrit and reticulocyte counts, these remained within normal limits throughout the study. Interestingly, for all three measures, there was a reduction below baseline in all four groups by day 85, followed by an increase above baseline by day 169 during the safety phase. In the recovery phase, these values remained below baseline levels initially, then increased marginally by the end of the study. Presence or absence of cultured protein are unlikely to account for these changes as there was no marked difference in dog responses, even at different inclusion levels. However, it is interesting to speculate on the impact of the nematode infection in these dogs, treated with pyrantel on days 72 and 93, either side of the blood samples taken on day 85. Nematode infections can lead to reductions in hematocrit, and hemoglobin levels [85] and whilst speculative, it may provide some explanation for the changes noted, particularly as these values showed the same pattern across all treatment groups. As all red blood cell measures fall within the normal ranges for beagles under laboratory conditions, they are not considered further.
In general, white blood cell parameters were within normal range and no effect of treatment was observed. However, there was an increase in white blood cell counts, driven by increases in neutrophil, monocyte, and eosinophil counts that showed a similar, but dose-dependent pattern, increasing up to day 85 in all groups, declining up to day 220 and subsequently increasing by day 232. Measures remained within normal limits with the exception of the FK6 and FK8 groups where white blood cell, neutrophil, and monocyte counts were above normal limits on day 85. In particular, these transient shifts in higher white blood cell counts were driven by increases in neutrophil counts. A similar pattern was observed for fibrinogen, although values, with the exception of FK6 on day 85, were within normal limits throughout the study. Increases in neutrophil counts and fibrinogen are indicative of an adaptive pro-inflammatory response. Dose-dependent inflammatory responses have been noted in fish fed on diets containing cultured protein [86,87,88,89,90,91], often providing useful protection against soybean meal induced enteritis [86,87,90,92,93], as well as improving survival following bacterial infections [37]. Dose-dependent responses in an in-vitro human whole blood model, supports the view that an inflammatory response is a normal reaction to cultured protein [94]. Increases in cultured protein-specific immunoglobulins, including IgA, IgG1, IgG2A, and total immunoglobulins in the blood were noted in mice fed cultured protein for eight weeks, and whilst the duration of the study was shorter than the current study, there was evidence of a decline in IgA titers in saliva towards the end of exposure [92]. It has been promulgated that the main driver for the inflammatory responses to cultured protein is either through exposure to dietary copper or lipopolysaccharide (LPS) in the bacteria [89,92]. Equally, exposure to novel antigens, such as those in cultured protein may elicit an immune response. LPS and other bacterial components are known to stimulate immune responses by interacting with innate immune pathways, leading to both pro-inflammatory and anti-inflammatory cytokine production. While Th-1-type cytokines can drive inflammatory responses and potential tissue damage if excessive, Th-2-type cytokines are generally associated with anti-inflammatory effects; both responses have been noted in mice and rats fed cultured protein [92,95]. Irrespective of the underlying mechanism, it is clear that the effect is transient and that dogs can tolerate cultured protein in their diets without long term activation of the immune system.
Endpoints for clinical chemistry were generally within normal limits and showed similar patterns, irrespective of inclusion level. Alanine aminotransferase (ALT) is a liver-specific enzyme in dogs and it can be a useful indicator of liver damage, including inflammation [96,97]. ALT levels in the sera were just above the normal range for FK8 on day 29, before returning to baseline levels by day 85 when values were similar to dogs fed test and control diets. The decrease in ALT levels in the current study following the initial increase suggests that any effect is transient and reversible. An increase in AST was also noted in the FK8 group, although this was within normal range. This initial doubling of ALT levels in the current study is certainly below those levels in dogs exhibiting severe hepatopathy [98] and has been noted in beagles fed standard diets [99]. The pattern of an initial ALT increase in the first six weeks followed by a subsequent decrease back to baseline levels in the Oba et al. [99] study was similar to the current study. In common with the current study, dogs remained healthy.
Concerns with the effect of feed-derived purines on animal health have been known for over a century [100,102], with particular issues noted in e.g. dalmatians. Single cell proteins contain variable amounts of RNA and DNA that, when digested, form purines or pyrimidines. It is the presence of purines that is of greater concern, given the link between purine levels and the production of urinary bladder stones, or uroliths [102,103]. Degradation products from purine nucleotide metabolism include uric acid, responsible for production of purine uroliths, and allantoin, a breakdown product of uric acid [103,104]. Allantoin accounted for around 97% of the excreted purine metabolites in mink fed diets containing 8% cultured protein [49]. Urine output and allantoin concentration was reduced, and uric acid excretion was increased in these mink compared with the control groups. In contrast, Hellwing et al. [50] showed that increasing levels of cultured protein in pigs and mink increased allantoin concentration in the urine of both species, but had no effect on uric acid excretion in mink. Reductions in urine output led the authors to conclude that renal function was not impaired and that cultured protein did not exert any urogenic effects in these animals. Dietary purines are utilized by the body to synthesize RNA and DNA, and can be excreted via feces as well as the urine [50]. Therefore, variations in urinary allantoin concentrations, whilst likely to be directly correlated with dietary purine levels, may be affected by the metabolic route used by the animal. FeedKind Pet has a purine (adenine and guanine) content of 2500 mg / 100g of dried product, broadly comparable to pork liver and bakers yeast [105], contributing around 100 to 200 mg purines per 100g in the FK4 and FK8 diets respectively. Whilst purine metabolites were not directly measured in the urine of the dogs in the current study, the urinalysis data showed no adverse effects, including the presence of urinary crystals or uroliths, at any inclusion level. The role of the gut microbiome in purine metabolism in dogs has not been explored thus far but holds the promise of further elucidating how purines are used by animals [106]. The high relative abundance of Firmicutes may be responsible for the lack of effect by purines in the current study due to their role in purine metabolism [107]. It appears that beagles are readily able to metabolize dietary purines, most likely to allantoin, and that the levels in the diets do not lead to the induction of purine urolithiasis.
The importance of the gastrointestinal microbiome in influencing gut health, immunity, growth, and metabolism is well recognized [108,109,110,111,112], reflected in efforts by the wider feed industry to assess the influence of diets on the microbiome. In the current study the baseline fecal microbiome was determined at the start, and the influence of cultured protein on the microbiome functionality and plasticity was assessed by feeding the dogs diets containing cultured protein for six months followed by a two month washout phase where they were fed control diet. Whilst alpha diversity was not statistically different over the course of the study, there was an increase in these measures, particularly in the FK6 group after six months of feeding cultured protein, followed by a return to baseline once the dogs were fed control diets for two months. Similarly, alpha diversity increased in spotted seabass fed diets containing up to 8% FK when compared to diets containing soybean meal, causing soybean meal induced enteritis in the same study [89]. However, the influence of diet manipulation on alpha diversity in dogs varies according to formulation. Whilst no differences in alpha diversity were noted in dogs fed hydrolyzed feather meal [113], there was an increase in alpha diversity following the addition of cereal fiber in adult dogs [114]. The addition of water to dry foods has been shown to increase alpha diversity, suggesting that these measures can be strongly influenced by a range of factors [115].
Variations in the fecal microbiome with time and treatment were noted. In general, increases in the relative abundance of a number of fecal bacteria were noted during the safety phase, although these were generally not statistically significant. Exceptions included an increase in Prevotellaceae Ga6A1 and Sutterella in the FK0 groups and increases in Ruminococcus torques and Sellimonas in the treatment groups at the end of the safety phase. One of the most notable differences between the groups in the current study was the increased weight gain rate in the control group compared with the FK groups, albeit that no effect on health was seen. Increases in the relative abundance of Prevotellaceae Ga6A1 and Sutterella, as seen in the FK0 group, are associated with obesity and weight gain [116]. Alongside the lower relative abundance of Turicibacter and increases in R. torques abundance in the FK groups, both of which are associated with controlled weight loss in obese dogs [99], provides evidence for the role of the microbiome in controlling weight gain in these dogs. In the current study, feed was restricted and so this mechanism does not explain the reduced abundance of Turicibacter in the current study. Turicibacter produces short chain fatty acids (SCFA) in the intestine and whilst reductions in their relative abundance in the FK groups may be a cause for concern, this is offset by increases in Sellimonas abundance which also produces SCFA. Additionally, increased abundance of Ruminococcus torques and Sellimonas, as noted on the FK groups, are useful markers of improved gut health.
5. Conclusions
Cultured protein, Methylococcus capsulatus has been tested in adult dogs with no impact on health and growth measures at the end of the six month exposure. Digestibility of FK was in line with previous studies and was comparable to control diets. Minor increases in white blood cell count in the early part of the exposure period were transient and likely reflect a normal response by dogs. Changes in the microbiome were positive and helped dogs to maintain their weight whilst ensuring no ill effects on dog health. FeedKind Pet can therefore be safely included in adult dog foods at up to 8% of the diet. Further work in understanding its effects in younger dogs, and in cats, in elucidating the underlying mechanisms of cultured protein on physiological processes and the effect of increased doses on health outcomes should be conducted.
Supplementary Materials
The following supporting information can be downloaded at the website of this paper posted on Preprints.org. Table S1: Hematology of dogs fed diets containing cultured protein (Methylococcus capsulatus); Table S2: Coagulation values of dogs fed diets containing cultured protein (Methylococcus capsulatus); Table S3: Clinical chemistry values of dogs fed diets containing cultured protein (Methylococcus capsulatus); Table S4: Urinalysis values of dogs fed diets containing cultured protein (Methylococcus capsulatus); Table S5: Urine microscopy results of dogs fed diets containing cultured protein (Methylococcus capsulatus); Table S6: Phyla-level fecal microbiome of dogs fed diets containing cultured protein (Methylococcus capsulatus); Table S7: Genera-level fecal microbiome of dogs fed diets containing cultured protein (Methylococcus capsulatus).
Author Contributions
Conceptualization, M.L. and W.M.; methodology, W.M.; formal analysis, W.M., P.M.O, and K.S.S; investigation, W.M., O.R.S., and P.M.O.; resources, M.L.; data curation, W.M., and P.M.O.; writing—original draft preparation, M.L. and K.M.; writing—review and editing, B.Q, M.L., K.M., W.M., and K.S.S.; visualization, M.L.; supervision, K.S.S, P.M.O., and M.L.; project administration, M.L. and W.M.; funding acquisition, M.L. All authors have read and agreed to the published version of the manuscript.
Funding
This research received no external funding.
Institutional Review Board Statement
The animal study was conducted in accordance with the United States Public Health Service Policy on Humane Care and Use of Laboratory Animals, and approved by the Animal Care and Use Committee of Charles River Laboratories (Ashland, OH) (protocol code 01851003).
Data Availability Statement
The original contributions presented in this study are included in the article/supplementary material. Further inquiries can be directed to the corresponding author
Acknowledgments
The authors acknowledge the support of the technical and veterinary staff at Charles River Ashland who conducted the in-life phase of the study, acknowledge Drs Blaire Aldridge and Chuck Zumbaugh of BSM Partners who designed the feeds used in the study, and acknowledge Calysta Inc. for funding the study.
Conflicts of Interest
The senior author (M.L.) is an employee of Calysta who funded the study and supplied the test ingredient (FeedKind Pet). Although M.L. assisted in the design of the study, this followed FDA and AAFCO guidelines for a target animal safety study with the addition of a 2-month washout period at the end of the 6-month exposure period and additional analysis for digestibility and microbiome. All data collected and analyzed was completed without input from M.L. In conjunction with K.M., M.L. wrote the first draft of the manuscript with subsequent editorial input from the other authors.
Abbreviations
The following abbreviations are used in this manuscript:
| DIAAS-like | Digestible, indispensable amino acid score |
| fL | femtoliters |
| g/dL | grammes per deciliter |
| HCl | hydrochloric acid |
| LC-PUFA | Long-chain polyunsaturated fatty acids |
| µL | microliter |
| mEq/L | milliequivalents per liter |
| mg/dL | milligrams per liter |
| pg | picograms |
| U/L | units per liter |
References
- Swanson, K.S.; Carter, R.A.; Yount, T.P.; Aretz, J.; Buff, P.R. Nutritional sustainability of pet foods. Adv. Nutr. 2013, 4, 141–150. [Google Scholar] [CrossRef] [PubMed]
- Alexandratos, N.; Bruinsma, J. 2012. World Agriculture towards 2030/2050: the 2012 revision. ESA Working paper No. 12-03. 2012, Rome, FAO.
- Van Peteghem, L.; Sakarika, M.; Matassa, S.; Pikaar, I.; Ganigué, R.; Rabaey, K. Towards new carbon–neutral food systems: Combining carbon capture and utilization with microbial protein production. Bioresour. Technol. 2022, 349, 126853. [Google Scholar] [CrossRef] [PubMed]
- Alexander, P.; Berri, A.; Moran, D.; Reay, D.; Rounsevell, M.D.A. The global environmental paw print of pet food. Glob. Environ. Change 2020, 65, 102153. [Google Scholar] [CrossRef]
- Fu, Q.; Zhao, J.; Rong, S.; Han, Y.; Liu, F.; Chu, Q.; Wang, S.; Chen, S. Research advances in plant protein-based products: protein sources, processing technology, and food applications. J. Agric. Food Chem. 2023, 71, 15429–15444. [Google Scholar] [CrossRef]
- McCusker, S.; Buff, P.R.; Yu, Z.; Fascetti, A.J. Amino acid content of selected plant, algae and insect species: a search for alternative protein sources for use in pet foods. J. Nutr. Sci. 2014, 3, e39. [Google Scholar] [CrossRef]
- Kanakubo, K.; Fascetti, A.J.; Larsen, J.A. Assessment of protein and amino acid concentrations and labeling adequacy of commercial vegetarian diets formulated for dogs and cats. J. Am. Vet. Med. Assoc. 2015, 247, 385–392. [Google Scholar] [CrossRef]
- Zafalon, R.V.A.; Risolia, L.W.; Vendramini, T.H.A.; Ayres Rodrigues, R.B.; Pedrinelli, V.; Teixeira, F.A.; Rentas, M.F.; Perini, M.P.; Alvarenga, I.C.; Brunetto, M.A. Nutritional inadequacies in commercial vegan foods for dogs and cats. PLoS One 2020, 15, e0227046. [Google Scholar] [CrossRef]
- Cavanaugh, S.M.; Cavanaugh, R.P.; Gilbert, G.E.; Leavitt, E.L.; Ketzis, J.K.; Vieira, A.B. Short-term amino acid, clinicopathologic, and echocardiographic findings in healthy dogs fed a commercial plant-based diet. PLoS One 2021, 16, e0258044. [Google Scholar] [CrossRef]
- Linde, A.; Lahiff, M.; Krantz, A.; Sharp, N.; Ng, T.T.; Melgarejo, T. Domestic dogs maintain clinical, nutritional, and hematological health outcomes when fed a commercial plant-based diet for a year. PLoS One 2024, 19, e0298942. [Google Scholar] [CrossRef]
- Sim, S.Y.J.; Akila, S.R.V.; Chiang, J.H.; Henry, C.J. Plant proteins for future foods: A roadmap. Foods 2021, 10, 1967. [Google Scholar] [CrossRef]
- Fantinati, M.; Dufayet, R.; Rouch-Buck, P.; Priymenko, N. Relationship between a plant-based “vegan” pet food and clinical manifestation of multiple nutrient deficiencies in two cats. J. Anim. Physiol. Anim. Nutr. 2021, 105, 1179–1191. [Google Scholar] [CrossRef] [PubMed]
- Fiacco, D.C.; Lowe, J.A.; Wiseman, J.; White, G.A. Evaluation of vegetable protein in canine diets: Assessment of performance and apparent ileal amino acid digestibility using a broiler model. J. Anim. Physiol. Anim. Nutr 2018, 102, e442–e448. [Google Scholar] [CrossRef] [PubMed]
- Reilly, L.M.; von Schaumburg, P.C.; Hoke, J.M.; Davenport, G.M.; Utterback, P.L.; Parsons, C.M.; de Godoy, M.R.C. Use of the precision-fed cecectomized rooster assay to determine standardized amino acid digestibility, true metabolizable energy content, and digestible indispensable amino acid scores of plant-based protein by-products used in canine and feline diets. Transl. Anim. Sci. 2021, 5, txab025. [Google Scholar] [CrossRef] [PubMed]
- Reilly, L.M.; von Schaumburg, P.C.; Hoke, J.M.; Davenport, G.M.; Utterback, P.L.; Parsons, C.M.; de Godoy, M.R.C. Macronutrient composition, true metabolizable energy and amino acid digestibility, and indispensable amino acid scoring of pulse ingredients for use in canine and feline diets. J. Anim. Sci. 2020, 98, skaa149. [Google Scholar] [CrossRef]
- Patel, S. Chapter 2 - Insects as a source of sustainable proteins. In Proteins: Sustainable Source, Processing and Applications, Galanakis, C.M., Ed.; Academic Press, London, UK, 2019; pp. 41–61. [CrossRef]
- Penazzi, L.; Schiavone, A.; Russo, N.; Nery, J.; Valle, E.; Madrid, J.; Martinez, S.; Hernandez, F.; Pagani, E.; Ala, U.; Prola, L. In vivo and in vitro digestibility of an extruded complete dog food containing black soldier fly (Hermetia illucens) larvae meal as protein source. Front. Vet. Sci. 2021, 8, 653411. [Google Scholar] [CrossRef]
- Choi, I.-H.; Jeong, Y.-W.; Park, K.-H.; Chung, T.-H. Evaluation of companion canine palatability by feeding insect diets(1). JESI 2023, 32, 853–856. [Google Scholar] [CrossRef]
- Abd El-Wahab, A.; Meyer, L.; Kölln, M.; Chuppava, B.; Wilke, V.; Visscher, C.; Kamphues, J. Insect larvae meal (Hermetia illucens) as a sustainable protein source of canine food and its impacts on nutrient digestibility and fecal quality. Animals 2021, 11, 2525. [Google Scholar] [CrossRef]
- Lisenko, K.G.; Godoy, M.R.C.; Oliveira, K.R.B.; Oliveira, M.R.D.; Silva, T.V.; Fontes, T.V.; Lacerda, R.F.; Ferreira, L.G.; Gonçalves, T.M.; Zangeronimo, M.G.; da Costa, D.V.; Saad, F.M.O.B. Digestibility of insect meals for dogs and their effects on blood parameters, faecal characteristics, volatile fatty acids, and gut microbiota. J. Insects Food Feed 2023, 9, 907–918. [Google Scholar] [CrossRef]
- Smola, M.A.; Oba, P.M.; Utterback, P.L.; Sánchez-Sánchez, L.; Parsons, C.M.; Swanson, K.S. Amino acid digestibility and protein quality of mealworm-based ingredients using the precision-fed cecectomized rooster assay. J. Anim. Sci. 2023, 101, skad012. [Google Scholar] [CrossRef]
- Rumpold, B.A.; Langen, N. Consumer acceptance of edible insects in an organic waste-based bioeconomy. Curr. Opin. Green Sustain. Chem. 2020, 23, 80–84. [Google Scholar] [CrossRef]
- Acosta-Estrada, B.A.; Reyes, A.; Rosell, C.M.; Rodrigo, D.; Ibarra-Herrera, C.C. Benefits and challenges in the incorporation of insects in food products. Front. Nutr. 2021, 8, 687712. [Google Scholar] [CrossRef] [PubMed]
- Bosch, G.; Swanson, K.S. Effect of using insects as feed on animals: pet dogs and cats. J. Insects Food Feed 2021, 7, 795–805. [Google Scholar] [CrossRef]
- He, J.; Tang, M.; Zhong, F.; Deng, J.; Li, W.; Zhang, L.; Lin, Q.; Xia, X.; Li, J.; Guo, T. Current trends and possibilities of typical microbial protein production approaches: a review. Crit. Rev. Biotechnol. 2024, 44, 1515–1532. [Google Scholar] [CrossRef] [PubMed]
- Marcellin, E.; Angenent, L.T.; Nielsen, L.K.; Molitor, B. Recycling carbon for sustainable protein production using gas fermentation. Curr. Opin. Biotechnol. 2022, 76, 102723. [Google Scholar] [CrossRef]
- Sobhi, M.; Zakaria, E.; Zhu, F.; Liu, W.; Aboagye, D.; Hu, X.; Cui, Y.; Huo, S. Advanced microbial protein technologies are promising for supporting global food-feed supply chains with positive environmental impacts. Sci. Total Environ. 2023, 894, 165044. [Google Scholar] [CrossRef]
- Xu, J.; Wang, J.; Ma, C.; Wei, Z.; Zhai, Y.; Tian, N.; Zhu, Z.; Xue, M.; Li, D. Embracing a low-carbon future by the production and marketing of C1 gas protein. Biotechnol. Adv. 2023, 63, 108096. [Google Scholar] [CrossRef]
- Anupama; Ravindra, P. Value-added food:: Single cell protein. Biotechnol. Adv. 2000, 18, 459–479. [CrossRef]
- D’Mello, J.P.F. Limiting amino acids in dried microbial cells given to young turkeys. Anim. Feed Sci. Technol. 1979, 4, 209–220. [Google Scholar] [CrossRef]
- Stringer, D.A. Industrial development and evaluation of new protein sources: Micro-organisms. Proc. Nutr. Soc. 1982, 41, 289–300. [Google Scholar] [CrossRef]
- Skrede, A.; Berge, G.M.; Storebakken, T.; Herstad, O.; Aarstad, K.G.; Sundstøl, F. Digestibility of bacterial protein grown on natural gas in mink, pigs, chicken and Atlantic salmon. Anim. Feed Sci. Technol. 1998, 76, 103–116. [Google Scholar] [CrossRef]
- Schøyen, H.F.; Svihus, B.; Storebakken, T.; Skrede, A. Bacterial protein meal produced on natural gas replacing soybean meal or fish meal in broiler chicken diets. Arch. Anim. Nutr. 2007, 61, 276–291. [Google Scholar] [CrossRef] [PubMed]
- Perera, W.M.; Carter, C.G.; Houlihan, D.F. Feed consumption, growth and growth efficiency of rainbow trout (Oncorhynchus mykiss (Walbaum)) fed on diets containing a bacterial single-cell protein. Br. J. Nutr. 1995, 73, 591–603. [Google Scholar] [CrossRef] [PubMed]
- Aas, T.S.; Grisdale-Helland, B.; Terjesen, B.F.; Helland, S.J. Improved growth and nutrient utilisation in Atlantic salmon (Salmo salar) fed diets containing a bacterial protein meal. Aquaculture 2006, 259, 365–376. [Google Scholar] [CrossRef]
- Chen, Y.; Chi, S.; Zhang, S.; Dong, X.; Yang, Q.; Liu, H.; Zhang, W.; Deng, J.; Tan, B.; Xie, S. Replacement of fish meal with Methanotroph (Methylococcus capsulatus, Bath) bacteria meal in the diets of Pacific white shrimp (Litopenaeus vannamei). Aquaculture 2021, 541, 736801. [Google Scholar] [CrossRef]
- Jintasataporn, O.; Chumkam, S.; Triwutanon, S.; LeBlanc, A.; Sawanboonchun, J. Effects of a single cell protein (Methylococcus capsulatus, Bath) in Pacific white shrimp (Penaeus vannamei) diet on growth performance, survival rate and resistance to Vibrio parahaemolyticus, the causative agent of Acute Hepatopancreatic Necrosis Disease. Front. Mar. Sci. 2021, 8, 1643. [Google Scholar] [CrossRef]
- Ruiz, A.; Sanahuja, I.; Thorringer, N.W.; Lynegaard, J.; Ntokou, E.; Furones, D.; Gisbert, E. Single cell protein from methanotrophic bacteria as an alternative healthy and functional protein source in aquafeeds, a holistic approach in rainbow trout (Oncorhynchus mykiss) juveniles. Aquaculture 2023, 576, 739861. [Google Scholar] [CrossRef]
- Vasilaki, A.; Mente, E.; Fountoulaki, E.; Henry, M.; Nikoloudaki, C.; Berillis, P.; Kousoulaki, K.; Nengas, I. Fishmeal, plant protein, and fish oil substitution with single-cell ingredients in organic feeds for European sea bass (Dicentrarchus labrax). Front. Physiol. 2023, 14, 1199497. [Google Scholar] [CrossRef]
- Øverland, M.S.; Skrede, A.; Matre, T. Bacterial protein grown on natural gas as feed for pigs. Acta Agri. Scand. A Anim. Sci. 2001, 51, 97–106. [Google Scholar] [CrossRef]
- Øverland, M.; Petter Kjos, N.; Skrede, A. Effect of bacterial protein meal grown on natural gas on growth performance and carcass traits of pigs. Ital. J. Anim. Sci. 2004, 3, 323–336. [Google Scholar] [CrossRef]
- Hellwing, A.L.F.; Tauson, A.-H.; Kjos, N.P.; Skrede, A. Bacterial protein meal in diets for growing pigs: effects on protein and energy metabolism. Animal 2007, 1, 45–54. [Google Scholar] [CrossRef]
- Hellwing, A.L.F.; Tauson, A.-H.; Skrede, A. Blood parameters in growing pigs fed increasing levels of bacterial protein meal. Acta Vet. Scand. 2007, 49, 33. [Google Scholar] [CrossRef] [PubMed]
- Rønn, M.; Thorsteinsson, M.; Johannsen, J.C.; Nørgaard, J.V.; Julegaard, I.K.; Nielsen, M.O. Evaluation of nutritional quality for weaner piglets of a new methanotrophic microbial cell-derived protein feed. Anim. Feed Sci. Technol. 2022, 294, 115498. [Google Scholar] [CrossRef]
- Hedemann, M.S.; Rønn, M.; van der Heide, M.E.; Julegaard, I.K.; Nielsen, M.O. Dietary inclusion of methanotrophic microbial cell-derived protein in the early postweaning period sustains growth performance and intestinal health of weaner piglets. Animal 2023, 17, 100798. [Google Scholar] [CrossRef] [PubMed]
- Hellwing, A.L.F.; Tauson, A.-H.; Skrede, A. Effect of bacterial protein meal on protein and energy metabolism in growing chickens. Arch. Anim. Nutr. 2006, 60, 365–381. [Google Scholar] [CrossRef]
- Schøyen, H.F.; Hetland, H.; Rouvinen-Watt, K.; Skrede, A. Growth performance and ileal and total tract amino acid digestibility in broiler chickens fed diets containing bacterial protein produced on natural gas. Poult. Sci. 2007, 86, 87–93. [Google Scholar] [CrossRef]
- Skrede, A.; Faaland Schøyen, H.; Svihus, B.; Storebakken, T. The effect of bacterial protein grown on natural gas on growth performance and sensory quality of broiler chickens. Can. J. Anim. Sci. 2003, 83, 229–237. [Google Scholar] [CrossRef]
- Ahlstrøm, Ø.; Tauson, A.-H.; Hellwing, A.L.F.; Mydland, L.T.; Skrede, A. Growth performance, nitrogen balance and urinary purine derivatives in growing-furring mink (Mustela vison) fed bacterial protein produced from natural gas. J. Anim. Feed Sci. 2006, 15, 491–504. [Google Scholar] [CrossRef]
- Hellwing, A.L.F.; Tauson, A.-H.; Skrede, A.; Kjos, N.P.; Ahlstrøm, Ø. Bacterial protein meal in diets for pigs and minks: Comparative studies on protein turnover rate and urinary excretion of purine base derivatives. Arch. Anim. Nutr. 2007, 61, 425–443. [Google Scholar] [CrossRef]
- Skrede, A.; Mydland, L.T.; Øverland, M. Effects of growth substrate and partial removal of nucleic acids in the production of bacterial protein meal on amino acid profile and digestibility in mink. J. Anim. Feed Sci. 2009, 18, 689–698. [Google Scholar] [CrossRef]
- Skrede, A.; Ahlstrøm, Ø. Bacterial protein produced on natural gas: A new potential feed ingredient for dogs evaluated using the blue fox as a model. J. Nutr. 2002, 132, 1668S–1669S. [Google Scholar] [CrossRef]
- Vhile, S.G.; Skrede, A.; Ahlstrøm, Ø.; Szymeczko, R.; Hove, K. Ileal and total tract nutrient digestibility in blue foxes (Alopex lagopus) fed extruded diets containing different protein sources. Arch. Anim. Nutr. 2005, 59, 61–72. [Google Scholar] [CrossRef] [PubMed]
- Biswas, A.; Takakuwa, F.; Yamada, S.; Matsuda, A.; Saville, R.M.; LeBlanc, A.; Silverman, J.A.; Sato, N.; Tanaka, H. Methanotroph (Methylococcus capsulatus, Bath) bacteria meal as an alternative protein source for Japanese yellowtail, Seriola quinqueradiata. Aquaculture 2020, 529, 735700. [Google Scholar] [CrossRef]
- Øverland, M.; Tauson, A.-H.; Shearer, K.; Skrede, A. Evaluation of methane-utilising bacteria products as feed ingredients for monogastric animals. Arch. Anim. Nutr. 2010, 64, 171–189. [Google Scholar] [CrossRef] [PubMed]
- Yu, H.; Liang, H.; Longshaw, M.; Wang, J.; Ge, X.; Ren, M.; Zhang, L. Methanotroph (Methylococcus capsulatus, Bath) bacteria meal (FeedKind®) could effectively improve the growth, apparent digestibility coefficient, blood biochemical parameters, antioxidant indices of juvenile Jian carp (Cyprinus carpio var. Jian). Anim. Feed Sci. Technol. 2022, 288, 115293. [Google Scholar] [CrossRef]
- Oba, P.M.; Utterback, P.L.; Longshaw, M.; Parsons, C.M.; Swanson, K.S. Comparing the standardized amino acid digestibility of an alternative protein source with commercially available protein-based ingredients using the precision-fed cecectomized rooster assay. J. Anim. Sci. 2023, 101, skad236. [Google Scholar] [CrossRef]
- Glencross, B.; Ling, X.; Gatlin, D.; Kaushik, S.; Øverland, M.; Newton, R.; Valente, L.M.P. A SWOT analysis of the use of marine, grain, terrestrial-animal and novel protein ingredients in aquaculture feeds. Rev. Fish. Sci. Aquacult. 2024, 32, 396–434. [Google Scholar] [CrossRef]
- Glencross, B.D.; Huyben, D.; Schrama, J.W. The application of single-cell ingredients in aquaculture feeds — a review. Fishes 2020, 5, 22. [Google Scholar] [CrossRef]
- AAFCO, 2023. Official Publication. Association of American Feed Control Officials, Champaign, IL.
- Hand, M. Small Animal Clinical Nutrition, 5th ed. Mark Morris Institute, 2010.
- Caporaso, J.G.; Lauber, C.L.; Walters, W.A.; Berg-Lyons, D.; Huntley, J.; Fierer, N.; Owens, S.M.; Betley, J.; Fraser, L.; Bauer, M.; Gormley, N.; Gilbert, J.A.; Smith, G.; Knight, R. Ultra-high-throughput microbial community analysis on the Illumina HiSeq and MiSeq platforms. ISME J 2012, 6, 1621–1624. [Google Scholar] [CrossRef]
- Caporaso, J.G.; Kuczynski, J.; Stombaugh, J.; Bittinger, K.; Bushman, F.D.; Costello, E.K.; Fierer, N.; Peña, A.G.; Goodrich, J.K.; Gordon, J.I.; Huttley, G.A.; Kelley, S.T.; Knights, D.; Koenig, J.E.; Ley, R.E.; Lozupone, C.A.; McDonald, D.; Muegge, B.D.; Pirrung, M.; Reeder, J.; Sevinsky, J.R.; Turnbaugh, P.J.; Walters, W.A.; Widmann, J.; Yatsunenko, T.; Zaneveld, J.; Knight, R. QIIME allows analysis of high-throughput community sequencing data. Nat. Methods 2010, 7, 335–336. [Google Scholar] [CrossRef]
- Callahan, B.J.; McMurdie, P.J.; Rosen, M.J.; Han, A.W.; Johnson, A.J.A.; Holmes, S.P. DADA2: High-resolution sample inference from Illumina amplicon data. Nat. Methods 2016, 13, 581–583. [Google Scholar] [CrossRef]
- Bokulich, N.A.; Kaehler, B.D.; Rideout, J.R.; Dillon, M.; Bolyen, E.; Knight, R.; Huttley, G.A.; Gregory Caporaso, J. Optimizing taxonomic classification of marker-gene amplicon sequences with QIIME 2’s q2-feature-classifier plugin. Microbiome 2018, 6, 90. [Google Scholar] [CrossRef] [PubMed]
- Quast, C.; Pruesse, E.; Yilmaz, P.; Gerken, J.; Schweer, T.; Yarza, P.; Peplies, J.; Glöckner, F.O. The SILVA ribosomal RNA gene database project: improved data processing and web-based tools. Nucleic Acids Res. 2013, 41, D590–D596. [Google Scholar] [CrossRef] [PubMed]
- Robeson, M.S.; O’Rourke, D.R.; Kaehler, B.D.; Ziemski, M.; Dillon, M.R.; Foster, J.T.; Bokulich, N.A. RESCRIPt: Reproducible sequence taxonomy reference database management. PLoS Comput. Biol. 2021, 17, e1009581. [Google Scholar] [CrossRef] [PubMed]
- Lozupone, C.; Knight, R. UniFrac: a new phylogenetic method for comparing microbial communities. Appl. Environ. Microbiol. 2005, 71, 8228–8235. [Google Scholar] [CrossRef]
- Milliken, G.; Johnson, D. Analysis of Messy Data, Volume III: Analysis of Covariance, 1st ed; Routledge, London, UK. 622pp.
- Pilmer, L.W.; Woolley, L.D.; Lymbery, A.J.; Salini, M.; Partridge, G.J. Using dietary additives to improve palatability of diets containing single-cell protein from methanotrophic bacteria in yellowtail kingfish (Seriola lalandi) diets. Aquacult. Res. 2022, 53, 5006–5017. [Google Scholar] [CrossRef]
- Andrade, T.; Lima, D.C.; Domingues, L.P.; Félix, A.P.; de Oliveira, S.G.; Maiorka, A. Spray-dried porcine plasma in dog foods: implications on digestibility, palatability and haematology. Semin. Ciênc. Agrár. 2019, 40, 1287–1296. [Google Scholar] [CrossRef]
- Guilherme-Fernandes, J.; Fonseca, A.J.M.; Aires, T.; Lima, S.A.C.; Maia, M.R.G.; Cabrita, A.R.J. Unveiling the effects of shrimp hydrolysate as a dietary ingredient in healthy adult Beagle dogs. J. Anim. Sci. 2024, 102, skae280. [Google Scholar] [CrossRef]
- Lin, C.-Y.; Kerr, K.R.; Panasevich, M.R.; Daristotle, L.; Frantz, N.Z. Duckweed protein as an alternative plant-based protein source for dog and cat dry diets. J. Anim. Sci. 2024, 102, skae244. [Google Scholar] [CrossRef]
- Kim, H.S.; Titgemeyer, E.C.; Curles, E.; Olsen, L.M.; Aldrich, C.G. Evaluation of soybean ingredients in pet foods applications: Systematic review. Animals 2024, 14, 16. [Google Scholar] [CrossRef]
- French, S.; Cochrane, C.-Y.; Faurot, M.; Audibert, P.; Belloso, T.; Badri, D.V. Safety and digestibility of a novel ingredient, brewed lamb protein, in healthy adult dogs. Animals 2025, 15, 427. [Google Scholar] [CrossRef]
- Kara, K.; Kahraman, O.; İnal, F.; İnanç, Z.S.; Öztaş, Y.; Alataş, M.S.; Ahmed, I. Digestion, faeces microbiome, and selected blood parameters in dogs fed extruded food containing Black soldier fly ( Hermetia illucens ) meal. Ital. J. Anim. Sci. 2025, 24, 466–483. [Google Scholar] [CrossRef]
- Rodrigues, A.; Leal, R.O.; Girod, M.; Dally, C.; Guery, E.; Gomes, E.; Hernandez, J. Canine copper-associated hepatitis: A retrospective study of 17 clinical cases. Open Vet. J. 2020, 10, 128–134. [Google Scholar] [CrossRef] [PubMed]
- Gori, E.; Pierini, A.; Meucci, V.; Abramo, F.; Muscatello, L.V.; Marchetti, V. ; Hepatic lead and copper concentrations in dogs with chronic hepatitis and their relationship with hematology, serum biochemistry, and histopathology. J. Vet. Intern. Med. 2021, 35, 1773–1779. [Google Scholar] [CrossRef] [PubMed]
- Poblanno Silva, F.M.; Grant, C.E.; Ribeiro, É.d.M.; Verbrugghe, A. Nutritional management of a dog with hepatic enzymopathy suspected to be secondary to copper-associated hepatitis: a case report. Front. Vet. Sci. 2023, 10, 1215447. [Google Scholar] [CrossRef]
- Amundson, L.A.; Kirn, B.N.; Swensson, E.J.; Millican, A.A.; Fahey, G.C. Copper metabolism and its implications for canine nutrition. Transl. Anim. Sci. 2024, 8, txad147. [Google Scholar] [CrossRef]
- National Research Council of the National Academies. Nutrient Requirements of Dogs and Cats. National Academies Press, Washington, D.C., USA, 2006; 398pp. [CrossRef]
- Ryu, M.-O.; Lee, K.-H.; Ha, H.-M.; Kim, H.-R.; Ahn, W.-S.; Kim, S.-H.; Seo, K.-W. Proximate analysis and profiles of amino acids, fatty acids, and minerals in insect-based foods for dogs. Am. J. Vet. Res. 2025, 86, 1–9. [Google Scholar] [CrossRef]
- Aas, T.S.; Hatlen, B.; Grisdale-Helland, B.; Terjesen, B.F.; Penn, M.; Bakke-McKellep, A.M.; Helland, S.J. Feed intake, growth and nutrient utilization in Atlantic halibut (Hippoglossus hippoglossus) fed diets containing a bacterial protein meal. Aquacult. Res. 2007, 38, 351–360. [Google Scholar] [CrossRef]
- Guo, B.; He, X.; Ge, C.; Xue, M.; Wang, J.; Longshaw, M.; Wang, J.; Liang, X. A natural gas fermentation bacterial meal (FeedKind®) as a functional alternative ingredient for fishmeal in diet of largemouth bass, Micropterus salmoides. Antioxidants 2022, 11, 1479. [Google Scholar] [CrossRef]
- Saichenko, I.V.; Antipov, A.A.; Bakhur, T.I.; Bezditko, L.V.; Shmayun, S.S. Co-infection of Trichuris vulpis and Toxocara canis in different aged dogs: Influence on the haematological indices. Biosys. Divers. 2021, 29, 129–134. [Google Scholar] [CrossRef]
- Romarheim, O.H.; Hetland, D.L.; Skrede, A.; Øverland, M.; Mydland, L.T.; Landsverk, T. Prevention of soya-induced enteritis in Atlantic salmon (Salmo salar) by bacteria grown on natural gas is dose dependent and related to epithelial MHC II reactivity and CD8α+ intraepithelial lymphocytes. Br. J. Nutr. 2013, 109, 1062–1070. [Google Scholar] [CrossRef]
- Romarheim, O.H.; Landsverk, T.; Mydland, L.T.; Skrede, A.; Øverland, M. Cell wall fractions from Methylococcus capsulatus prevent soybean meal-induced enteritis in Atlantic salmon (Salmo salar). Aquaculture 2013, 402–403, 13–18. [Google Scholar] [CrossRef]
- Zhang, Q.; Liang, H.; Longshaw, M.; Wang, J.; Ge, X.; Zhu, J.; Li, S.; Ren, M. Effects of replacing fishmeal with methanotroph (Methylococcus capsulatus, Bath) bacteria meal (FeedKind®) on growth and intestinal health status of juvenile largemouth bass (Micropterus salmoides). Fish Shellfish Immunol. 2022, 122, 298–305. [Google Scholar] [CrossRef] [PubMed]
- Zhang, J.; Yu, M.; Wang, J.; Longshaw, M.; Song, K.; Wang, L.; Li, X.; Zhang, C.; Lu, K. Methanotroph (Methylococcus capsulatus, Bath) bacteria meal alleviates soybean meal-induced enteritis in spotted seabass (Lateolabrax maculatus) by modulating immune responses and the intestinal flora. Aquaculture 2023, 575, 739795. [Google Scholar] [CrossRef]
- Zheng, J.; Zhang, W.; Dan, Z.; Cao, X.; Gong, Y.; Mai, K.; Ai, Q. Dietary methanotroph bacteria meal alleviates soybean meal-induced enteritis by improving immune tolerance and intestinal flora profile of juvenile turbot (Scophthalmus maximus L.). Fish Shellfish Immunol. 2024, 148, 109463. [Google Scholar] [CrossRef]
- Dai, J.; Luo, H.; Liu, Z.; Hu, Y. Evaluation of fish meal replacement by Methylococcus capsulatus protein in diets for juvenile Chinese softshell turtle (Pelodiscus sinensis). Aquaculture 2024, 587, 740857. [Google Scholar] [CrossRef]
- Christensen, H.R.; Larsen, L.C.; Frøkiær, H. The oral immunogenicity of BioProtein, a bacterial single-cell protein, is affected by its particulate nature. Br. J. Nutr. 2003, 90, 169–178. [Google Scholar] [CrossRef]
- Romarheim, O.H.; Øverland, M.; Mydland, L.T.; Skrede, A.; Landsverk, T. Bacteria grown on natural gas prevent soybean meal-induced enteritis in Atlantic salmon. J. Nutr. 2011, 141, 124–130. [Google Scholar] [CrossRef]
- Sikkeland, L.I.B.; Thorgersen, E.B.; Haug, T.; Mollnes, T.E. Complement activation and cytokine response by BioProtein, a bacterial single cell protein. Clin. Exp. Immunol. 2007, 148, 146–152. [Google Scholar] [CrossRef]
- Mølck, A.-M.; Poulsen, M.; Christensen, H.R.; Lauridsen, S.T.; Madsen, C. Immunotoxicity of nucleic acid reduced BioProtein — a bacterial derived single cell protein — in Wistar rats. Toxicol. 2002, 174, 183–200. [Google Scholar] [CrossRef]
- Boyd, J.W. The mechanisms relating to increases in plasma enzymes and isoenzymes in diseases of animals. Vet. Clin. Pathol. 1983, 12, 9–24. [Google Scholar] [CrossRef]
- Oikonomidis, I.; Milne, E. Clinical enzymology of the dog and cat. Aust. Vet. J. 2023, 101, 465–478. [Google Scholar] [CrossRef] [PubMed]
- Center, S.A. Interpretation of liver enzymes. Vet. Clin. North Am. Small Anim. Pract. 2007, 37, 297–333. [Google Scholar] [CrossRef] [PubMed]
- Oba, P.M.; Kelly, J.; Kostiuk, D.; Swanson, K.S. . Effects of weight loss and feeding specially formulated diets on the body composition, blood metabolite profiles, voluntary physical activity, and fecal metabolites and microbiota of obese dogs. J. Anim. Sci. 2023, 101, skad073. [Google Scholar] [CrossRef] [PubMed]
- Wells, H.G. The purine metabolism of the dalmatian coach hound. J. Biol. Chem. 1918, 35, 221–225. [Google Scholar] [CrossRef]
- Langfeldt, E.; Holmsen, J. The excretion of purine derivatives in dogs. Biochem. J. 1925, 19, 717–723. [Google Scholar] [CrossRef]
- Hellwing, A.L.F.; Tauson, A.-H.; Skrede, A. Excretion of purine base derivatives after intake of bacterial protein meal in pigs. In: Livestock Science, 10th International Symposium on Digestive Physiology in Pigs, Denmark 2006, 109, 70–72. [Google Scholar] [CrossRef]
- Defarges, A.; Evason, M.; Dunn, M.; Berent, A. Urolithiasis in Small Animals. In: Clinical Small Animal Internal Medicine., 1st ed.; Bruyette, D.S.; Bexfield, N.; Chretin, J.D.; Kidd, L.; Kube, S.; Langston, C.; Owen, T.J.; Oyama, M.A.; Peterson, N.; Reiter, L.V.; Rozanski, E.A.; Ruaux, C.; Torres, S.M.F., Eds.; John Wiley & Sons, Ltd, London, 2020; pp. 1123–1156. [CrossRef]
- Osborne, C.A., Lulich, J.P., Ulrich, L.K., 2010. Chapter 38: Canine urolithiasis: definitions, pathophysiology and clinical manifestations. In: Small Animal Clinical Nutrition, 5th Edition. 2007, p. 813-832.
- Kaempfle, M.; Bergmann, M.; Koelle, P.; Hartmann, K. High performance liquid chromatography analysis and description of purine content of diets suitable for dogs with Leishmania infection during Allopurinol treatment — a pilot trial. Animals 2023, 13, 3060. [Google Scholar] [CrossRef]
- Kasahara, K.; Kerby, R.L.; Zhang, Q.; Pradhan, M.; Mehrabian, M.; Lusis, A.J.; Bergström, G.; Bäckhed, F.; Rey, F.E. Gut bacterial metabolism contributes to host global purine homeostasis. Cell Host Microbe 2023, 31, 1038–1053.e10. [Google Scholar] [CrossRef]
- Zhen, Y.; Chen, Y.; Ge, L.; Wei, W.; Wang, Y.; Hu, L.; Loor, J.J.; Wang, M.; Yin, J. The short-day cycle induces intestinal epithelial purine metabolism imbalance and hepatic disfunctions in antibiotic-mediated gut microbiota perturbation mice. Int. J. Mol. Sci. 2022, 23, 6008. [Google Scholar] [CrossRef]
- Suchodolski, J.S. Analysis of the gut microbiome in dogs and cats. Vet. Clin. Pathol. 2022, 50, 6–17. [Google Scholar] [CrossRef]
- Baritugo, K.A.; Bakhsh, A.; Kim, B.; Park, S. Perspectives on functional foods for improvement of canine health and treatment of diseases. J. Funct. Foods 2023, 109, 105744. [Google Scholar] [CrossRef]
- Atuahene, D.; Mukarram, S.A.; Balouei, F.; Antwi, A. Gut health optimization in canines and felines: Exploring the role of probiotics and nutraceuticals. Pets 2024, 1, 135–151. [Google Scholar] [CrossRef]
- Rojas, C.A.; Park, B.; Scarsella, E.; Jospin, G.; Entrolezo, Z.; Jarett, J.K.; Martin, A.; Ganz, H.H. Species-level characterization of the core microbiome in healthy dogs using full-length 16S rRNA gene sequencing. Front. Vet. Sci. 2024, 11, 1405470. [Google Scholar] [CrossRef] [PubMed]
- Wilson, S.M.; Swanson, K.S. The influence of ‘biotics’ on the gut microbiome of dogs and cats. Vet. Rec. 2024, 195, 2–12. [Google Scholar] [CrossRef] [PubMed]
- Balouei, F.; Stefanon, B.; Armone, R.; Randazzo, A.; Chiofalo, B. Nutritional and microbiome effects of a partial substitution of poultry meat with hydrolyzed feather meal in dog diets. Microorganisms 2025, 13, 121. [Google Scholar] [CrossRef]
- Montserrat-Malagarriga, M.; Castillejos, L.; Salas-Mani, A.; Torre, C.; Martín-Orúe, S.M. The impact of fiber source on digestive function, fecal microbiota, and immune response in adult dogs. Animals 2024, 14, 196. [Google Scholar] [CrossRef]
- Zhang, L.; Yang, K.; Jian, S.; Xin, Z.; Wen, C.; Zhang, L.; Huang, J.; Deng, B.; Deng, J. Effects of softening dry food with water on stress response, intestinal microbiome, and metabolic profile in Beagle dogs. Metabolites 2022, 12, 1124. [Google Scholar] [CrossRef]
- Kim, H.; Seo, J.; Park, T.; Seo, K.; Cho, H.-W.; Chun, J.L.; Kim, K.H. Obese dogs exhibit different fecal microbiome and specific microbial networks compared with normal weight dogs. Sci. Rep. 2023, 13, 723. [Google Scholar] [CrossRef]
- AOAC. 2006. Official Methods of Analysis of AOAC International. 17th ed. Association of Official Analysis Chemists International, Arlington, VA, USA.
- AOAC. 2002. Official Methods of Analysis of AOAC International. 16th ed. Association of Official Analysis Chemists International, Arlington, VA, USA.
- Prosky, L.; Asp, N.G.; Schweizer, T.F.; DeVries, J.W.; Furda, I. Determination of insoluble, soluble, and total dietary fiber in foods and food products: interlaboratory study. J. Assoc. Off. Anal. Chem. 1988, 71, 1017–1023. [Google Scholar] [CrossRef]
- Viñas, P.; López-Erroz, C.; Balsalabre, N.; Hernández-Córdoba, M. Reversed-phase liquid chromatography on an amide stationary phase for the determination of the B group vitamins in baby foods. J. Chrom. A 2003, 1007, 77–84. [Google Scholar] [CrossRef]
Figure 1.
Alpha diversity of fecal samples from dogs across different time points (D0: baseline, D178: day 178, D235: day 235), illustrating variations in microbial richness and diversity over the study period.
Figure 1.
Alpha diversity of fecal samples from dogs across different time points (D0: baseline, D178: day 178, D235: day 235), illustrating variations in microbial richness and diversity over the study period.

Figure 2.
Alpha diversity of fecal samples from dogs across dietary treatments. Test diets included FeedKind® (FK) at different inclusion levels: 0% (FK0), 4% (FK4), 6% (FK6), and 8% (FK8).
Figure 2.
Alpha diversity of fecal samples from dogs across dietary treatments. Test diets included FeedKind® (FK) at different inclusion levels: 0% (FK0), 4% (FK4), 6% (FK6), and 8% (FK8).
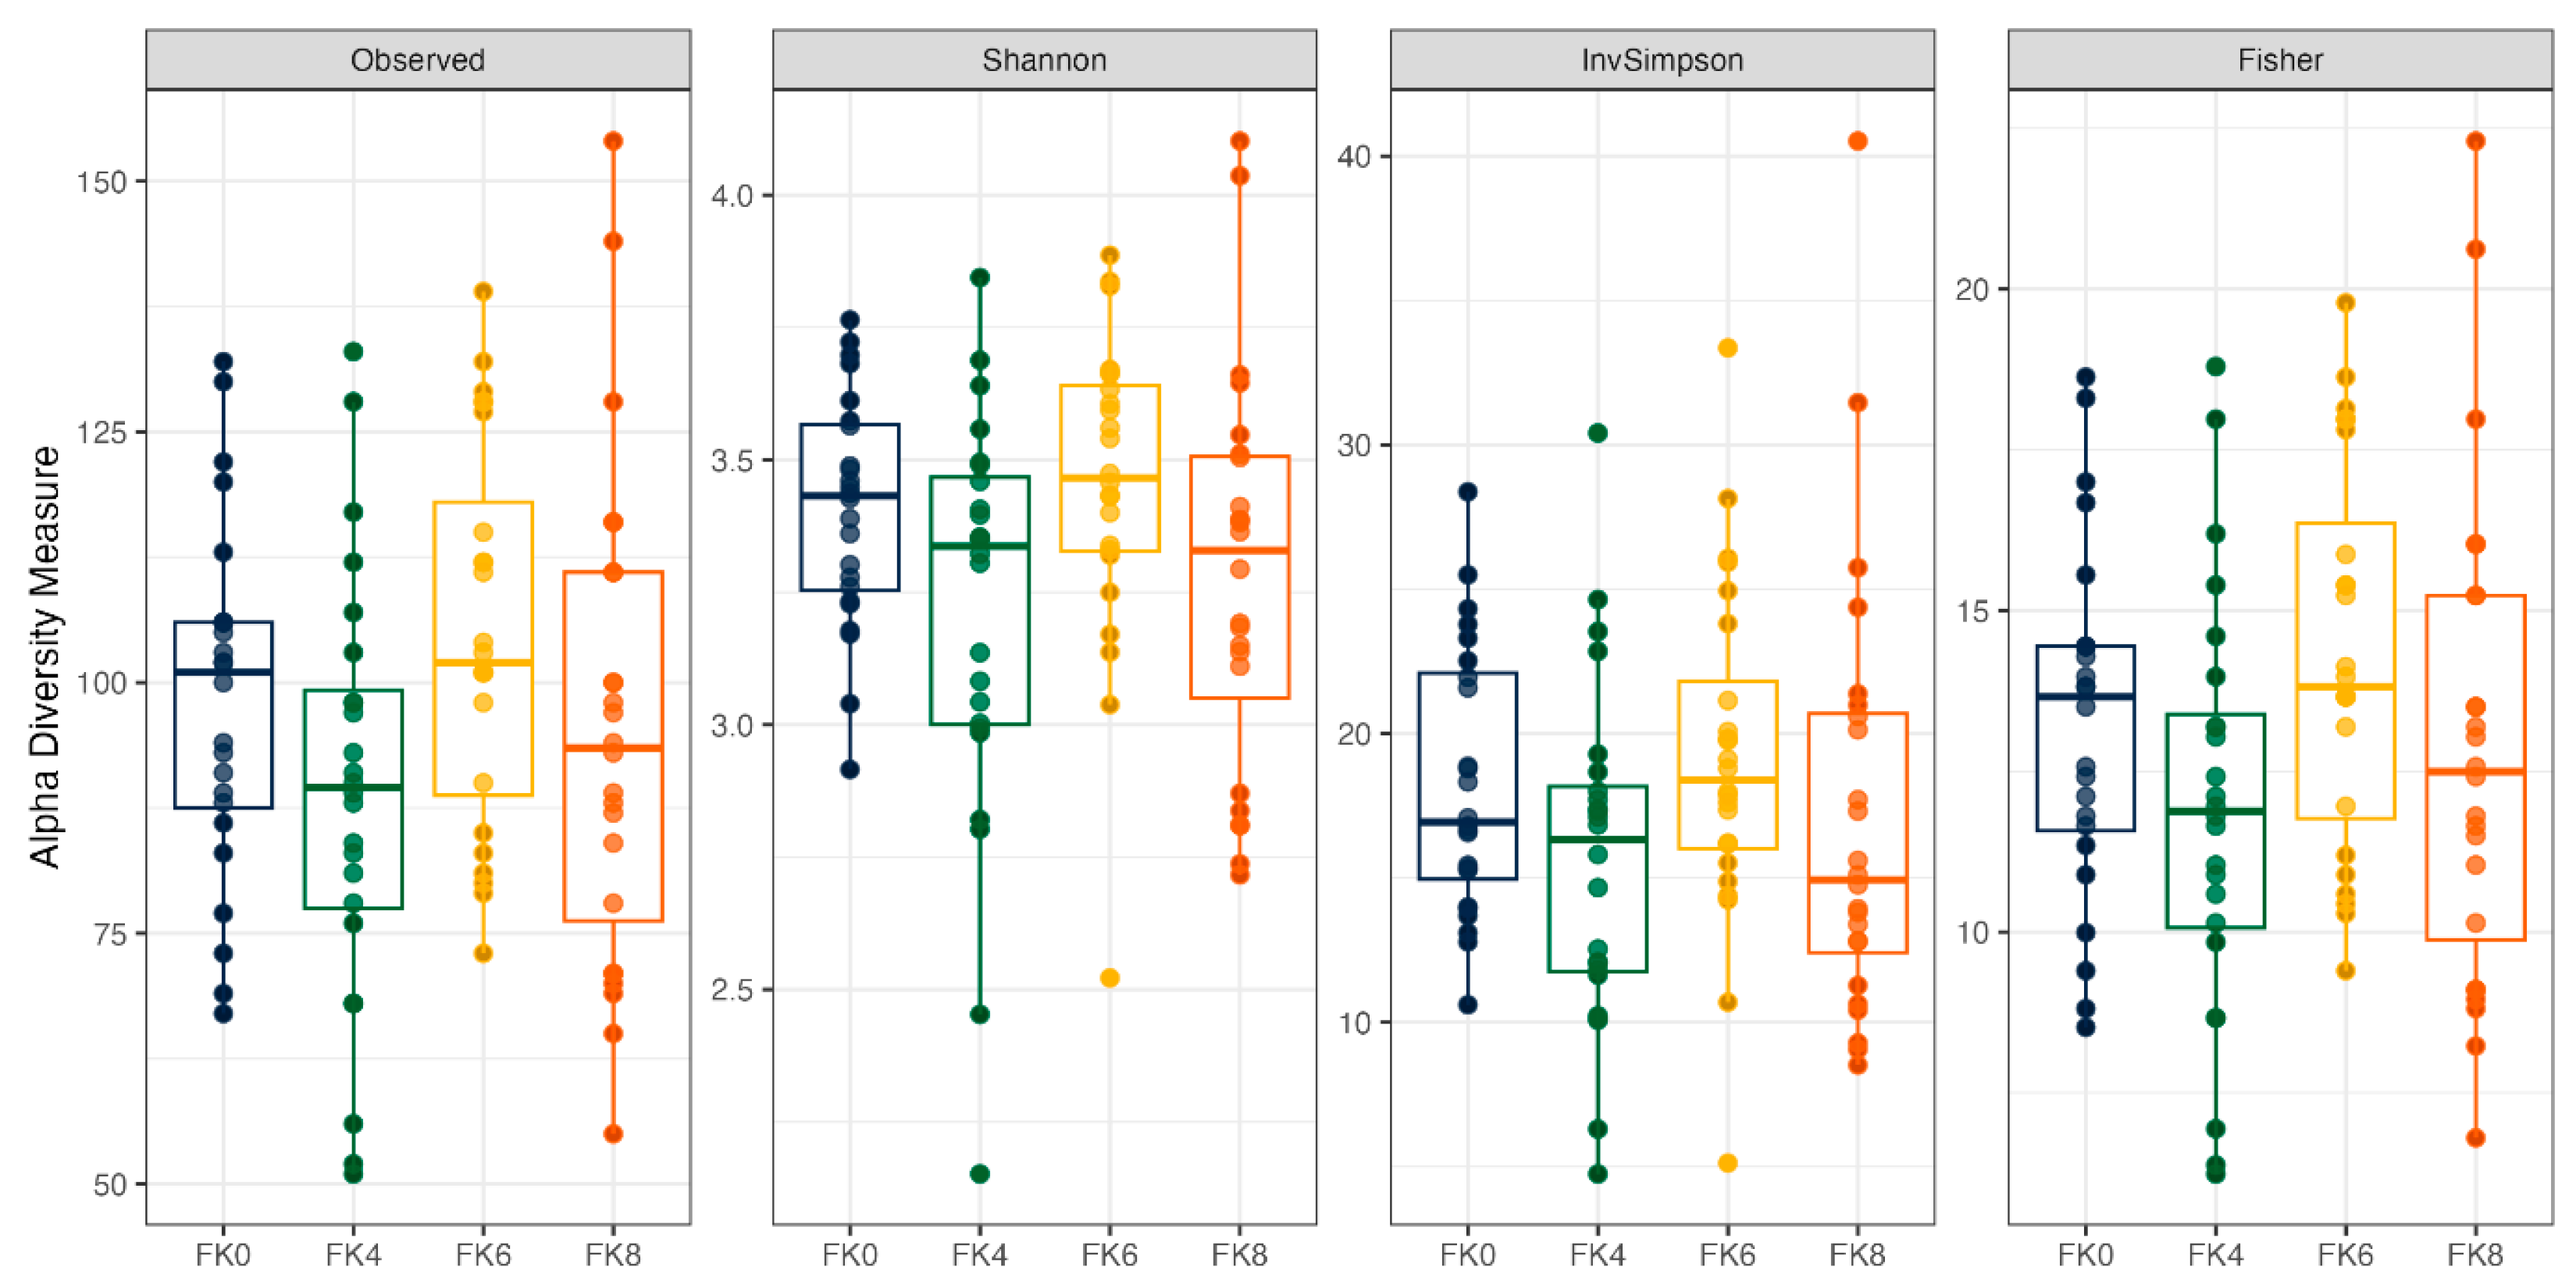
Figure 3.
Alpha diversity of fecal samples from dogs, analyzed based on the interaction between dietary treatment and time point. Dietary treatments included FeedKind® (FK) at 0% (FK0), 4% (FK4), 6% (FK6), and 8% (FK8), with samples collected at baseline (D0), day 178 (D178), and day 235 (D235).
Figure 3.
Alpha diversity of fecal samples from dogs, analyzed based on the interaction between dietary treatment and time point. Dietary treatments included FeedKind® (FK) at 0% (FK0), 4% (FK4), 6% (FK6), and 8% (FK8), with samples collected at baseline (D0), day 178 (D178), and day 235 (D235).
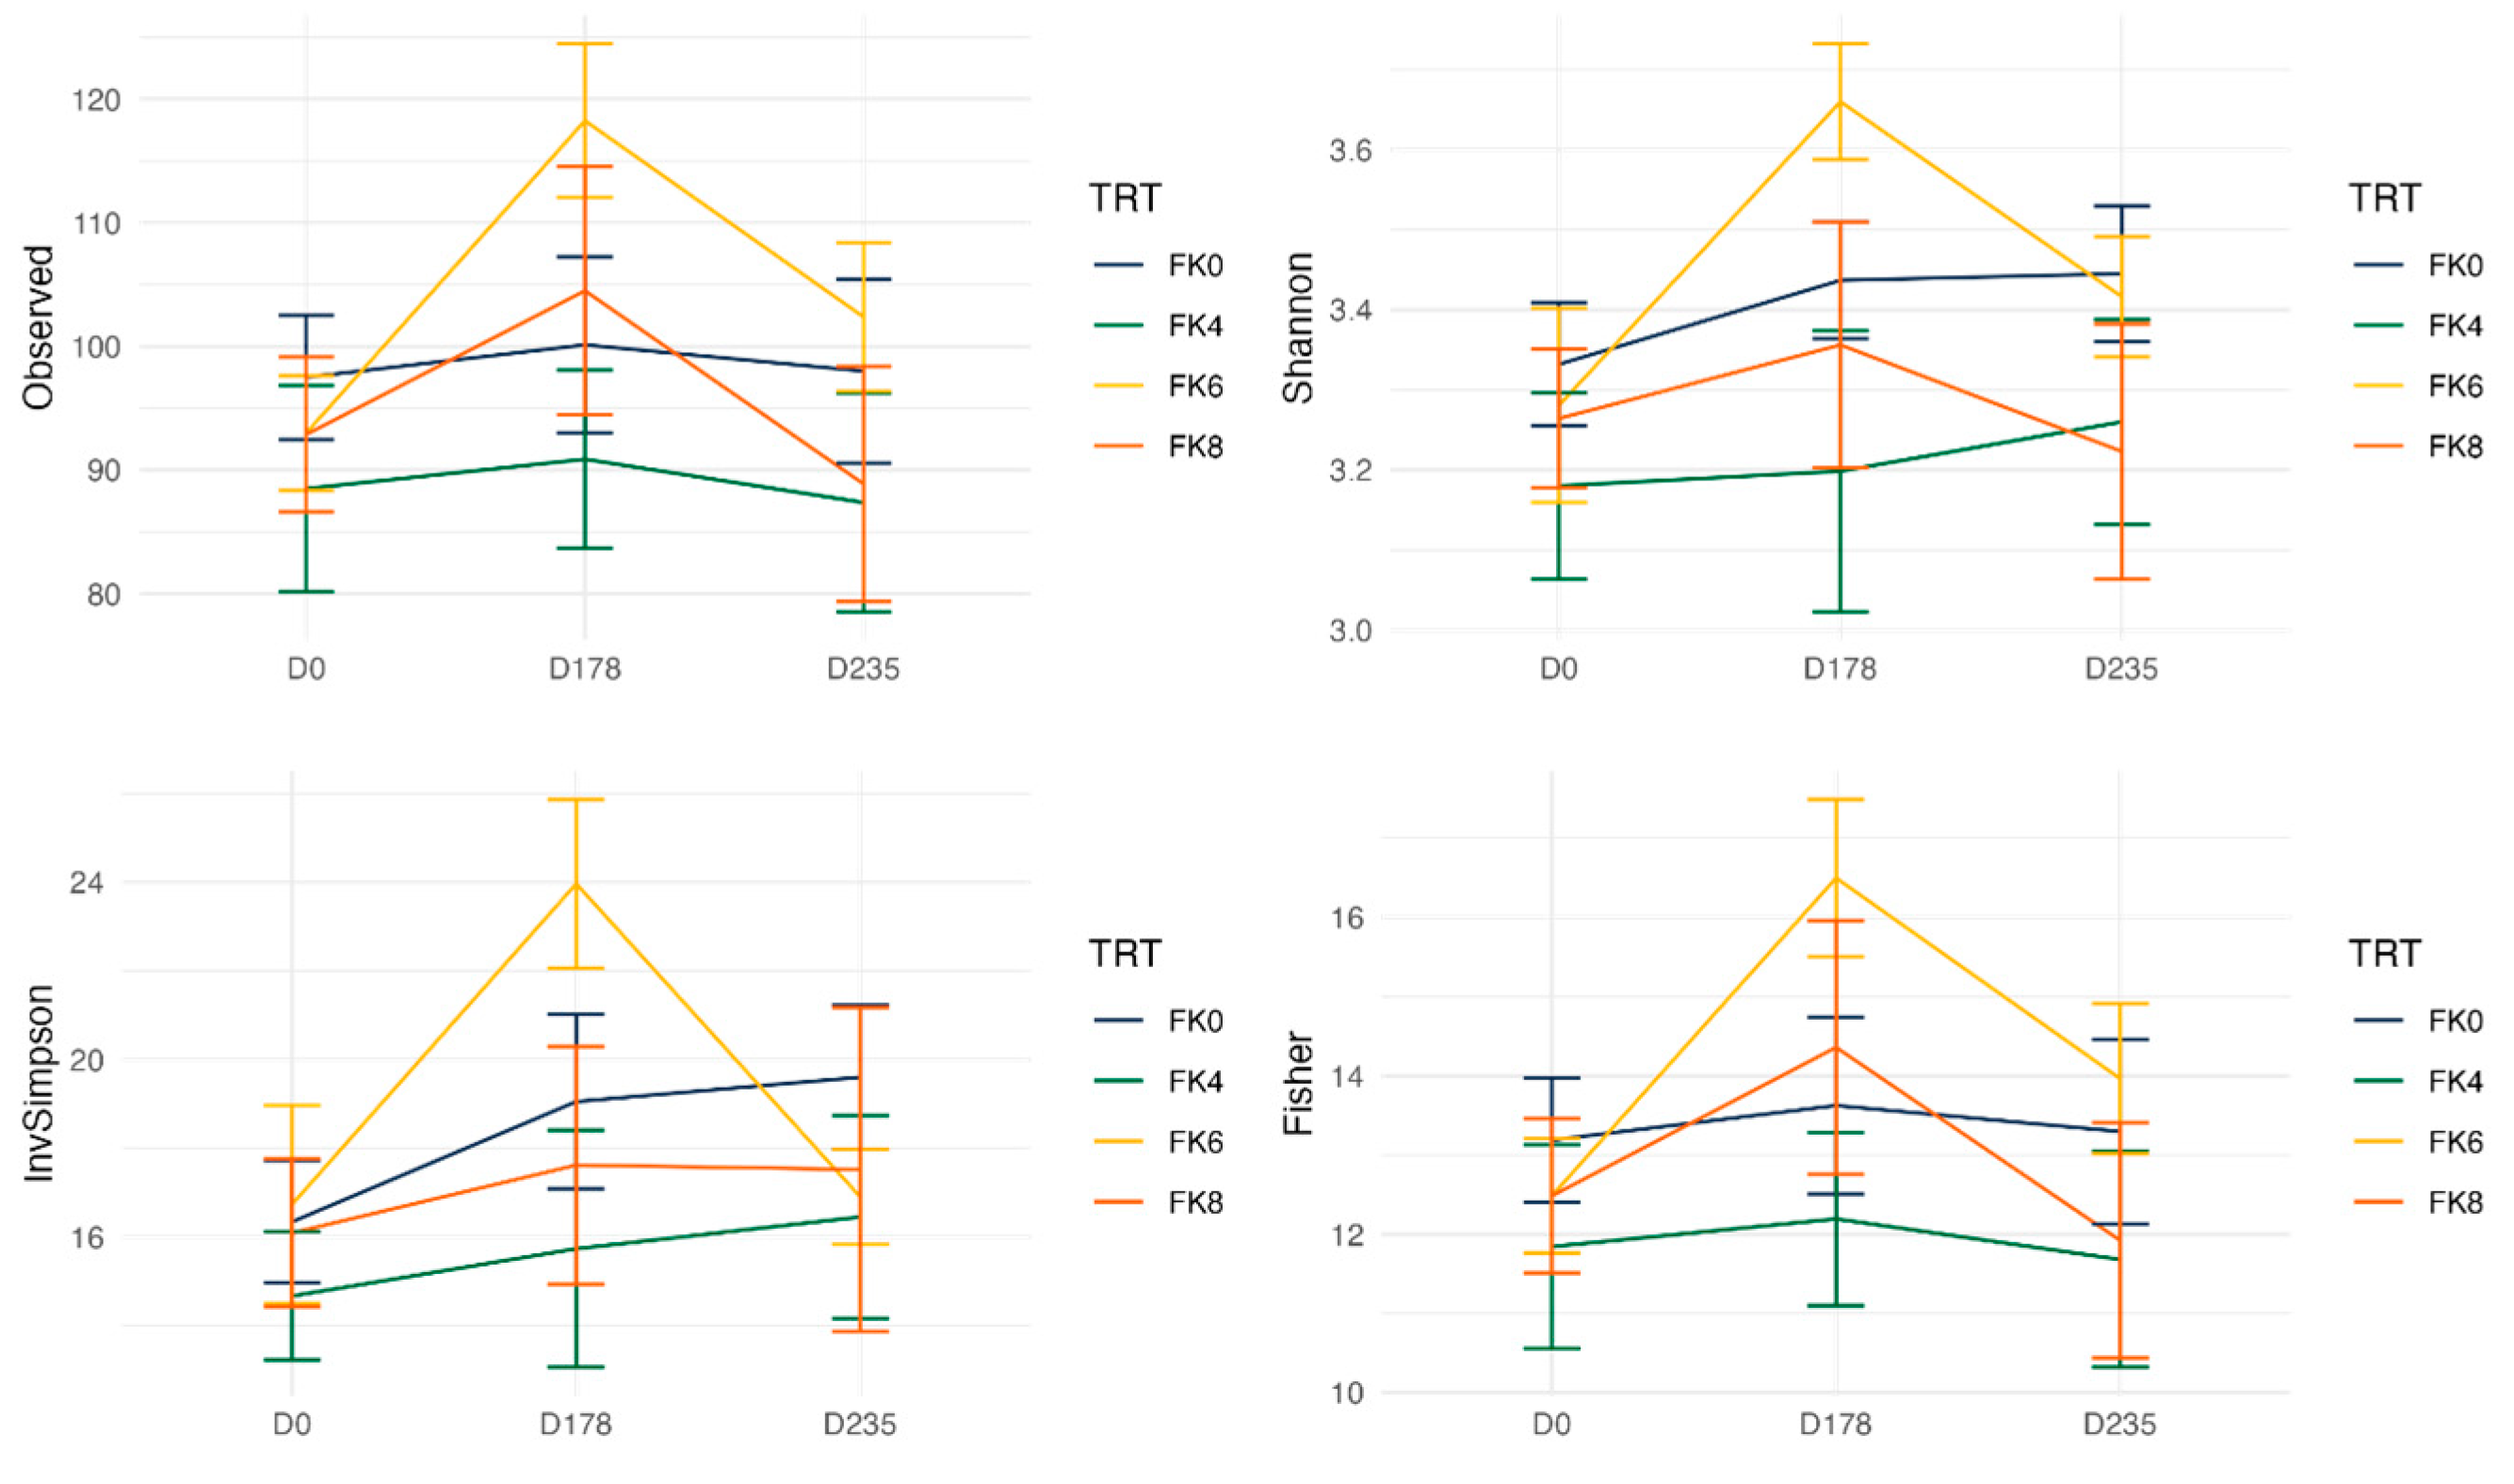
Figure 4.
Beta diversity plots of fecal samples from dogs based on weighted and unweighted UniFrac distances at baseline (D0) and after 178 days (D178).
Figure 4.
Beta diversity plots of fecal samples from dogs based on weighted and unweighted UniFrac distances at baseline (D0) and after 178 days (D178).
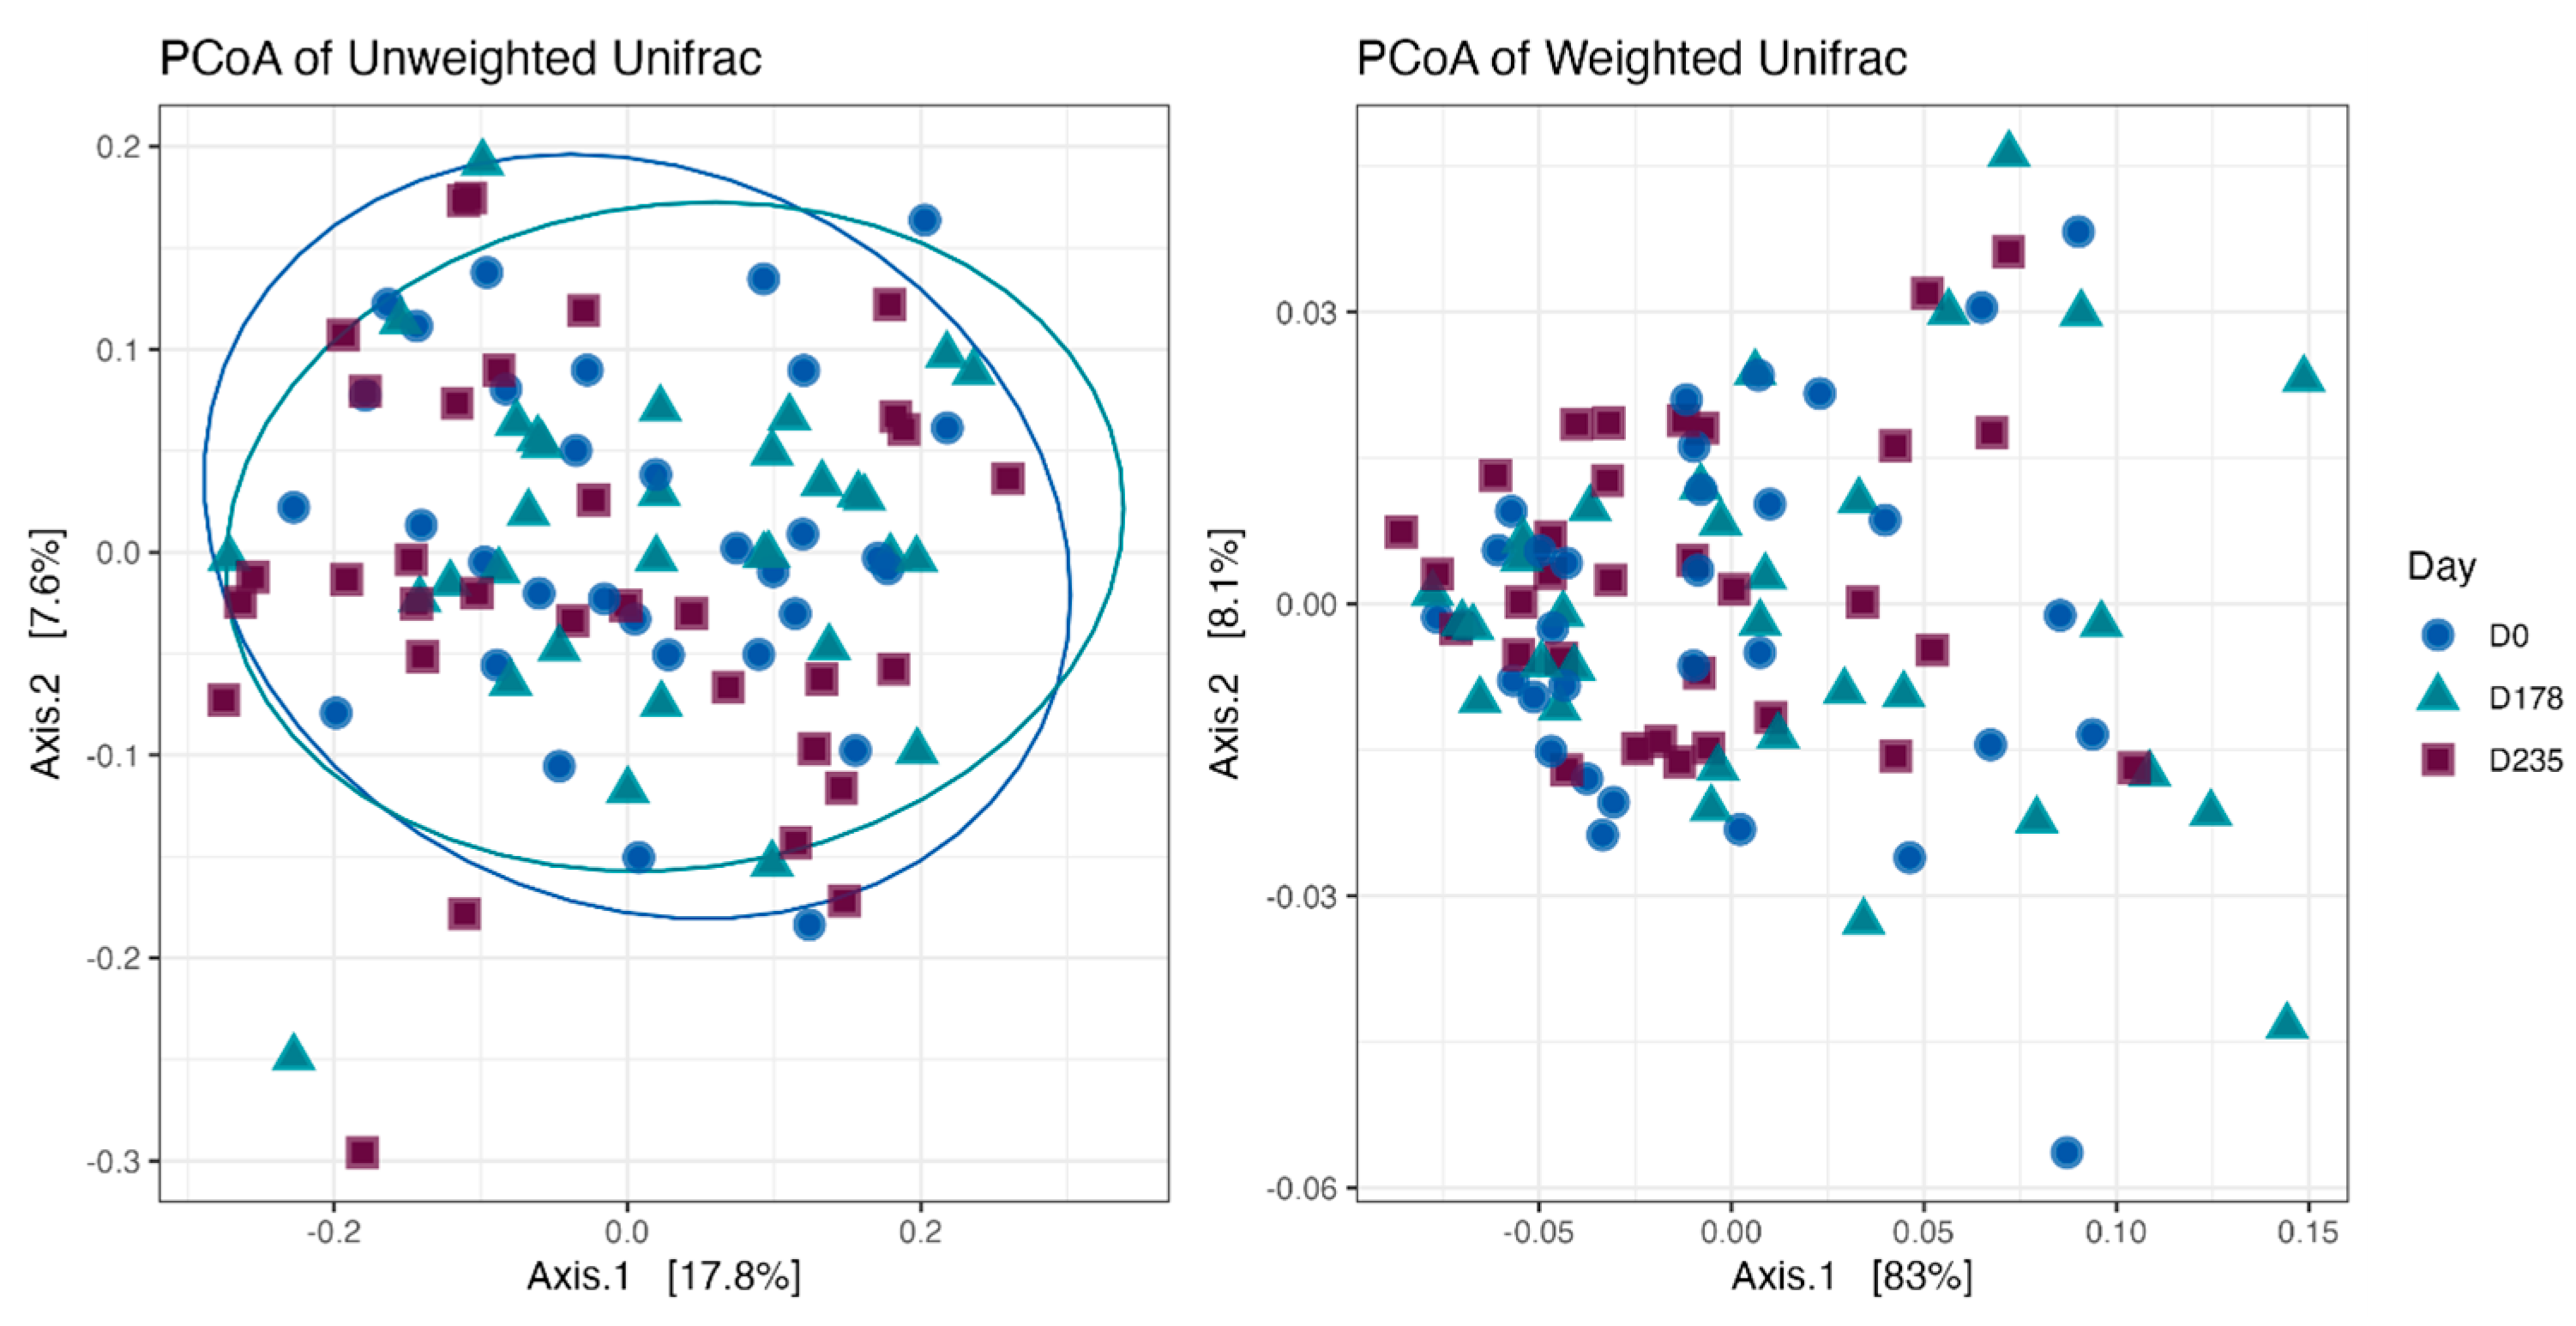
Figure 5.
Beta diversity plots of fecal samples from dogs based on weighted and unweighted UniFrac distances. FK0: 0% FeedKind® inclusion; FK4: 4% FeedKind® inclusion; FK6: 6% FeedKind® inclusion; FK8: 8% FeedKind® inclusion.
Figure 5.
Beta diversity plots of fecal samples from dogs based on weighted and unweighted UniFrac distances. FK0: 0% FeedKind® inclusion; FK4: 4% FeedKind® inclusion; FK6: 6% FeedKind® inclusion; FK8: 8% FeedKind® inclusion.
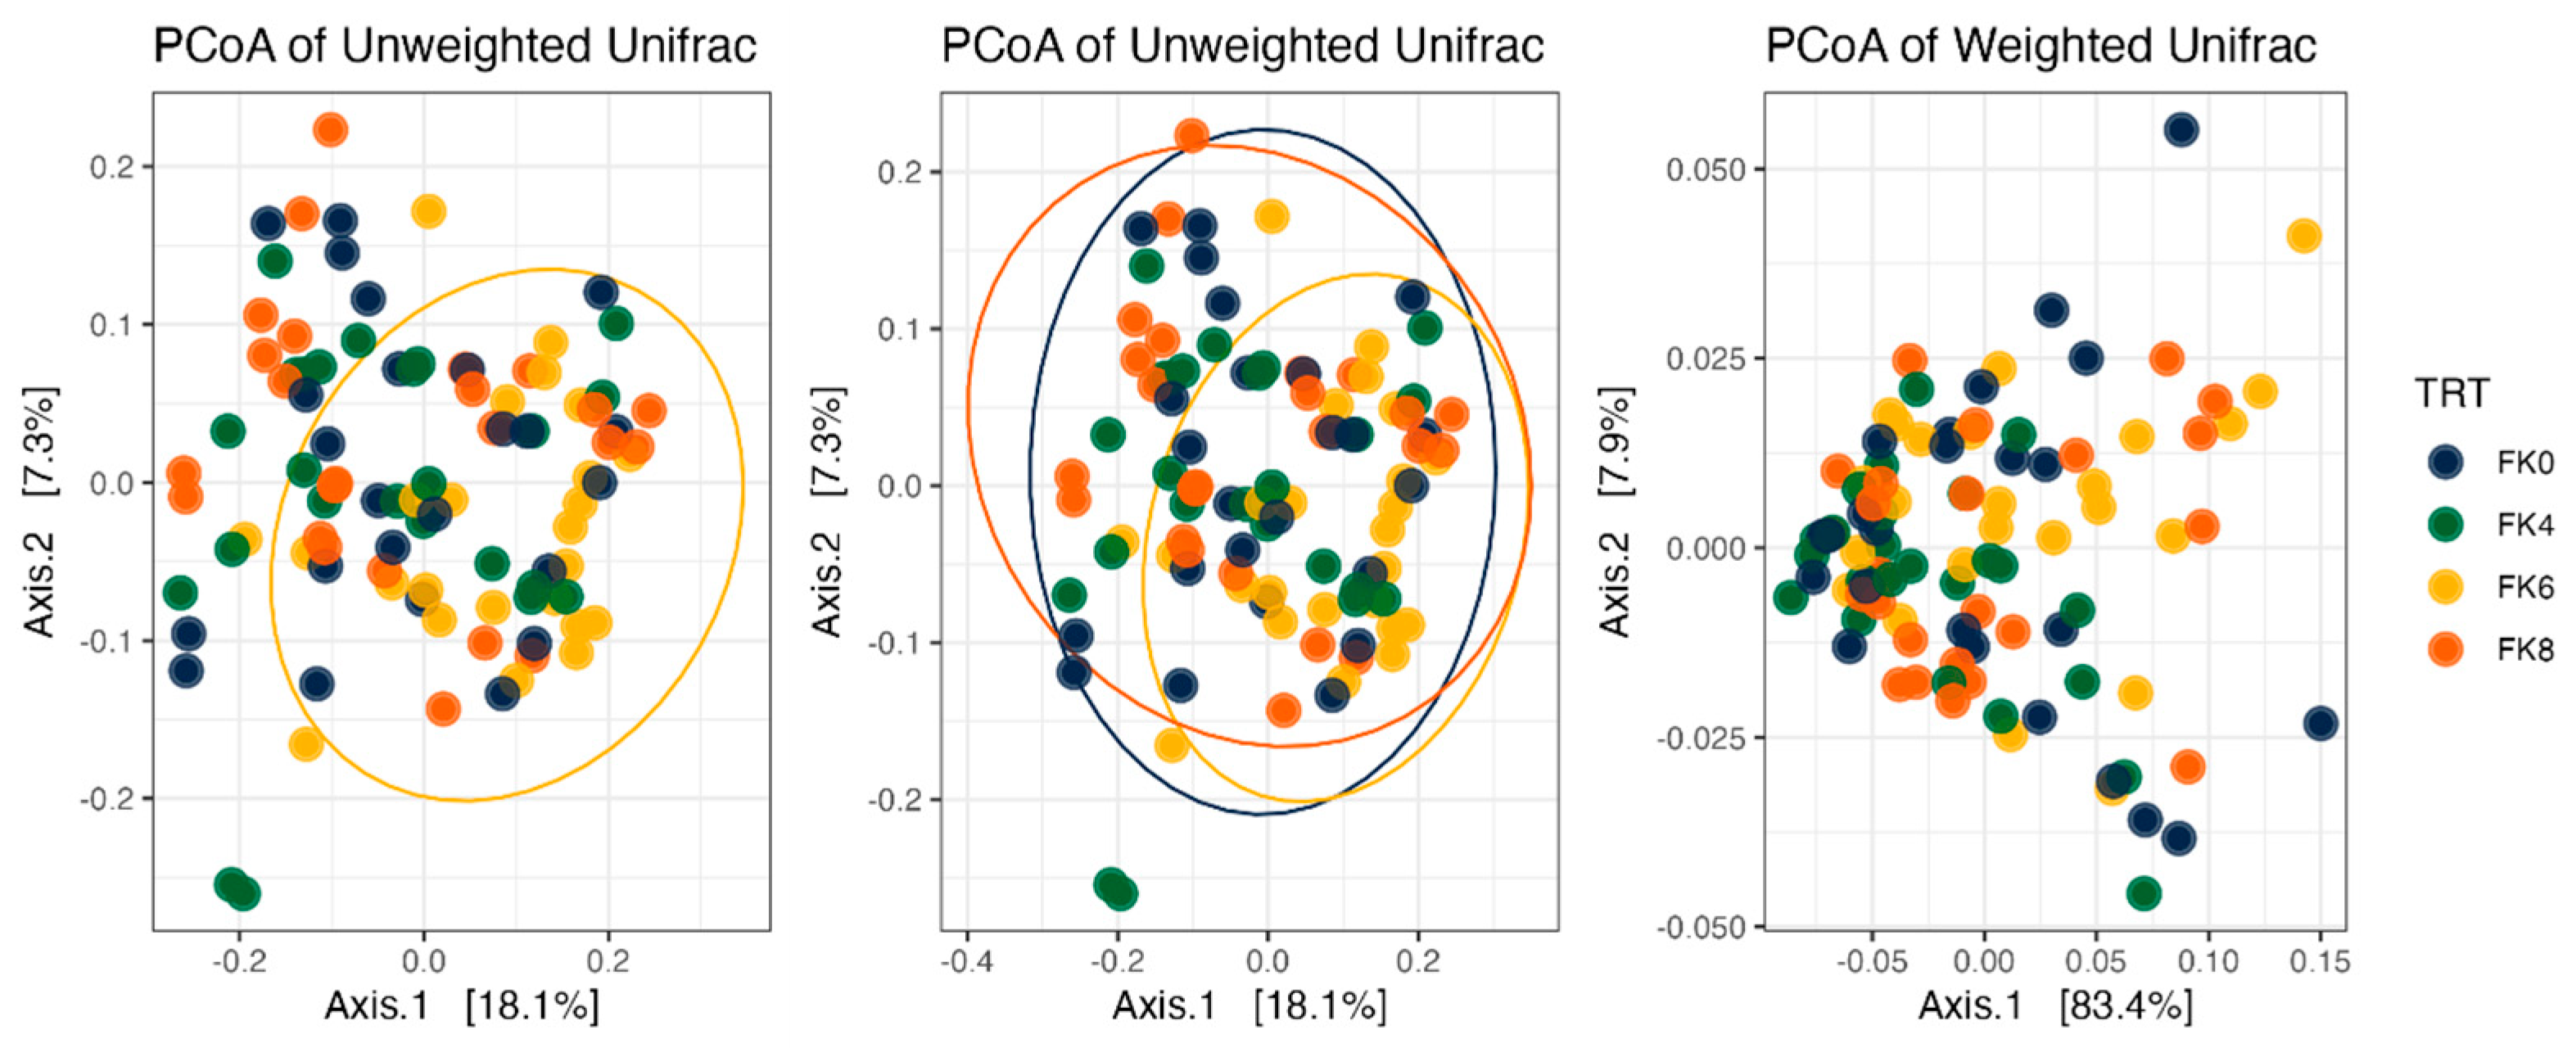
Figure 6.
Beta diversity plots of fecal samples from dogs based on weighted and unweighted UniFrac distances. FK0: 0% FeedKind® inclusion; FK4: 4% FeedKind® inclusion; FK6: 6% FeedKind® inclusion; FK8: 8% FeedKind® inclusion. D0: baseline; D178: day 178.
Figure 6.
Beta diversity plots of fecal samples from dogs based on weighted and unweighted UniFrac distances. FK0: 0% FeedKind® inclusion; FK4: 4% FeedKind® inclusion; FK6: 6% FeedKind® inclusion; FK8: 8% FeedKind® inclusion. D0: baseline; D178: day 178.
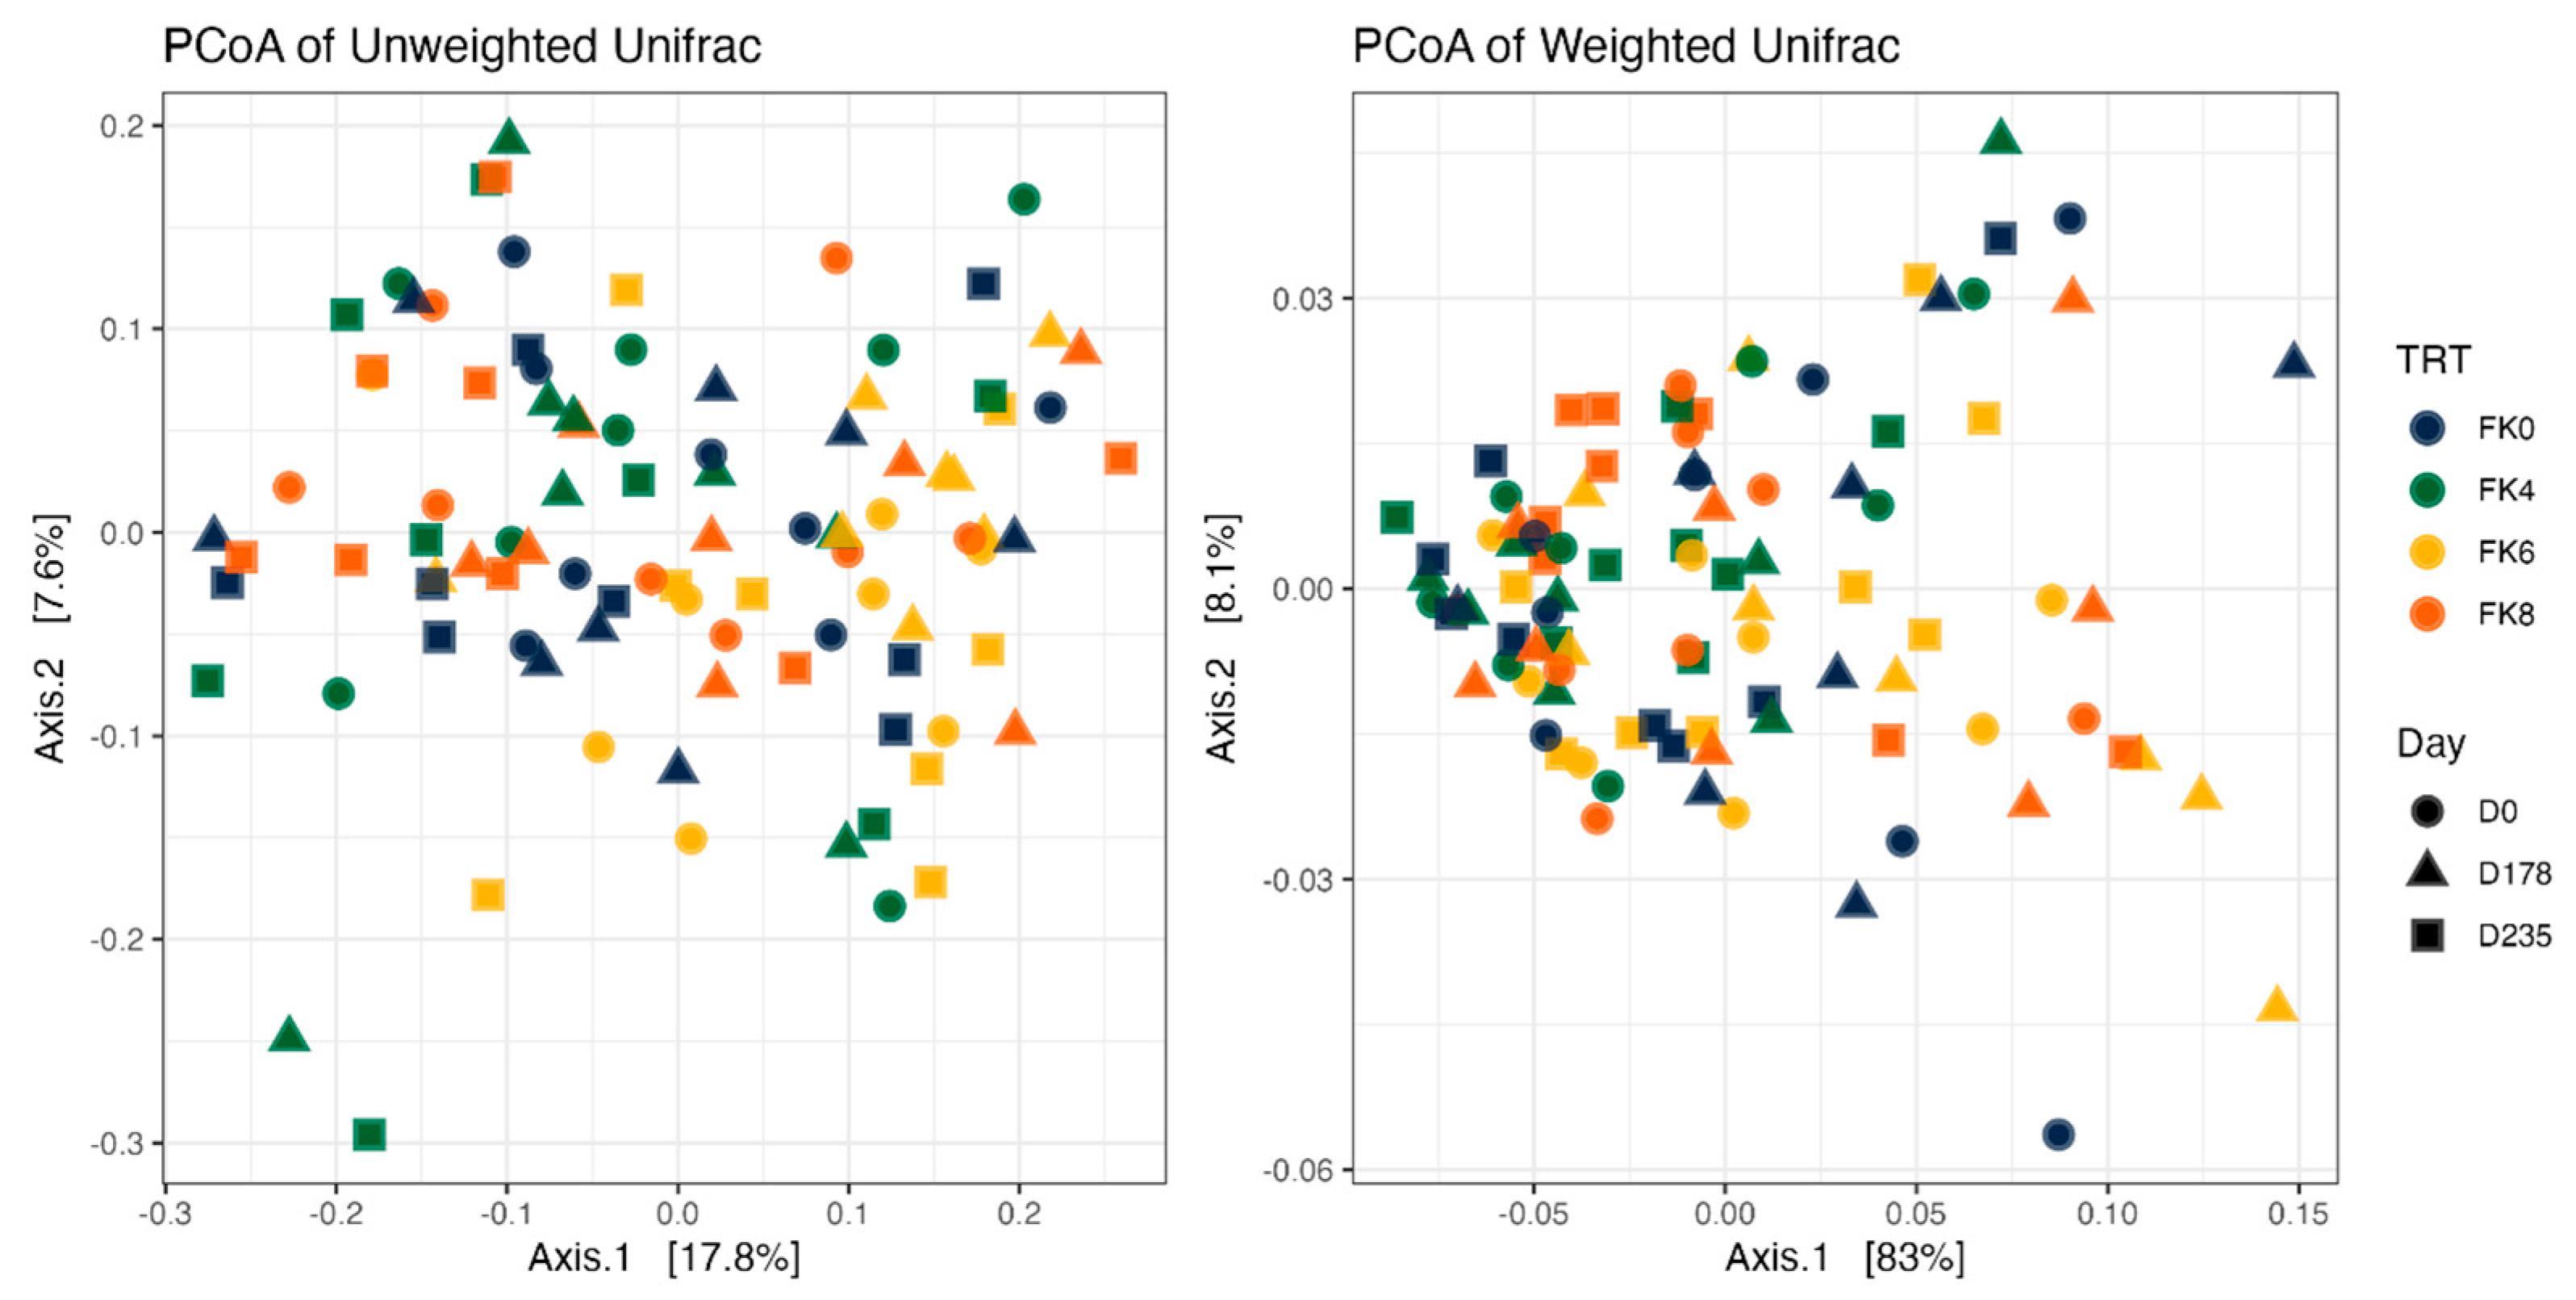
Figure 7.
Relative abundance of fecal bacterial taxa in dogs across dietary treatments and time points. FK0: 0% FeedKind® inclusion; FK4: 4% FeedKind® inclusion; FK6: 6% FeedKind® inclusion; FK8: 8% FeedKind® inclusion. D0: baseline; D178: day 178; D235: day 235.
Figure 7.
Relative abundance of fecal bacterial taxa in dogs across dietary treatments and time points. FK0: 0% FeedKind® inclusion; FK4: 4% FeedKind® inclusion; FK6: 6% FeedKind® inclusion; FK8: 8% FeedKind® inclusion. D0: baseline; D178: day 178; D235: day 235.
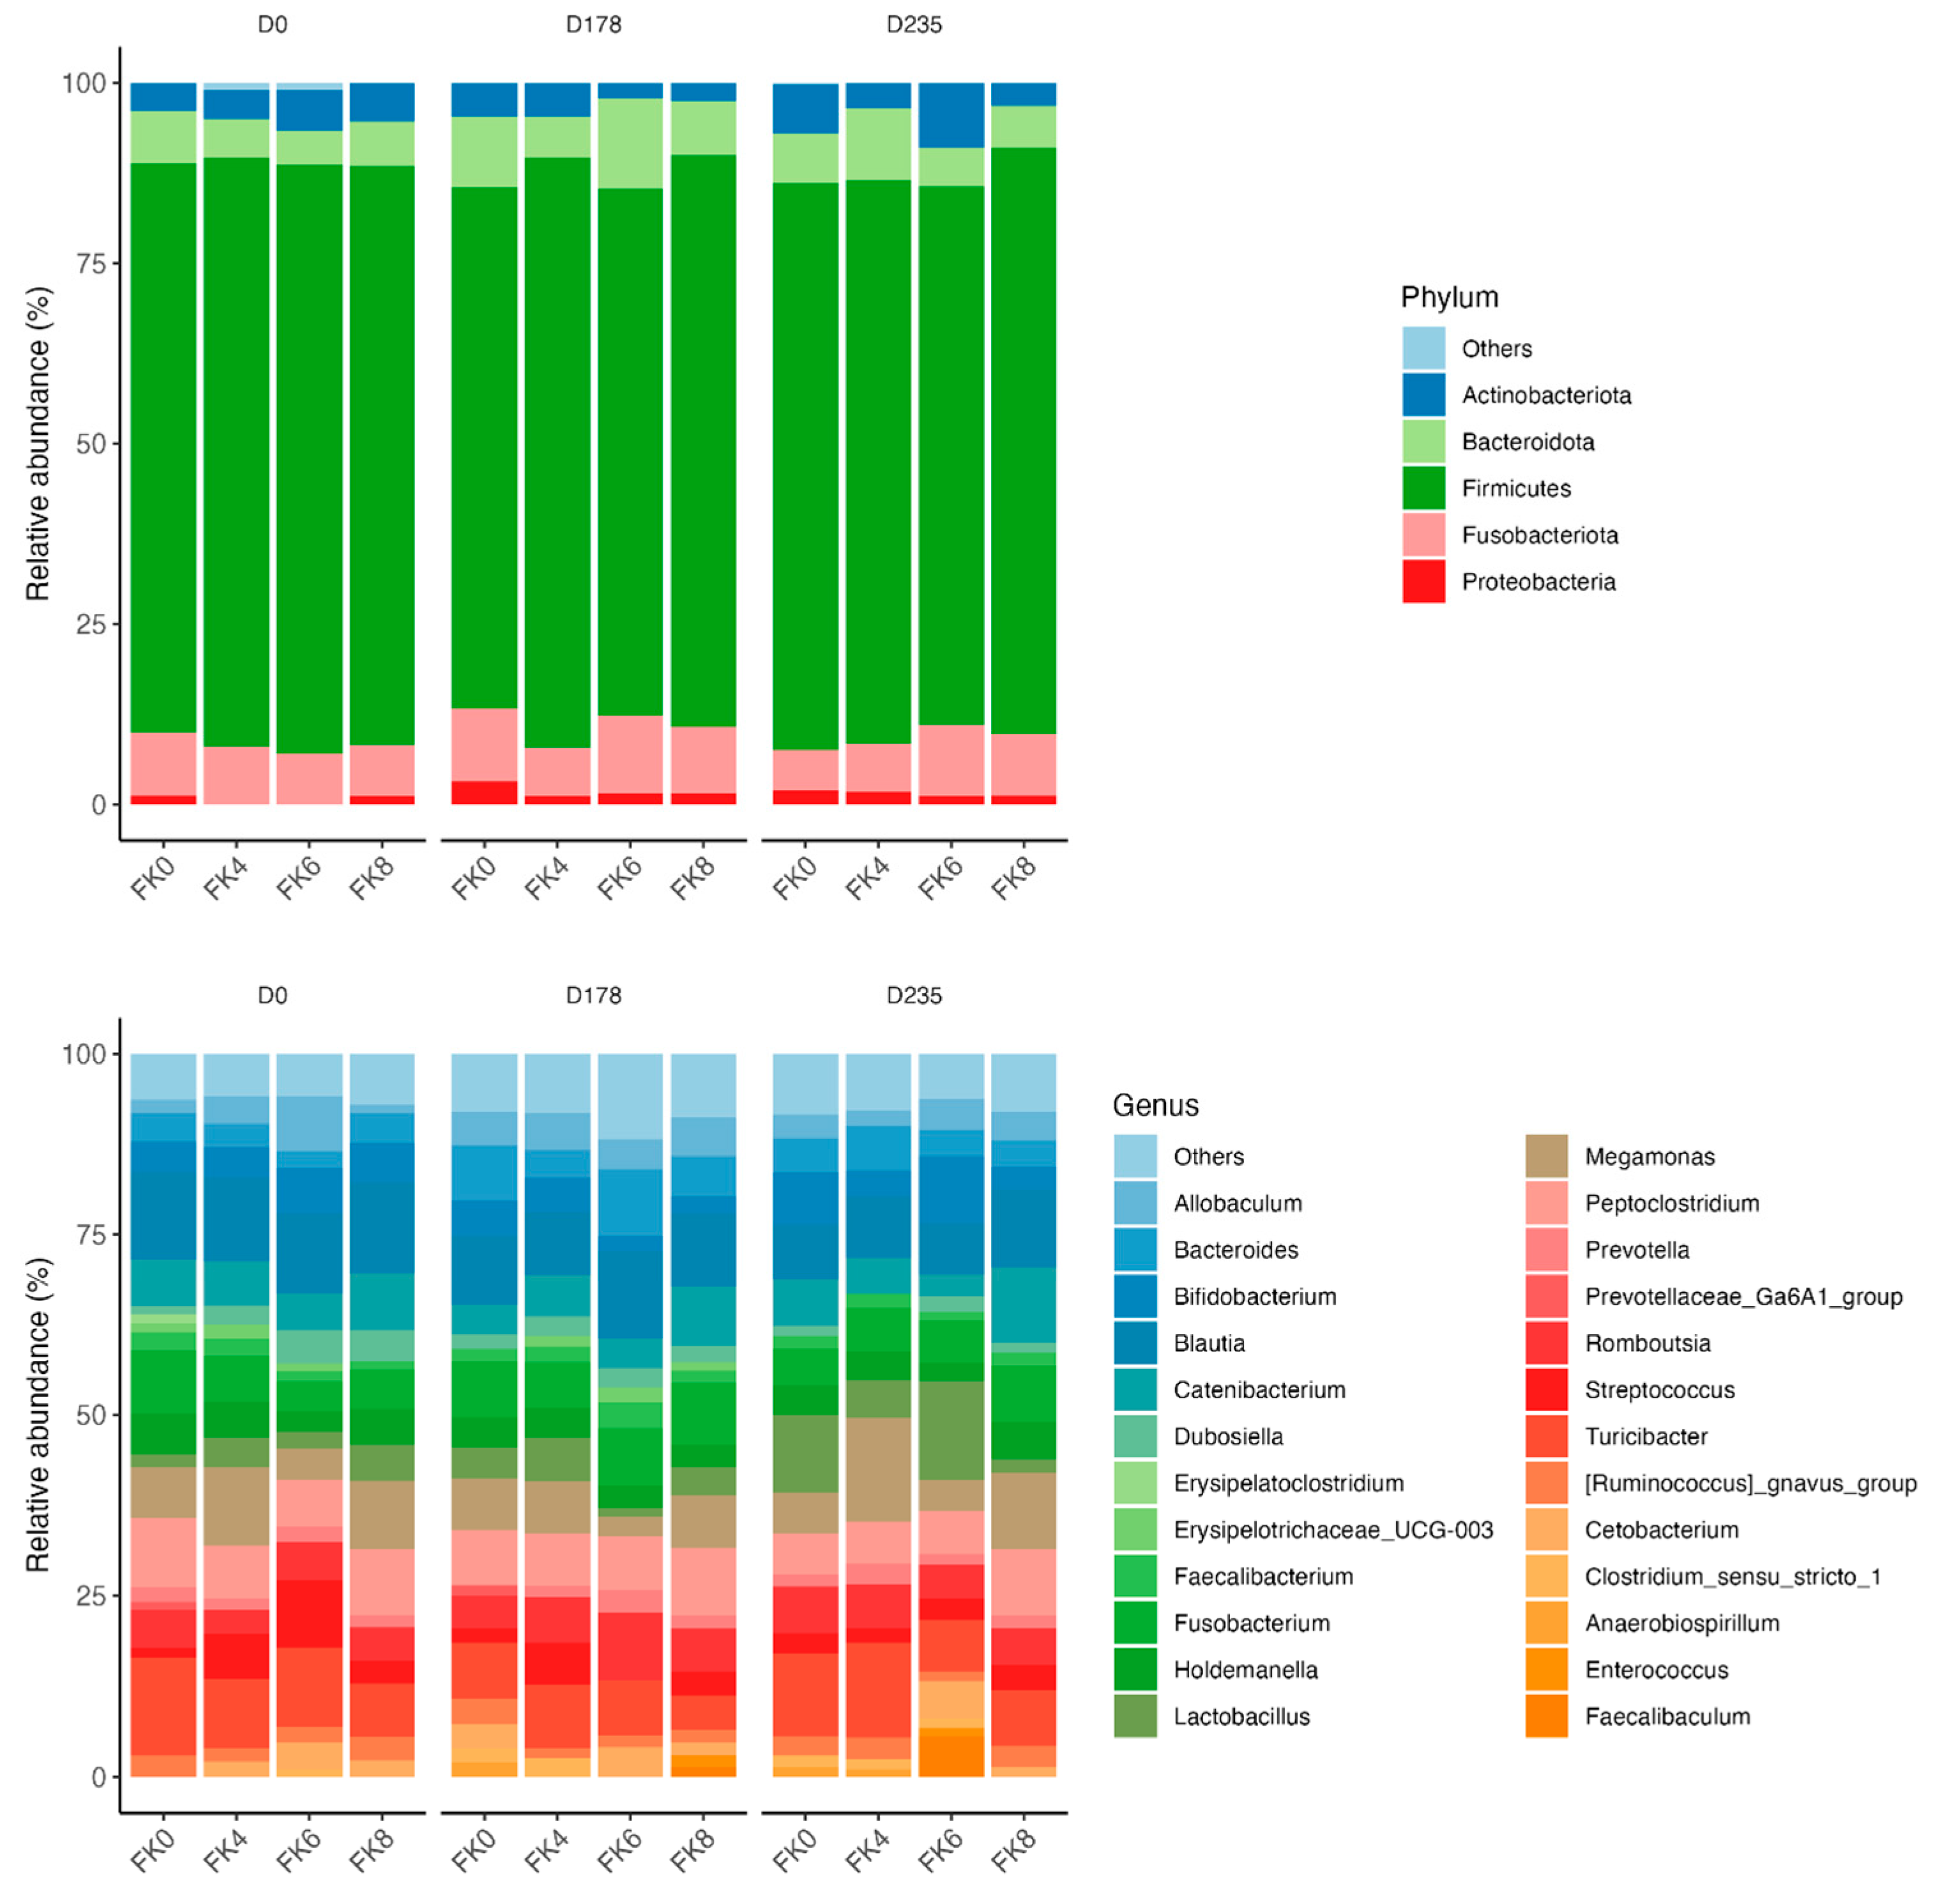
Figure 8.
Relative abundance of the phylum Actinobacteria and its genus Bifidobacterium in fecal samples of dogs across dietary treatments and time points. FK0: 0% FeedKind® inclusion; FK4: 4% FeedKind® inclusion; FK6: 6% FeedKind® inclusion; FK8: 8% FeedKind® inclusion. D0: baseline; D178: day 178; D235: day 235.
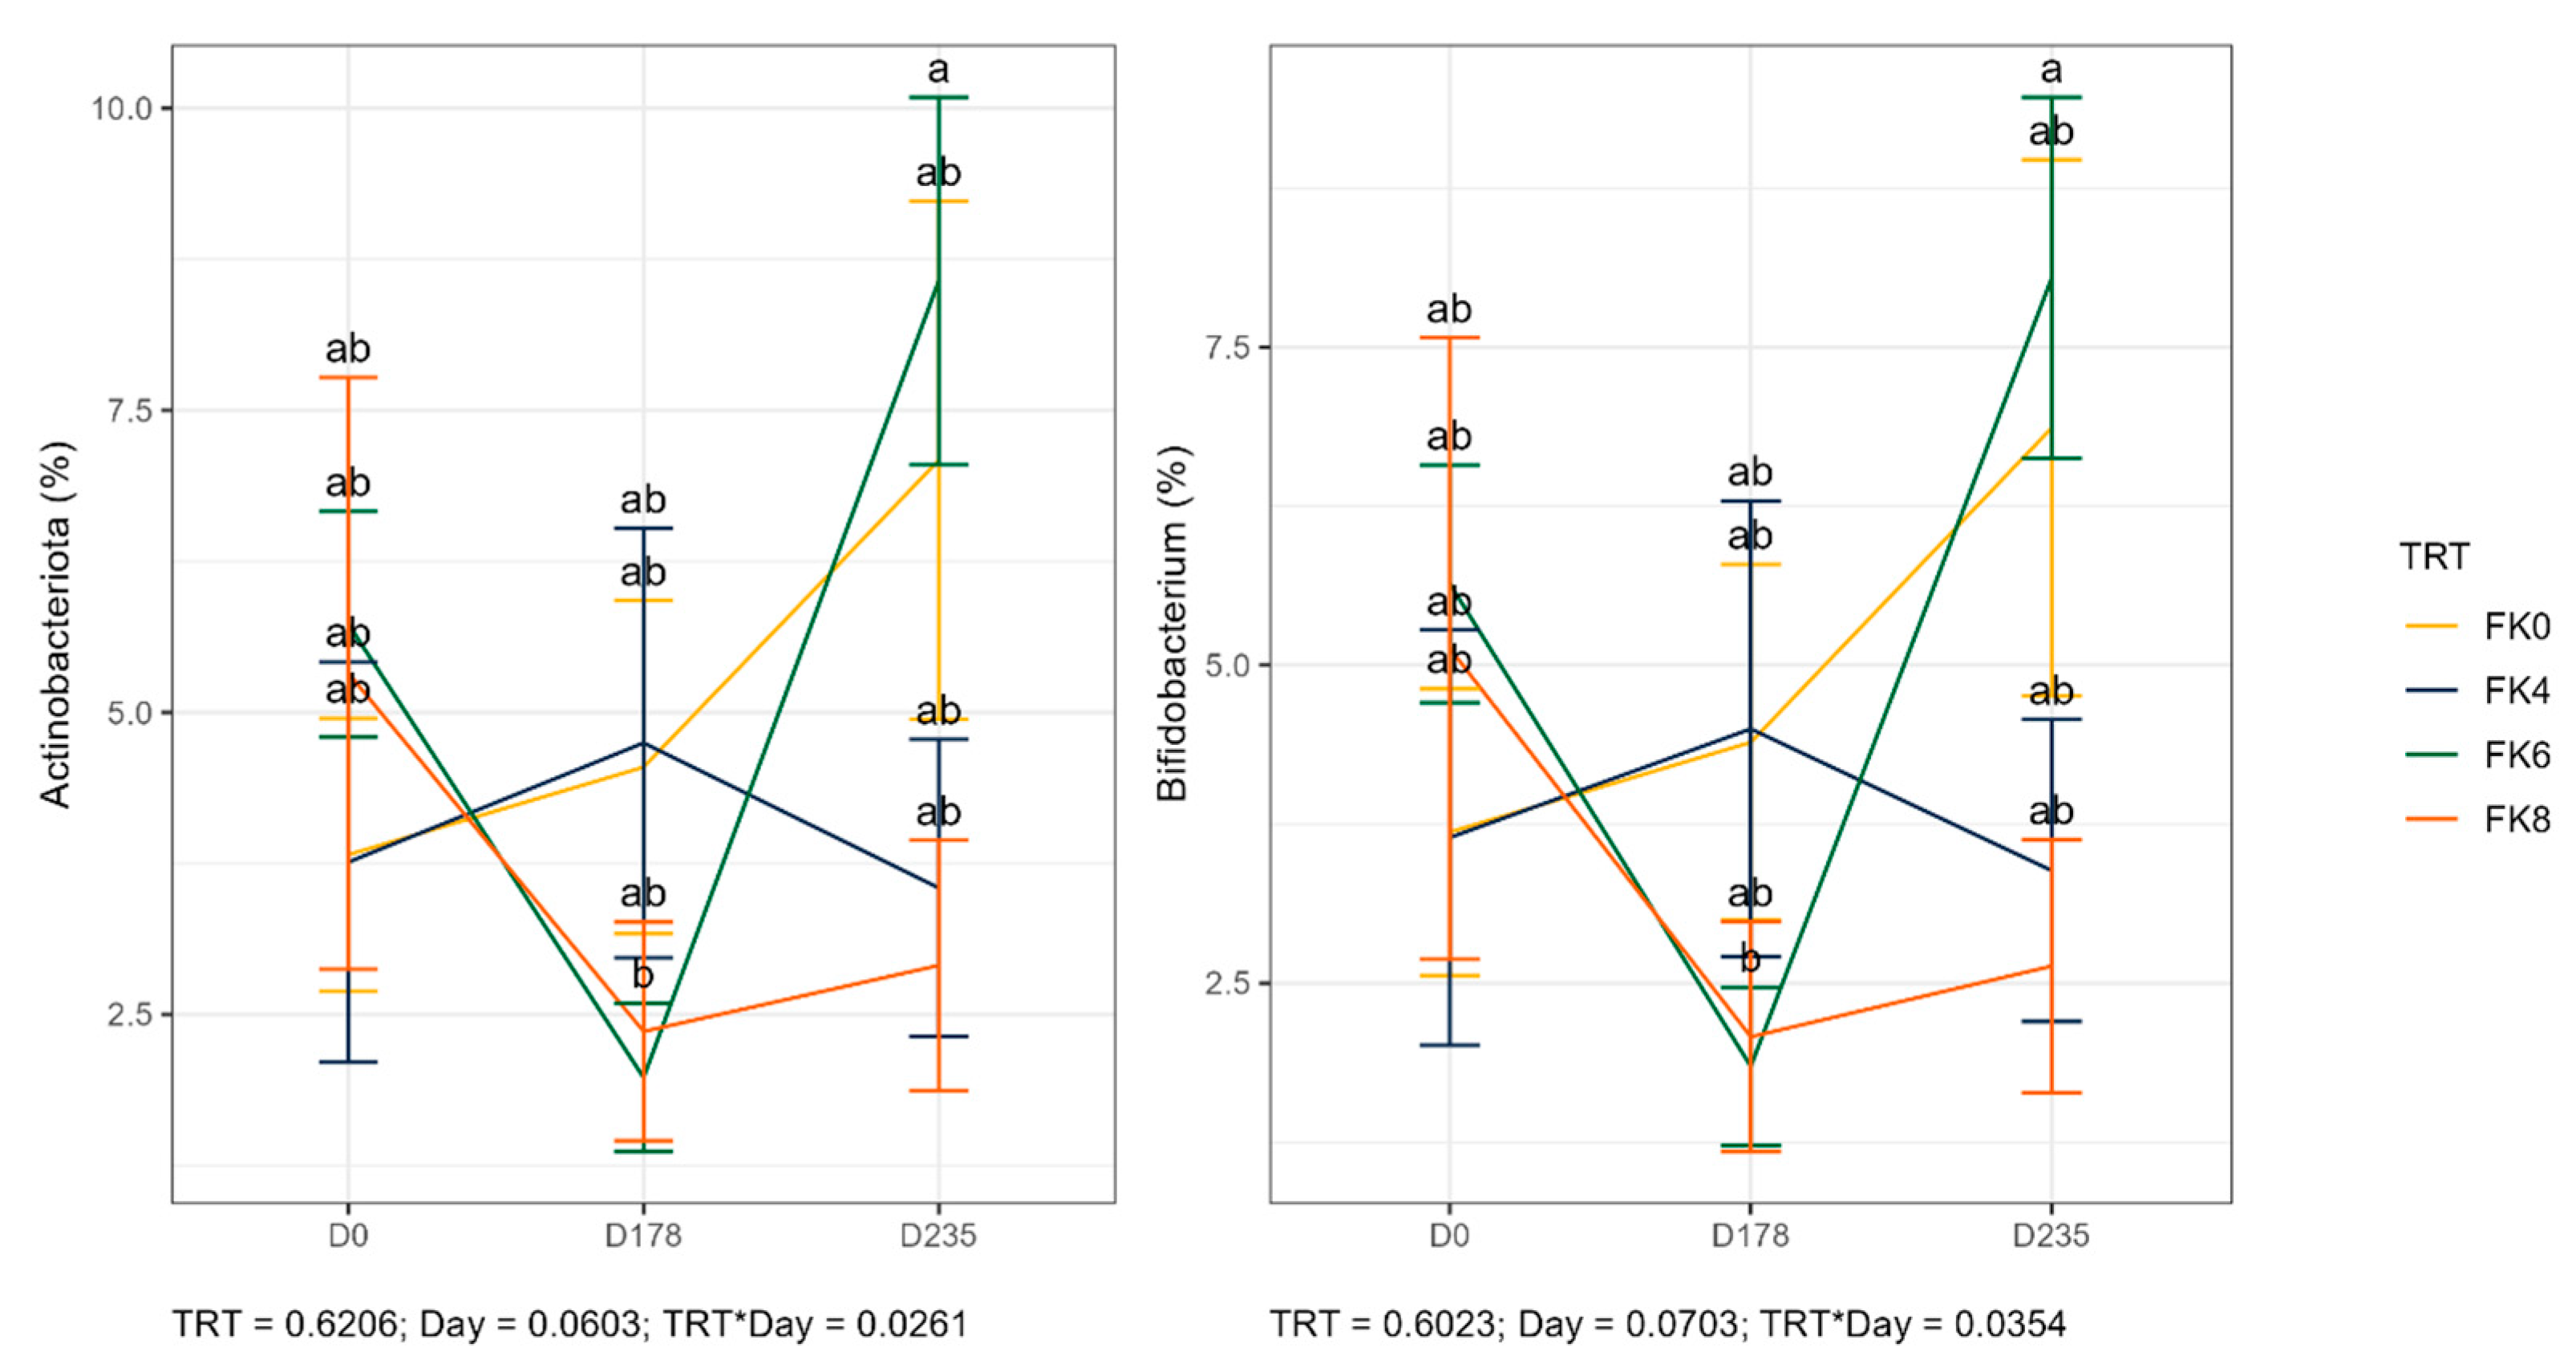
Figure 9.
Relative abundance of specific bacterial taxa in fecal samples of dogs across dietary treatments and time points. FK0: 0% FeedKind® inclusion; FK4: 4% FeedKind® inclusion; FK6: 6% FeedKind® inclusion; FK8: 8% FeedKind® inclusion. D0: baseline; D178: day 178; D235: day 235.
Figure 9.
Relative abundance of specific bacterial taxa in fecal samples of dogs across dietary treatments and time points. FK0: 0% FeedKind® inclusion; FK4: 4% FeedKind® inclusion; FK6: 6% FeedKind® inclusion; FK8: 8% FeedKind® inclusion. D0: baseline; D178: day 178; D235: day 235.
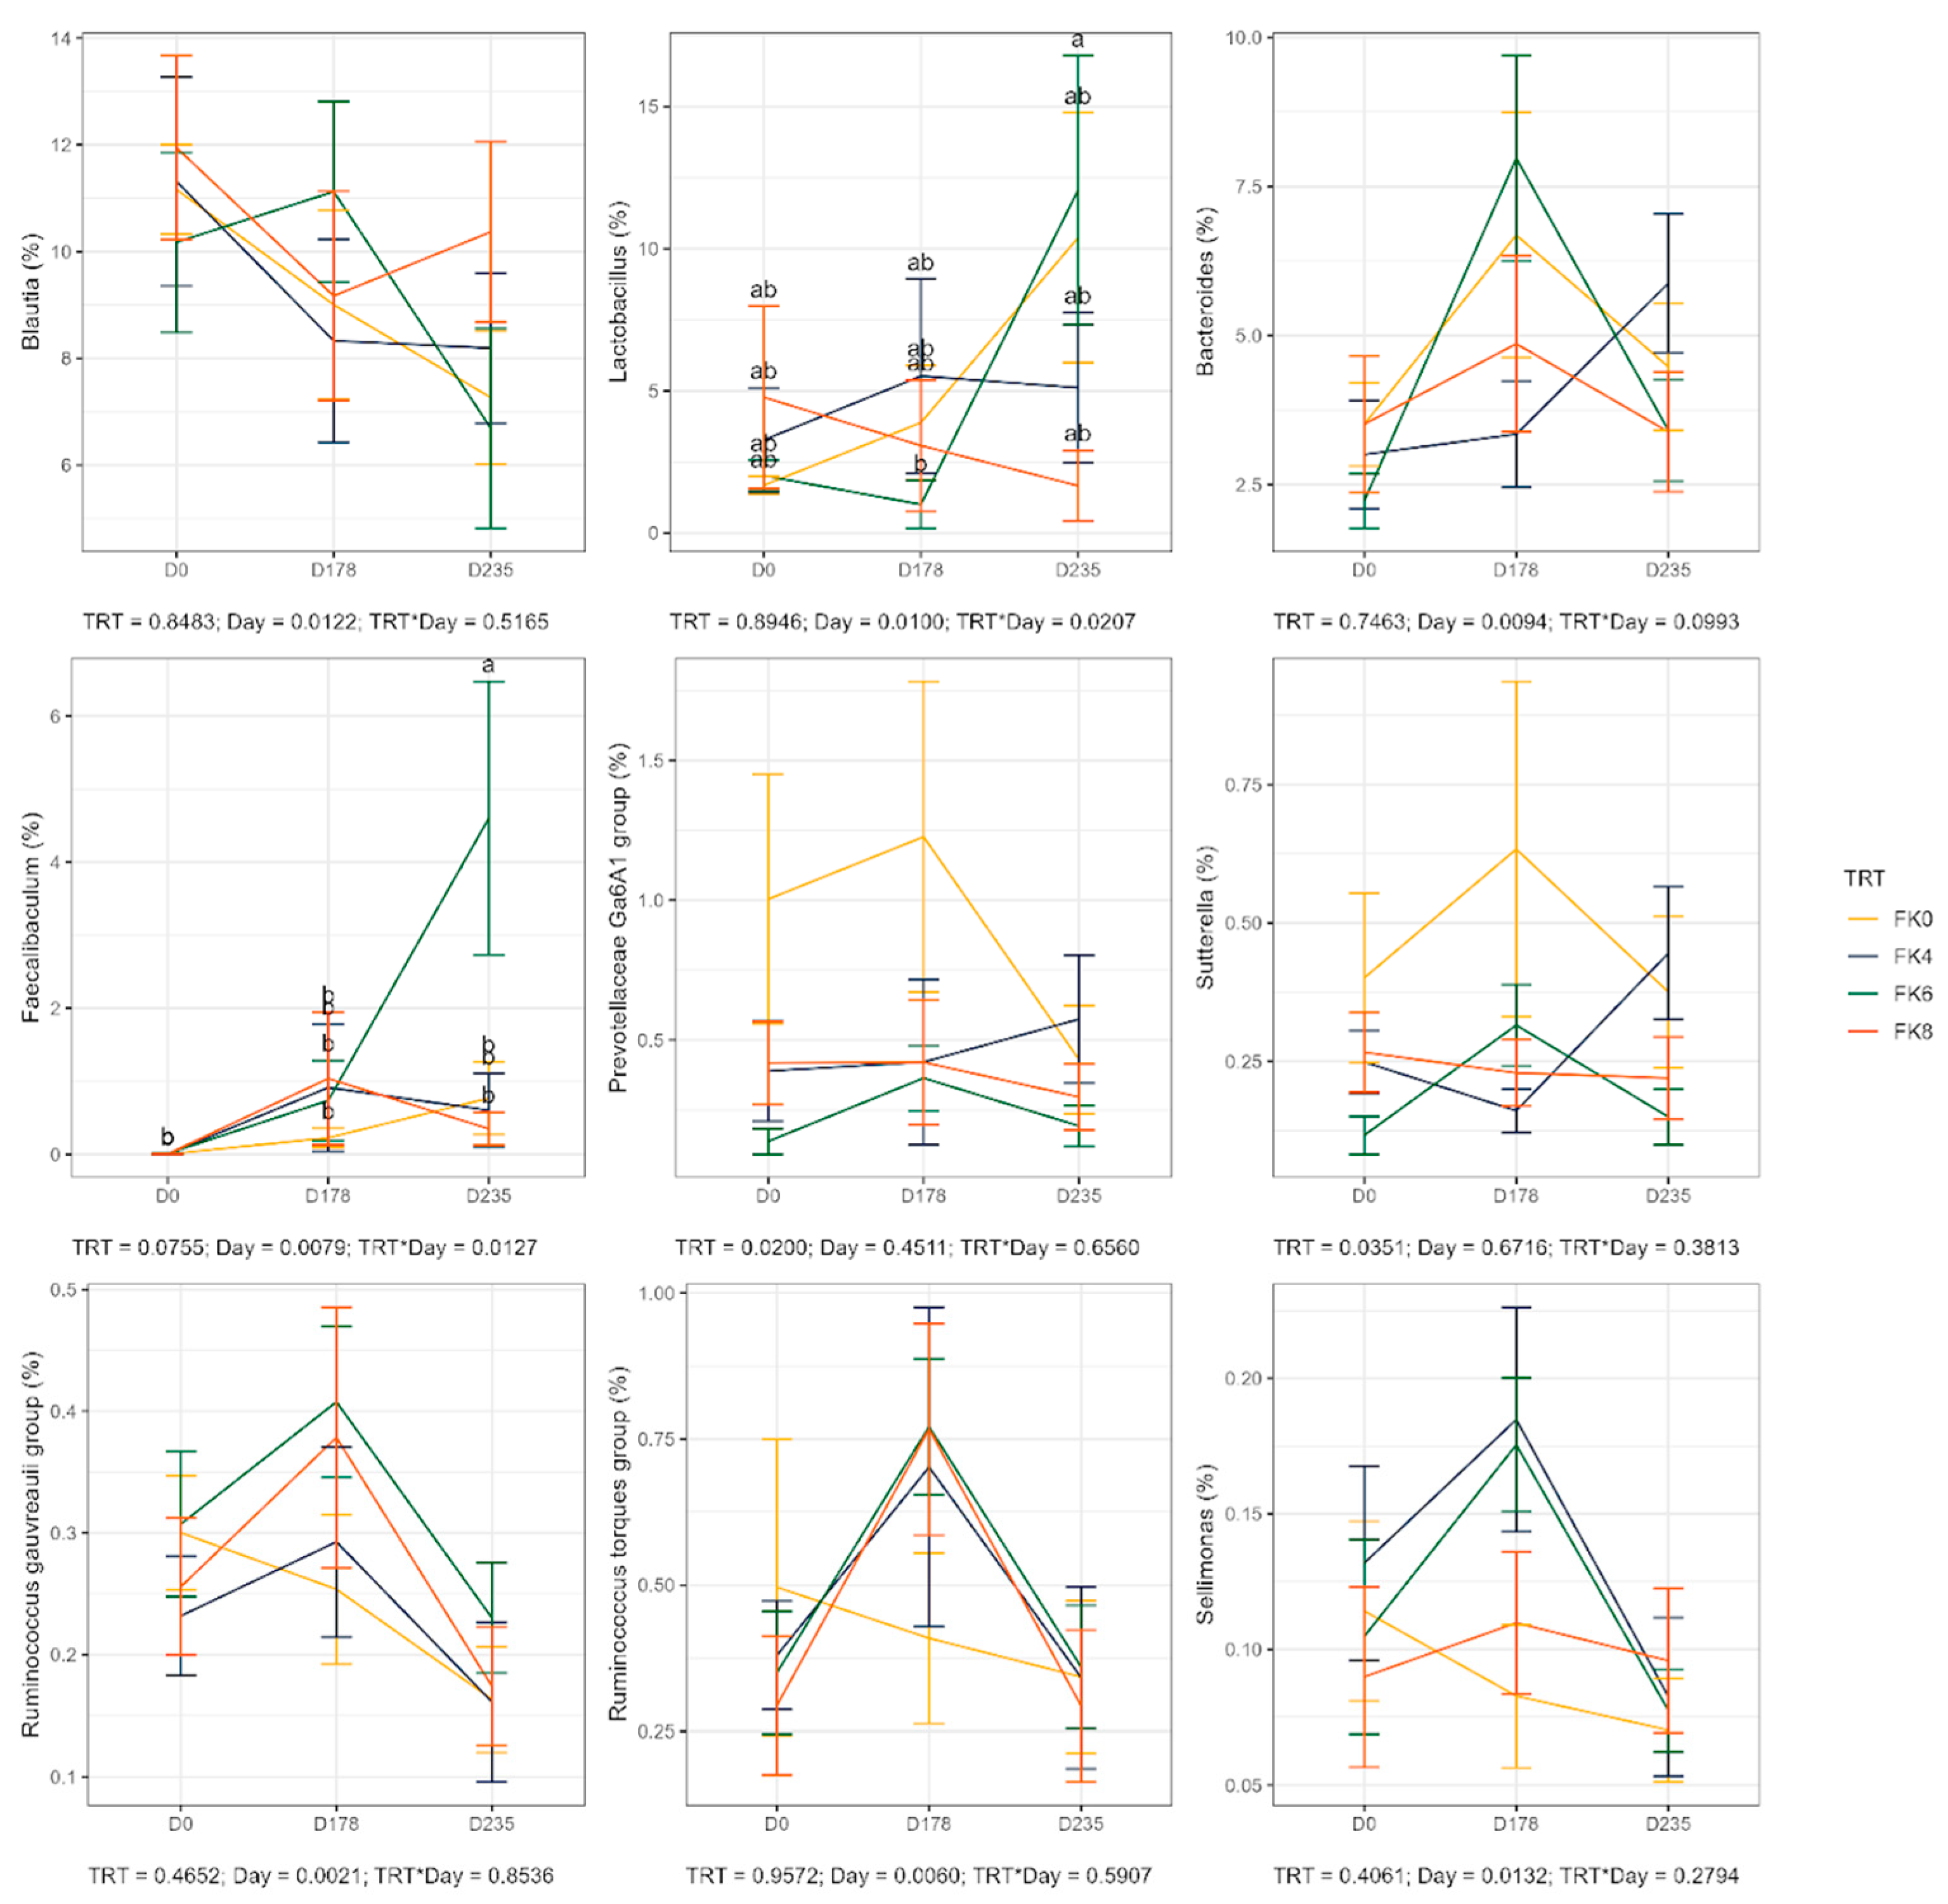

Table 1.
Proximate composition of FeedKind Pet® cultured protein meal (% DM).
| Crude Protein | 74.68 |
| Ash | 7.17 |
| Fat | 8.48 |
| Crude Fibre | 0.03 |
| Alanine | 4.27 |
| Arginine | 3.89 |
| Aspartic acid | 5.21 |
| Glutamic acid | 6.51 |
| Glycine | 3.06 |
| Histidine | 1.34 |
| Isoleucine | 2.65 |
| Leucine | 4.61 |
| Lysine | 3.41 |
| Phenylalanine | 2.49 |
| Proline | 2.49 |
| Serine | 2.07 |
| Threonine | 2.62 |
| Tyrosine | 1.60 |
| Valine | 3.46 |
| Tryptophan | 0.77 |
| Methionine | 1.61 |
| Cystine | 0.37 |
| Copper (mg/kg) | 83.67 |
Table 2.
Ingredient formulation of experimental diets as % of DM.
| Diet | ||||
| Ingredient Name | FK0 | FK4 | FK6 | FK8 |
| FeedKind | 0 | 4 | 6 | 8 |
| Ground Corn | 24.749 | 28.734 | 29.509 | 29.465 |
| Soybean Meal | 15.750 | 9.354 | 10.113 | 7.052 |
| Chicken Meal | 9.354 | 9.448 | 10.214 | 10.924 |
| Corn Gluten Meal | 9.354 | 9.262 | 6.000 | 5.000 |
| Chicken Fat | 7.671 | 7.247 | 7.091 | 7.052 |
| Wheat Midds | 7.671 | 7.247 | 7.091 | 7.052 |
| Ground Wheat | 7.671 | 7.247 | 6.324 | 7.052 |
| Dicalcium Phosphate | 3.777 | 3.602 | 3.436 | 3.524 |
| Beet Pulp | 3.200 | 2.974 | 3.465 | 4.000 |
| Liquid Natural Flavor | 3.000 | 3.000 | 3.000 | 3.000 |
| Dry Natural Flavor | 2.000 | 2.000 | 2.000 | 2.000 |
| Blood Meal | 1.000 | 1.000 | 1.000 | 1.000 |
| Wheat Germ Meal | 1.000 | 1.500 | 1.000 | 1.500 |
| Fish Oil | 0.652 | 0.649 | 0.635 | 0.482 |
| Brewer's Dried Yeast | 0.635 | 0.397 | 0.200 | 0.200 |
| Salt | 0.610 | 0.572 | 0.538 | 0.515 |
| Dried Whey | 0.500 | 0.200 | 0.500 | 0.500 |
| L-Threonine | 0.301 | 0.322 | 0.311 | 0.323 |
| Choline Chloride 60% | 0.228 | 0.216 | 0.202 | 0.153 |
| Potassium Chloride | 0.222 | 0.371 | 0.716 | 0.552 |
| Calcium Carbonate | 0.200 | 0.200 | 0.200 | 0.200 |
| Vitamins Premix | 0.189 | 0.189 | 0.189 | 0.189 |
| Minerals Premix | 0.155 | 0.158 | 0.156 | 0.155 |
| Mixed Tocopherols | 0.096 | 0.096 | 0.096 | 0.097 |
| BHA + BHT | 0.015 | 0.015 | 0.015 | 0.015 |
| Total value | 100.000 | 100.000 | 100.000 | 100.000 |
| Protein | 28.35 | 28.91 | 29.39 | 30.4 |
| Crude Fat | 13.09 | 13.85 | 13 | 12.4 |
| Crude Fiber | 2.9 | 3.11 | 2.9 | 2.78 |
| Ash | 7.14 | 7.57 | 8.29 | 8.08 |
Table 3.
Proximate analysis of experimental diets, 20 months after production (as is values).
| Feed component | Units | FK0 | FK4 | FK6 | FK8 | Minimum requirements1 |
| Moisture | % | 7.28 | 7.50 | 8.21 | 8.24 | - |
| Dry Matter | % | 92.72 | 92.50 | 91.79 | 91.76 | - |
| Crude Protein | % | 25.8 | 27.4 | 28.3 | 27.9 | 22.5 |
| Fat (acid hydrolysis) | % | 13.9 | 11.0 | 11.6 | 10.4 | 8.5 |
| Crude Fiber | % | 4.02 | 4.77 | 3.42 | 2.98 | - |
| Ash | % | 6.32 | 6.88 | 7.41 | 7.34 | - |
| Total Sulfur | % | 0.33 | 0.36 | 0.37 | 0.37 | - |
| Phosphorus (total) | % | 1.20 | 1.31 | 1.37 | 1.38 | 1.00 |
| Potassium (total) | % | 0.95 | 0.99 | 1.13 | 1.02 | 0.6 |
| Magnesium (total) | % | 0.16 | 0.17 | 0.19 | 0.20 | 0.06 |
| Calcium (total) | % | 1.16 | 1.38 | 1.45 | 1.36 | 1.2 |
| Sodium (total) | % | 0.34 | 0.40 | 0.40 | 0.38 | 0.30 |
| Iron (total) | ppm | 324 | 384 | 356 | 356 | 88 |
| Manganese (total) | ppm | 53.0 | 56.0 | 55.7 | 63.8 | 7.2 |
| Copper (total) | ppm | 24.4 | 28.0 | 27.1 | 30.8 | 12.4 |
| Zinc (total) | ppm | 149 | 148 | 130 | 157 | 100 |
| Aspartic acid | % | 2.44 | 2.57 | 2.40 | 2.26 | |
| Threonine | % | 1.11 | 1.19 | 1.18 | 1.19 | 1.04 |
| Serine | % | 1.23 | 1.30 | 1.20 | 1.18 | |
| Glutamic acid | % | 4.90 | 4.86 | 4.62 | 4.20 | |
| Proline | % | 1.81 | 1.76 | 1.75 | 1.43 | |
| Glycine | % | 1.92 | 1.89 | 1.79 | 1.64 | |
| Alanine | % | 1.88 | 1.98 | 1.89 | 1.84 | |
| Cystine | % | 0.34 | 0.32 | 0.42 | 0.31 | |
| Valine | % | 1.00 | 1.01 | 1.04 | 0.86 | 0.68 |
| Methionine | % | 0.43 | 0.45 | 0.50 | 0.50 | 0.35 |
| Isoleucine | % | 0.74 | 0.76 | 0.77 | 0.65 | 0.71 |
| Leucine | % | 1.70 | 2.16 | 2.07 | 2.20 | 1.29 |
| Tyrosine | % | 0.82 | 0.89 | 0.86 | 0.77 | |
| Phenylalanine | % | 1.06 | 1.10 | 1.09 | 1.11 | 0.83 |
| Lysine (total) | % | 1.09 | 1.14 | 1.32 | 1.11 | 0.90 |
| Histidine | % | 0.59 | 0.62 | 0.61 | 0.56 | 0.44 |
| Arginine | % | 1.00 | 0.94 | 1.00 | 1.42 | 1.00 |
| Tryptophan | % | 0.23 | 0.26 | 0.27 | 0.28 | 0.20 |
| Saturated fat (total) | g/100g | 4.28 | 3.41 | 3.63 | 3.28 | |
| Polyunsaturated fats (total) | g/100g | 3.25 | 2.62 | 2.75 | 2.45 | |
| Monounsaturated fats (total) | g/100g | 6.33 | 4.94 | 5.18 | 4.64 | |
| Trans fatty acids (total) | g/100g | 0.04 | 0.03 | 0.04 | 0.03 | |
| Omega 3 fatty acids (total) | g/100g | 0.22 | 0.19 | 0.22 | 0.18 | |
| Omega 6 fatty acids (total) | g/100g | 3.00 | 2.40 | 2.51 | 2.24 | |
| Omega 9 fatty acids (total) | g/100g | 5.39 | 4.19 | 4.38 | 3.92 | |
| Pantothenic acid (Vitamin B5) | mg/kg | 39.8 | 45.9 | 57.6 | 61.4 | 12 |
| Riboflavin (Vitamin B2) | mg/kg | 5.26 | 5.94 | 6.77 | 6.72 | 5.2 |
1Based on adult dog growth and reproduction minima according to AAFCO [60].
Table 4.
Analyzed chemical and energy composition of the diet fed to dogs; data calculated for digestibility component.
Table 4.
Analyzed chemical and energy composition of the diet fed to dogs; data calculated for digestibility component.
| Item | FK0 | FK4 | FK6 | FK8 |
| Dry matter, % | 93.87 | 93.83 | 93.16 | 92.92 |
| ---- Dry matter basis ---- | ||||
| Organic matter | 93.16 | 91.97 | 91.52 | 91.69 |
| Ash | 6.84 | 8.03 | 8.48 | 8.31 |
| Crude protein | 26.26 | 28.67 | 29.74 | 29.68 |
| Acid-hydrolyzed fat | 12.82 | 11.97 | 12.41 | 12.39 |
| Total dietary fiber | 16.04 | 16.62 | 15.98 | 16.27 |
| Insoluble fiber | 11.7 | 12.24 | 11.91 | 12.06 |
| Soluble fiber | 4.35 | 4.38 | 4.06 | 4.21 |
| Gross energy, kcal/g | 4.92 | 4.83 | 4.88 | 4.89 |
Table 5.
Mean weight, weight gain rate and feed conversion ratios (FCR) of adult beagles fed diets containing 0% (FK), 4% (FK4), 6% (FK6) or 8% (FK8) FeedKind.
Table 5.
Mean weight, weight gain rate and feed conversion ratios (FCR) of adult beagles fed diets containing 0% (FK), 4% (FK4), 6% (FK6) or 8% (FK8) FeedKind.
| FK0 | FK4 | FK6 | FK8 | P | |
| Mean initial weight (kg) (day 0) | 7.44 ± 1.372 | 7.7 ± 1.11 | 8.1 ± 1.24 | 8.24 ± 1.31 | 0.567 |
| Mean final weight (kg) (day 175) | 7.98 ± 1.61 | 8.10 ± 1.44 | 8.36 ± 1.49 | 8.27 ± 1.54 | 0.95 |
| Mean final weight (kg) (day 239) | 8.00 ± 1.62 | 8.23 ±1.49 | 8.60 ± 1.51 | 8.66 ± 1.45 | 0.789 |
| Weight gain (%) (day 0 to 180) | 7.23 | 4.85 | 3.24 | 0.35 | - |
| FCR (day 0 to 180) | 58.46 | 87.39 | 131.25 | 1238.66 | |
| Weight gain (%) (day 180 to 239) | 0.16 | 0.77 | 2.08 | 4.30 | - |
| FCR (day 181 to day 239) | 776.81 | 163.33 | 63.37 | 32.23 | |
| Weight gain (%) (day 0 to 239) | 7.56 | 6.47 | 6.17 | 5.03 | - |
| FCR (day 0 to day 239) | 73.13 | 85.96 | 91.08 | 113.22 |
Table 6.
Hematology values (mean ± standard deviation) from dogs fed diets containing 0% (FK0, 4% (FK4), 6% (FK6) or 8% (FK8) FeedKind Pet for 6 months, followed by 2 months on diets containing 0% (FK0) FeedKind Pet. Data shown for days 0, 169 and 232 to represent the samples taken at the end of each phase. Figures in bold represent values outside the normal range for these dogs.
| Day | Reference range | FK0 | FK4 | FK6 | FK8 |
| Red Blood Cell Count (106/uL) | |||||
| Day -7 | 5.64-7.98 | 6.831 ± 0.3171 | 6.828 ± 0.5255 | 6.929 ± 0.2923 | 7.051 ± 0.4330 |
| Day 169 | 6.980 ± 0.5423 | 7.036 ± 0.4564 | 6.808 ± 0.4563 | 6.803 ± 0.3138 | |
| Day 232 | 6.679 ± 0.4660 | 6.734 ± 0.6398 | 6.904 ± 0.5460 | 6.936 ± 0.5195 | |
| Hemoglobin (g/dL) | |||||
| Day -7 | 13.2-18.3 | 15.90 ± 0.784 | 15.64 ± 1.089 | 16.25 ± 0.767 | 16.24 ± 1.021 |
| Day 169 | 16.43 ± 1.236 | 16.46 ± 1.195 | 16.16 ± 1.072 | 15.66 ± 0.550 | |
| Day 232 | 15.84 ± 1.097 | 15.78 ± 1.655 | 16.38 ± 1.319 | 16.11 ± 1.122 | |
| Hemocrit (%) | |||||
| Day -7 | 39.8-55.5 | 46.18 ± 2.271 | 45.59 ± 2.966 | 47.05 ± 2.181 | 47.01 ± 2.718 |
| Day 169 | 49.54 ± 3.398 | 50.40 ± 3.806 | 48.98 ± 3.184 | 47.70 ± 1.654 | |
| Day 232 | 47.33 ± 3.157 | 47.43 ± 4.756 | 49.24 ± 3.363 | 48.66 ± 3.123 | |
| Mean Corpuscular Volume (fL) | |||||
| Day -7 | 65.4-74.2 | 67.61 ± 2.325 | 66.80 ± 2.191 | 67.90 ± 1.058 | 66.66 ± 1.686 |
| Day 169 | 71.09 ± 2.653 | 71.64 ± 2.571 | 71.96 ± 1.085 | 70.16 ± 1.969 | |
| Day 232 | 70.88 ± 2.575 | 70.40 ± 2.424 | 71.39 ± 1.118 | 70.21 ± 2.097 | |
| Mean Corpuscular Hemoglobin (pg) | |||||
| Day -7 | 21.6-24.6 | 23.31 ± 0.872 | 22.94 ± 0.905 | 23.42 ± 0.311 | 23.07 ± 0.687 |
| Day 169 | 23.54 ± 0.865 | 23.40 ± 0.812 | 23.76 ± 0.437 | 23.01 ± 0.863 | |
| Day 232 | 23.71 ± 1.025 | 23.40 ± 0.741 | 23.71 ± 0.419 | 23.26 ± 0.812 | |
| Mean Corpuscular Hemoglobin Concentration (g/dL) | |||||
| Day -7 | 31.9-34.5 | 34.49 ± 0.203 | 34.34 ± 0.510 | 34.54 ± 0.354 | 34.59 ± 0.302 |
| Day 169 | 33.14 ± 0.366 | 32.71 ± 0.409 | 33.01 ± 0.300 | 32.81 ± 0.481 | |
| Day 232 | 33.48 ± 0.341 | 33.26 ± 0.288 | 33.25 ± 0.563 | 33.11 ± 0.353 | |
| Red Blood Cell Distribution Width (%) | |||||
| Day -7 | 11.3-13.5 | 11.93 ± 0.369 | 12.06 ± 0.245 | 12.29 ± 0.327 | 11.96 ± 0.331 |
| Day 169 | 12.43 ± 0.358 | 12.56 ± 0.346 | 12.90 ± 0.644 | 12.69 ± 0.422 | |
| Day 232 | 12.39 ± 0.519 | 12.11 ± 0.416 | 12.59 ± 0.506 | 12.31 ± 0.453 | |
| Platelet Count (103/uL) | |||||
| Day -7 | 154-427 | 273.4 ± 31.75 | 269.9 ± 52.72 | 259.5 ± 50.61 | 276.4 ± 39.64 |
| Day 169 | 293.6 ± 36.62 | 310.8 ± 50.32 | 330.4 ± 96.13 | 317.3 ± 43.33 | |
| Day 232 | 308.6 ± 51.90 | 294.3 ± 55.11 | 283.8 ± 62.97 | 327.3 ± 43.23 | |
| MPV (fL) | |||||
| Day -7 | 7.9-16.2 | 11.23 ± 1.557 | 10.78 ± 1.237 | 11.05 ± 1.232 | 10.29 ± 0.758 |
| Day 169 | 11.98 ± 1.929 | 11.69 ± 2.209 | 12.34 ± 1.793 | 11.40 ± 1.349 | |
| Day 232 | 13.55 ± 1.535 | 13.13 ± 1.229 | 13.20 ± 1.605 | 12.87 ± 1.447 | |
| Reticulocytes (109/L) | |||||
| Day -7 | 9.1-87.5 | 33.14 ± 5.901 | 32.43 ± 9.512 | 37.61 ± 9.101 | 38.57 ± 12.448 |
| Day 169 | 31.35 ± 10.117 | 51.54 ± 19.799 | 57.74 ± 20.995 | 60.74 ± 38.094 | |
| Day 232 | 32.11 ± 7.260 | 35.90 ± 11.705 | 58.93 ± 26.505 | 59.31 ± 20.025 | |
| White Blood Cell Count (103/uL) | |||||
| Day -7 | 5.59-13.33 | 8.503 ± 1.496 | 8.066 ± 1.113 | 8.544 ± 1.164 | 8.696 ± 1.260 |
| Day 169 | 8.875 ± 1.098 | 10.829 ± 4.318 | 11.934 ± 4.146 | 12.973 ± 2.929 | |
| Day 232 | 9.414 ± 1.477 | 10.221 ± 1.656 | 10.080 ± 2.017 | 10.171 ± 0.756 | |
| Neutrophils (103/uL) | |||||
| Day -7 | 3.02-9.19 | 4.844 ± 0.9667 | 4.683 ± 0.6899 | 4.810 ± 0.8069 | 5.286 ± 0.7566 |
| Day 169 | 5.504 ± 0.9185 | 7.365 ± 3.8040 | 8.228 ± 3.4552 | 8.967 ± 1.9673 | |
| Day 232 | 5.840 ± 1.1491 | 6.505 ± 1.2514 | 6.096 ± 1.5059 | 6.566 ± 0.6471 | |
| Lymphocytes (103/uL) | |||||
| Day -7 | 1.49-4.08 | 2.706 ± 0.6820 | 2.523 ± 0.4754 | 2.668 ± 0.2471 | 2.797 ± 0.6111 |
| Day 169 | 2.453 ± 0.4245 | 2.423 ± 0.4086 | 2.635 ± 0.4800 | 2.774 ± 0.6780 | |
| Day 232 | 2.599 ± 0.4197 | 2.739 ± 0.3705 | 2.870 ± 0.4396 | 2.606 ± 0.3425 | |
| Monocytes (103/uL) | |||||
| Day -7 | 0.2-0.87 | 0.318 ± 0.0785 | 0.369 ± 0.0815 | 0.420 ± 0.1042 | 0.460 ± 0.1393 |
| Day 169 | 0.325 ± 0.0697 | 0.571 ± 0.4234 | 0.639 ± 0.3245 | 0.733 ± 0.2381 | |
| Day 232 | 0.430 ± 0.1836 | 0.449 ± 0.0620 | 0.520 ± 0.1343 | 0.487 ± 0.0711 | |
| Eosinophil (103/uL) | |||||
| Day -7 | 0.08-0.74 | 0.515 ± 0.2244 | 0.403 ± 0.2149 | 0.545 ± 0.3349 | 0.310 ± 0.1363 |
| Day 169 | 0.394 ± 0.1205 | 0.393 ± 0.2622 | 0.331 ± 0.1132 | 0.384 ± 0.4347 | |
| Day 232 | 0.464 ± 0.2391 | 0.445 ± 0.2478 | 0.498 ± 0.3409 | 0.419 ± 0.2168 | |
| Basophils (103/uL) | |||||
| Day -7 | 0.02-0.15 | 0.064 ± 0.0239 | 0.043 ± 0.0219 | 0.049 ± 0.0125 | 0.056 ± 0.0299 |
| Day 169 | 0.054 ± 0.0239 | 0.045 ± 0.0220 | 0.048 ± 0.0158 | 0.057 ± 0.0138 | |
| Day 232 | 0.054 ± 0.0130 | 0.053 ± 0.0271 | 0.059 ± 0.0181 | 0.064 ± 0.0382 | |
| Large Unstained Cells (103/uL) | |||||
| Day -7 | 0.01-0.1 | 0.058 ± 0.0139 | 0.049 ± 0.0309 | 0.053 ± 0.0167 | 0.053 ± 0.0281 |
| Day 169 | 0.035 ± 0.0160 | 0.033 ± 0.0219 | 0.051 ± 0.0336 | 0.059 ± 0.0363 | |
| Day 232 | 0.026 ± 0.0092 | 0.030 ± 0.0160 | 0.039 ± 0.0223 | 0.036 ± 0.0151 | |
Table 7.
Coagulation values (mean ± standard deviation) from dogs fed diets containing 0% (FK0, 4% (FK4), 6% (FK6) or 8% (FK8) FeedKind Pet for 6 months, followed by 2 months on diets containing 0% (FK0) FeedKind Pet. Data shown for days 0, 169 and 232 to represent the samples taken at the end of each phase. No values were outside the normal range for these dogs at these there time points.
| Days | Reference range | FK0 | FK4 | FK6 | FK8 |
| Activated Partial Thromboplastin Time (sec) | |||||
| Day -7 | 9.8-13.8 | 12.49 ± 0.409 | 12.36 ± 0.717 | 12.68 ± 0.406 | 12.54 ± 0.556 |
| Day 169 | 12.18 ± 0.459 | 12.05 ± 0.798 | 12.28 ± 0.471 | 12.21 ± 0.363 | |
| Day 232 | 12.19 ± 0.380 | 12.01 ± 0.596 | 12.40 ± 0.421 | 12.40 ± 0.370 | |
| Fibrinogen (mg/dL) | |||||
| Day -7 | 144-305 | 164.6 ± 14.09 | 185.4 ± 42.73 | 191.0 ± 26.15 | 184.4 ± 39.31 |
| Day 169 | 188.0 ± 44.15 | 206.4 ± 55.32 | 249.0 ± 64.00 | 241.4 ± 54.52 | |
| Day 232 | 184.6 ± 27.76 | 226.8 ± 47.20 | 222.3 ± 34.82 | 221.4 ± 68.19 | |
| Prothrombin Time (sec) | |||||
| Day -7 | 7.0-8.8 | 8.16 ± 0.262 | 8.00 ± 0.256 | 7.88 ± 0.175 | 8.29 ± 0.219 |
| Day 169 | 7.98 ± 0.341 | 7.93 ± 0.191 | 7.75 ± 0.330 | 8.13 ± 0.287 | |
| Day 232 | 8.10 ± 0.302 | 7.83 ± 0.276 | 7.80 ± 0.193 | 8.21 ± 0.261 | |
Table 8.
Clinical chemistry values (mean ± standard deviation) from dogs fed diets containing 0% (FK0, 4% (FK4), 6% (FK6) or 8% (FK8) FeedKind Pet for 6 months, followed by 2 months on diets containing 0% (FK0) FeedKind Pet. Data shown for days 0, 169 and 232 to represent the samples taken at the end of each phase. Figures in bold represent values outside the normal range for these dogs.
| Days | Reference range | FK0 | FK4 | FK6 | FK8 |
| Albumin / Globulin Ratio | |||||
| Day -7 | 1.1-1.9 | 1.61 ± 0.146 | 1.54 ± 0.233 | 1.73 ± 0.413 | 1.56 ± 0.113 |
| Day 169 | 1.39 ± 0.146 | 1.33 ± 0.301 | 1.30 ± 0.169 | 1.17 ± 0.180 | |
| Day 232 | 1.29 ± 0.125 | 1.19 ± 0.189 | 1.24 ± 0.151 | 1.13 ± 0.138 | |
| Albumin (g/dL) | |||||
| Day -7 | 2.9-3.6 | 3.30 ± 0.251 | 3.34 ± 0.141 | 3.31 ± 0.181 | 3.36 ± 0.113 |
| Day 169 | 3.25 ± 0.227 | 3.29 ± 0.230 | 3.23 ± 0.149 | 3.21 ± 0.195 | |
| Day 232 | 3.05 ± 0.169 | 3.04 ± 0.192 | 3.09 ± 0.155 | 3.07 ± 0.198 | |
| Alkaline Phosphatase (U/L) | |||||
| Day - 7 | 22-126 | 55.1 ± 15.48 | 62.0 ± 22.13 | 56.3 ± 13.44 | 57.6 ± 12.12 |
| Day 169 | 60.0 ± 26.34 | 59.6 ± 25.04 | 56.0 ± 12.02 | 66.7 ± 21.91 | |
| Day 232 | 53.4 ± 16.93 | 59.5 ± 26.06 | 54.3 ± 14.74 | 60.9 ± 17.85 | |
| Alanine Transferase (U/L) | |||||
| Day -7 | 19-59 | 31.8 ± 7.48 | 29.0 ± 2.62 | 30.9 ± 6.69 | 32.6 ± 3.60 |
| Day 169 | 33 ± 6.82 | 33.0 ± 6.02 | 34.8 ± 6.71 | 39.3 ± 19.09 | |
| Day 232 | 30.3 ± 10.08 | 27.8 ± 4.68 | 29.0 ± 4.60 | 30.4 ± 7.48 | |
| Aspartate Aminotransferase (U/L) | |||||
| Day -7 | 20-47 | 30.0 ± 3.7 | 31.0 ± 5.10 | 33.1 ± 5.51 | 32.4 ± 6.11 |
| Day 169 | 31.4 ± 7.42 | 35.1 ± 4.36 | 36.1 ± 11.58 | 37.1 ± 12.06 | |
| Day 232 | 29.6 ± 4.21 | 31.4 ± 2.26 | 35.1 ± 4.76 | 34.0 ± 6.81 | |
| Bile acids (umol/L) | |||||
| Day -7 | No reference range | 0.54 ± 0.346 | 0.63 ± 0.568 | 0.66 ± 0.424 | 1.56 ± 1.693 |
| Day 169 | 0.83 ± 0.623 | 4.31 ± 8.017 | 3.05 ± 4.407 | 2.13 ± 2.336 | |
| Day 232 | 2.01 ± 1.132 | 4.15 ± 8.765 | 5.61 ± 9.888 | 1.16 ± 0.787 | |
| Calcium (mg/dL) | |||||
| Day -7 | 9.4-11.0 | 10.06 ± 0.267 | 10.05 ± 0.177 | 9.93 ± 0.219 | 10.14 ± 0.251 |
| Day 169 | 9.94 ± 0.160 | 10.14 ± 0.389 | 9.99 ± 0.304 | 9.94 ± 0.282 | |
| Day 232 | 9.58 ± 0.183 | 9.74 ± 0.374 | 9.83 ± 0.271 | 9.71 ± 0.273 | |
| Cholesterol (mg/dL) | |||||
| Day -7 | 104-252 | 159.4 ± 44.78 | 163.9 ± 17.68 | 171.0 ± 46.50 | 154.7 ± 25.17 |
| Day 169 | 163.5 ± 35.61 | 149.9 ± 28.01 | 158.8 ± 35.79 | 153.9 ± 27.72 | |
| Day 232 | 181.8 ± 47.98 | 161.1 ± 17.33 | 182.8 ± 46.60 | 168.6 ± 52.18 | |
| Creatine Kinase (U/L) | |||||
| Day -7 | 81-458 | 180.9 ± 48.92 | 162.0 ± 34.14 | 209.9 ± 63.31 | 201.6 ± 81.39 |
| Day 169 | 181.0 ± 127.65 | 156.0 ± 57.03 | 182.6 ± 173.33 | 183.0 ± 93.04 | |
| Day 232 | 159.6 ± 45.06 | 163.9 ± 53.91 | 227.0 ± 103.84 | 207.1 ± 98.05 | |
| Chloride (mEq/L) | |||||
| Day -7 | 109-117 | 115.0 ± 1.20 | 115.0 ± 1.60 | 114.9 ± 1.46 | 115.3 ± 1.38 |
| Day 169 | 114.5 ± 1.77 | 115.0 ± 1.31 | 114.1 ± 2.03 | 114.3 ± 1.98 | |
| Day 232 | 115.5 ± 1.60 | 116.4 ± 1.41 | 115.5 ± 1.85 | 116.1 ± 1.57 | |
| Bicarbonate (mEq/L) | |||||
| Day -7 | No reference range | 23.9 ± 3.91 | 22.4 ± 3.66 | 21.6 ± 2.20 | 22.0 ± 2.83 |
| Day 169 | 22.0 ± 2.07 | 20.4 ± 1.77 | 21.6 ± 1.85 | 22.4 ± 4.28 | |
| Day 232 | 22.0 ± 1.07 | 21.6 ± 2.33 | 20.4 ± 2.13 | 20.6 ± 2.57 | |
| Creatinine (mg/dL) | |||||
| Day -7 | 0.4-0.8 | 0.58 ± 0.0171 | 0.63 ± 0.071 | 0.60 ± 0.076 | 0.63 ± 0.076 |
| Day 169 | 0.61 ± 0.064 | 0.66 ± 0.130 | 0.61 ± 0.136 | 0.59 ± 0.069 | |
| Day 232 | 0.61 ± 0.064 | 0.66 ± 0.092 | 0.63 ± 0.089 | 0.61 ± 0.069 | |
| Gamma Glutamyl Transferase (U/L) | |||||
| Day -7 | 0.0-4.0 | 0.0 ± 0.0 | 0.0 ± 0.0 | 0.0 ± 0.0 | 0.0 ± 0.0 |
| Day 169 | 0.0 ± 0.0 | 0.0 ± 0.0 | 0.0 ± 0.0 | 0.0 ± 0.0 | |
| Day 232 | 0.0 ± 0.0 | 0.0 ± 0.0 | 0.0 ± 0.0 | 0.0 ± 0.0 | |
| Globulin (g/dL) | |||||
| Day -7 | 1.7-2.9 | 2.06 ± 0.213 | 2.20 ± 0.245 | 2.00 ± 0.298 | 2.20 ± 0.191 |
| Day 169 | 2.36 ± 0.262 | 2.56 ± 0.472 | 2.54 ± 0.288 | 2.77 ± 0.315 | |
| Day 232 | 2.40 ± 0.200 | 2.58 ± 0.358 | 2.51 ± 0.189 | 2.70 ± 0.231 | |
| Glucose (mg/dL) | |||||
| Day -7 | 67-101 | 88.1 ± 9.51 | 87.8 ± 5.55 | 87.6 ± 8.00 | 86.7 ± 6.60 |
| Day 169 | 90.8 ± 8.41 | 83.0 ± 7.13 | 80.5 ± 6.35 | 80.0 ± 9.24 | |
| Day 232 | 89.3 ± 8.31 | 86.3 ± 7.54 | 83.3 ± 7.11 | 85.6 ± 5.77 | |
| Potassium (mEq/L) | |||||
| Day -7 | 4.0-4.9 | 4.34 ± 0.169 | 4.26 ± 0.185 | 4.30 ± 0.200 | 4.37 ± 0.256 |
| Day 169 | 4.31 ± 0.210 | 4.36 ± 0.192 | 4.40 ± 0.227 | 4.30 ± 0.265 | |
| Day 232 | 4.29 ± 0.146 | 4.35 ± 0.298 | 4.53 ± 0.198 | 4.60 ± 0.283 | |
| Lactate Dehydrogenase (U/L) | |||||
| Day -7 | 40-303 | 171.5 ± 67.00 | 139.8 ± 77.57 | 220.5 ± 91.60 | 168.0 ± 100.07 |
| Day 169 | 169.6 ± 152.13 | 134.5 ± 86.27 | 199.5 ± 268.72 | 155.7 ± 145.04 | |
| Day 232 | 141.0 ± 82.99 | 111.8 ± 51.84 | 218.5 ± 130.12 | 152.6 ± 60.87 | |
| Sodium (mEq/L) | |||||
| Day -7 | 144-150 | 147.3 ± 0.46 | 147.3 ± 1.04 | 146.4 ± 0.74 | 147.7 ± 0.95 |
| Day 169 | 146.3 ± 1.49 | 146.0 ± 1.07 | 145.8 ± 2.31 | 146.0 ± 1.29 | |
| Day 232 | 146.8 ± 1.49 | 146.9 ± 1.13 | 146.4 ± 1.30 | 146.6 ± 0.49 | |
| Phosphorus (mg/dL) | |||||
| Day -7 | 3.2-5.4 | 4.01 ± 0.270 | 4.13 ± 0.337 | 3.80 ± 0.342 | 4.06 ± 0.310 |
| Day 169 | 3.01 ± 0.236 | 3.34 ± 0.220 | 3.14 ± 0.307 | 3.04 ± 0.565 | |
| Day 232 | 2.85 ± 0.283 | 2.90 ± 0.389 | 3.18 ± 0.474 | 2.96 ± 0.336 | |
| Total Bilirubin (mg/dL) | |||||
| Day -7 | 0.0-0.1 | 0.016 ± 0.0119 | 0.014 ± 0.0106 | 0.011 ± 0.0173 | 0.017 ± 0.0150 |
| Day 169 | 0.030 ± 0.0185 | 0.021 ± 0.0155 | 0.018 ± 0.0167 | 0.013 ± 0.0111 | |
| Day 232 | 0.029 ± 0.0196 | 0.018 ± 0.0231 | 0.015 ± 0.0141 | 0.017 ± 0.0150 | |
| Total Protein (g/dL) | |||||
| Day -7 | 4.8-6.2 | 5.36 ± 0.385 | 5.54 ± 0.239 | 5.31 ± 0.280 | 5.56 ± 0.257 |
| Day 169 | 5.61 ± 0.432 | 5.85 ± 0.460 | 5.76 ± 0.226 | 5.99 ± 0.195 | |
| Day 232 | 5.45 ± 0.267 | 5.61 ± 0.376 | 5.60 ± 0.177 | 5.77 ± 0.304 | |
| Triglycerides (mg/dL) | |||||
| Day -7 | 19-65 | 26.9 ± 7.66 | 30.9 ± 5.49 | 34.6 ± 10.85 | 29.9 ± 8.05 |
| Day 169 | 29.6 ± 6.35 | 34.3 ± 4.06 | 36.4 ± 7.37 | 36.4 ± 7.35 | |
| Day 232 | 30.3 ± 5.23 | 35.0 ± 6.82 | 38.8 ± 5.28 | 36.3 ± 10.44 | |
| Urea Nitrogen (mg/dL) | |||||
| Day -7 | 10.0-24.0 | 13.0 ± 1.93 | 13.4 ± 1.69 | 13.1 ± 1.36 | 13.3 ± 1.70 |
| Day 169 | 12.0 ± 1.20 | 13.0 ± 2.93 | 13.6 ± 1.92 | 12.1 ± 1.35 | |
| Day 232 | 11.3 ± 1.04 | 11.6 ±1.77 | 11.6 ±1.06 | 11.6 ±1.81 | |
Table 9.
Urinalysis values (mean ± standard deviation) from dogs fed diets containing 0% (FK0, 4% (FK4), 6% (FK6) or 8% (FK8) FeedKind Pet for 6 months, followed by 2 months on diets containing 0% (FK0) FeedKind Pet. Data shown for days 0, 169 and 232 to represent the samples taken at the end of each phase. Figures in bold represent values outside the normal range for these dogs.
| Day | Reference range | FK0 | FK4 | FK6 | FK8 |
| Volume (mL) | |||||
| Day -7 | No reference range | 93.98 ± 66.272 | 86.45 ± 55.112 | 81.26 ± 31.135 | 125.14 ± 123.567 |
| Day 169 | 123.20 ± 101.446 | 99.53 ± 58.867 | 107.04 ± 64.784 | 166.40 ± 172.987 | |
| Day 232 | 91.85 ± 50.951 | 56.50 ± 48.977 | 89.23 ± 58.860 | 121.26 ± 78.126 | |
| Specific gravity | |||||
| Day -7 | 1.010-1.070 | 1.0480 ± 0.0201 | 1.0494 ± 0.0175 | 1.0489 ± 0.0102 | 1.0463 ± 0.0278 |
| Day 169 | 1.0396 ± 0.0205 | 1.0370 ± 0.0125 | 1.0366 ± 0.0101 | 1.0329 ± 0.0209 | |
| Day 232 | 1.0399 ± 0.0144 | 1.0451 ± 0.0113 | 1.0361 ± 0.0165 | 1.0333 ± 0.0166 | |
| pH | |||||
| Day -7 | 5.50-9.00 | 5.47 ± 0.1797 | 5.365 ± 0.1259 | 5.485 ± 0.4294 | 5.601 ± 0.5632 |
| Day 169 | 5.565 ± 0.3307 | 5.328 ± 0.1681 | 5.368 ± 0.1349 | 5.591 ± 0.4281 | |
| Day 232 | 5.426 ± 0.2026 | 5.260 ± 0.2089 | 5.311 ± 0.3629 | 5.309 ± 0.1586 | |
Table 10.
Apparent total tract macronutrient and energy digestibilities, food and energy intake, fecal output of dogs. Where FK0, FK4, FK6, FK8 = FeedKind inclusion levels, 0-8%; SEM = pooled standard error of the means, DM = Dry Matter, OM = Organic Matter. Superscript lower case letters reflect statistically similar values.
| Item | FK0 | FK4 | FK6 | FK8 | SEM1 | p-value |
| Food intake | ||||||
| g food/d, as-is | 169.00 | 179.32 | 191.23 | 197.34 | 7.45 | 0.0581 |
| g food/d, DM | 158.63 | 168.26 | 178.15 | 183.37 | 6.96 | 0.0865 |
| kcal/d, as-is | 781.25 | 813.12 | 870.25 | 897.43 | 34.10 | 0.0941 |
| Fecal output | ||||||
| g/d, as-is | 107.75 | 133.17 | 122.66 | 130.28 | 8.00 | 0.1302 |
| g/d, DM | 31.47b | 36.82ab | 35.40ab | 39.21a | 1.41 | 0.0060 |
| Digestibility, % | ||||||
| DM | 80.11 | 78.07 | 76.35 | 78.56 | 1.95 | 0.5893 |
| OM | 82.92a | 80.94b | 83.21a | 81.63ab | 0.48 | 0.0066 |
| Fat | 91.92a | 90.55b | 91.93a | 91.44ab | 0.29 | 0.0067 |
| Protein | 81.09 | 80.23 | 81.68 | 80.25 | 0.53 | 0.1789 |
| Energy | 83.78a | 81.83b | 83.78a | 82.35ab | 0.38 | 0.0012 |
| Copper | 23.28 | 19.59 | 20.71 | 20.11 | 2.01 | 0.5879 |
Disclaimer/Publisher’s Note: The statements, opinions and data contained in all publications are solely those of the individual author(s) and contributor(s) and not of MDPI and/or the editor(s). MDPI and/or the editor(s) disclaim responsibility for any injury to people or property resulting from any ideas, methods, instructions or products referred to in the content. |
© 2025 by the authors. Licensee MDPI, Basel, Switzerland. This article is an open access article distributed under the terms and conditions of the Creative Commons Attribution (CC BY) license (http://creativecommons.org/licenses/by/4.0/).
Copyright: This open access article is published under a Creative Commons CC BY 4.0 license, which permit the free download, distribution, and reuse, provided that the author and preprint are cited in any reuse.


