
Submitted:
21 September 2024
Posted:
23 September 2024
You are already at the latest version
Abstract
Two extruded diets isoenergetic, isonitrogenous, and isolipidic were formulated with poultry meal (CTR) as the source of animal-origin proteins (160 g/kg of feed) or with 90 g/kg of poultry meal and 70 g/kg of HFM (TRT) and were fed to eight dogs (four adult female and four adult male English Setters). Over 45 days, body weight, body condition, muscle condition, and fecal consistency scores were monitored at the beginning of the trial and after 3, 7, 15, and 45 days. No significant differences (P > 0.05) were observed for these parameters between diets and between sex. Fecal samples, collected at the same time points, were analyzed for microbiota composition. There was no significant difference in Shannon alpha diversity between the control (CTR) and experimental (TRT) diets or for diet × sampling time interaction and sex. However, beta diversity differed between diets (PERMANOVA p=0.001) and for diet × sampling interaction (p=0.009), with specific significant time points, and also differed by sex (p=0.047). LEfSe analysis showed Clostridiales, Coprococcus, Bacteroides plebeius, and others were more abundant in CTR, while Fusobacterium, Enterobacteriaceae, and others were more abundant in TRT. Temporal shifts in taxa like Prevotella copri and Fusobacterium were observed, with 25 taxa differing by sex. The study highlights diet and sex effects on gut microbiota in dogs.
Keywords:
Hydrolyzed Feather Meal
; Fecal Microbiota
; Dog
; Sex
1. Introduction
The microbiota performs various biochemical functions that influence the host, such as producing metabolites, regulating physiological and biochemical processes, and modulating the immune system [1]. The constantly changing gastrointestinal environment greatly affects the composition, function, and metabolism of the intestinal microbiota [2]. The microorganisms found in the gastrointestinal tract (GIT) of domestic dogs form a diverse and intricate community [3,4]. The commensal bacteria found in a dog’s gastrointestinal tract belongs to one of the five predominant bacterial phyla, Bacteroidetes, Fusobacteria, Firmicutes, Proteobacteria, and Actinobacteria [5]. Generally, these communities reflect the environment, substrate availability and functions of the specific region of the gastrointestinal tract they occupy [6,7,8].
Diet is the most crucial factor shaping the intestinal environment, making the microbiota highly sensitive to dietary changes. The microbiota aids in food breakdown, fermentation of complex carbohydrates and amino acids, and the production of short-chain fatty acids (SCFAs) [9]. The food consumed by the host is the primary nourishment for the intestinal microbiota, significantly shaping its composition. This microbiota, in turn, influences the host’s gut function. Both humans and animals need a balanced intake of carbohydrates, proteins, fats, and metabolites for health. Excess or indigestible food bypasses initial digestion and is broken down in the colon by intestinal microbes [10]. In dogs obligate anaerobic bacteria, for instance, are primarily located in the anaerobic large intestine and mainly belong to the Firmicutes phylum and/or have ability to ferment dietary fibers [6,8,11]. In comparison, the oxygen rich small intestine hosts aerobic and facultative anaerobic bacteria, along with protein metabolizing bacteria, which typically belong to the Proteobacteria phylum [3,6,8]. Generally, a high prevalence of Fusobacteria is linked to protein-rich diets [12,13,14], while an increased relative abundance of Proteobacteria is associated with protein metabolism in dogs [3].
Considering the importance of diet on the microbial community of the gut in dogs [5,15], the effect of nutrients or ingredients composition of the diet can be evaluated also through the analysis of fecal microbiota. This technique offers the opportunity to carry out dietary intervention studies without the need to handle animals, since they require only fecal collection from the floor. Furthermore, the analysis of fecal microbiota can be extended to assess the inclusion of by-products of agrifood industry into the diet, that is paramount for the evaluation of circular economy. This approach was recently applied to investigate the effect of hydrolyzed feather meal as a protein source in dogs [16].
Treated feather and hog hair meals are valuable protein sources for growing chicks [17]. Enzyme supplementation, including protease and amylase, improves poultry growth performance [18]. Keratinase, an enzyme that breaks down various proteins [19], aids in the degradation of chicken feathers and keratinous waste by fungi [20], which can then be used as nitrogen-rich fertilizers [21,22]. This microbial degradation provides an alternative protein source, reduces production costs, and converts feather waste into a digestible feather meal [23].
The aim of this study was to assess the implications of incorporating hydrolyzed feather meal (HFM) as a substitute for poultry meat in the diet of dogs on fecal microbiome composition. To investigate the impact of dietary substitution with HFM on the composition and diversity of the fecal microbiome in dogs, 16S rRNA gene sequencing technique was applied to analyze changes in abundance of key taxa and microbial biodiversity of fecal samples.
2. Materials and Methods
2.1. Animal Ethics Statement
The research was approved by the Ethical Animal Care and Use Committee of the University of Messina, Department of Veterinary Sciences (January 24th, 2023, code 01/2023), and the experiment was carried out following ethical and animal welfare guidelines.
2.2. Animals and Diets
Two extruded diets, isoenergetic (approximately 3680 kcal/kg, as-fed), isonitrogenous (approximately 19 g/100 g, as-fed) and isolipidic (approximately 15 g/100 g, as-fed) were formulated to meet the nutritional needs of adult dogs [24]. One diet, CTR, was formulated with poultry meal (PM) as the source of proteins of animal origin (160 g/kg of feed) and one diet, TRT, was formulated with 90 g/kg poultry meal (PM) and 70 g/kg of poultry feather hydrolyzed (HFM) with pressure and steam (GOLDMEHL FM, Gepro, Diepholz, Germany).
GOLDMEHL FM contains approximately 83 g/100g crude protein, 7 g/100g crude fat, 1 g/100g of crude fiber, 6 g/100g starch and 2 g/100g ash (as-fed) and a declared ileal digestible protein >80%. GOLDMEHL FM derives from fully healthy poultry by-products, and it is considered a processed animal protein, Cat. III material, in accordance with Regulation (EC) No 1069/2009.
The amount of calcium and phosphorus of the diet were adjusted, due to the lower quantity in HFM compared to PM. Diets also contained docosahexaenoic acid (DHA). The formulation and the chemical composition of the diets is reported in a previously published article [16].
The research involved 4 adult female English setter dogs, divided into 2 groups, CTR group and TRT group homogeneous for initial body weight (BW, CTR: 16.1 kg; TRT: 16.8 kg), body condition score (BCS: 5, on a 9-point scale), muscle condition score (MCS: 1, on a 4-point scale) and fecal consistency score (FCS: 2.25, on a 5-point scale), and 4 adult male English setter dogs, divided into 2 groups: CTR group and TRT group homogeneous for initial body weight (CTR: 21.9 kg; TRT: 21.6 kg), BCS (5, on a 9-point scale), MCS (1, on a 4-point scale) and FCS (2.3, on a 5-point scale).
Body weight (BW) measurements were obtained from fasted animals using a platform electronic balance (EOS 150K100NXL, Kern & Sohn GMBH; Balingen - Germany) at 09:00 in the morning. The assessment of BCS involved utilizing a rating scale ranging from 1 (too thin) to 9 (too heavy), based on the table proposed by WSAWA Global Nutrition Guidelines [25]. The MCS Muscle was determined using a scale ranging from 1 (no muscle wasting and normal muscle mass) to 4 (marked muscle wasting), based on the table proposed by WSAWA Global Nutrition Guidelines. Evaluation of muscle mass encompassed visual examination and palpation of the temporal bones, scapulae, ribs, lumbar vertebrae, and pelvic bones [26]. Fecal consistency score (FCS) was assessed by subjective evaluation of the using a rating scale ranging from 1 (dry stool) to 5 (liquid stool) according to the table proposed by Waltham Fecal Score [27].
All the dogs were privately owned and kept in the same environmental conditions. They were housed in cages with a natural light - dark cycle (natural rhythms of dawn to dusk). Exercise was provided twice a day (morning and evening, for approximately one hour each time) in an outdoor area. All the dogs had regular opportunities for socialization with each other and with members of the owner’s family. Before initiating the trial, a clinical assessment was performed on all dogs, comprising physical examinations, complete blood counts, biochemical tests, and fecal analyses (data not shown), with the objective of assessing their health conditions. Furthermore, diagnosis of Leishmania infantum was conducted using the Indirect Immune Fluorescent Antibody Test (IFAT), while simultaneous coprological evaluations were carried out to detect the presence of endoparasites. The study lasted 45 days (from 9th October to 24th November), with 7 days for adaptation to the diets (T -15) as recommended by the American Animal Hospital Association [28].
The amount of feed daily administered to each dog was calculated based on the ratio between the calculated metabolizable energy requirements for adult dogs with moderate physical activity (1-3 hour/day) as proposed by the European Pet Food Industry Federation guidelines [24], and the caloric density of metabolizable energy (ME) of each diet (CTR and TRT).
ME requirement =125 x BW 0.75
The feeding regimen consisted of a single daily serving, administered individually, at the same hour (8.00 p.m.) according to the FEDIAF guidelines (2021).
The research protocol was meticulously controlled, with careful consideration given to factors such as for both groups, ensuring a comprehensive and controlled approach.
2.3. Data Recording and Samples Collections
Over the 45-day period, at specific time points, day 0 (T0), day 3 (T03), day 7 (T07), day 15 (T15), day 45 (T45), each animal underwent assessment of the BW, BCS and MCS. Fecal samples for microbiota sequencing were collected on the following pairs of days: day 0 and day 1 for T0, day 3 and day 4 for T03, day 7 and day 8 for T07, day 15 and day 16 for T15, and day 45 and day 46 for T45. Fecal samples were collected in screw cap tubes containing eNAT® transport and storage medium (eNAT® tubes, Copan, Brescia, Italy) at 9:00 on consecutive days. They were promptly stored in the dark at room temperature awaiting analysis, adhering to the preservation requirements of the eNAT® medium.
2.4. Microbiota Analysis
DNA extraction was performed within 3 weeks from the collection date. Total DNA extraction for microbiome analysis was performed on 150 mg of feces using the Quick-DNA™ Fecal/Soil Microbe Miniprep Kit (Zymo Research, Irvine, CA, USA), following the manufacturer’s instructions. Quantification and quality assessment of the extracted DNA were carried out using a QubitTM 3 Fluorometer (Thermo Scientific; Waltham, MA, USA). Following DNA extraction, libraries were prepared by amplifying the V3 and V4 regions of the 16S rRNA gene and incorporating sequencing indexes. This step utilized the Nextera DNA Library Prep kit (Illumina; San Diego, CA, USA), following the manufacturer’s guidelines and employing specific primers [29]. The resulting amplicons underwent sequencing on a MiSeq platform (Illumina; San Diego, CA, USA) in 2 × 250 paired-end mode, following standard protocols to achieve an intended sequencing depth of 50,000 reads per sample. The raw sequence data obtained was deposited in the NCBI Sequence Read Archive under the accession number PRJNA1079213.
2.5. Bioinformatic and Statistical Analysis
After processing the initial raw sequences (FASTQ) from the samples using the bioinformatics tool Quantitative Insights Into Microbial Ecology 2 (QIIME 2) [30], the following steps were undertaken: demultiplexing was performed, sequenced reads meeting the quality threshold (Phred score ≥ 30) were identified, and chimeras were filtered out. Overall, a total of 4449601 reads with an average counts per sample of 55620 reads. These high-quality sequences were clustered into amplicon sequence variants (ASVs) against the greengenes database [31] for 16S rRNA. Reads were assigned to taxa until specie level and the data were uploaded to the Microbiome Analyst (https://www.microbiomeanalyst.ca/) for statistical and integrative analysis of microbiome [32] and normalized as relative abundance (RA). The reads RA were used to compute Shannon alpha diversity and the comparisons for the factors Diet, Diet X Times of sampling and Sex were tested with Mann-Whitney test, with multi-testing adjustment based on Benjamini-Hochberg procedure (FDR). Bray-Curtis beta diversity differences between Diet, Diet X Times of sampling and Sex were also computed and the results were visualized using Principal Coordinate Analysis (PCoA) plots. Differences in community composition were evaluated through permutational multivariate analysis of variance (PERMANOVA). Linear Discriminant Analysis Effect Size (LEfSe) was subsequently applied [33] to compare RA between Diets, Diets X Times of sampling and Sex.
Data of BCS, MCS and FCS were analyzed with ordinal regression models, with the effects of diet, sex, time of sampling and interaction of diet X time of sampling. Data of BW were analyzed with mixed model, with the fixed effects of diet, sex and time of sampling and the interaction of diet X time of sampling and with the random effect of dog. These statistical analyses were performed with XLSTAT (Addinsoft, 2022).
3. Results
3.1. Animal Performances
In relation to the diet, the BW, BCS, and MCS did not significantly vary during the study between the dogs fed the CTR and TRT diets (Table 1). The TRT diet caused a slight but not significant (P>0.05) decrease in FCS compared to the CTR diet. In relation to the sex, the BW of males was significantly higher (P<0.01) than females, as expected, while no significant differences were observed for BCS, MCS and FCS. The interaction diet x time of sampling showed significantly (P<0.05) lower values for the FCS in the TRT group at T0, T7, and T15 compared to T3 and T45, and also lower than the values measured for the CTR group. However, at T45, the FCS of the CTR and TRT groups did not significantly differ. Overall, the mean values of BCS, MCS and FCS indicated generally good health conditions.
3.2. Microbiome
3.2.1. Relative Abundances
The rarefaction curves, reported in the supplementary material S1, showed that the sequence depth was satisfactory for all the samples in the CTR and TRT diets. The results of relative abundance (RA) at the phylum and family taxonomic levels are reported in Figure 1 for the two diets at the time points. These results indicated that the phyla Firmicutes, Bacteroidetes, and Fusobacteria were the most represented in the feces of the dogs (Figure 1A). At the family taxonomic level, Lachnospiraceae, Fusobacteriaceae, Prevotellaceae, and Bacteroidaceae were the most dominant families in the gut microbiota of the dogs (Figure 1B).
3.2.2. Alpha Diversity
The Mann-Whitney test yielded an FDR > 0.05, indicating no statistically significant difference in the Shannon alpha diversity index between the two dietary groups, marked as CTR and TRT (Figure 2A). Similarly, there was no statistically significant difference for the Diet × Time of sampling interaction (Figure 2B) or for Sex (Figure 2C).
3.2.3. Beta Diversity
The CTR group, consisting of dogs fed the PM diet (diet with poultry meal), and the TRT group, consisting of dogs fed the HFM diet (diet with hydrolyzed feather meal), were analyzed for differences in beta diversity using the Bray-Curtis dissimilarity matrix, reported as PCoA (Figure 3A). The PERMANOVA test yielded a p-value of 0.001, indicating a statistically significant difference in the Bray-Curtis beta diversity index between the two dietary groups.
Figure 3B shows the Bray-Curtis beta diversity index for dogs fed with CTR and TRT diets throughout the study period. The CTR and TRT groups were examined at several time points: T0, T03, T07, T15, and T45. The PERMANOVA test found a p-value of 0.009, which means there were significant differences in beta diversity between the two diets over the study period. However, significant differences were only detected in pairwise comparisons between CTR_T07 and TRT_T07 and between CTR_T07 and TRT_T45, showing differences in beta diversity at these specific times.
Figure 3C shows the beta diversity index for male and female dogs. The PERMANOVA test revealed a significant difference in the Bray-Curtis beta diversity index between sexes, with a p-value of 0.047.
3.2.4. LEfSe Analysis
The LEfSe analysis revealed significant differences in the gut microbiota composition of dogs fed with the CTR and TRT diets group (Figure 4). In the CTR diet group, the order Clostridiales and 5 genera were more abundant. In contrast, in the TRT diet group, 4 families, Fusobacteriaceae, Paraprevotellaceae, Enterobacteriaceae, Peptostreptococcaceae, and 7 genera were prevalent. Based on the LEfSe analysis of the significant features identified in the Diet x Time interaction (Figure 5), it was shown that on day 45, dogs fed the CTR diet group exhibited a significant abundance of the species Prevotella copri. At T0, dogs fed the TRT diet group had a significant abundance of the genus Fusobacterium. For the TRT diet group, the genus Blautia showed a significant increase in abundance at T03, and the family Fusobacteriaceae did so at T07. Furthermore, the LDA scores of the genera were above 4.
The LEfSe analysis further highlighted notable differences in the gut microbiota composition between male and female dogs (Figure 6). Overall, 25 taxa were significantly different between sexes, with 14 taxa being more abundant in females (Bacteroides, Anaerobiospirillum, Ruminococcaceae, Burkholderiales, Faecalibacterium, Butyricicoccus pullicaecorum, Clostridiales, Parabacteroides, Coprococcus, Bacteroidales, S24_7, Erysipelotrichaceae, Succinivibrio and Sarcina) and 11 in males (Peptostreptococcaceae, Clostridium celatum, Succinivibrionaceae, Enterobacteriaceae, Turicibacter, Clostridium perfringens, Enterococcus, Ruminococcus gnavus, Blautia, Megamonas and Streptococcus luteciae).
4. Discussion
4.1. Animal Performances
During the 45-day study, BW remained unchanged between the groups, as did body condition (i.e., BCS and MCS), confirming that the inclusion of 7% HFM did not affect the energy content and nutrient availability of the TRT diet compared to the CTR diet.
These results align with a previous publication by Balouei et al. [16] and another study by Wahab et al. [34], which investigated the addition of 5%, 10%, and 20% HFM in the diet fed to adult female Beagles. In relation to sex, Wallis et al. [35] hypothesized that a sex-specific effect on BCS exists in canine species, being a notable factor for canine obesity. They demonstrated how this might occur: in their study, female Labrador retrievers had a higher mean BCS than male Labrador retrievers. Importantly, this sex effect strongly depended on whether the dogs were intact (female BCS > male BCS) or neutered (male BCS > female BCS). In our study, all dogs were intact, and females had a similar (P > 0.05) mean BCS (5.2, on a 9-point scale) to that of males (5.0, on a 9-point scale), both reaching the same mean value (5.0, on a 9-point scale) at the end of the trial.
The significant differences in FCS between groups (P<0.05) at some times of sampling are partly in agreement with the previous studies by Balouei et al. [16] and Pacheco et al. [36], which involved adult Beagles fed diets with 7.5% and 15% HFM. Indeed, El- Wahab et al. [34] reported an increase in FCS with inclusion levels of 10% and 20% HFM in the diet of Beagle dogs. Deschamps et al. [37] noted that dog size influences digestion and microbiota, which may partly explain the differences between the present study and those conducted with Beagles. However, other factors, such as age, sex, previous dietary regimes, and environmental conditions, could also be directly or indirectly involved. Nevertheless, the numerical differences in FCS values between the two groups were limited to well-formed feces for all dogs over time (T0 to T45) with fecal scores ranging from 2.2 to 2.5 on a 5-point scale testifying normal gut health.
4.2. Fecal Microbiome
The impact of substituting PM with HFM in the diets of adult male and female dogs on their gut microbiome was assessed at various time points during the trial. The RA analysis at the phylum and family levels confirmed that Firmicutes, Bacteroidetes, and Fusobacteria were the predominant phyla, consistent with findings from previous studies on canine gut microbiota. You and Kim [38] found that healthy dogs predominantly harbor Firmicutes, Bacteroidetes, Fusobacteria, Proteobacteria, and Actinobacteria, with Fusobacterium abundance varying by breed and age. Studies using next-generation sequencing [3] reveal that healthy dogs and cats have gut microbiomes rich in Firmicutes and Bacteroidetes, with a notable presence of Proteobacteria, which includes both beneficial and opportunistic pathogenic species. At the family level, Lachnospiraceae, Fusobacteriaceae, Prevotellaceae, and Bacteroidaceae were the most dominant, indicating their critical role in the gut ecosystem of dogs (Figure 1).
The analysis of alpha diversity, as measured by the Shannon index, revealed no statistically significant differences between the CTR and TRT groups. This suggests that while the overall diversity of microbial species was similar across both dietary groups, it does not preclude the possibility of differences in specific microbial populations or functional capacities. The absence of significant differences in the Diets × Times interaction and sex further supports the stability of alpha diversity across different conditions within this study (Figure 2). In a previous study, Balouei et al. [16] examined the effects of substituting 7% of PM with HFM on the performance and fecal microbiota of six adult female English Setter dogs. Over a 45-day period, no significant differences were found for alpha diversity between diets and Diets × Times interaction, although the analysis revealed higher evenness in the HFM group.
In contrast, beta diversity analysis (Figure 3) demonstrated significant differences (p-value of 0.001) between the dietary groups, highlighting distinct microbial community structures between dogs fed the CTR and TRT diets. Longitudinal analysis of beta diversity across multiple time points underscored the stability of microbial communities over the 45-day trial, as significant differences were limited to specific time points (CTR_T07 vs. TRT_T07 and CTR_T07 vs. TRT_T45). These results align with the previous study by Balouei et al. [16], which also found differences in beta diversity following the substitution of PM with HFM.
The LEfSe analysis revealed significant differences in the gut microbiota composition of dogs fed with the CTR and TRT diets group (Figure 4). In the CTR diet group, Clostridiales, Coprococcus, Bacteroides plebeius, Eubacterium biforme, Catenibacterium and Prevotella copri were more abundant. In contrast, in the TRT diet group, Fusobacterium, Bacteroides, Fusobacteriaceae, Paraprevotellaceae, Enterococcus, Faecalibacterium, Enterobacteriaceae, Peptostreptococcaceae and Clostridium spiroforme, Fusobacterium, the family Fusobacteriaceae, and the genus Bacteroides were prevalent. These changes in RA of microbiota were likely related to the partial substitution of PM with HFM.
Different amino acids composition between these two raw materials [16] can affect sequence, type, charge and dimensional arrangement of the proteins that determine cleavage sites. Moreover, feathers were treated with pressure and steam, a process that is known to decrease the digestibility of protein and to modify several amino acids, with a production of new disulphide linkages, amide bonds, that reduces the enzymatic hydrolysis in the gastrointestinal tract [39]. These factors can affect the extent of undigested protein and the type of peptides into the bowel and, in turn, influence the microbiota composition, as reported in the systematic of Wu et al. [40] that included 6 mouse studies, 7 pig studies, 15 rat studies, and 1 in vitro study. In a study by Do et al. [41], a comparison of human-grade pet foods with extruded diets revealed that human grade diets improved digestibility, reduced fecal output, and significantly altered fecal microbiota composition. Notably, dogs fed human grade beef exhibited a higher relative abundance of Bacteroidetes and a lower abundance of Firmicutes compared to those receiving fresh or human grade chicken diets. While the phyla Actinobacteria, Fusobacteria, Proteobacteria, and Spirochaetes remained stable, nearly 20 bacterial genera showed changes in RA. In a comparison between natural and commercial diets, Kim et al. [42] observed significant differences in gut microbiota diversity and composition. Dogs on the natural diet exhibited higher alpha diversity and distinct beta diversity, with increased levels of Clostridium perfringens and Fusobacterium varium. In dogs, a meat-based diet led to reduced fecal weight, improved protein and energy digestibility, and notable changes in gut microbiota in comparison to a kibble diet. Specifically, Bacteroides, Prevotella, Peptostreptococcus, and Faecalibacterium decreased, whereas Fusobacterium, Lactobacillus, and Clostridium increased [43]. [44] reported that a raw meat diet caused an increase of RA of Fusobacterium and Bacteroides, Megamonas, Lactococcus and Escherichia and a reduction of Lactobacillus and Prevotella and Paralactobacillus. In a meta-analysis of 16 studies involving 314 dogs [5], dietary protein contents were found to have a significant impact on specific microbial taxa than on overall community diversity. Higher protein intake was associated with increased relative abundances of Prevotellaceae Ga6A1 and Enterococcus. The variations of microbiota in relation to protein source and content seem not to obey to a strict rule, and conflicting results were reported among different studies, depending on the experimental setting, as time of sampling, number of animals, age, sex and diet composition, and in general to environmental factors, including ambient microbiota, that are not easy to compare.
The effects of dietary inclusion of HFM on the fecal microbiome in dogs were also investigated by Hankel et al. [45], and the authors did not find significant variations in diversity or RA of taxa, likely due to the lower amount of feather meal (2.7%) used in comparison to the present study. Furthermore, present results do not agree with those obtained in a previous study [16], where the TRT diet caused a reduction of RA of Ruminococcus gnavus, Bacteroides coprophilus, Colinsella stercoris and Streptococcus and an increase Bacteroides uniformis. Only for Peptostreptococcaceae the increase in the TRT group in comparison to CTR group agree with previous observations. The difference between the two studies mainly lies in sex of the dogs, since the previous trial was conducted only with females and in the present trial dogs were males and females. If this was the reason of the differences is hard to state, but, interestingly, the beta diversity of microbiota was significantly different between sexes (Figure 3). There is limited literature related to the effect of sex on fecal microbiota in dogs. Scarsella et al. [15] found significant differences between male, female, and castrated dogs, while Jah et al. [46] did not observe variations in diversity between genders in a population of household pets in the United States. However, the authors conducted the study by collecting fecal samples from dogs living in very different conditions, such as diet and living environment, which could have masked the relationship between microbiota and sex. Similarly, Pereira et al. [47] reported no effect of sex on fecal microbiota in growing puppies. The role of sex in shaping gut microbial populations has been investigated more extensively in humans. D’Afflitto et al. [48], in a systematic review, reported an association between sex hormones and microbiota composition or diversity, a relationship that was also detected in mice [49]. This finding suggests that sex-specific factors may influence gut microbiota composition, potentially impacting how male and female dogs respond to dietary interventions. Specific taxa differed between the groups, with notable variations in bacterial abundance.
5. Conclusions
This study confirms that it’s possible to substitute some of the protein intake in a dog’s diet with HFM without negatively affecting the dogs’ health and implies that hydrolyzed feather meal could be a viable alternative protein source for dogs, potentially offering benefits such as cost-effectiveness or sustainability compared to traditional protein sources.
Supplementary Materials
The following supporting information can be downloaded at the website of this paper posted on Preprints.org. Figure S1: Rarefaction curve of the sequence reads in dogs fed control diet (CTR) and experimental diet (TRT). CTR group, dogs fed with PM diet (diet with poultry meal); TRT group, dogs fed with HFM diet (diet with hydrolyzed feather meal); Figure S2: Rarefaction curve of the sequence reads in dogs fed control diet (CTR) and experimental diet (HFM) during the study.
Author Contributions
Fatemeh Balouei: Data curation, Formal analysis, Writing - original draft, and Writing, review & editing; Bruno Stefanon: Data curation, Formal analysis, Methodology, Writing - original draft, and Writing - review & editing; Rosangela Armone: Data curation; Formal analysis; Methodology; Writing - original draft; Andrea Randazzo: Formal analysis; Investigation; Methodology; Biagina Chiofalo: Conceptualization; Data curation; Funding acquisition; Investigation, Project administration; Resources; Supervision; Writing - original draft; and Writing – review & editing.
Funding
This research was funded by the Project “BIO = C = O”, PON-MISE I&C 2014–2020 FESR, ASSE 6 REACT Priorità di investimento 13. i Azione I, “Finanziato nell’ambito della risposta dell’Unione alla pandemia di COVID-19”. Project codex N. F/200078/03/X45, CUP B41B20000280005.
Institutional Review Board Statement
The animal study protocol was approved by the Ethics Committee of the Department of Veterinary Sciences of the University of Messina (protocol code 01/2023 of 24 January 2023).
Data Availability Statement
Data are contained within the article.
Conflicts of Interest
The funders had no role in the design of the study; in the collection, analyses, or interpretation of data; in the writing of the manuscript; or in the decision to publish the results.
References
- de Vos, W.M.; Tilg, H.; van Hul, M. Gut microbiome and health: mechanistic insights. Gut 2022, 71, 1020–1032. [Google Scholar] [CrossRef] [PubMed]
- Kolodziejczyk, A.A.; Zheng, D.P.; Elinav, E. Diet-microbiota interactions and personalized nutrition. Nat. Rev. Microbiol. 2019, 17, 742–753. [Google Scholar] [CrossRef] [PubMed]
- Moon, C. D.; Young, W.; Maclean, P. H.; Cookson, A. L.; Bermingham, E. N. Metagenomic insights into the roles of Proteobacteria in the gastrointestinal microbiomes of healthy dogs and cats. Microbiologyopen 2018, 7, 1–20. [Google Scholar] [CrossRef] [PubMed]
- Valdes, A. M.; Walter, J.; Segal, E.; Spector, T. D. Role of the gut microbiota in nutrition and health. BMJ. 2018, 361, k2179. [Google Scholar] [CrossRef] [PubMed]
- Phimister, F.D.; Anderson, R.C.; Thomas, D.G.; Farquhar, M.J.; Maclean, P.; Jauregui, R.; Young, W.; Butowski, C.F.; Bermingham, E.N. Using meta-analysis to understand the impacts of dietary protein and fat content on the composition of fecal microbiota of domestic dogs (Canis lupus familiaris): A pilot study. Microbiologyopen 2024, 13, e1404. [Google Scholar] [CrossRef]
- Honneffer, J. B., Steiner, J. M., Lidbury, J. A., & Suchodolski, J. S. Variation of the microbiota and metabolome along the canine gastrointestinal tract. Metabolomics 2017, 13, 26. [CrossRef]
- Pilla, R.; Suchodolski, J. S. The role of the canine gut microbiome and metabolome in health and gastrointestinal disease. Front. Vet. Sci. 2020, 6, 1–12. [Google Scholar] [CrossRef]
- Suchodolski, J. S.; Camacho, J.; Steiner, M. Analysis of bacterial diversity in the canine duodenum, jejunum, ileum, and colon by comparative16S rRNAgene analysis. FEMS Microbiol. Ecol. 2008, 66, 567–578. [Google Scholar] [CrossRef]
- Cani, P.D.; de Hase, E.M.; van Hul, M. Gut microbiota and host metabolism: from proof of concept to therapeutic intervention. Microorganisms 2021, 9, 1302. [Google Scholar] [CrossRef]
- Bolte, L.A.; Vila, A.V.; Imhann, F. , Long-term dietary patterns are associated with pro-inflammatory and anti-inflammatory features of the gut microbiome. Gut 2021, 70, 1287–1298. [Google Scholar] [CrossRef]
- Panasevich, M. R.; Kerr, K. R.; Dilger, R. N.; Fahey, G. C.; Guérin-Deremaux, L.; Lynch, G. L.; Wils, D.; Suchodolski, J. S.; Steer, J. M.; Dowd, S. E.; Swanson, K. S. Modulation of the faecal microbiome of healthy adult dogs by inclusion of potato fibre in the diet. Br. J. Nutr. 2015, 113, 125–133. [Google Scholar] [CrossRef] [PubMed]
- Menke, S.; Wasimuddin, Meier, M.; Melzheimer, J.; Mfune, J. K. E.; Heinrich, S.; Thalwitzer, S.; Wachter, B.; Sommer, S. Oligotyping reveals differences between gut microbiomes of freeranging sympatric Namibian carnivores (Acinonyx jubatus, Canis mesomelas) on a bacterial species-like level. Front. Microbiol. 2014, 5, 526. [CrossRef] [PubMed]
- Nelson, T. M.; Rogers, T. L.; Brown, M. V. The gut bacterial community of mammals from marine and terrestrial habitats. PLoS One 2013, 8, e83655. [Google Scholar] [CrossRef] [PubMed]
- Zhu, L.; Wu, Q.; Deng, C.; Zhang, M.; Zhang, C.; Chen, H.; Lu, G.; Wei, F. Adaptive evolution to a high purine and fat diet of carnivorans revealed by gut microbiomes and host genomes. Environ. Microbiol. 2018, 20, 1711–1722. [Google Scholar] [CrossRef]
- Scarsella, E.; Stefanon, B.; Cintio, M.; Licastro, D.; Sgorlon, S.; Monego, S.D.; Sandri, M. Learning machine approach reveals microbial signatures of diet and sex in dog. PLoS ONE. 2020, 15, e0237874. [Google Scholar] [CrossRef]
- Balouei, F.; Armone, R.; Stefanon, B.; Randazzo, A.; Chiofalo, B. Long-term dietary intervention of the hydrolyzed feather meal on microbiota composition of adult female dogs. Res. Vet. Sci. 2024, 176, 10534. [Google Scholar] [CrossRef]
- Moran, E.T.; Summers, J.D.; Slinger, S.J. Keratin as a source of protein for the growing chick. 1. Amino acid imbalance as the cause for inferior performance of feather meal and the implication of disulfide bonding in raw feathers as the reason for poor digestibility. Poult. Sci. 1966, 45, 1257–1266. [Google Scholar] [CrossRef]
- Greenwood, M.W.; Fritts, C.A.; Waldroup, P.W. Utilization of avizyme 1502 in corn-soyabean meal diets with and without antibiotics. Poult. Sci. 2002, 81, 25. [Google Scholar]
- Odetallah, N.H.; Wang, J.J.; Garlich, J.D.; Shih, J.C.H. Keratinase in starter diets improves growth of broiler chicks. Poult. Sci. 2003, 82, 664–670. [Google Scholar] [CrossRef]
- Kumar, J.; Yadav, R. Keratinolysis of human hair and chicken feather by nondermatophytic keratinophilic fungi isolated from soil. J. Appl. Nat. Sci. 2020, 12, 568–574. [Google Scholar] [CrossRef]
- Kumari, M.; Kumar, J. Chicken feather waste degradation by Alternaria tenuissima and its application on plant growth. J. Appl. Nat. Sci. 2020, 12, 411–414. [Google Scholar] [CrossRef]
- Kumar, J.; Kumar, P.; Kushwaha, R.K.S. Recycling of chicken feather protein into compost by Chrysosporium indicum JK14 and their effect on the growth promotion of Zea mays. Plant Cell Biotechnol. Mol. Biol. 2020, 21, 75–80. [Google Scholar]
- Volik, V.; Ismailova, D.; Lukashenko, V.; Saleeva, I.; Morozov, V. Biologically active feed additive development based on keratin and collagen- containing raw materials from poultry waste. Int. Transact. J. Eng. Manage. Appl. Sci. Technol. 2020, 11, 1–10. [Google Scholar] [CrossRef]
- FEDIAF. Nutritional Guidelines for Complete and Complementary Pet Food for Cats and Dogs. The European Pet Food Industry Federation. FEDIAF Press (2021).
- Laflamme, D.P. Development and validation of a body condition score system for dogs. Canine Pract. 1997, 22, 10–5. [Google Scholar]
- Baldwin, K.; Bartges, J.; Buffington, T.; Freeman, L.M., Grabow, M.; Legred, J.; Ostwald, D. Jr. AAHA nutritional assessment guidelines for dogs and cats. J. Am. Anim. Hosp. Assoc. 2010, 46, 285–96. [CrossRef]
- Moxham, G. The WALTHAM faeces scoring system—a tool for veterinarians and pet owners: how does your pet rate? WALTHAM Focus. 2001, 11, 24–25. [Google Scholar]
- Cline, M.G.; Burns, K.M.; Coe, J.B; Downing, R.; Durzi, T.; Murphy, M.; Parker, V. AAHA Nutrition and Weight Management Guidelines for Dogs and Cats. J. Am. Anim. Hosp. Assoc. 2021, 57(4), 153–178. [Google Scholar] [CrossRef]
- Klindworth, A.; Pruesse, E.; Schweer, T.; Peplies, J.; Quast, C.; Horn, M.; Glockner, F.O. Evaluation of general 16S ribosomal RNA gene PCR primers for classical and next-generation sequencing-based diversity studies. Nucleic Acids Res. 2013, 41, e1-e1. [Google Scholar] [CrossRef]
- Bolyen, E.; Rideout, J.R.; Dillon, M.R.; Bokulich, N.A.; Abnet, C.C.; Al-Ghalith, G.A.; Alexander, H.; Alm, E.J.; Arumugam, M.; Asnicar, F. Reproducible, interactive, scalable, and extensible microbiome data science using QIIME 2. Nat. Biotechnol. 2019, 37, 852–857. [Google Scholar] [CrossRef]
- Greengene Database. Available online: https://greengenes.secondgenome.com (accessed on 31 December 2023).
- Lu, Y.; Zhou, G.; Ewald, J.; Pang, Z.; Shiri, T.; Xia, J. MicrobiomeAnalyst 2.0: comprehensive statistical, functional and integrative analysis of microbiome data. Nucleic Acids Res. 2023, 5, 310–318. [Google Scholar] [CrossRef] [PubMed]
- Segata, N.; Izard, J.; Waldron, L.; Gevers, D.; Miropolsky, L.; Garrett, W.S.; Huttenhower, C. Metagenomic biomarker discovery and explanation. Genome Biol. 2011, 12, R60. [Google Scholar] [CrossRef] [PubMed]
- Abd El-Wahab, A.; Zeiger, A.L.; Chuppava, B.; Visscher, C.; Kamphues, J. Effects of poultry by-products inclusion in dry food on nutrient digestibility and fecal quality in Beagle dogs. PLoS One 2022, 17(11), e0276398. [Google Scholar] [CrossRef] [PubMed]
- Wallis, N.J.; Sumanasekera, N.T.; Raffan, E. Obesity risk factors in British Labrador retrievers: Effect of sex, neuter status, age, chocolate coat colour and food motivation. Vet. Rec. 2023, e3410. [Google Scholar] [CrossRef] [PubMed]
- Pacheco, G.F.E.; Pezzali, J.G.; Kessler, A.dM.; Trevizan, L. Inclusion of exogenous enzymes to feathers during processing on the digestible energy content of feather meal for adult dogs. R. Bras. Zootec. 2016, 45, 288–94. [Google Scholar] [CrossRef]
- Deschamps, C.; Humbert, D.; Zentek, J.; Denis, S.; Priymenko, N.; Apper, E.; Blanquet-Diot, S. From Chihuahua to Saint-Bernard: how did digestion and microbiota evolve with dog sizes. Int. J. Biol. Sci. 2022, 18, 5086–5102. [Google Scholar] [CrossRef]
- You, I.; Kim, M.J. Comparison of Gut Microbiota of 96 Healthy Dogs by Individual Traits: Breed, Age, and Body Condition Score. Animals (Basel) 2021, 18, 11-2432. [Google Scholar] [CrossRef]
- Qi, J.; Li, X.; Zhang, W.; Wang, H.; Zhou, G.; Xu, X. Influence of stewing time on the texture, ultrastructure and in vitro digestibility of meat from the yellow-feathered chicken breed. Anim. Sci. J. 2018, 89, 474–482. [Google Scholar] [CrossRef]
- Wu, S., Bhat, Z.F., Gounder, R.S., Mohamed Ahmed, I.A., Al-Juhaimi, F.Y., Ding, Y., Bekhit, A.E.A. Effect of Dietary Protein and Processing on Gut Microbiota-A Systematic Review. Nutrients, 2022; 14, 153. [CrossRef]
- Do, S.; Phungviwatnikul, T.; de Godoy, M.R.C.; Swanson, K.S. Nutrient digestibility and fecal characteristics, microbiota, and metabolites in dogs fed human-grade foods. J. Anim. Sci, 2021; 1, 99(2). [Google Scholar] [CrossRef]
- Kim, J.; An., J.U.; Kim, W.; Lee, S.; Cho, S. Differences in the gut microbiota of dogs (Canis lupus familiaris) fed a natural diet or a commercial feed revealed by the Illumina MiSeq platform. Gut Pathog 2021, 21, 9–68. [CrossRef]
- Bermingham, E.N.; Maclean, P.; Thomas, D.G.; Cave, N.J.; Young, W. Key bacterial families (Clostridiaceae, Erysipelotrichaceae and Bacteroidaceae) are related to the digestion of protein and energy in dogs. PeerJ. 2017, 5, e3019. [Google Scholar] [CrossRef]
- Sandri, M.; Dal Monego, S.; Conte, G.; Sgorlon, S.; Stefanon, B. Raw meat-based diet influences fecal microbiome and end products of fermentation in healthy dogs. BMC Vet. Res. 2017, 28, 13–65. [Google Scholar] [CrossRef]
- Hankel, J.; Abd El-Wahab, A.; Grone, R.; Keller, B.; Galvez, E.; Strowig, T.; Visscher, C. Fecal Microbiota of Dogs Offered a Vegetarian Diet with or without the Supplementation of Feather Meal and either Cornmeal, Rye or Fermented Rye: A Preliminary Study. Microorganisms 2020, 6, 8–1363. [Google Scholar] [CrossRef]
- Jha, A.R.; Shmalberg, J.; Tanprasertsuk, J.; Perry, L.; Massey, D.; Honaker, R.W. Characterization of gut microbiomes of household pets in the United States using a direct-to-consumer approach. PLoS One 2020, 15, e0227289. [Google Scholar] [CrossRef] [PubMed]
- Pereira, A.M.; Pinna, C.; Biagi, G.; Stefanelli, C.; Maia, M.R.G.; Matos, E.; Segundo, M.A.; Fonseca, A.J.M.; Cabrita, A.R.J. Supplemental selenium source on gut health: insights on fecal microbiome and fermentation products of growing puppies. FEMS Microbiol. Ecol. 2020, 96, fiaa212. [Google Scholar] [CrossRef] [PubMed]
- d’Afflitto, M.; Upadhyaya, A.; Green, A.; Peiris, M. Association Between Sex Hormone Levels and Gut Microbiota Composition and Diversity-A Systematic Review. J Clin. Gastroenterol. 2022, 56, 384–392. [Google Scholar] [CrossRef]
- Org, E.; Mehrabian, M.; Parks, B.W.; Shipkova, P.; Liu, X.; Drake, T.A.; Lusis, A.J. Sex differences and hormonal effects on gut microbiota composition in mice. Gut Microbes 2016, 7, 313–322. [Google Scholar] [CrossRef]
Figure 1.
Relative abundance profile of phyla (Panel A) and families (Panel B) of the dogs fed with control diet (CTR) and experimental diet (TRT) at T0, T03, T07, T15 and T45. CTR group, dogs fed with PM diet (diet with poultry meal); TRT group, dogs fed with HFM diet (diet with hydrolyzed feather meal). Times of sampling: T0, T03, T07, T15 and T45 denote samples collected at the beginning of the study and after 3, 7, 15 and 45 days.
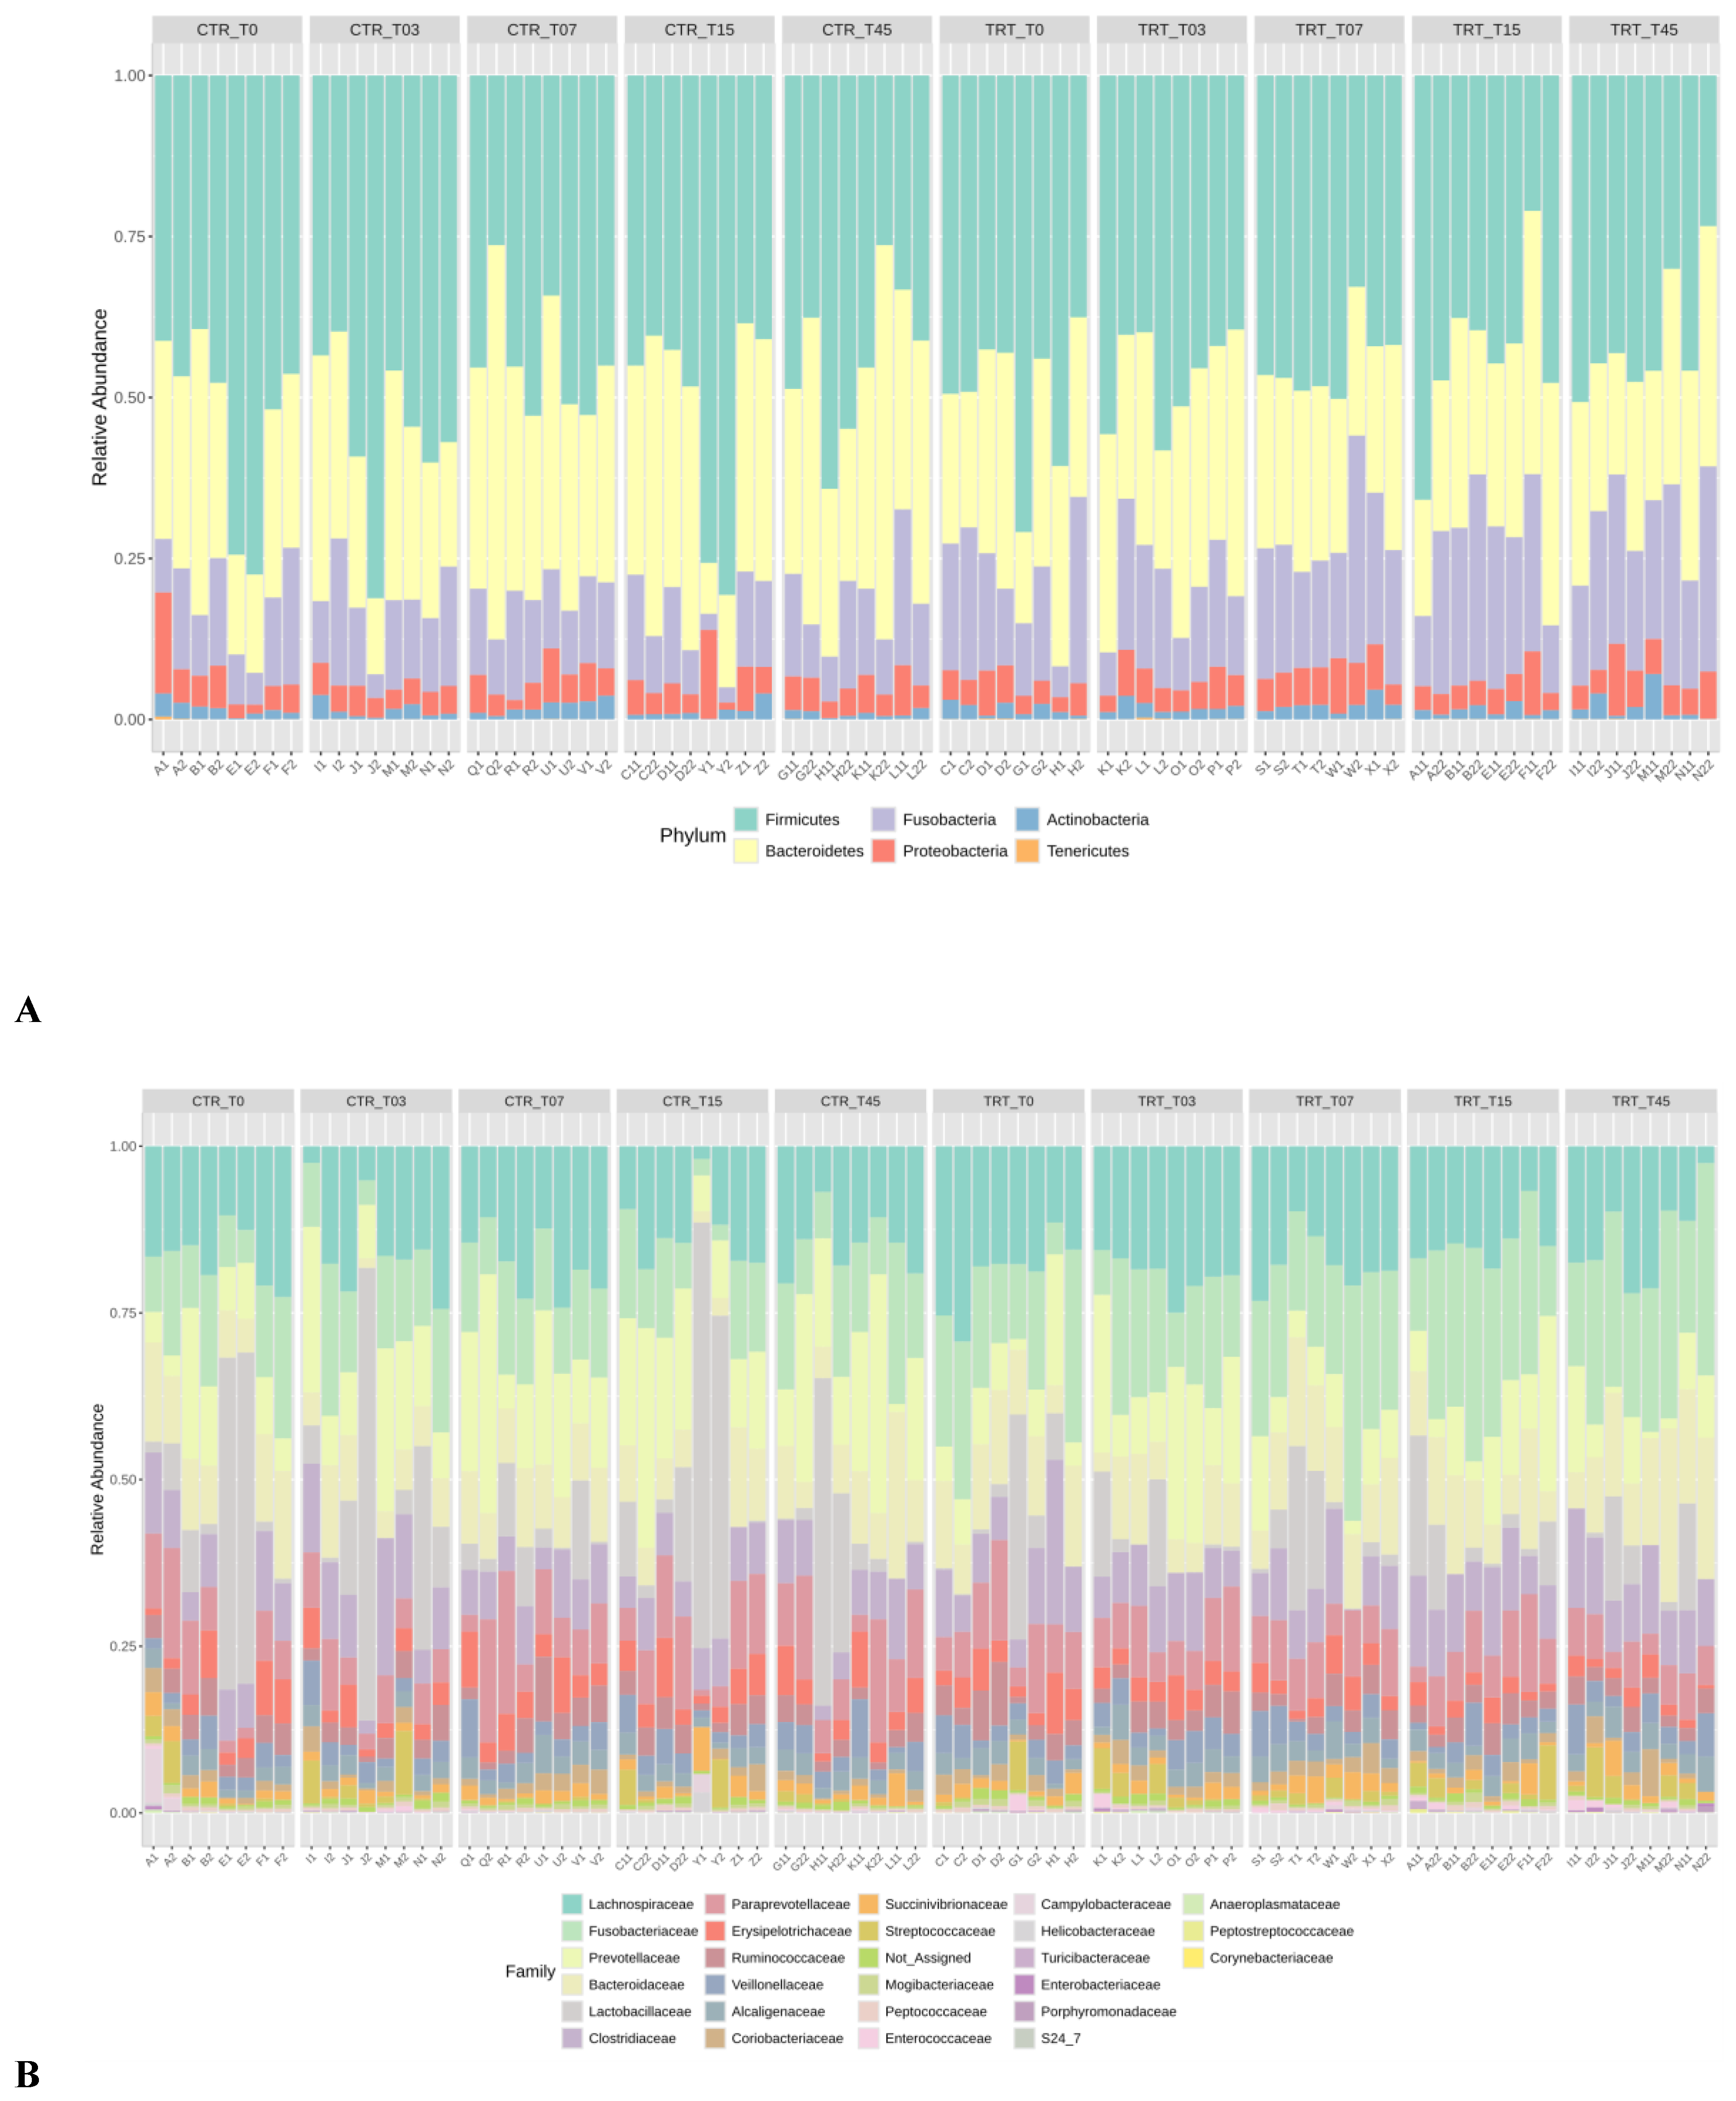
Figure 2.
Comparison of the Shannon alpha diversity index of dogs across dietary treatments (Panel A), Diet × Time of sampling interaction (Panel B), and Sex (Panel C). CTR group, dogs fed with PM diet (diet with poultry meal); TRT group, dogs fed with HFM diet (diet with hydrolyzed feather meal). Times of sampling: T0, T03, T07, T15 and T45 denote samples collected at the beginning of the study and after 3, 7, 15 and 45 days.
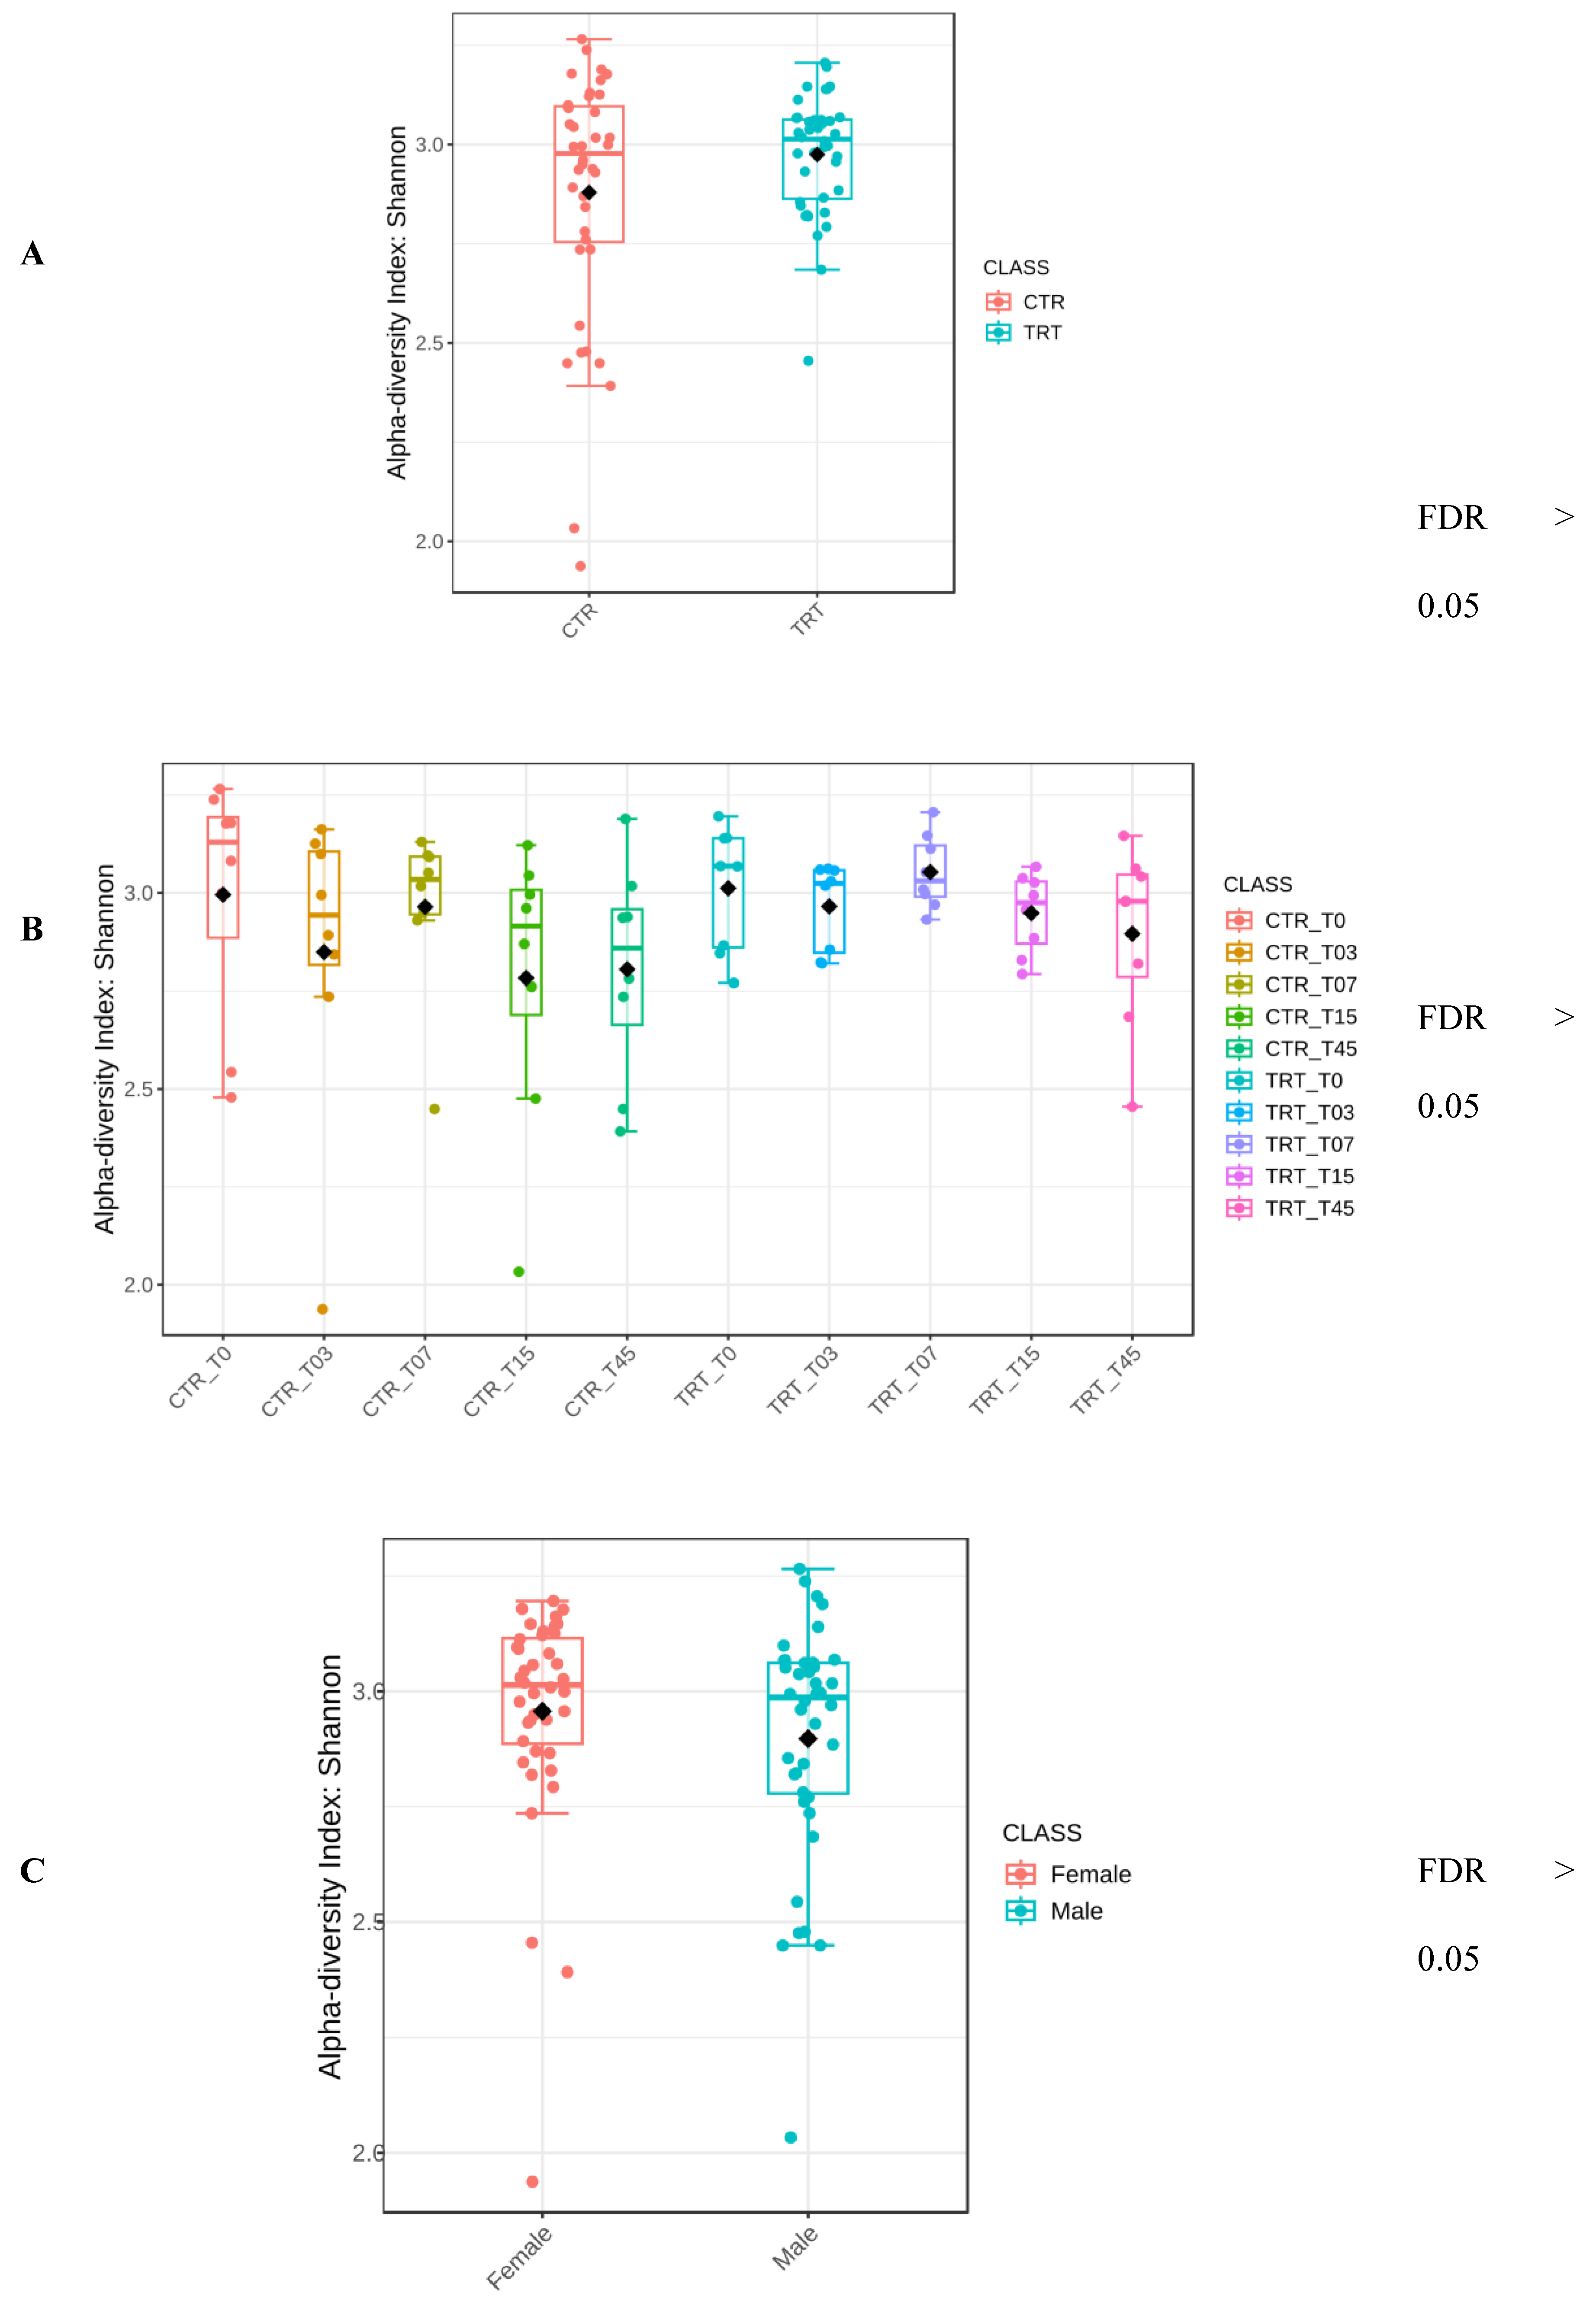
Figure 3.
Principal component analysis of the Bray-Curtis beta diversity index of dogs across dietary treatments (Panel A), Diet × Time of sampling interaction (Panel B), and Sex (Panel C). CTR group, dogs fed with PM diet (diet with poultry meal); TRT group, dogs fed with HFM diet (diet with hydrolyzed feather meal). Times of sampling: T0, T03, T07, T15 and T45 denote samples collected at the beginning of the study and after 3, 7, 15 and 45 days.
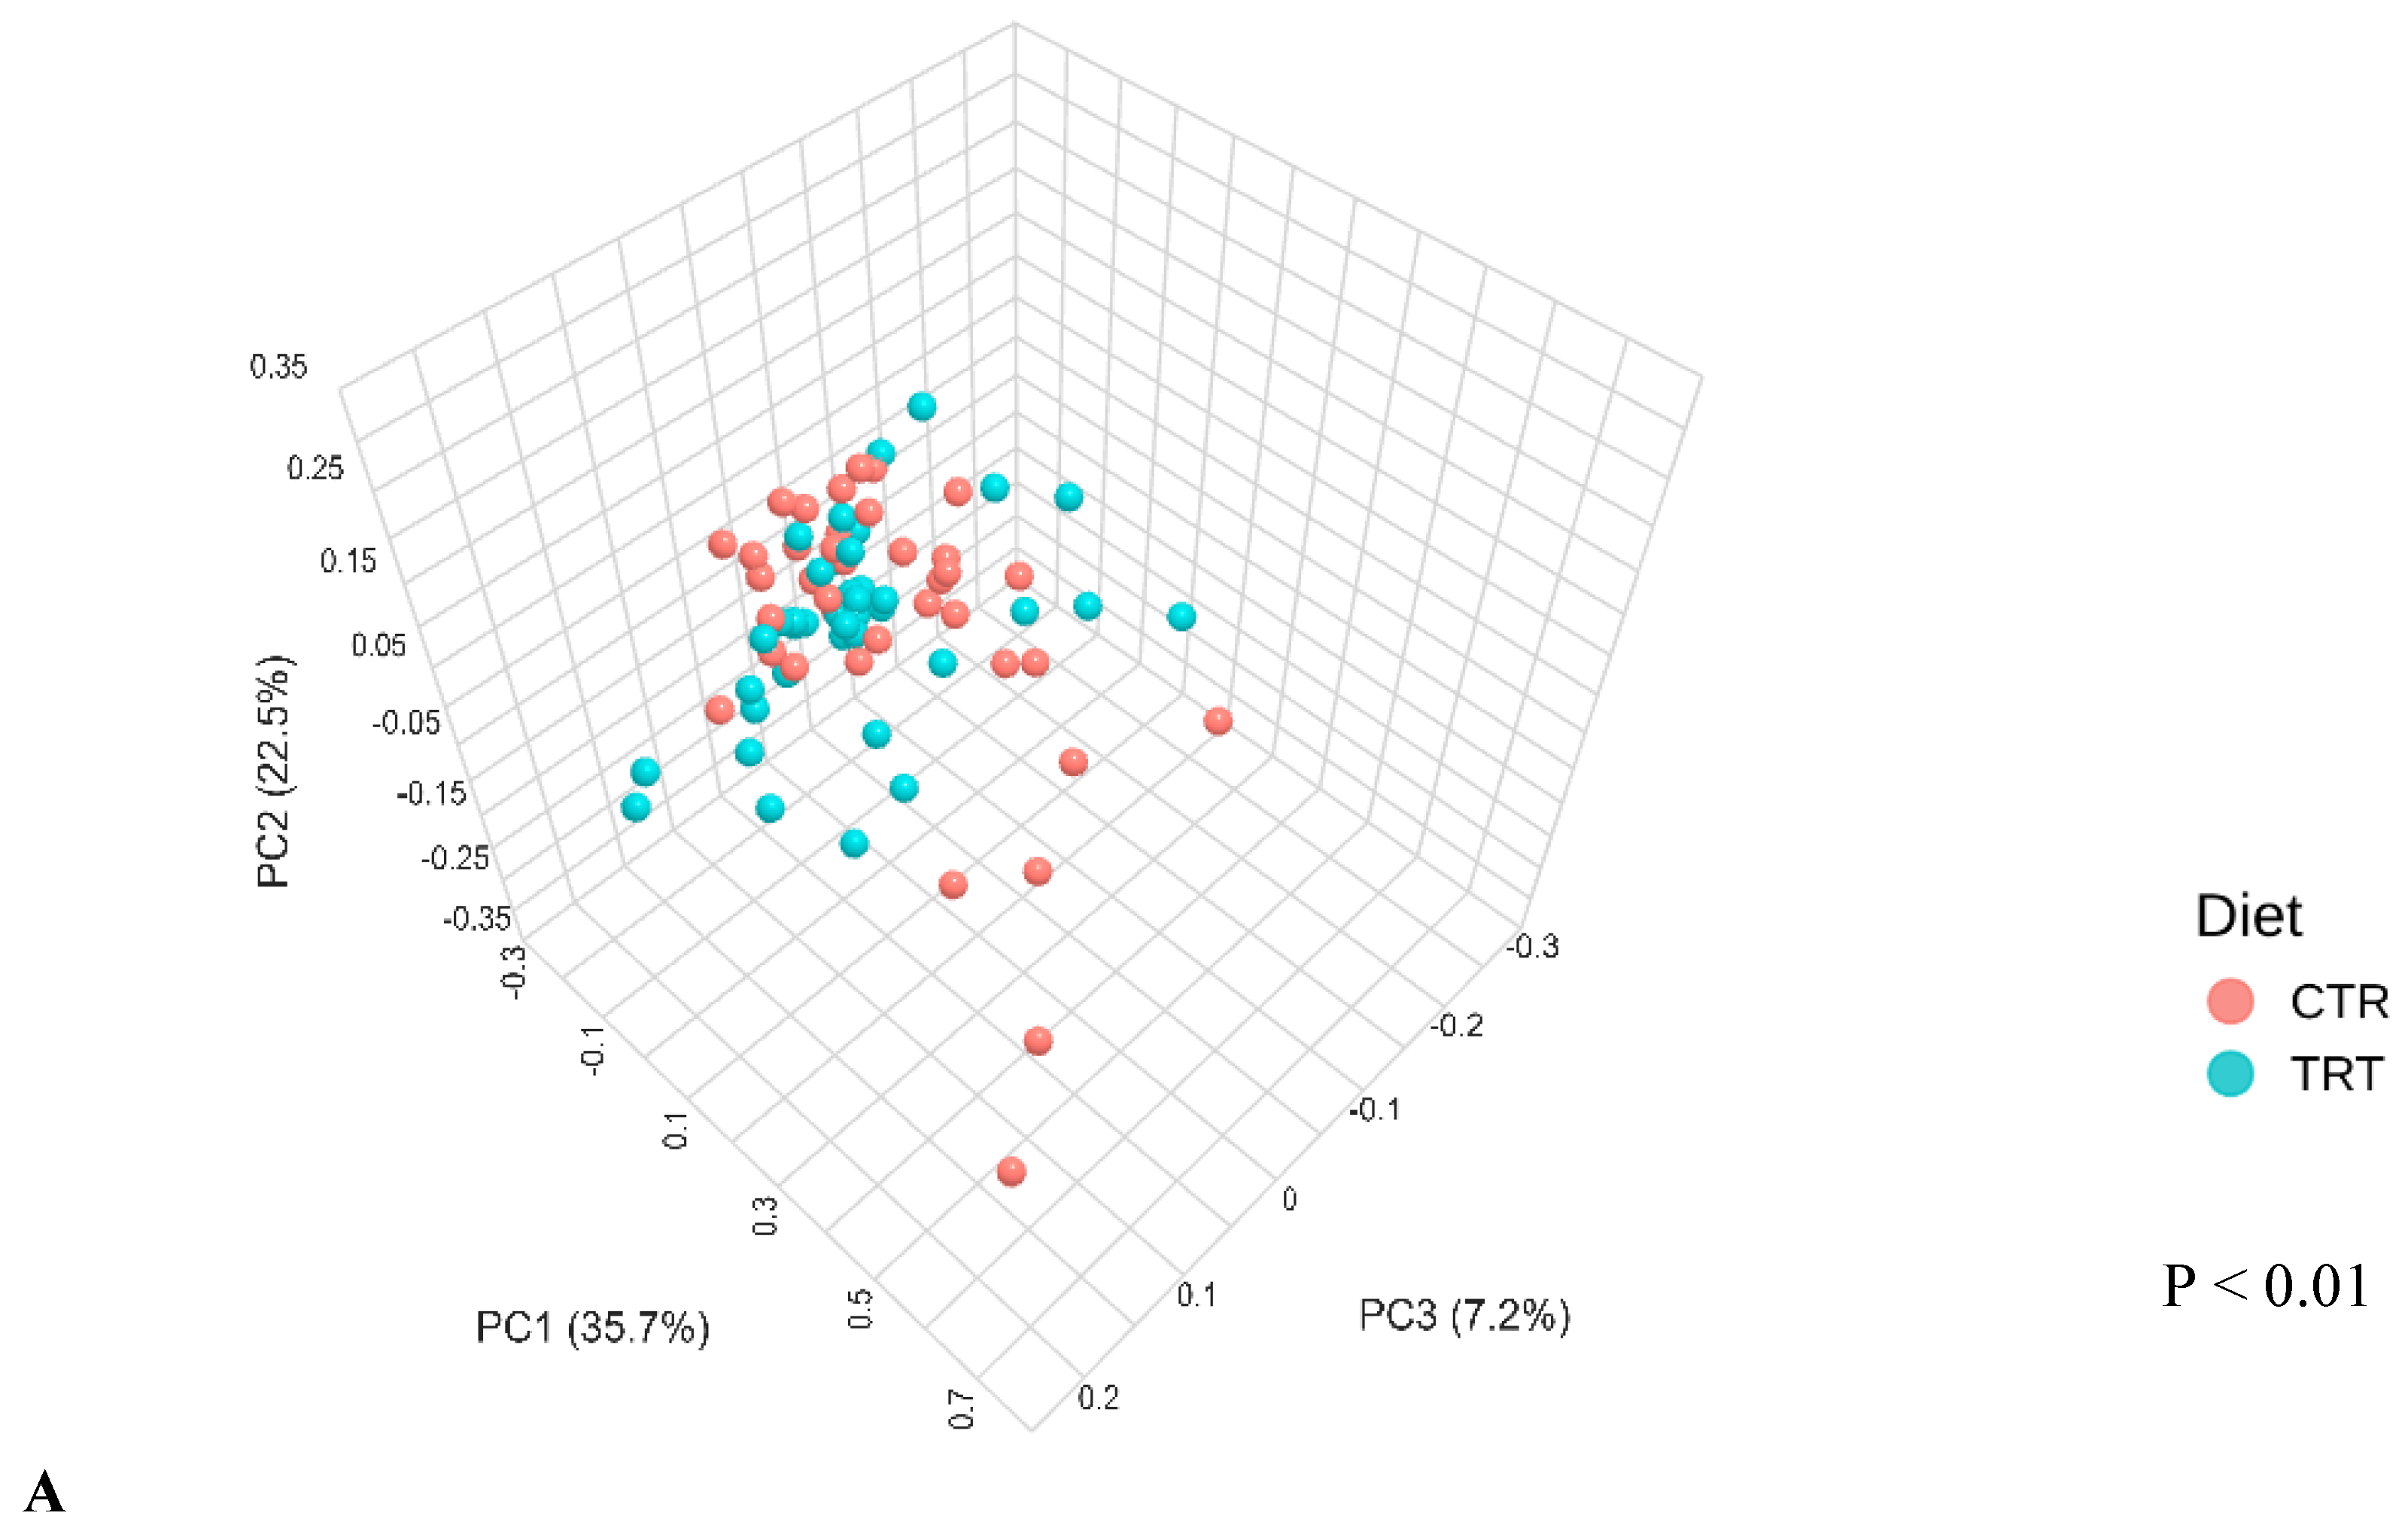
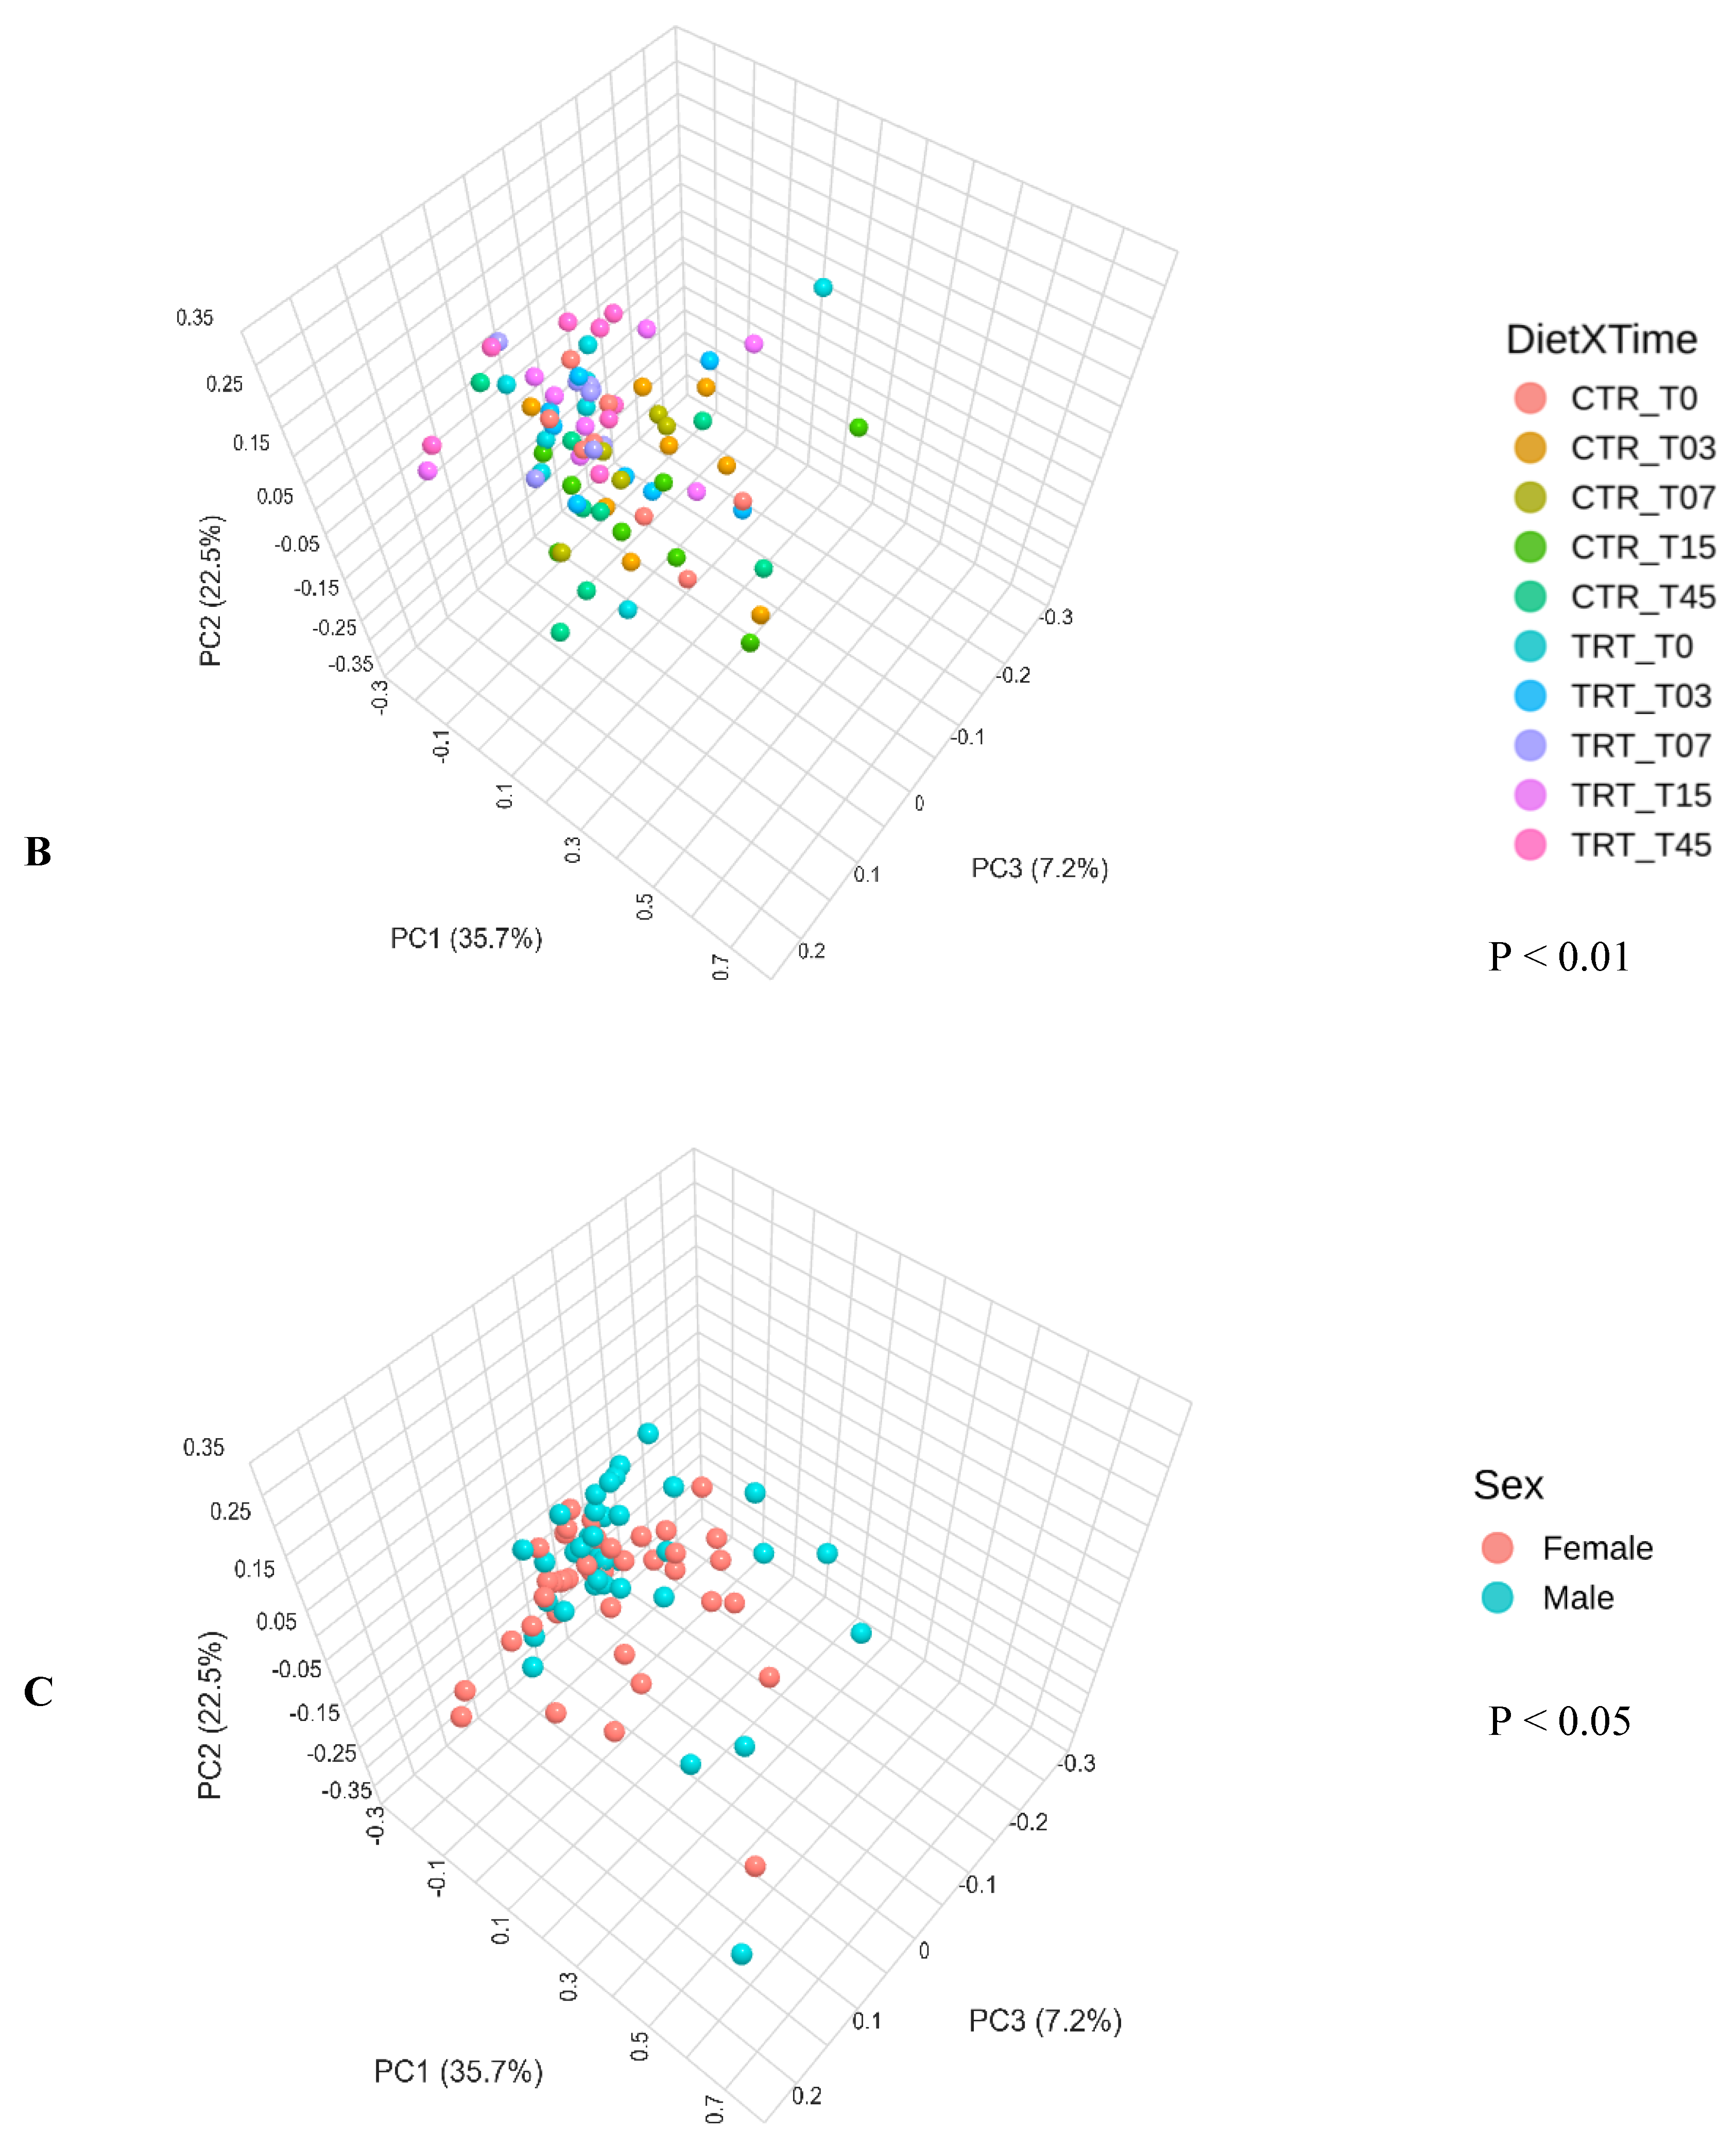
Figure 4.
Taxa that significantly differed between the CTR and TRT diets in the Linear Discriminant Analysis Effect Size (LEfSe). CTR group, dogs fed with PM diet (diet with poultry meal); TRT group, dogs fed with HFM diet (diet with hydrolyzed feather meal).
Figure 4.
Taxa that significantly differed between the CTR and TRT diets in the Linear Discriminant Analysis Effect Size (LEfSe). CTR group, dogs fed with PM diet (diet with poultry meal); TRT group, dogs fed with HFM diet (diet with hydrolyzed feather meal).
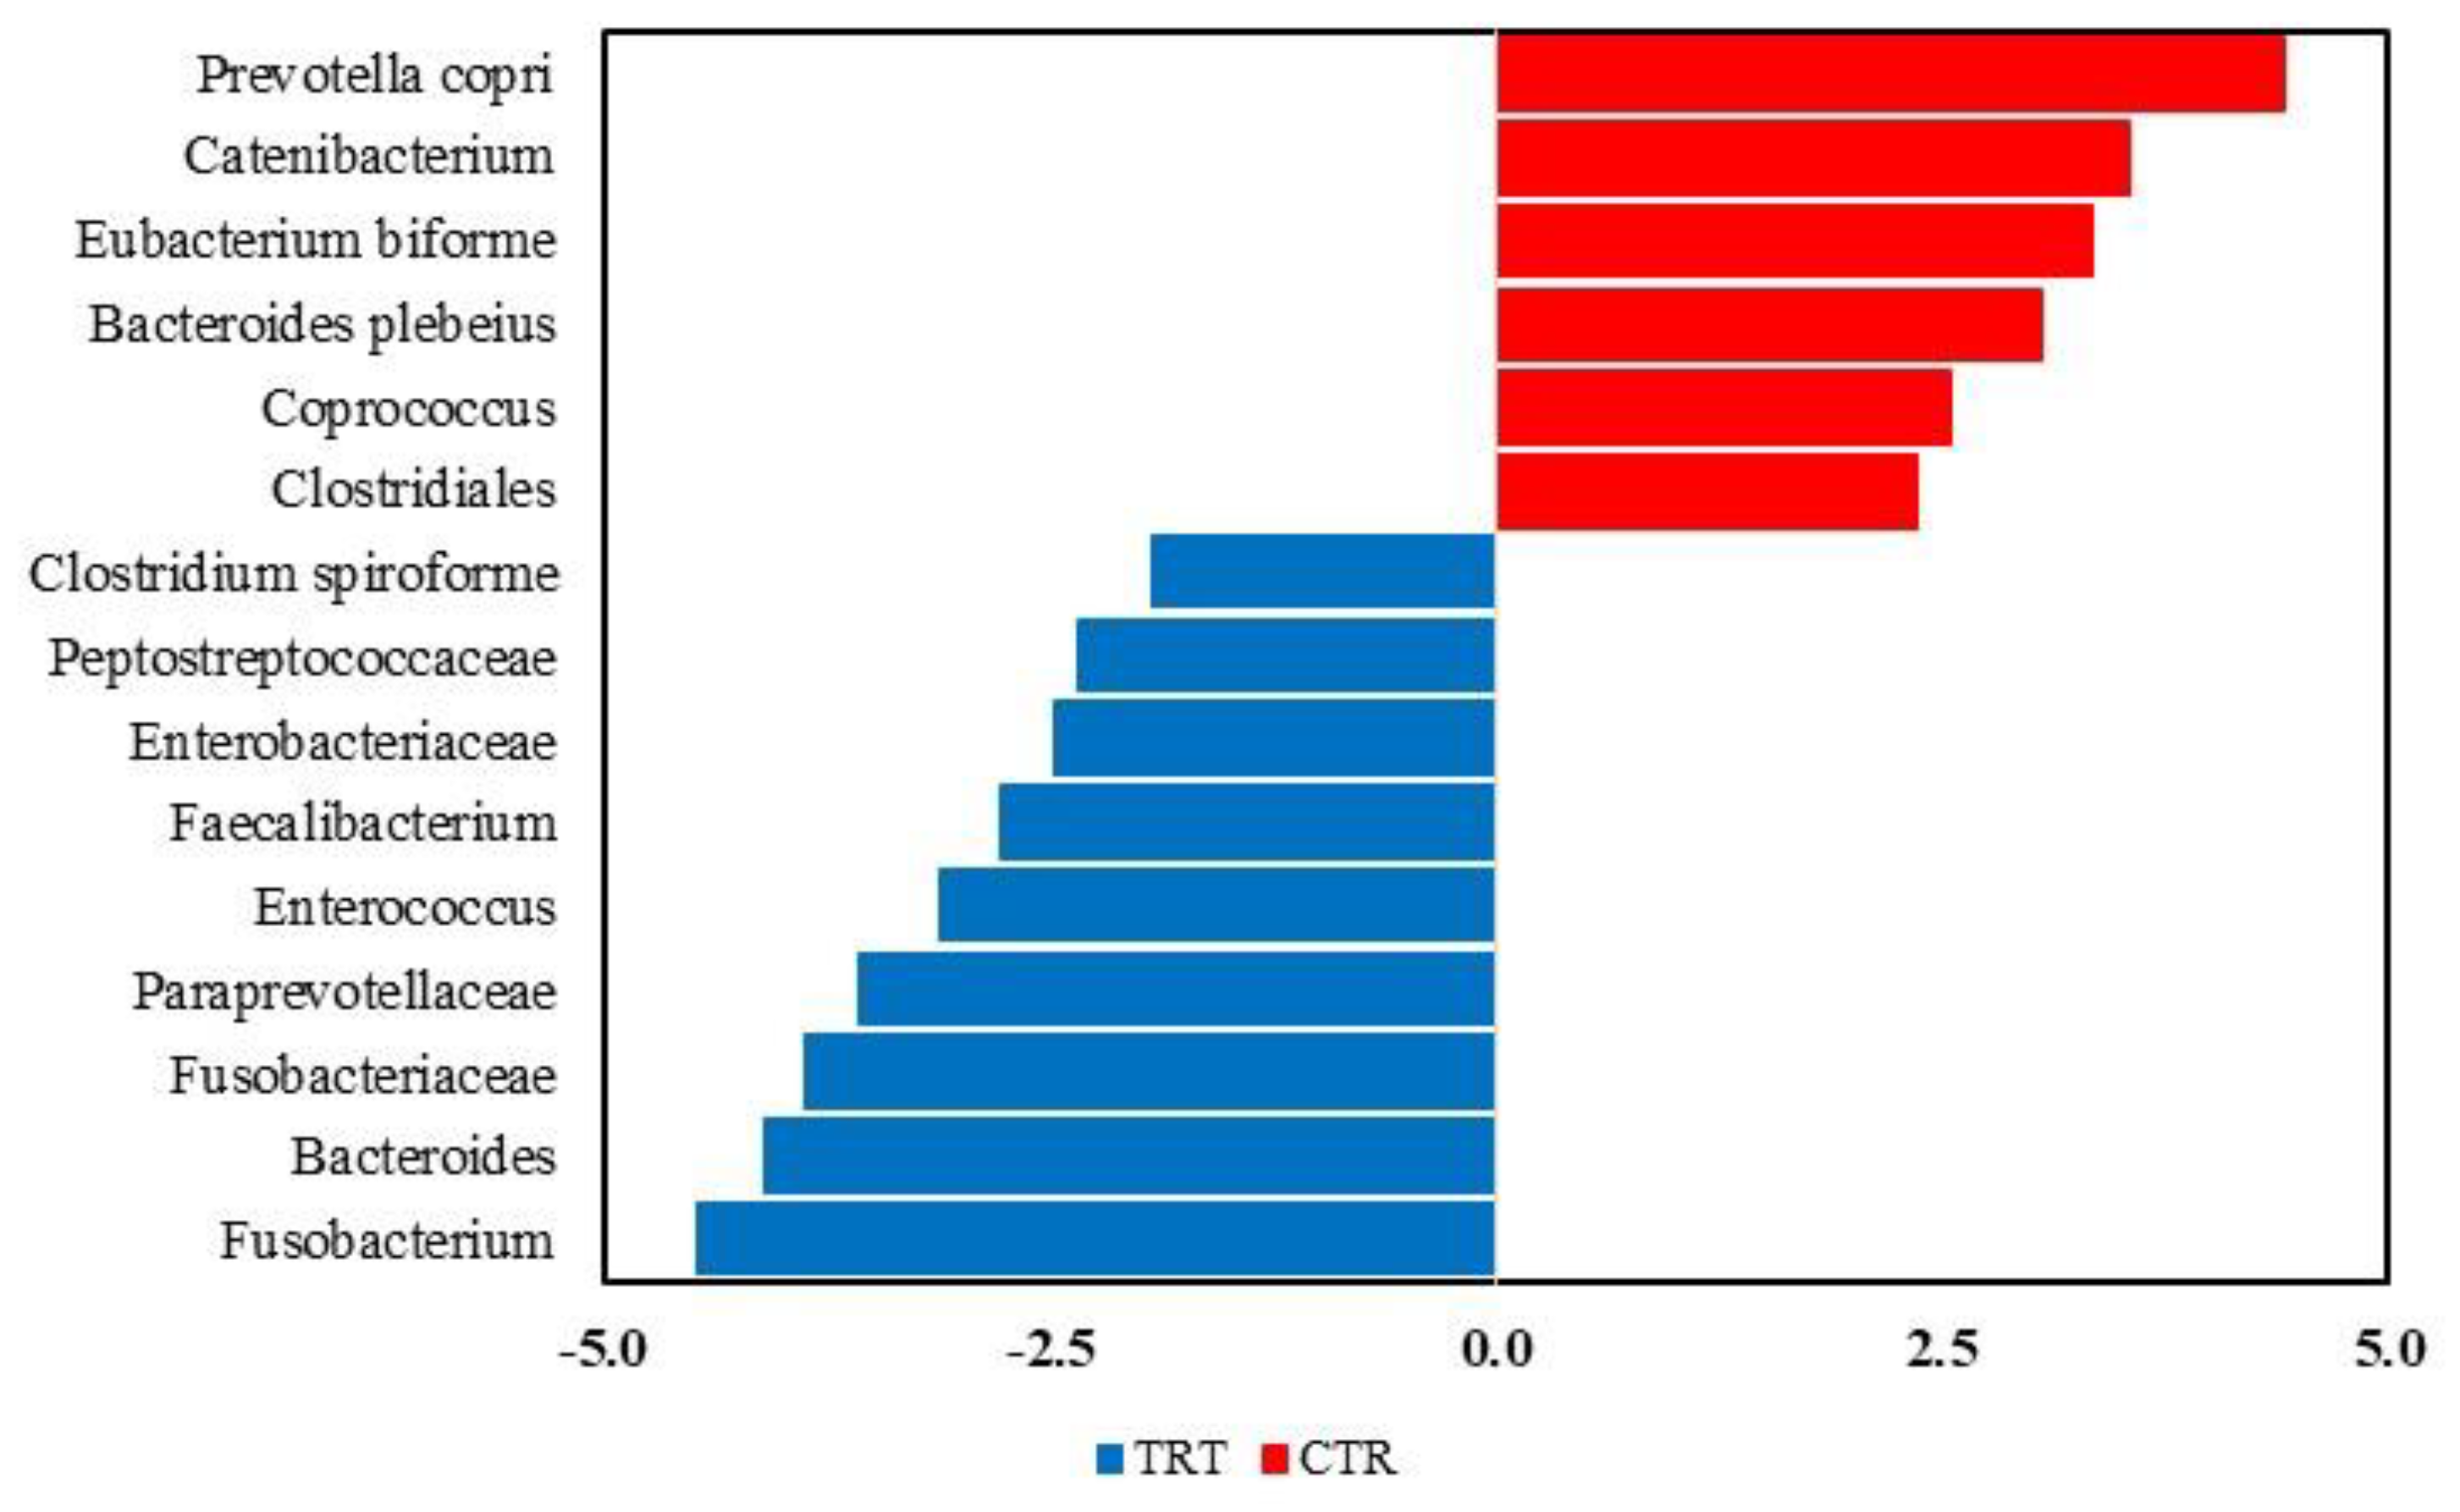
Figure 5.
Taxa that significantly differed in the Linear Discriminant Analysis Effect Size (LEfSe) between the CTR and TRT diets during the sampling times. CTR group, dogs fed with PM diet (diet with poultry meal); TRT group, dogs fed with HFM diet (diet with hydrolyzed feather meal). Times of sampling: T0, T03, T07, T15 and T45 denote samples collected at the beginning of the study and after 3, 7, 15 and 45 days.
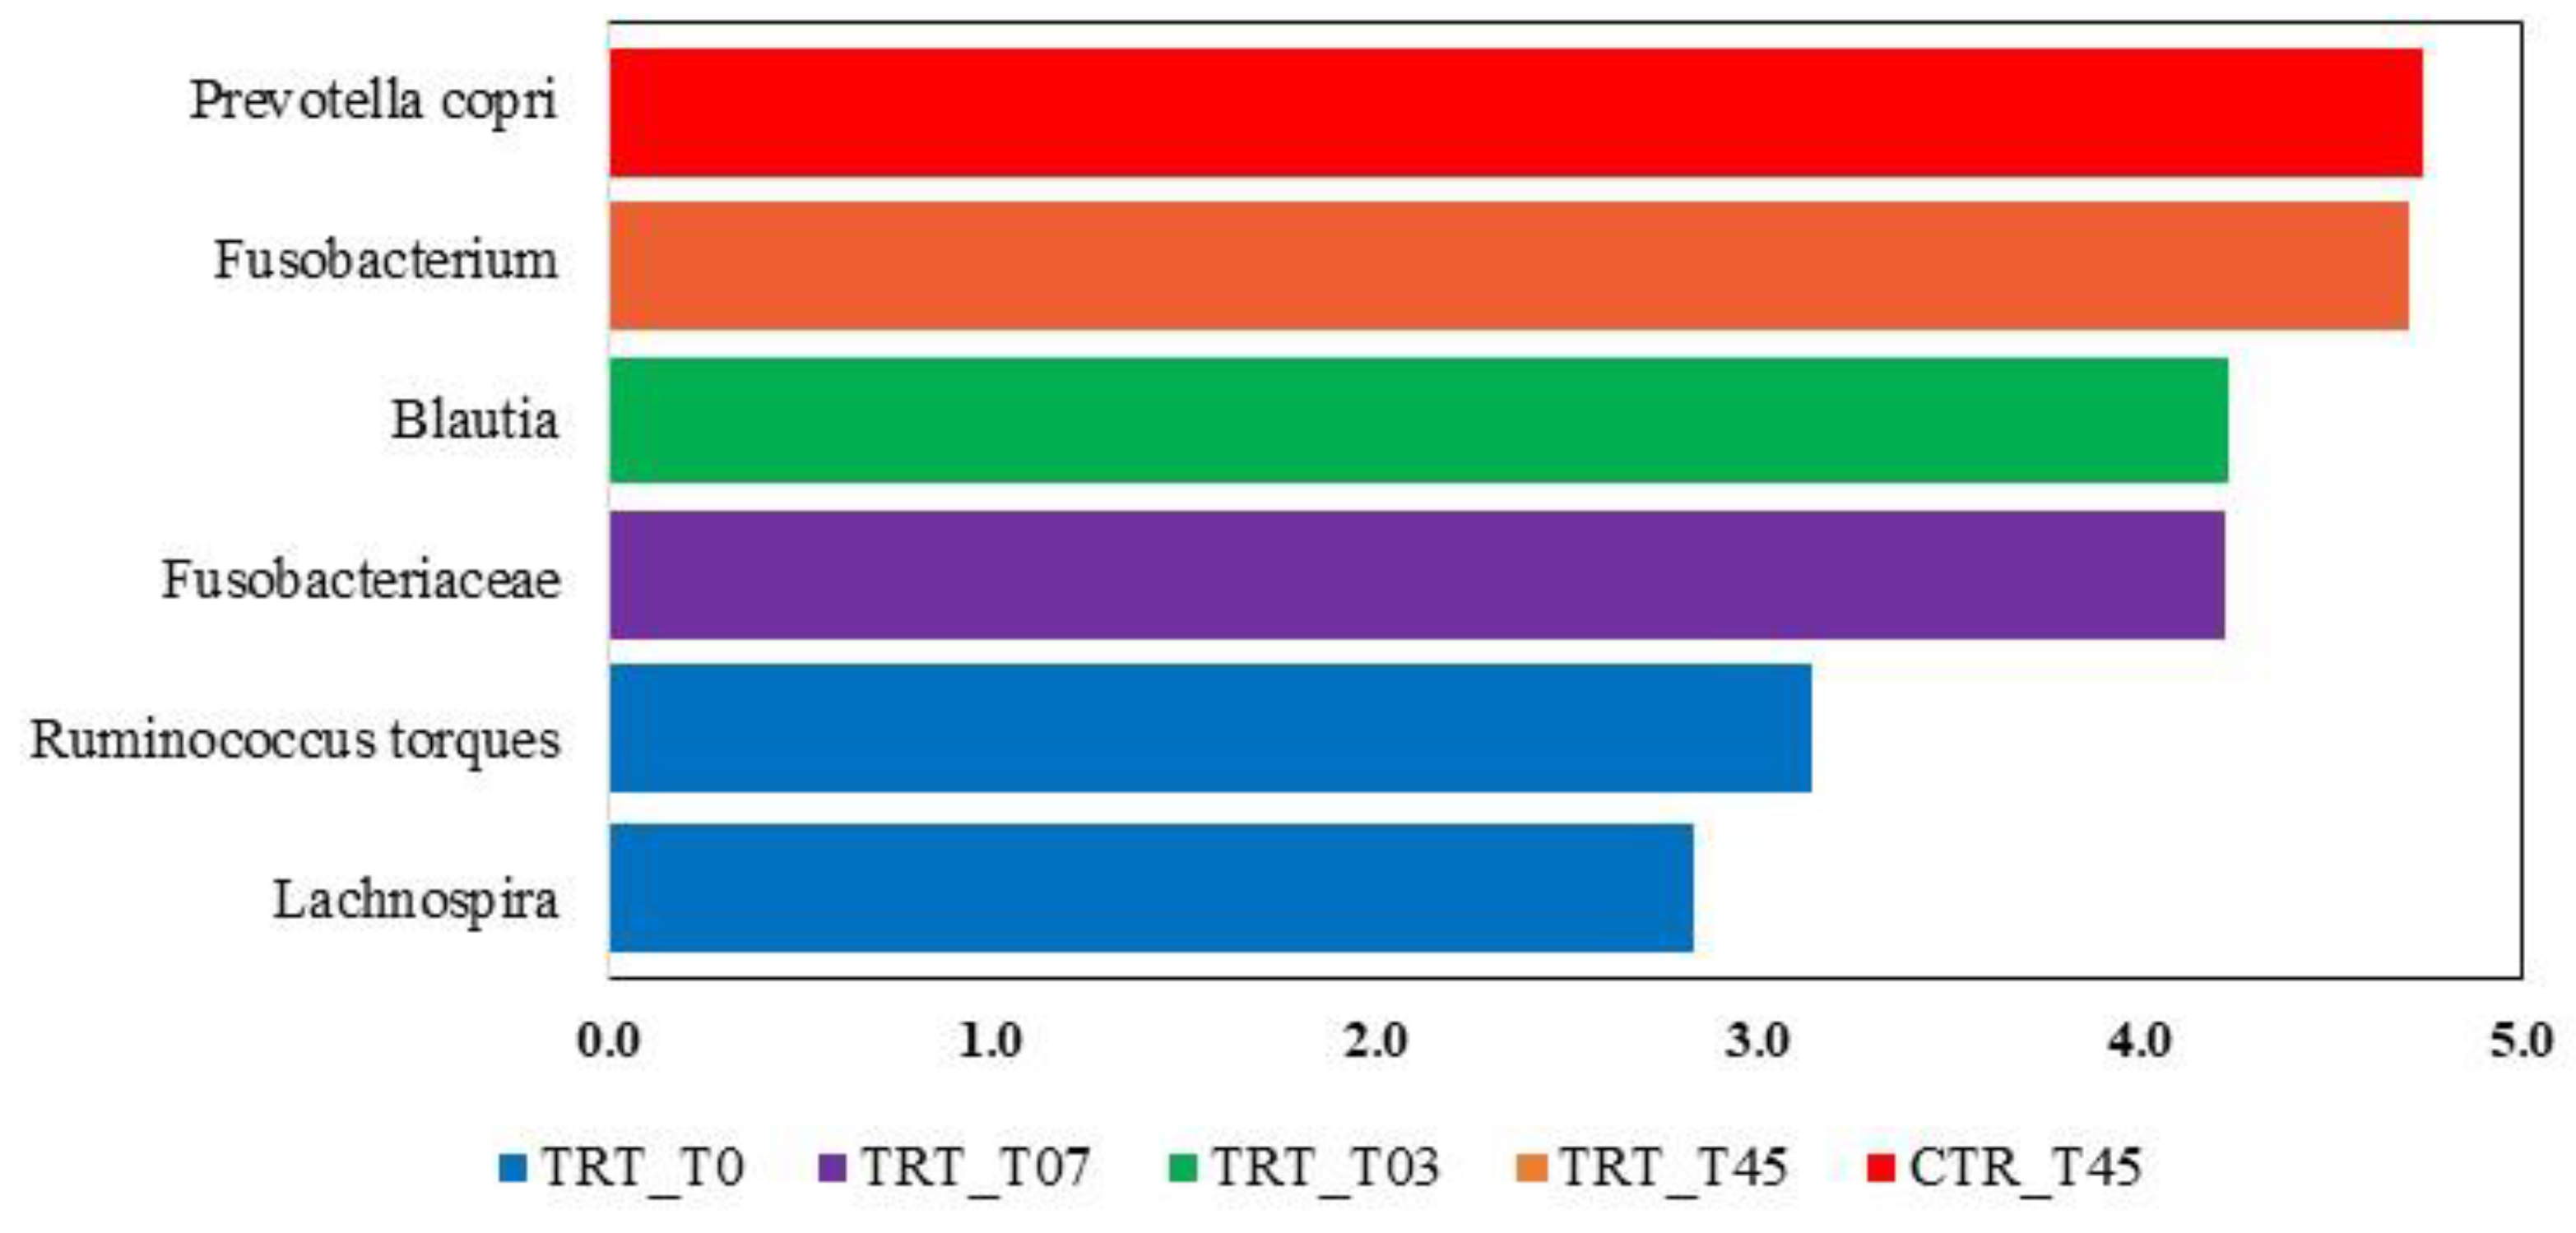
Figure 6.
Taxa that significantly differed in the Linear Discriminant Analysis Effect Size (LEfSe) between male and female dogs.
Figure 6.
Taxa that significantly differed in the Linear Discriminant Analysis Effect Size (LEfSe) between male and female dogs.
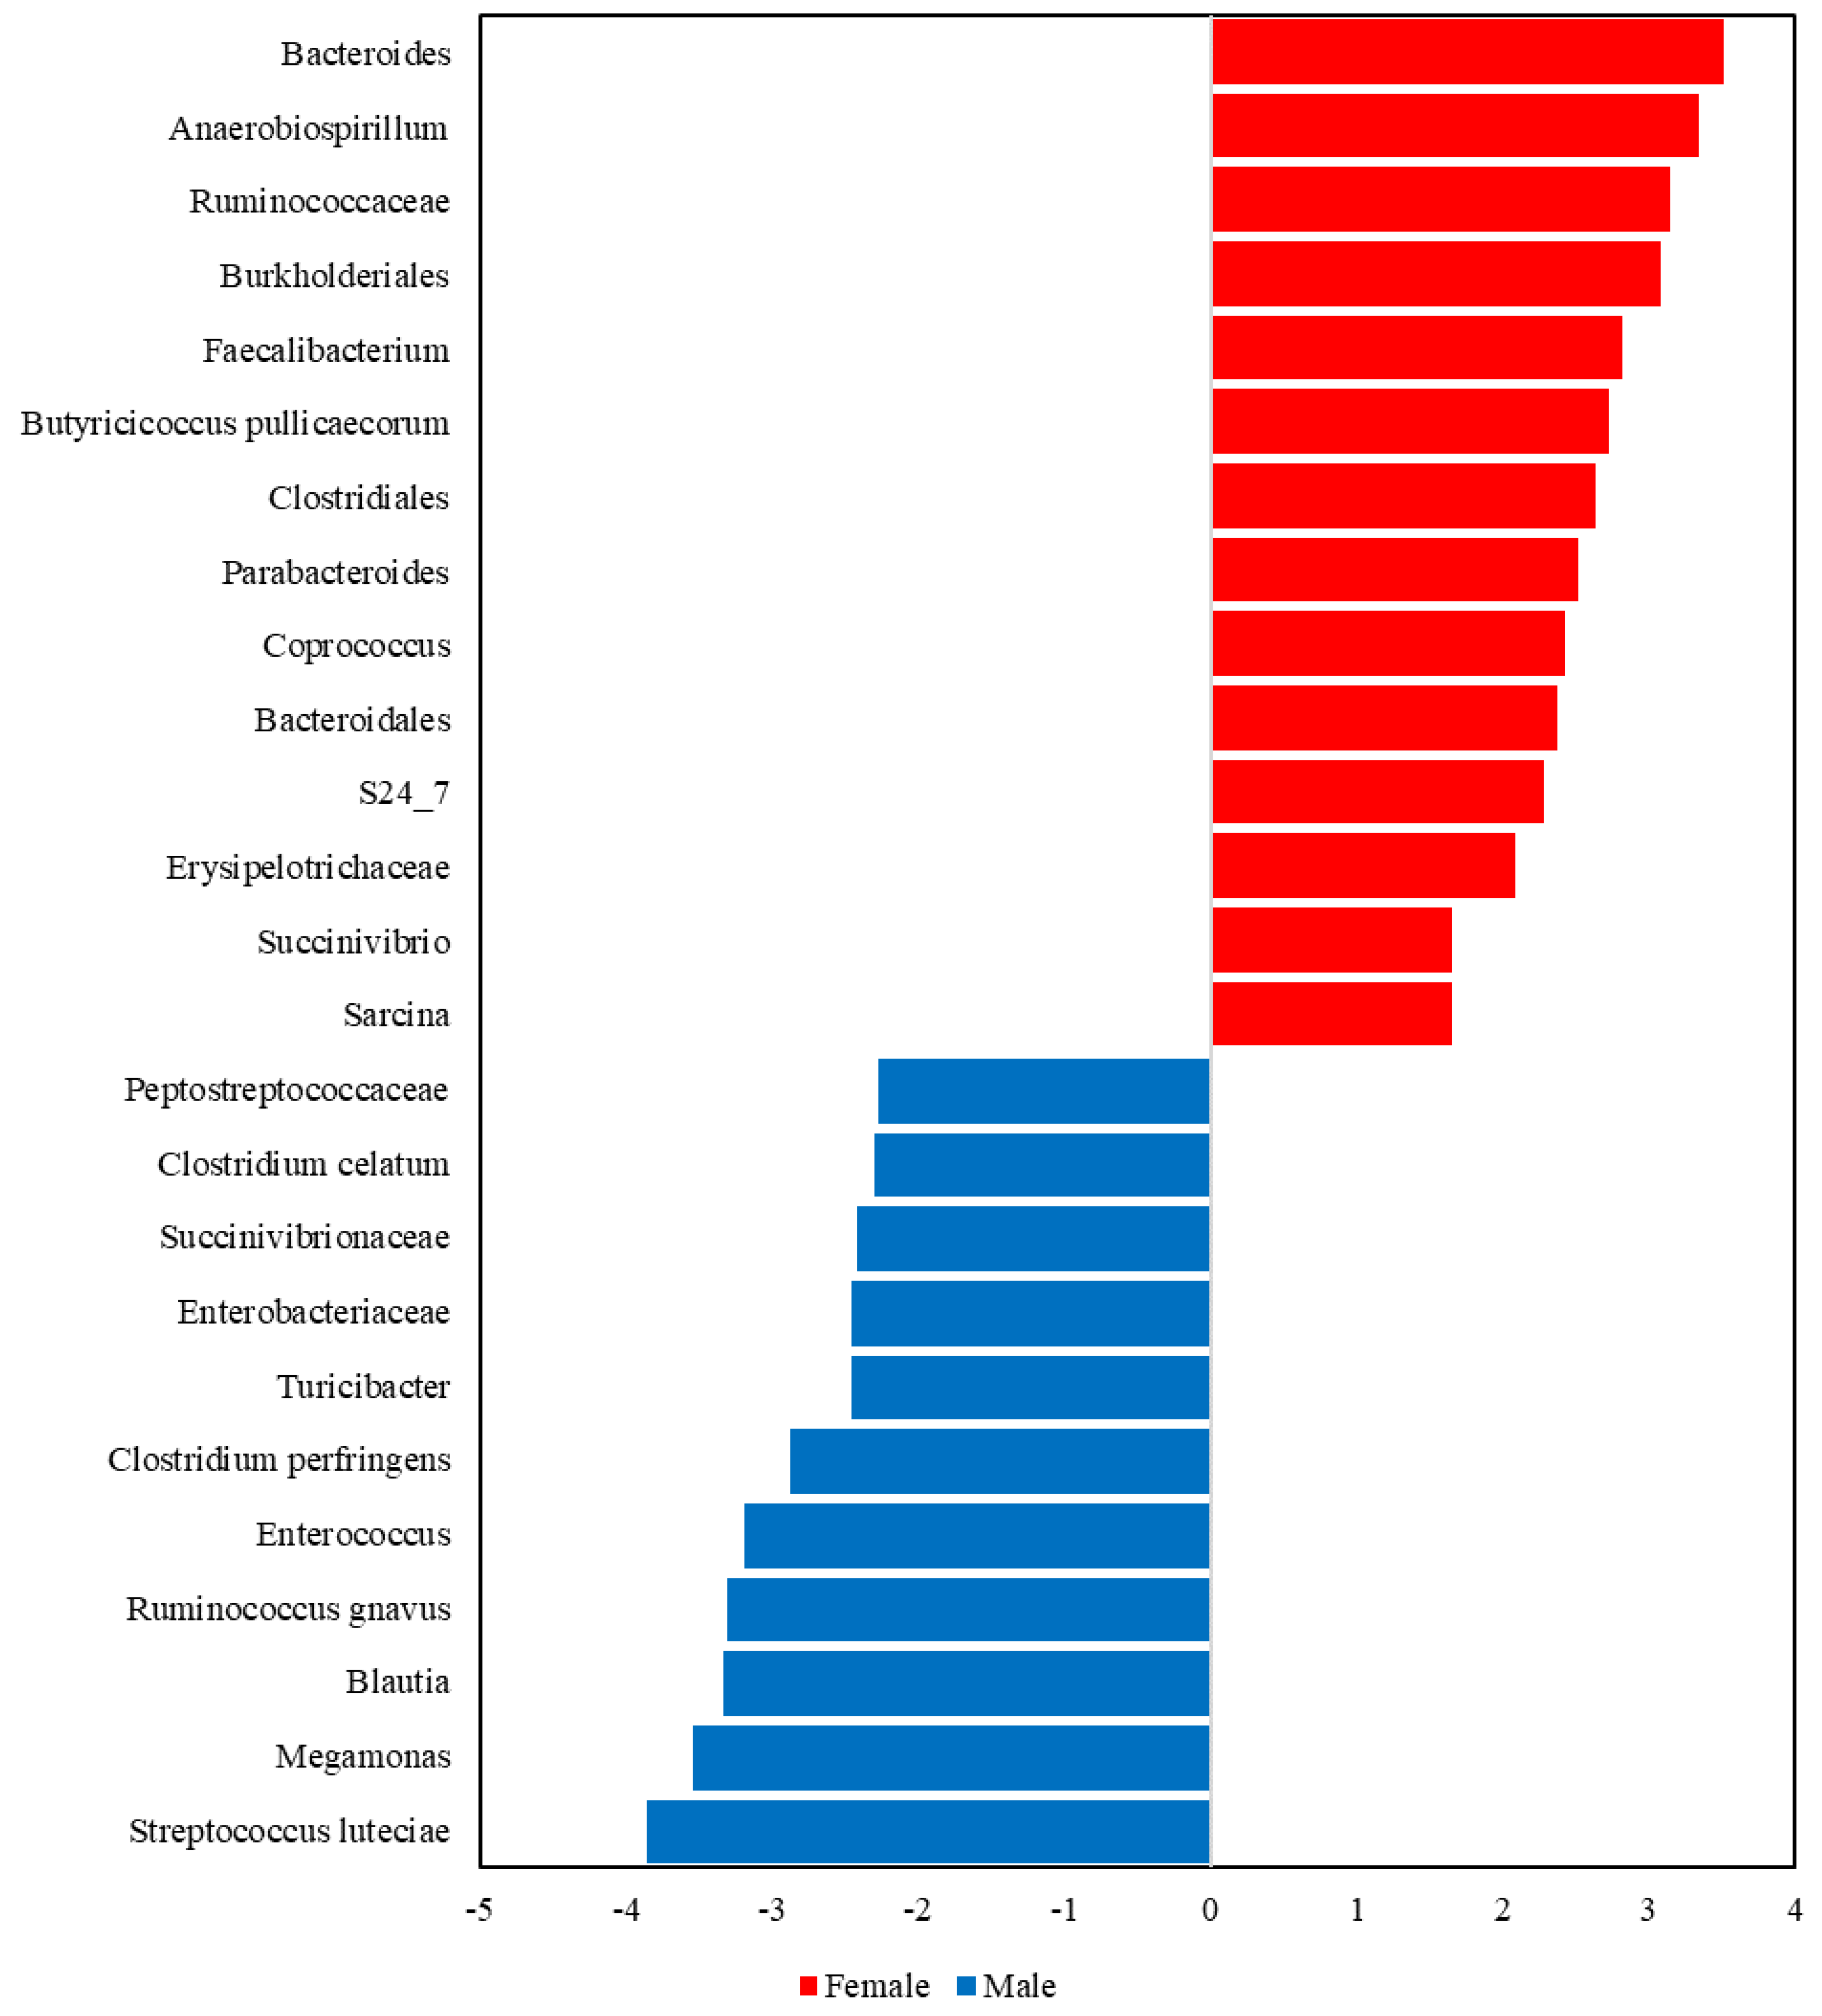

Table 1.
Mean values and standard deviation of body weight (BW), body condition score (BCS), muscle condition score (MCS) and fecal consistency score (FCS) of the dogs fed control diet (CTR) and experimental diet (TRT) at time of sampling 0, 3, 7, 15 and 45 days.
Table 1.
Mean values and standard deviation of body weight (BW), body condition score (BCS), muscle condition score (MCS) and fecal consistency score (FCS) of the dogs fed control diet (CTR) and experimental diet (TRT) at time of sampling 0, 3, 7, 15 and 45 days.
| BW | BCS | MCS | FCS | ||||||||
| Effects | Mean | SD | Mean | SD | Mean | SD | Mean | SD | |||
| Diet | |||||||||||
| CTR | 19.5 | 4.1 | 5.2 | 0.8 | 1.1 | 0.2 | 2.5 | 0.2 | |||
| TRT | 19.6 | 3.0 | 5.0 | 0.0 | 1.0 | 0.0 | 2.3 | 0.3 | |||
| Sex | |||||||||||
| Male | 16.6B | 1.1 | 5.0 | 0.0 | 1.0 | 0.0 | 2.4 | 0.2 | |||
| Female | 22.6A | 2.5 | 5.2 | 0.8 | 1.1 | 0.2 | 2.4 | 0.3 | |||
| Diet x Time of sampling | |||||||||||
| CTR_T0 | 19.3 | 4.6 | 5.0 | 0.8 | 1.0 | 0.0 | 2.4a | 0.4 | |||
| CTR_T3 | 19.4 | 4.6 | 5.0 | 0.8 | 1.0 | 0.0 | 2.5a | 0.2 | |||
| CTR_T7 | 19.6 | 4.7 | 5.5 | 1.0 | 1.0 | 0.0 | 2.5a | 0.2 | |||
| CTR_T15 | 19.8 | 4.7 | 5.5 | 1.0 | 1.0 | 0.0 | 2.5a | 0.3 | |||
| CTR_T45 | 19.6 | 4.6 | 5.0 | 0.8 | 1.3 | 0.5 | 2.4a | 0.2 | |||
| TRT_T0 | 19.4 | 3.4 | 5.0 | 0.0 | 1.0 | 0.0 | 2.2b | 0.3 | |||
| TRT_T3 | 19.5 | 3.3 | 5.0 | 0.0 | 1.0 | 0.0 | 2.4a | 0.2 | |||
| TRT_T7 | 19.6 | 3.5 | 5.0 | 0.0 | 1.0 | 0.0 | 2.2b | 0.3 | |||
| TRT_T15 | 19.9 | 3.5 | 5.0 | 0.0 | 1.0 | 0.0 | 2.2b | 0.3 | |||
| TRT_T45 | 19.7 | 3.4 | 5.0 | 0.0 | 1.0 | 0.0 | 2.4a | 0.2 | |||
SD: Standard Deviation, Diet: CTR group, dogs fed with PM diet (diet with poultry meal); TRT group, dogs fed with HFM diet (diet with hydrolyzed feather meal). Times of sampling: T0, T3, T7, T15 and T45 denote samples collected at the beginning of the study and after 3, 7, 15 and 45 days. Within a column, values followed by different upper-case letters are significantly different at P < 0.01, values followed by lower-case letters are significantly different at P < 0.05.
Disclaimer/Publisher’s Note: The statements, opinions and data contained in all publications are solely those of the individual author(s) and contributor(s) and not of MDPI and/or the editor(s). MDPI and/or the editor(s) disclaim responsibility for any injury to people or property resulting from any ideas, methods, instructions or products referred to in the content. |
© 2024 by the authors. Licensee MDPI, Basel, Switzerland. This article is an open access article distributed under the terms and conditions of the Creative Commons Attribution (CC BY) license (http://creativecommons.org/licenses/by/4.0/).
Copyright: This open access article is published under a Creative Commons CC BY 4.0 license, which permit the free download, distribution, and reuse, provided that the author and preprint are cited in any reuse.


