
Submitted:
27 May 2025
Posted:
27 May 2025
You are already at the latest version
Abstract
In the Architecture, Engineering, and Construction (AEC) industry, traditional labor efficiency evaluation methods have limitations, while computer vision technology shows great potential. This study aims to develop an automated construction efficiency evaluation method. We propose a method that integrates keypoint processing and extraction using the BlazePose model from MediaPipe, action classification with a Long Short - Term Memory (LSTM) network, and construction object recognition with the YOLO algorithm. A new model framework for action recognition and work hour statistics is introduced, and a specific construction scene dataset is developed. Experiments show that the worker action recognition accuracy can reach 82.23%, and the average accuracy of the classification model based on the confusion matrix is 81.67%. This research makes contributions in terms of innovative methodology, a new model framework, and a comprehensive dataset, which has practical implications for enhancing construction efficiency, saving costs, and providing decision - support. However, it also has limitations such as dependence on well - lit environments and high computational requirements. Future research should focus on addressing these limitations.
Keywords:
Computer vision
; Action recognition
; BlazePose
; LSTM networks
; Construction efficiency
1. Introduction
The introduction should briefly place the study in a broad context and highlight why it is important. It should define the purpose of the work and its significance. The current state of the research field should be carefully reviewed and key publications cited. Please highlight controversial and diverging hypotheses when necessary. Finally, briefly mention the main aim of the work and highlight the principal conclusions. As far as possible, please keep the introduction comprehensible to scientists outside your particular field of research. References should be numbered in order of appearance and indicated by a numeral or numerals in square brackets—e.g., [1] or [2,3], or [4,5,6]. See the end of the document for further details on references.The Architecture, Engineering, and Construction (AEC) industry is one of the largest industry in the world, with an annual budget of $10 trillion, accounting for approximately 13% of global GDP[1,2,3]. Over the past few decades, the AEC industry has significantly lagged behind other industry in terms of productivity[4,5,6,7]. Despite substantial investments in new technologies, which have enhanced the efficiency of design, planning, and construction, the industry still faces numerous severe challenges. These challenges include increasing project complexity, tight deadlines, cost control pressures, and the critical tasks of ensuring safety and quality[8,9,10,11]. As a labor-intensive industry, labor efficiency is crucial to the success or failure of construction projects. Workers' behavior directly impacts the progress and cost of a project[12,13]. Therefore, accurately monitoring workers' work status is essential, as it allows construction managers to access real-time information about workers' conditions and adjust their strategies accordingly. This has become a key factor in driving construction project performance.
To monitor the labor status of workers on construction sites effectively, a more automated efficiency evaluation method must be adopted. This will help with real-time monitoring and analysis of construction sites, addressing potential issues through timely labor force recognition[14]. The inefficiency of traditional methods stems from the lack of systematic and automated monitoring tools[15]. Manual recording of construction progress data encounters discrepancies between recorded and actual progress, hindering accurate efficiency evaluation and problem prediction. Additionally, the commonly used work sampling technique, which observes only a single worker, leads to inefficiency and[16] .
Computer vision technology demonstrates great potential in automatic monitoring and evaluation of construction activities. By utilizing advanced video processing algorithms and machine learning models, relevant worker actions can be automatically identified from construction site videos. This makes construction labor efficiency evaluation more objective and accurate. However, current labor recognition in the construction industry largely focuses on basic actions like walking and standing, with professional action recognition mostly carried out in laboratory settings. This study aims to develop a system that utilizes action recognition to address the issue of construction labor efficiency monitoring. The system is applicable to various construction scenarios, providing continuous and comprehensive monitoring, improving information collection efficiency, ensuring timely identification and resolution of on-site problems, and ultimately meeting the needs of future unmanned construction.
Given the substantial potential of computer vision technology in automated construction monitoring and real-time evaluation, this study leverages this method to address the limitations of traditional methods. By utilizing advanced video processing algorithms and machine learning models, we aim to enhance the objectivity and accuracy of construction efficiency evaluation. The main contributions of this study are as follows:
1.Innovative Method: We propose an automated efficiency evaluation method suitable for various construction scenarios, significantly reducing reliance on manual monitoring, thus improving the accuracy and reliability of construction activity assessments. This method emphasizes both breadth and completeness.
2.New Model: This study introduces a new model framework for action recognition and work hour statistics. By utilizing state-of-the-art computer vision technology, the model can more accurately track and analyze worker activities in real-time.
3.New Dataset: We have developed and utilized a specific construction scene dataset that captures worker activities and scenarios in a particular trade, which was used to validate the applicability of our method.
The structure of this paper is divided into four parts. First, the introduction and related work section outlines the background and motivation for the study. Next, the methodology and validation sections describe the methodology used and verify the feasibility of the approach through the use of a single construction scenario. Finally, the results and discussion sections analyze the experimental data and research findings, summarize the main content of the paper, and offer prospects for future research directions.
2. Related Work
In the construction industry, traditional labor efficiency evaluation methods typically rely on manual recording and work sampling. However, with the development of modern technologies, especially the application of computer-based methods, the accuracy and efficiency of evaluations have been significantly improved. This section will explore the main methods currently used for labor efficiency evaluation in the construction industry, with a focus on analyzing the limitations of traditional methods, the shortcomings of current methods, and providing the fundamental principles for selecting computer vision models and activity recognition models.
2.1. Labor Efficiency Evaluation in Construction
In construction labor assessment, work sampling, as a method with stable probabilities, has been widely used for decades[1,17,18]. However, in the current context of the construction industry, where precise efficiency evaluation is required, this method is no longer applicable[19,20]. The method involves randomly sampling to record work time and non-work time, thereby inferring the overall work efficiency during a given time period. The advantages of work sampling include low cost and no need for continuous monitoring[9,21,22]. However, its accuracy is severely affected by sample size and sampling frequency. Additionally, work sampling is also a time-consuming method, as it typically requires long periods of personnel deployment at construction sites. As a result, work sampling is a labor-intensive task that requires several people to be present at the site to collect data[23,24,25]. This leads to the subjectivity of the observers potentially having a significant impact on the results, as different observers may classify the same instance differently.
Currently, automated methods can address the issues of frequent data sampling and labor intensity. However, most of them merely classify the types of labor performed by construction workers to measure their productivity[12,20,26]. For example, Luo et al. captured the working state of workers through surveillance videos, helping managers accurately quantify and measure labor productivity[15,16,27]. They classified workers' activities into three modes: productive, semi-productive, and non-productive. Observers recorded the results by inputting them under the observed activity. Finally, all input results were summed to calculate the percentage of activities in each mode, representing productivity. Emil L et al., on the other hand, classified the productivity indicators of construction site workers[28]. This method uses a combination of CNN and LSTM to classify multivariate time-series data collected from five inertial measurement units installed on workers, without any manual feature engineering. In this study, the indicators are overall work sampling metrics: direct work, indirect work, and waste. Unlike most other research focusing on computer vision, this study uses motion sensors and collected 3D acceleration and angular velocity data instead of videos or photos, thereby eliminating the main limitation of computer vision, which is occlusion[28,29,30,31]. This allows the system to monitor from the start to the end of the project[8]. Reza Akhavian et al. used smartphone sensors as data collectors, using the collected data as input for machine learning classification algorithms to detect and distinguish various types of human activities[1,32]. While this research uses the worker's idle/busy state to provide the necessary information for productivity analysis, it further advances this information by extracting more specific and accurate knowledge about different activities performed by construction workers[11,33]. For example, in their experiment, they categorized the actions of loading a wheelbarrow into Loading, Pushing, Unloading, Returning, and Idling actions.
In conclusion, current labor monitoring methods require data collection for action recognition to infer productivity indicators. During the action recognition phase, detailed action classification of workers not only provides productivity inference information but also assists in further improvements in safety and ergonomics analysis for future construction worker activity recognition systems.
2.2. Recognition of Construction Worker Activities by Computer Vision
In the construction field, accurately identifying worker activities is crucial for improving construction efficiency, ensuring worker safety, and optimizing project management[3,34,35,36]. With continuous technological advancements, activity recognition methods have also been evolving.
In the early days, activity recognition in the construction field primarily relied on the combination of sensors and machine learning[27,30,37,38]. IoT-based systems began focusing on target objects equipped with electronic sensors, analyzing their activity states through information from mobile sensors such as accelerometers, gyroscopes, and GPS[3]. For example, in the early 2000s, Akhavian et al. successfully identified earthmoving equipment activities using mobile sensors and machine learning classifiers[1,32,39]. Simultaneously, the direct angle measurement system with an electric angular instrument could accurately measure node angles on construction sites, exhibiting high resolution and accuracy around 2005[40]. However, its limitation lies in its ability to measure only two-dimensional motion and its cumbersome operation. The indirect angle measurement system uses image-based systems (e.g., depth sensors and stereo cameras) or inertial measurement units (IMU) to track human movement. In the early 21st century, depth sensors like Kinect™ cameras became widely used for tracking workers' body movements, with applications ranging from activity classification to biomechanics evaluation and safety assessment[41,42,43,44]. Furthermore, around 2010, IMUs were used for full-body tracking and classifying construction activities. For instance, Joshua and Varghese, in 2010, used a wired accelerometer installed at the waist of a mason, combined with machine learning algorithms, to classify three types of masonry activities with an accuracy of 80%[44]. In 2016, Ryu et al. used wristbands equipped with accelerometers for activity classification in masonry work, achieving over 97% accuracy using a multi-layer perceptron neural network[45].
With technological advancements, computer vision technology has become increasingly important in construction worker activity recognition. The first convolutional neural network (CNN) models began to emerge in the construction field, primarily based on region-based CNNs for detecting construction workers and equipment from RGB data and identifying unsafe activities or objects[46,47]. However, this method had limitations as it only processed video frames or images individually, failing to establish connections between objects in preceding and subsequent frames. For example, around 2015, Fang et al. used a region-based CNN to detect construction workers and equipment from RGB data. Subsequently, the YOLO (You Only Look Once) algorithm was introduced into the construction field[36]. As a real-time object detection system, YOLO can quickly detect and classify multiple objects. In the construction scene, YOLO was used to identify and classify tools and materials, providing strong support for a comprehensive understanding of the construction environment. For example, in 2017, Zhang et al. proposed a real-time deep learning method for detecting bridge deck cracks based on the YOLO algorithm for detecting objects in construction scenes[8,48]. The BlazePose model in the Mediapipe library performs excellently in keypoint processing and extraction. It can detect 33 key points on the human body in images and video streams, including 2D coordinates and relative depth information. Combined with a multi-object tracking algorithm framework, using bounding box information, motion information, and appearance information, workers can be tracked to provide key data for analyzing construction activities. For example, in 2020, Roberts et al. used keypoint extraction algorithms like Alphapose for pose estimation and used 3D convolutions to process both two-stream and keypoint information. Although this method becomes computationally intensive with an increase in work thread numbers, keypoint extraction methods have been proven effective for activity recognition tasks[49,50,51].
The advent of depth cameras has brought new opportunities for activity recognition in the construction field. Various types of depth cameras, such as structured light depth cameras, stereo depth cameras, and time-of-flight (ToF) depth cameras, have been applied to the construction field to generate distance images or 3D point clouds. For example, Kinect V1, a typical structured light depth camera, uses infrared light patterns to estimate depth and was applied to estimate the joint position trajectories of construction workers around 2010[3]. Stereo depth cameras, simulating the human binocular vision system to perceive depth, were used in 2018 in a study that developed a stereo depth camera using two ordinary smartphones to estimate 3D poses. Kinect V2, which includes a ToF camera, uses infrared light for 3D pose collection to detect unsafe behaviors, with applications starting around 2015[3,6,34,52,53,54,55]. Additionally, LiDAR sensors and radar sensors, also ToF depth cameras, have been used to recognize human poses or estimate human poses based on 3D point clouds[20,35,56,57,58].
Activity recognition in the construction field involves analyzing and determining workers' actions, postures, interactions with objects, and group activities to identify the specific activity state of workers on the construction site. Algorithms are the specific methods and techniques for achieving activity recognition, with different algorithms having unique characteristics and applicable scenarios. For instance, CNN is used for feature extraction and classification of images to detect construction workers and equipment, YOLO can quickly and accurately identify tools and materials in construction scenes, and LSTM (Long Short-Term Memory) is suitable for processing time-series data, enabling accurate action classification by analyzing the temporal features of worker movements[29]. Frameworks are software platforms that integrate multiple algorithms and tools to provide a complete solution for activity recognition. Mediapipe, for example, is a powerful framework designed for computer vision tasks, integrating multiple advanced deep learning models and algorithms, such as BlazePose for human pose estimation and keypoint processing, performing well in activity recognition in the construction field, providing efficient computation and processing capabilities, and meeting real-time requirements in construction sites[51]. In addition, Mediapipe is easy to use and integrate, providing rich interfaces and tools for rapid development and deployment, allowing developers to quickly integrate Mediapipe into existing construction management systems for real-time monitoring and analysis of worker activities.
The advantages of choosing monitoring for recognition lie in its real-time nature, simplicity, and non-invasiveness. Widely distributed surveillance cameras on construction sites can capture real-time images and videos, providing a rich data source for activity recognition, enabling real-time activity recognition and monitoring. It is easy to install and use, and does not interfere with the workers' normal activities[30,59,60]. Compared to contact-based sensors, monitoring systems are non-invasive, and workers do not need to wear sensors or markers, avoiding discomfort and frustration caused by sensor usage, which makes it more acceptable to workers, enhancing the system's practicality and feasibility.
The basis for choosing the LSTM algorithm lies in its advantage in processing time-series data. In construction activity recognition, workers' movements are typically continuous time-series data, and LSTM can effectively learn and extract temporal features of movements, enabling accurate action classification. By inputting the time-series data of detected keypoints into the LSTM network, the system can capture the duration and dynamic changes of actions, providing a more detailed analysis of worker behavior. At the same time, compared with other machine learning models, LSTM can better utilize the temporal features in the video, where the results of the previous frame affect the next frame, allowing for more accurate action recognition[50]. The output of the LSTM network provides a probability distribution of possible actions, enabling accurate classification of worker actions and improving the accuracy of activity recognition.
The basis for choosing the Mediapipe framework lies in its powerful functionality and performance. Mediapipe is a powerful framework specifically designed for computer vision tasks, integrating various advanced deep learning models and algorithms. BlazePose, used for human pose estimation and keypoint processing, performs well in construction activity recognition, offering high performance and accuracy. It provides efficient computation and processing capabilities, quickly processing image and video data to meet the real-time demands of construction sites. Additionally, Mediapipe is easy to use and integrate, offering a rich set of interfaces and tools that allow developers to quickly develop and deploy solutions. Developers can easily integrate Mediapipe into existing construction management systems to enable real-time monitoring and analysis of worker activities[35]. The framework's ease of use lowers development costs and technical barriers, making it more accessible to construction companies looking to apply computer vision technology for activity recognition and management. Given that construction sites typically use RGB cameras instead of depth cameras, the BlazePose model in Mediapipe infers relative depth information from standard RGB camera data, providing a practical solution for construction site environments[35,61]. The multi-object tracking algorithm framework, combined with bounding box information, motion information, and appearance information, can effectively handle the complex environment of construction sites, tracking and analyzing multiple workers.
In summary, the activity recognition methods in the construction field have evolved from early sensor-based machine learning methods to later computer vision technologies, continually improving the accuracy and practicality of recognition. Monitoring, as a non-invasive activity recognition method, offers advantages such as real-time nature and simplicity. The choice of LSTM algorithm and Mediapipe framework for activity recognition has solid foundations, providing effective solutions for construction companies to improve construction management and ensure worker safety. With continuous technological advancements, activity recognition methods in the construction field will keep innovating and improving, contributing to the development of the construction industry.
2.3. Construction Scene Theory
Although the recognition of construction worker activities has provided significant help for automated labor statistics in the construction field, most studies focus only on statistical methods for construction worker actions, treating activity recognition results as the sole conclusion. These studies lack further development and utilization of the data. Moreover, most research is concentrated on single scenes or laboratory environments. In response to this, we introduce activity recognition in scene theory to assist in our analysis[62].
The concept of construction activity scenes comes from engineering practice and is a generalization of the real working state within a specific scope of the construction site. There are three main types of classification: the first type represents a generalization of a specific construction task (e.g., masonry work, rebar work), known as construction activity; the second focuses on a specific construction procedure (e.g., wall curing, bricklaying), referred to as direct construction work; and the third emphasizes actions driven by workers or machines, referred to as construction operations[62]. In this study, we primarily adopt the first classification to define construction activity scenes. Regardless of the classification level, the overall construction activity scene consists of multiple interconnected entities, relationships, and attributes, among other scene elements. In the intelligent era, a construction scene is defined as the totality of one or more physical objects, the relationships between these objects, and their attributes as contained in visual data related to construction operations. These scene elements, centered around the same construction activity and subject, include entities such as workers, equipment, and materials, relationships (e.g., cooperation or coexistence between entities), and attributes of the entities (e.g., color, quantity, shape)[15,16,38,63].
To determine the indicators related to construction productivity in a construction activity scene, it is necessary to deconstruct the ontology of the scene. Ontological decomposition specifically refers to the structural breakdown of content in visual data based on visually identifiable objects and clarifying the relevance of each visible object to the subject and the relationships between objects[62]. A construction activity scene must break down the scene elements related to construction production activities in the visual data into entities, relationships, and attributes according to unified rules. Combined with the relevant work mentioned in construction labor productivity, this process mainly involves pre-classifying workers based on attributes in the construction activity scene, and then analyzing the entities and their attributes to influence construction labor productivity.
In scene theory, activity recognition is an automated process aimed at matching the relationships between entities in visual data with predicted activity names. In construction management, it is primarily achieved by automatically analyzing the interactions or coexistence relationships between workers, construction tools, and operational objects in activity scenes. In existing scene analyses, the "workface" concept proposed by Luo et al. refers to a specific area where a worker performs a task[62]. This concept has limitations as it isolates workers from the broader context of the construction site. In contrast, Liu et al.'s "construction scene" method provides a more comprehensive perspective. This method analyzes video clips and extracts information from all elements in the scene, including entities, relationships, and attributes, thereby providing a more comprehensive view of the construction process and facilitating better management and efficiency assessment[15,16,27,64].
Furthermore, Liu et al.'s construction scene analysis solves the limitation of single-object tracking. By using advanced models capable of multi-object detection and tracking, the system can monitor the interactions between multiple workers and tools in the same scene. This ability is crucial for accurately capturing the complex work processes and collaborative efforts typical of construction sites[62]. By combining scene elements such as tools, machinery, and materials with worker activities, a more detailed and nuanced analysis can be conducted. For instance, understanding the relationship between tool availability and usage and worker activity efficiency can provide insights that cannot be obtained through single-object tracking alone. This holistic view helps identify bottlenecks, optimize resource allocation, and improve overall site management.
2.4. Summary of Literature
A comprehensive review of the existing literature reveals several key limitations in the current research on construction efficiency assessment and action recognition, which this study addresses through targeted improvements.
Firstly, traditional construction efficiency assessment methods, such as manual recording and work sampling, heavily rely on human observation and subjective judgment. These methods are not only labor-intensive and time-consuming but also prone to errors. The frequency and scope of manual monitoring are limited, which hinders comprehensive and timely data collection on construction sites. These limitations restrict the accuracy and efficiency of efficiency assessments. To address these challenges, this study proposes an automated construction efficiency evaluation method based on computer vision technology. This method provides a more comprehensive and accurate evaluation by integrating the recognition of worker actions, tools, equipment, and other relevant elements, surpassing the limitations of traditional methods.
Furthermore, current datasets for action recognition in the construction field are typically limited to specific types of activities or environments, lacking comprehensive data that captures the diversity of worker actions and construction site conditions. The lack of comprehensive datasets makes it difficult to develop models that can generalize across different construction environments. To fill this gap, this study develops a construction scene dataset specifically tailored to particular scenarios, encompassing unique worker activities, tools, and interactive scenes. This dataset enriches existing resources, making it more applicable to real-world applications.
Based on these improvements, the proposed method aims to enhance the understanding of construction productivity through an integrated process. This process begins with analyzing the tools in the hands of workers to determine their associated construction scene, followed by worker activity recognition. The recognition results are then integrated with actual outcomes to provide a comprehensive productivity analysis. This method not only optimizes the evaluation process but also offers deeper insights into the factors affecting construction efficiency, thus providing a more accurate and dynamic approach to construction productivity assessment.
3. Methodology
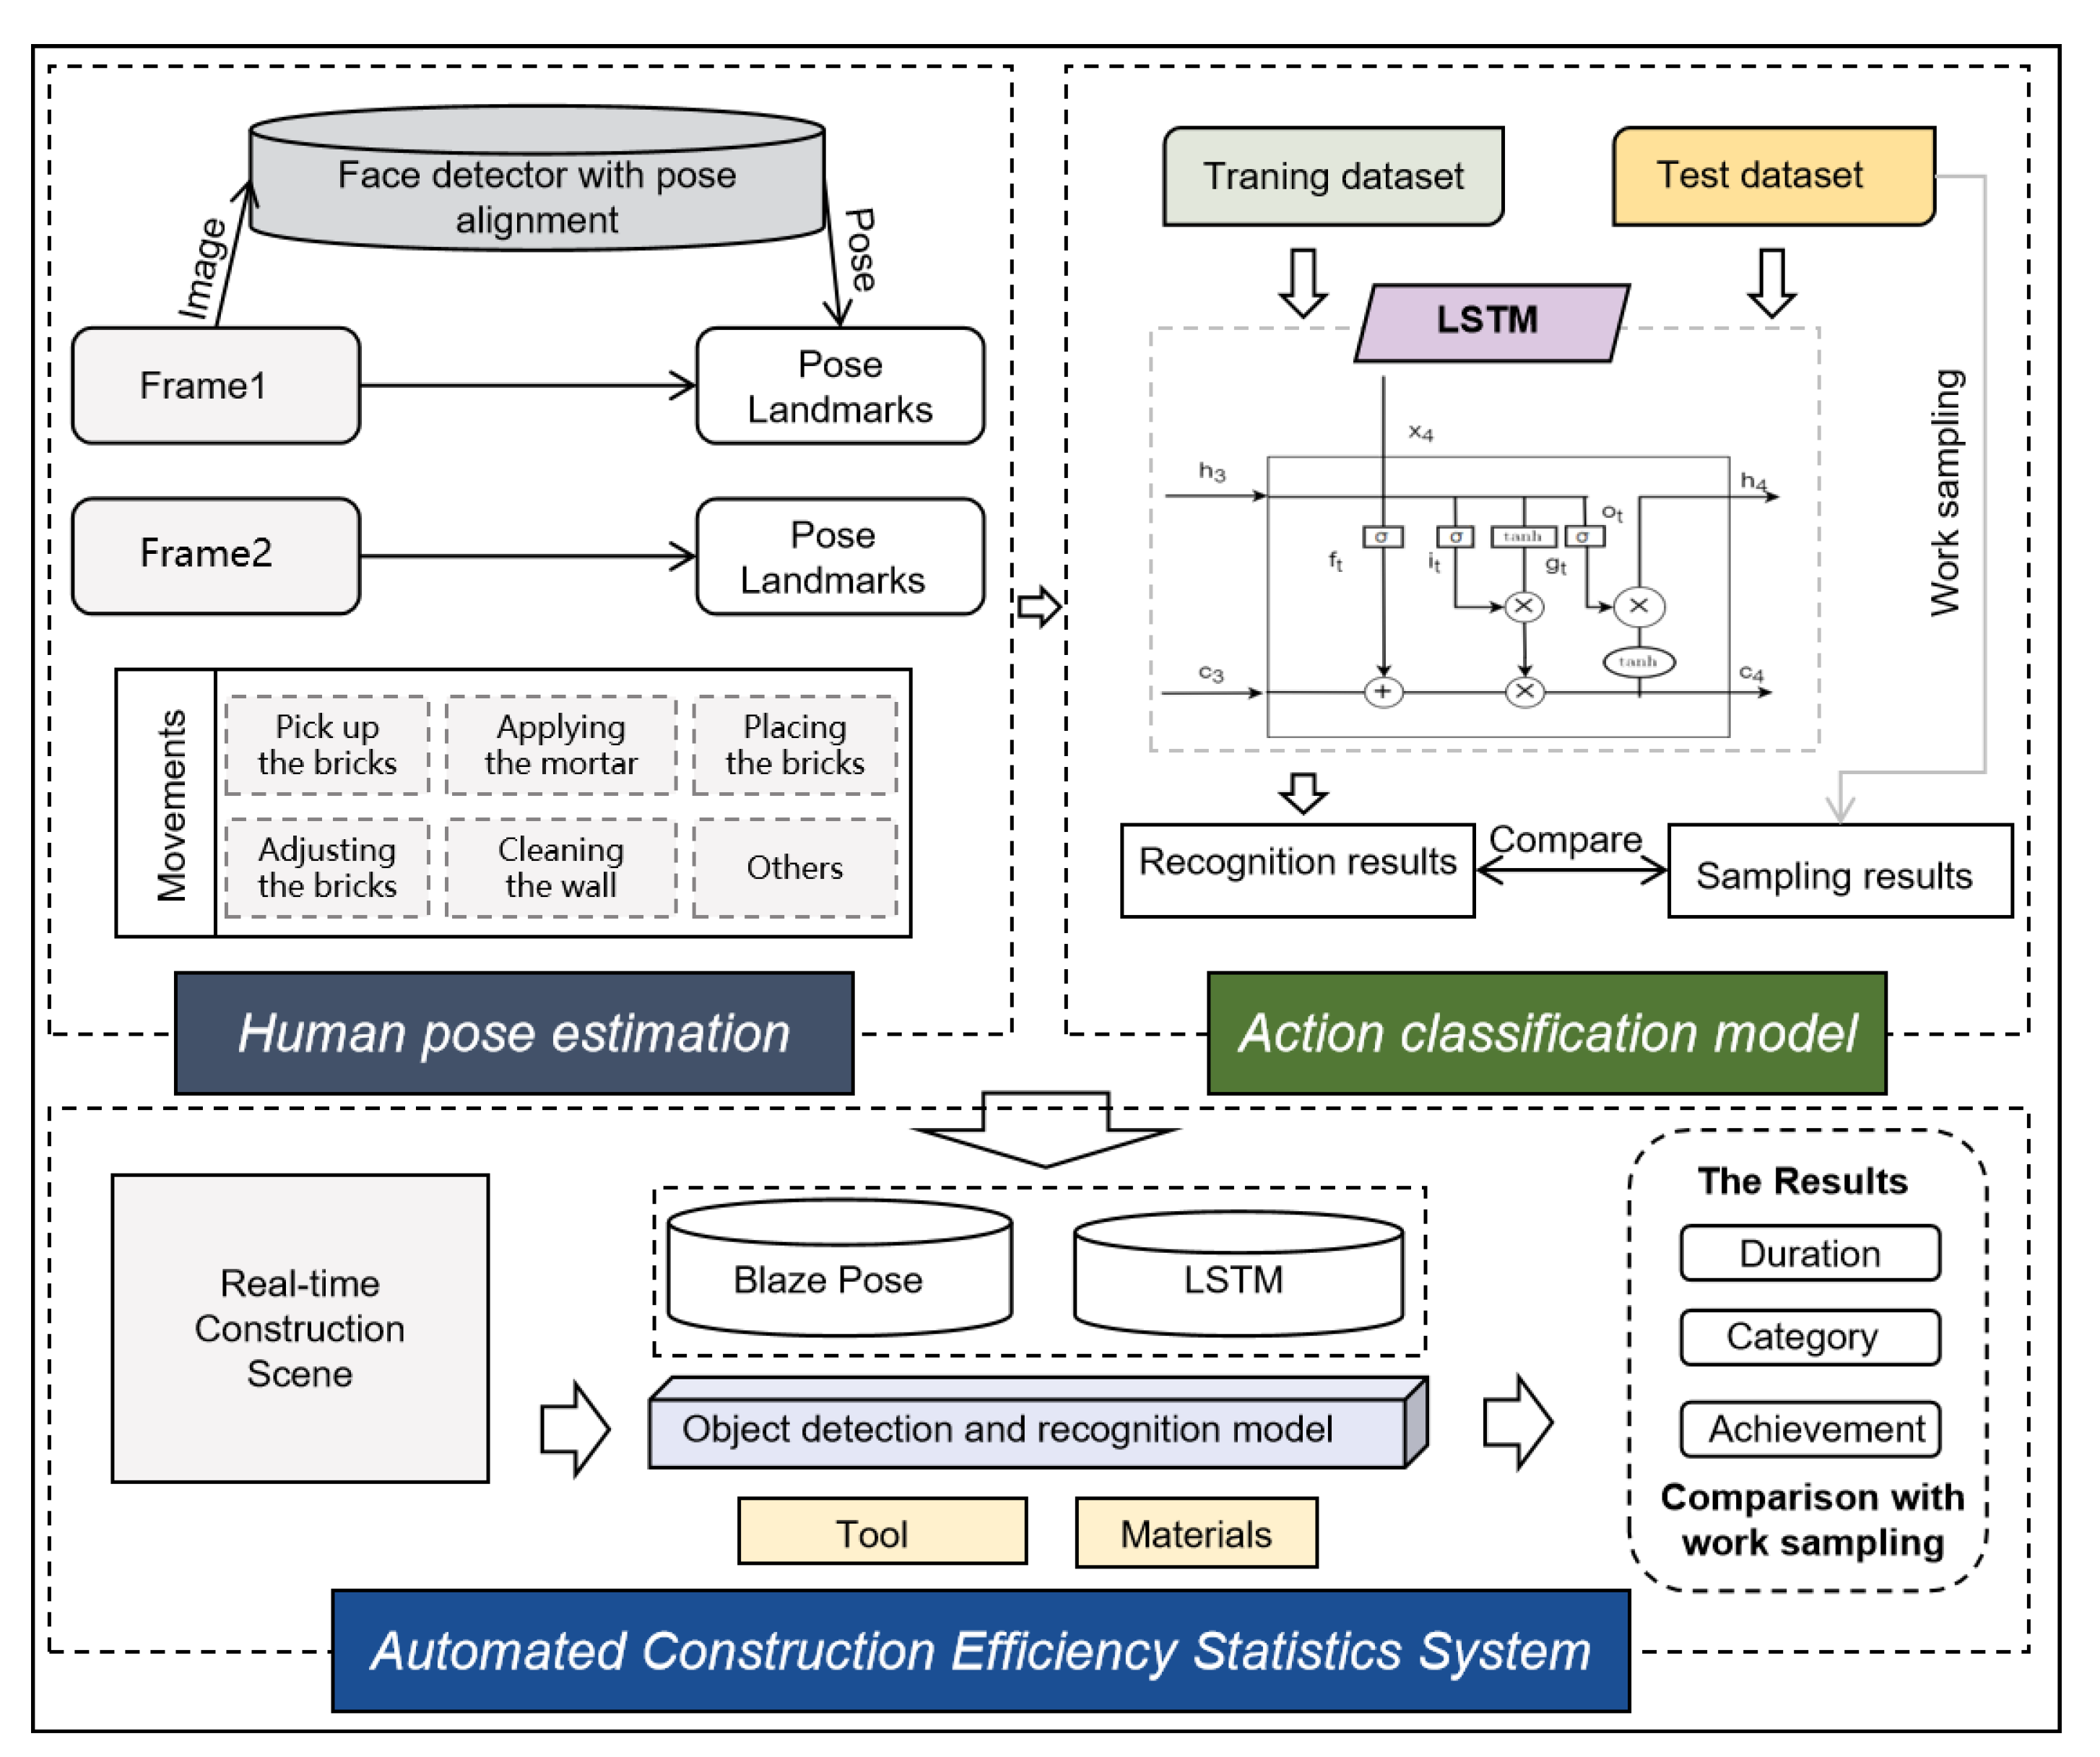
The automated analysis system comprises three primary modules: (1) Keypoint Processing and Extraction, (2) Action Classification, and (3) Construction Object Recognition.
Keypoint Processing and Extraction Module: This module utilizes the BlazePose model from the MediaPipe library, a deep learning framework designed for human pose estimation. BlazePose is capable of detecting 33 key points on the human body, including the head, shoulders, elbows, wrists, hips, knees, and ankles, in both images and video streams. Besides estimating the 2D coordinates (x, y) of these key points, BlazePose also infers relative depth information (z) to approximate the distance between the key points and the camera. However, it is important to note that the depth information provided by BlazePose is inferred from standard RGB camera data rather than obtained from physical depth cameras. This estimation offers a relative depth reference, not an absolute physical distance. For applications requiring precise depth measurements, such as specific physical distances, devices equipped with depth sensors like Kinect or Intel RealSense would be necessary. Given that construction sites typically utilize RGB cameras instead of depth cameras, this approach aligns well with the environmental conditions present on-site.
Action Classification Module: This module employs a Long Short-Term Memory (LSTM) network, a type of neural network adept at handling and predicting time-series data. LSTM is particularly effective for analyzing sequential actions in video frames. By feeding the time-series data of the detected key points into the LSTM network, the system can learn and extract temporal features of the actions, enabling accurate classification of worker movements. This module not only identifies the type of actions but also captures their duration and dynamic variations, providing a detailed analysis of worker behavior.
Construction Object Recognition Module: The YOLO (You Only Look Once) algorithm powers this module, a real-time object detection system renowned for its efficiency and accuracy. YOLO can detect and classify multiple objects within a single pass through the neural network. In the context of a construction site, YOLO is utilized to identify and classify tools and materials present in the video footage, such as bricks, trowels, and scaffolding. The model provides rapid identification of various objects in the scene, along with their corresponding categories and locations, which is crucial for comprehensively understanding the dynamics and layout of the construction environment.
Figure 1.
Framework for automatic recognition of labor force.
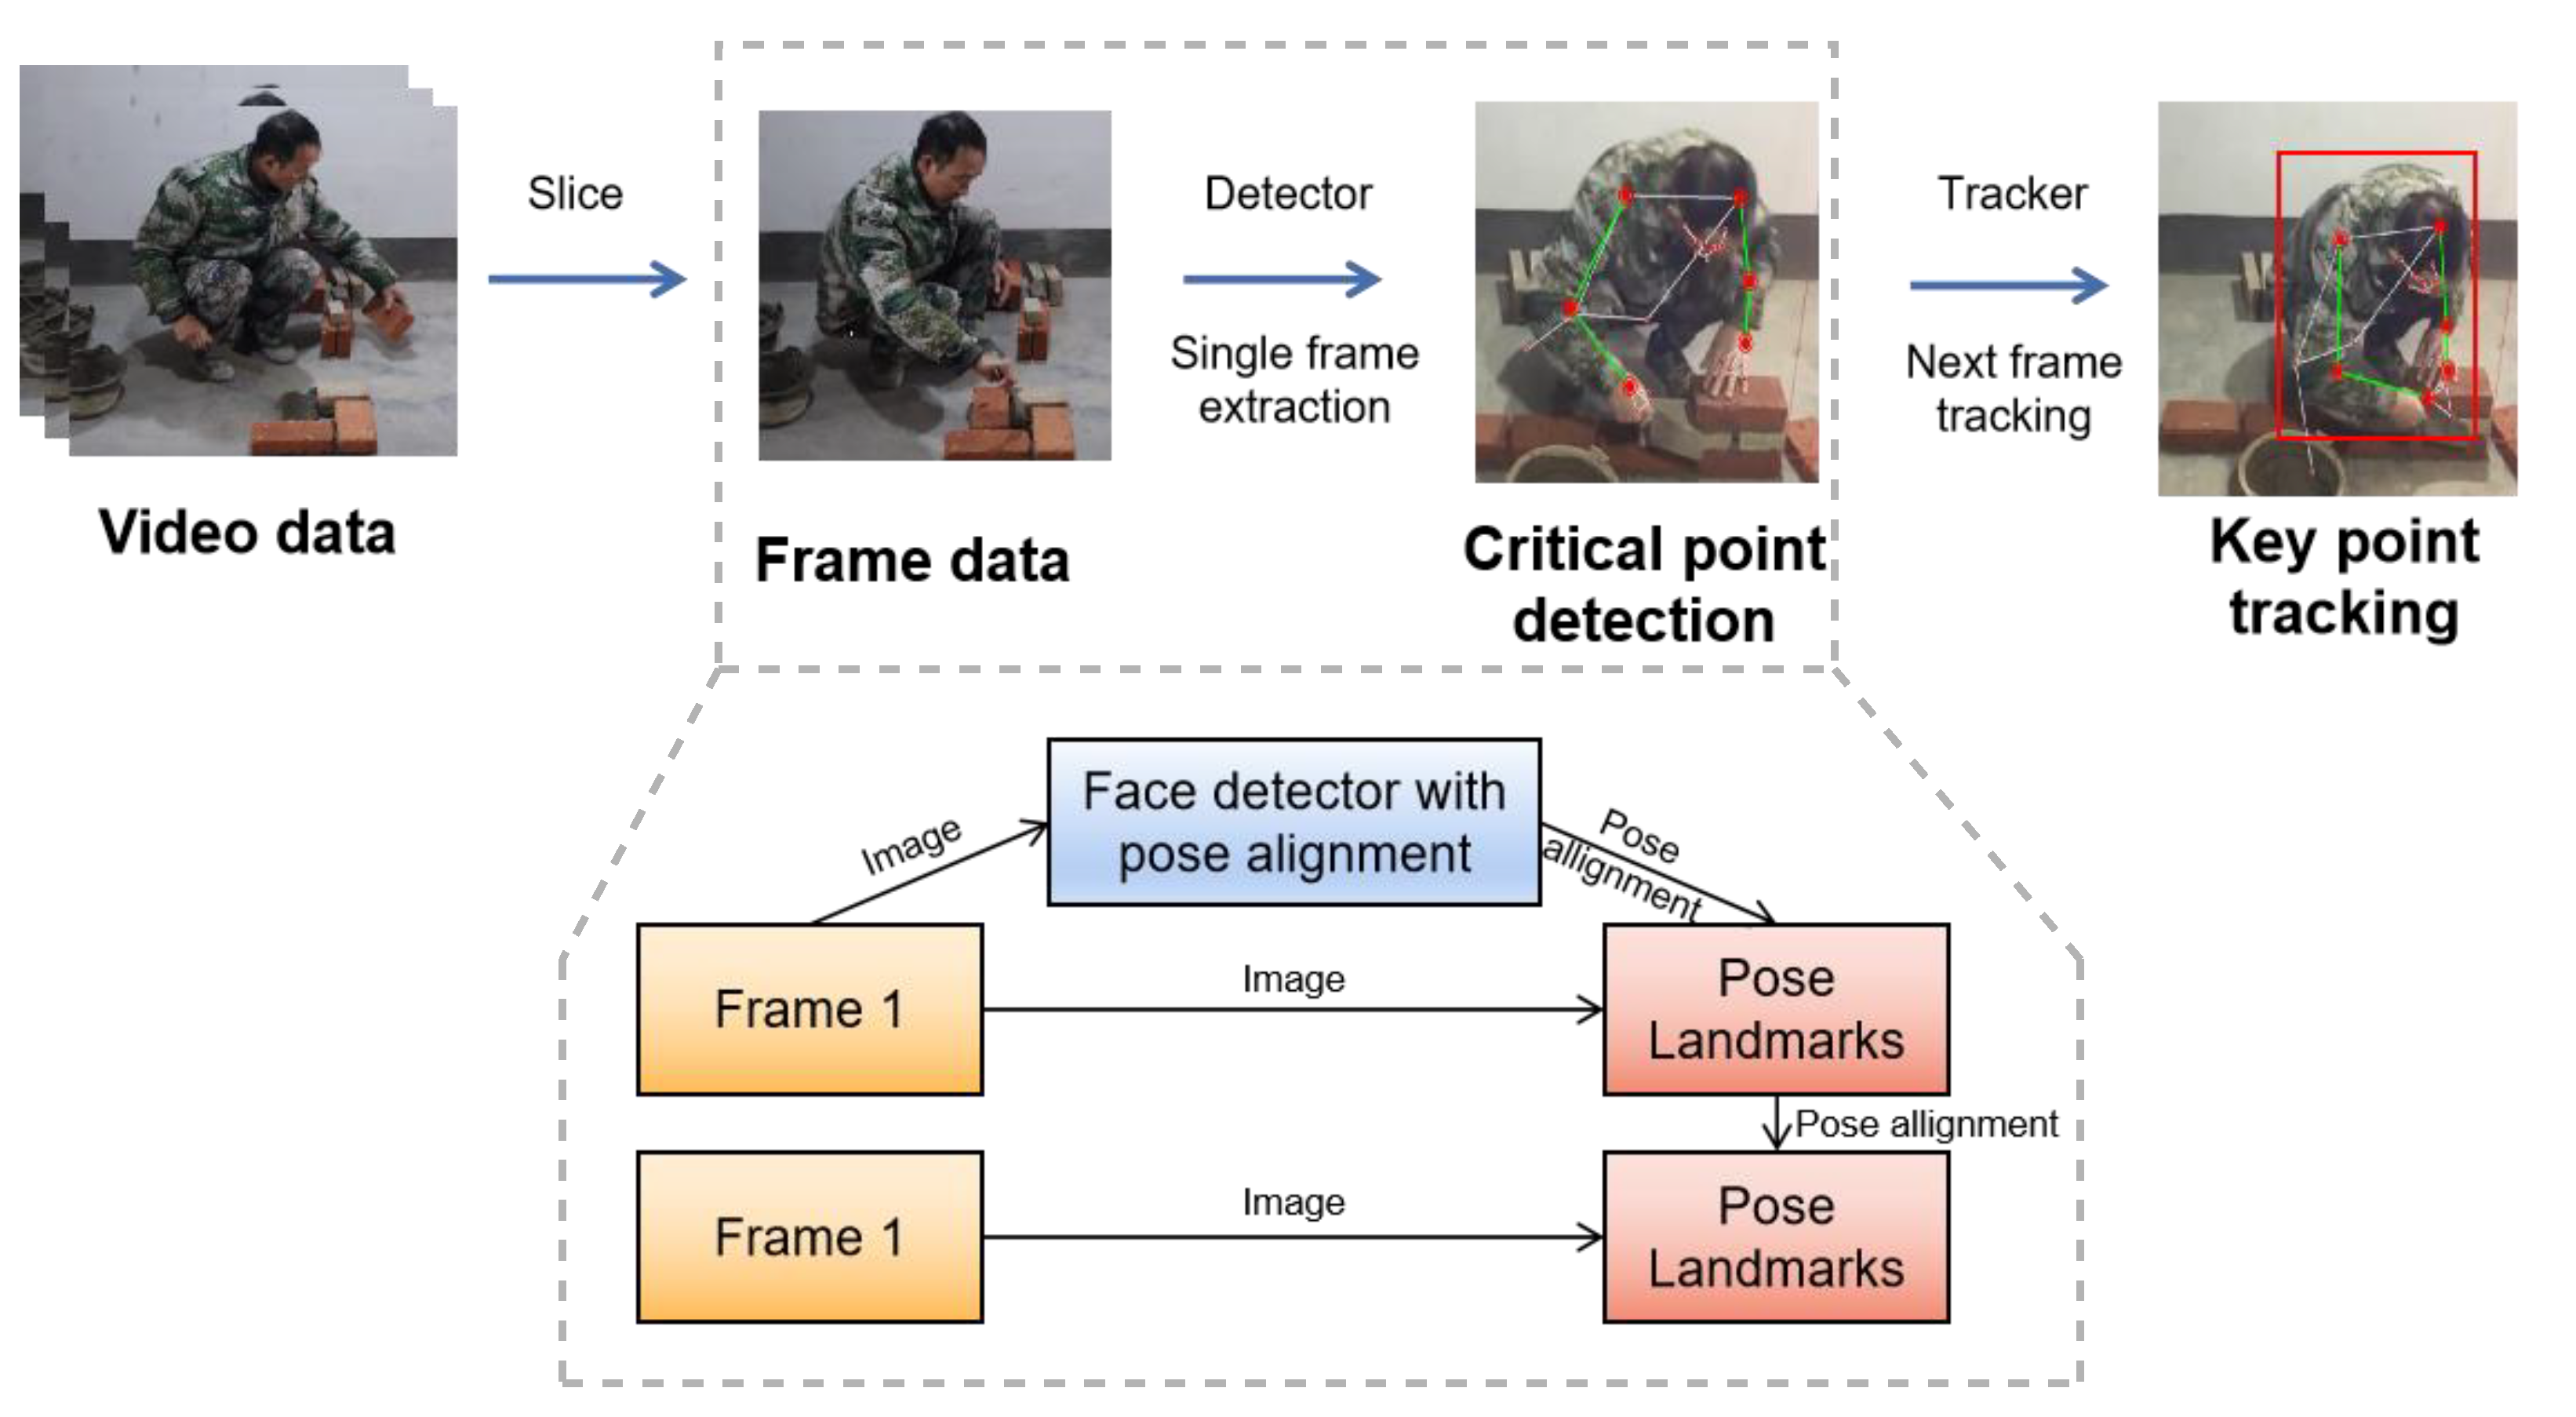
3.1. Extraction and Tracking of Worker Key Points
The extraction and tracking of worker key points is a fundamental step in analyzing construction activities. This process provides crucial data for understanding worker movements and behaviors.
Figure 2.
Distribution of human body key points.
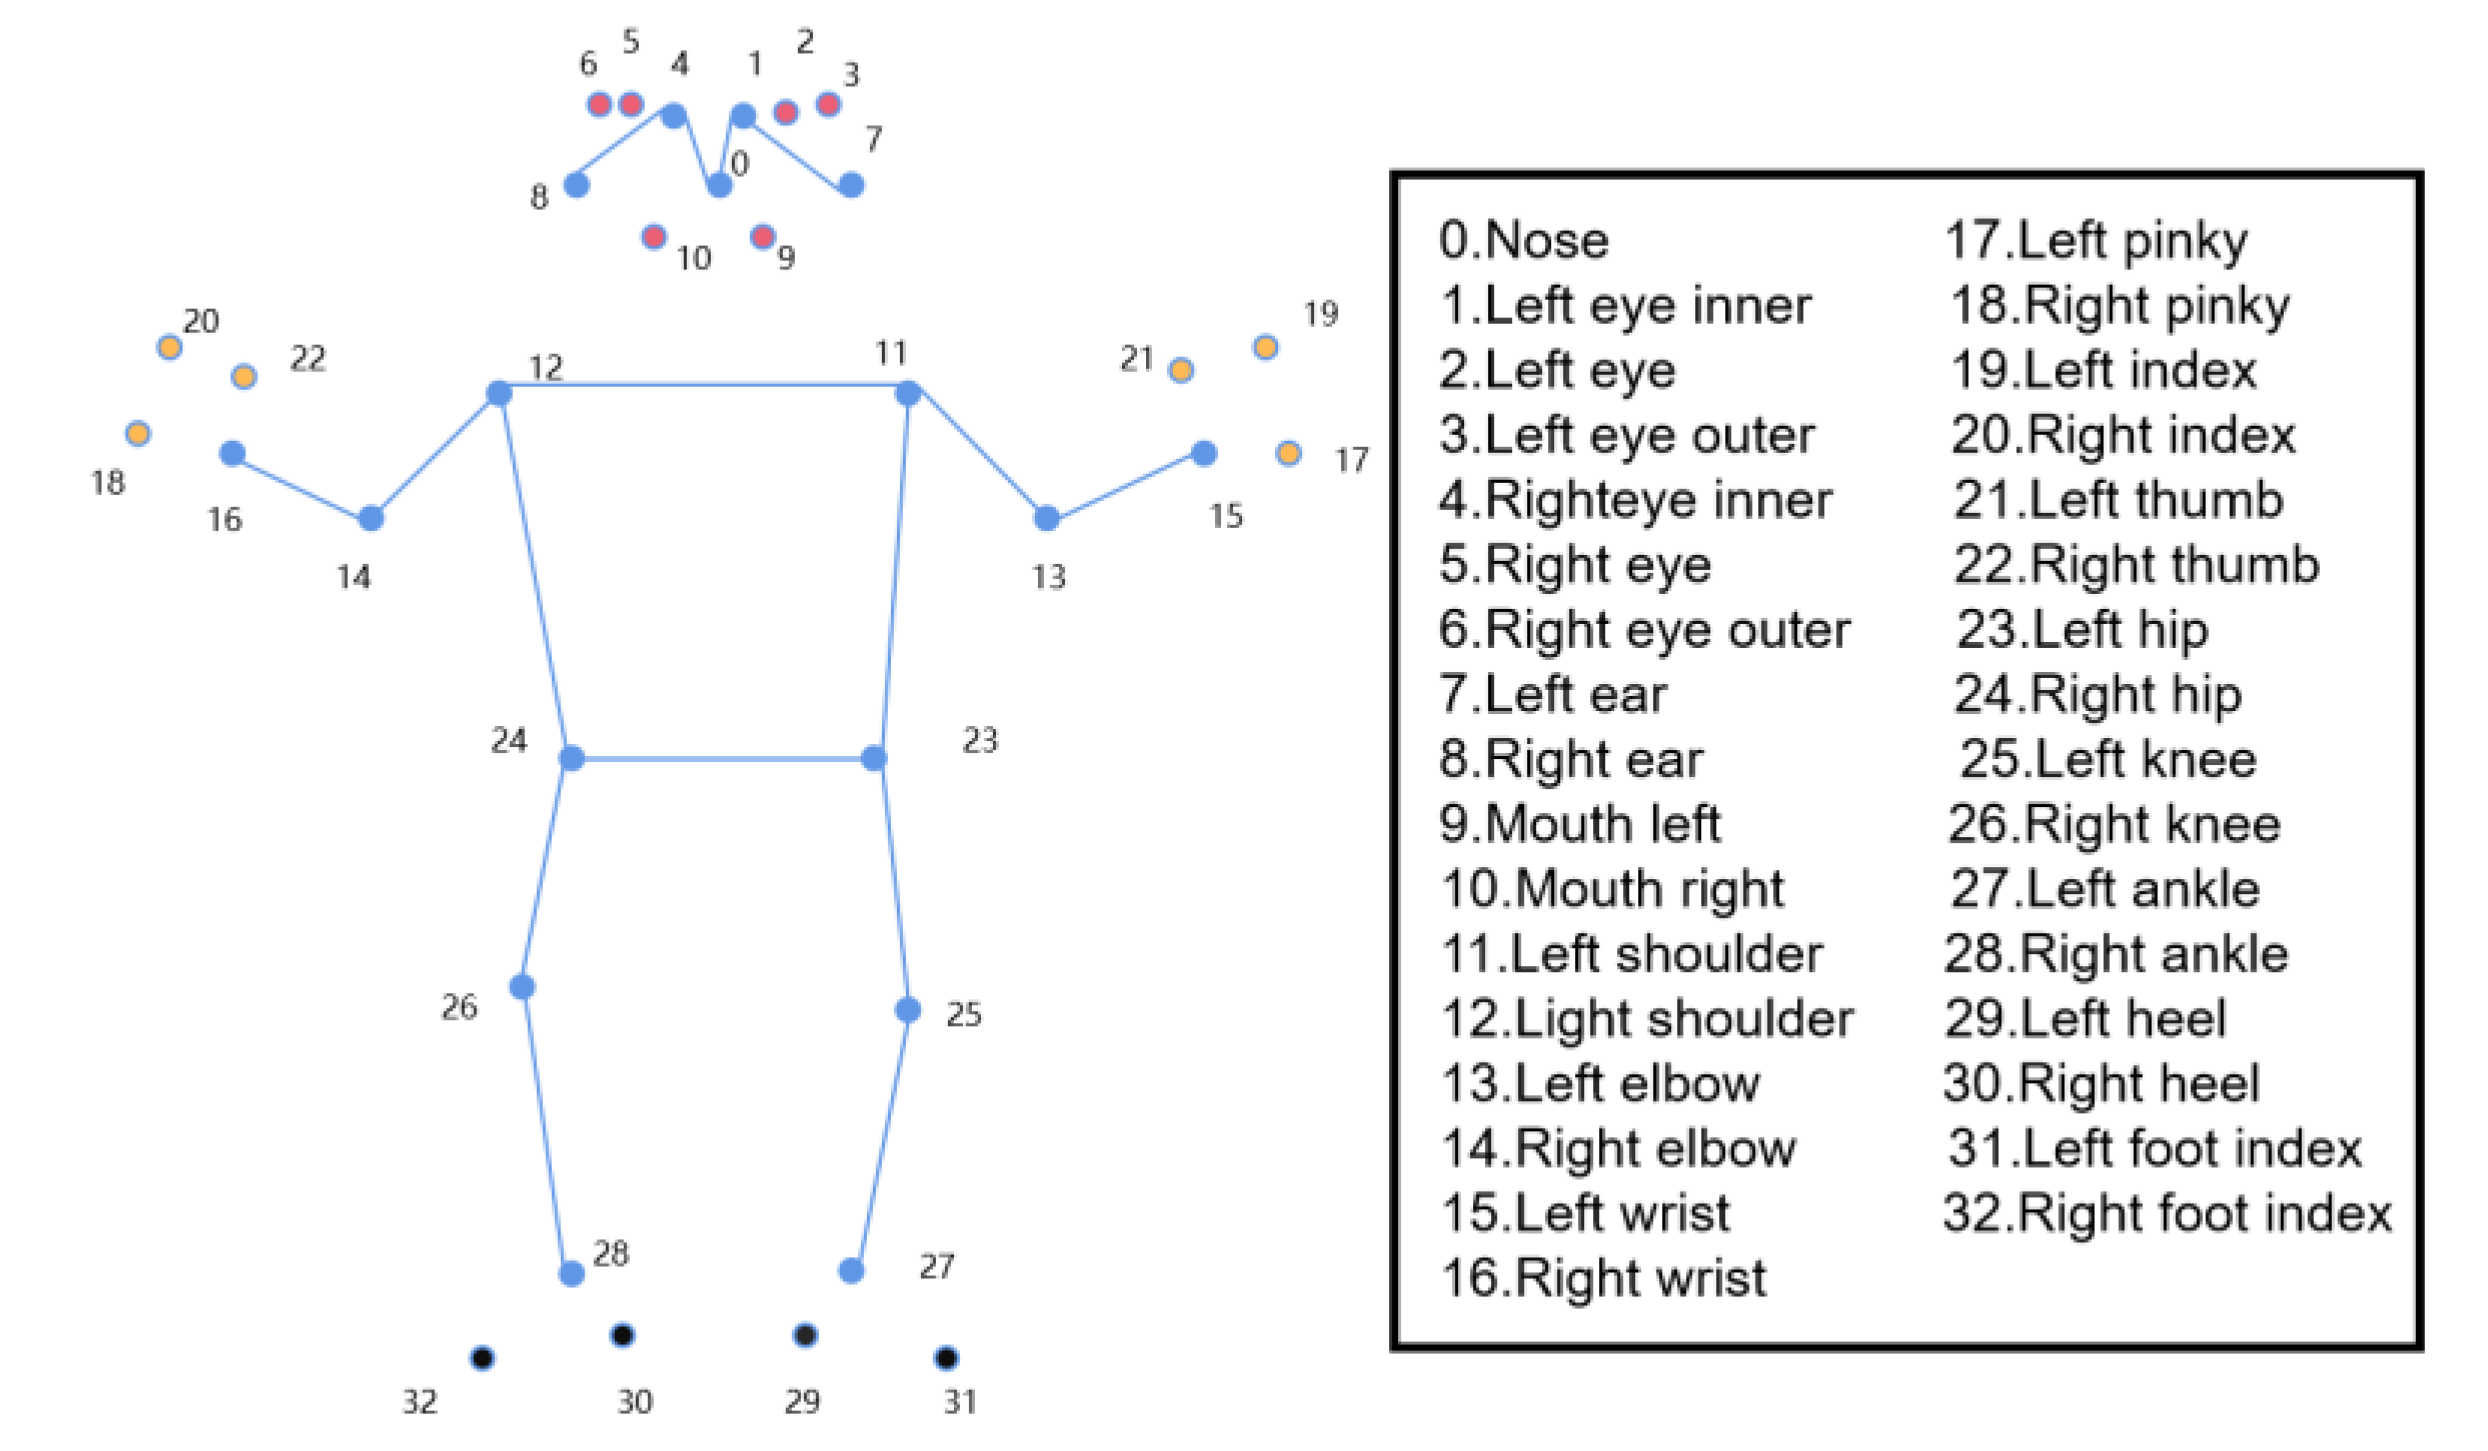
We utilize the BlazePose model from the MediaPipe library for keypoint processing and extraction. BlazePose is a deep learning framework designed for human pose estimation and can detect 33 key points on the human body in images and video streams. It not only provides 2D coordinates (x, y) but also infers relative depth information (z), which is valuable for assessing changes in posture and movement. Although the depth information is an estimation from standard RGB camera data rather than from physical depth cameras, it still offers a relative depth reference that is useful in construction site environments where RGB cameras are commonly used.
To handle the complexity of a dynamic construction site with multiple workers, we introduce a multi-target tracking algorithm framework. This framework consists of three main components: bounding box information, motion information, and appearance information. Bounding box information is generated based on the key point coordinate data, helping to locate workers in the image and providing detailed information for local regions in subsequent motion recognition. Motion information is extracted using a Kalman filter, which predicts the worker's position in the next moment using current and past key point position data. Mahalanobis distance is used to measure the similarity between newly detected targets and existing tracked targets to maintain effective tracking in a multi-target environment. Appearance information, such as clothing color and texture features, provides additional identification features for long-term tracking and reduces the risk of misidentification and tracking loss in complex backgrounds.
Each worker is assigned a unique identification ID, and the data, including key point coordinates, timestamps, bounding box information, and appearance features, is stored in a comprehensive database for subsequent analysis. Feature analysis is performed on the key point data, extracting positional coordinate features, center of mass features, and angle features. These features provide valuable insights into worker postures, movements, and task performance, enabling the identification and classification of various worker actions as well as the assessment of their efficiency and safety.
3.2. The Process of Deconstructing Construction Activity Scenes
To accurately deconstruct the actions of bricklaying workers, we first segment the video into time units based on the minimum duration of each action, where each time unit represents a complete action. These time units ensure that the scene elements (including workers, tools, bricks, etc.) remain consistent within each unit, allowing us to ignore the influence of time in the analysis. This method simplifies the data processing process and allows us to focus on the analysis of scene elements without considering the temporal variations. The minimum duration of each action determines the division points for the video, ensuring the accuracy and simplicity of action recognition. For example, during actions such as picking up a brick, placing a brick, or applying mortar, the start and end times of the actions are very clear. By segmenting these time periods, we can more efficiently analyze each action performed by the worker.
Each action of the bricklaying worker can be further broken down into five basic actions based on their duration and details: picking up a brick, placing a brick, applying mortar, cleaning mortar, and placing mortar. By clearly defining these actions into individual time units, we can process each step of the bricklaying process more simply. The choice of these five actions is based on the necessity and sequence of each step in the bricklaying process. They represent the most critical and indispensable parts of the work, with each action having a clear temporal boundary. For each action’s deconstruction, we apply the analysis method of entities, relationships, and attributes in scene theory, which helps us to deeply understand the actual processes represented by each action.
The action of picking up a brick begins with the worker visually identifying the target brick and accurately grabbing it. In this process, the relationship between the worker and the brick is "grasping," and the physical attributes of the brick (such as weight and size) influence the worker's operation. Although this action seems simple, it requires the worker to have good coordination to ensure the stability of the brick. When placing the brick, the worker must consider factors such as the wall structure, the arrangement of the bricks, and the thickness of the mortar, all of which are reflected in the relationship between the worker, the brick, and the wall. In the process of applying mortar, the worker uses a tool to extract an appropriate amount of mortar and evenly applies it to the surface of the brick. This requires the worker to control the amount of mortar and the application pressure based on the surface of the brick, ensuring the mortar firmly binds the bricks together. Next, the worker cleans off excess mortar to maintain the neatness and aesthetic of the wall. This cleaning process is not just surface treatment; it ensures the stability of the connections between the bricks. Finally, placing mortar is done to ensure that the gaps between the bricks are filled adequately, ensuring the stability and durability of the structure.
To ensure effective classification of bricklaying actions, we maintain the consistency of scene elements by considering the completeness of each action within the time unit. During the analysis, we deconstruct each action’s characteristics and impacts using the entities, relationships, and attributes method. For example, in the action of "picking up a brick," the relationship between the worker and the brick is "grasping," and the brick's attributes (such as weight and shape) determine the worker's movements. When placing the brick, the relationship between the worker, the brick, and the wall is "placing," and the attributes of the brick are still important, but they focus more on the angle, position, and fit with the wall. The processes of applying mortar, cleaning mortar, and placing mortar follow a similar logic, where the interactions between the worker, the tools, the mortar, and the wall determine the final outcome of the actions.
Figure 3.
Action decomposition diagram.
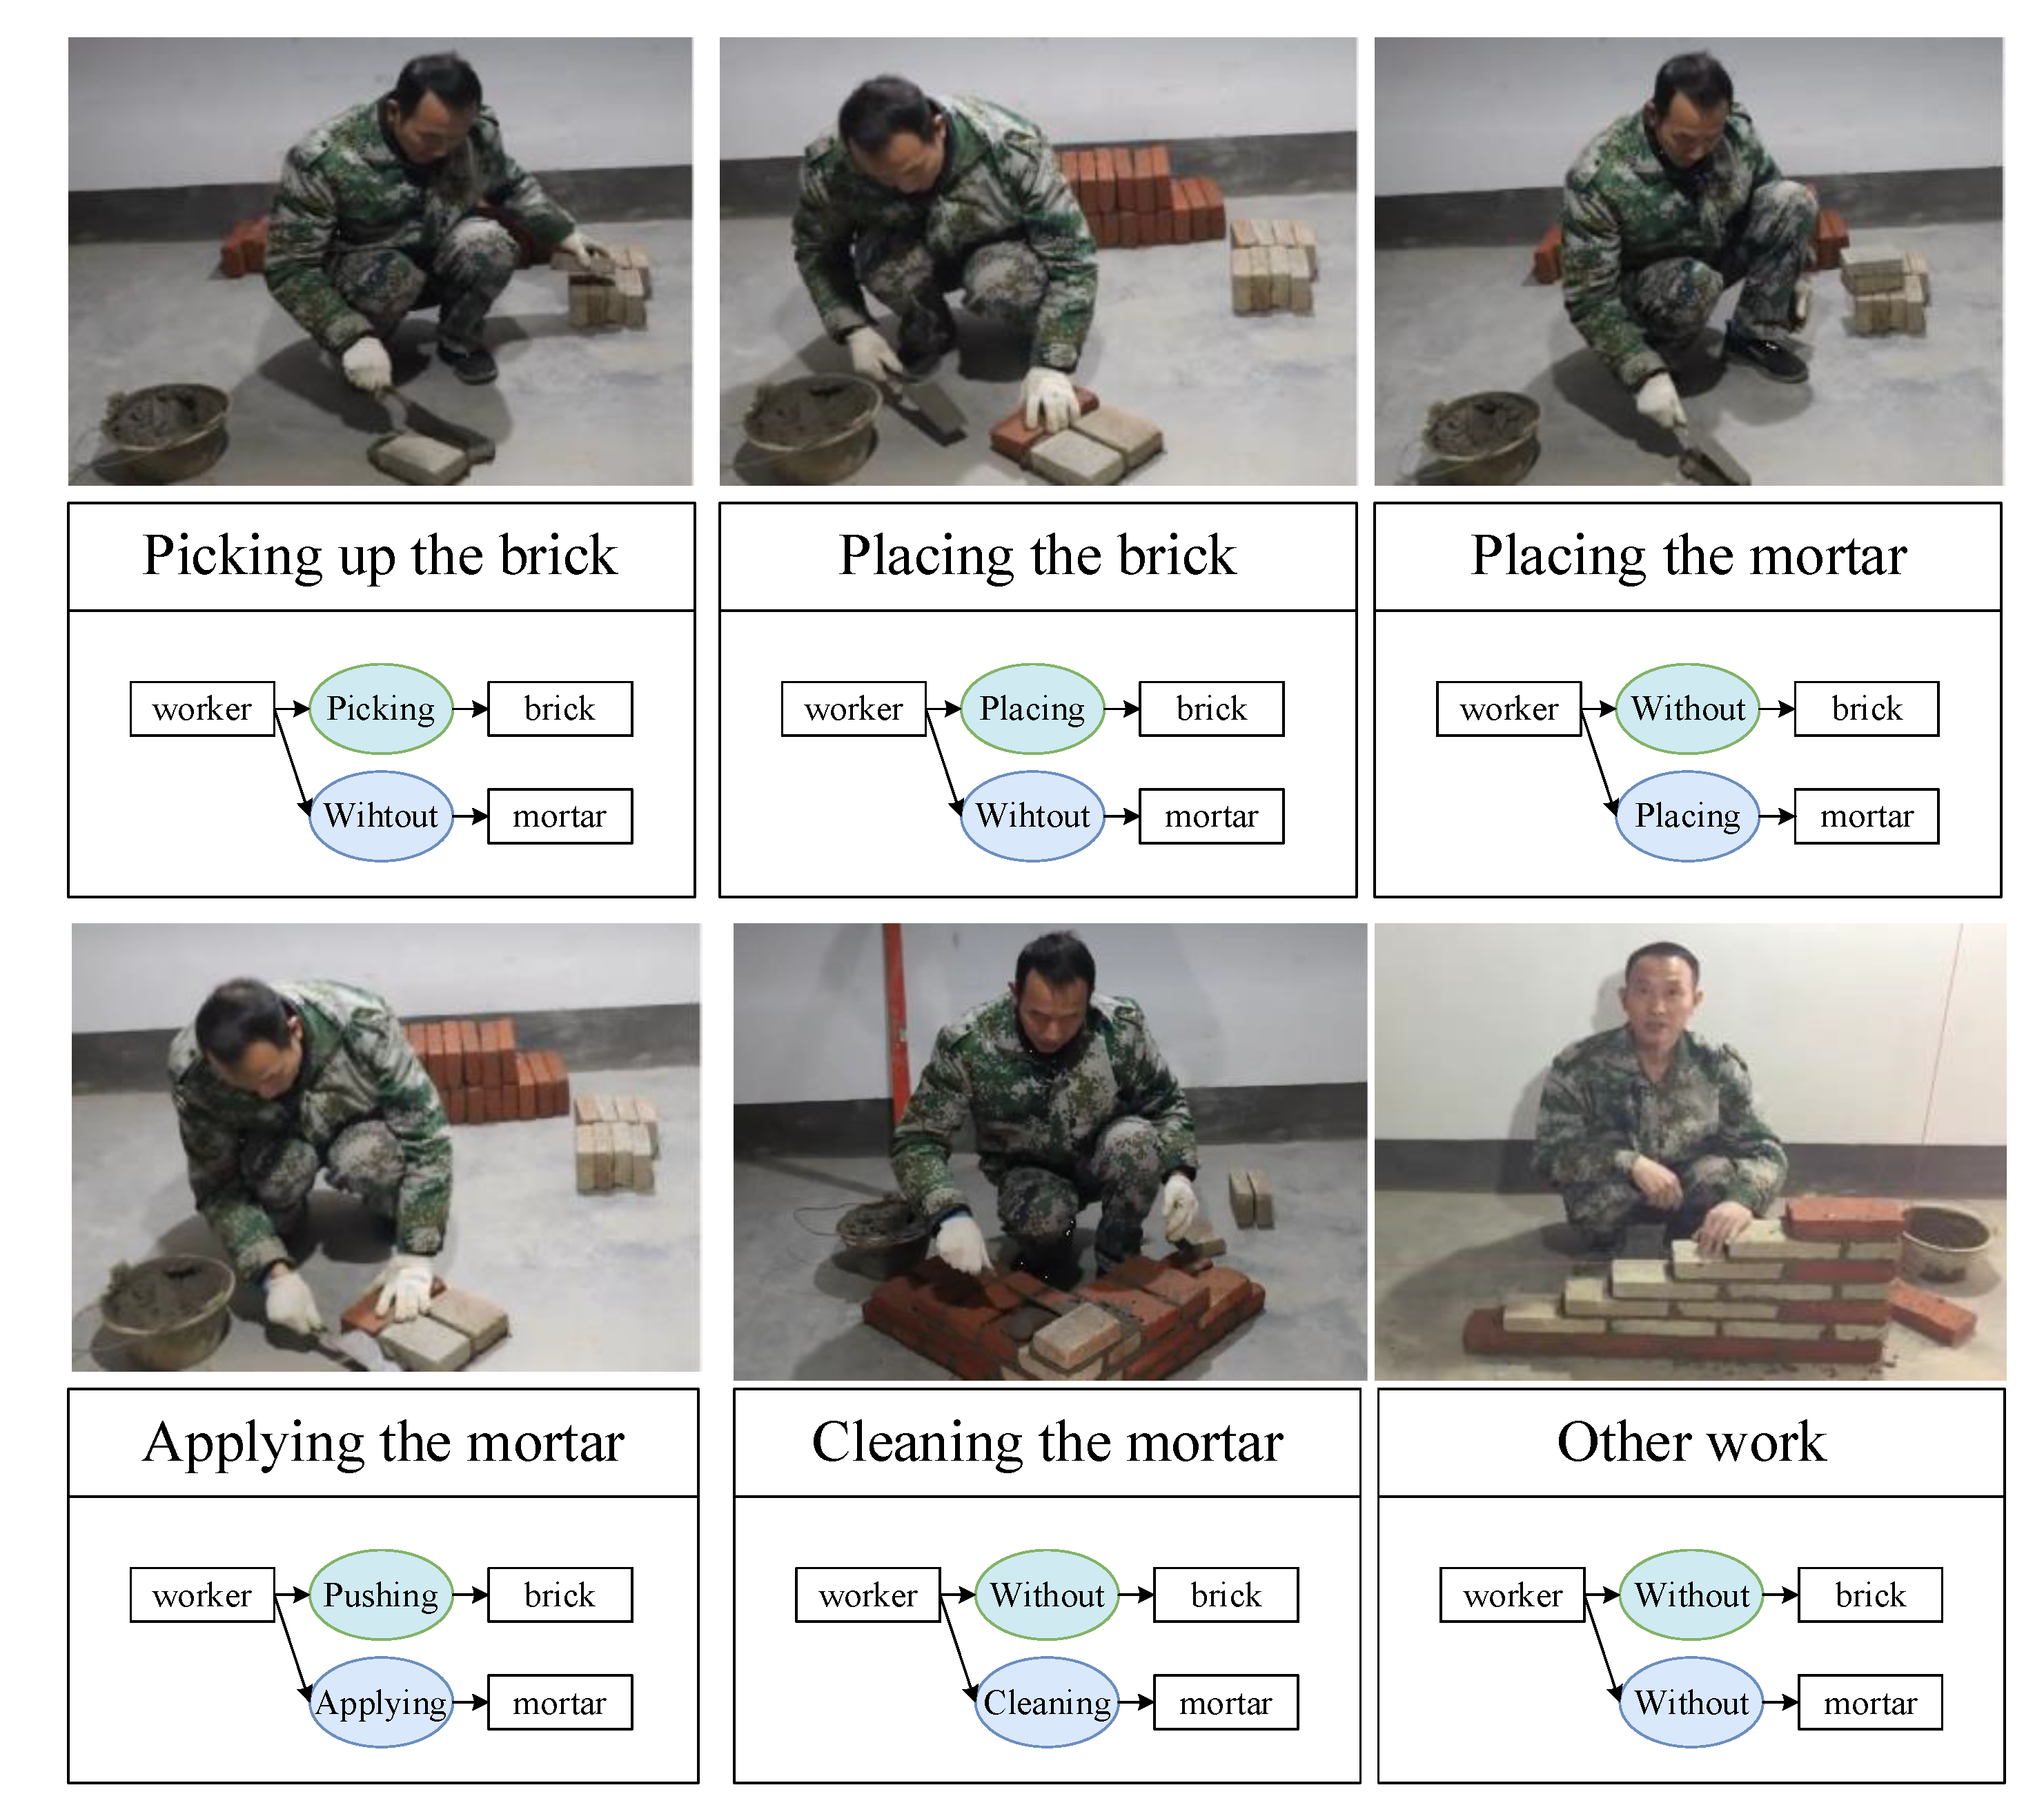
Through the in-depth deconstruction of these five actions, we can clarify the steps of each action, the tools, materials, and environmental elements involved, and use this information for efficient labor productivity evaluation. This detailed analysis of actions provides essential foundational data for the subsequent automation of construction and offers theoretical support for improving the workflow of bricklaying workers. In the age of smart buildings and the continuous development of automation technology, accurate action classification and recognition will play a key role in enhancing construction productivity, optimizing workplace safety, and improving construction quality.
3.3. Action Recognition of Time Series Data
Worker action recognition is essential for optimizing workflows on construction sites. We employ Long Short-Term Memory (LSTM) networks, a type of recurrent neural network effective for sequential data analysis. The LSTM model receives input in the form of a sequence of coordinates corresponding to the worker's key points over time. These coordinates are pre-processed to normalize scale differences and align time steps for consistent input data. The model processes this sequence, capturing temporal dependencies and identifying patterns that correspond to different actions, such as lifting, placing, or adjusting materials. The output of the LSTM network provides a probability distribution over possible actions, allowing for accurate classification of worker movements.
Figure 4.
LSTM model processing flow.
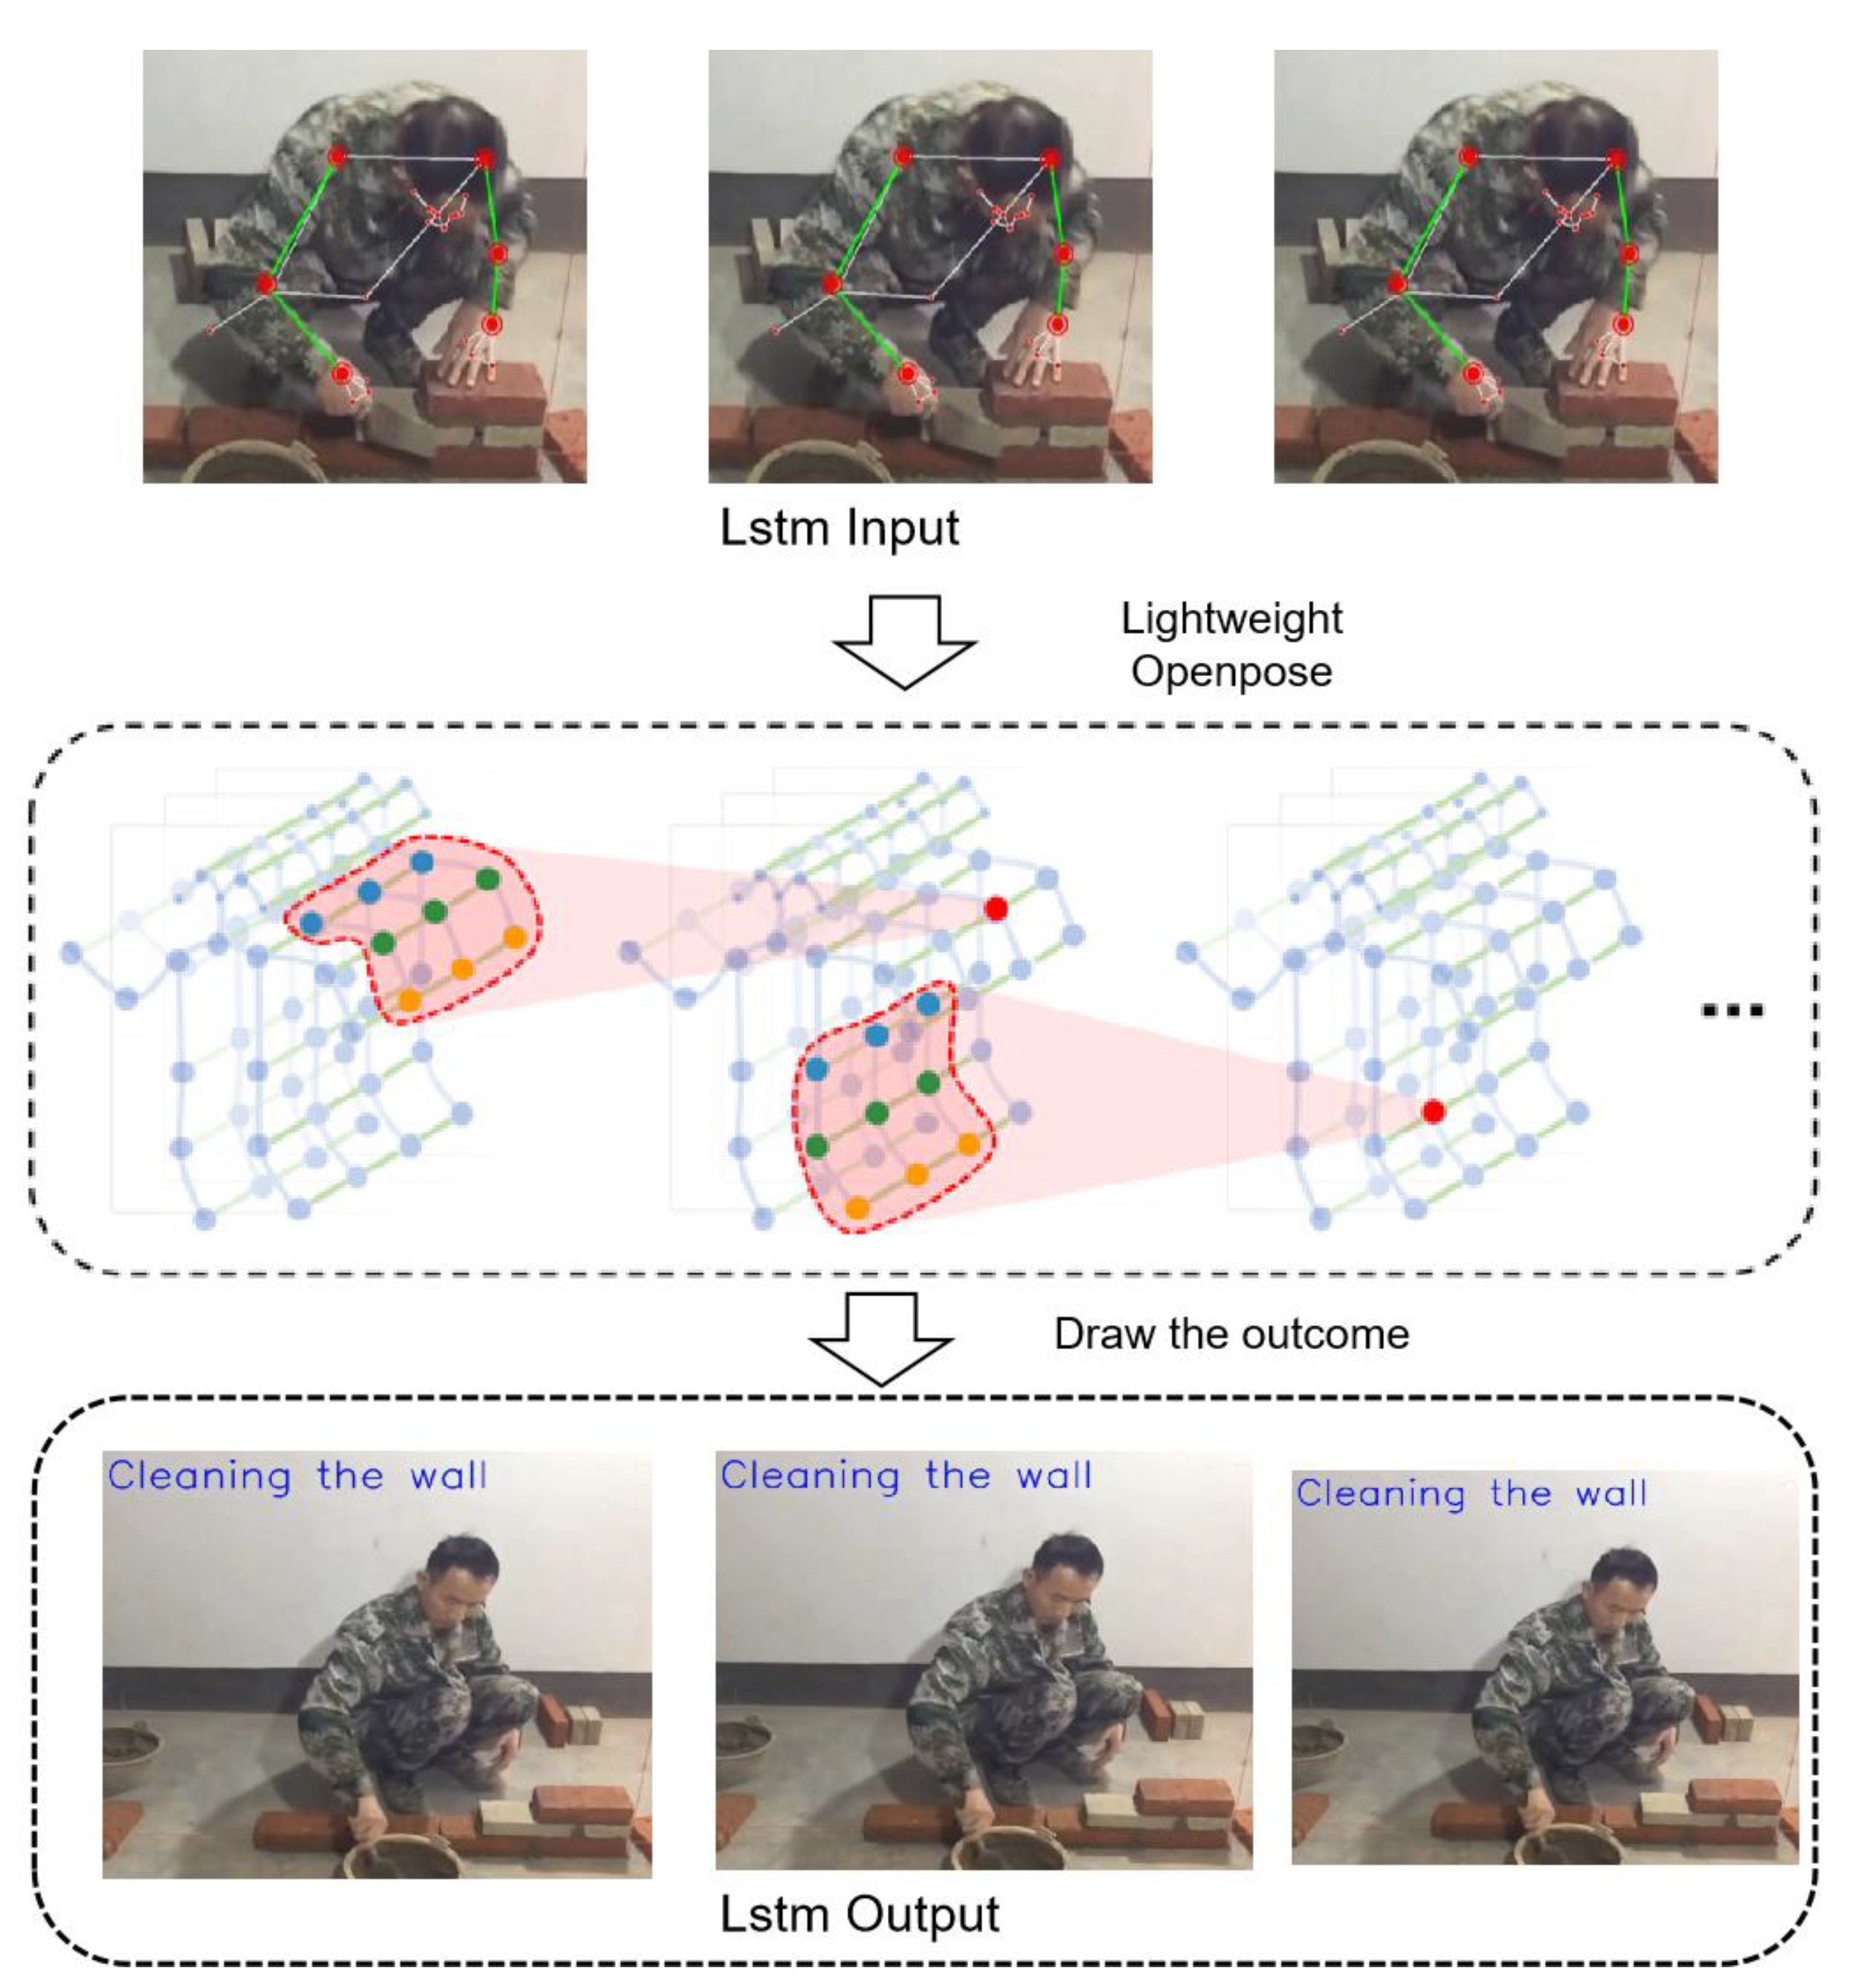
By leveraging LSTM networks, we can make better use of the temporal features in videos. The processing result of the previous frame of video has an impact on the result of the next frame. Compared with other machine learning models, it can better utilize the video characteristics to improve the accuracy.
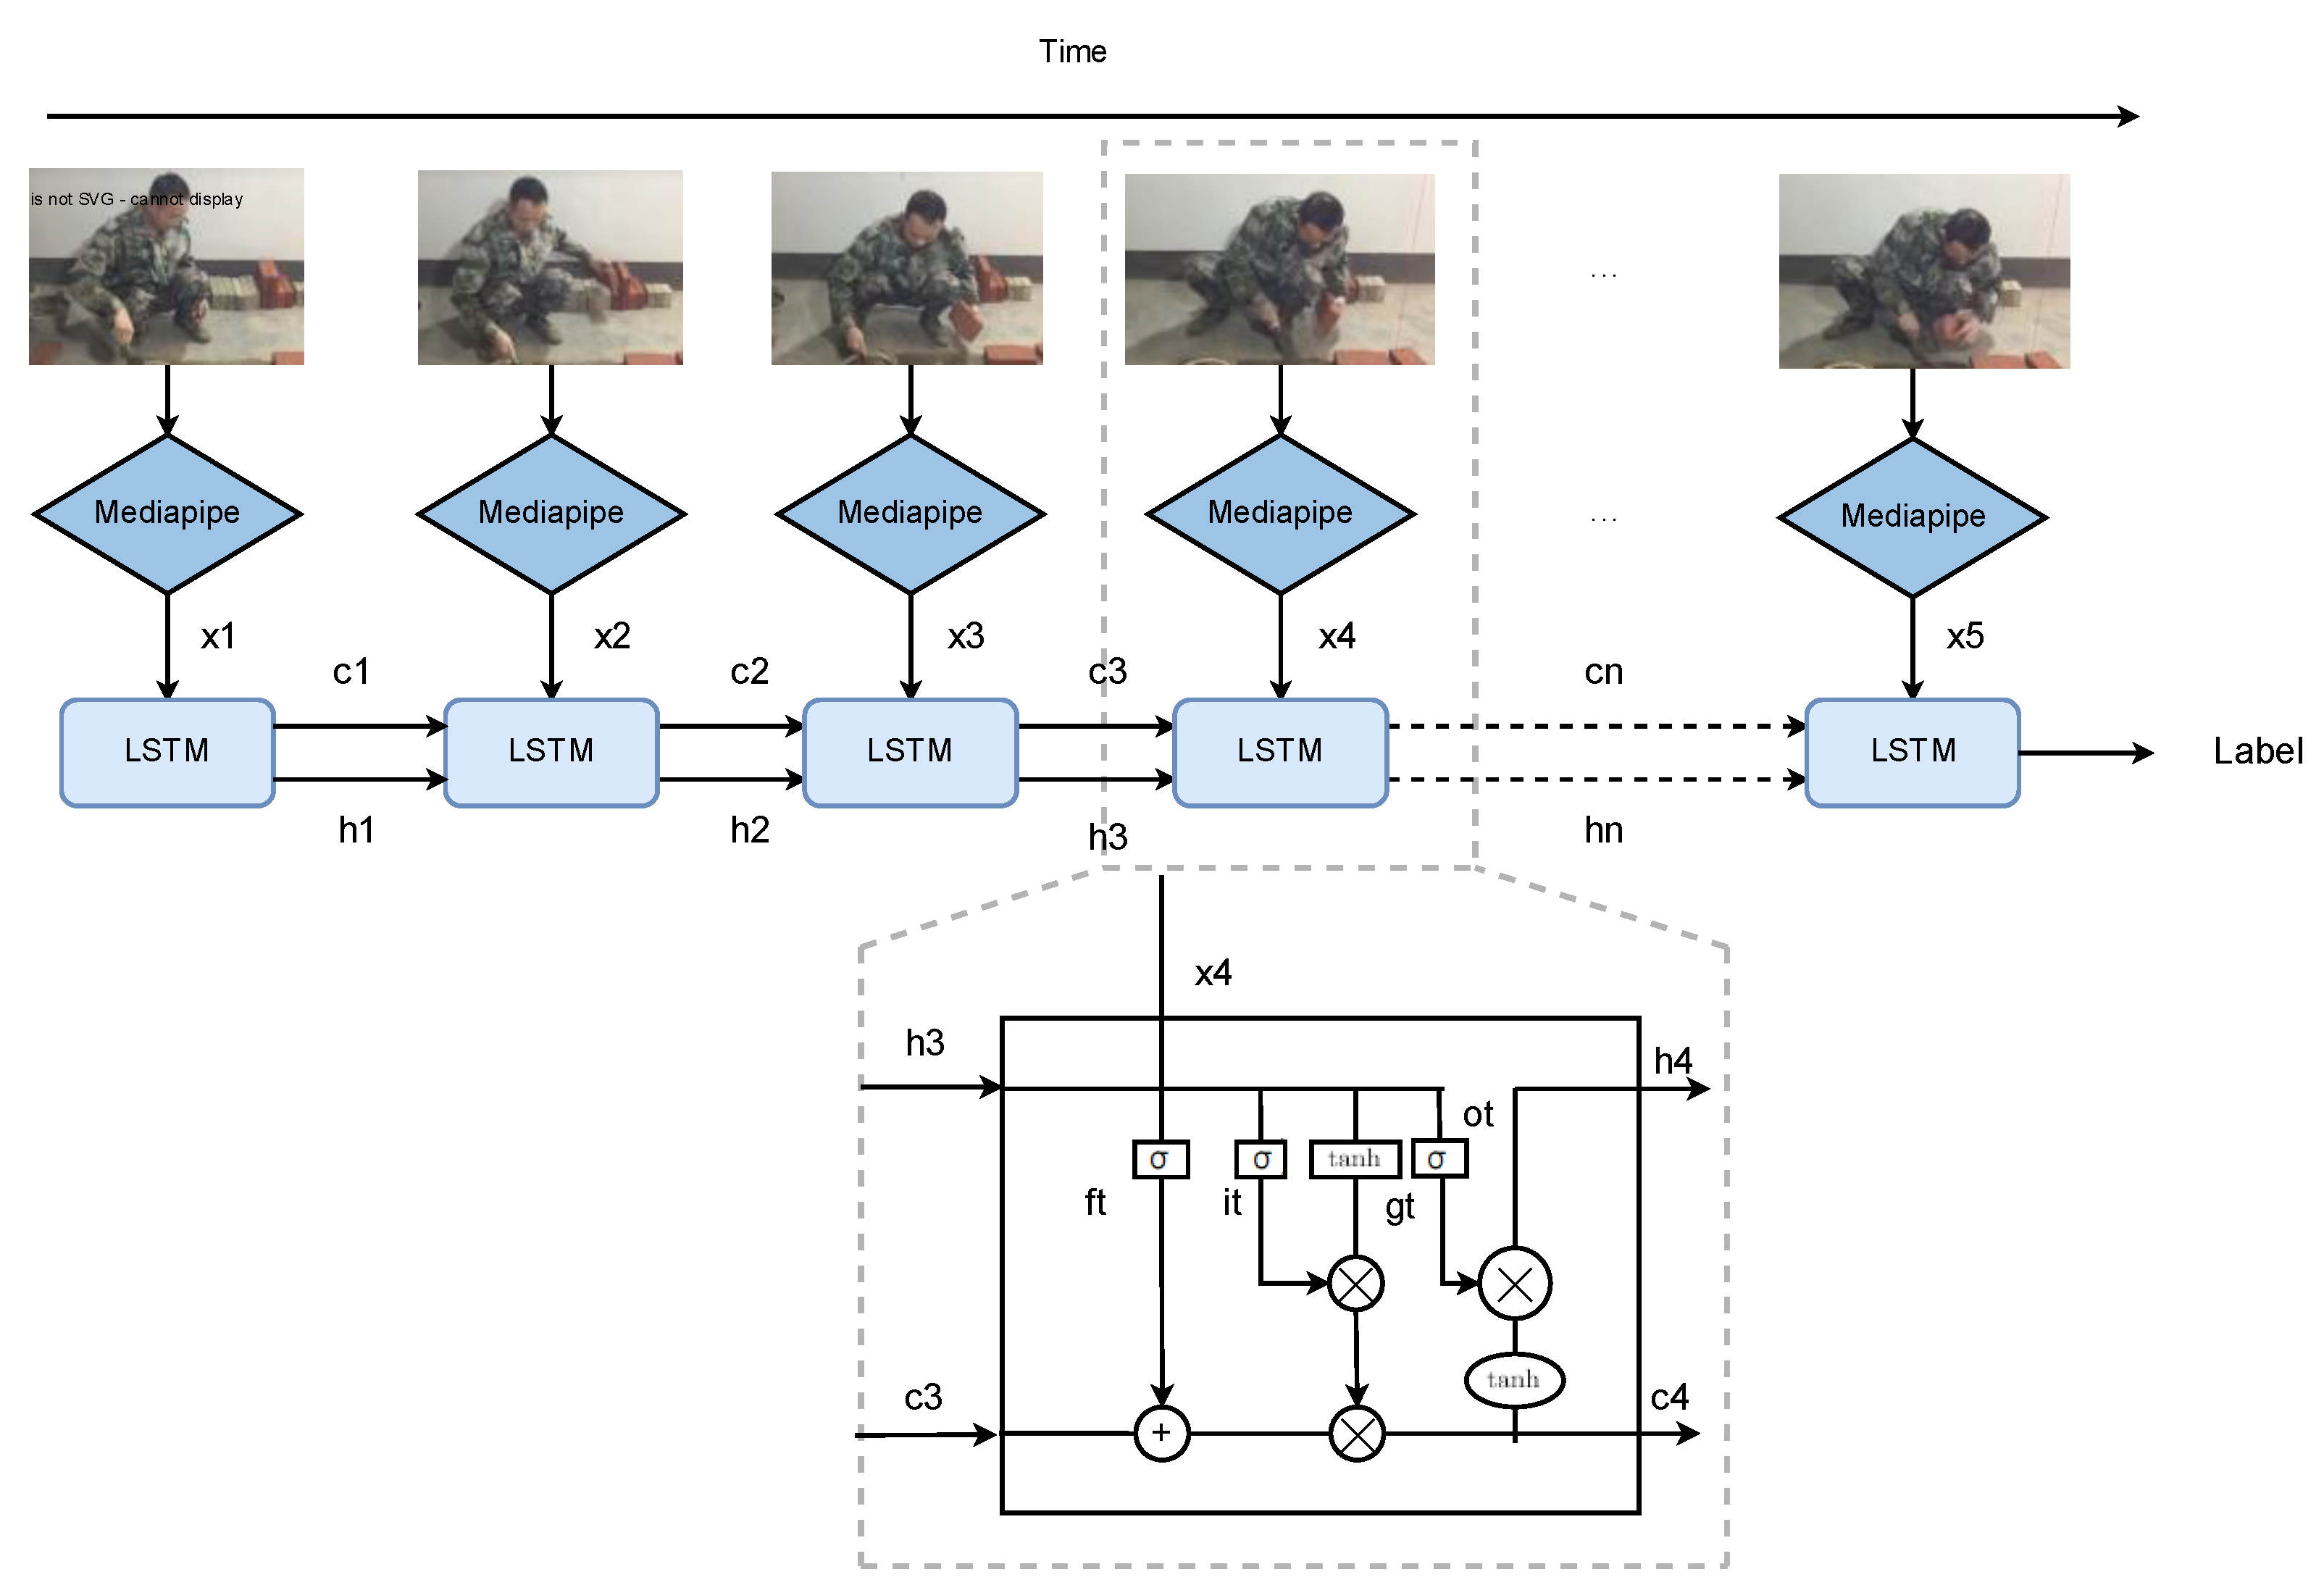
Figure 5.
The LSTM training process.
: Represents the data features input to the LSTM at each time step after being processed by Mediapipe. For example, it could be human pose features extracted from video frames.
: The cell state in the LSTM. The cell state is a core part of the LSTM, which can retain and transmit information over time series. It is similar to a memory unit that can selectively forget or remember information.
: The hidden state of the LSTM. The hidden state contains information of the current time step and is passed to the next time step for subsequent calculations and outputs. It can be regarded as an abstract representation of the current input and all previous information by the LSTM.
Label: The final output label, which is the classification or prediction result obtained after the entire LSTM sequence processing.
: Forget Gate. It determines which information in the cell state from the previous time step should be forgotten. It outputs a value between 0 and 1 through a Sigmoid activation function and performs element-wise multiplication with to control the degree of information forgetting.
: Input Gate. It decides which information in the current time step input should be saved in the cell state. It also obtains a value between 0 and 1 through a Sigmoid activation function to control the input of information.
: Input Modulation Gate, also known as the Candidate Cell State. It is obtained by performing some calculations (usually including linear transformation and activation functions such as Tanh) on the input and the previous hidden state , and is used to update the cell state.
: Output Gate. It determines which information in the cell state should be output to the hidden state . It obtains a value between 0 and 1 through a Sigmoid activation function and performs element-wise multiplication with the cell state processed by the Tanh activation function to obtain the hidden state of the current time step.
The above diagram illustrates the operation process of the LSTM model in detail. At each time step, the video frames are first processed by Mediapipe to extract relevant data features, represented as xn . These features could be human pose features extracted from video frames.
The LSTM cell state cn is a core part of the LSTM. It can retain and transmit information over time series, similar to a memory unit that can selectively forget or remember information. The forget gate ft determines which information in the cell state cn-1 from the previous time step should be forgotten. It outputs a value between 0 and 1 through a Sigmoid activation function and performs element-wise multiplication with cn-1 to control the degree of information forgetting.
The input gate decides which information in the current time step input xn should be saved in the cell state. It also obtains a value between 0 and 1 through a Sigmoid activation function to control the input of information. The input modulation gate gt, also known as the Candidate Cell State, is obtained by performing some calculations (usually including linear transformation and activation functions such as Tanh) on the input xn and the previous hidden state hn-1, and is used to update the cell state. The updated cell state is calculated by adding the result of element-wise multiplication of the forget gate output and the previous cell state cn-1 to the result of element-wise multiplication of the input gate output and the input modulation gate output.
The hidden state hn of the LSTM contains information of the current time step and is passed to the next time step for subsequent calculations and outputs. It can be regarded as an abstract representation of the current input and all previous information by the LSTM. The output gate determines which information in the cell state cn should be output to the hidden state hn. It obtains a value between 0 and 1 through a Sigmoid activation function and performs element-wise multiplication with the cell state processed by the Tanh activation function to obtain the hidden state hn of the current time step.
After processing through multiple time steps, the final output label is obtained, which is the classification or prediction result obtained after the entire LSTM sequence processing. This label represents the recognition result of the worker's actions in the video, such as different actions in the construction process.
3.4 Object Recognition in Scenes
In addition to recognizing worker actions, identifying and tracking construction tools is crucial for a comprehensive analysis of the construction site. We utilize the YOLO (You Only Look Once) algorithm, a state-of-the-art deep learning model for real-time object detection22. The YOLO model is trained on a curated dataset of construction tools, including common items like hammers, bricks, trowels, and power tools. The model outputs bounding boxes with confidence scores, indicating the presence and identity of tools in the scene. This data is then integrated with worker tracking information to provide a holistic view of the site, allowing us to correlate tool usage with specific tasks and worker activities.
By continuously monitoring and identifying tools, the system not only ensures efficient tool management but also contributes to safety management. For instance, the system can alert supervisors if unauthorized tools are in use or if tools are being used in unsafe manners.
3.5. Productivity Analysis
Productivity analysis is a key objective of our research. By integrating the extraction and tracking of worker key points, action recognition of time series data, and object recognition in scenes, we can comprehensively understand construction activities. This understanding enables us to analyze various factors that affect productivity, such as worker actions, tool usage, and environmental conditions.First, through tool identification data, we can determine different task scenarios. Later, perform trained action recognition on the construction trades in the scene. Finally, we can better reflect the labor productivity in the construction field by establishing the connection between the counting of the results of this trade and action recognition.
In conclusion, our research method provides a comprehensive framework for analyzing construction activities and evaluating productivity. By utilizing advanced technologies such as deep learning and computer vision, we aim to improve the level of labor productivity analysis for construction industry workers.
4. Result
4.1. Dataset Production and Preprocessing
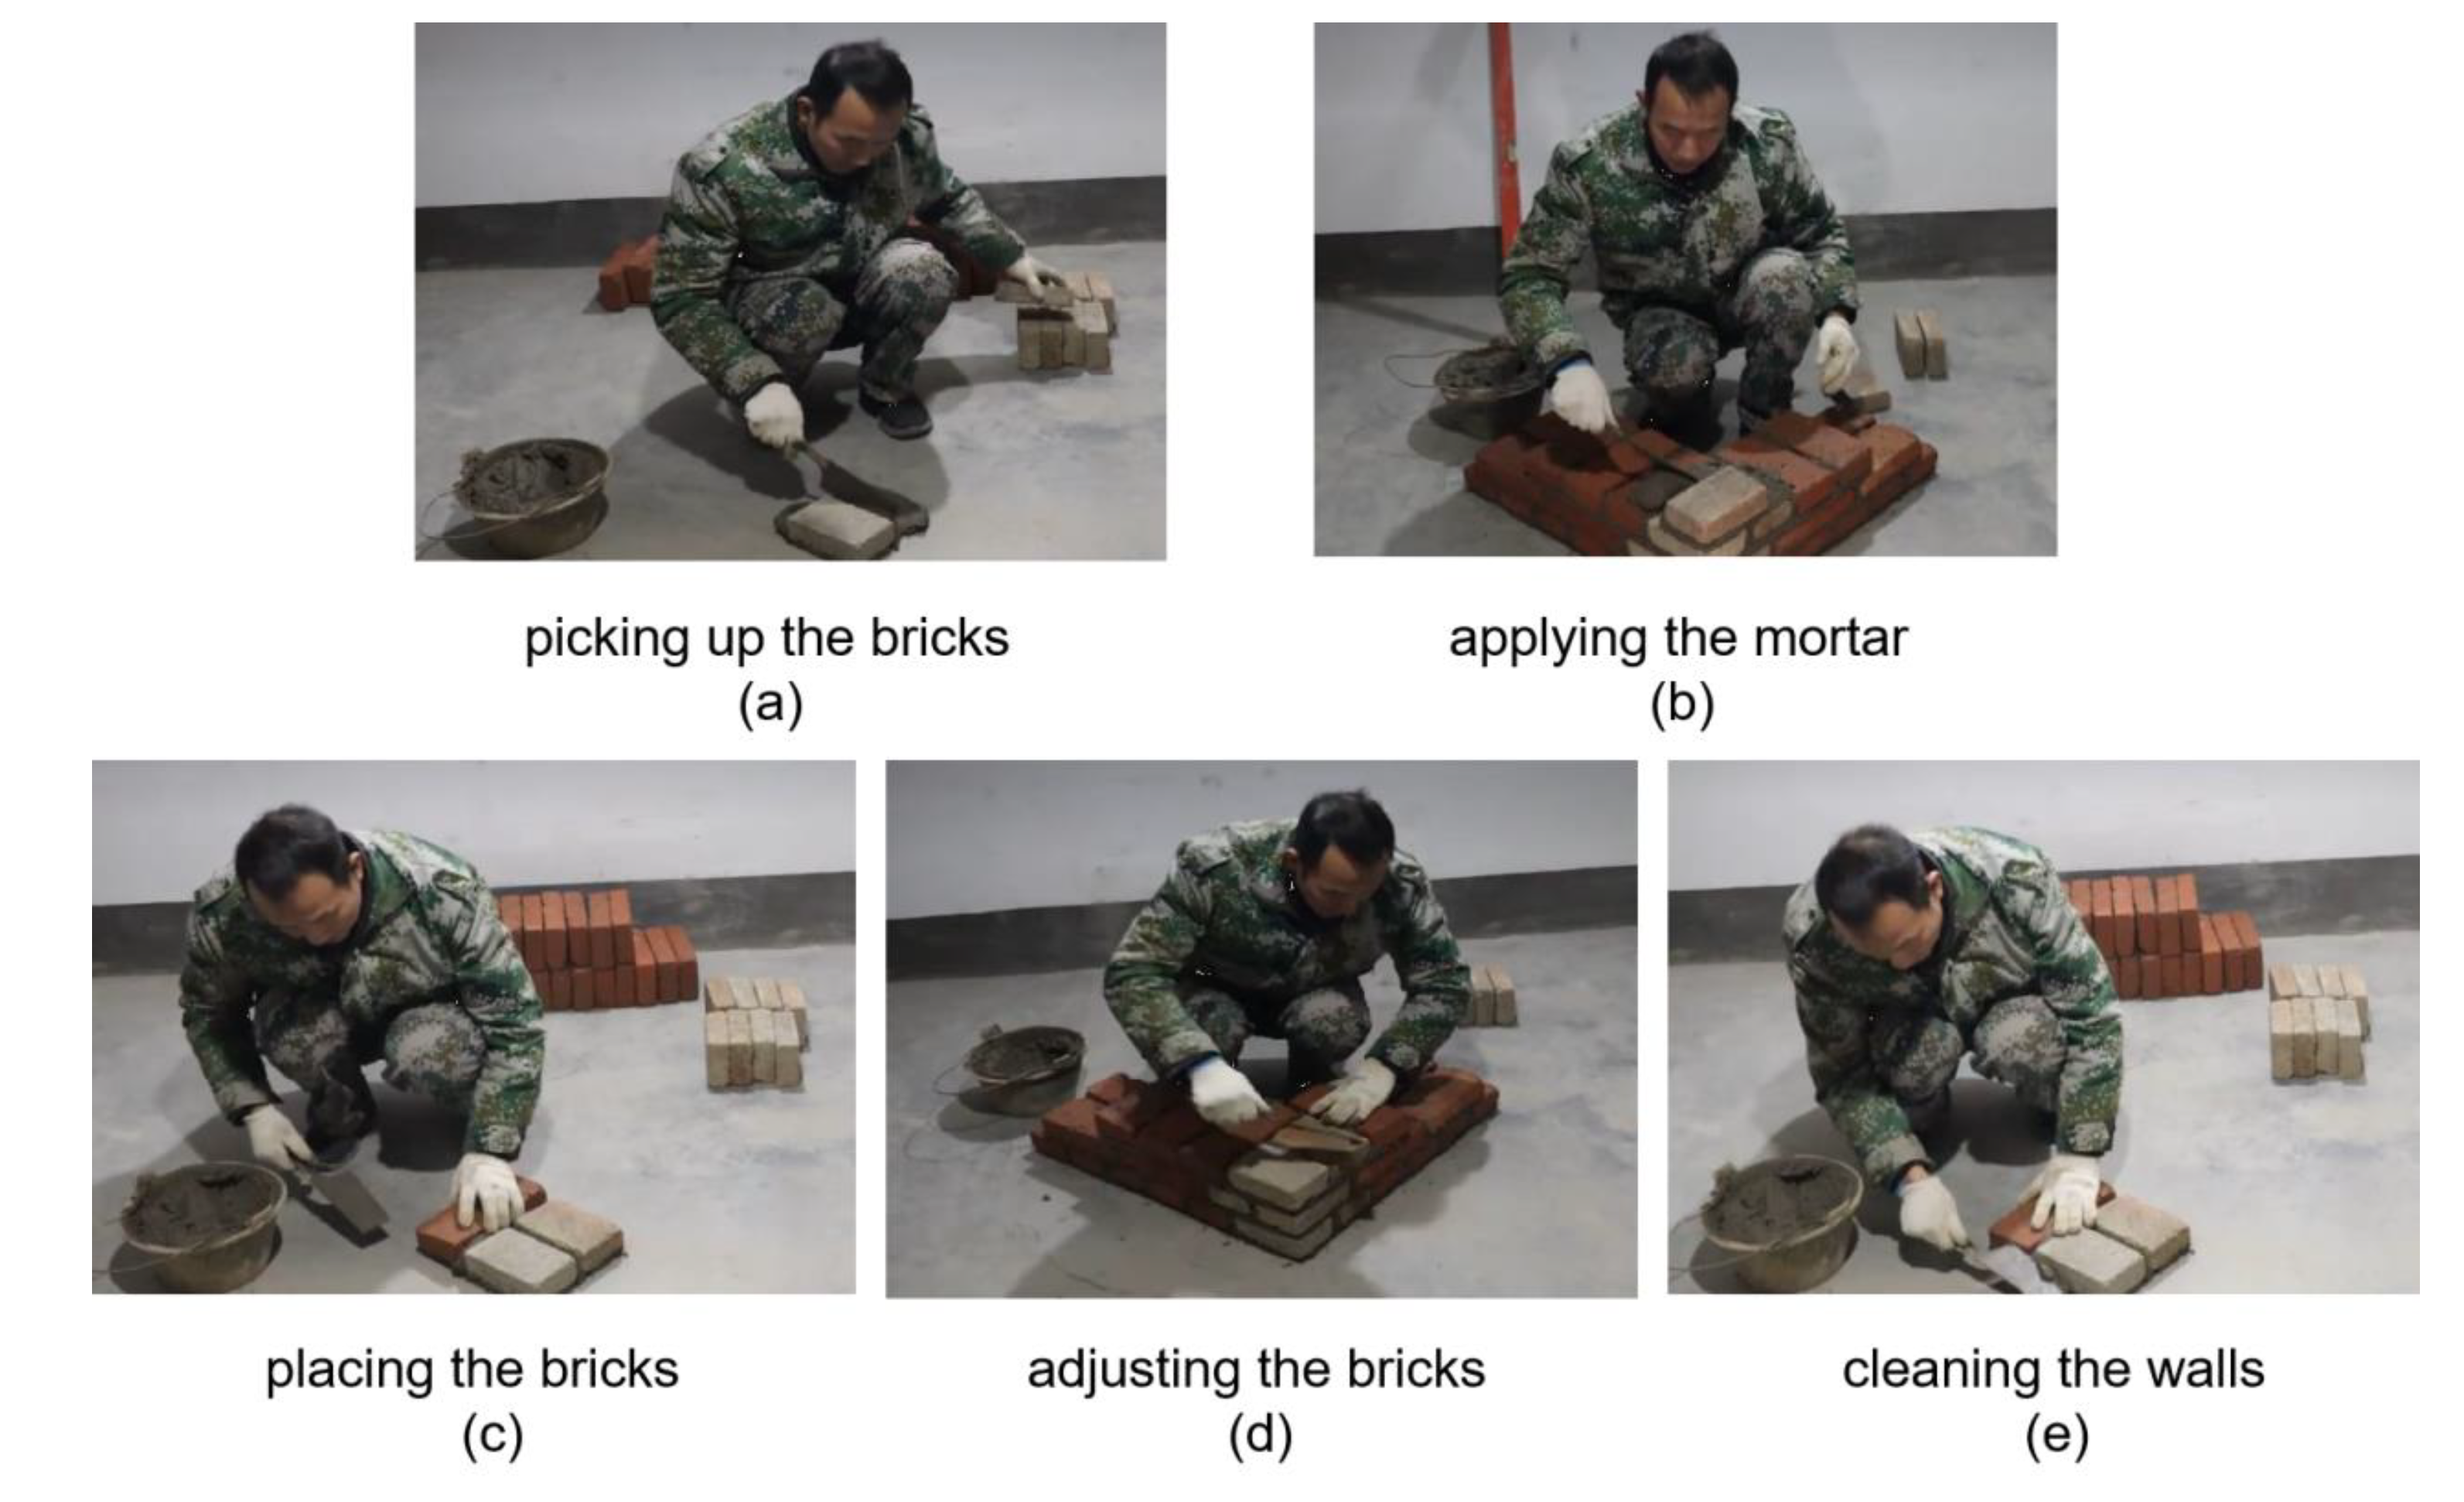
As depicted in Figure 4, the research process comprises seven steps and can be divided into three parts. The first part is action deconstruction analysis. A standard is established through deconstructive analysis to define workers' actions. In the construction industry, bricklayers are selected as the research object, and their work process is divided into five steps: applying mortar, picking up bricks, placing bricks, adjusting bricks, and cleaning the wall. Figure 6 shows the actual actions and the deconstruction of workers' actions. For instance, picking up bricks (Figure 6(a)) involves picking up bricks from the ground or other places and handing them to the bricklayer. This action is characterized by placing the right arm (the arm holding the shovel) on the chest, with the body twisted backward and the left hand elongated. Applying mortar (Figure 6(b)) is the act of spreading cement mortar paste on one or both sides of the brick. In this case, the front is facing forward, and the left and right hands are not much different in length and are of medium length. Placing the brick (Figure 6(c)) is the action of placing the brick with cement paste on the position where the brick needs to be laid. The left arm (the arm without the shovel) is extended, and the right arm is retracted. Adjusting the brick (Figure 6(d)) is the action of firmly tapping bricks and mortar. The palms of both hands are placed in front of the chest, and the lengths of the left and right hands are not much different. Cleaning the wall (Figure 6(e)) is to use a scraper to smooth the excess cement paste. The left and right hands are held straight at the same time, and there will be a slight swing during the movement.
Figure 6.
Action of bricklayers.
In the experiment, worker workmanship videos from Youtube and self-filmed ones are manually cut into five actions of workers and invalid actions, totaling six parts. Then, Mediapipe is used to read the short videos of each action. The specific data in Figure 3 is the vector output of (x,y,z). The coordinates of each key point are represented by a normalized image coordinate system. The three data are added and squared again to simplify the output. Since the sliced videos are about two seconds each, with about 20 frames per video. A total of 60 movements are obtained for training, and the total frame rate is approximately 2400. After obtaining the output of a specific frame, it is labeled and put into the LSTM model for training. The specific corresponding order between the label and the action is: 0 - applying mortar, 1 - picking up bricks, 2 - placing bricks, 3 - adjusting bricks, 4 - cleaning the wall, and 5 - invalid action.
4.2. Action Recognition Model Training
The segmented 2-second pick-up brick action video is input into the action recognition model for further processing and evaluation. After the model processes the video, the results obtained are consistent with the manually labeled outcomes, indicating that the model has been successfully trained to a preliminary level. This validation confirms that the action recognition model is able to recognize and categorize actions effectively, providing initial evidence of its capability. The model, in particular, is based on the Long Short-Term Memory (LSTM) architecture, which excels in handling time-series data. This ability allows it to analyze sequential video frames, extract meaningful features, and ultimately perform accurate action classification.Each LSTM cell contains three essential components: the input gate, the forget gate, and the output gate, all of which work together to control the flow of information within the memory unit. The input gate determines which data should be fed into the memory unit, while the forget gate decides which data should be discarded. The output gate then regulates the output of the memory unit, ensuring that relevant information is retained for future prediction. The LSTM network is a supervised learning model, which means that it requires labeled data for training. As a result, videos need to be manually divided into smaller segments, typically between 1 and 2 seconds in length, and each segment must be labeled with one of six predefined action categories.
In this case, the video segments are first processed and converted into individual frames through the use of the Mediapipe framework, which efficiently handles keypoint extraction and video frame analysis. The frames are extracted at regular intervals—specifically every 0.25 seconds—to ensure that the data maintains high accuracy. This segmentation strategy also helps prevent chaotic data distribution, which could otherwise lead to noise and imprecision in the model's predictions. With this approach, the LSTM model is provided with structured data, enabling it to learn the patterns and features of the actions within the video more effectively.By following this methodology, the system can be trained on time-sequenced video data, where each action is captured in discrete segments, allowing the LSTM model to learn how to classify complex actions accurately over time. The segmentation of video into small time units ensures that the model can identify and distinguish between various actions, such as "pick-up brick," while accounting for the sequential nature of human motion. As the model progresses through the training process, it becomes increasingly capable of recognizing the nuanced dynamics of worker actions on a construction site, further enhancing its effectiveness for real-world applications.
Figure 7.
The data recognition process of Mediapipe.
The data format recognized by Mediapipe is as shown in the following Table1.

Table 1.
The sum of the three coordinates obtained from each key point of Mediapipe.
| fps | X0 | X1 | X2 | X3 | .... | X32 |
|---|---|---|---|---|---|---|
| 1 | 0.618238 | 0.232524 | 0.555385 | 0.78614 | 0.760563 | |
| 2 | 0.651198 | 1.01199 | 0.407865 | 0.57514 | 0.499335 | |
| 3 | 0.760563 | 0 | 1.32282 | 0.407865 | 0.760563 | |
| 4 | 0.534423 | 0.555385 | 0.73582 | 0.794876 | 0.925179 | |
| 5 | 0.509691 | 0.679963 | 1.01199 | 0.464099 | 0.543936 | |
| ... | ... | ... | ... | ... | ... | ... |
| 40 | 0.525569 | 0.599635 | 0.564189 | 0 | 0.760563 |
The Long Short-Term Memory (LSTM) model can process time series data and extract features for action classification. Each LSTM unit contains three gates and a memory cell. The training of the LSTM model is based on supervised learning. Therefore, videos need to be manually segmented into 1 - 2 second clips and divided into six action types. The segmented videos input into the untrained LSTM model are first converted into video frames through Mediapipe. Output is set every 0.25 seconds to ensure accuracy and avoid chaotic data distribution.
The training process of the LSTM model is as follows: First, the previously prepared data set is divided into training set, validation set and test set in a ratio of 7:2:1. In the training stage, the video clips in the training set are input into the LSTM model in sequence. The LSTM model continuously adjusts its internal weight parameters to make the model output as close as possible to the real action label. The three gates (input gate, forget gate and output gate) work together to control the inflow and outflow of information and the state update of the memory cell. In each round of training, the loss function of the model is calculated, and the cross-entropy loss function is used to measure the difference between the model output and the real label. Continuously reduce the value of the loss function through stochastic gradient descent to optimize the parameters of the model. During the training process, the validation set is used to evaluate the performance of the model so as to adjust the hyperparameters in time and prevent overfitting. When the performance of the model on the validation set no longer improves, training can be stopped. Finally, the prepared test set is used to conduct the final performance evaluation on the trained model to determine the accuracy and generalization ability of the model in practical applications.
Figure 8.
Training Loss.
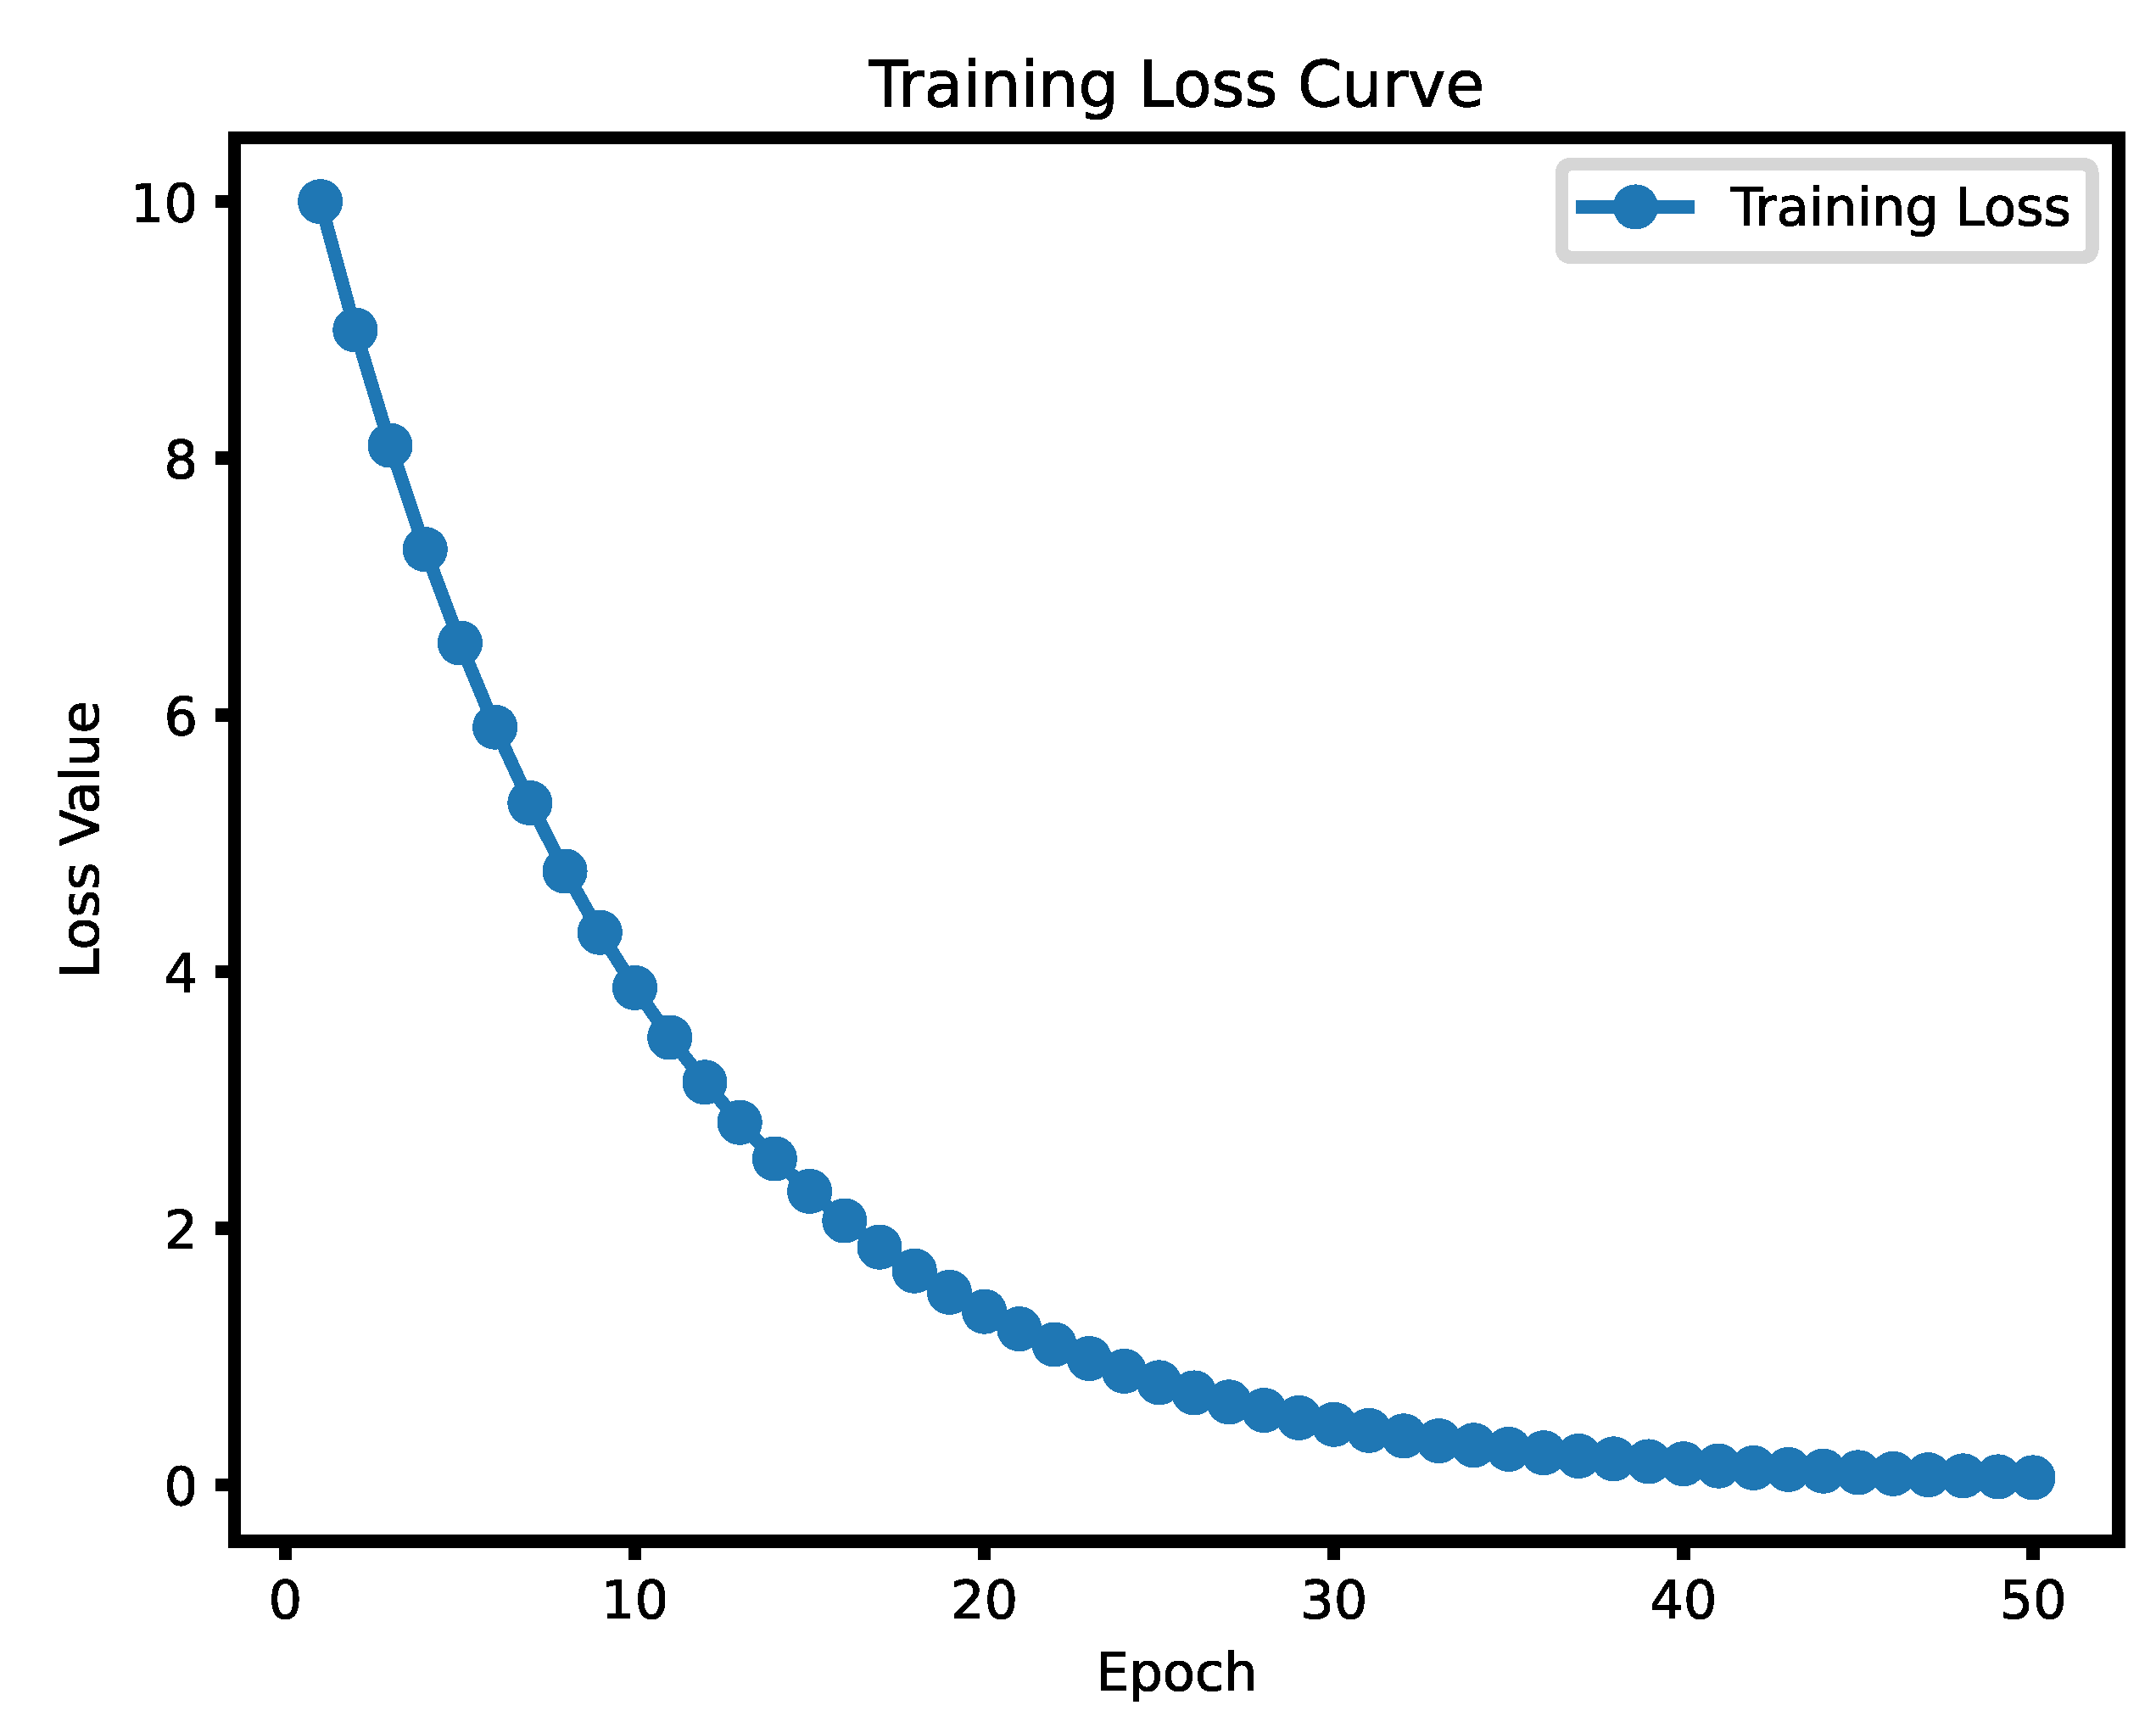
During the training process, the continuous decline of the loss function curve is a key indicator for evaluating the model's optimization progress. As training progresses, the loss function value should gradually approach zero, indicating that the difference between the model's output and the true labels is becoming smaller. In the initial stages, the loss function curve is typically higher because the model's weights are randomly initialized, leading to large prediction errors. However, as training continues, the model gradually adjusts its internal parameters to better fit the training data, and the loss function starts to steadily decrease.
In this training process, as the training progresses, the loss function curve gradually becomes smoother and tends toward a lower value, ultimately approaching zero. When the loss function curve gradually stabilizes at a lower value, it indicates that the difference between the model's output and the true labels is very small, and the model's predictive ability has significantly improved. The model has gradually learned the patterns and features within the data. At this stage, the loss curves for both the training set and the validation set should closely align and stabilize, indicating that the model is not only making accurate predictions on the training data but also demonstrating good generalization ability. This trend of gradual convergence also indicates the effectiveness and sufficiency of the training. By observing the loss function curve, we can determine when to stop training, avoid over-fitting caused by excessive training, and ensure the model's effectiveness in practical applications.
4.3. Model Test Results
Currently, the accuracy rate of worker action recognition can reach 82.23%. When using the trained model for actual detection, the actions must be consistent with the collected dataset. This is because the Mediapipe coordinates change depending on the distance from the camera. To solve this problem, video data can be continuously collected to enrich the dataset and update the model. The model can count and visualize the working hours of workers and generate bar charts. Figure 7 shows the specific location of each action, the articulation between actions, and the duration of the action. The comparison between model prediction data and real data shows that under the premise of a total duration of 38 seconds, 31.25 seconds of data are consistent, so the accuracy rate is 82.23%.
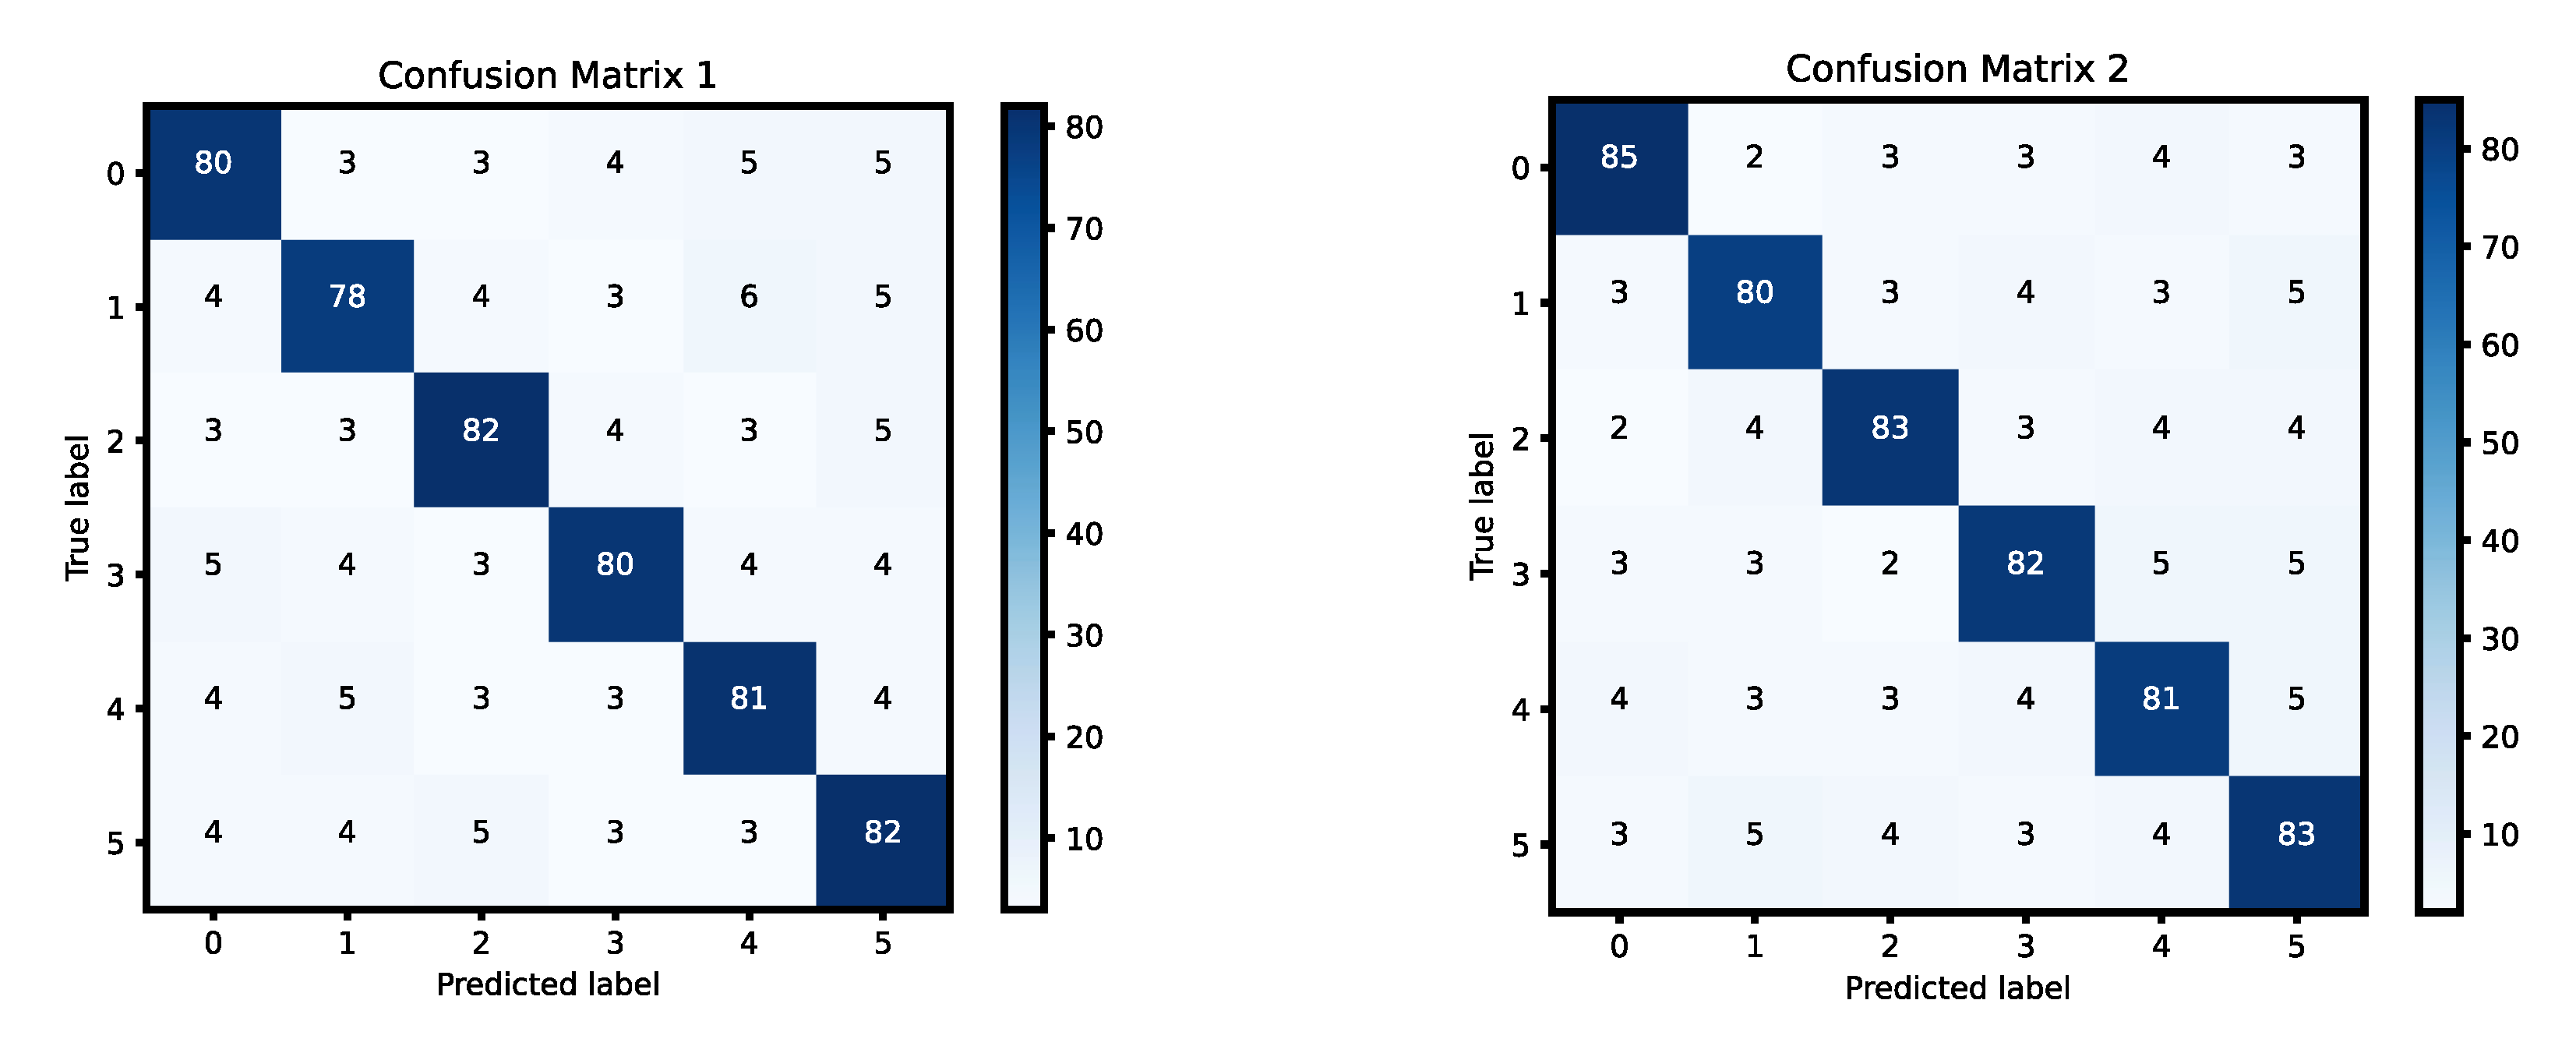
After completing the training process and performing predictions on the dataset, a confusion matrix is generated to evaluate the model's performance. The confusion matrix is a useful tool that allows us to assess how well the model performs in classifying actions and identifying errors. It consists of various cells that represent different categories of predictions, such as true positives (TP), false positives (FP), false negatives (FN), and true negatives (TN). In the context of action recognition, however, the focus is on the detection results of worker key point categories. Here, the categories are labeled as either correct or incorrect, so we only have two key components: true positives (TP) and false positives (FP). There are no false negatives (FN) or true negatives (TN), because the model does not distinguish between actions that are completely missed or correctly identified in the context of action recognition.
In this evaluation, the accuracy of each category is computed as the ratio of the number of correct predictions (TP) to the total number of actions in that category used for prediction. For example, if the model correctly predicts a certain action 8 times out of 10 attempts, the accuracy for that category will be 80%. By calculating the accuracy for each category individually, we can then compute the average accuracy of all categories. The average accuracy is simply the mean of the individual accuracies of each category.The confusion matrix provides a visual representation of the performance of the action recognition system. The matrix is typically displayed in a color-coded format, with dark blue indicating the correct classifications (TP), and lighter shades of color indicating incorrect classifications (FP). The darker the color, the higher the accuracy for that particular action category, while lighter colors suggest that the model struggled with correctly identifying certain actions. The final result of the classification model's performance, based on the confusion matrix in Figure 9, is an average accuracy of 81.67%. This indicates that the model correctly identified actions with a high degree of accuracy, though there were still some errors, as indicated by the lighter colors representing false positives (FP).
Figure 9.
Confusion matrix for LSTM.

4.4 Productivity Analysis
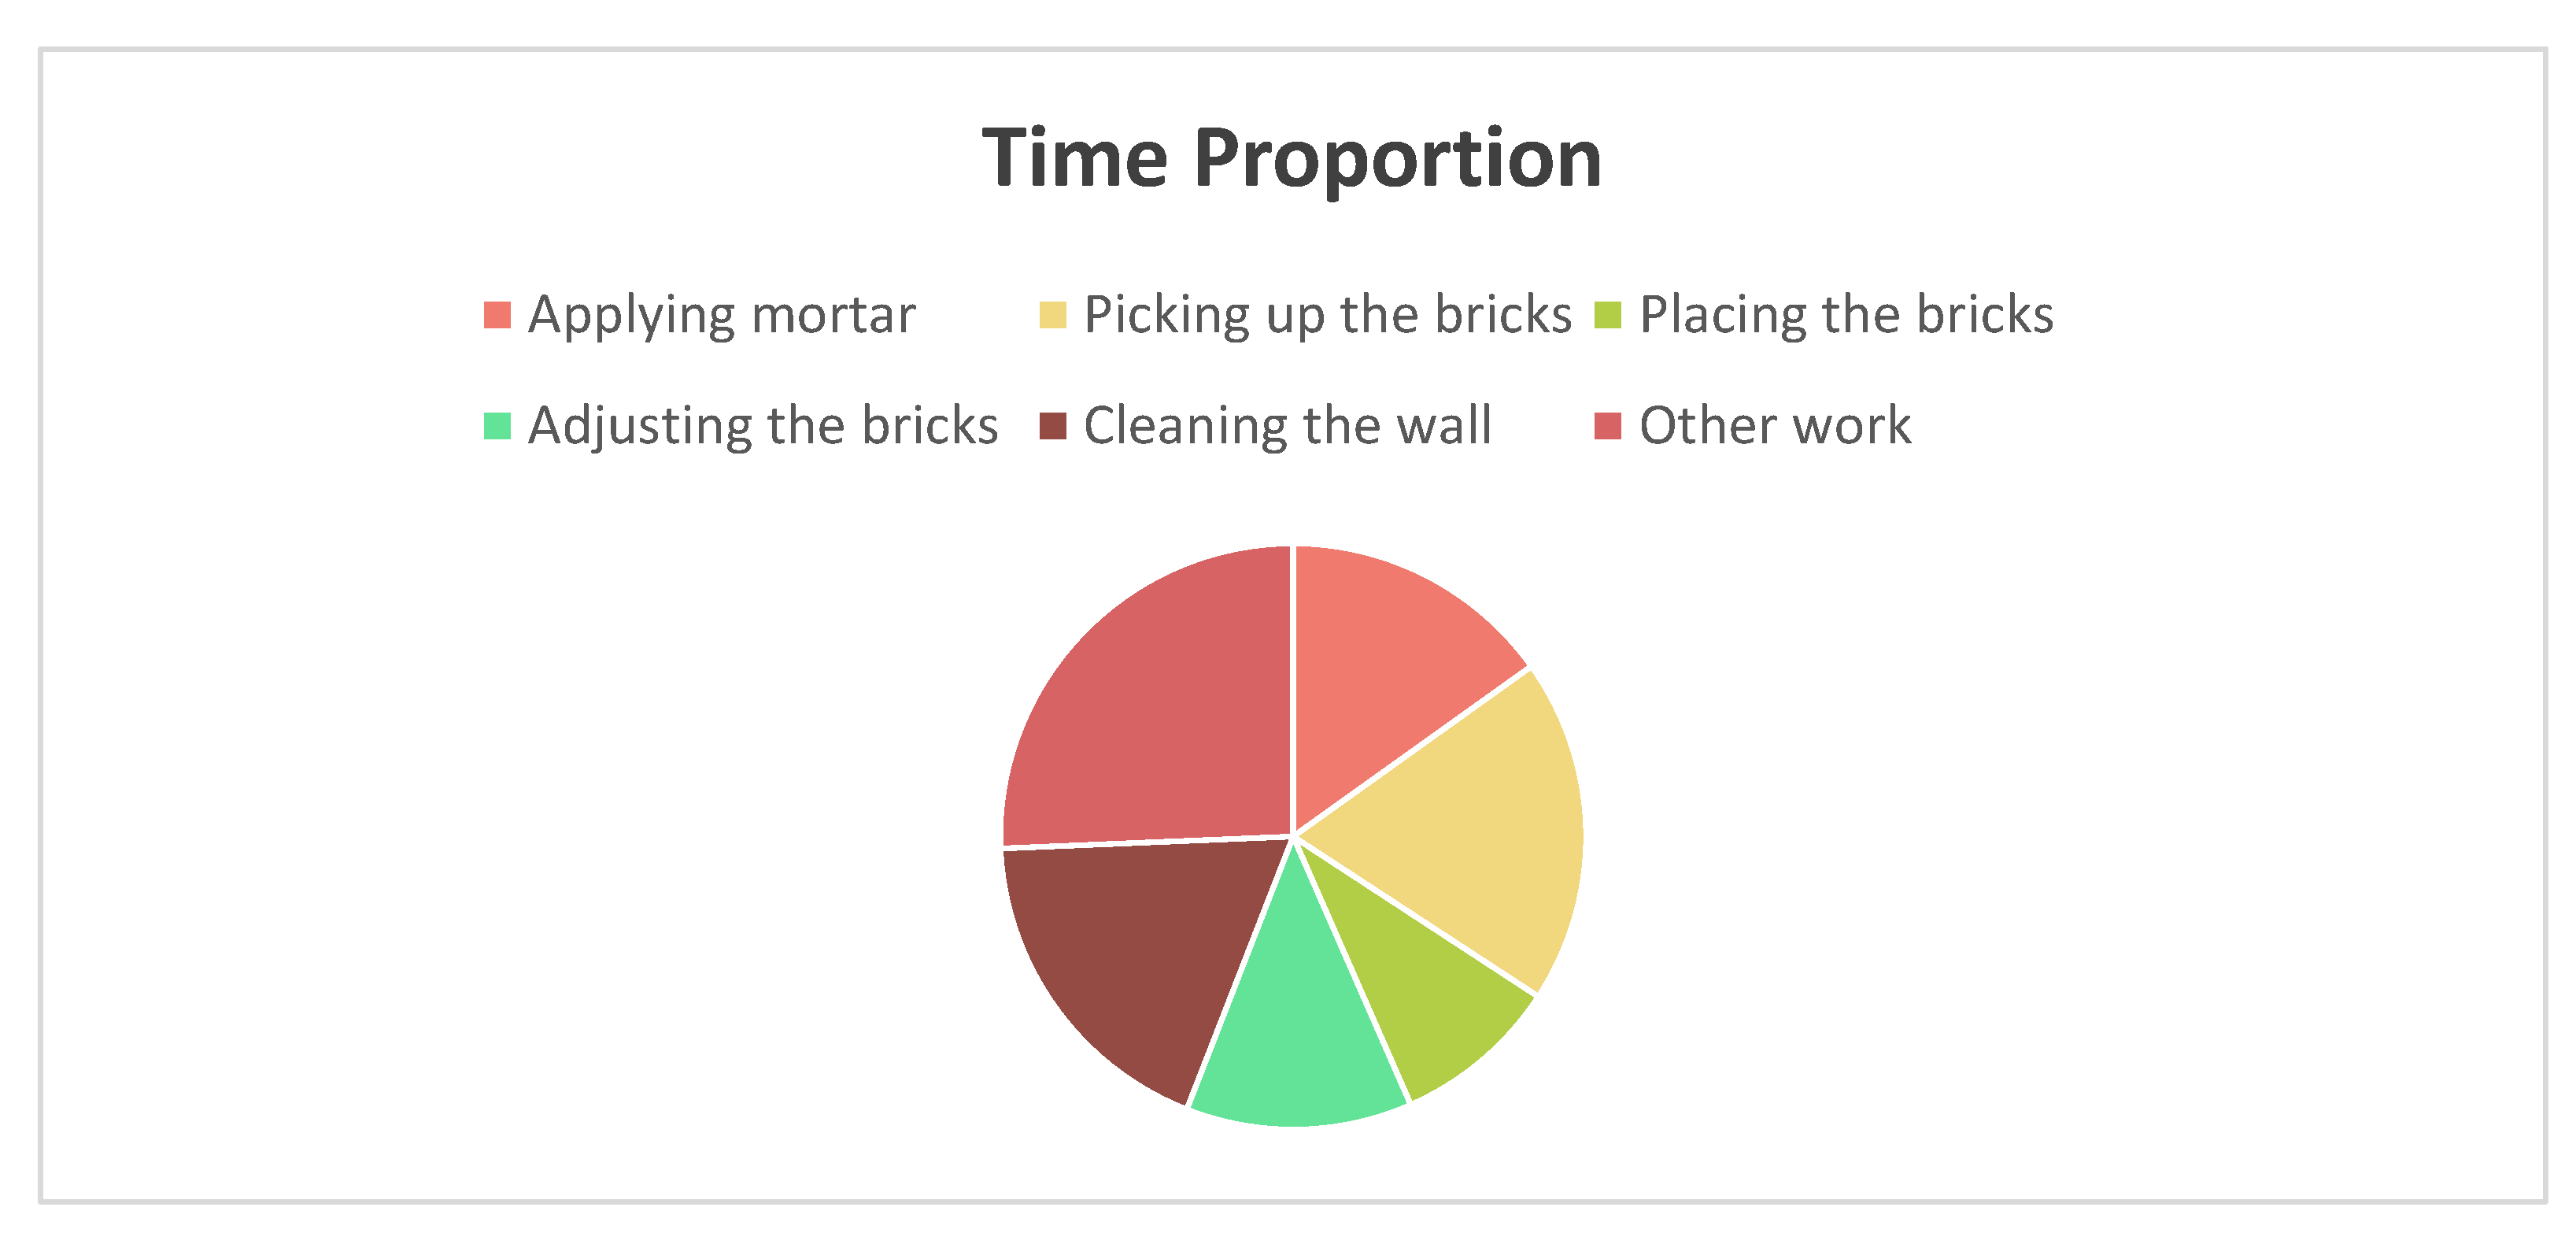
Table 2 shows the duration and percentage of the six actions (applying mortar, picking up bricks, placing bricks, adjusting bricks, cleaning the wall, and invalid action) in the entire video length. Counting the recognized actions and manually segmented action duration separately shows the accuracy of the model to a certain extent.
Table 2.
Comparison and Analysis of Manual Segmentation and Model Recognition Results.
| Name | The total time of manual segmentation (s) | Proportion of total time spent on manual segmentation (%) | The total time of model recognition (s) | Proportion of total model recognition time (%) |
|---|---|---|---|---|
| Applying mortar | 6 | 15.78 | 5.75 | 15.13 |
| Picking up the bricks | 7 | 18.42 | 7.25 | 19.07 |
| Placing the bricks | 4 | 10.52 | 3.5 | 9.21 |
| Adjusting the bricks | 4 | 10.52 | 4.75 | 12.5 |
| Cleaning the wall | 7 | 18.42 | 7 | 18.42 |
| Other work | 10 | 26.31 | 9.75 | 25.65 |
Figure 10.
Productivity recognition results combined with achievements(a). .
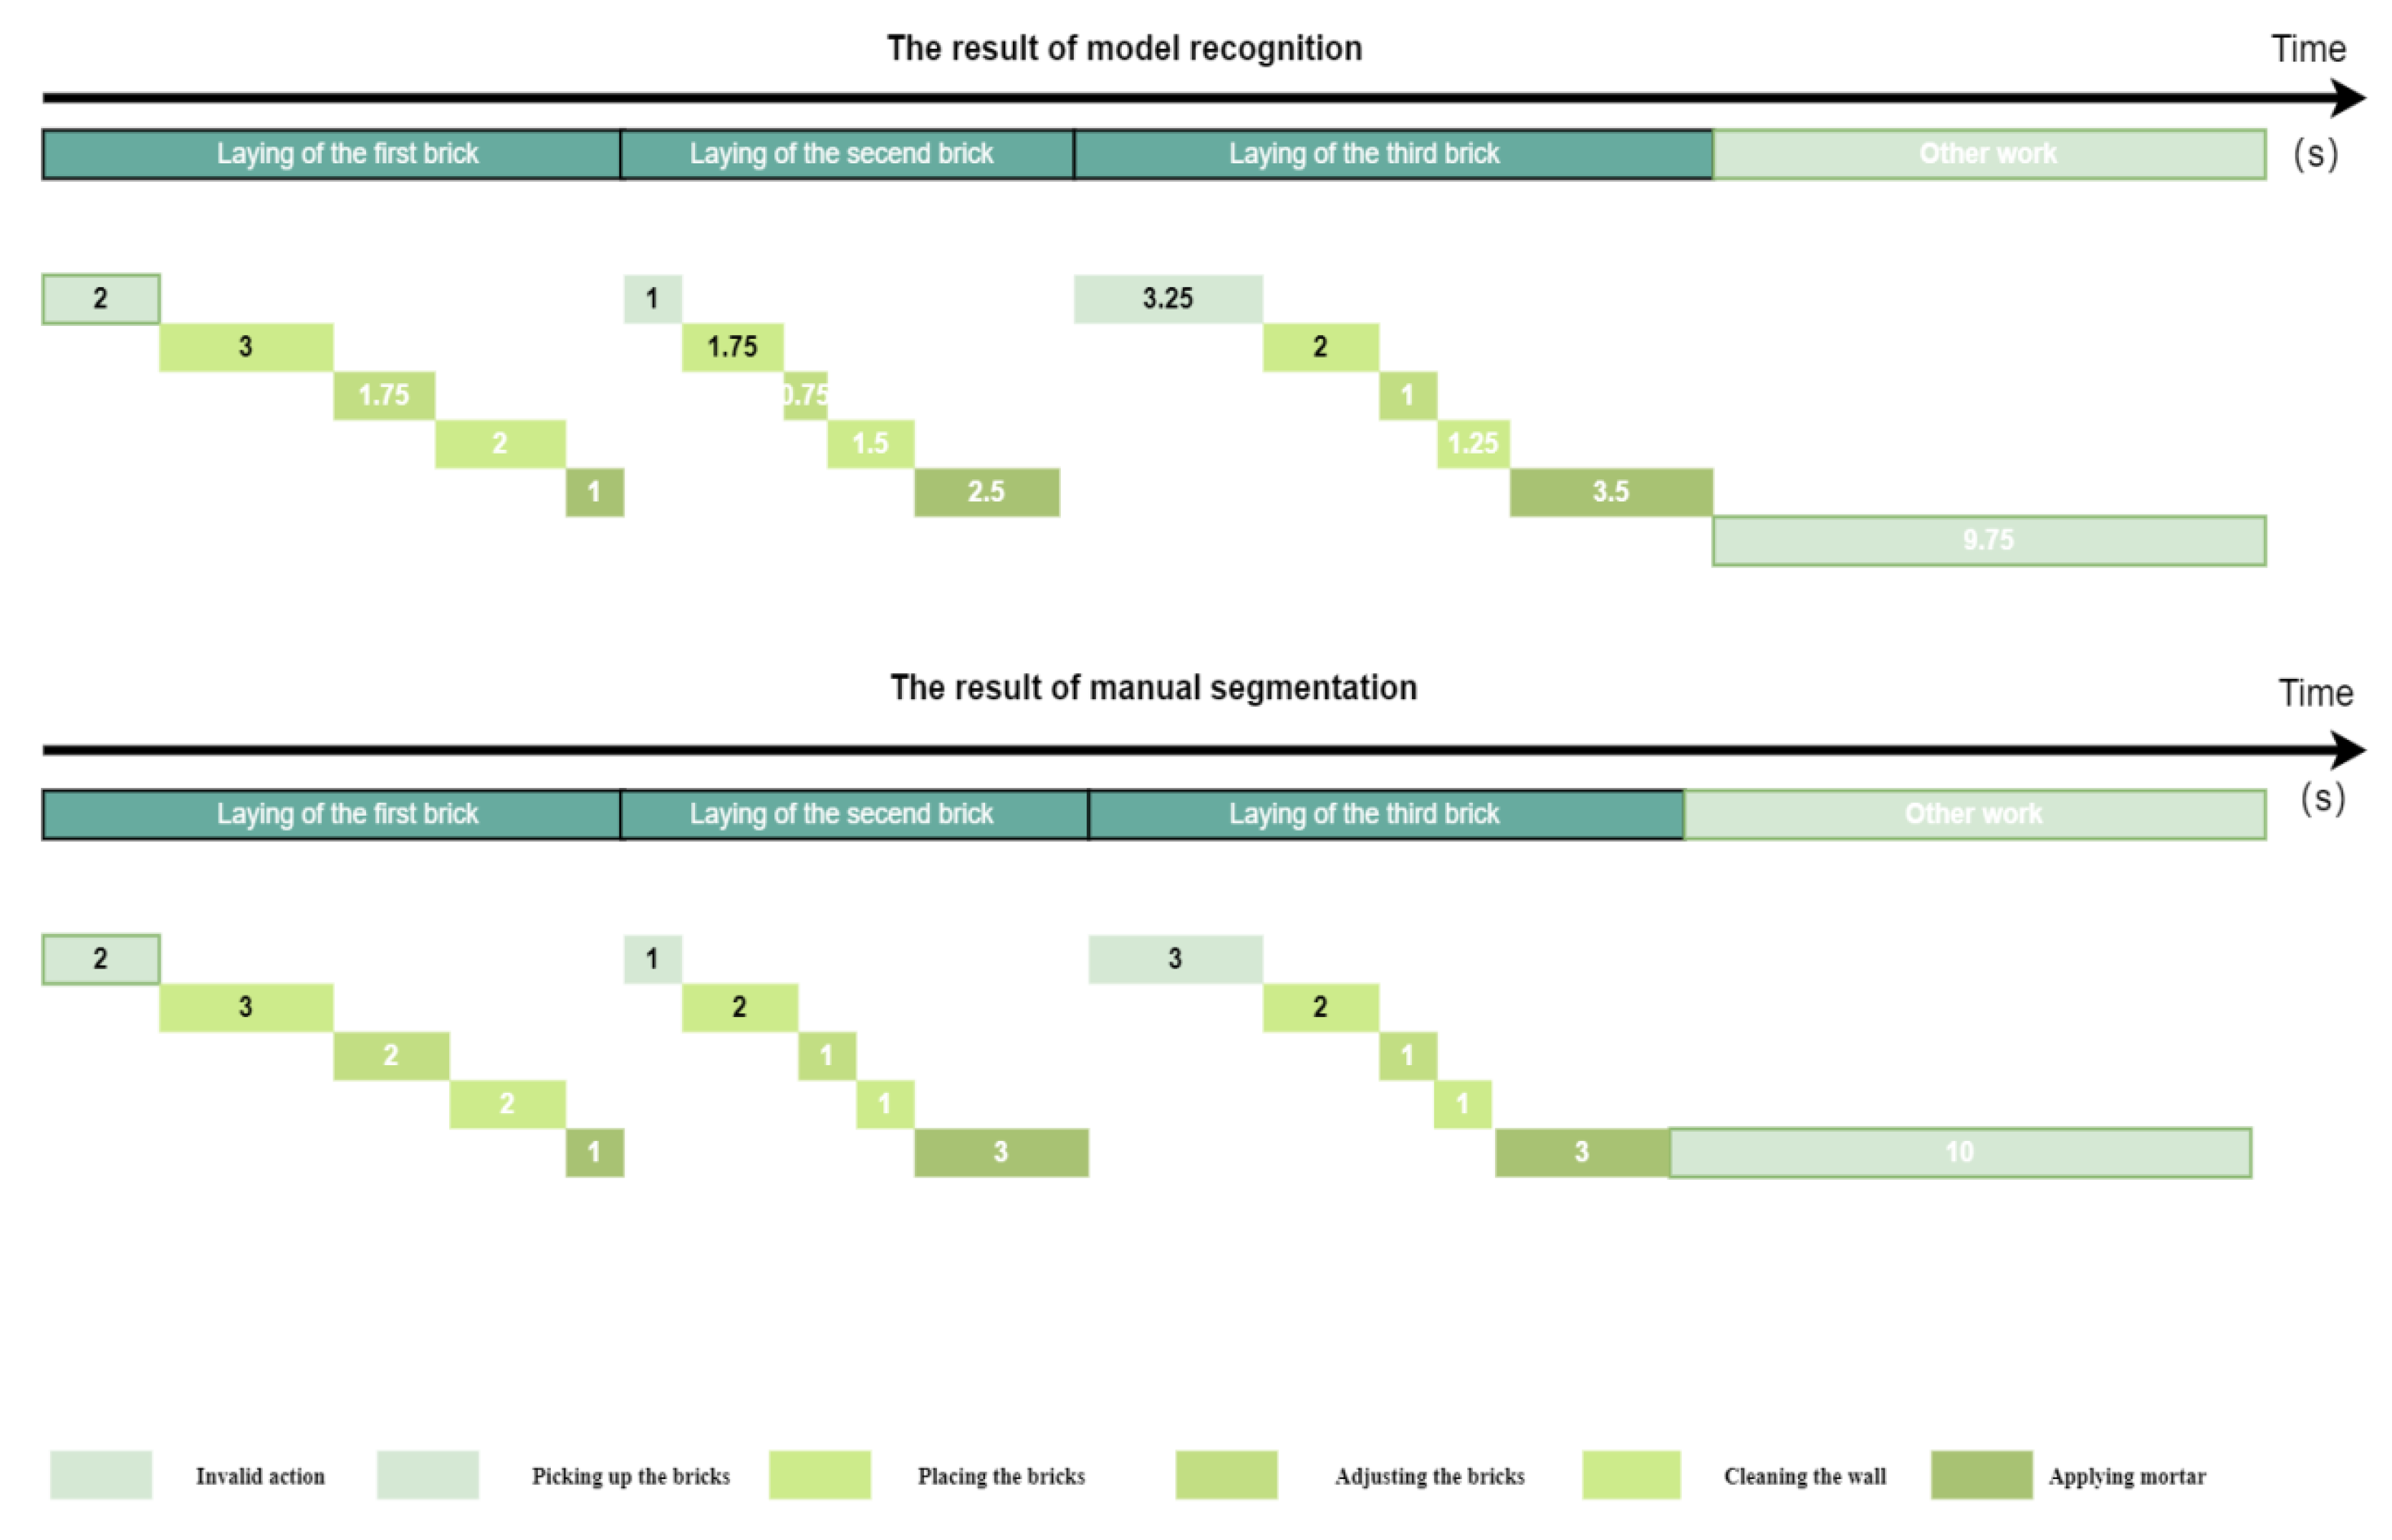
Figure 11.
Productivity recognition results combined with achievements.
This performance evaluation reveals that the model has made significant progress in recognizing worker actions, but there are still areas for improvement. The accuracy of 81.67% suggests that, while the model is able to classify most actions correctly, there are still instances where the model mistakenly classifies an action as another category, as shown by the false positives. This result is promising, as it indicates the model is well on its way to performing reliable action recognition in the context of construction worker movements. Further fine-tuning and optimization of the model will help reduce the occurrence of false positives and increase the overall accuracy.
5. Discussion
5.1. Contributions
This study offers several significant contributions to the field of construction management and efficiency assessment:
1.Innovative Methodology: One of the primary contributions of this research is the development of an automated efficiency assessment method utilizing computer vision. Traditional methods such as manual recording and work sampling are labor-intensive, time-consuming, and prone to human error. By leveraging advanced image processing algorithms and machine learning models, our approach significantly reduces reliance on manual monitoring, making efficiency assessments more objective and capable of real-time execution. Furthermore, our method includes a comprehensive analysis of the construction scene, focusing not only on worker actions but also integrating information about workers, tools, equipment, and other relevant objects, thereby providing a more holistic view of the construction process. This integrated approach aids in better identification of inefficiencies and optimization opportunities, ultimately improving construction management practices.
2.New Model Framework: We introduce a novel framework for action estimation and work time statistics. This framework utilizes state-of-the-art computer vision technology to accurately track and analyze worker activities. Unlike previous methods that primarily focus on single-object tracking, our model handles complex, multi-object dynamic construction scenes. This advancement enhances the understanding of worker activities and improves the accuracy of efficiency assessments.
3.Comprehensive Dataset: Another notable contribution is the creation and utilization of a comprehensive construction scene dataset. This dataset captures a wide range of worker activities and environmental elements at construction sites, serving as a valuable resource for further research and model training in the field of construction efficiency assessment. The richness and diversity of the dataset enhance the generalizability and robustness of our model, making it applicable to various construction scenarios and conditions.
5.2. Practical Implications
The practical significance of this study is substantial, offering multiple benefits to real-world construction projects:
1.Efficiency Enhancement: By employing automated and real-time efficiency assessment methods, we can quickly identify bottlenecks and inefficiencies in the construction process. This capability for real-time data analysis enables managers to promptly detect and address issues, thereby reducing time wasted due to inefficient operations. Additionally, automated systems can operate around the clock, ensuring that every aspect of the construction site is functioning efficiently, thus shortening project timelines. More accurate tracking of worker activities and scene analysis assists managers in making informed task allocations and optimizing workflows, thereby improving overall construction efficiency.
2.Cost Savings: Accurate efficiency assessments and timely issue detection can significantly reduce resource wastage. By optimizing worker allocation and construction processes, projects can achieve more with the same budget, thereby lowering overall construction costs. Automated monitoring reduces the need for on-site supervisory staff, saving labor costs. Moreover, effective resource management and scheduling can minimize material waste and equipment idling, further reducing project costs.
3.Decision Support: The data and analytical tools provided by this research offer strong support to project managers and decision-makers. Detailed efficiency and activity data enable managers to gain a comprehensive understanding of the actual conditions on site, leading to more informed decision-making. For instance, during the project planning phase, managers can use historical data for accurate time and resource forecasting; during construction, real-time data analysis helps adjust strategies, address unforeseen issues, and optimize construction progress. This data-driven decision support makes project management more scientific and efficient.
This study not only introduces new methods and model frameworks theoretically but also demonstrates their substantial potential in enhancing construction efficiency, saving costs, and supporting decision-making through practical application. Future work could further extend these findings to a broader range of applications, advancing the field of construction management and efficiency assessment.
6. Conclusions
This study presents a significant advancement in the field of construction management by proposing an innovative approach for automated efficiency assessment using computer vision technology. We developed a new method that reduces reliance on manual monitoring through the application of advanced image processing algorithms and machine learning models. Our approach provides a more objective, real-time evaluation of construction efficiency by integrating comprehensive scene analysis that includes not only worker actions but also interactions with tools, equipment, and other environmental elements. The introduction of a novel model framework for action estimation and work hour statistics, coupled with the creation of a comprehensive construction scene dataset, further enhances the accuracy and applicability of our system across various construction scenarios.
Despite the promising results, this study has several limitations that should be acknowledged. One major limitation is the dependence on well-lit environments for effective computer vision performance. The accuracy of the system can be adversely affected by poor lighting conditions and occlusions, which are common in dynamic construction sites. Additionally, the model's performance may vary depending on the complexity of the construction scenarios and the diversity of activities captured in the dataset. The computational requirements for processing large volumes of video data can also be significant, which may impact the scalability and cost-effectiveness of the proposed solution.
Future research should focus on addressing these limitations to further enhance the robustness and practicality of the system. Improvements could include developing algorithms capable of handling varying lighting conditions and occlusions, as well as incorporating multi-sensor data to complement visual information and provide a more comprehensive assessment. Expanding the dataset to cover a broader range of construction scenarios and worker activities would also improve the model's generalizability. Additionally, advancements in computational efficiency could help reduce costs and make the technology more accessible for widespread use. Overall, ongoing research and technological advancements hold the potential to refine and expand the applications of automated efficiency assessment, driving further innovations in construction management and efficiency evaluation.
Author Contributions
Conceptualization, C.Z. (Chaojun Zhang), J.Z. (Jiayi Zhou) and Y.L. (Yunlong Liao); methodology, C.Z.; software, C.Z.; validation, C.Z.; formal analysis, C.Z.; investigation, C.Z.; resources, H.L. (Huan Liu); data curation, C.Z.; writing—original draft, C.Z.; writing—review and editing, H.L.; visualization, C.Z.; supervision, C.M. (Chao Mao); project administration, C.M.; funding acquisition, H.L. All authors have read and agreed to the published version of the manuscript.
Funding
This research received no external funding.
Data Availability Statement
We encourage all authors of articles published in MDPI journals to share their research data. In this section, please provide details regarding where data supporting reported results can be found, including links to publicly archived datasets analyzed or generated during the study. Where no new data were created, or where data is unavailable due to privacy or ethical restrictions, a statement is still required. Suggested Data Availability Statements are available in section “MDPI Research Data Policies” at https://www.mdpi.com/ethics.
Acknowledgments
In this section, you can acknowledge any support given which is not covered by the author contribution or funding sections. This may include administrative and technical support, or donations in kind (e.g., materials used for experiments). Where GenAI has been used for purposes such as generating text, data, or graphics, or for study design, data collection, analysis, or interpretation of data, please add “During the preparation of this manuscript/study, the author(s) used [tool name, version information] for the purposes of [description of use]. The authors have reviewed and edited the output and take full responsibility for the content of this publication.”.
Conflicts of Interest
Declare conflicts of interest or state “The authors declare no conflicts of interest.” Authors must identify and declare any personal circumstances or interest that may be perceived as inappropriately influencing the representation or interpretation of reported research results. Any role of the funders in the design of the study; in the collection, analyses or interpretation of data; in the writing of the manuscript; or in the decision to publish the results must be declared in this section. If there is no role, please state “The funders had no role in the design of the study; in the collection, analyses, or interpretation of data; in the writing of the manuscript; or in the decision to publish the results”.
References
- Akhavian, R.; Behzadan, A.H. Productivity Analysis of Construction Worker Activities Using Smartphone Sensors.
- Alashhab, S.; Gallego, A.J.; Lozano, M.Á. Efficient Gesture Recognition for the Assistance of Visually Impaired People Using Multi-Head Neural Networks. Eng. Appl. Artif. Intell. 2022, 114, 105188. [Google Scholar] [CrossRef]
- Arshad, S.; Akinade, O.; Bello, S.; Bilal, M. Computer Vision and IoT Research Landscape for Health and Safety Management on Construction Sites. J. Build. Eng. 2023, 76, 107049. [Google Scholar] [CrossRef]
- Bassier, M.; Vergauwen, M. Unsupervised Reconstruction of Building Information Modeling Wall Objects from Point Cloud Data. Autom. Constr. 2020, 120, 103338. [Google Scholar] [CrossRef]
- Chan, A.P.C.; Yi, W.; Wong, D.P.; Yam, M.C.H.; Chan, D.W.M. Determining an Optimal Recovery Time for Construction Rebar Workers after Working to Exhaustion in a Hot and Humid Environment. Build. Environ. 2012, 58, 163–171. [Google Scholar] [CrossRef]
- Gong, J.; Caldas, C.H. Computer Vision-Based Video Interpretation Model for Automated Productivity Analysis of Construction Operations. J. Comput. Civ. Eng. 2010, 24, 252–263. [Google Scholar] [CrossRef]
- Gouett, M.C.; Haas, C.T.; Goodrum, P.M.; Caldas, C.H. Activity Analysis for Direct-Work Rate Improvement in Construction. J. Constr. Eng. Manag. 2011, 137, 1117–1124. [Google Scholar] [CrossRef]
- Zhang, H.; Yan, X.; Li, H. Ergonomic Posture Recognition Using 3D View-Invariant Features from Single Ordinary Camera. Autom. Constr. 2018, 94, 1–10. [Google Scholar] [CrossRef]
- Zhao, J.; Zhu, N.; Lu, S. Productivity Model in Hot and Humid Environment Based on Heat Tolerance Time Analysis. Build. Environ. 2009, 44, 2202–2207. [Google Scholar] [CrossRef]
- Tian, Y.; Chen, J.; Kim, J.I.; Kim, J. Lightweight Deep Learning Framework for Recognizing Construction Workers’ Activities Based on Simplified Node Combinations. Autom. Constr. 2024, 158, 105236. [Google Scholar] [CrossRef]
- Sherafat, B.; Ahn, C.R.; Akhavian, R.; Behzadan, A.H.; Golparvar-Fard, M.; Kim, H.; Lee, Y.-C.; Rashidi, A.; Azar, E.R. Automated Methods for Activity Recognition of Construction Workers and Equipment: State-of-the-Art Review. J. Constr. Eng. Manag. 2020, 146, 03120002. [Google Scholar] [CrossRef]
- Dixit, S.; Mandal, S.N.; Thanikal, J.V.; Saurabh, K. Evolution of Studies in Construction Productivity: A Systematic Literature Review (2006–2017). Ain Shams Eng. J. 2019, 10, 555–564. [Google Scholar] [CrossRef]
- Ghodrati, N.; Yiu, T.W.; Wilkinson, S. Unintended Consequences of Management Strategies for Improving Labor Productivity in Construction Industry. J. Safety Res. 2018, 67, 107–116. [Google Scholar] [CrossRef] [PubMed]
- Alwasel, A.; Sabet, A.; Nahangi, M.; Haas, C.T.; Abdel-Rahman, E. Identifying Poses of Safe and Productive Masons Using Machine Learning. Autom. Constr. 2017, 84, 345–355. [Google Scholar] [CrossRef]
- Luo, X.; Li, H.; Cao, D.; Yu, Y.; Yang, X.; Huang, T. Towards Efficient and Objective Work Sampling: Recognizing Workers’ Activities in Site Surveillance Videos with Two-Stream Convolutional Networks. Autom. Constr. 2018, 94, 360–370. [Google Scholar] [CrossRef]
- Luo, X.; Li, H.; Cao, D.; Dai, F.; Seo, J.; Lee, S. Recognizing Diverse Construction Activities in Site Images via Relevance Networks of Construction Related Objects Detected by Convolutional Neural Networks. J. Comput. Civ. Eng. 2017, 32. [Google Scholar] [CrossRef]
- Alaloul, W.S.; Alzubi, K.M.; Malkawi, A.B.; Al Salaheen, M.; Musarat, M.A. Productivity Monitoring in Building Construction Projects: A Systematic Review. Eng. Constr. Archit. Manag. 2022, 29, 2760–2785. [Google Scholar]
- Baek, J.; Kim, D.; Choi, B. Deep Learning-Based Automated Productivity Monitoring for on-Site Module Installation in off-Site Construction. Dev. Built Environ. 2024, 18, 100382. [Google Scholar] [CrossRef]
- Chen, C.; Zhu, Z.; Hammad, A. Automated Excavators Activity Recognition and Productivity Analysis from Construction Site Surveillance Videos. Autom. Constr. 2020, 110, 103045. [Google Scholar] [CrossRef]
- Chen, X.; Wang, Y.; Wang, J.; Bouferguene, A.; Al-Hussein, M. Vision-Based Real-Time Process Monitoring and Problem Feedback for Productivity-Oriented Analysis in off-Site Construction. Autom. Constr. 2024, 162, 105389. [Google Scholar] [CrossRef]
- Work Estimation of Construction Workers for Productivity Monitoring Using Kinematic Data and Deep Learning. Autom. Constr. 2023, 152, 104932. [CrossRef]
- Teizer, J.; Cheng, T.; Fang, Y. Location Tracking and Data Visualization Technology to Advance Construction Ironworkers’ Education and Training in Safety and Productivity. Autom. Constr. 2013, 35, 53–68. [Google Scholar] [CrossRef]
- Small, E.P.; Baqer, M. Examination of Job-Site Layout Approaches and Their Impact on Construction Job-Site Productivity. Procedia Eng. 2016, 164, 383–388. [Google Scholar] [CrossRef]
- Qi, K.; Owusu, E.K.; Francis Siu, M.-F.; Albert Chan, P.-C. A Systematic Review of Construction Labor Productivity Studies: Clustering and Analysis through Hierarchical Latent Dirichlet Allocation. Ain Shams Eng. J. 2024, 102896. [Google Scholar] [CrossRef]
- Oral, M.; Oral, E.L.; Aydın, A. Supervised vs. Unsupervised Learning for Construction Crew Productivity Prediction. Autom. Constr. 2012, 22, 271–276. [Google Scholar] [CrossRef]
- Cheng, M.-Y.; Khitam, A.F.K.; Tanto, H.H. Construction Worker Productivity Evaluation Using Action Recognition for Foreign Labor Training and Education: A Case Study of Taiwan. Autom. Constr. 2023, 150, 104809. [Google Scholar] [CrossRef]
- Luo, H.; Xiong, C.; Fang, W.; Love, P.E.D.; Zhang, B.; Ouyang, X. Convolutional Neural Networks: Computer Vision-Based Workforce Activity Assessment in Construction. Autom. Constr. 2018, 94, 282–289. [Google Scholar] [CrossRef]
- Jacobsen, E.L.; Teizer, J.; Wandahl, S. Work Estimation of Construction Workers for Productivity Monitoring Using Kinematic Data and Deep Learning. Autom. Constr. 2023, 152, 104932. [Google Scholar] [CrossRef]
- Bassino-Riglos, F.; Mosqueira-Chacon, C.; Ugarte, W. AutoPose: Pose Estimation for Prevention of Musculoskeletal Disorders Using LSTM. In Innovative Intelligent Industrial Production and Logistics; Terzi, S., Madani, K., Gusikhin, O., Panetto, H., Eds.; Communications in Computer and Information Science; Springer Nature Switzerland: Cham, 2023; ISBN 978-3-031-49338-6. [Google Scholar]
- Han, S.; Lee, S. A Vision-Based Motion Capture and Recognition Framework for Behavior-Based Safety Management. Autom. Constr. 2013, 35, 131–141. [Google Scholar] [CrossRef]
- Cheng, M.-Y.; Khitam, A.F.K.; Tanto, H.H. Construction Worker Productivity Evaluation Using Action Recognition for Foreign Labor Training and Education: A Case Study of Taiwan. Autom. Constr. 2023, 150, 104809. [Google Scholar] [CrossRef]
- Akhavian, R.; Behzadan, A.H. Smartphone-Based Construction Workers’ Activity Recognition and Classification. Autom. Constr. 2016, 71, 198–209. [Google Scholar] [CrossRef]
- Nath, N.D.; Akhavian, R.; Behzadan, A.H. Ergonomic Analysis of Construction Worker’s Body Postures Using Wearable Mobile Sensors. Appl. Ergon. 2017, 62, 107–117. [Google Scholar] [CrossRef] [PubMed]
- Baduge, S.K.; Thilakarathna, S.; Perera, J.S.; Arashpour, M.; Sharafi, P.; Teodosio, B.; Shringi, A.; Mendis, P. Artificial Intelligence and Smart Vision for Building and Construction 4.0: Machine and Deep Learning Methods and Applications. Autom. Constr. 2022, 141, 104440. [Google Scholar] [CrossRef]
- Escorcia, V.; Dávila, M.A.; Golparvar-Fard, M.; Niebles, J.C. Automated Vision-Based Recognition of Construction Worker Actions for Building Interior Construction Operations Using RGBD Cameras. In Proceedings of the Construction Research Congress 2012; American Society of Civil Engineers: West Lafayette, Indiana, United States, May 17, 2012; pp. 879–888. [Google Scholar]
- Fang, W.; Ding, L.; Love, P.E.D.; Luo, H.; Li, H.; Peña-Mora, F.; Zhong, B.; Zhou, C. Computer Vision Applications in Construction Safety Assurance. Autom. Constr. 2020, 110, 103013. [Google Scholar] [CrossRef]
- Kim, J.; Chi, S. A Few-Shot Learning Approach for Database-Free Vision-Based Monitoring on Construction Sites. Autom. Constr. 2021, 124, 103566. [Google Scholar] [CrossRef]
- Luo, H.; Wang, M.; Wong, P.K.-Y.; Cheng, J.C.P. Full Body Pose Estimation of Construction Equipment Using Computer Vision and Deep Learning Techniques. Autom. Constr. 2020, 110, 103016. [Google Scholar] [CrossRef]
- Mansouri, S.; Castronovo, F.; Akhavian, R. Analysis of the Synergistic Effect of Data Analytics and Technology Trends in the AEC/FM Industry. J. Constr. Eng. Manag. 2020, 146, 04019113. [Google Scholar] [CrossRef]
- Balci, R.; Aghazadeh, F. The Effect of Work-Rest Schedules and Type of Task on the Discomfort and Performance of VDT Users. Ergonomics 2003, 46, 455–465. [Google Scholar] [CrossRef]
- Kim, H.; Ham, Y.; Kim, W.; Park, S.; Kim, H. Vision-Based Nonintrusive Context Documentation for Earthmoving Productivity Simulation. Autom. Constr. 2019, 102, 135–147. [Google Scholar] [CrossRef]
- Kim, J.; Golabchi, A.; Han, S.; Lee, D.-E. Manual Operation Simulation Using Motion-Time Analysis toward Labor Productivity Estimation: A Case Study of Concrete Pouring Operations. Autom. Constr. 2021, 126, 103669. [Google Scholar] [CrossRef]
- Mirahadi, F.; Zayed, T. Simulation-Based Construction Productivity Forecast Using Neural-Network-Driven Fuzzy Reasoning. Autom. Constr. 2016, 65, 102–115. [Google Scholar] [CrossRef]
- Rao, A.S.; Radanovic, M.; Liu, Y.; Hu, S.; Fang, Y.; Khoshelham, K.; Palaniswami, M.; Ngo, T. Real-Time Monitoring of Construction Sites: Sensors, Methods, and Applications. Autom. Constr. 2022, 136, 104099. [Google Scholar] [CrossRef]
- Ryu, J.; McFarland, T.; Banting, B.; Haas, C.T.; Abdel-Rahman, E. Health and Productivity Impact of Semi-Automated Work Systems in Construction. Autom. Constr. 2020, 120, 103396. [Google Scholar] [CrossRef]
- Xiao, B.; Yin, X.; Kang, S.-C. Vision-Based Method of Automatically Detecting Construction Video Highlights by Integrating Machine Tracking and CNN Feature Extraction. Autom. Constr. 2021, 129, 103817. [Google Scholar] [CrossRef]
- Xiao, B.; Yin, X.; Kang, S.-C. Corrigendum to ‘Vision-Based Method of Automatically Detecting Construction Video Highlights by Integrating Machine Tracking and CNN Feature Extraction’ [Journal of Automation in Construction 129(2021) 103817]. Autom. Constr. 2021, 132, 103924. [Google Scholar] [CrossRef]
- Zhang, M.; Zhou, Y.; Xu, X.; Ren, Z.; Zhang, Y.; Liu, S.; Luo, W. Multi-View Emotional Expressions Dataset Using 2D Pose Estimation. Sci. Data 2023, 10, 649. [Google Scholar] [CrossRef]
- Bora, J.; Dehingia, S.; Boruah, A.; Chetia, A.A.; Gogoi, D. Real-Time Assamese Sign Language Recognition Using MediaPipe and Deep Learning. Procedia Comput. Sci. 2023, 218, 1384–1393. [Google Scholar] [CrossRef]
- Sundar, B.; Bagyammal, T. American Sign Language Recognition for Alphabets Using MediaPipe and LSTM. Procedia Comput. Sci. 2022, 215, 642–651. [Google Scholar] [CrossRef]
- Bazarevsky, V.; Grishchenko, I.; Raveendran, K.; Zhu, T.; Zhang, F.; Grundmann, M. BlazePose: On-Device Real-Time Body Pose Tracking 2020.
- Konstantinou, E. Vision-Based Construction Worker Task Productivity Monitoring. PhD Thesis, 2018.
- Teizer, J. Status Quo and Open Challenges in Vision-Based Sensing and Tracking of Temporary Resources on Infrastructure Construction Sites. Adv. Eng. Inform. 2015, 29, 225–238. [Google Scholar] [CrossRef]
- Xiao, B.; Xiao, H.; Wang, J.; Chen, Y. Vision-Based Method for Tracking Workers by Integrating Deep Learning Instance Segmentation in off-Site Construction. Autom. Constr. 2022, 136, 104148. [Google Scholar] [CrossRef]
- Xiao, B.; Zhang, Y.; Chen, Y.; Yin, X. A Semi-Supervised Learning Detection Method for Vision-Based Monitoring of Construction Sites by Integrating Teacher-Student Networks and Data Augmentation. Adv. Eng. Inform. 2021, 50, 101372. [Google Scholar] [CrossRef]
- Gong, J.; Caldas, C.H. An Intelligent Video Computing Method for Automated Productivity Analysis of Cyclic Construction Operations. In Proceedings of the Computing in Civil Engineering (2009); American Society of Civil Engineers: Austin, Texas, United States, June 19, 2009; pp. 64–73. [Google Scholar]
- Ishioka, H.; Weng, X.; Man, Y.; Kitani, K. Single Camera Worker Detection, Tracking and Action Recognition in Construction Site. In Proceedings of the ISARC. Proceedings of the International Symposium on Automation and Robotics in Construction; IAARC Publications, 2020; Vol. 37, pp. 653–660.
- Kikuta, T.; Chun, P. Development of an Action Classification Method for Construction Sites Combining Pose Assessment and Object Proximity Evaluation. J. Ambient Intell. Humaniz. Comput. 2024, 15, 2255–2267. [Google Scholar] [CrossRef]
- Li, C.; Lee, S. Computer Vision Techniques for Worker Motion Analysis to Reduce Musculoskeletal Disorders in Construction. In Proceedings of the Computing in Civil Engineering (2011); American Society of Civil Engineers: Miami, Florida, United States, June 16, 2011; pp. 380–387. [Google Scholar]
- Panahi, R.; Louis, J.; Aziere, N.; Podder, A.; Swanson, C. Identifying Modular Construction Worker Tasks Using Computer Vision. In Proceedings of the Computing in Civil Engineering 2021; American Society of Civil Engineers: Orlando, Florida, May 24, 2022; pp. 959–966. [Google Scholar]
- Jang, Y.; Jeong, I.; Younesi Heravi, M.; Sarkar, S.; Shin, H.; Ahn, Y. Multi-Camera-Based Human Activity Recognition for Human–Robot Collaboration in Construction. Sensors 2023, 23, 6997. [Google Scholar] [CrossRef] [PubMed]
- Liu, H.; Wang, G.; Huang, T.; He, P.; Skitmore, M.; Luo, X. 1 Manifesting Construction Activity Scenes via Image Captioning.
- Xing, X.; Zhong, B.; Luo, H.; Rose, T.; Li, J.; Antwi-Afari, M.F. Effects of Physical Fatigue on the Induction of Mental Fatigue of Construction Workers: A Pilot Study Based on a Neurophysiological Approach. Autom. Constr. 2020, 120, 103381. [Google Scholar] [CrossRef]
- Sheng, D.; Ding, L.; Zhong, B.; Love, P.E.D.; Luo, H.; Chen, J. Construction Quality Information Management with Blockchains. Autom. Constr. 2020, 120, 103373. [Google Scholar] [CrossRef]
Disclaimer/Publisher’s Note: The statements, opinions and data contained in all publications are solely those of the individual author(s) and contributor(s) and not of MDPI and/or the editor(s). MDPI and/or the editor(s) disclaim responsibility for any injury to people or property resulting from any ideas, methods, instructions or products referred to in the content. |
© 2025 by the authors. Licensee MDPI, Basel, Switzerland. This article is an open access article distributed under the terms and conditions of the Creative Commons Attribution (CC BY) license (http://creativecommons.org/licenses/by/4.0/).
Copyright: This open access article is published under a Creative Commons CC BY 4.0 license, which permit the free download, distribution, and reuse, provided that the author and preprint are cited in any reuse.


