
Submitted:
23 May 2025
Posted:
23 May 2025
You are already at the latest version
Abstract
Background/Objectives: Shoulder injury prevalence appears to be the highest among all injuries in CrossFit (CF) athletes. Nevertheless, there is no evidence deriving from prospective studies to explain this phenomenon. The purpose of this study was to document shoulder injury incidence in CF participants over a 12-month period and prospectively investigate the risk factors associated with their demographic, epidemio-logical, and functional characteristics. Methods: The sample comprised of 109 CF ath-letes in various levels. Participants’ data were collected during the baseline assessment, using a specially designed questionnaire, as well as active range of motion, muscle strength, muscle endurance, and sport-specific tests. Non-parametric statistical tests and inferential statistics were employed, and in addition, linear and regression models were created. Logistic regression models incorporating the study’s continuous predictors to classify injury occurrence in CF athletes were developed and evaluated using the Area Under the ROC Curve (AUC) as the performance metric. Results: A shoulder injury incidence rate of 0.79 per 1,000 training hours was recorded. Olympic weightlifting (45%) and gymnastics (35%) exercises were associated with shoulder injury occurrence. The most frequent injury concerned rotator cuff tendons (45%), including lesions and tendinopathies, exhibiting various severity levels. None of the examined variables showed a statistically significant correlation with shoulder injuries. Conclusions: This was the first study which investigated prospectively shoulder injuries in CrossFit, creating a realistic profile of these athletes. Despite the broad spectrum of collected data, the traditional statistical approach failed to identify shoulder injury predictors. This indicates the necessity to explore this topic using more sophisticated techniques, such as advanced machine learning approaches.
Keywords:
shoulder
; injury incidence
; injury risk
; CrossFit
; functional assessment
1. Introduction
CrossFit (CF) workouts are comprised of high intensity and variety functional movements, integrating elements from weightlifting, gymnastics, and cardiovascular exercises aiming to enhance strength, stamina, flexibility, and coordination [1]. Both aerobic and anaerobic energy systems are engaged, exemplified by benchmark workouts like Isabel, which demand maximal effort and considerable energy expenditure [2]. CF athletes exhibit a force-velocity profile that is more oriented towards velocity than force, with significant differences in neuromuscular characteristics between males and females, and improvements noted with increased training frequency [3]. However, overtraining, along with the high variability of exercises and occasionally improper form, have been associated with contributing to overuse injuries [4,5].
The prevalence of injuries among CF practitioners varies significantly, with reported rates ranging from 0.2 to 18.9 injuries per 1,000 hours of exposure [6]. The most affected areas are the shoulders, lower back, and knees, with shoulder injuries being remarkably prevalent, accounting for up to 40.6% of all injuries [7]. These injuries are often linked to specific exercises, such as Olympic weightlifting and gymnastic movements like kipping pull-ups and ring dips [7,8]. These exercises, which are integral to CF routines, place significant stress on the shoulder joint, often leading to overloading and subsequent injuries such as partial lesions of the supraspinatus tendon and labral tears [9,10]. The repetitive and extreme positions required in CF, such as overhead movements, are predisposing the shoulder complex to overload and damage [11]. Additionally, improper training techniques like training with pain and inadequate warm-up routines have been shown to adversely affect injury incidence [4,5]. Recent study findings indicated an isokinetic force-power imbalance in favor of internal rotators in the shoulder of advanced CrossFitters [12]. Scapular dyskinesis, glenohumeral internal rotation deficit and posterior shoulder stiffness which are observed in overhead athletes’ populations can also lead to kinematics alterations and decreased shoulder functionality [13].
In conclusion, the high prevalence of shoulder injuries in (CF) athletes could be mitigated by systematically recording predisposing factors and elucidating their contribution to injury incidence. Despite an expanding body of research, much of the current literature comprises lower-level evidence, highlighting the need for high-quality study designs [14]. The present prospective cohort study aimed to develop a representative profile of CF athletes in Greece regarding shoulder injuries. Specifically, we sought to integrate demographic, epidemiological, and functional data to investigate their association with shoulder injury occurrence over a complete training and competition cycle. Following an initial baseline assessment, athletes were monitored prospectively throughout the entire cycle to record shoulder injuries and support the modeling of potential predisposing factors.
2. Materials and Methods
2.1. Participants
Four CF gyms (boxes), located in four different cities in Greece, were included in the study. They were asked to invite their athletes to participate in a shoulder injury investigation survey. The inclusion criteria were as follows: individuals of both genders, aged 18 years or older, regardless of the level of experience, while novice participants had to complete the first month of participation. Individuals were excluded from the study if they had an active injury in any area of the body which discouraged them from ordinary training routines, or they failed to participate in CF constantly for the following one year after their baseline assessment. One hundred and eleven participants met the inclusion criteria, but during the data analysis stage, two of them dropped out due to missing values. Eventually, the results from one hundred and nine healthy active CF participants entered the statistics. Detailed information about the study procedures, associated risks, and the benefits of participation was provided to all participants before reading and signing an informed consent form. The study protocol obtained ethical approval from the Ethics Committee of the University of Patras (Unique Protocol ID: 14279) and was registered in the ClinicalTrials.gov PRS database (Identifiers: NCT05909592).
2.2. Testing Protocol
The intention of the present study was to record CrossFitters’ profile concerning shoulder injuries and investigate shoulder injury rates and risk factors among this population. For this purpose, a unique protocol of a prospective cohort study was created. The study protocol consisted of three stages: baseline assessment, one-year monitoring and finally data analysis. During the first stage, participants were admitted to the study and underwent the baseline evaluation process. Baseline evaluation included demographics, health status and injury history, flexibility, strength, muscle endurance, and functional ability assessment. Baseline evaluation included demographics, health status and injury history, as well as flexibility, strength, muscle endurance, and functional ability assessment. Demographic data, general health history, general injuries history, and detailed history of shoulder injuries were documented using specially designed forms. The dominant upper extremity was determined via participants’ self-report concerning the limb that demonstrated preference in performing a range of basic tasks.
2.3. Active Range of Motion (ROM)
Shoulder ROM during flexion, external and internal rotation was evaluated qualitatively via a scale of 0-3. Normal symmetrical ROM was presented with 0, while considerable ROM restriction to both sides was presented with 3. Deficit to the dominant or non-dominant upper limb was labeled as 1 or 2, respectively. The athletes stood with their back against the wall, ensuring trunk stability, while simultaneously executing movements with both arms. The distance of each hand, at the wrist level, from the wall was measured in centimeters to decide whether symmetry or asymmetry existed. This binary approach was selected instead of goniometry, because pilot measurements inserted high uncertainty regarding the reliability of continuous variables in this position. Core rotation ROM was measured utilizing a custom-made iron rod with a laser-guided digital goniometer (HALO model HG1, HALO Medical Devices, Sydney, Australia) [15] attached on it to ensure higher accuracy of the measurements. For this examination, athletes sat astraddle on a box with ninety degrees of knee and hip flexion, feet on the ground and neutral position of their back. The rod was held by both hands at scapular-spine level. Trunk rotation was slowly performed on each side and the final position in each direction was recorded in degrees.
2.4. Strength
Isometric strength of the shoulder external rotator muscles, internal rotator muscles and hip abductors was measured utilizing the Kinvent handheld dynamometer (K-Force Muscle, Kinvent, Montpellier, France) [16] and the Kinvent application (K-Force application, ed. 5.4.10). The dynamometer was stabilized on the wall by the examiner, two fingers below wrist level. Internal and external shoulder rotations were performed against the wall in a standing position close to the wall, with ninety degrees shoulder abduction and elbow flexion. The elbow position was marked by a tape in the wall to ensure it remained the same for both sides throughout the test. For the hip abduction, the dynamometer was stabilized against a vertical steel frame on the ground level with a strap. Participants lied on the floor with their hips at twenty degrees of abduction and zero degrees of flexion and were instructed to push out against the dynamometer as hard as they could without raising the limb from the floor. Muscle endurance of the external rotator muscles was evaluated via a protocol created in the Kinvent application (K-Force application, ed. 5.4.10). Participants were asked to hold an isometric contraction from the same position for shoulder strength measurements. Three sets of thirty seconds, intercepted by three-second intervals, were performed at the target intensity of 60% of a maximum voluntary contraction (MVC). A deviation within 6% was allowed, thus, the percentage of the time maintaining at least at 54% force output represented endurance performance. The output for each shoulder was a percentage of successful isometric strength production throughout the timeframe of the total 90 seconds, as calculated automatically by the dynamometer application.
2.5. Sports-Specific Tests
Functional ability was assessed using a novice sport-specific instrument, CrossFit FABS [17]. The newly introduced battery of tests consisted of six tests which are used regularly on the CF routine: Air squat, Shoulder mobility, Wall angel, Overhead squat (OHS), Windmill, and Sots press. Each test was scored from 0 to 3. A total score of the tool was also calculated for each participant. Lastly, Closed Kinetic Chain Upper Extremity Stability test (CKCUEST) was used to evaluate shoulder dynamic stability in a familiar loading position [18]. Testing started from a push-up position with the hands placed outside two lines of tape, distanced 91.4 cm (36 inches), feet at shoulder width. They were encouraged to touch the athletic tape with the opposing hand, while alternating hands, as many times as possible within fifteen seconds. The number of repetitions achieved was recorded for each subject.
Baseline measurements were conducted from September 2022 until February 2023. Each participant was followed for one year after entering the study. During that period, participants were contacted on a weekly basis for an update about their shoulder health. Once a new shoulder injury emerged, the athlete was examined personally by the main researcher, who is a musculoskeletal and sports injuries expert with more than 10 years of clinical experience. Injury identification was made through clinical examination, and the injured athlete was tracked until coming back to regular training. The criterion of a “new shoulder injury” included any new or aggravated old injury sustained during training or competition, which prevented participation in CF or urged performance modifications for tissue protection for at least one day [11,19].
2.6. Statistical Analysis
Variables were coded into groups according to their type (nominal, ordinal, categorical, scalar) and their nature (for instance ROM, strength, endurance, specific functional tests). Descriptive statistics, including range, mean, standard deviation and standard error, as well as inferential statistics were analyzed [20]. Non-parametric techniques, particularly the kernel density estimation method, were used to estimate the Probability Density Functions (PDFs) [21,22]. Hypothesis testing was conducted using both the t-test and the Mann-Whitney U test, along with a p-value correction technique to address the issue of multiple testing [23]. Linear models were employed to explore the interactions among the continuous measurements described in the previous sections and provide insights into their relationships. Finally, logistic regression models were used to link these continuous measurements with potential shoulder injuries [24].
3. Results
3.1. Demographics and Injury Incidence
The study included one hundred and nine CrossFitters from four cities in Greece, ten of them (9.2%) being left-hand dominant. A complete demographic profile is illustrated in Table 1. Twenty-one individuals (19.3%) participated in CF competitions, while the rest were training for health and recreation purposes. Regarding their warm-up and cool-down routines, proportions of 72.5% and 45% of the participants, respectively, declared that they were consistently adhering to both procedures in an adequate manner. Other sports activities, apart from CF, were practiced by 48.6% of the sample. Forty percent (40.4%) of the sample population had a particularly good fitness level before starting CF, and 35.8% started with a low prior fitness level. A fraction of four out of ten participants (N=43, 39.4%) were experiencing shoulder pain during CF workouts.
During the observation period, 18 athletes (16.5%) presented with new unilateral shoulder injuries with two individuals experiencing bilateral shoulder involvement, resulting in a cumulative total of 20 shoulder joint injuries. Among these incidents, ten (50%) occurred on the non-dominant shoulder, six on the dominant shoulder and four injuries were bilateral. Injury incidence rate (IIR) of shoulder injuries in this sample of CF athletes was 0.79 per 1,000 training hours.
Six out of the twenty referred shoulder injuries were new, while the rest fourteen were an exacerbation of an old injury. Four injuries were acute, whereas the rest sixteen demonstrated gradual onset as overuse injuries. The occurrence of 45% of the new shoulder injuries was associated with Olympic weightlifting exercises, 35% with gymnastics, and equal percentages of 10% with combination of Olympic weightlifting and gymnastics, and with free weights exercises solely.
In terms of the tissue involved, the most frequent injury (45%) concerned rotator cuff (RC) tendons, including lesions and tendinopathies. The second most prevalent injury, accounting for 40%, was identified as a concomitant injury to the rotator cuff and the biceps tendon. Labral tears and injuries involving both the rotator cuff and the acromioclavicular joint were noted, representing 10% and 5% of cases respectively. The injury severance ranged from the modification of a single day’s workout to the alternation or total cessation of practice for up to 108 days. Only five injured participants (25%) managed to return to sport without pain, while twelve (60%) returned to full practice with pain symptoms, and the remaining three (15%) failed to return to their previous level of practice routines during the observation period. The pain, shoulder disability and days out of practice are shown in Table 2.
3.2. Exploratory Data Analysis and Descriptive Statistics
During the first stage of statistical analysis potential factors that could influence injury rates were investigated to determine whether further grouping based on variables such as gender, age, experience, or competition level, was necessary. Apart from statistical analysis, PDFs of the binary variables were used to illustrate the degree their distributions overly.
3.2.1. Demographic Data
Regarding gender profile, PDFs of male and female athletes, showed considerable overlapping in age and training volume, visually verifying their non statistically significant difference. The only noticeable observation, however non-significant, was that male athletes exhibited higher BMI values and were slightly more experienced (Figure 1).
Athletes who participate in competitions exhibited very similar age and BMI distributions with non-competitive athletes. The pattern of PDFs of experience and training hours shifted toward higher values for competitive athletes (Figure 2). Using a cut-off age of 40 years to separate younger from older athletes, in line with CF scaling [25,26], it was noticed that 83.5% of the sample comprised the younger athletes’ category. Experience and training volume variances demonstrated similar distributions across the two age groups, while BMI was slightly higher for older athletes.
During exploratory analysis, athletes who sustained a new shoulder injury and those who did not, were categorized into two groups. Similar overlapping pattern diagrams were reproduced for age, BMI, experience, and training volume between these two groups (Figure 3).
3.2.2. Range of Motion, Strength and Sports-Specific Tests
Overlaying the distributions of the continuous variables of injured (red area) and non-injured (green area) athletes showed them to overlap considerably. In core-rotation ROM toward the side of the non-dominant upper extremity (NDUE), hip abduction strength in both sides and CKCUEST, the two groups appeared nearly identical, while in cases of CF FABS, hip abduction strength deficit, non-dominant shoulder external rotation endurance and shoulder external rotation endurance deficit there was a lower extent of overlap (Figure 4). However, even in the latter case, differences appeared to be associated with the regions of higher density, i.e., near the peak values of the curves, while the spread along the horizontal axis remained similar. Therefore, we concluded that the PDFs were nearly identical, which strongly indicated that no distinction between injured and non-injured athletes exists, thus they could be examined as a single group.
Despite the differences on PDF overlapping in the aforementioned variables, none of them was statistically significantly associated with shoulder injuries.
3.2.3. Ordinal Measurements and Data
The resulting visualization of the data allowed the observation of a significant intermixing of injured (red dots) and non-injured (green dots) athletes without a clear pattern distinguishing the two groups. This technique prevented data collapse while preserving the categorical structure, allowing for a clearer distinction between injured and non-injured athletes. As a result, no single measurement, and the corresponding ordinal variable, was sufficient to differentiate between them. Warm up and recovery routines, prior fitness level, injury history on any area of the body, or each one of the individual tests of CF FABS were not correlated to new shoulder injury incidence. An example of this optical demonstration is given in Figure 5.
3.2.4. Nominal Data
A typical example of binary categorical data interaction is visually represented in Figure 6. Injured and non-injured athletes were plotted against the binary response of each categorical variable. It was attempted to locate any systematic pattern that could potentially connect the two colored lines; for example, a pattern that blue or black dots favored any of the red or green athletes. It was observed that this pattern was absent in all subplots concerning gender, UE dominance, competitiveness, other parallel activity, and history of general injury. In particular, there was a significant intermixture of binary data across all groups.
3.3. Inferential Statistics
Chi-squared (χ2) tests were conducted to compare the percentages of injured versus non-injured individuals within the following categories: male/female, competitive/non-competitive, and equal and under/over 40 years of age. The findings indicated that a proportion of 19.4% of the male population exhibited a shoulder injury in contrast to the corresponding 11.9% of the female population (χ2=1.053, p=0.305). Moreover, 23.8% of the competitive athletes sustained injuries, as opposed to 14.8% of the non-competitive athletes (χ2=0.219, p=0.640). Nearly identical proportions of younger and older participants (16.5% and 16.7% respectively) displayed shoulder injuries throughout the observational period (χ2<0.001, p=0.985). The p-values for these statistical analyses were notably elevated, suggesting a lack of statistical significance and therefore multiple testing was not further investigated.
Independent t-tests were conducted for the comparisons between continuous variables, with a conservative significance threshold of α=0.05 (Table 3). Bonferroni’s method adjusted at the level of α=0.0031, instead of 0.05 for 16 multiple tests [23]. Additionally, the study aimed to assess how rare the observed values of individual ordinal variables were, relative to the expected variability of the test statistic due to random sampling. For this purpose, the Mann-Whitney U test was applied and evaluated the p-values against a conservative significance level of the adjusted α=0.0029, instead of 0.05 for 17 multiple tests (Table 4). Both testing procedures resulted in very high p-values for most of the variables, considerably higher than the chosen α level (with Bonferroni adjustments), suggesting no significant difference between injured and non-injured athletes.
The low p-values of the hip abductors’ strength deficit, shoulder external rotators’ endurance deficit, warm-up practice, and history of body injuries noted a difference between the tested variables. These may point to a better attitude towards warm-up in CF athletes and a possible relationship between specific deficits or general injury history and shoulder injury incidence. However, after Bonferroni correction due to the high number of comparisons, this difference was not considered statistically significant, but there were some obvious trends which should be considered.
3.4. Understanding the Interactions of the Epidemiological Characteristics and the Functional Tests
Ordinary least square (OLS) linear models were constructed to examine all possible combinations of continuous variables within each coding group. In Figure 8, a strong correlation was demonstrated between height and weight, which may indicate that a lean body type favors CF participation. Additionally, the low R2 values for the weight-age pair suggest that CF athletes maintain stable body weight over time, which is expected according to the high energy demands and the whole-body muscular development. Another demographic characteristic given by the positive linear correlation between months of experience and weekly training hours, proposes that more experienced athletes continue to enjoy and engage in training over extended periods.
In Figure 9, the two parameter pairs of dominant and non-dominant shoulder external rotators strength as well as their deficit, exhibited very high R2 values. This finding strongly indicates that CF athletes engage in symmetrical training for these particular muscle groups, suggesting that symmetrical strength is an essential requirement for this sport. Moreover, this idea of bilateral mechanics is reinforced by an R2 value of 0.4 between core rotation ROM toward the side of the dominant and non-dominant upper limb.
Analogous linear correlations regarding symmetry in isometric external rotators’ strength endurance and hip abductors strength are supported by the relatively high R2 values observed in Figure 10. This finding is a logical consequence of the nature of CF, as the sport incorporates exercises from various high-intensity interval training sports, promoting balanced muscular development.
3.5. Modeling and Predicting Shoulder Injuries
Models of the CF athletes’ injuries that utilize the continuous (i.e. scalar) variables of this study were created. Logistic regression models [24] that combine the continuous variables (i.e. predictors) with the binary outcome of injury/no-injury (i.e. response variable) are presented. The model’s performance metric utilized the Area Under the Curve (AUC) of the Receiver Operating Characteristic (ROC) curve, which quantifies the overall ability of a binary classifier to discriminate between the two classes across all possible classification thresholds [24]. An AUC value of 1.0 indicates perfect classification, while a value of 0.5 suggests no discriminative ability, equivalent to random guessing. Higher AUC values reflect better model performance. The ROC curve plots the true positive rate (TPR or sensitivity: measures how well a model identifies actual positive cases, and quantifies, how many the model correctly caught out of all the real positives/injuries) against the false positive rate (FPR or specificity: measures how often a model incorrectly labels negative cases as positive, and quantifies, how many the model mistakenly flagged as positive out of all the real negatives/no-injuries), showing the trade-off between sensitivity and specificity. AUC is widely used because it is independent of class distribution and provides a single, interpretable measure.
In Figure 11, the AUC performance of the logistic regression models is presented, computed for all continuous variables analyzed in this study. As expected, given the large p-values from the corresponding t-tests and the substantial overlap of the probability density functions, the model performance is generally low. This provides strong evidence that individual variables possess limited or negligible predictive capability for shoulder injuries.
Focusing on the moderate performance models, with AUC values around 0.66, hip abduction strength deficit and shoulder external rotation endurance deficit are presented in Figure 12 and Figure 13. Higher values of shoulder external rotation endurance deficit appear to favor injury occurrence (i.e. >70) with a steady gaining ROC curve for the whole range of the values (with respect to random choice). On the other hand, the ROC curve of hip abduction strength deficit appears to be problematic at lower values (i.e. < 0.2), indicating that the model fails to accurately capture this range. Therefore, despite its moderate AUC value (i.e., 0.66), it does not provide significant insights into the shoulder injury mechanism.
4. Discussion
Numerous epidemiological investigations have examined CF injuries in recent years, revealing a significant prevalence of shoulder injuries. To the fullest extent of the researchers’ knowledge in the current study, this represents the inaugural prospective investigation into the demographic, epidemiological, and functional characteristics of shoulder injuries among CF athletes. The observed IIR for shoulder injuries was calculated to be 0.79 per 1,000 training hours, which is considerably lower than the results of prior, isolated retrospective epidemiological research on shoulder injuries that documented an IIR of 1.18 [27]. The results of the present study resembled another retrospective investigation that solicited participants to recount their injuries that transpired within the previous six months, ultimately counting an IIR of 0.51 for shoulder injuries [28]. It was observed high variability in injury report among previous retrospective studies, nonetheless. This disparity may be attributed to the self-reported nature of data collection in previous studies, which relied on participants’ evocation of their past injury experiences, contrary to current study which used prospective methodology. In order to enhance the precision of the results, participants were tracked by researchers during a year of training and competitions, with the objective of documenting any shoulder injuries that occurred during this period, including the nature, severity, and impact on the athlete’s participation in CF.
An additional innovative aspect of the present research was the implementation of the CF FABS, a sport-specific assessment tool utilized to evaluate the functional capabilities of CF athletes. The only prior assessment tool employed for the CF athlete population was the Functional Movement Screen (FMS) [29]. However, this is a widely used tool for assessment of functionality, while CF FABS is specific for the sport. The aggregate scores obtained from both assessment tools did not reveal statistically significant correlations with the incidence of shoulder injuries. CrossFitters exhibited remarkably higher symmetry on the FMS in comparison to other athletic populations, particularly in the shoulder mobility test [30]. The present study’s results corroborated those suggestions by demonstrating notable symmetry in ROM, strength, and endurance measured parameters.
CF has been characterized as a strenuous sport, pushing participants to engage at the upper limit of their physical capacities [31]. The toughness of the sport additional to the sample’s average time of attendance, which was approximately three years, may indicate that athletes were used to participating under hard circumstances. It appears that a substantial pain tolerance has been evidenced, indicated by the finding that nearly 40% of our sample were practicing regularly despite experiencing pain in their shoulder. This element may serve as a contributory factor to the observed low incidence rate of shoulder injuries.
As a new injury was delineated, any sensation of pain or discomfort resulting in the cessation or alteration of the training regime for one day or more was noted. The criteria for defining a newly reported injury were consistent with established definitions in the literature [27,29]. Prior prospective investigations on the incidence of CF injuries and their corresponding risk factors tracked their cohorts for durations of either 8 weeks [32] or 12 weeks [19,29], which were considerably shorter time frames than the 12-months period of the current study.
Previous research has indicated that age and sex represent significant non-modifiable factors correlated with the incidence of injuries, with older individuals and male participants demonstrating a heightened susceptibility to such injuries [5,6]. Moreover, an elevated BMI has been associated with higher risk for injury, alongside a prior history of injuries, which predisposes individuals to a greater likelihood of sustaining subsequent injuries, particularly in the same anatomical region [6]. A discrepancy was observed among studies regarding competitiveness. One particular study found a higher injury incidence among competitive individuals [28], a different one reported a 2.64-fold greater probability for injury in non-competitors [33], while another study showed no statistically significant differences between the groups [34]. One possible explanation for these contradictory results, apart from the diverse methodological approaches of the studies, is the fact that competitive athletes are usually exposed to a higher load by pushing their limits further, which may be counteracted by them being more physically aware and technically efficient. Concerning male gender, older age, and prior injury history, a contemporary systematic review on the vulnerability to musculoskeletal injuries among CF participants resulted in incongruent evidence [35]. This is in line with the current study, which demonstrated no statistically significant association of any of those variables with the incidence of shoulder injuries.
RC injuries constituted the predominant tissue involvement among the shoulder injuries that occurred, manifesting either in isolation or in conjunction with other shoulder injuries. This result was in accordance with the outcomes of a magnetic resonance imaging study which indicated elevated percentages of partial lesions in the supraspinatus and subscapularis tendons within a sample of CF participants evaluated [9]. In terms of exercises associated with an increased risk of shoulder injury, a recent systematic review identified several gymnastics exercises, namely ring dips, ring muscle-ups, and kipping movements, as significantly prevalent [7]. On the contrary, the present study recognized Olympic weightlifting exercises as the most strongly related to shoulder injuries, followed by gymnastics activities. Similarly, Summitt et al. reported that overhead press and snatch variations were the ones most frequently leading to shoulder injuries, ahead of the gymnastics exercises [27]. In summary, both types of exercises that load the shoulder in an overhead position predispose athletes to overuse tendinopathies as well as partial or complete thickness tears [14].
Nevertheless, the comparisons drawn between the present study and prior retrospective or prospective studies with a short observation period must be critically scrutinized. Athletes with extensive experience in CF may exhibit a higher incidence of injuries compared to those who are relatively new to the sport, reflecting chronically accumulated microtrauma. The fact that the majority of the findings come from retrospective studies based on electronic questionnaires, inherently subject to bias, weakens the existing evidence on the topic of CF injuries. Furthermore, the preponderance of the studies focuses on all forms of CF injuries, whereas the present study exclusively examined shoulder injuries. Consequently, the validity of comparisons may be debatable.
The principal objective of this investigation was to discern potential variables that may correlate with shoulder injuries among CF athletes. To accomplish this, the study’s methods were meticulously crafted to gather a comprehensive array of measurements and data. This extensive data framework affords the opportunity for an in-depth analysis intended to elucidate highly correlated variables, which may facilitate the exclusion of certain factors in subsequent research and reveal novel interactions that could enhance athletic training practices. Nevertheless, one plausible interpretation of the aforementioned statistical findings is that no single parameter in isolation, regardless being a demographic characteristic, an epidemiological variable, or a functional assessment, proved adequate to establish a link with shoulder injuries. Further inquiry may elucidate the interrelationships among variables that could contribute to the prevalence of shoulder injuries.
The principal strength of the current investigation lies in the 12-month prospective nature of the observational period, involving a cohort of 109 CF athletes. The methodological approach encompassed direct baseline assessment of the athletes and a second assessment upon the occurrence of new injuries. The classification of the documented shoulder injuries was undertaken by a single examiner, the principal investigator who is a senior physiotherapist. A comprehensive array of measurements was collected to guarantee that all pertinent dimensions of the subject matter were thoroughly examined. Nevertheless, potential limitations were recognized. The extended duration of the study, in addition to the spread of the sample over four different cities, rendered it challenging to ensure compliance within the cohort. It is possible that some injuries went unreported to the investigators, notwithstanding the frequent updates provided to the sample. The number of the 20 new shoulder injuries might appear low, however, prospective monitoring of a greater sample of CF athletes is very challenging. Additionally, the possibility that baseline values might change throughout the 12-month monitoring period, introduces a degree of uncertainty to the investigation of their connection to new injuries, but this is a standard flaw of all relevant studies that use baseline tests. Repeated testing throughout the season could ameliorate this limitation.
5. Conclusions
This prospective cohort study investigated the profile of CF athletes and the prevalence of shoulder injuries among them. The sample demonstrated symmetrical functional characteristics, and an IIR of 0.79 per 1,000 training hours for shoulder injuries was documented. Most of the cases involved RC injuries and were predominantly associated with Olympic weightlifting exercises. The severity of the cases demonstrated a broad spectrum, with all injuries being managed conservatively. Notably, a substantial proportion of athletes returned to sport despite ongoing shoulder pain. Hypothesis testing, with the common approach for epidemiological studies, indicated that none of the examined variables had a statistically significant association with the incidence of shoulder injuries.
Despite the abundance of the gathered data, there was no significant interaction between any of them and the occurrence of shoulder injuries. This highlights the need to examine such a multifaceted phenomenon of complex interactions between intrinsic and extrinsic risk factors as well as triggering events [36], under a novel approach. Artificial Intelligence (AI) and Machine Learning techniques have the potential to identify injury prone athletes and discern the most salient injury risk factors [37]. Further exploration of the findings from the current study will be conducted utilizing these techniques.
Author Contributions
Conceptualization, A.B.; Methodology, A.B., G.T., K.F., S.A.X., and E.T.; Validation, A.B., E.T., and G.T.; Investigation, A.B.; Writing—original draft preparation, A.B.; Writing—review and editing, E.T., G.T., C.M., K.F., and S.A.X.; Supervision, E.T., G.T., and C.M. All authors have read and agreed to the published version of the manuscript.
Funding
This research received no external funding.
Institutional Review Board Statement
The study was conducted in accordance with the Declaration of Helsinki and approved by the Ethics Committee of the University of Patras (Unique protocol code 14279, 22/09/2022).
Informed Consent Statement
Written informed consent has been obtained from the patient(s) to publish this paper.
Conflicts of Interest
The authors declare no conflicts of interest.
References
- Glassman, G. The CrossFit Level 1 Training Guide. CrossFit J 2016, 1–255. [Google Scholar]
- Rios, M.; Becker, K.M.; Cardoso, F.; Pyne, D.B.; Reis, V.M.; Moreira-Gonçalves, D.; Fernandes, R.J. Assessment of Cardiorespiratory and Metabolic Contributions in an Extreme Intensity CrossFit® Benchmark Workout. Sensors 2024, 24, 513. [Google Scholar] [CrossRef] [PubMed]
- Párraga-Montilla, J.A.; Cabrera Linares, J.C.; Jiménez Reyes, P.; Moyano López, M.; Serrano Huete, V.; Morcillo Losa, J.A.; Latorre Román, P.A. Force–Velocity Profiles in CrossFit Athletes: A Cross-Sectional Study Considering Sex, Age, and Training Frequency. Balt. J. Health Phys. Act. 2023, 15, 5. [Google Scholar] [CrossRef]
- Shaffick, M.B. A Review of the Epidemiology of CrossFit-Related Injuries. Am. J. Health Med. Nurs. Pract. 2023, 8, 33–53. [Google Scholar] [CrossRef]
- Szajkowski, S.; Dwornik, M.; Pasek, J.; Cieślar, G. Risk Factors for Injury in CrossFit®—A Retrospective Analysis. Int. J. Environ. Res. Public. Health 2023, 20, 2211. [Google Scholar] [CrossRef]
- Rodríguez, Á.M.; García-Calleja, P.; Terrados, N.; Crespo, I.; Del Valle, M.; Olmedillas, H. Injury in CrossFit®: A Systematic Review of Epidemiology and Risk Factors. Phys. Sportsmed. 2022, 50, 3–10. [Google Scholar] [CrossRef]
- Brandsema, C.J.; Mehrab, M.M.; Nina, M.C. Most Common Injuries in Crossfit Training: A Systematic Review. Int. J. Sports Exerc. Med. 2022, 8. [Google Scholar] [CrossRef]
- Boeira, D.; Brida, L.D.; Milhomens, Y.; Doyenart, R.; Silva, L.A.D. Injuries in CrossFit Practioner: A Cross-Sectional Study. Mot. Rev. Educ. Física 2023, 29. [Google Scholar] [CrossRef]
- Bernstorff, M.A.; Schumann, N.; Schwake, L.; Somberg, O.; Balke, M.; Schildhauer, T.; Königshausen, M. Shoulder Pathologies in CrossFit: A Magnetic Resonance Imaging Study of 51 Cases. J. Sports Med. Phys. Fitness 2024, 64. [Google Scholar] [CrossRef]
- Vanderlei, E.D.S.O.; Santos, A.L.F.D.; Carvalho, N.D.; Carvalho, N.D.; Neves, E.D.A.E.; Lopes-Junior, J.E.G. Muskuloskeletal Injuries in CrossFit Practitioners: An Integrative Review. Braz. J. Clin. Med. Rev. 2023, 1, 25–30. [Google Scholar] [CrossRef]
- Hak, P.T.; Hodzovic, E.; Hickey, B. The Nature and Prevalence of Injury during CrossFit Training. J. Strength Cond. Res. Publish Ahead of Print. 2013. [Google Scholar] [CrossRef]
- Torres-Banduc, M.A.; Jerez-Mayorga, D.; Moran, J.; Keogh, J.W.L.; Ramírez-Campillo, R. Isokinetic Force-Power Profile of the Shoulder Joint in Males Participating in CrossFit Training and Competing at Different Levels. PeerJ 2021, 9, e11643. [Google Scholar] [CrossRef]
- Kibler, B.W.; Sciascia, A.; Wilkes, T. Scapular Dyskinesis and Its Relation to Shoulder Injury. J. Am. Acad. Orthop. Surg. 2012, 20, 364–372. [Google Scholar] [CrossRef] [PubMed]
- Nicolay, R.W.; Moore, L.K.; DeSena, T.D.; Dines, J.S. Upper Extremity Injuries in CrossFit Athletes—A Review of the Current Literature. Curr. Rev. Musculoskelet. Med. 2022, 15, 402–410. [Google Scholar] [CrossRef]
- Wilson-Smith, A.R.; Muralidaran, S.; Maharaj, M.; Pelletier, M.H.; Beshara, P.; Rao, P.; Pearce, L.M.; Wang, T.; Mobbs, R.J.; Walsh, W.R. Validation of a Novel Range of Motion Assessment Tool for the Cervical Spine: The HALO© Digital Goniometer. J. Spine Surg. 2022, 8, 93–102. [Google Scholar] [CrossRef] [PubMed]
- Olds, M.; McLaine, S.; Magni, N. Validity and Reliability of the Kinvent Handheld Dynamometer in the Athletic Shoulder Test. J. Sport Rehabil. 2023, 32, 764–772. [Google Scholar] [CrossRef] [PubMed]
- Bakaraki, A.; Parmaxizoglou, D.; Gkrilias, P.; Tsekoura, M.; Fousekis, K.; Xergia, S.; Matzaroglou, C.; Tsepis, E. Inter-Rater and Test-Retest Reliability of an Innovative Evaluation Tool: CrossFit Functional Assessment Battery of Tests for the Shoulder Joint. Cureus 2024. [Google Scholar] [CrossRef] [PubMed]
- Barbosa, G.M.; Calixtre, L.B.; Fonseca Fialho, H.R.; Locks, F.; Kamonseki, D.H. Measurement Properties of Upper Extremity Physical Performance Tests in Athletes: A Systematic Review. Braz. J. Phys. Ther. 2024, 28, 100575. [Google Scholar] [CrossRef]
- Szeles, P.R.D.Q.; Costa, T.S.D.; Cunha, R.A.D.; Hespanhol, L.; Pochini, A.D.C.; Ramos, L.A.; Cohen, M. CrossFit and the Epidemiology of Musculoskeletal Injuries: A Prospective 12-Week Cohort Study. Orthop. J. Sports Med. 2020, 8. [Google Scholar] [CrossRef]
- Rosner, B. Fundamentals of Biostatistics, 7th ed.; Brooks/Cole, Cengage Learning: Boston, 2011. [Google Scholar]
- Botev, Z.I.; Grotowski, J.F.; Kroese, D.P. Kernel Density Estimation via Diffusion. Ann. Stat. 2010, 38. [Google Scholar] [CrossRef]
- Colbrook, M.J.; Botev, Z.I.; Kuritz, K.; MacNamara, S. Kernel Density Estimation with Linked Boundary Conditions. Stud. Appl. Math. 2020, 145, 357–396. [Google Scholar] [CrossRef]
- Abdi, H. The Bonferonni and Šidák Corrections for Multiple Comparisons.
- James, G.; Witten, D.; Hastie, T.; Tibshirani, R.; Taylor, J. An Introduction to Statistical Learning: With Applications in Python; Springer Texts in Statistics; Springer International Publishing: Cham, 2023. [Google Scholar] [CrossRef]
- How to Classify, Assess, and Coach Aging CrossFit Athletes. Available online: https://www.crossfit.com/pro-coach/classify-assess-coach-aging-crossfit-athletes (accessed on 1 May 2025).
- Kilgore, L. Aging, Performance, and Health: While Physical Capacity Inevitably Declines as Athletes Age, Fitness Has Dramatic Effects on Health and Quality of Life. CrossFit J 2016, 2–6. [Google Scholar]
- Summitt, R.J.; Cotton, R.A.; Kays, A.C.; Slaven, E.J. Shoulder Injuries in Individuals Who Participate in CrossFit Training. Sports Health Multidiscip. Approach 2016, 8, 541–546. [Google Scholar] [CrossRef]
- Montalvo, A.M.; Shaefer, H.; Rodriguez, B.; Li, T.; Epnere, K.; Myer, G.D. Retrospective Injury Epidemiology and Risk Factors for Injury in CrossFit. J. Sports Sci. Med. 2017, 16, 53–59. [Google Scholar]
- Moran, S.; Booker, H.; Staines, J.; Williams, S. Rates and Risk Factors of Injury in CrossFitTM: A Prospective Cohort Study. J. Sports Med. Phys. Fitness 2017, 57. [Google Scholar] [CrossRef] [PubMed]
- Tafuri, S. CrossFit Athletes Exhibit High Symmetry of Fundamental Movement Patterns. A Cross-Sectional Study. Muscles Ligaments Tendons J. 2016. [Google Scholar] [CrossRef]
- Drum, S.N.; Bellovary, B.N.; Jensen, R.L.; Moore, M.T.; Donath, L. Perceived Demands and Postexercise Physical Dysfunction in CrossFit® Compared to an ACSM Based Training Session. J. Sports Med. Phys. Fitness 2017, 57. [Google Scholar] [CrossRef]
- Larsen, R.T.; Hessner, A.L.; Ishøi, L.; Langberg, H.; Christensen, J. Injuries in Novice Participants during an Eight-Week Start up CrossFit Program—A Prospective Cohort Study. Sports 2020, 8, 21. [Google Scholar] [CrossRef]
- Minghelli, B.; Vicente, P. Musculoskeletal Injuries in Portuguese CrossFit Practitioners. J. Sports Med. Phys. Fitness 2019, 59. [Google Scholar] [CrossRef]
- Feito, Y.; Burrows, E.; Tabb, L.; Ciesielka, K.-A. Breaking the Myths of Competition: A Cross-Sectional Analysis of Injuries among CrossFit Trained Participants. BMJ Open Sport Exerc. Med. 2020, 6, e000750. [Google Scholar] [CrossRef]
- Mehrab, M.; Wagner, R.K.; Vuurberg, G.; Gouttebarge, V.; De Vos, R.-J.; Mathijssen, N.M.C. Risk Factors for Musculoskeletal Injury in CrossFit: A Systematic Review. Int. J. Sports Med. 2023, 44, 247–257. [Google Scholar] [CrossRef] [PubMed]
- Bittencourt, N.F.N.; Meeuwisse, W.H.; Mendonça, L.D.; Nettel-Aguirre, A.; Ocarino, J.M.; Fonseca, S.T. Complex Systems Approach for Sports Injuries: Moving from Risk Factor Identification to Injury Pattern Recognition—Narrative Review and New Concept. Br. J. Sports Med. 2016, 50, 1309–1314. [Google Scholar] [CrossRef] [PubMed]
- Van Eetvelde, H.; Mendonça, L.D.; Ley, C.; Seil, R.; Tischer, T. Machine Learning Methods in Sport Injury Prediction and Prevention: A Systematic Review. J. Exp. Orthop. 2021, 8. [Google Scholar] [CrossRef] [PubMed]
Figure 1.
Descriptive statistics and PDFs of male and female athletes (a) regarding (b) age, (c) BMI, (d) training volume, and (e) CF experience.
Figure 1.
Descriptive statistics and PDFs of male and female athletes (a) regarding (b) age, (c) BMI, (d) training volume, and (e) CF experience.
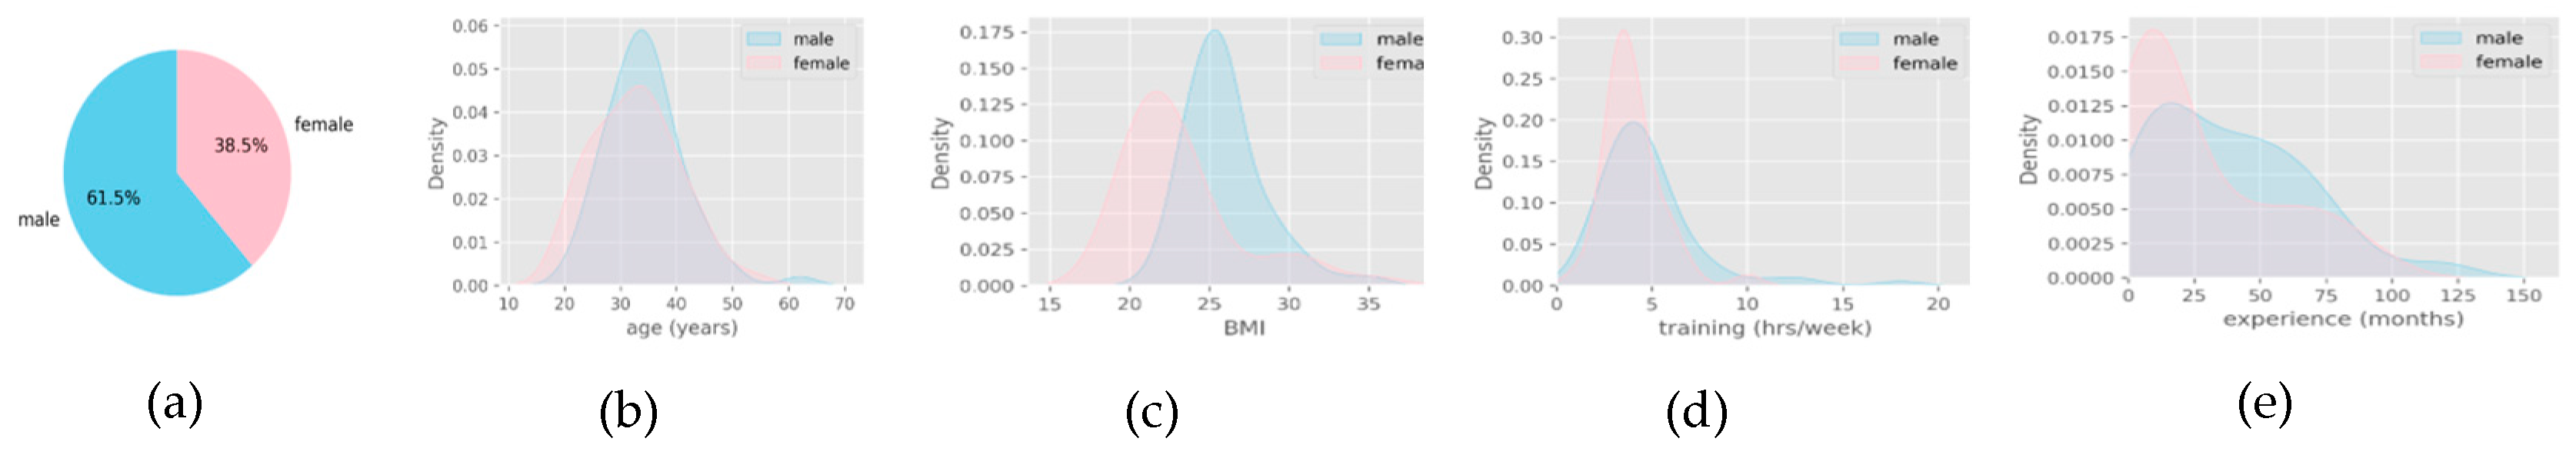
Figure 2.
PDFs of competitive and non-competitive athletes regarding (a) experience and (b) training volume.
Figure 2.
PDFs of competitive and non-competitive athletes regarding (a) experience and (b) training volume.
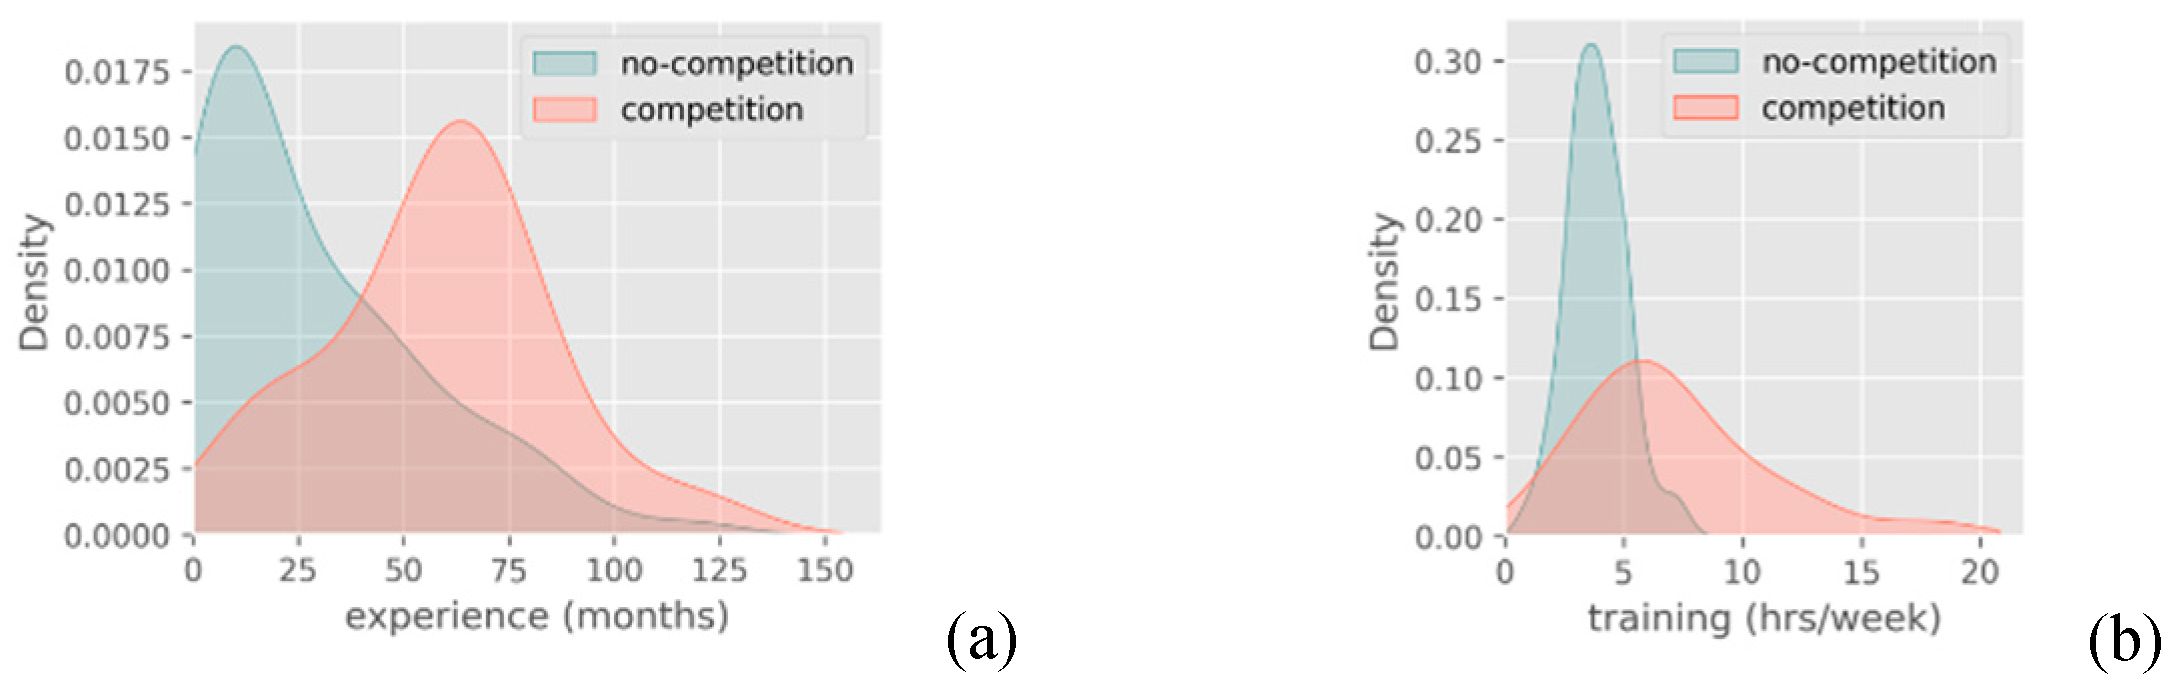
Figure 3.
(a) Sample’s percentage of injured and non-injured athletes and (b) an indicative example of overlapping in PDF of injured and non-injured athletes regarding CF experience.
Figure 3.
(a) Sample’s percentage of injured and non-injured athletes and (b) an indicative example of overlapping in PDF of injured and non-injured athletes regarding CF experience.
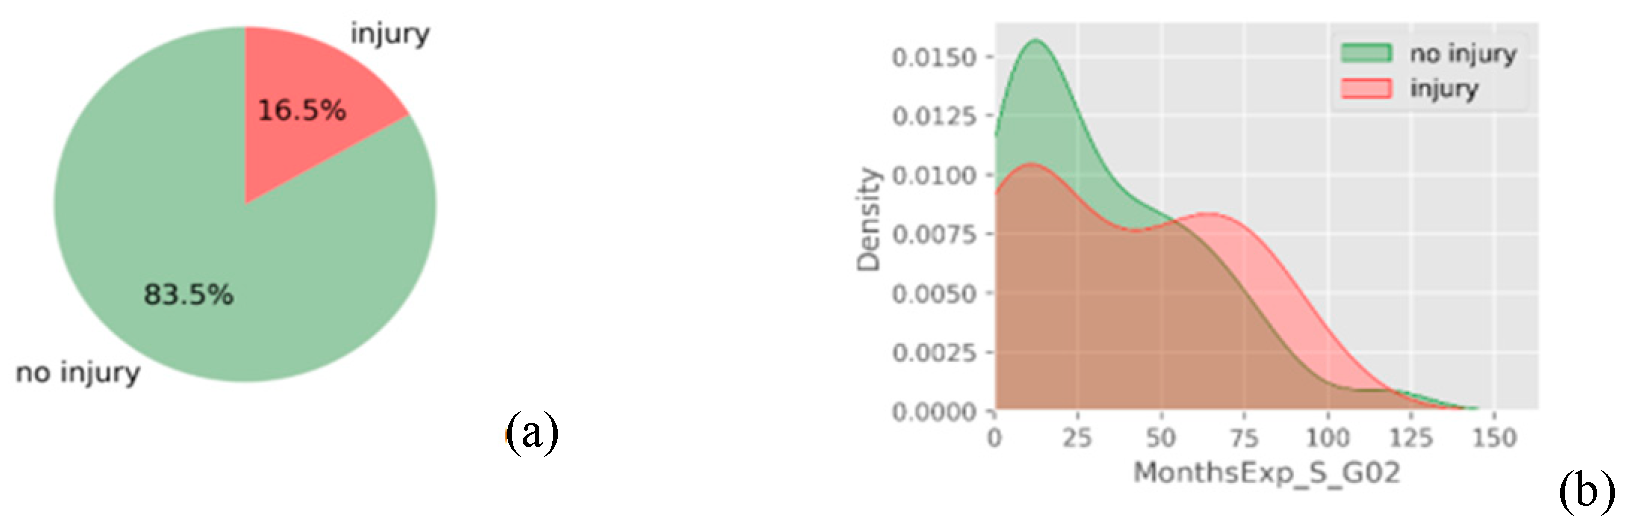
Figure 4.
PDFs of injured and non-injured athletes regarding (a) core rotation towards NDUE’s side, and (b) CF FABS total score.
Figure 4.
PDFs of injured and non-injured athletes regarding (a) core rotation towards NDUE’s side, and (b) CF FABS total score.
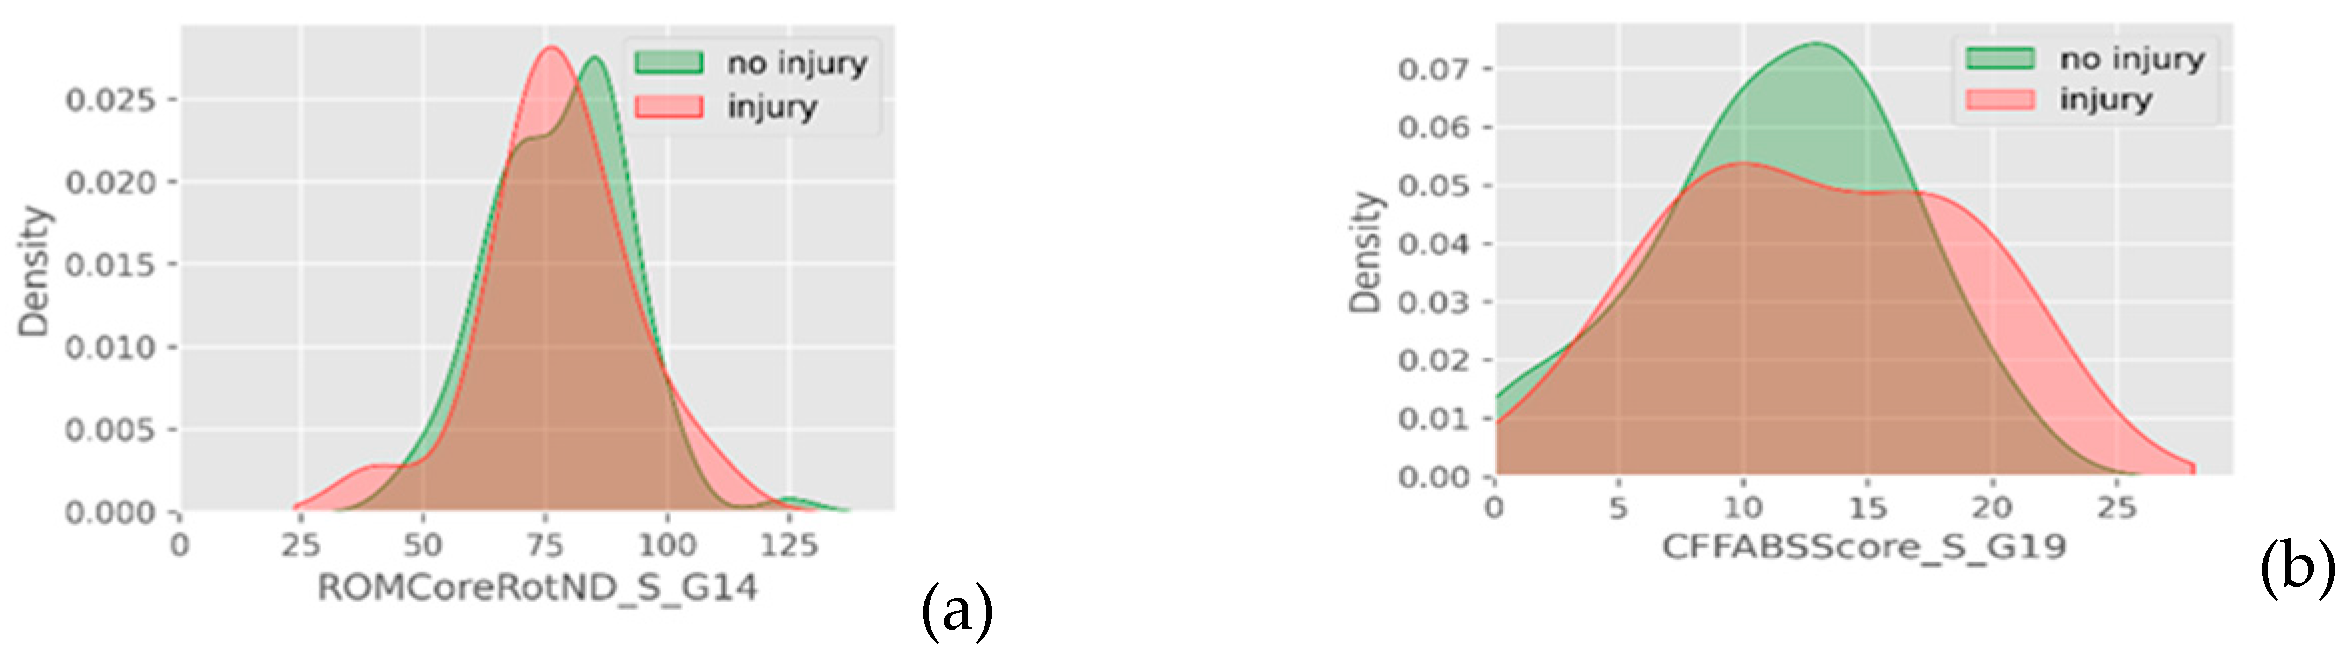
Figure 5.
Injured versus non-injured athletes regarding ordinal data of (a) warm up, (b) recovery, and (c) Sots press test.
Figure 5.
Injured versus non-injured athletes regarding ordinal data of (a) warm up, (b) recovery, and (c) Sots press test.
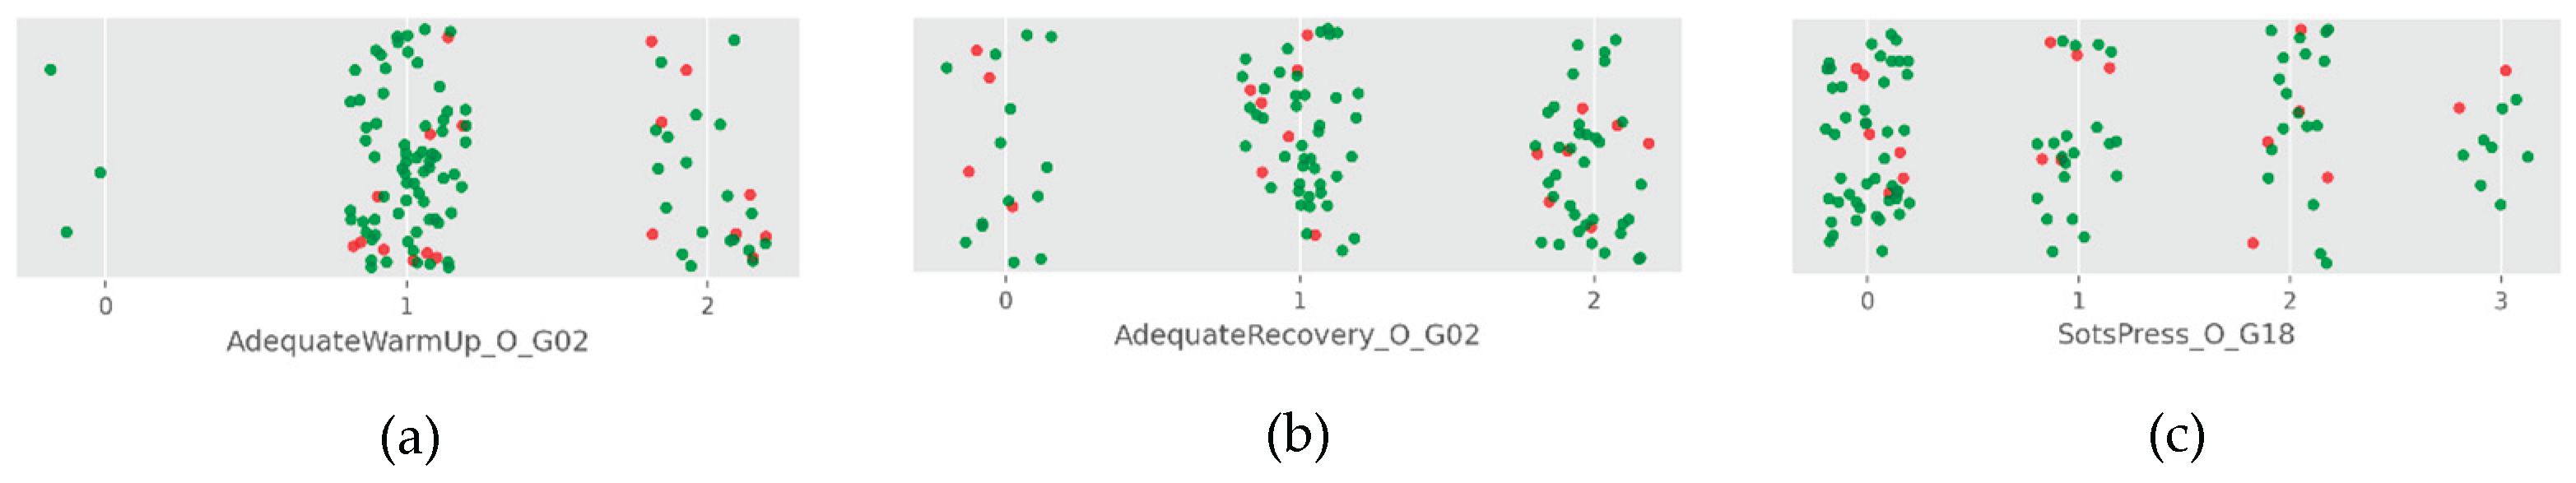
Figure 7.
Examples of visual verification of binary data intermixture. Injured versus non-injured athletes regarding (a) shoulder pain during CF, (b) symmetry of flexion ROM, (c) external rotation, and (d) internal rotation ROM between shoulders.
Figure 7.
Examples of visual verification of binary data intermixture. Injured versus non-injured athletes regarding (a) shoulder pain during CF, (b) symmetry of flexion ROM, (c) external rotation, and (d) internal rotation ROM between shoulders.
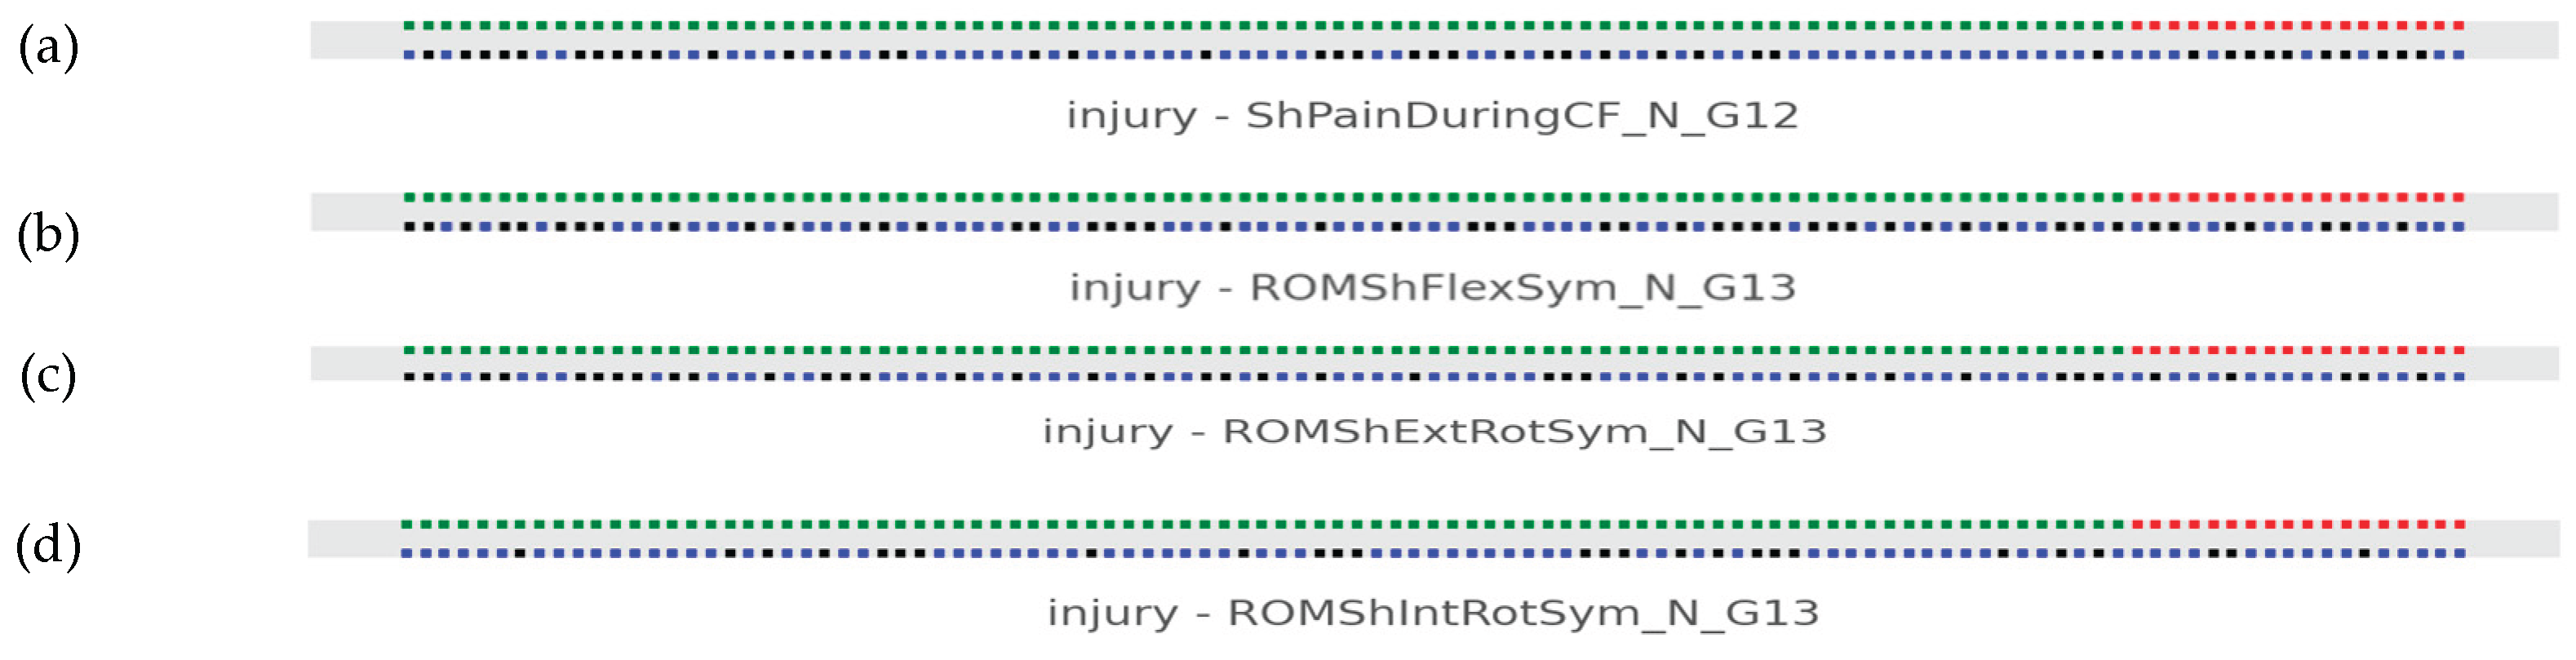
Figure 8.
Linear models among age and weight, height, and BMI (Data group 1).
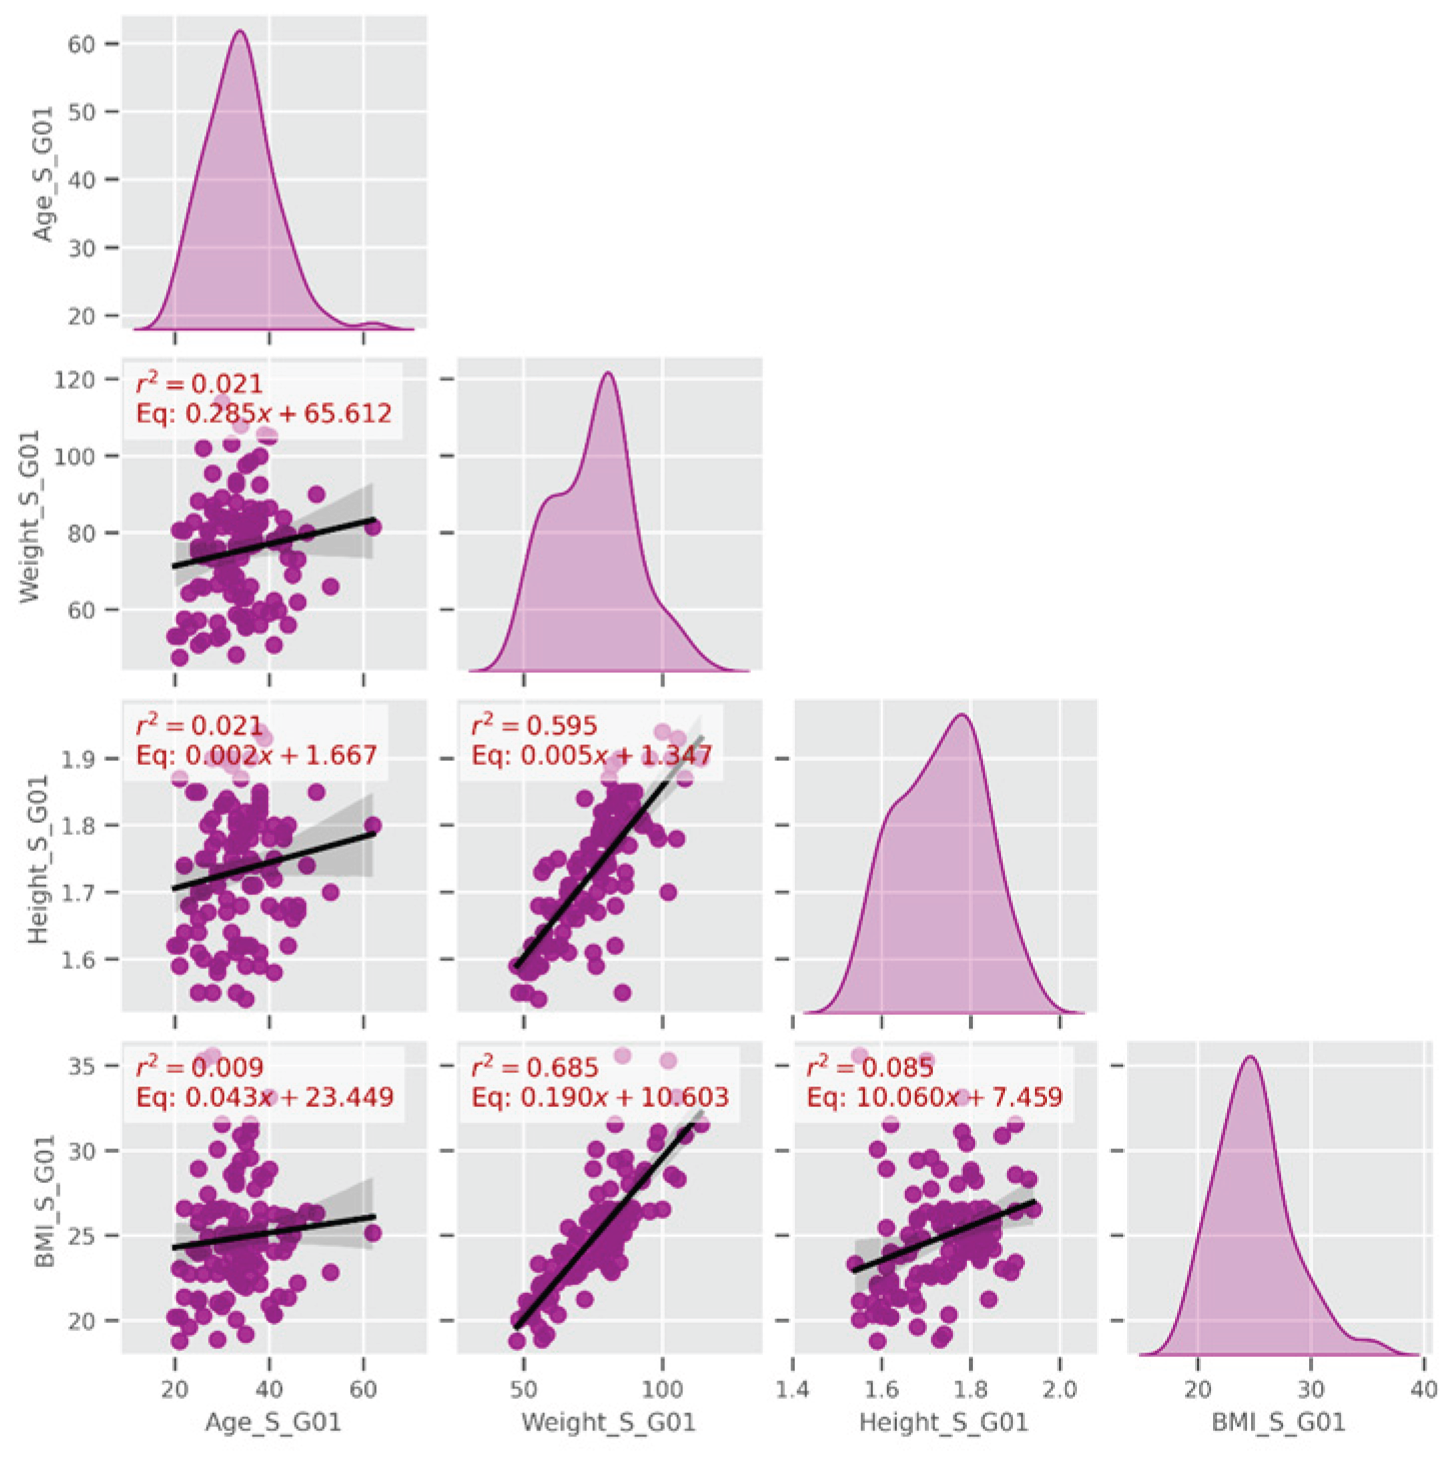
Figure 9.
Linear models among dominant and non-dominant shoulder’s external and internal rotation strength. Continuous data of external and internal rotators strength and deficits (Data group 15).
Figure 9.
Linear models among dominant and non-dominant shoulder’s external and internal rotation strength. Continuous data of external and internal rotators strength and deficits (Data group 15).
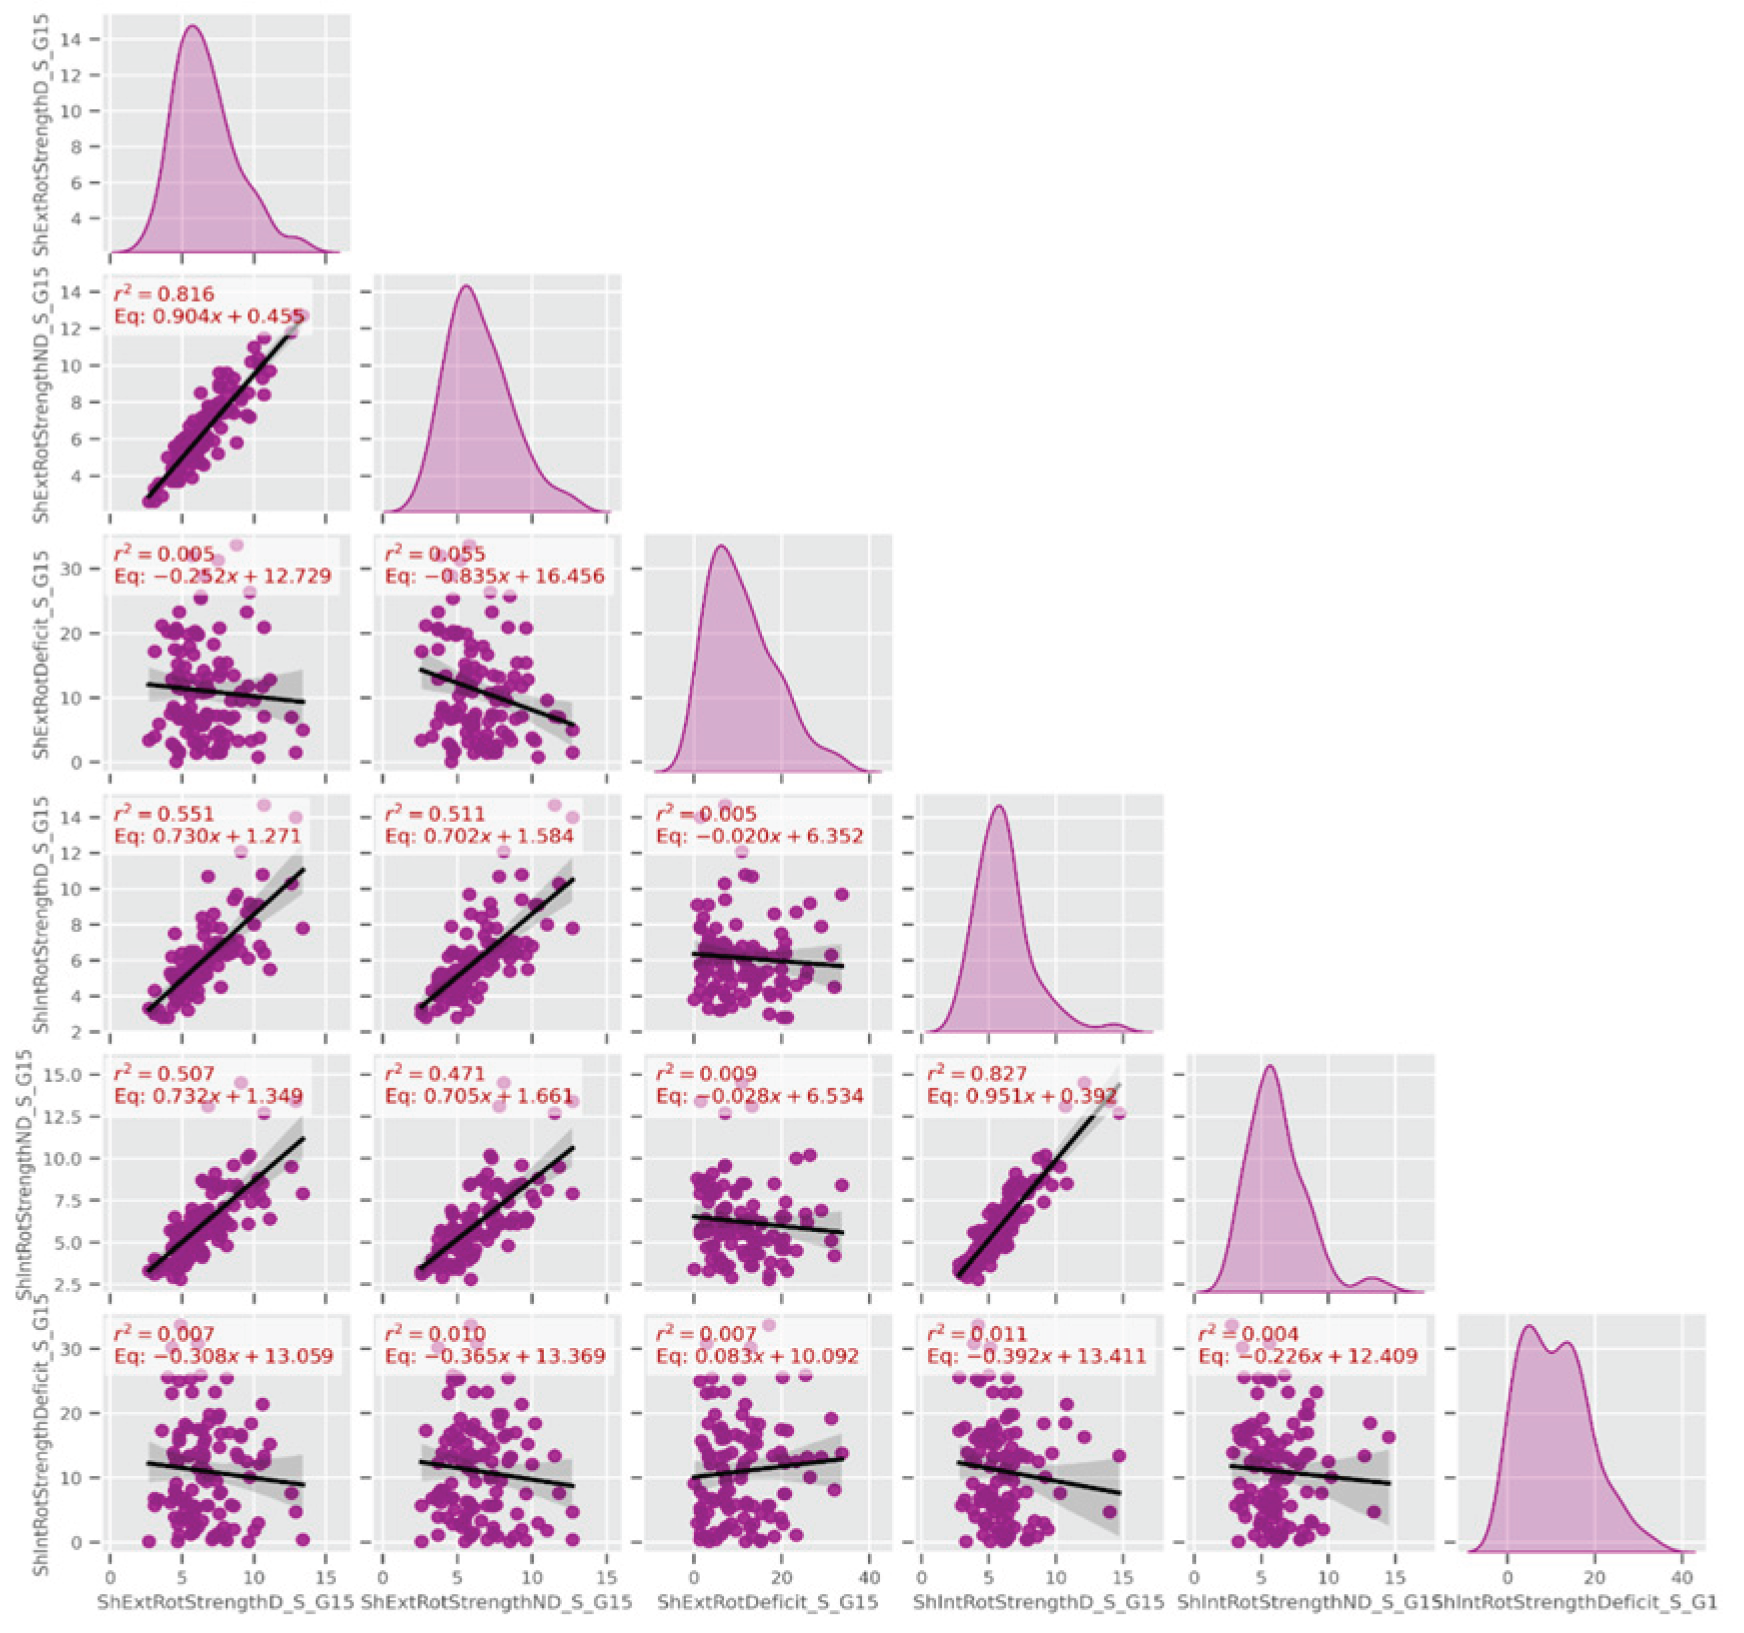
Figure 10.
Linear models among (a) hip abductors strength measurements and (b) shoulder external rotators endurance measurements (Data group 16 and 17 respectively).
Figure 10.
Linear models among (a) hip abductors strength measurements and (b) shoulder external rotators endurance measurements (Data group 16 and 17 respectively).
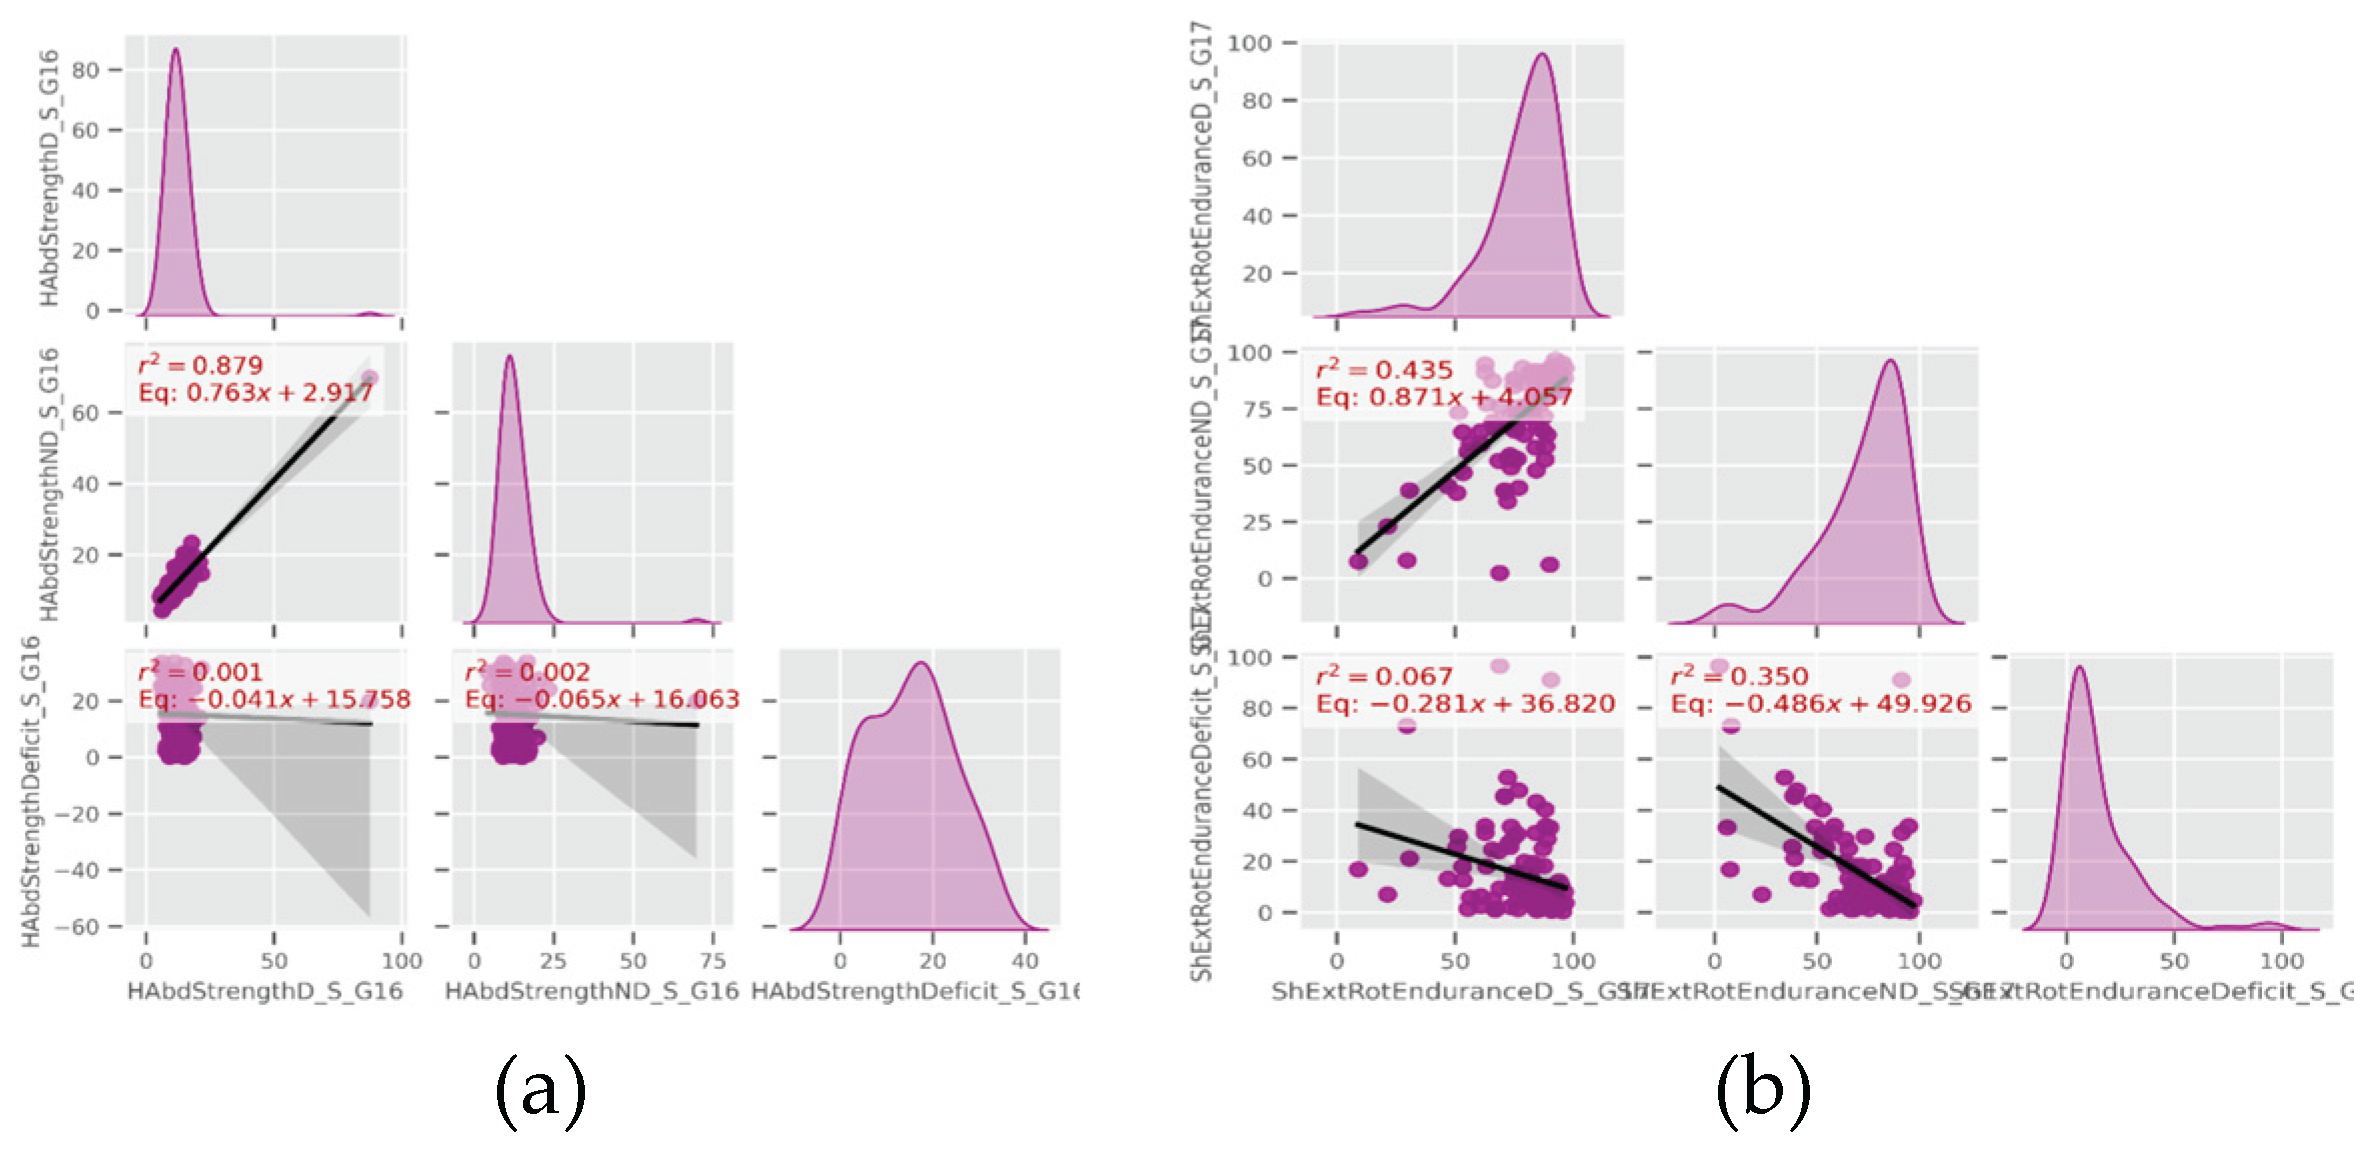
Figure 11.
AUC performance of the logistic regression for all the continuous variables.
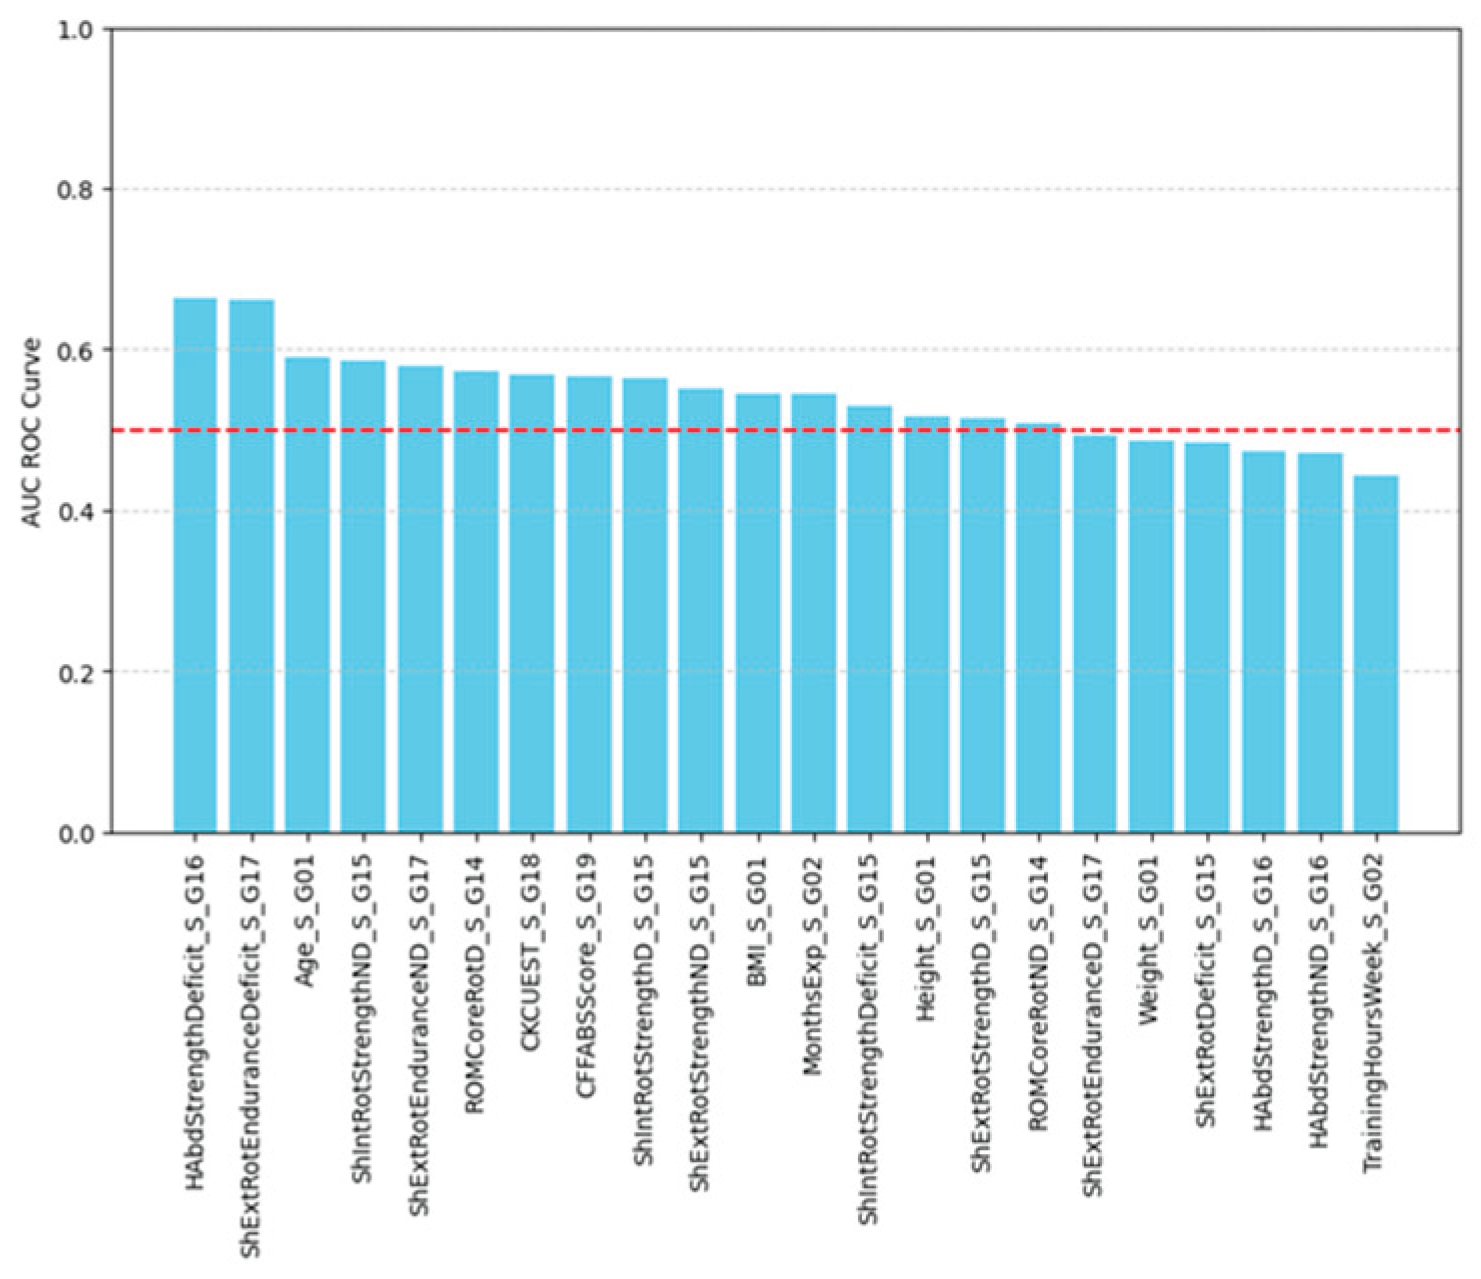
Figure 12.
(a) Logistic regression model and (b) ROC curve for hip abduction strength deficit.
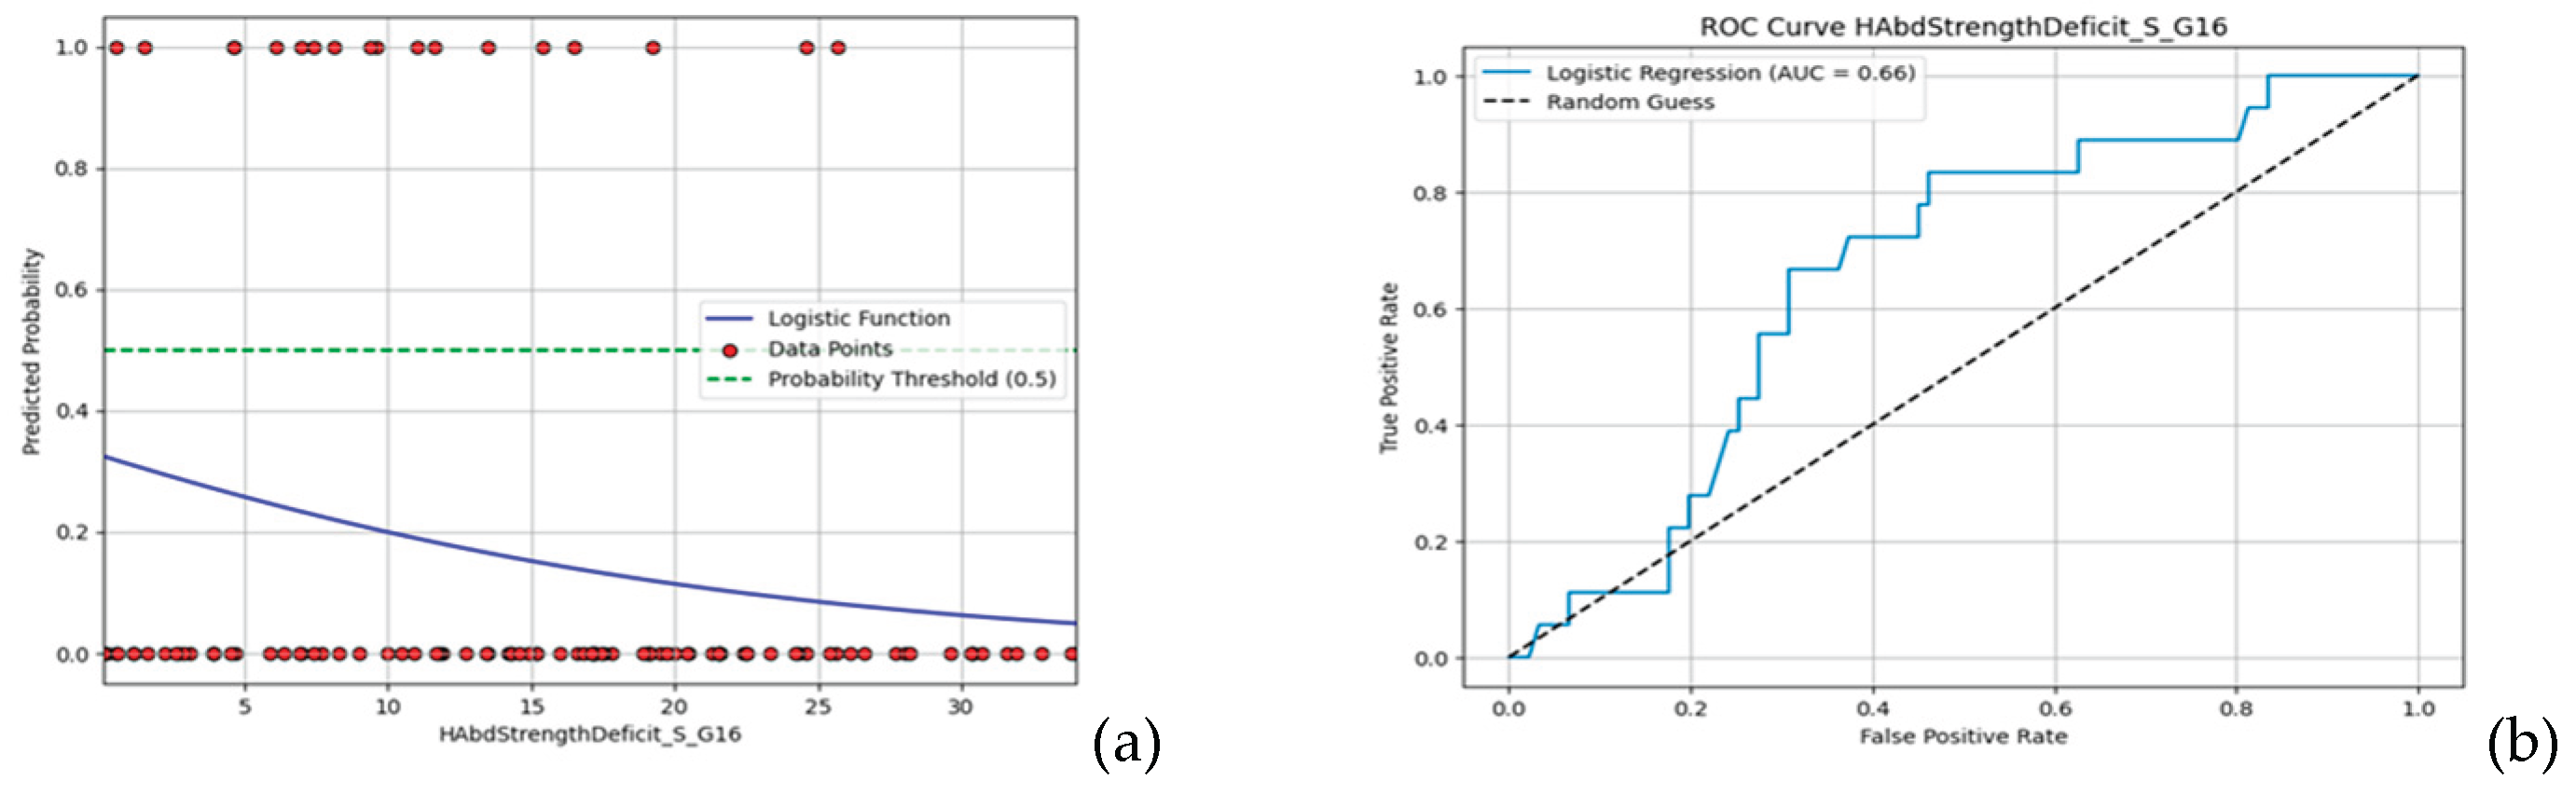
Figure 13.
(a) Logistic regression model and (b) ROC curve for shoulder external rotation endurance deficit.
Figure 13.
(a) Logistic regression model and (b) ROC curve for shoulder external rotation endurance deficit.
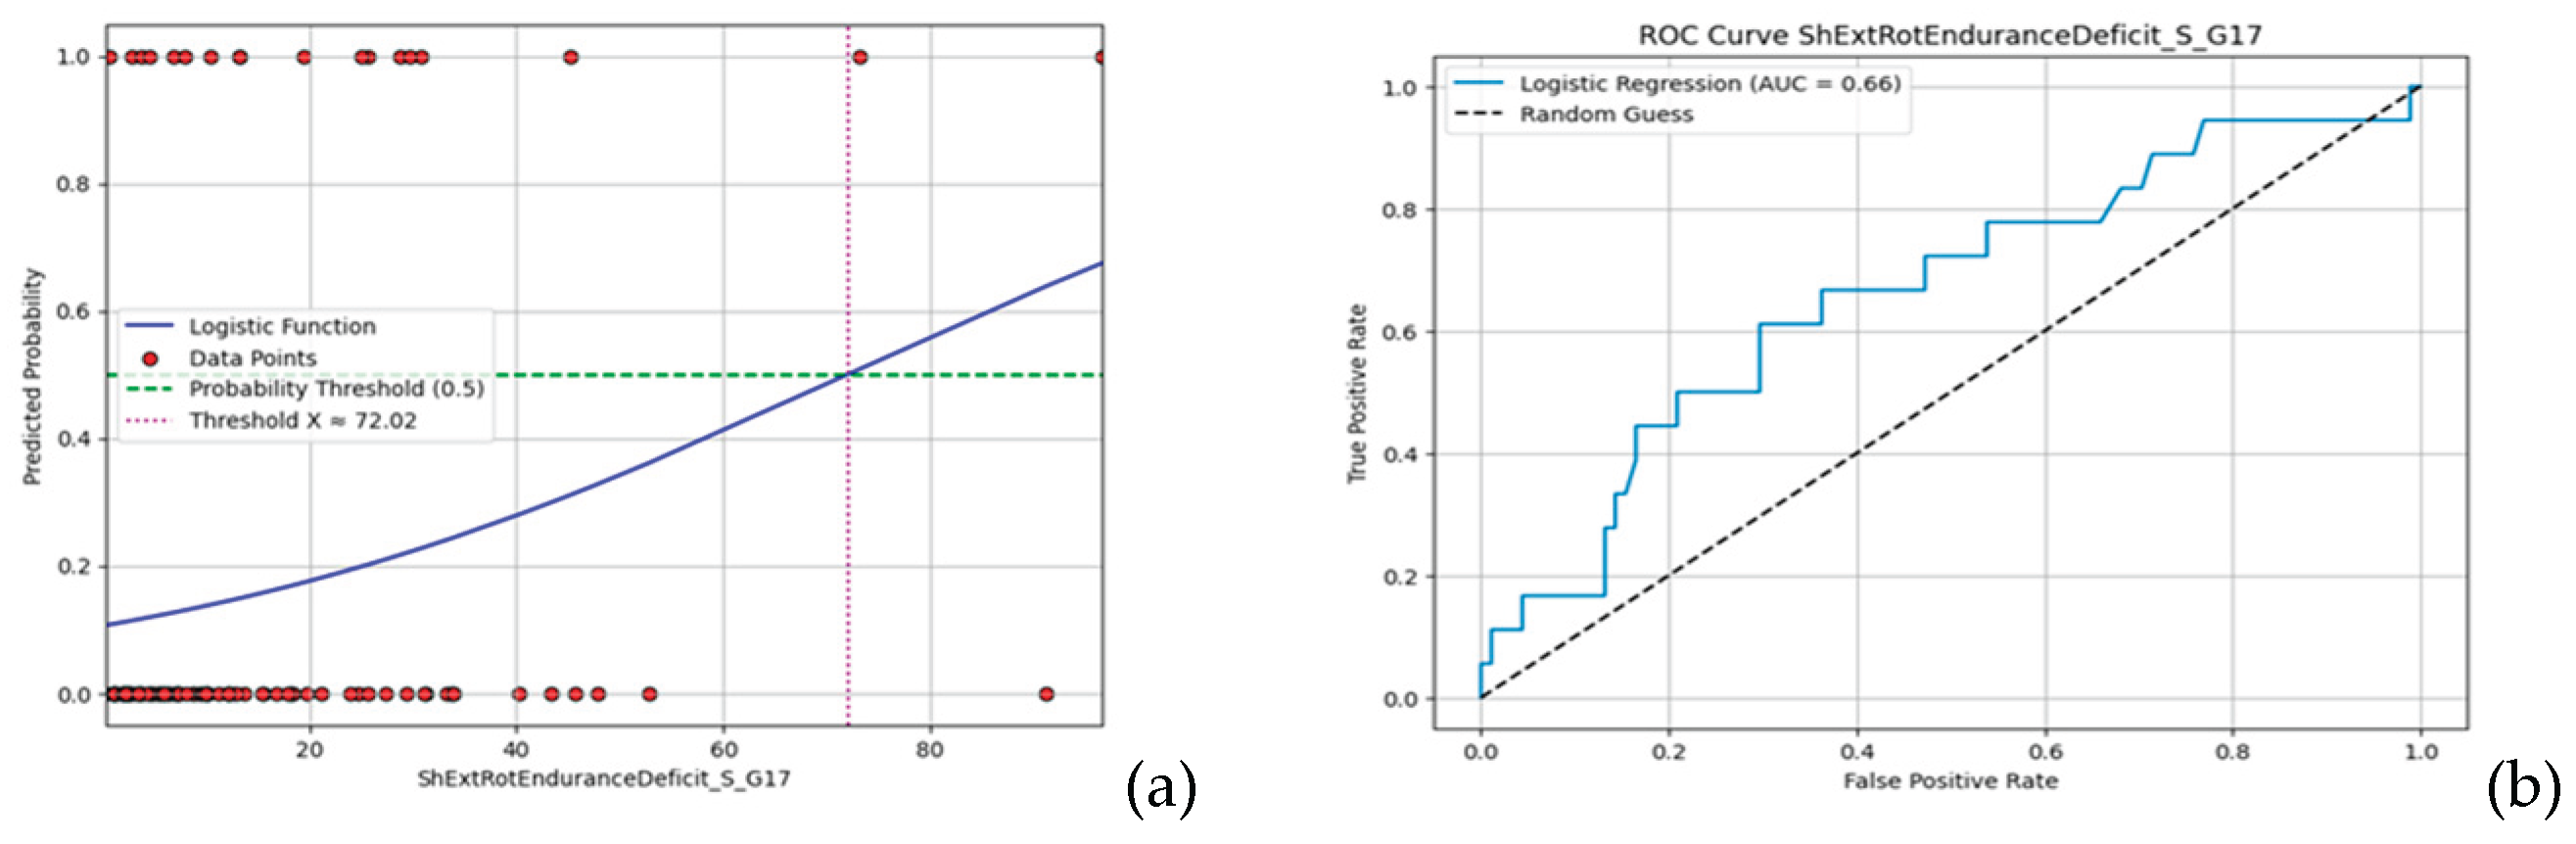

Table 1.
Descriptive statistics for baseline measurements.
| Variable | Mean | Std. Deviation | Std. Error Mean | Range |
|---|---|---|---|---|
| Age (years) | 33.73 | 7.31 | .70 | 20 – 62 |
| Weight (kg) | 75.24 | 14.57 | 1.40 | 47.50 - 113.90 |
| Height (meters) | 1.73 | 0.10 | .01 | 1.54 - 1.94 |
| BMI (kg/m2) | 24.89 | 3.34 | .32 | 18.79 - 35.59 |
| Experience (months) | 34.10 | 29.16 | 2.79 | 1 - 120 |
| Training Volume (hours/week) | 4.48 | 2.36 | .23 | 1 - 18 |
| ROM Core Rotation D* (degrees) | 73.32 | 14.07 | 1.35 | 40 - 105 |
| ROM Core Rotation ND** (degrees) | 77.92 | 13.87 | 1.33 | 40 - 125 |
| Shoulder External Rotation Strength D (kg) | 6.66 | 2.16 | .21 | 2.70 - 13.40 |
| Shoulder External Rotation Strength ND (kg) | 6.48 | 2.16 | .21 | 2.60 - 12.70 |
| Shoulder External Rotation Strength Deficit (side-to-side difference %) | 11.05 | 7.67 | .74 | 0.10 - 33.70 |
| Shoulder Internal Rotation Strength D (kg) | 6.13 | 2.12 | .20 | 2.80 - 14.70 |
| Shoulder Internal Rotation Strength ND (kg) | 6.22 | 2.22 | .21 | 2.80 - 14.50 |
| Shoulder Internal Rotation Strength Deficit (side-to-side difference %) | 11.01 | 7.80 | .75 | 0.10 - 33.70 |
| Hip Abduction Strength D (kg) | 12.77 | 7.99 | .77 | 5.60 - 87.30 |
| Hip Abduction Strength ND (kg) | 12.66 | 6.50 | .62 | 4.30 - 69.80 |
| Hip Abduction Strength Deficit (side-to-side difference %) | 15.24 | 9.25 | .89 | 0.10 - 34 |
| Shoulder External Rotation Endurance D (%) | 78.37 | 15.98 | 1.53 | 9.10 - 96.50 |
| Shoulder External Rotation Endurance ND (%) | 72.31 | 21.11 | 2.02 | 2.40 - 96.90 |
| Shoulder External Rotation Endurance Deficit (side-to-side difference %) | 14.77 | 17.35 | 1.66 | 0.40 - 96.60 |
| CKCUEST Score (non-dimensional) | 24.39 | 5.27 | .51 | 13 - 37 |
| CF FABS Score (non-dimensional) | 11.61 | 5.16 | .49 | 0 - 22 |
*D: dominant upper extremity (UE), ND**: non-dominant UE.
Table 2.
Descriptive statistics of the new referred shoulder injuries’ scale data.
| Variable | Mean | Std. Deviation | Std. Error Mean | Range |
|---|---|---|---|---|
| VAS Pain Score | 5.15 | 1.69 | .38 | 3.0 - 9.0 |
| SDQ Score (%) | 38.13 | 16.83 | 3.76 | 12.50 - 87.50 |
| Days Out | 13.75 | 28.04 | 6.27 | 0 - 108 |
Table 3.
Comparisons between the continuous data of the functional measurements.
| Variable | t-statistic | p-value |
|---|---|---|
| ROM Core Rotation D (degrees) | -0.8749 | 0.384 |
| ROM Core Rotation ND (degrees) | -0.1206 | 0.904 |
| Shoulder External Rotation Strength D (kilograms) | 0.4344 | 0.665 |
| Shoulder External Rotation Strength ND (kilograms) | 0.8175 | 0.416 |
| Shoulder External Rotation Strength Deficit (side-to-side difference %) | -0.2284 | 0.820 |
| Shoulder Internal Rotation Strength D (kilograms) | 1.8113 | 0.073 |
| Shoulder Internal Rotation Strength ND (kilograms) | 1.4597 | 0.147 |
| Shoulder Internal Rotation Strength Deficit (side-to-side difference %) | -0.3061 | 0.760 |
| Hip Abduction Strength D (kilograms) | -0.2777 | 0.782 |
| Hip Abduction Strength ND (kilograms) | -0.2952 | 0.768 |
| Hip Abduction Strength Deficit (side-to-side difference %) | -2.2162 | 0.029* |
| Shoulder External Rotation Endurance D (%) | -0.2963 | 0.768 |
| Shoulder External Rotation Endurance ND (%) | -1.6982 | 0.092 |
| Shoulder External Rotation Endurance Deficit (side-to-side difference %) | 2.6192 | 0.010* |
| CKCUEST (nd) | -0.7786 | 0.438 |
| CF FABS Score (nd) | 1.0984 | 0.275 |
* Statistically significant individually, but non-significant after Bonferroni adjustment.
Table 4.
Comparisons between the ordinal epidemiological data and sport-specific testing measurements.
Table 4.
Comparisons between the ordinal epidemiological data and sport-specific testing measurements.
| Variable | t-statistic | p-value | |
|---|---|---|---|
| Epidemiological characteristics | Adequate Warm Up | 611.0 | 0.029** |
| Adequate Recovery | 850.5 | 0.784 | |
| Prior Fitness Level | 903.5 | 0.464 | |
| DUE* Injured Areas | 663.5 | 0.153 | |
| NDUE* Extremity Injured Areas | 636.0 | 0.082 | |
| DLE* Injured Areas | 776.5 | 0.691 | |
| NDLE* Injured Areas | 742.0 | 0.442 | |
| Core Injured Areas | 663.5 | 0.153 | |
| All Injured Areas | 509.5 | 0.0097** | |
| CF FABS individual tests | Squat | 695.5 | 0.289 |
| Shoulder Rotation D | 825.0 | 0.962 | |
| Shoulder Rotation ND | 680.5 | 0.243 | |
| Wall Angel | 932.0 | 0.326 | |
| OHS | 688.0 | 0.262 | |
| Windmill D | 812.0 | 0.956 | |
| Windmill ND | 651.0 | 0.152 | |
| Sots Press | 684.0 | 0.241 |
*DUE: dominant upper extremity, NDUE: non-dominant upper extremity, DLE: dominant lower extremity, NDLE: non-dominant lower extremity. ** Statistically significant individually, but non-significant after Bonferroni adjustment.
Disclaimer/Publisher’s Note: The statements, opinions and data contained in all publications are solely those of the individual author(s) and contributor(s) and not of MDPI and/or the editor(s). MDPI and/or the editor(s) disclaim responsibility for any injury to people or property resulting from any ideas, methods, instructions or products referred to in the content. |
© 2025 by the authors. Licensee MDPI, Basel, Switzerland. This article is an open access article distributed under the terms and conditions of the Creative Commons Attribution (CC BY) license (http://creativecommons.org/licenses/by/4.0/).
Copyright: This open access article is published under a Creative Commons CC BY 4.0 license, which permit the free download, distribution, and reuse, provided that the author and preprint are cited in any reuse.


