
Submitted:
14 May 2025
Posted:
15 May 2025
You are already at the latest version
Abstract
Chronic obstructive pulmonary disease (COPD), whose main risk factor is cigarette smoking, is among the most prevalent diseases worldwide. Previous studies have shown that cigarette smoke extract (CSE) can directly affect pulmonary artery function independently of hypoxia resulting from the airway obstruction. In addition, CSE also affects bronchial smooth muscle, leading to airway hyper-responsiveness. However, its specific impact on the contractile machinery of this compartment remains unclear. In this study, using in vitro experiments with human bronchial smooth muscle cells (hBSMC) we found that CSE exposure disrupted calcium homeostasis, increased ROS and lipid peroxidation, and reduced cell antioxidant defenses. Furthermore, CSE exposure altered the cell contractile apparatus by decreasing key cytoskeletal proteins and impairing actin dynamics, this potentially contributing to cell dysregulated contractile response. Notably, these effects were significantly attenuated by antioxidant drugs such as mitoTEMPO and N-acetylcysteine, as well as by the inhibition of the RE calcium channels with 2-aminoethoxydiphenyl borate (2-APB). More importantly, mitoTEMPO partially restored the contractile response of bronchus upon CSE challenge. Collectively, our findings give evidence that CSE-mediated increase in ROS and intracellular calcium contribute to cytoskeletal disruption and functional impairment in airway smooth muscle. Moreover, these results also point to potential therapeutical approaches for mitigating the harmful effects of cigarette smoke in the lung.
Keywords:
COPD
; cigarettes smoke
; contractility
; mitochondria
; calcium
; ROS
1. Introduction
Chronic obstructive pulmonary disease (COPD) is one of the most important causes of morbidity, mortality, and healthcare use, affecting 400 million people worldwide [1]. In addition, it is the third-leading cause of death globally, being responsible for over 3 million deaths annually [2]. This pulmonary disease develops slowly over many years and noticeable symptoms, such as chronic bronchitis, emphysema and small airway obstruction appear several years later. However, the most severe comorbidity of this illness is the development of pulmonary hypertension (PH), due in part to the local hypoxia after the emphysema develops [3]. In this context, cigarette smoke (CS) is the main risk factor that contributes to the development and progression of COPD. Nevertheless, environmental factors, such as the rising prevalence of fine particles, dust or fumes can also play an important role, especially in non-smokers [4].
Bronchodilators and glucocorticoids are the most widely used treatments with therapeutic effects for COPD [5]. However, despite its profound public health impact, curative therapies for COPD or COPD-related pulmonary hypertension are not yet available. Therefore, understanding of the molecular mechanisms involved in these pathologies are needed to develop new therapeutic approaches. In this respect, recent studies of our laboratory have shown that cigarette smoke extract (CSE) has direct effects on the pulmonary vasculature, independently of the hypoxic situation, that lead to a vascular remodeling responsible for the development of pulmonary hypertension [6,7]. On the other hand, studies on the airways demonstrate that CSE promotes airways hyper-responsiveness, an effect that gradually drives into an unusual narrowing of the airways due to smooth muscle contraction [8]. In this context, bronchial smooth muscle cells play a central role in regulating airway function; therefore, it is essential to unveil the mechanisms whereby CSE-treatment impairs their performance.
The accumulation of reactive oxygen species (ROS) has been closely associated with COPD pathogenesis, as evidenced by increased oxidative stress markers in exhaled breath condensates and lung tissues of COPD patients compared to control subjects [9]. This phenomenon may be caused not only by oxidizing substances such as tobacco, but also by an excessive production of these species or a decrease in the antioxidant defenses of the cells. In this respect, other authors have identified lower levels of glutathione (GSH) in bronchoalveolar lavages (BAL) from COPD patients [10], and our group has shown that treatment with CSE promotes not only increased oxidative stress, but also a dysregulated antioxidant response in pulmonary arterial smooth muscle cells [7]. Indeed, the excessive ROS production triggers a redox imbalance that contributes to organelle damage and disrupted homeostasis [11]. In particular, mitochondria are considered one of the main sources of ROS in the cell [12], and mitochondrial ROS (mtROS) are routinely produced at several sites within the organelle. However, when a sudden or sustained increase in mtROS exceeds the natural antioxidant defense mechanisms in the cell, the resulting oxidative stress impairs cellular function and viability, ultimately contributing to the onset and progression of COPD [13]. Therefore, elucidating the role of CSE-induced oxidative stress in airway contractile impairment is of particular interest in the context of COPD. To that end, we will first investigate a set of key proteins involved in the contractile machinery of bronchial smooth muscle cells, which may be susceptible to CSE-induced alterations.
In this regard, filamentous actin (F-actin) is one of the most representative proteins of the cell cytoskeleton. Specifically, it plays an important role in focal adhesions, alongside other proteins such as vinculin [14]. Furthermore, actin is organized within the cytoplasm of smooth muscle cells where it interacts with myosin to form the core components of the contractile machinery. Both are involved in force generation in a cyclical mechanism that requires myosin light chain (MLC) phosphorylation. However, the contraction of smooth muscle involves many different upstream signals before the latter event occurs. For instance, calmodulin, in the presence of calcium, is known to activate myosin light chain kinase (MLCK), resulting in MLC phosphorylation and contraction [15]. Furthermore, other upstream kinases, such as protein kinase C (PKC) can also contribute to MLCK activation through other signaling pathways [16]. Additionally, microtubule network also plays a critical role in intracellular dynamics; however, its regulation in smooth muscle cells, particularly in the context of respiratory pathologies such as COPD, remains poorly understood.
In addition to the above-mentioned alterations, other species such as hydroxyl radical and hydroperoxyl [17] can trigger the peroxidation of polyunsaturated fatty acids in biological tissues. Indeed, these products have been shown to display higher levels in breath condensate and in lungs of stable COPD patients. Moreover, they also correlate negatively with the lung function marker forced expiratory volume in one second (FEV1), suggesting that lipid peroxidation plays an important role in the decline of lung function [18]. Furthermore, it has been shown that this phenomenon also regulates podocyte migration and cytoskeleton structure [19]. Therefore, it is plausible that this phenomenon might also be occurring within the airway smooth muscle and contribute to the CSE-negative effects in this compartment, such as the dysregulated contractile response.
This study aims to delve deeper into the molecular mechanisms underlying the development of airway hyper-responsiveness induced by cigarette smoke. Our findings demonstrate that cigarette smoke exposure promoted oxidative stress, increased intracellular calcium levels, and disrupts the contractile machinery, collectively contributing to functional impairment of the bronchial smooth muscle layer. Furthermore, we show that several pharmacological agents, in particular antioxidants, effectively mitigate these CSE-induced alterations in the airways.
2. Materials and Methods
Cell culture. Primary bronchial smooth muscle cells (hBSMC) were obtained from ScienCell Research Laboratories (#3400), and cultured following manufacturer’s recommendations in smooth muscle cell medium (ScienCell, #1101) with 2% fetal bovine serum (ScienCell, #0010), 1X smooth muscle cell growth supplement (ScienCell, #1152), and penicillin/streptomycin solution (ScienCell, #0503). Cells were grown to 90% maximum confluence, maintained in incubators at 37ºC and 5% CO2 in a humidified atmosphere and used for a maximum number of eight passages. In the indicated experiments, cells were pretreated with 25 nM of the mitochondrial antioxidant mitoTEMPO (Sigma, SML0737) for 24 hours or with 500 μM N-acetylcysteine (NAC) (Sigma, A7250) for 2 hours before being co-treated with 15% CSE. The rest of the treatments were as follows: before CSE treatment cells were pre-treated with 50 μM 2-Aminoethoxydiphenyl borate (2-APB) (Merck, 100065) for 2 hours or 5 μM cytochalasin B (Merk, C6762) for 2 hours. Afterwards cells media was washed out and replaced with fresh media containing 15% CSE. When treated with CSE, cells were maintained in a different incubator to avoid the exposure of non-treated cells to volatile substances from CSE.
Western blot analysis. Cells were grown to 90% confluence in culture plates in the presence or absence of CSE for different times and lysates were prepared in non-reducing 2X Laemmli buffer, boiled at 95ºC for 10 minutes in the presence of 20 mM Dithiothreitol (DTT), electrophoretically separated by SDS-PAGE and transferred onto 0.45-μm nitrocellulose membranes (GE Healthcare Life Sciences, 10600003). Total protein bands were reversibly stained with Fast Green FCF (Sigma, F7252) and imaged on Amersham ImageQuant 800 (GE Healthcare Life Sciences) for total protein quantification. Transferred proteins were incubated overnight at 4ºC with specific primary antibodies (Table 1). Horseradish peroxidase conjugated secondary antibodies (Table 2) were added for 1 hour at room temperature and protein signal was then visualized using Immobilon Forte (Millipore, WBLUF0500) on Amersham ImageQuant 800. Specific protein bands intensity was quantified by densitometry using ImageJ 1.51 software (U. S. National Institutes of Health, Bethesda, Maryland, USA) and normalized to the intensity of Fast Green FCF staining from each gel lane.
Cell hypertrophy assessment. Cells were grown in 35 mm plates in the presence of CSE for 48 hours. Afterwards they were detached with 0.05% trypsin-EDTA (Gibco, 25300-054) and analyzed by flow cytometry. Median forward scattering of light from Ar 488 nm laser was quantified on a FACSCanto™ II cytometer (BD Biosciences), excluding cell debris and doublets from the analysis.
Proliferation assay. Cells were stained with 5 μM fluorescent probe carboxyfluorescein succinimidyl ester (CFSE, CellTraceTM, Thermo Fisher Scientific, C34554) in PBS for 20 minutes at 37 ºC. Afterwards, complete medium was added for another 5 minutes to stop the staining process and cells were allowed to attach on 24-well plates before CSE challenge. Cells were detached with 0.05% trypsin-EDTA (Gibco, 25300-054), and median CFSE fluorescence intensity was measured on a FACSCantoTM II cytometer (BD Biosciences), illuminating with Ar 488 nm lase, right before CSE exposure (day 0 condition) or 72 hours later. Results were expressed as the lost CFSE fluorescence with respect to day 0 condition and normalized to CSE- untreated cells fluorescence levels.
Quantification of calcium, cytosolic and mitochondrial superoxide levels. hBSMC were grown in 35 mm plates and exposed to CSE and/or different drugs. After that, cytosolic and mitochondrial superoxide levels, as well as intracellular calcium levels, were analyzed with fluorescent probes 10 μM dihydroethidium (DHE) (Invitrogen, D11347), 5 μM MitoSOXTM Red (Thermo Fisher Scientific, M36008) and 1 μM Fluo-4 AM (ThermoFisher Scientific, F14201), respectively. Afterwards, cells were trypsinized and quantified by flow cytometry. Events were collected on a FACS Canto II flow cytometer, excluding cell debris and doublets from the subsequent analysis by means of forward (FSC) and side scattering (SSC) of the blue laser light. All collected data were analyzed by GraphPad Prism 9.5.1 software.
Quantification of lipid peroxidation. hBSMC were grown in 35 mm plates and exposed to CSE and/or different drugs. Afterwards, C11-BODIPY 581/591 staining was conducted. Briefly, a 1.5 mM solution of C11-BODIPY was prepared in DMSO and then diluted in Opti-MEM to achieve a final concentration of 1 μM. Cells were then incubated in the working solution for 30 minutes at 37ºC, trypsinized and quantified by flow cytometry. The degree of lipid peroxidation was quantified by calculating the fluorescence intensity ratio between 510 nm (the emission peak of its oxidized form) and 590 nm (the emission peak of its reduced form). Events were collected on a FACS Canto II flow cytometer, excluding cell debris and doublets from the subsequent analysis by means of forward (FSC) and side scattering (SSC) of the blue laser light. All collected data were analyzed by GraphPad Prism 9.5.1 software.
Immunofluorescence. hBSMC were seeded onto fibronectin (5 μg/mL) coated 13-mm glass coverslips and then incubated under the desired experimental conditions. Cells were then fixed with 4% paraformaldehyde in PBS for 20 minutes at 4 ºC and permeabilized with 0,3% saponin in 0,2% BSA/PBS. Next, they were labeled with fluorescent primary antibodies (anti-P-MLC and anti-vinculin) followed by Alexa Fluor 488 and 568 labeled secondary antibodies, respectively and phalloidin-conjugated Alexa 647. DAPI probe was used to stain cell nuclei. Cells mounted in coverslips with Faramount Aqueous Medium (Agilent, S3025) were imaged using the THUNDER Imager 3D fluorescence microscope (Leica Microsystems) and processed with LASX software. Ten randomly selected images were collected for each sample.
Cytoskeleton recovery assay. The actin cytoskeleton was destabilized by incubation for 2 hours with 5 μM cytochalasin B (cytB) (Sigma-Aldrich, C6762-1MG) followed by a 1-hour recovery period, during which cells were cultured with or without 15% CSE exposure. NAC pretreatment was done for 2 hours before adding cytB. Then NAC was withdrawn during destabilization with cytB and reintroduced during the recovery period. Finally, the cells were labeled with Phalloidin Alexa FluorTM 568 (Invitrogen, A12380) at 1:200, trypsinized and analyzed by flow cytometry. To calculate the percentage of repolymerized F-actin the MFI of cells with cytoskeleton destabilized by cytB was normalized to the MFI of cells subjected to the same conditions without cytB.
Bronchial reactivity analysis. Bronchial segments from C57BL/6J female mice were carefully dissected free of surrounding tissue and cut into rings (1.8–2 mm length). Bronchial rings were then incubated for 24 hours in DMEM (Sigma-Aldrich, D5796) medium containing vehicle (Control) and CSE with or without mitoTEMPO (25 nM). Thereafter, rings were mounted in a wire myograph (610 M, Danish Myo Technology) with Krebs physiological solution maintained at 37°C and bubbled with a mixture of 21% O2 and 5% CO2. Contractility was recorded by an isometric force transducer and a displacement device coupled with a digitalization and data acquisition system (PowerLab, ADINSTRUMENTS). Rings were stretched to give an equivalent transmural pressure of 20 mmHg. After equilibration, bronchial rings were first stimulated with KCl (80 mM). Then, preparations were washed three times and allowed to recover before a new stimulation. After that, concentration-response curves to serotonin (5-HT, 30 nM - 10 µM) or to acetylcholine (ACh 1 nM - 10 µM) were performed.
Statistics. Data are presented as the mean ± S.E.M. Two-sided unpaired Student's t-test were used to compare two experimental groups and one-way or two-way ANOVA tests followed by Sidak’s post-hoc test were used when comparing three or more groups, according with the conditions of normality and homoscedasticity. In case the assumptions of normality and homoscedasticity were not accomplished, Wilcoxon test was used to compare two groups and non-parametrical Kruskal–Wallis test was used to compare three or more groups followed by Wilcoxon post-hoc test to compare between groups. No statistically significant differences were considered to be present when p values were larger than 0.05. Statistical and graphical analyses were performed with GraphPad Prism 9.5.1 software (San Diego, CA, USA).
3. Results
3.1. CSE Induces an Increase in Cytosolic and Mitochondrial ROS, Intracellular Calcium and Lipid Peroxidation in hBSMC
Given the close association between ROS production and COPD, and the crucial role of calcium in regulating the contractile response, we first analyze the levels of ROS, specifically the levels of oxygen superoxide, and intracellular calcium in human bronchial smooth muscle cells (hBSMC) following CSE treatment.
Our results showed that CSE promoted a rapid and significant increase in intracellular Ca2+ levels, peaking at 30 min post-exposure (Figure 1A). Moreover, this increase was accompanied by a small but significant increase in cytosolic superoxide levels, this reaching its maximum at 24 hours after CSE treatment (Figure 1B). In addition, superoxide levels generated by the mitochondria were significantly higher in CSE treated cells with a quick increase peaking 1 hour after CSE exposure (Figure 1C). This increase in ROS likely contributed to a marked increase in lipid peroxidation in hBSMC upon 24 hours of CSE exposure, with levels peaking at 48 hours post-exposure (Figure 1D). This oxidative damage may play a key role in mediating the harmful effects of CSE in this compartment.
3.2. CSE Stimulates ER-Mitochondria Crosstalk Triggering a Feedback Loop That Amplifies Both ROS and Calcium Levels
Given that CSE treatment induced a rise in superoxide in hBSMC, we sought to explore the underlying regulatory mechanisms and potential strategies to prevent it. First, we analyzed if antioxidants could prevent the CSE-mediated alterations in ROS homeostasis. As expected, our results showed that pretreatment with mitoTEMPO (a mitochondria-targeted antioxidant) could prevent the increase in mitochondrial superoxide stimulated by CSE treatment (Figure 2A). Moreover, pretreatment with NAC not only prevented the increase in mitochondrial and cytosolic superoxide levels but also inhibited the rise in intracellular calcium (Figure 2B-D).
These results suggested that tobacco may induce a bidirectional regulation of calcium and ROS. To explore this, we next assessed the effect of inhibiting calcium channels from the endoplasmic reticulum as inositol 1,4,5-triphosphate receptor (IP3R). Specifically, we evaluated the efficacy of 2-Aminoethoxydiphenilborate (2-APB), a membrane-permeable IP3R inhibitor, in preventing the increase in calcium and ROS.
Our results showed that inhibiting the endoplasmic reticulum IP3R with 2-APB prevented the initial rise in intracellular calcium (Figure 2E) and, more importantly, it also prevented the increase in mitochondrial superoxide (Figure 2F). However, contrary to our expectations, the late increase in cytosolic ROS observed 24 hours after CSE treatment could not be prevented with this drug (Figure 2G). These results therefore suggested the involvement of a RE-mitochondrial axis involved in the CSE-mediated increase in mtROS and calcium in hBSMC.
3.3. CSE Decreases Antioxidant Defenses in hBSMC.
Our previously published results demonstrate that CSE impairs the antioxidant response in pulmonary artery smooth muscle cells (Sevilla-Montero et al 2022). Given the significant increase in mitochondrial superoxide in CSE-treated hBSMC, we examined whether a reduction in certain cellular antioxidant enzymes contributed to this rise. Our results supported this hypothesis, showing that CSE treatment significantly reduced antioxidant defenses, specifically the levels in superoxide dismutase isoforms SOD1, SOD2 and SOD3, with the most pronounced decrease observed in the mitochondrial (SOD2) and extracellular (SOD3) forms (Figure 3A-C). In addition, catalase levels were also markedly diminished upon CSE exposure (Figure 3D). Notably, antioxidant treatment did not prevent the downregulation of these enzymes (data not shown). The resulting accumulation of superoxide, reinforced by impaired antioxidant defenses, likely contributed to the observed increase in lipid peroxidation, as previously shown. More importantly, this effect was totally prevented by treatment with either NAC or 2-APB after 24 hours of CSE exposure (Figure 3E).
3.4. hBSMC Exhibits a Senescent Phenotype in Response to CSE
Our previous findings demonstrate that CSE induces cell senescence in hPASMC [6]. Thus, we studied whether the molecular alterations observed in response to CSE in hBSMCs were also associated with the induction of a senescence phenotype. To this end, we assessed established markers of senescence, including changes in cell size and proliferative capacity. Our results proved that CSE treatment resulted in a significant increase in cell size as well as a marked reduction in proliferation (Figure 4A, B). These changes were consistent with the emergence of a senescent phenotype which became evident 72 hours after CSE exposure (Figure 4C).
3.5. CSE Decreases the Levels of Proteins Involved in Cytoskeleton Dynamics in hBSMC
As previously noted, airway hyper-reactivity is a common feature in COPD patients, and hBSMCs play a pivotal role in mediating this response. Since cell traction machinery is crucial to this process, we investigated whether CSE might affect the levels of some representative cytoskeletal proteins. To this end, we challenged hBSMC to 15% CSE for varying durations to assess time-dependent effects and afterwards analyzed protein levels by Western blots. Despite the levels of α-smooth muscle actin, which is a major component of the cytoskeleton and plays a central role in cell structure, remained unchanged, other cytoskeletal proteins including fibulin and tubulin were significantly diminished following 24 hours of CSE treatment (Figure 5A-C). Additionally, we analyzed the impact of smoke exposure on proteins of focal adhesions, since these are dynamic protein complexes playing a crucial role in mechanotransduction. Similarly, the levels of vinculin were significantly decreased in CSE-treated cells (Figure 5D). Next, we analyzed the levels of MLC and its phosphorylated active form p-MLC. Our results showed no significant changes in total MLC levels after 24 hours of CSE exposure. However, phosphorylated, active MLC levels increased at 15 minutes post-exposure, only to decrease significantly after 24 hours (Figure 5E, F). To address whether the effects on MLC phosphorylation were due to alterations in specific kinases, we analyzed the levels of MLCK (responsible for the phosphorylation and activation of MLC), and the levels of pPKC (ε) as an upstream effector of this signaling pathway. Although the levels of pPKC (ε) remained unchanged, MLCK levels showed only a slight increase 15 minutes after CSE exposure and was followed by a significant reduction after 24 h of treatment (Figure 5 G, H).
3.6. CSE Disrupts Actin Cytoskeleton Assembly and Impairs Its Spontaneous Recovery in hBSMCs After Cytochalasin B Treatment
To gain a better understanding not only of the levels of these proteins but also of their assembly within the cell cytoplasm, we performed immunofluorescence microscopy (Figure 6A). In agreement with our Western blot data, CSE decreased vinculin levels and changed its subcellular location from the cytoplasm to the cell periphery, these effects were partially prevented with NAC (Figure 6A). Although actin filaments appeared diffuse and poorly organized in CSE-treated cells, their quantitative levels remain unchanged (Figure 6 A, B). In addition, p-MLC fluorescence intensity was significantly reduced in CSE-treated cells, and this effect was also significantly prevented with NAC (Figure 6C).
To reconcile the discrepancy between actin levels and its organization, we performed an actin dynamics assay to assess cytoskeleton recovery capability following disruption by cytochalasin B. This drug is a cell-permeable mycotoxin that inhibits actin polymerization into filamentous actin. Specifically, it blocks actin monomer addition to the “barbed” end of the filaments, where monomers are normally added more rapidly [20]. Thus, hBSMCs were treated with cytochalasin B for 2 hours, followed by a 1-hour recovery period in drug-free medium, with or without CSE. Cytoskeletal organization was then evaluated using phalloidin staining and analyzed by flow cytometry. Our results showed that CSE-treated cells exhibited a significantly reduced actin repolymerization rate compared to controls (Figure 6D). Most importantly, pretreatment with the antioxidant NAC efficiently prevented this phenotype (Figure 6D). Therefore, these results indicated that CSE-mediated increase in ROS is responsible for the alterations of the cytoskeleton.
3.7. MitoTEMPO Alleviates CSE-Mediated Decrease in Bronchial Contractility
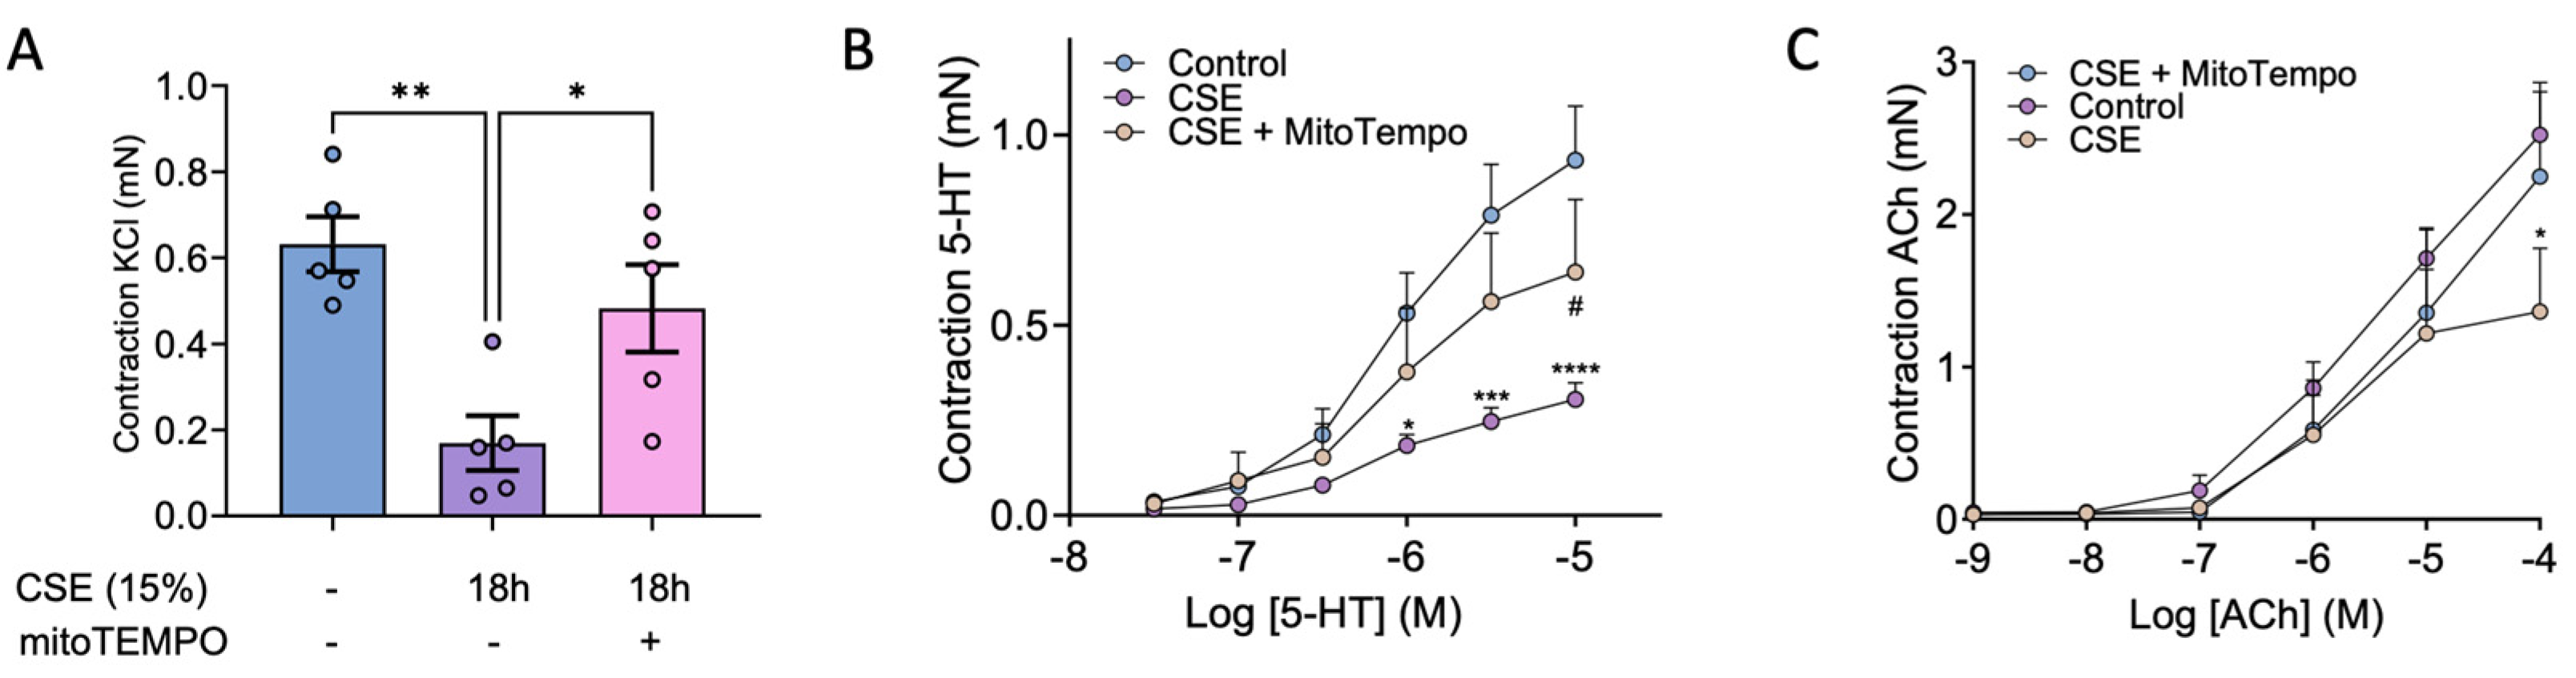
Since CSE exposure disrupted the expression of key proteins involved in smooth muscle contractility we further tested whether it might alter bronchial reactivity. To this end, mice bronchial rings were incubated with vehicle (Control) or CSE with or without mitoTEMPO and mounted in a wire myograph. We found that incubation with CSE markedly reduced the bronchial contraction to KCl (Figure 7A), to 5-HT (Figure 7B) and, to a lesser extent, to ACh (Figure 7C). Interestingly, mitoTEMPO alleviated the CSE-induced decrease in bronchial contraction to Ach, and more importantly, significantly prevented the decrease in contraction to KCl and 5-HT.
4. Discussion
COPD is a complex respiratory pathology characterized by chronic bronchitis, emphysema, small airway obstruction, and persistent respiratory symptoms. It is well-known that cigarette smoke, which is the main risk factor of this illness, is key to promote airway hyperresponsiveness. However, the mechanisms involved in CSE-mediated effects on airway smooth muscle are poorly understood. Here we have delved into the molecular mechanisms responsible for the generation of ROS and the deregulation of calcium levels in bronchial smooth muscle cells following exposure to tobacco smoke, and how these pathways contribute to the smoke-induced dysregulation in airway hyperreactivity.
We documented two different peaks of calcium occurring at 30’ and 24 hours after CSE exposure. This suggests that, despite calcium signaling occurs rapidly after the initial stimuli, this signal could be extended for longer periods of time due factors such as the continuous presence of CSE in the cell culture or the activation of “long-lasting” calcium channels. This could explain the increase in calcium observed after 24 hours of CSE exposure. Furthermore, this second wave of calcium may be amplified by the increase in ROS levels at later times. This is supported by previous results reporting a feedback regulatory mechanism between calcium and ROS [21]. In parallel, antioxidant enzymes such as SOD1, SOD2, SOD3 and catalase were decreased upon CSE treatment, this indicating that the rise in oxidative stress is not only due to the direct effects of tobacco smoke but also to impaired antioxidant defenses in bronchial smooth muscle cells. These findings are in line with previous results from our group in pulmonary artery smooth muscle cells [7]. Notably, N-acetylcysteine not only prevented the increase in ROS observed 24 hours post CSE exposure but also blocked the calcium peaks to both 30 minutes and 24 hours after CSE. This result supports the existence of a feedback loop between calcium and ROS and suggests that the early calcium influx in the cells may contribute to the late ROS surge. Additionally, CSE treatment increased mitochondrial superoxide levels, which was also prevented by NAC, further highlighting the effectiveness of this antioxidant in our cells. On the other hand, the reduction in antioxidant defenses and the resulting accumulation of hydrogen peroxide (H₂O₂), due to elevated cytosolic superoxide, likely accounts for the observed increase in lipid peroxidation after 24 hours of CSE exposure. Consistent with these findings, NAC effectively prevented this rise in lipid peroxidation, including the peak levels detected at 48 hours.
IP3 receptors, which mediate calcium release from intracellular stores, are mainly located in the endoplasmic reticulum [22]. In this regard, 2-APB, an antagonist of these receptors, was shown to block the early CSE-driven increase in intracellular calcium as well as the subsequent increase in mitochondrial superoxide. Thus, these results demonstrate that, in response to CSE, an initial cytosolic calcium surge originating from the ER triggers a subsequent overproduction of mitochondrial ROS. This phenomenon may be attributed to mitochondrial calcium uptake through calcium-permeable channels within this organelle, such as voltage-dependent anion channels (VDAC)located in the mitochondrial outer membrane [23]. This situation will in turn lead to a mitochondrial calcium overload responsible for the generation of mitochondrial oxidative stress [24].
CSE-mediated oxidative stress and calcium alterations in hBSMCs, may be potentially linked to impaired cytoskeleton function and organization observed in our cells, as some of these effects were prevented with antioxidants. In this context, previous studies have shown that nicotine [25], tobacco smoke exposure [26], and particularly elevated ROS levels [27,28] significantly impact cytoskeletal architecture, focal adhesion dynamics, and the organization of actin and tubulin networks. We also detected altered actin dynamics and decreased phosphorylation of myosin light chain (MLC), both critical markers of impaired contractile function. These alterations appear to be closely linked to CSE-induced oxidative stress, as they were mitigated by treatment with the antioxidant N-acetylcysteine (NAC). Supporting this, previous research suggests that MLCK activity is modulated by the cellular redox state, with elevated oxidative conditions potentially inhibiting its function and thus reducing MLC phosphorylation [28]. This mechanism may underlie the diminished reactivity of CSE-challenged bronchi observed in our study.
However, these findings are somewhat unexpected in this cellular compartment, as previous studies have reported that CSE exposure leads to increased airway hyperreactivity, primarily driven by enhanced contraction of airway smooth muscle cells [8]. This could be explained by the fact that phosphorylation is a rapid post-translational modification that occurs within minutes in response to specific stimuli. In fact, the analysis of MLC phosphorylation shortly after CSE exposure, demonstrated an early increase in pMLC levels, accompanied by a slight but concurrent rise in MLCK, the kinase responsible for MLC phosphorylation. These findings, along with the quick increase in cytosolic calcium suggest that hBSMCs exhibit an enhanced but short-lived contractile response immediately following CSE exposure. A plausible explanation for the reduced pMLC levels observed after 24 hours is that CSE may impair global protein synthesis in hBSMC, which could also account for the decreased levels of other cytoskeleton proteins. In addition, oxidative stress may contribute to protein degradation via oxidative modifications [29]. Notably, treatment with the antioxidant NAC prevented the CSE-mediated loss of cytoskeleton recovery ability and preserved the organization and/or the levels of key cytoskeletal proteins including vinculin, pMLC and F-actin. These findings indicate that the dysregulation of ROS and calcium homeostasis underlies the observed alterations in cytoskeletal integrity and contractile machinery.
Along with the disrupted expression and organization of crucial cytoskeleton proteins, we also confirmed that CSE reduced the bronchial contraction in response to KCl (used as a positive control), 5-HT and ACh. In this regard, mitoTEMPO alleviated the loss of contractility in response to ACh, and more importantly, it significantly prevented the CSE-mediated decrease in contractility with KCl and 5-HT. Therefore, these results further reinforce the importance of the early CSE-mediated increase in calcium and ROS in the contractile machinery disfunction of hBSMC.
In conclusion, our results demonstrate that CSE exposure disrupts cytoskeleton organization and function in hBSMC. This disruption is accompanied by increased levels of superoxide, intracellular calcium, and lipid peroxidation, factors that likely contribute to the detrimental effects of CSE on the contractile apparatus. This hypothesis is further supported by our observation that both antioxidants and calcium modulating agents effectively mitigate these alterations. Therefore, the use of these drugs, in combination with current therapies, could be a promising therapeutic approach for the management of COPD.
Author Contributions
Conceptualization, M.C., J.R. and R.A.; methodology, J.R., L.P., R.A. and A.H.; software, J.R., R.A. and A.H.; validation, J.R., R.A. and A.H.; formal analysis, J.R., R.A., M.C. and A.C.; investigation, M.C., J.R., R.A., C.M. and A.C.; resources, M.C., C.M. and A.C. ; data curation, M.C, C.M. and A.C.; writing—original draft preparation, M.C. and J.R.; writing—review and editing, M.C, J.R., R.A., A.H. and A.C.; visualization, M.C, J.R., R.A., A.H. and A.C.; supervision, M.C., C.M. and A.C.; project administration, M.C. and A.C.; funding acquisition, M.C.. All authors have read and agreed to the published version of the manuscript.
Funding
Spanish Ministerio de Ciencia e Innovación, Programa Retos en Investigación (grant -139144OB-I00). Redes en Biomedicina from Comunidad Autonoma of Madrid; INSPIRACM (P2022/BMD7224). Fundación Eugenio Rodríguez Pascual 2023.
Institutional Review Board Statement
Animal protocols were approved by the Committee for Research and Ethics of the Universidad Autonoma of Madrid (PROEX 322/14).
Data Availability Statement
All the data and materials involved in this study are present in the paper or the Supplementary Materials. Additional information can be provided upon request to the corresponding author.
Acknowledgments
Supporting grants to MJC: Spanish Ministerio de Ciencia e Innovación, Programa Retos en Investigación 2022 (grant -139144OB-I00). Redes en Biomedicina from Comunidad Autonoma of Madrid; INSPIRACM (P2022/BMD7224). Fundación Eugenio Rodríguez Pascual 2023. Optical microscopy experimentation was conducted at the Videomicroscopy Facility of the IIS-Princesa (Madrid, Spain), co-funded by IFEQ21/00085 and IFCS22/00014 from Instituto de Salud Carlos III (ISCIII) and FEDER.
Conflicts of Interest
The authors have no interests related to the content of the manuscript to declare.
Abbreviations
The following abbreviations are used in this manuscript:
| COPD | Chronic obstructive pulmonary disease |
| CSE | Cigarette smoke extract |
| hBSMC | Human bronchial smooth muscle cells |
| ROS | Reactive oxygen species |
| 2-APB | 2-Aminoethoxidiphenylborate |
| PH | Pulmonary hypertension |
| GSH | Glutathione |
| BAL | Bronchoalveolar lavage |
| mtROS | Mitochondrial ROS |
| MLC | Myosin light chain |
| MLCK | Myosin light chain kinase |
| PKC | Protein kinase C |
| FEV1 | Forced expiratory volume in one second |
| CFSE | Carboxyfluorescein succinimidyl ester |
| CytB | Cytochalasin B |
| SOD | Superoxide dismutase |
| ACh | Acetylcholine |
References
- Labaki, W.W.; Rosenberg, S.R. Chronic Obstructive Pulmonary Disease. Ann Intern Med 2020, 173, ITC17–ITC32. [CrossRef]
- Chow, R.; So, O.W.; Im, J.H.B.; Chapman, K.R.; Orchanian-Cheff, A.; Gershon, A.S.; Wu, R. Predictors of Readmission, for Patients with Chronic Obstructive Pulmonary Disease (COPD) - A Systematic Review. Int J Chron Obstruct Pulmon Dis 2023, 18, 2581–2617. [CrossRef]
- Jo, Y.S. Long-Term Outcome of Chronic Obstructive Pulmonary Disease: A Review. Tuberc Respir Dis (Seoul) 2022, 85, 289–301. [CrossRef]
- Christenson, S.A.; Smith, B.M.; Bafadhel, M.; Putcha, N. Chronic obstructive pulmonary disease. Lancet 2022, 399, 2227–2242. [CrossRef]
- Wang, C.; Zhou, J.; Wang, J.; Li, S.; Fukunaga, A.; Yodoi, J.; Tian, H. Progress in the mechanism and targeted drug therapy for COPD. Signal Transduct Target Ther 2020, 5, 248. [CrossRef]
- Sevilla-Montero, J.; Labrousse-Arias, D.; Fernández-Pérez, C.; Fernández-Blanco, L.; Barreira, B.; Mondéjar-Parreño, G.; Alfaro-Arnedo, E.; López, I.P.; Pérez-Rial, S.; Peces-Barba, G.; Pichel, J.G.; Peinado, V.I.; Cogolludo, Á; Calzada, M.J. Cigarette Smoke Directly Promotes Pulmonary Arterial Remodeling and Kv7.4 Channel Dysfunction. Am J Respir Crit Care Med 2021, 203, 1290–1305. [CrossRef]
- Sevilla-Montero, J.; Munar-Rubert, O.; Pino-Fadón, J.; Aguilar-Latorre, C.; Villegas-Esguevillas, M.; Climent, B.; Agrò, M.; Choya-Foces, C.; Martínez-Ruiz, A.; Balsa, E.; Muñoz-Calleja, C.; Gómez-Punter, R.M.; Vázquez-Espinosa, E.; Cogolludo, A.; Calzada, M.J. Cigarette smoke induces pulmonary arterial dysfunction through an imbalance in the redox status of the soluble guanylyl cyclase. Free Radical Biology and Medicine 2022, 193, 9–22. [CrossRef]
- Saunders, R.M.; Biddle, M.; Amrani, Y.; Brightling, C.E. Stressed out - The role of oxidative stress in airway smooth muscle dysfunction in asthma and COPD. Free Radic Biol Med 2022, 185, 97–119. [CrossRef]
- Murata, K.; Fujimoto, K.; Kitaguchi, Y.; Horiuchi, T.; Kubo, K.; Honda, T. Hydrogen peroxide content and pH of expired breath condensate from patients with asthma and COPD. COPD 2014, 11, 81–87. [CrossRef]
- Drost, E.M.; Skwarski, K.M.; Sauleda, J.; Soler, N.; Roca, J.; Agusti, A.; MacNee, W. Oxidative stress and airway inflammation in severe exacerbations of COPD. Thorax 2005, 60, 293–300. [CrossRef]
- Fan, X.; Dong, T.; Yan, K.; Ci, X.; Peng, L. PM2.5 increases susceptibility to acute exacerbation of COPD via NOX4/Nrf2 redox imbalance-mediated mitophagy. Redox Biol 2022, 59, 102587. [CrossRef]
- Zhang, B.; Pan, C.; Feng, C.; Yan, C.; Yu, Y.; Chen, Z.; Guo, C.; Wang, X. Role of mitochondrial reactive oxygen species in homeostasis regulation. Redox Rep 2022, 27, 45–52. [CrossRef]
- Antonucci, S.; Di Lisa, F.; Kaludercic, N. Mitochondrial reactive oxygen species in physiology and disease. Cell Calcium 2021, 94, 102344. [CrossRef]
- Gunst, S.J.; Tang, D.D. The contractile apparatus and mechanical properties of airway smooth muscle. Eur Respir J 2000, 15, 600–616. [CrossRef]
- Sohn, U.D.; Cao, W.; Tang, D.C.; Stull, J.T.; Haeberle, J.R.; Wang, C.L.; Harnett, K.M.; Behar, J.; Biancani, P. Myosin light chain kinase- and PKC-dependent contraction of LES and esophageal smooth muscle. Am J Physiol Gastrointest Liver Physiol 2001, 281, 467. [CrossRef]
- Vetterkind, S.; Morgan, K.G. Chapter 87 - Regulation of Smooth Muscle Contraction. In Muscle; Hill, J.A.; Olson, E.N., Eds.; Academic Press: Boston/Waltham, 2012; pp. 1173–1180.
- Ayala, A.; Muñoz, M.F.; Argüelles, S. Lipid Peroxidation: Production, Metabolism, and Signaling Mechanisms of Malondialdehyde and 4-Hydroxy-2-Nonenal. Oxid Med Cell Longev 2014, 2014, 360438. [CrossRef]
- Boots, A.W.; Haenen, G.R.M.M.; Bast, A. Oxidant metabolism in chronic obstructive pulmonary disease. European Respiratory Journal 2003, 22, 14s–27s. [CrossRef]
- Kruger, C.; Burke, S.J.; Collier, J.J.; Nguyen, T.; Salbaum, J.M.; Stadler, K. Lipid peroxidation regulates podocyte migration and cytoskeletal structure through redox sensitive RhoA signaling. Redox Biol 2018, 16, 248–254. [CrossRef]
- MacLean-Fletcher, S.; Pollard, T.D. Mechanism of action of cytochalasin B on actin. Cell 1980, 20, 329–341. [CrossRef]
- Görlach, A.; Bertram, K.; Hudecova, S.; Krizanova, O. Calcium and ROS: A mutual interplay. Redox Biol 2015, 6, 260–271. [CrossRef]
- Prole, D.L.; Taylor, C.W. Structure and Function of IP3 Receptors. Cold Spring Harb Perspect Biol 2019, 11, a035063. [CrossRef]
- Rosencrans, W.M.; Rajendran, M.; Bezrukov, S.M.; Rostovtseva, T.K. VDAC regulation of mitochondrial calcium flux: From channel biophysics to disease. Cell Calcium 2021, 94, 102356. [CrossRef]
- Peng, T.; Jou, M. Oxidative stress caused by mitochondrial calcium overload. Ann N Y Acad Sci 2010, 1201, 183–188. [CrossRef]
- Yoshiyama, S.; Chen, Z.; Okagaki, T.; Kohama, K.; Nasu-Kawaharada, R.; Izumi, T.; Ohshima, N.; Nagai, T.; Nakamura, A. Nicotine exposure alters human vascular smooth muscle cell phenotype from a contractile to a synthetic type. Atherosclerosis 2014, 237, 464–470. [CrossRef]
- D'Anna, C.; Cigna, D.; Di Sano, C.; Di Vincenzo, S.; Dino, P.; Ferraro, M.; Bini, L.; Bianchi, L.; Di Gaudio, F.; Gjomarkaj, M.; Pace, E. Exposure to cigarette smoke extract and lipopolysaccharide modifies cytoskeleton organization in bronchial epithelial cells. Exp Lung Res 2017, 43, 347–358. [CrossRef]
- Wilson, C.; González-Billault, C. Regulation of cytoskeletal dynamics by redox signaling and oxidative stress: implications for neuronal development and trafficking. Front Cell Neurosci 2015, 9, 381. [CrossRef]
- Xu, Q.; Huff, L.P.; Fujii, M.; Griendling, K.K. Redox regulation of the actin cytoskeleton and its role in the vascular system. Free Radic Biol Med 2017, 109, 84–107. [CrossRef]
- Pajares, M.; Jiménez-Moreno, N.; Dias, I.H.K.; Debelec, B.; Vucetic, M.; Fladmark, K.E.; Basaga, H.; Ribaric, S.; Milisav, I.; Cuadrado, A. Redox control of protein degradation. Redox Biol 2015, 6, 409–420. [CrossRef]
Figure 1.
CSE effects in mitochondrial and cytosolic superoxide levels, intracellular calcium and lipid peroxidation. hBSMC were exposed to 15% CSE for 30 minutes or for 1, 24 or 48 hours and afterwards flow cytometry analysis were performed. Cells were stained with 1 µM Fluo-4AM (A) and 10 µM DHE (B) to analyze calcium and cytosolic superoxide levels respectively, or with 5 µM MitoSOX Red to analyze mitochondrial superoxide (C). Lipid peroxidation was analyzed with 1 µM Bodipy 581/591 C11 and data were calculated as the ratio between the oxidized (510 nm) and the non-oxidized (590 nm) form (D). Results are presented as mean ± SEM, n = 3-17. Statistical analysis between three or more groups was carried out using one-way ANOVA test followed by Sidak’s post-hoc test. *P < 0.05, ***P < 0.005, ****P < 0.0001.
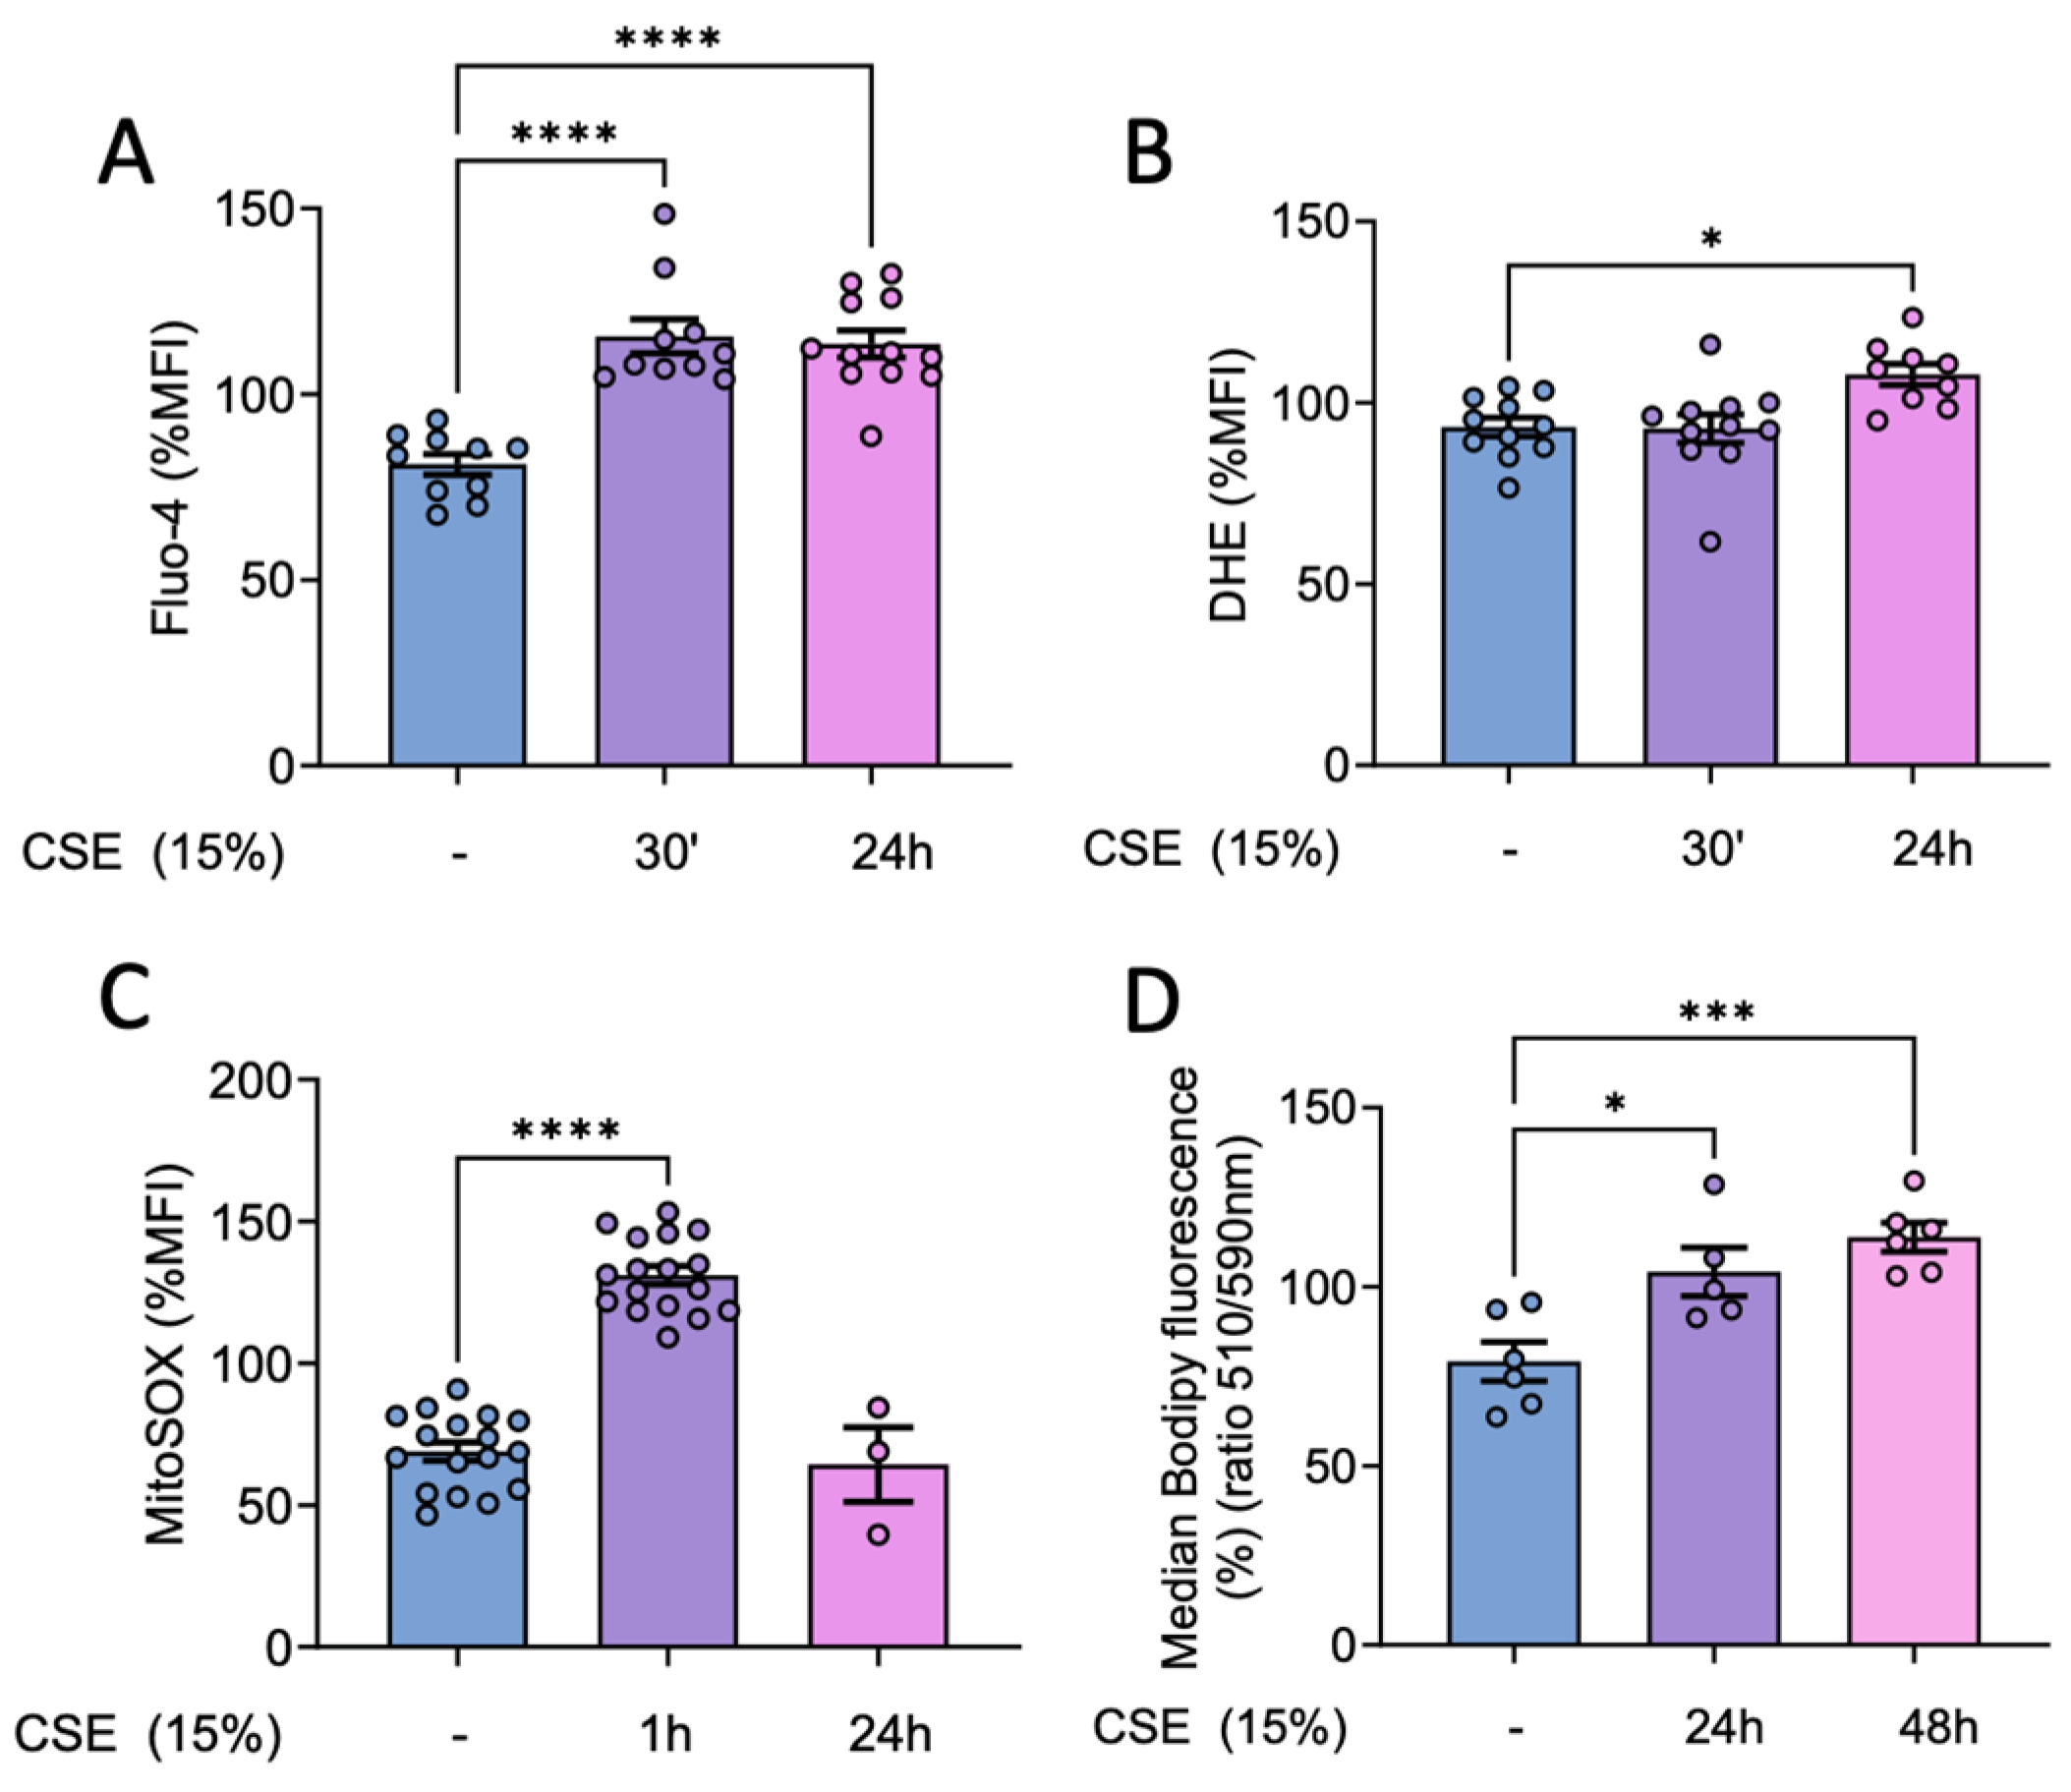
Figure 2.
Effects of antioxidants and ER calcium channel inhibition on CSE-mediated increase in intracellular calcium and ROS. Cells were cultured for 2 hours in the absence or the presence of 500 µM NAC, 25 nM mitoTEMPO before adding 15% CSE for the indicated time. Regarding 2-APB, cells were pre-treated with 50 µM of the drug for 4 hours. Afterwards, 2APB was removed and cells were exposed to 15% CSE for the indicated time. After that, cells were stained with 5 µM MitoSOX Red to analyze mitochondrial superoxide (A-B) or probed with 10 µM DHE (C) and 1 µM Fluo-4AM (D) to analyze cytosolic ROS and calcium levels respectively via flow cytometry. Effect of 2-APB on the CSE-mediated increase of calcium (E), mitochondrial (F) and cytosolic (G) superoxide were analyzed at the indicated times. Results are presented as mean ± SEM, n = 3-10. Statistical analysis between three or more groups was carried out using one-way ANOVA test followed by Sidak’s post-hoc test. *P < 0.05, **P < 0.01, ***P < 0.005, ****P < 0.0001.
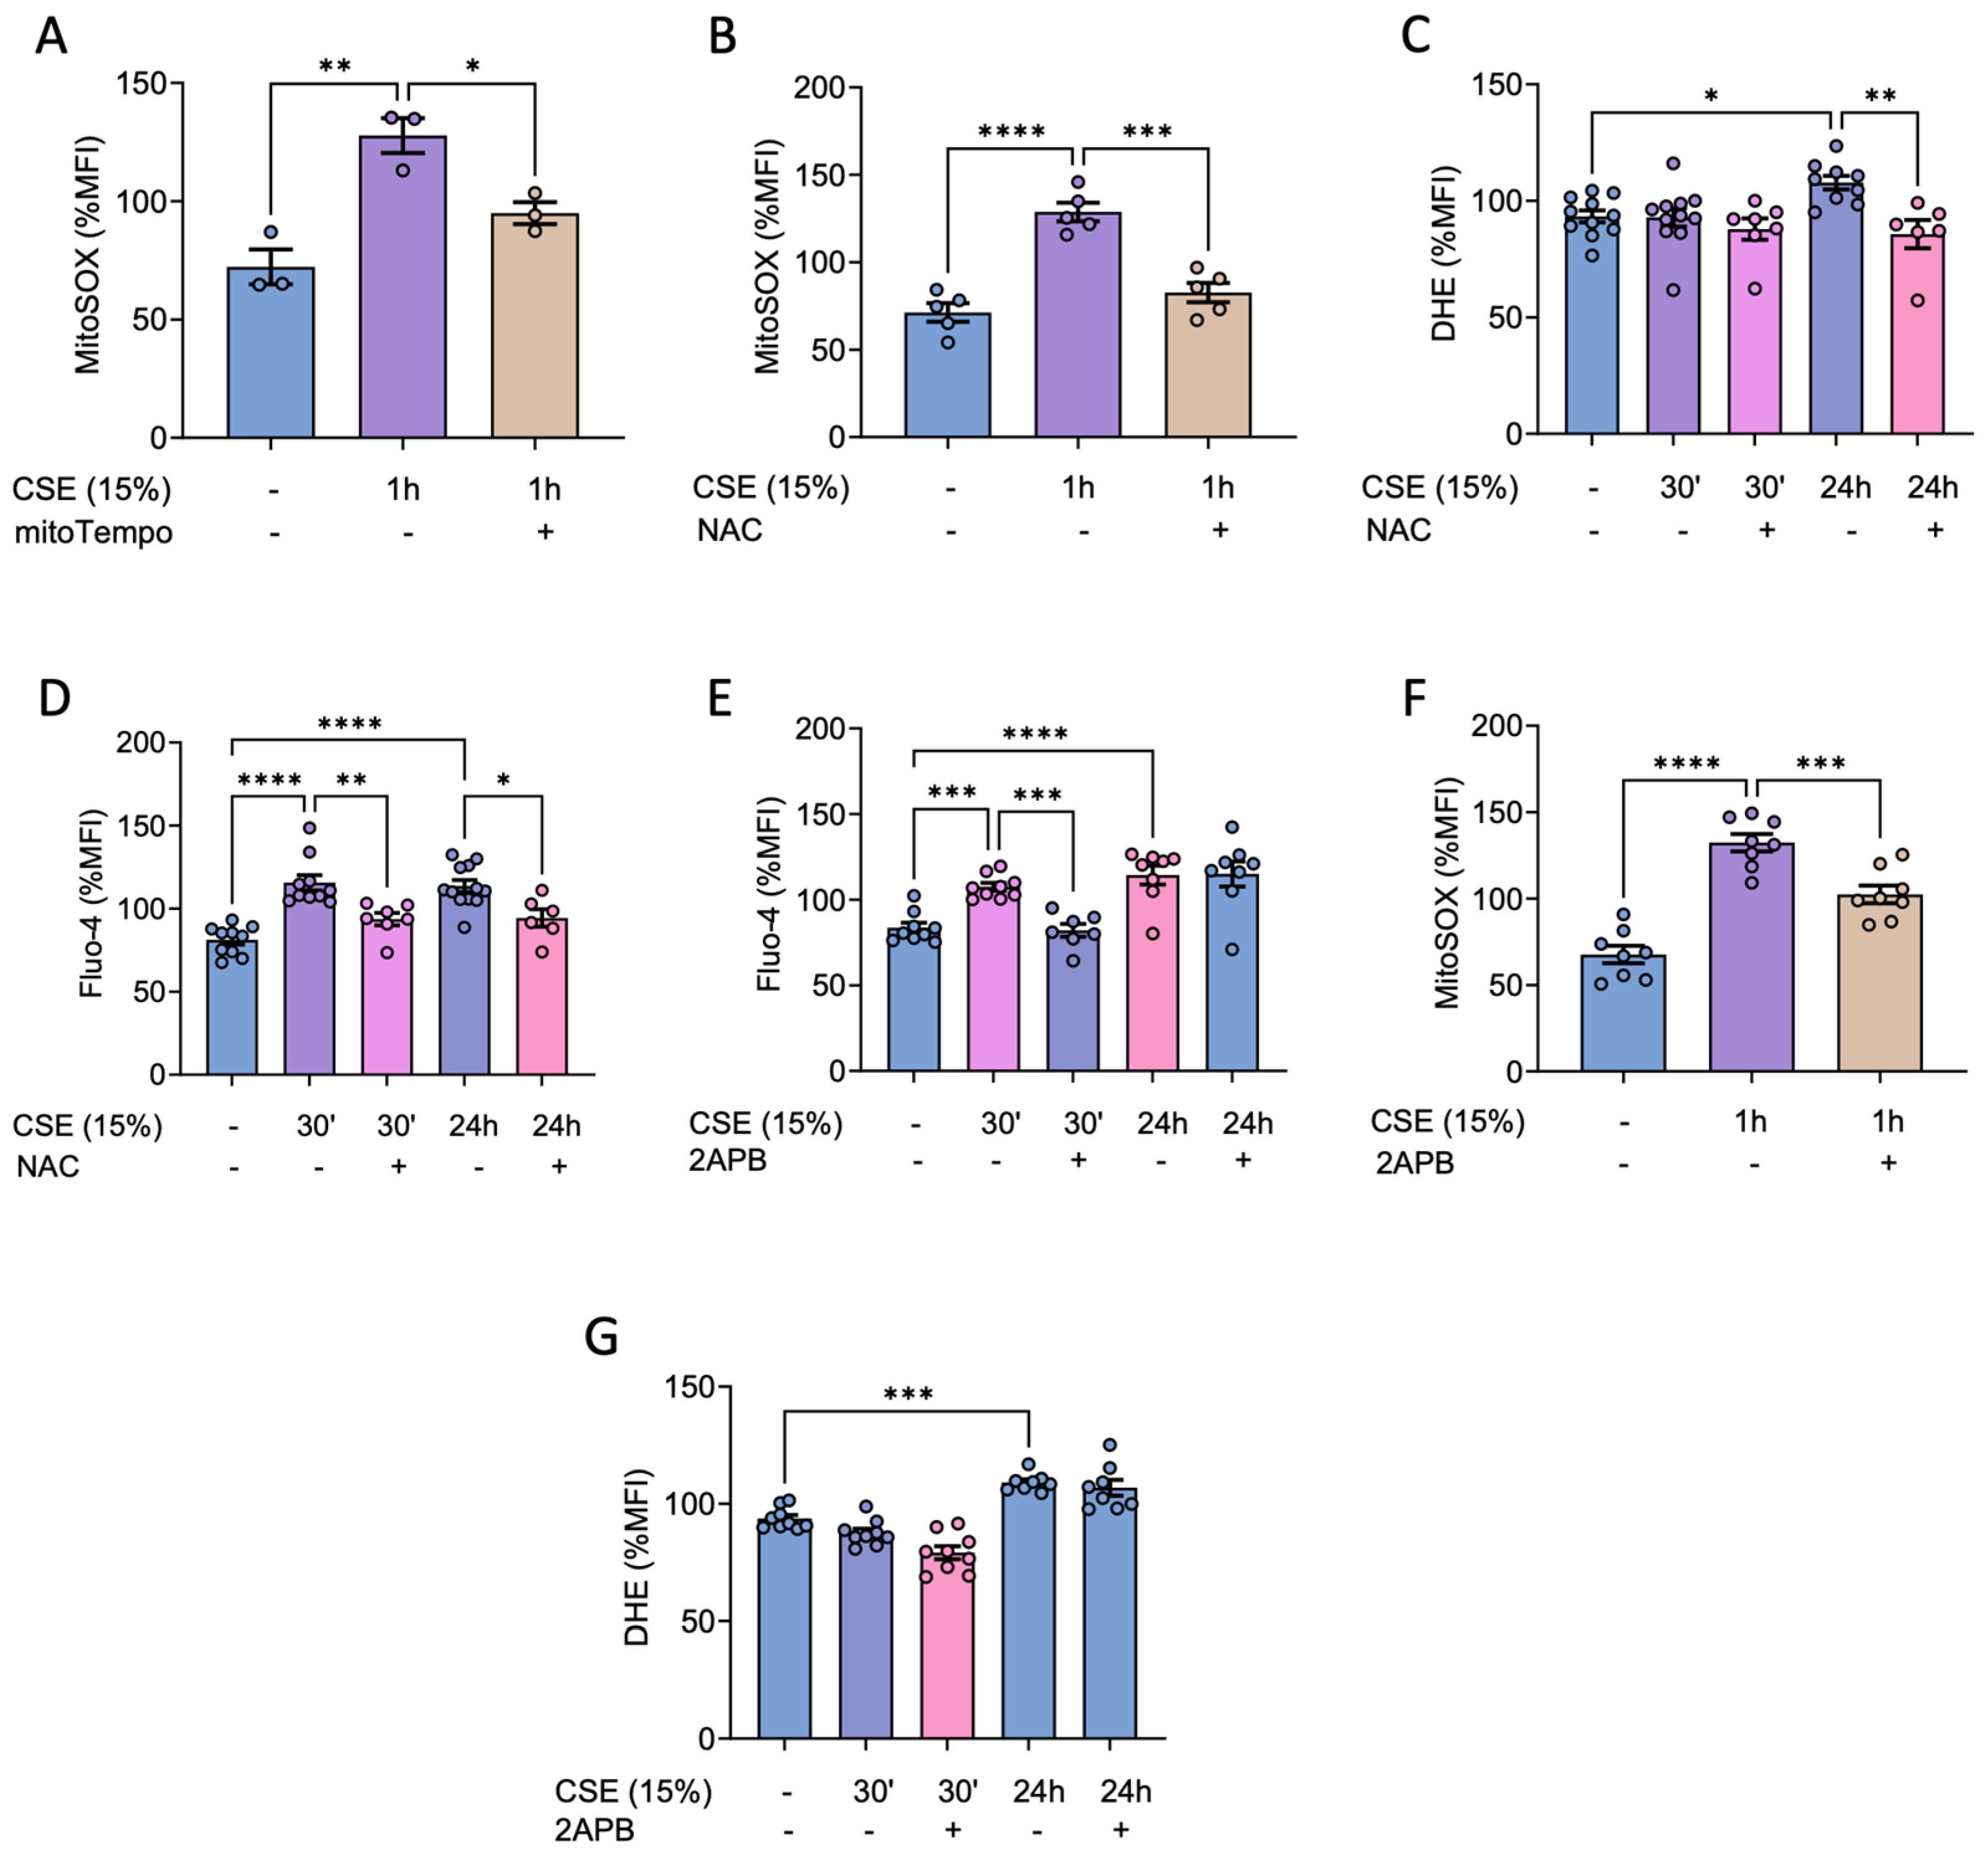
Figure 3.
Analysis of antioxidant enzymes proteins levels and lipid peroxidation in CSE-treated hBSMC. hBSMC were exposed to 15% CSE for 24 hours and SOD1, SOD2, SOD3 and catalase protein levels were analyzed by western blot (A-D). Cells were exposed to 15% CSE in the absence or the presence of 500 µM NAC or pretreated for 4 hours with 2-APB before CSE treatment. Cells were then probed with 1 µM Bodipy 581/591 C11 and lipid peroxidation data were calculated as the ratio between the oxidized (510 nm) and the non-oxidized (590 nm) form (E). Results are presented as mean ± SEM, n = 4-9. Statistical analysis between three or more groups was carried out using one-way ANOVA test followed by Sidak’s post-hoc test. Statistical analysis between two groups was carried out using a two-sided unpaired Student’s T-test. *P < 0.05, **P < 0.01, ***P < 0.005, ****P < 0.0001.
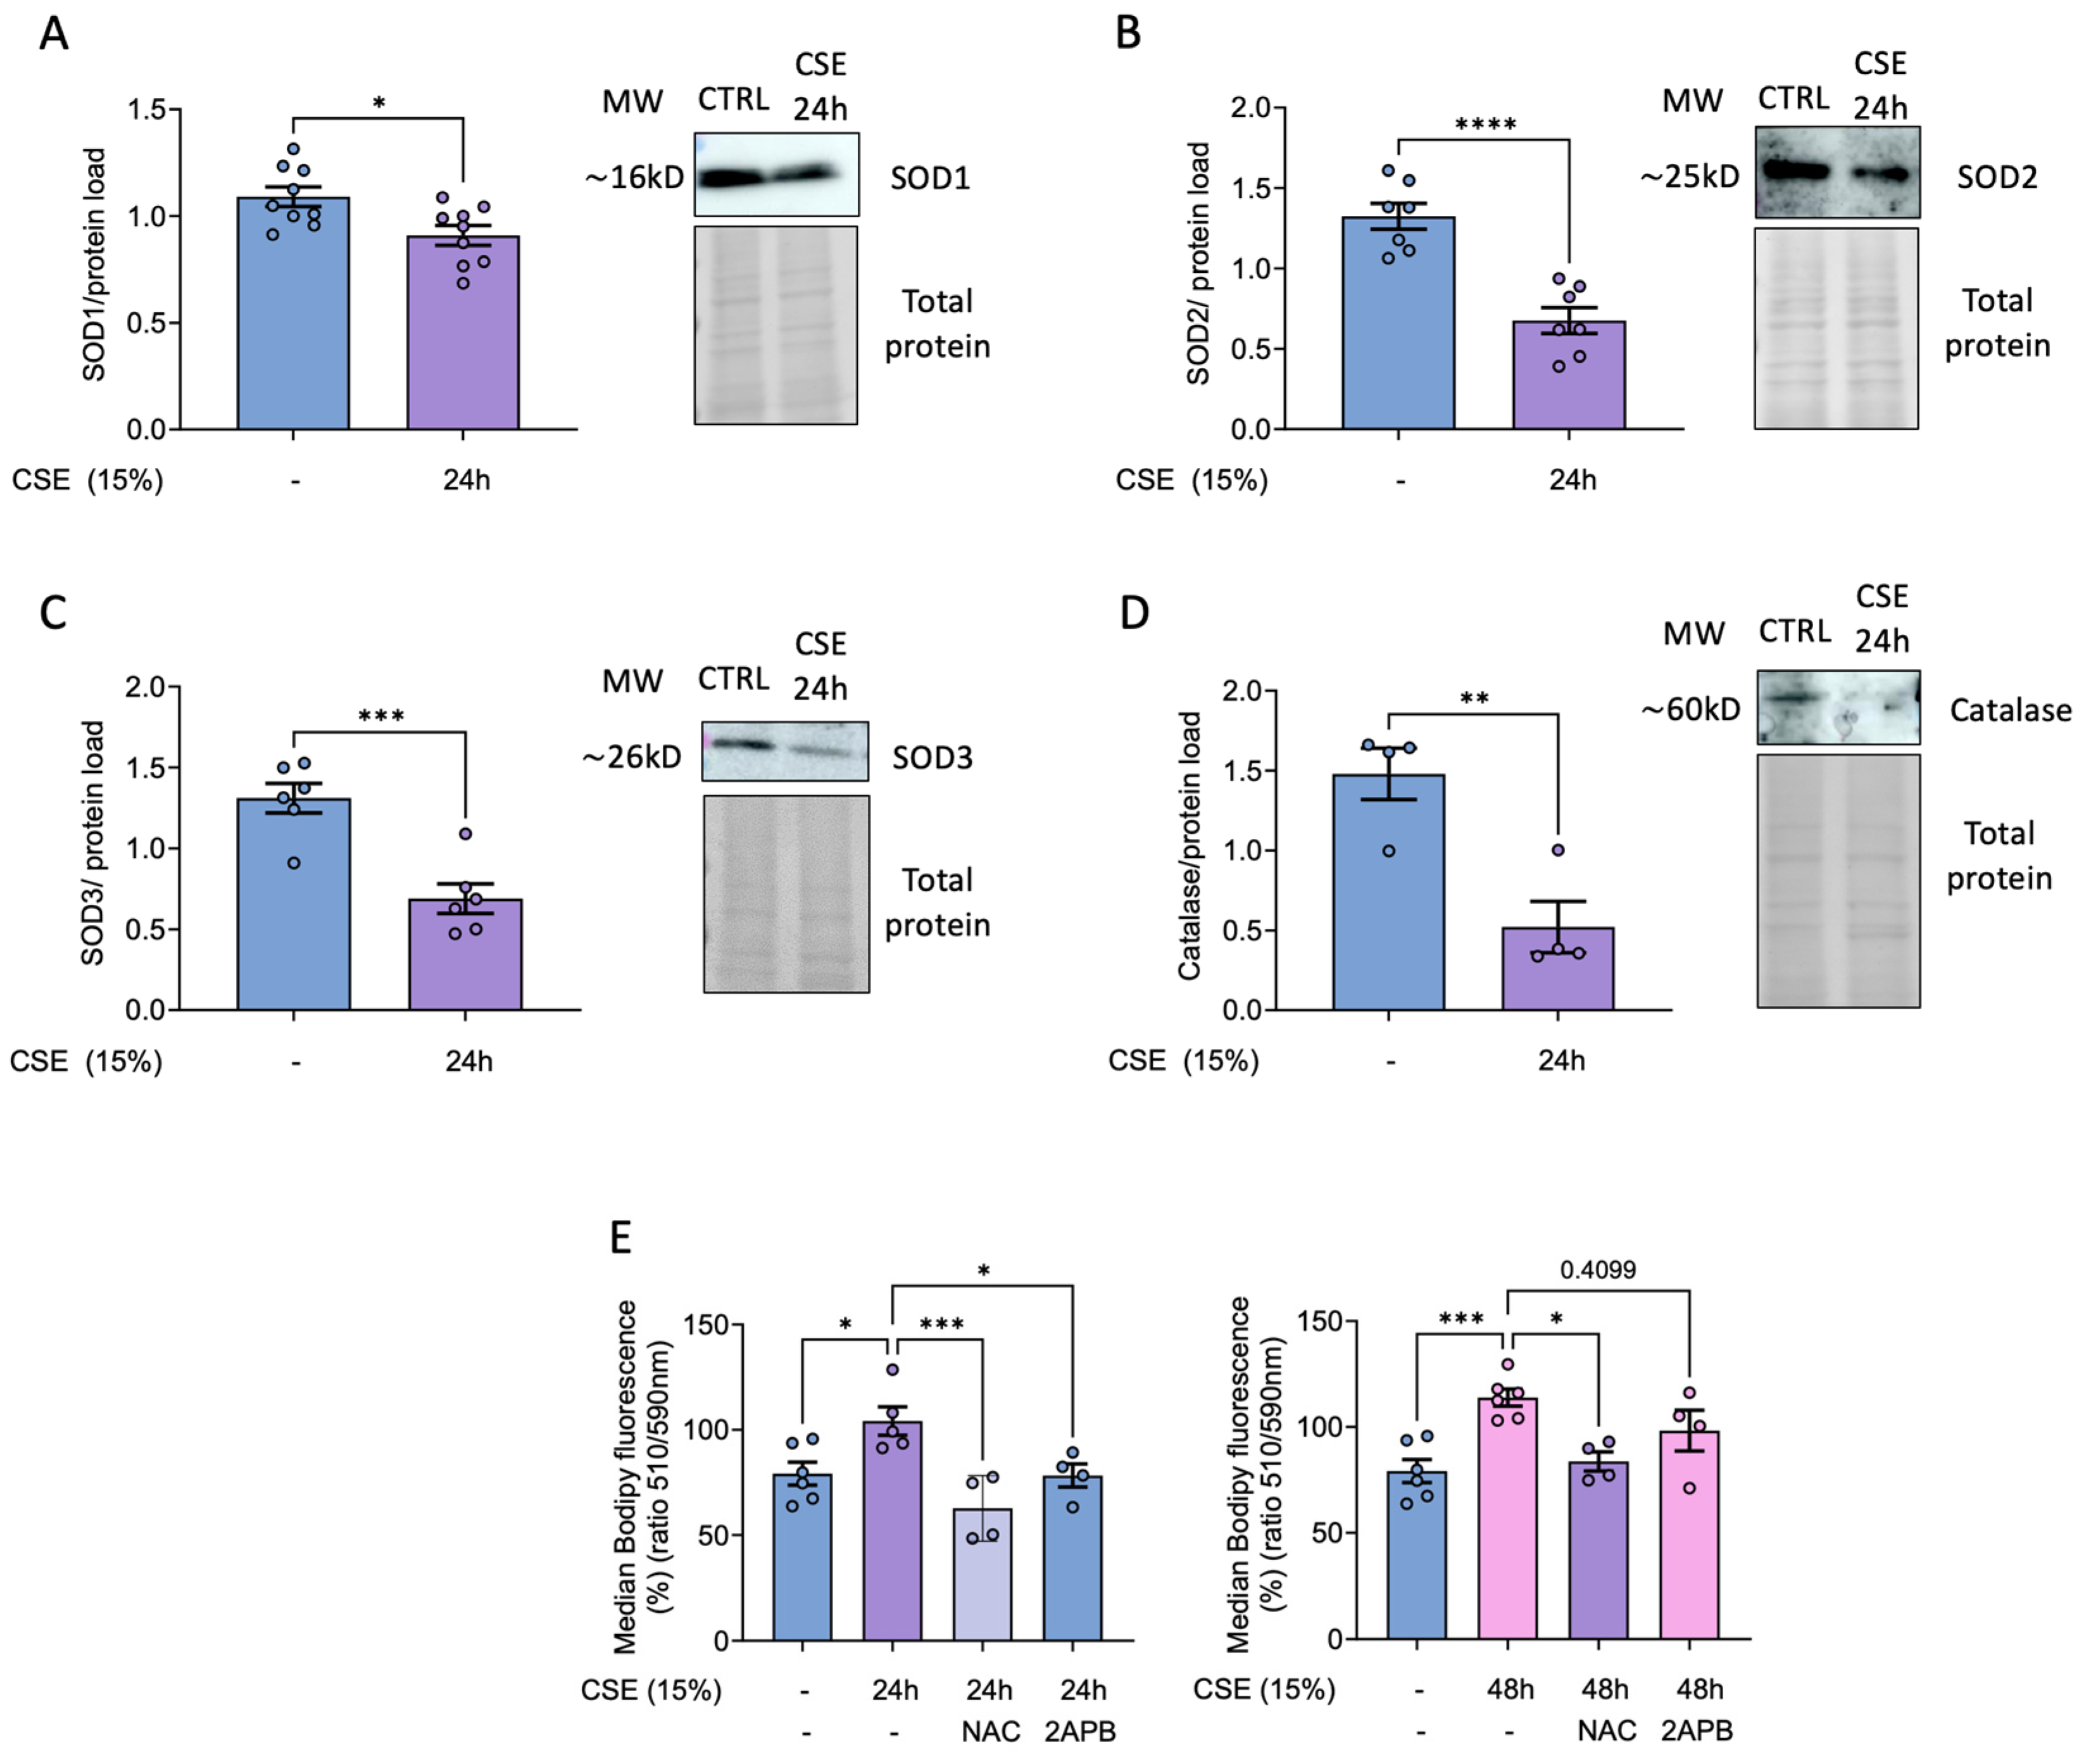
Figure 4.
Effects of CSE in cell size, proliferation and senescence of hBSMC. Cells were exposed to CSE for 48 hours and cell size was quantified in terms of the FSC-A parameter using flow cytometry (A). For proliferation assays, cells were stained with 5 µM of CFSE, and median fluorescent intensity was measured by flow cytometry right before the CSE exposure (day 0 condition) or after 72 hours in the presence or the absence of 15% CSE. Data is presented as the lost CFSE fluorescence with respect to day 0 condition and normalized to CSE untreated cells fluorescence levels (B). X-gal staining to quantify β-Galactosidase activity was analyzed by flow cytometry. Cell senescence is presented as median fold change in β-Gal MFI and normalized to the levels in non-CSE treated (-) (C). n = 3-5. Statistical analysis between two groups was carried out using a two-sided unpaired Student’s T-test. **P < 0.01 ****P < 0.001.
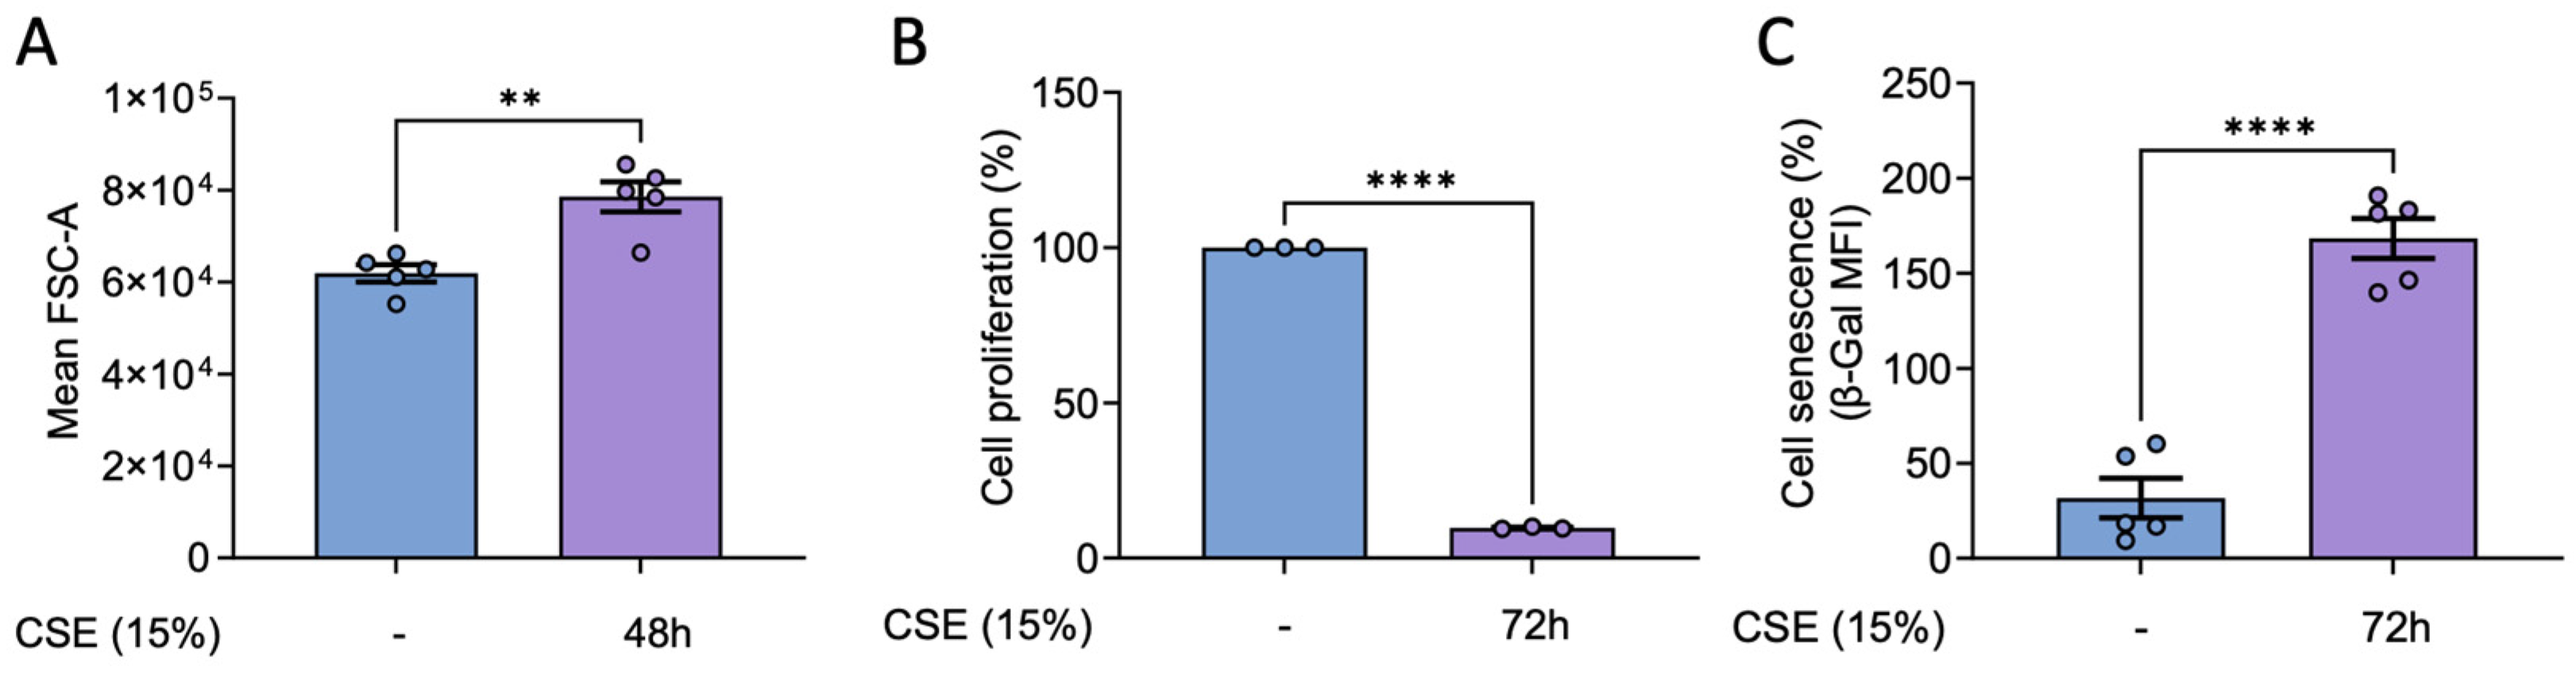
Figure 5.
Effects of CSE on representative proteins of cell cytoskeleton in hBSMC. Protein levels from hBSMC cultured in the presence of 15% CSE for different times were determined by western blot using primary antibodies for the indicated proteins (A-H). Total protein was used as loading control. Representative images and band quantifications by densitometry are shown. Protein levels are presented as mean ± SEM, n = 3-18. Statistical analysis between three or more groups was carried out using one-way ANOVA test followed by Sidak’s post-hoc test. Statistical analysis between two groups was carried out using a two-sided unpaired Student’s T-test. *P < 0.05, **P < 0.01, ***P < 0.005, ****P < 0.001.
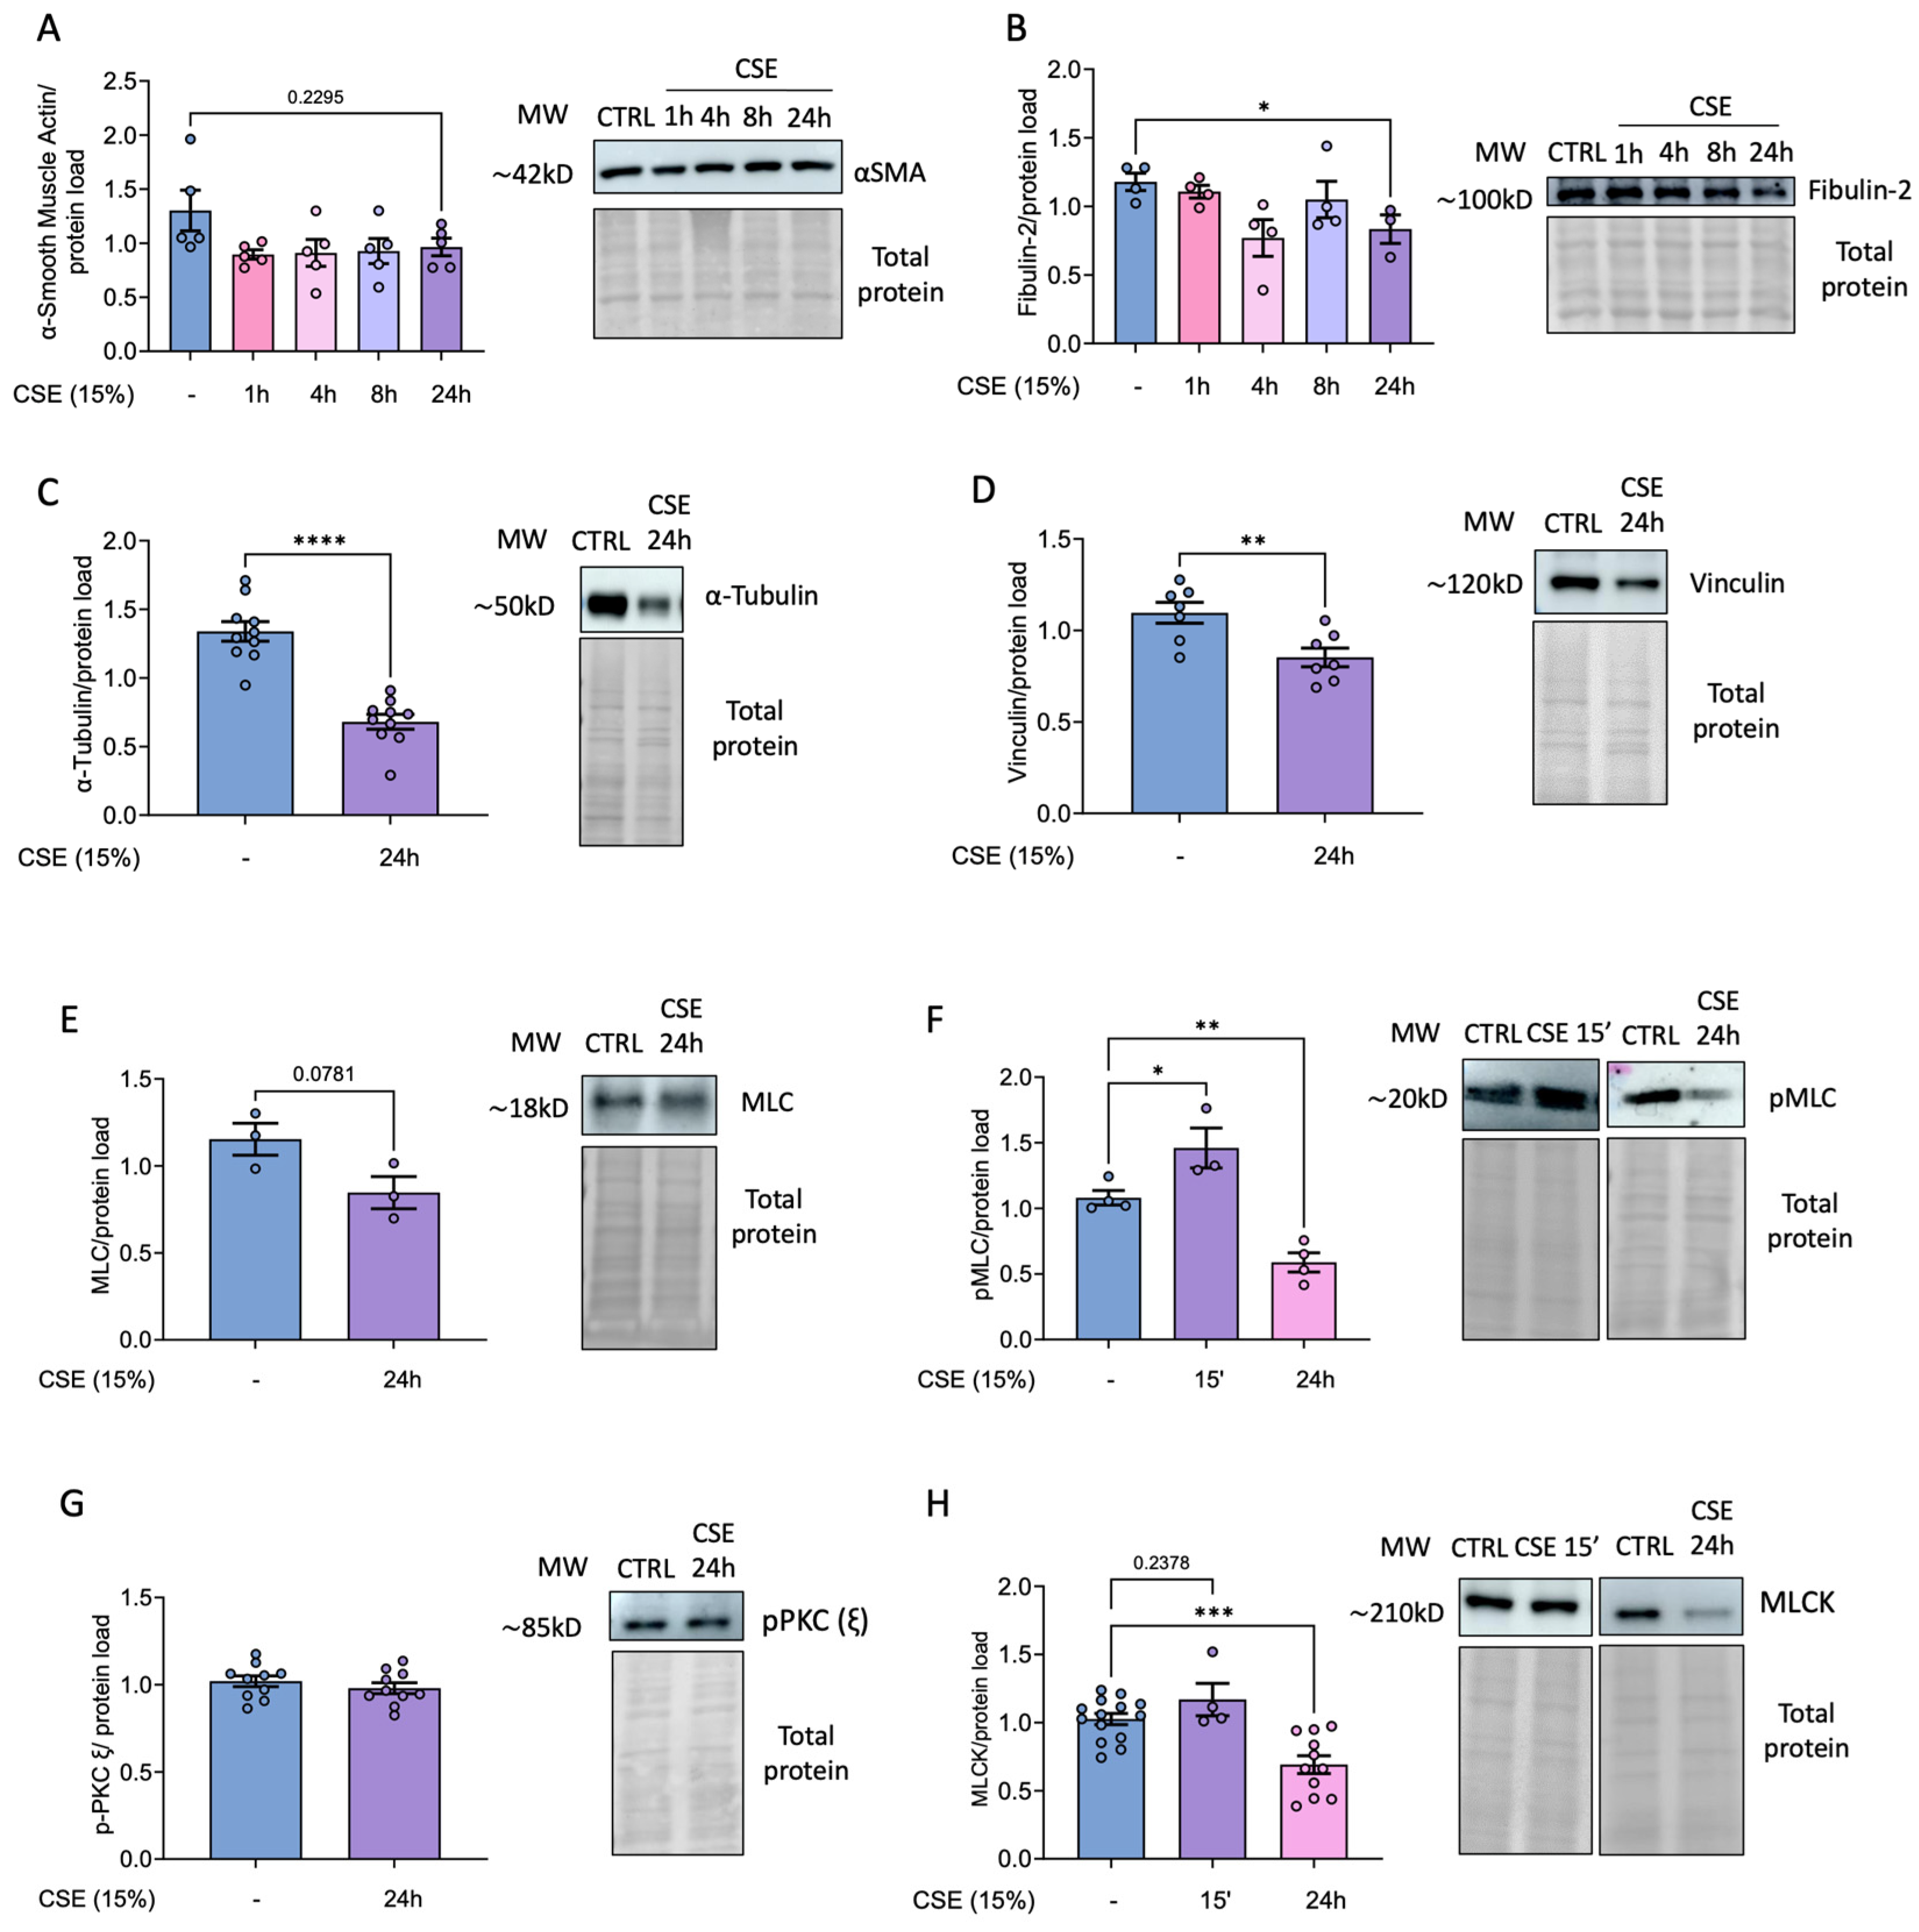
Figure 6.
Effects of CSE in cytoskeleton dynamics. hBSMC were cultured in the absence or the presence of 15% CSE for 24 hours and then stained for pMLC (green), F-actin (magenta) or vinculin (red). 8-10 different fields were analyzed and representative images from each sample were taken with a Thunder imager (Leica microsystems), n=3 (A). Phalloidin and pMLC fluorescent intensity was quantify by means of Integrated Density using Image J software (B, C). hBSMC were treated for 2 hours with 5 µM cytochalasin B and, then cultured for 1 hour without the drug (control condition) or in the presence of 15% CSE. Cells were also pre-treated with 500 µM NAC for 2 hours before adding cytochalasin B for another 2 hours. Finally, they were cultured for 1 hour in the presence of NAC and 15% CSE (D). Statistical analysis between two groups was carried out using a two-sided unpaired Student’s T-test. Statistical analysis between three or more groups was carried out using one-way ANOVA test followed by Sidak’s post-hoc test. *P < 0.05, **P < 0.01.
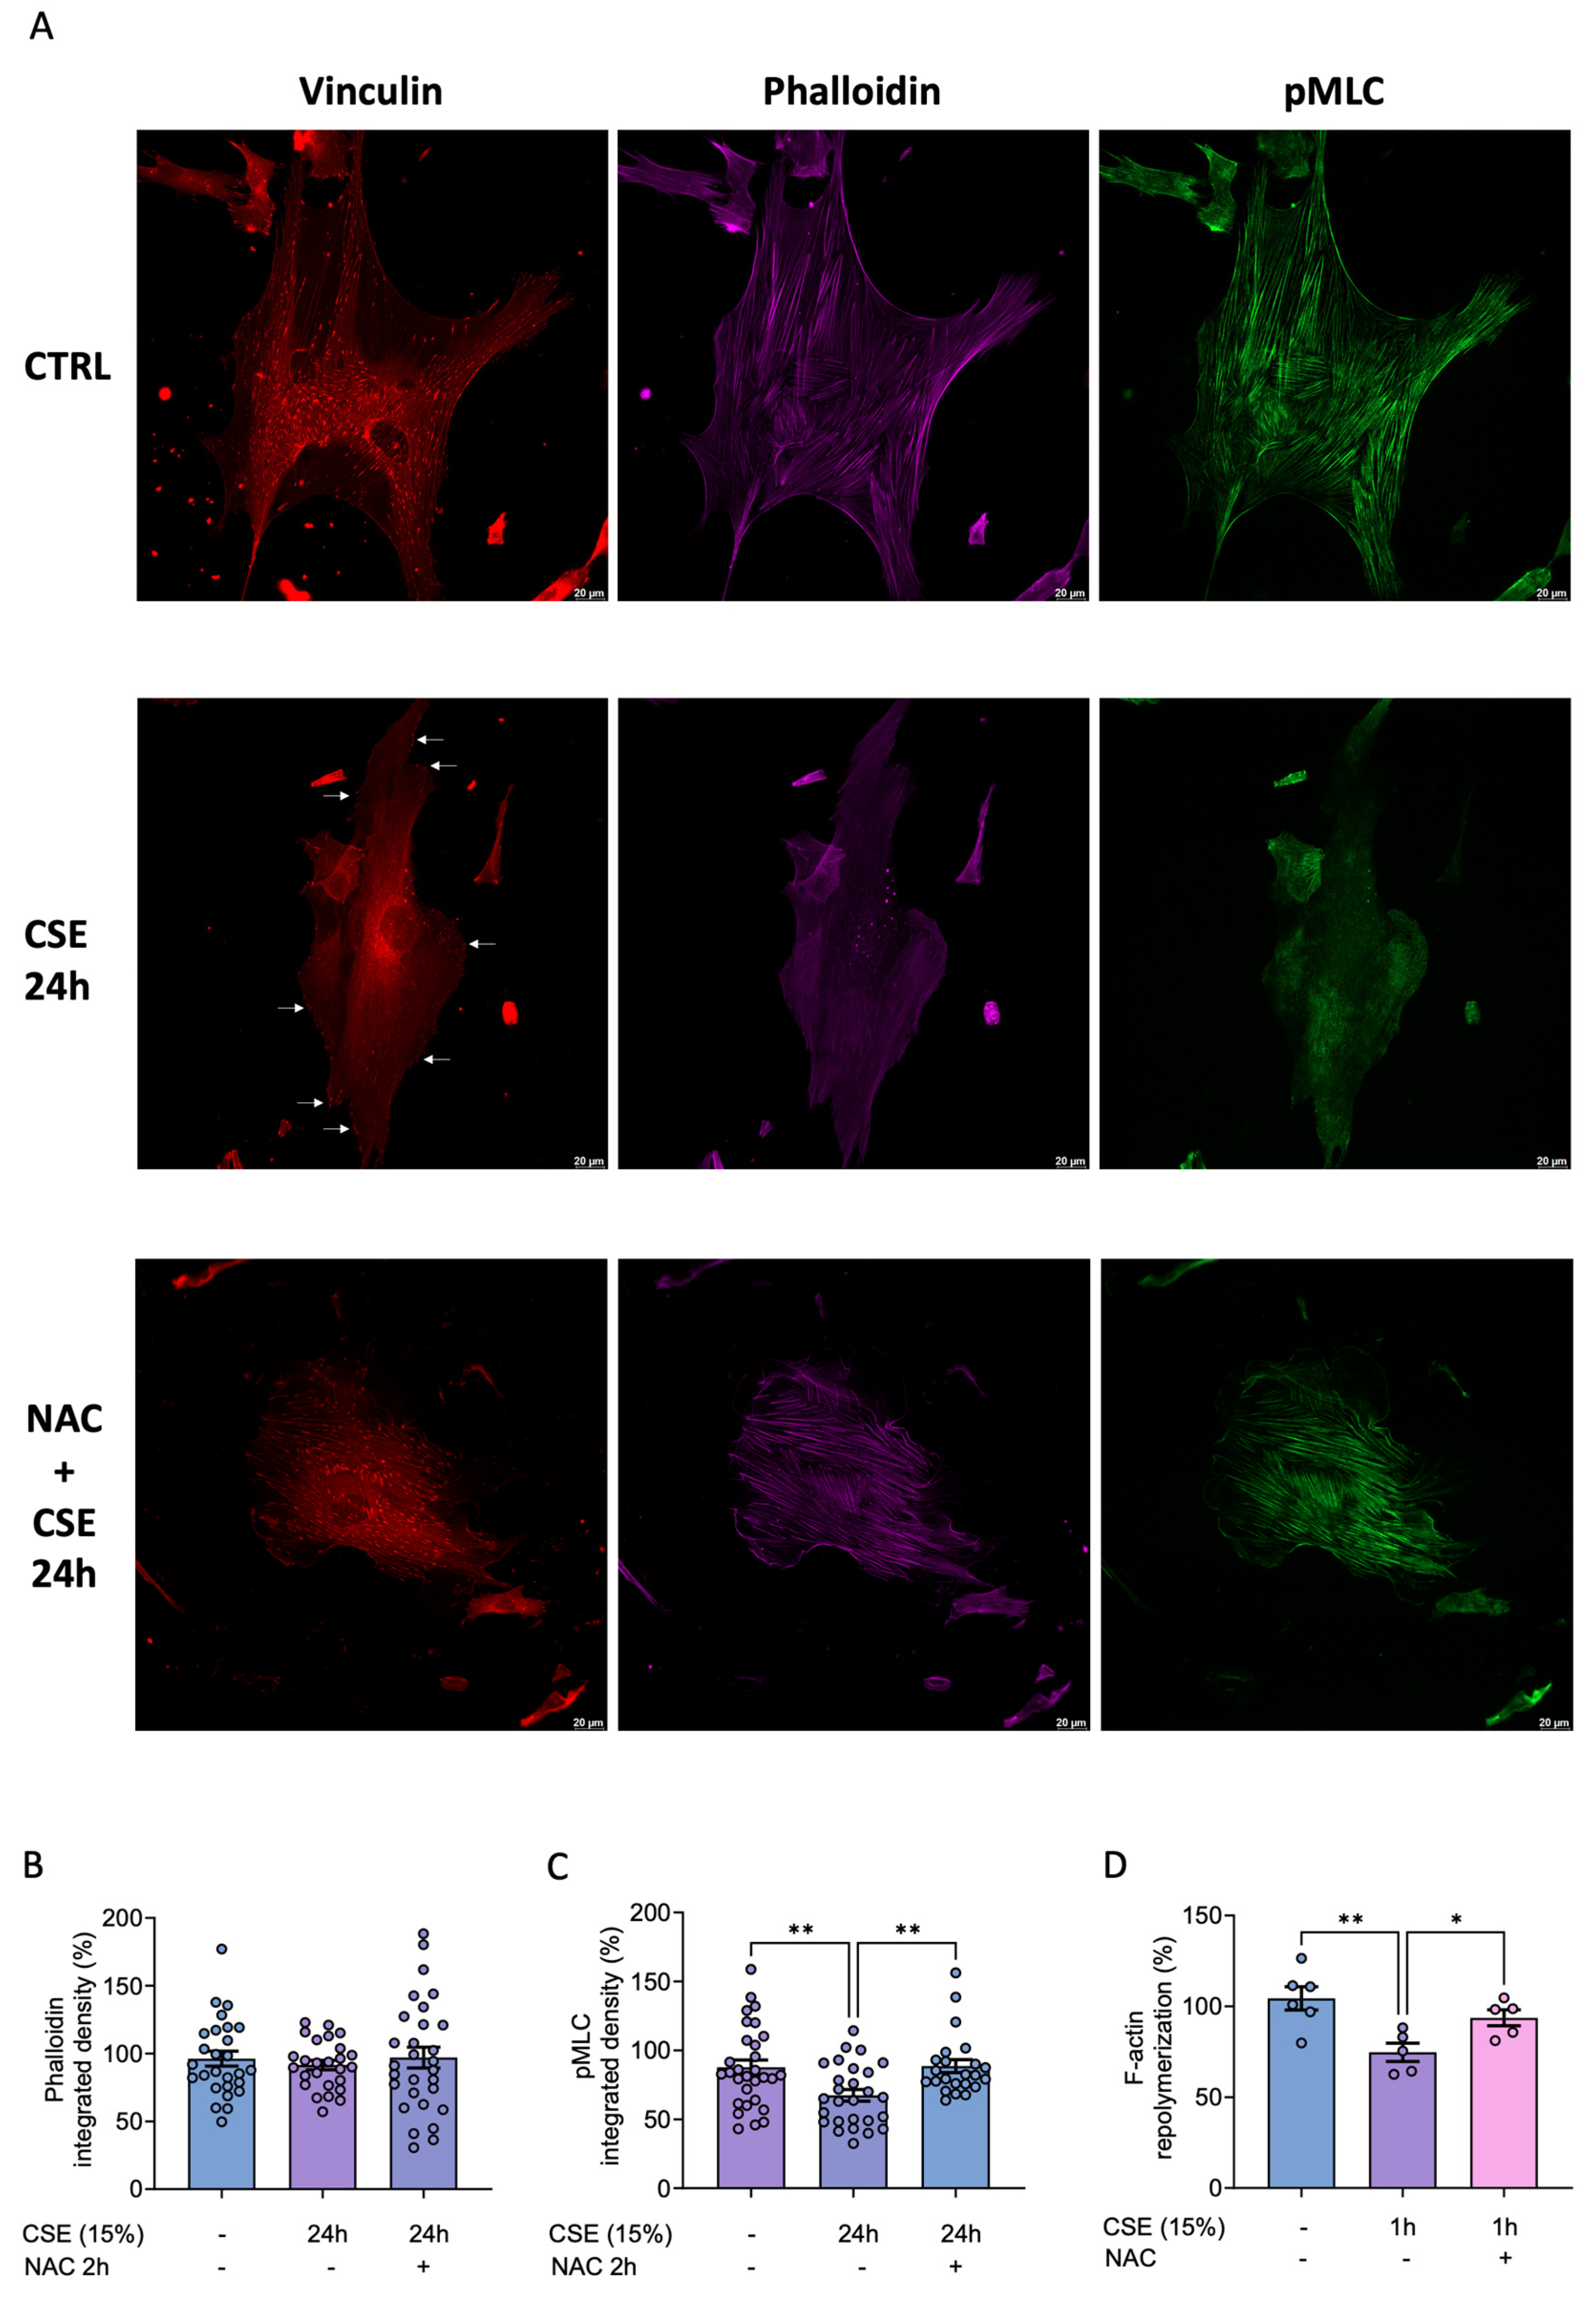
Figure 7.
Effects of CSE in bronchial reactivity. Mice bronchial rings were incubated with vehicle (Control) and 15% CSE with or without 25 nM mitoTEMPO. Contractile responses induced by 80mM KCl (A), 5-HT (B) and ACh (C) were then quantified with a wire myograph. Data are presented as mean ± SEM; n = 6-7 mice for A and B and n=4-6 mice for C. Statistical comparisons among groups were made using one-way (A) or repeated measures two-way (B and C) ANOVA test followed by Bonferroni’s post hoc test (* P < 0.05, **P < 0.01, ***P < 0.005, ****P < 0.001 vs Control; # P < 0.05 vs CSE).
Disclaimer/Publisher’s Note: The statements, opinions and data contained in all publications are solely those of the individual author(s) and contributor(s) and not of MDPI and/or the editor(s). MDPI and/or the editor(s) disclaim responsibility for any injury to people or property resulting from any ideas, methods, instructions or products referred to in the content. |
© 2025 by the authors. Licensee MDPI, Basel, Switzerland. This article is an open access article distributed under the terms and conditions of the Creative Commons Attribution (CC BY) license (http://creativecommons.org/licenses/by/4.0/).
Copyright: This open access article is published under a Creative Commons CC BY 4.0 license, which permit the free download, distribution, and reuse, provided that the author and preprint are cited in any reuse.


