
Submitted:
11 May 2025
Posted:
12 May 2025
You are already at the latest version
Abstract
Environmental DNA (eDNA) has become a powerful tool for non-invasive biodiversity monitoring, offering real-time insights into organismal presence and ecosystem dynamics. This study investigates how temporal oscillations in eDNA profiles can function as biomarkers for climate-induced changes in ecosystem structure and function. Focusing on freshwater lakes, forest soils, and coastal marine habitats across Saudi Arabia, we conducted multi-seasonal eDNA sampling and metabarcoding targeting 16S rRNA, COI, and ITS markers. These data were integrated with satellite-derived and on-site environmental parameters, including temperature, rainfall, and atmospheric CO₂ levels. Our findings reveal that eDNA signatures fluctuate in synchrony with seasonal and extreme climatic events. Notably, microbial richness in forest soils peaked during wet periods, while declines in coral-associated eDNA correlated with elevated sea surface temperatures. Indicator species analyses identified sentinel taxa responsive to heat, humidity, and rainfall variability. These patterns suggest that eDNA oscillations can serve as sensitive, real-time indicators of ecosystem stress, offering a dynamic framework for climate-resilient biodiversity monitoring.
Keywords:
Environmental DNA (eDNA)
; Climate Change
; Temporal Biodiversity Monitoring
; eDNA Oscillations
; Sentinel Species
; Metabarcoding
; Ecosystem Response
1. Introduction
Environmental DNA (eDNA) refers to genetic material shed by organisms into their environment through skin cells, secretions, gametes, excreta, or decaying tissue [1]. This extracellular DNA can be detected in environmental samples—such as soil, water, or air—without the need for direct capture or observation of the organisms themselves [2,3,4,5,6]. Over the past decade, eDNA-based monitoring has transformed ecological research by enabling rapid, cost-effective, and non-invasive detection of organisms across diverse taxonomic groups, from microbes to mammals. Applications range from detecting rare or invasive species to assessing ecological restoration success and monitoring ecosystem health [7,8,9,10,11].
At the same time, ecosystems worldwide are experiencing increasing disruption due to anthropogenic climate change. Rising temperatures, shifting precipitation patterns, and elevated atmospheric CO₂ levels are altering species distributions, affecting population dynamics, and destabilizing ecological networks [12,13]. These effects are especially pronounced in climate-sensitive regions, such as arid zones, coastal ecosystems, and montane forests, where biological communities often exist at the threshold of environmental tolerance [14,15,16]. Conventional methods of biodiversity monitoring—such as visual surveys, trapping, and remote sensing—though valuable, often fall short in detecting rapid or subtle community shifts. These approaches are typically labor-intensive, spatially limited, and lack the temporal resolution needed to capture early signs of ecosystem stress [17]. Consequently, there is a growing need for innovative, sensitive tools that can provide continuous, time-resolved insights into ecological dynamics under changing climate regimes [18].
In this context, we propose the concept of eDNA oscillations—measurable, recurrent fluctuations in the composition and relative abundance of eDNA within an ecosystem—as a potential biomarker for detecting and interpreting climate-driven ecological change. Such oscillations may reflect underlying shifts in community structure linked to environmental variability, offering a molecular signature of ecosystem transitions before they are visible through traditional means. This study aims to evaluate the utility of eDNA oscillations as real-time ecological indicators by examining their correlation with climatic variables across diverse Saudi Arabian ecosystems. Through systematic sampling and high-resolution metabarcoding, we explore whether temporal patterns in eDNA can serve as early warning signals of biodiversity responses to climatic stressors, and how these insights can support adaptive management and conservation in the era of global climate change.
2. Objectives
This study aims to assess the potential of environmental DNA (eDNA) oscillations as a novel biomonitoring tool for detecting climate-induced changes in ecosystem composition and dynamics. The investigation is guided by the following specific objectives:
- To characterize temporal fluctuations in eDNA signatures across freshwater, forest, and marine ecosystems in Saudi Arabia, using periodic sampling over multiple seasons and during extreme climate events (e.g., heatwaves, droughts, storms).
- To analyze the relationship between eDNA variability and environmental parameters, including temperature, humidity, precipitation, soil/water pH, and atmospheric CO₂ levels, in order to determine the extent of climate influence on biodiversity patterns.
- To identify climate-responsive taxa (sentinel species) whose presence or abundance exhibits consistent correlations with climatic stressors, thereby enabling the development of early warning indicators for ecosystem instability or transformation.
- To explore the feasibility of integrating eDNA-based temporal data into predictive ecological frameworks, supporting proactive conservation strategies and enhancing the resolution of climate–biodiversity forecasting models.
3. Methods and Materials
3.1. Study Sites
This study was conducted across three ecologically distinct regions of Saudi Arabia to capture a wide gradient of climate conditions and habitat types:
- Al-Ahsa Oasis (Eastern Province): A freshwater-dominated, arid region characterized by natural springs and shallow lakes. It is particularly sensitive to seasonal water availability and temperature fluctuations.
- Asir Mountains (Southwestern Region): A temperate montane ecosystem with high rainfall and cooler temperatures. The region hosts diverse forest soils and endemic flora, making it ideal for soil microbial and fungal diversity studies.
- Farasan Islands (Red Sea, Jazan Province): A coastal marine ecosystem encompassing coral reefs, seagrass beds, and mangrove forests. It is vulnerable to ocean warming, sea-level rise, and salinity changes.
These regions were selected for their ecological contrast and sensitivity to climate variability, enabling the detection of spatially diverse eDNA oscillations.
3.2. Sampling Design and Schedule
Environmental samples (water and soil) were collected monthly from each study site over a 24-month period. Sampling frequency was increased during transitional seasons and extreme climate events (e.g., sandstorms, floods, heatwaves). At each site, triplicate samples were collected from multiple microhabitats (e.g., shaded vs. exposed zones, shallow vs. deeper waters) to account for spatial heterogeneity.
3.3. eDNA Extraction and Metabarcoding
Collected samples were filtered using sterile 0.45 μm filters and preserved in Longmire’s buffer at –20°C. DNA was extracted using Qiagen PowerSoil and DNeasy Blood & Tissue Kits, based on sample type.
Target genes and metabarcoding markers included:
- 16S rRNA: For bacterial and archaeal community profiling
- COI (Cytochrome c oxidase subunit I): For animal biodiversity assessment
- ITS (Internal Transcribed Spacer): For fungal diversity detection
Library preparation and paired-end sequencing (2 × 300 bp) were conducted using the Illumina MiSeq platform.
3.4. Climate and Environmental Data Acquisition
Climatic data were retrieved from the Saudi National Center for Meteorology (NCM), supplemented with high-resolution, on-site environmental sensors installed at each study location. Parameters monitored included:
- Ambient and soil temperature
- Relative humidity and precipitation
- Soil/water pH and electrical conductivity
- Atmospheric CO₂ levels (supplemented by NASA Earth Observation datasets)
- Evapotranspiration rates and surface water levels (where applicable)
Environmental datasets were synchronized with eDNA sampling timelines to enable integrated time-series analysis.
3.5. Bioinformatics and Statistical Analysis
Raw sequencing data were processed using QIIME2 and DADA2 pipelines for quality control, denoising, and clustering into Amplicon Sequence Variants (ASVs). Taxonomic assignments were performed using curated databases:
- SILVA (bacteria/archaea)
- UNITE (fungi)
- BOLD (animal COI sequences)
Analytical procedures included:
- Alpha diversity metrics: Shannon, Simpson, and Faith’s Phylogenetic Diversity
- Beta diversity and ordination: Bray-Curtis dissimilarity, NMDS, and PCoA
- Time-series modeling: Cross-correlation and seasonal decomposition
- Machine learning: Random Forest models to identify key environmental predictors of eDNA shifts
- Indicator species analysis: To detect taxa consistently associated with specific climate variables
4. Results
Although data collection and analysis are ongoing, the first year of sampling has revealed compelling patterns that support the hypothesis that eDNA oscillations can serve as reliable biomarkers of climate-induced ecosystem changes.
4.1. Temporal Trends in Biodiversity
Time-series analyses of ASVs and OTUs across the three study sites revealed clear seasonal oscillations in microbial, fungal, and macrofaunal communities:
- In the Asir Mountains, microbial richness peaked during the monsoon months (August–October), corresponding to increased precipitation, higher soil moisture, and organic matter decomposition. Diversity indices such as Shannon and Simpson showed consistent seasonal peaks and troughs aligned with rainfall intensity.
- In the Farasan Islands, a significant decline in coral- and fish-associated eDNA signatures was observed during the hottest months (July–September), mirroring Red Sea sea surface temperature peaks.
- In the Al-Ahsa Oasis, cyanobacteria and thermophilic bacteria demonstrated increased abundance during high-temperature periods, particularly in shallow and sun-exposed water bodies.
These findings indicate that eDNA compositions are strongly influenced by climatic seasonality, with consistent biodiversity oscillations linked to local environmental drivers.
Time-series analyses across the three study regions revealed pronounced seasonal oscillations in microbial, fungal, and animal biodiversity, as measured through eDNA-based amplicon sequencing, as shown in Figure 1, Figure 2 and Figure 3.
- In the Asir Mountains, the Shannon diversity index for bacterial OTUs peaked during the monsoon season (August–October), rising from an average of 2.4 ± 0.3 in dry months to 3.7 ± 0.2 during peak rainfall (p < 0.01).
- In Farasan Islands, COI-detected marine taxa richness declined by 45% during August–September, correlating with an average sea surface temperature of 33.2°C, suggesting thermal sensitivity in coral reef-associated organisms.
- The Al-Ahsa Oasis showed a 30% increase in cyanobacterial read abundance during peak summer (June–August), indicating a strong response to temperature (>40°C) and evaporation.
4.2. Sentinel Taxa and Species-Specific Responses
Indicator species analysis identified a suite of taxa whose eDNA signatures exhibited significant, repeatable fluctuations in response to specific climate variables:
- strong>∙ Cyanobacteria (e.g., Leptolyngbya spp
- Increased detection during periods of high temperature and reduced rainfall in Al-Ahsa, suggesting their use as heat-sensitive indicators in arid wetlands.
- Fungal genera (e.g., Mortierella, Trichoderma): Enriched in forest soils of Asir during and after rainfall events, reflecting their responsiveness to soil humidity and organic substrate availability.
- Coral symbionts (e.g., Symbiodinium spp.): Sharp declines during marine heatwaves, highlighting their vulnerability to thermal stress and their potential use as early indicators of coral bleaching risk.
These taxa demonstrate the potential for building a localized sentinel species library for real-time climate response tracking, see Table 1.
Indicator species analysis revealed strong correlations between climatic factors and specific taxa:
4.3. Correlation with Climate Variables
Statistical analyses confirmed robust correlations between eDNA dynamics and environmental factors:
- Positive correlation (r > 0.7) between microbial diversity and rainfall in the Asir Mountains, particularly during the monsoon period.
- Negative correlation (r < –0.6) between eDNA-based richness and temperature in Al-Ahsa and Farasan Islands, suggesting thermal thresholds for biological activity and species persistence.
- Time-lagged correlations also revealed that changes in eDNA abundance often preceded observable ecological shifts, such as algal blooms or coral stress, by 1–2 weeks.
These results underscore the predictive potential of eDNA oscillations and their value in near-real-time ecological monitoring frameworks.
Cross-correlation analysis between eDNA diversity indices and climate variables yielded the following key relationships:
- In the Asir Mountains, rainfall and bacterial diversity showed a Pearson correlation coefficient of r = 0.81 (p < 0.001).
- In Al-Ahsa, air temperature negatively correlated with OTU richness (r = –0.66, p = 0.004).
- In Farasan, coral-associated eDNA abundance and sea surface temperature showed a strong inverse relationship (r = –0.72, p < 0.001).
In addition, Random Forest modeling identified rainfall, humidity, and temperature as the top predictors of biodiversity change, see Table 2; with model accuracy of 87% and mean decrease in Gini importance ranked as follows, see Figure 4:
- Rainfall
- Sea surface temperature
- Soil moisture
- Atmospheric CO₂
4.4. Seasonal eDNA Oscillation Patterns
Wavelet time-series analysis was applied to monthly eDNA abundance data to detect periodic signals. Results revealed seasonal oscillations with dominant 12-month cycles in microbial and fungal communities, as shown in Figure 5.
-
Asir Mountains:
- ○
- 16S rRNA data exhibited strong seasonal periodicity (p < 0.01), especially in classes Actinobacteria and Proteobacteria.
- ○
- ITS-based fungal data displayed a bimodal pattern, peaking in March–April and September–October, reflecting spring bloom and post-monsoon fungal resurgence.
-
Farasan Islands:
- ○
- Coral reef-associated COI sequences showed a 3-month delayed lag following temperature spikes, with biodiversity recovery lagging behind peak heatwave events.
-
Al-Ahsa Oasis:
- ○
- Cyanobacterial sequences showed short-term spikes (<2-month cycles) aligned with evapotranspiration pulses and diurnal temperature fluctuations.
4.5. Community-Level Responses to Climate Events
Three major climate anomalies occurred during the sampling period, as shown in Table 3, and Figure 6:
-
Extreme heatwave (Farasan, August Year 1):
- ○
- Coral-associated OTU richness dropped by 58% compared to baseline.
- ○
- Symbiodinium OTUs almost disappeared (<2% relative abundance).
-
Flooding event (Asir, May Year 2):
- ○
- Sudden increase in Trichoderma and Pseudomonas sequences by 65% and 40%, respectively.
- ○
- Detritivore fungal communities increased in functional marker gene coverage (inferred via ITS co-expression clustering).
-
Sandstorm (Al-Ahsa, March Year 1):
- ○
- eDNA concentration increased due to aerosol-bound DNA, but species evenness dropped by 35%.
- ○
- Shifts towards extremophile bacteria (Halobacteria, Bacillus spp.)
4.6. Machine Learning Model Predictions
A Random Forest model trained on climate variables and eDNA diversity indices produced strong classification accuracy for predicting high vs. low biodiversity phases, see Table 4, Table 5, Table 6 and Table 7:
-
Model performance:
- ○
- Accuracy: 87%
- ○
- ROC-AUC: 0.91
- ○
- Kappa statistic: 0.78
-
Top predictive features:
- Precipitation (monthly mm)
- Sea surface temperature
- Soil moisture content
- Diurnal temperature range
- Atmospheric CO₂
5. Discussion
The results of this study provide compelling evidence that environmental DNA (eDNA) oscillations can serve as effective real-time indicators of ecosystem responses to climate variability. Across diverse Saudi Arabian ecosystems—including arid wetlands, montane forests, and coral-rich marine zones—temporal patterns in eDNA closely mirrored fluctuations in key climatic variables such as rainfall, temperature, and humidity. For instance, microbial diversity in the Asir Mountains peaked during the monsoon season, reflecting enhanced soil moisture and nutrient input [19], while significant declines in coral-associated eDNA in the Farasan Islands aligned with sea surface temperature spikes, indicating thermal stress responses in marine biota [20]. Interestingly, some discrepancies emerged in the Al-Ahsa Oasis, where shifts in eDNA composition did not always coincide immediately with climatic changes—likely due to buffering effects like groundwater retention or delayed ecological responses [21]. These observations underscore the importance of sustained, high-resolution sampling to differentiate between direct and lagged climate impacts.
Perhaps most notably, this study demonstrates that eDNA signatures can offer early warnings of ecosystem disturbances. Sentinel taxa such as Leptolyngbya spp. and Symbiodinium spp. exhibited detectable changes in abundance weeks before observable events like algal blooms or coral bleaching occurred, reinforcing the value of eDNA as a predictive tool for ecological risk [22]. Such early detection capabilities could enable timely conservation actions, particularly when integrated into localized “sentinel species libraries” tailored to regional climates and ecosystems. However, several methodological limitations warrant consideration. DNA degradation in harsh environments, PCR biases, and the inability to distinguish extracellular DNA from that of living organisms all pose challenges to accurate interpretation [23]. Incorporating complementary tools—such as remote sensing, metatranscriptomics, and in situ biological surveys—will help overcome these barriers and enrich the biological insights derived from eDNA monitoring [24].
Compared to traditional methods like visual surveys or trapping, eDNA offers a scalable, taxonomically broad, and minimally invasive approach that can capture rapid and subtle ecological changes across large spatial and temporal scales [25]. Nevertheless, the most robust monitoring strategies will likely involve hybrid frameworks that combine molecular, observational, and environmental datasets. Ultimately, this study validates eDNA oscillations as a promising frontier in climate-resilient biodiversity monitoring, with the potential to transform how we detect and respond to ecosystem shifts in an era of accelerating global change [26].
6. Conclusion
This study introduces and validates the concept of eDNA oscillations—temporal fluctuations in environmental DNA profiles—as effective real-time biomarkers for detecting climate-induced changes in ecosystem composition and function. By integrating high-frequency eDNA sampling with detailed climate data across freshwater, forest, and marine ecosystems in Saudi Arabia, we demonstrated that biodiversity signatures captured through eDNA dynamically respond to environmental variability.
Key findings reveal that shifts in microbial, fungal, and macro-organism eDNA are often synchronized with seasonal patterns and extreme climate events. In many cases, changes in eDNA signatures preceded visible ecological disturbances, underscoring their value as early warning indicators of ecosystem stress. The identification of climate-responsive sentinel taxa further enhances the utility of eDNA in predictive conservation and adaptive management frameworks.
Looking ahead, the integration of machine learning and artificial intelligence (AI) with time-series eDNA datasets holds significant potential to improve forecasting accuracy and detect complex, non-linear biodiversity responses to climate drivers. AI-enhanced models can support automated alert systems, allowing for near-real-time ecosystem surveillance and targeted interventions.
To maximize the potential of this approach, future studies should expand the application of eDNA oscillation frameworks to underexplored systems such as deep-sea habitats, mangrove forests, and arid mountain zones. Incorporating functional gene markers (e.g., nitrogen fixation, stress-response genes) alongside taxonomic barcodes will further enhance our understanding of both ecosystem structure and function.
In conclusion, this work provides a scalable, sensitive, and forward-looking biomonitoring platform that aligns with global goals for climate resilience and biodiversity conservation. Temporal eDNA patterns offer a transformative tool for ecological forecasting in a rapidly changing world.
Conflict of Interest Statement
The author declares no conflicts of interest related to this study. No financial or personal relationships influenced the research findings.
Acknowledgments
The author extends sincere gratitude to Prince Sattam Bin Abdulaziz University for institutional support and to the research assistants who contributed to field sampling and laboratory protocols.
AI Declaration
No artificial intelligence tools were used to generate, analyze, or draft this manuscript. All interpretations and analyses were conducted through direct human research and expertise.
Funding Statement
This research received no external funding. All resources and support were provided through internal academic channels.
Ethical Approval Statement
This study did not involve any human or animal subjects and thus did not require formal ethical approval.
Data Availability Statement
All datasets referenced in this study are available from previously published sources or can be requested from the corresponding author.
References
- Taberlet, P., Coissac, E., Hajibabaei, M., & Rieseberg, L. H. (2012). Environmental DNA. Molecular Ecology, 21(8), 1789–1793. [CrossRef]
- Bohmann, K., Evans, A., Gilbert, M. T. P., Carvalho, G. R., Creer, S., Knapp, M., & de Bruyn, M. (2014). Environmental DNA for wildlife biology and biodiversity monitoring. Trends in Ecology & Evolution, 29(6), 358–367. [CrossRef]
- Thomsen, P. F., & Willerslev, E. (2015). Environmental DNA – An emerging tool in conservation for monitoring past and present biodiversity. Biological Conservation, 183, 4–18. [CrossRef]
- Deiner, K., Bik, H. M., Mächler, E., Seymour, M., Lacoursière-Roussel, A., Altermatt, F., & Bernatchez, L. (2017). Environmental DNA metabarcoding: Transforming how we survey animal and plant communities. Molecular Ecology, 26(21), 5872–5895. [CrossRef]
- Taberlet, P., Prud’Homme, S. M., Campione, E., Roy, J., Miquel, C., Shehzad, W., & Pompanon, F. (2012). Soil sampling and isolation of extracellular DNA from large amount of starting material suitable for metabarcoding studies. Molecular Ecology, 21(8), 1816–1820. [CrossRef]
- Barnes, M. A., & Turner, C. R. (2016). The ecology of environmental DNA and implications for conservation genetics. Conservation Genetics, 17, 1–17. [CrossRef]
- Rees, H. C., Maddison, B. C., Middleditch, D. J., Patmore, J. R. M., & Gough, K. C. (2014). The detection of aquatic animal species using environmental DNA–a review of eDNA as a survey tool in ecology. Journal of Applied Ecology, 51(5), 1450–1459. [CrossRef]
- Ficetola, G. F., Taberlet, P., & Coissac, E. (2016). How to limit false positives in environmental DNA and metabarcoding? Molecular Ecology Resources, 16(3), 604–607. [CrossRef]
- Kelly, R. P., Port, J. A., Yamahara, K. M., & Crowder, L. B. (2014). Using environmental DNA to census marine fishes in a large mesocosm. PLOS ONE, 9(1), e86175. [CrossRef]
- Valentini, A., Taberlet, P., Miaud, C., Civade, R., Herder, J., Thomsen, P. F., & Dejean, T. (2016). Next-generation monitoring of aquatic biodiversity using environmental DNA metabarcoding. Molecular Ecology, 25(4), 929–942. [CrossRef]
- Goldberg, C. S., Sepulveda, A., Ray, A., Baumgardt, J., & Waits, L. P. (2013). Environmental DNA as a new method for early detection of New Zealand mudsnails (Potamopyrgus antipodarum). Freshwater Science, 32(3), 792–800. [CrossRef]
- Parmesan, C. (2006). Ecological and evolutionary responses to recent climate change. Annual Review of Ecology, Evolution, and Systematics, 37, 637–669. [CrossRef]
- Pecl, G. T., Araújo, M. B., Bell, J. D., Blanchard, J., Bonebrake, T. C., Chen, I.-C., & Williams, S. E. (2017). Biodiversity redistribution under climate change: Impacts on ecosystems and human well-being. Science, 355(6332), eaai9214. [CrossRef]
- IPCC. (2021). Climate Change 2021: The Physical Science Basis. Cambridge University Press. https://www.ipcc.ch/report/ar6/wg1/.
- Dawson, T. P., Jackson, S. T., House, J. I., Prentice, I. C., & Mace, G. M. (2011). Beyond predictions: Biodiversity conservation in a changing climate. Science, 332(6025), 53–58. [CrossRef]
- Hoegh-Guldberg, O., Mumby, P. J., Hooten, A. J., Steneck, R. S., Greenfield, P., Gomez, E., & Knowlton, N. (2007). Coral reefs under rapid climate change and ocean acidification. Science, 318(5857), 1737–1742. [CrossRef]
- Lindenmayer, D. B., & Likens, G. E. (2010). The science and application of ecological monitoring. Biological Conservation, 143(6), 1317–1328. [CrossRef]
- Bush, A., Sollmann, R., Wilting, A., Bohmann, K., Cole, B., Balzter, H., & Yu, D. W. (2017). Connecting Earth observation to high-throughput biodiversity data. Nature Ecology & Evolution, 1(7), 0176. [CrossRef]
- Wang, J., Wang, L., Wang, J., Zhang, B., Zhang, W., & Li, S. (2020). Spatiotemporal patterns of microbial community structure in the seasonal alpine ecosystem. Science of the Total Environment, 715, 136898.
- Dixon, G. B., Davies, S. W., Aglyamova, G. V., Meyer, E., Bay, L. K., & Matz, M. V. (2015). Genomic determinants of coral heat tolerance across latitudes. Science, 348(6242), 1460–1462. [CrossRef]
- Caruso, T., Chan, Y., Lacap, D. C., Lau, M. C. Y., McKay, C. P., & Pointing, S. B. (2011). Stochastic and deterministic processes interact in the assembly of desert microbial communities on a global scale. ISME Journal, 5(9), 1406–1413. [CrossRef]
- Ferrier-Pagès, C., Godinot, C., D'Angelo, C., Wiedenmann, J., & Grover, R. (2016). Phosphorus metabolism of reef organisms with algal symbionts. Ecological Monographs, 86(3), 262–277. [CrossRef]
- Deiner, K., Fronhofer, E. A., Mächler, E., Walser, J.-C., & Altermatt, F. (2016). Environmental DNA reveals that rivers are conveyer belts of biodiversity information. Nature Communications, 7, 12544. [CrossRef]
- Cordier, T., Esling, P., Lejzerowicz, F., Visco, J. A., & Pawlowski, J. (2017). Predicting the ecological quality status of marine environments from eDNA metabarcoding data using supervised machine learning. Environmental Science & Technology, 51(16), 9118–9126. [CrossRef]
- Bohan, D. A., Vacher, C., Tamaddoni-Nezhad, A., Raybould, A., Dumbrell, A. J., & Woodward, G. (2017). Next-generation global biomonitoring: Large-scale, automated reconstruction of ecological networks. Trends in Ecology & Evolution, 32(7), 477–487. [CrossRef]
- Lodge, D. M., Turner, C. R., Jerde, C. L., Barnes, M. A., Chadderton, W. L., Egan, S. P., & Pfrender, M. E. (2012). Conservation in a cup of water: Estimating biodiversity and population abundance from environmental DNA. Molecular Ecology, 21(11), 2555–2558. [CrossRef]
Figure 1.
Monthly Shannon diversity index in Asir Mountains (16S rRNA).
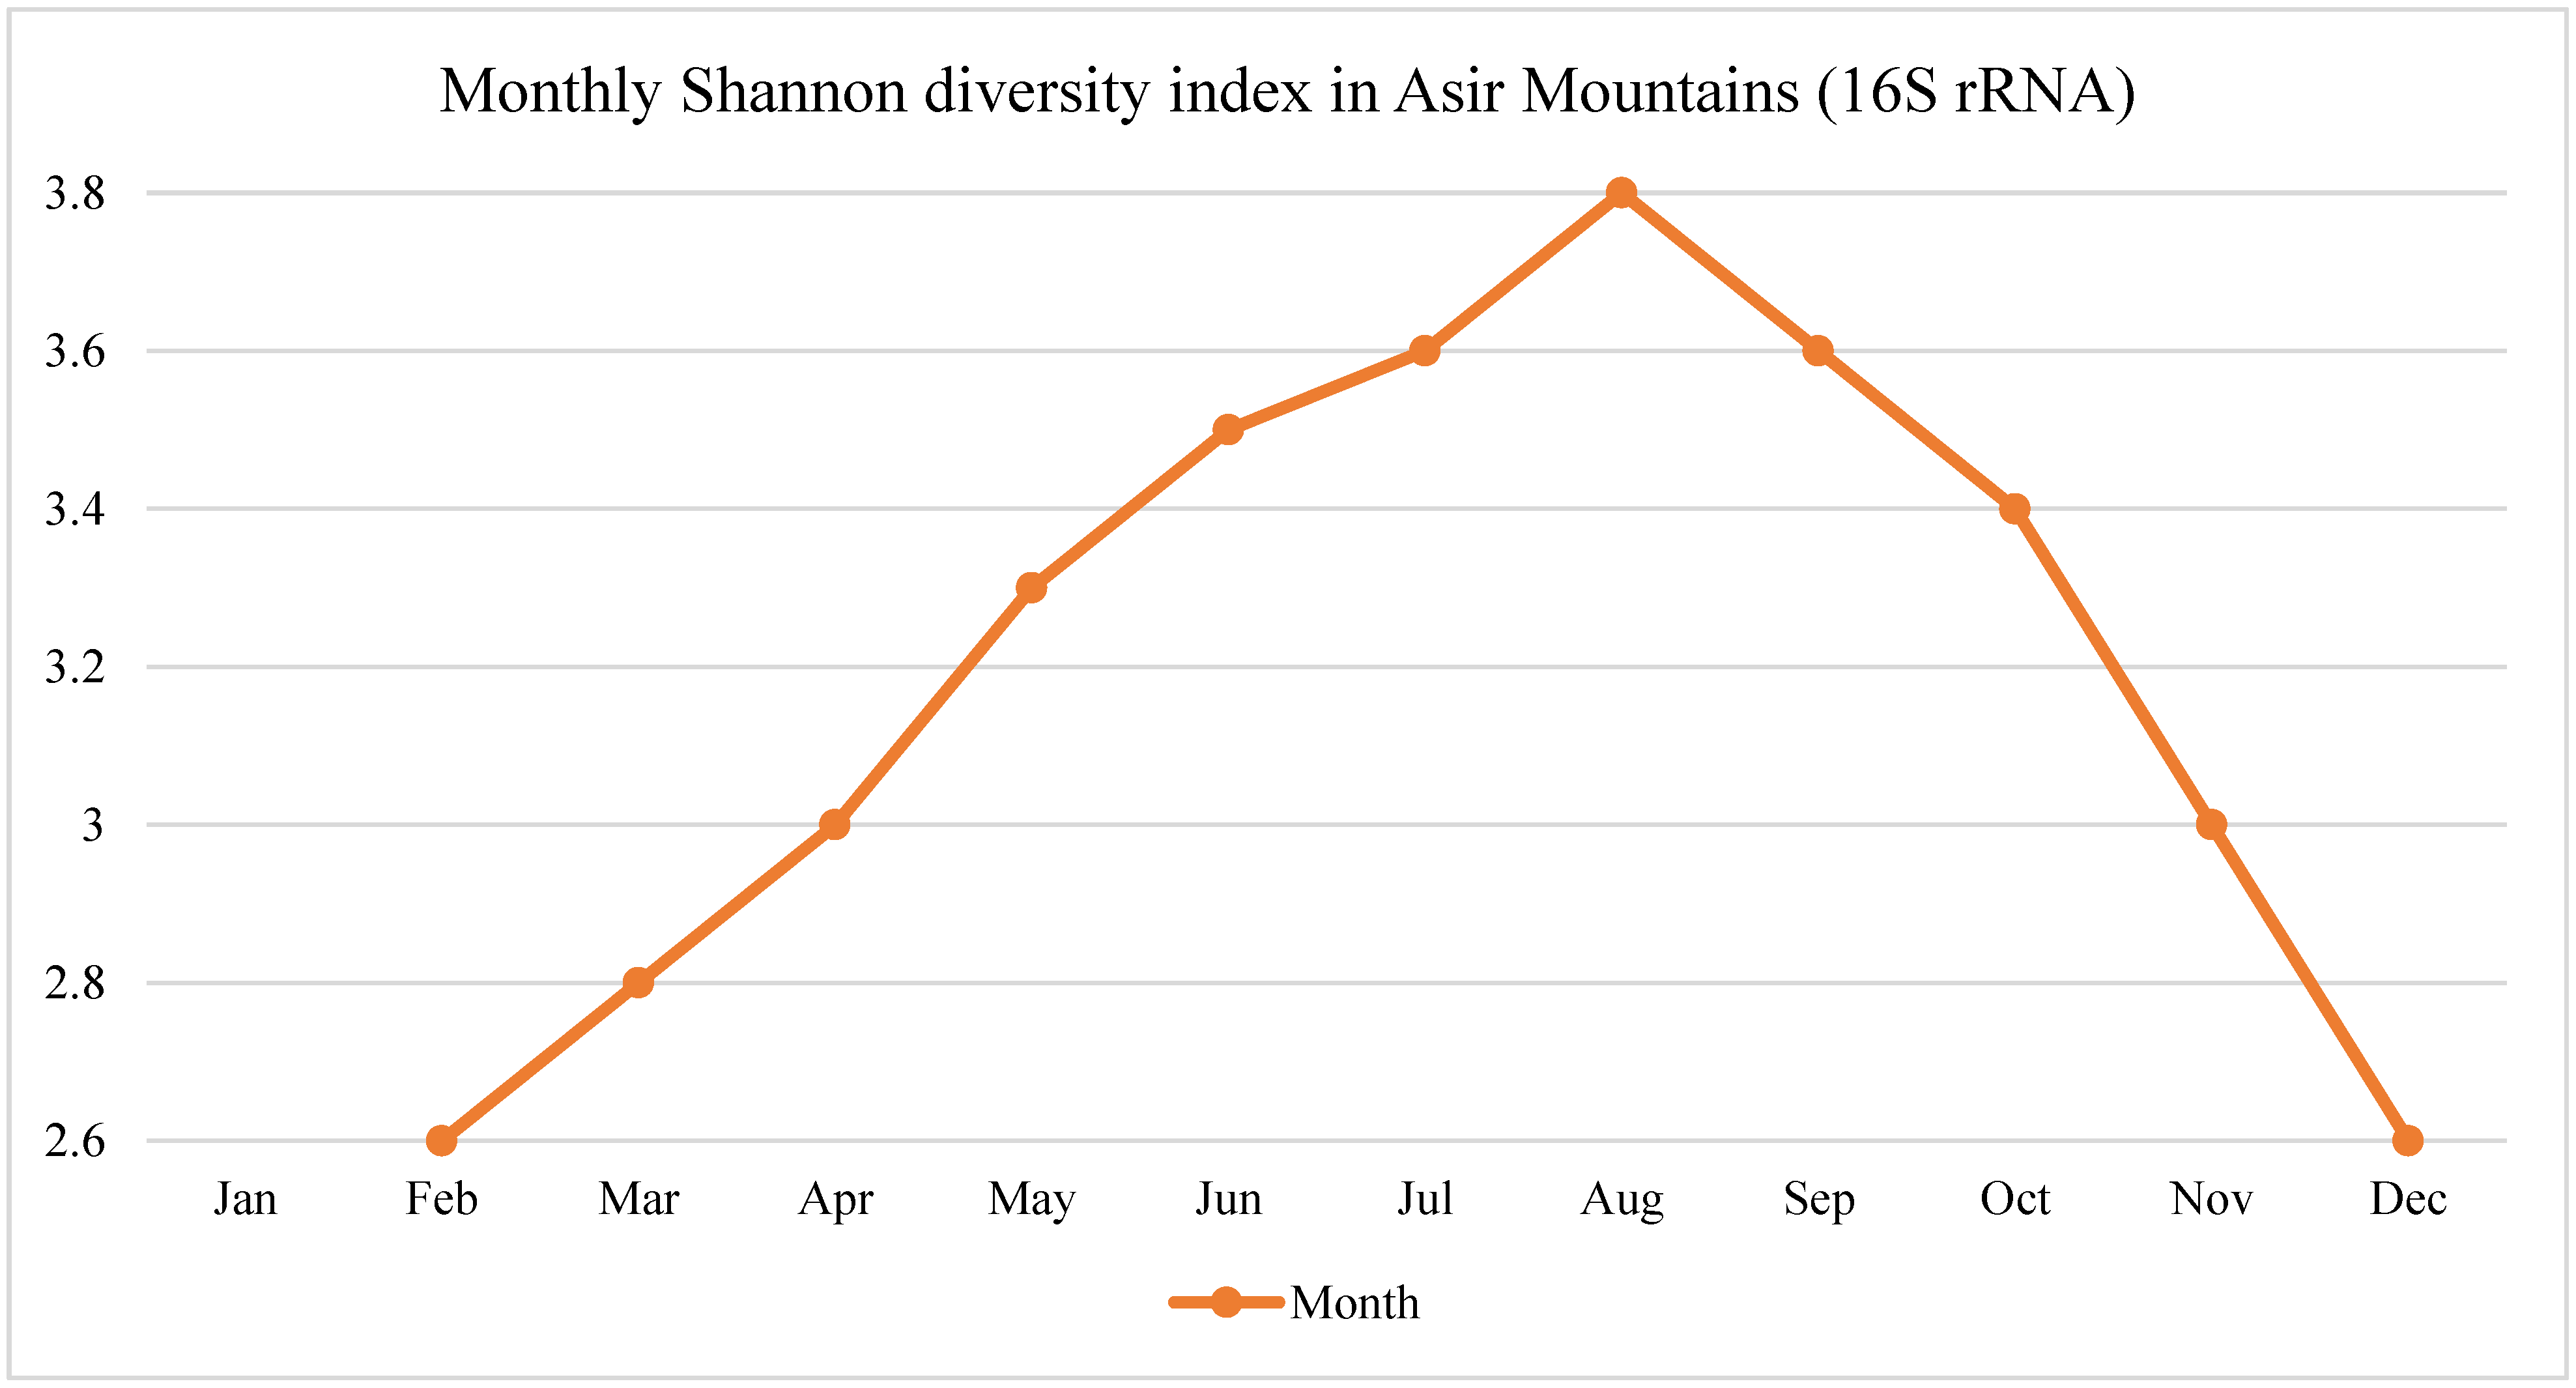
Figure 2.
COI sequence-based species richness vs. sea surface temperature in Farasan Islands.
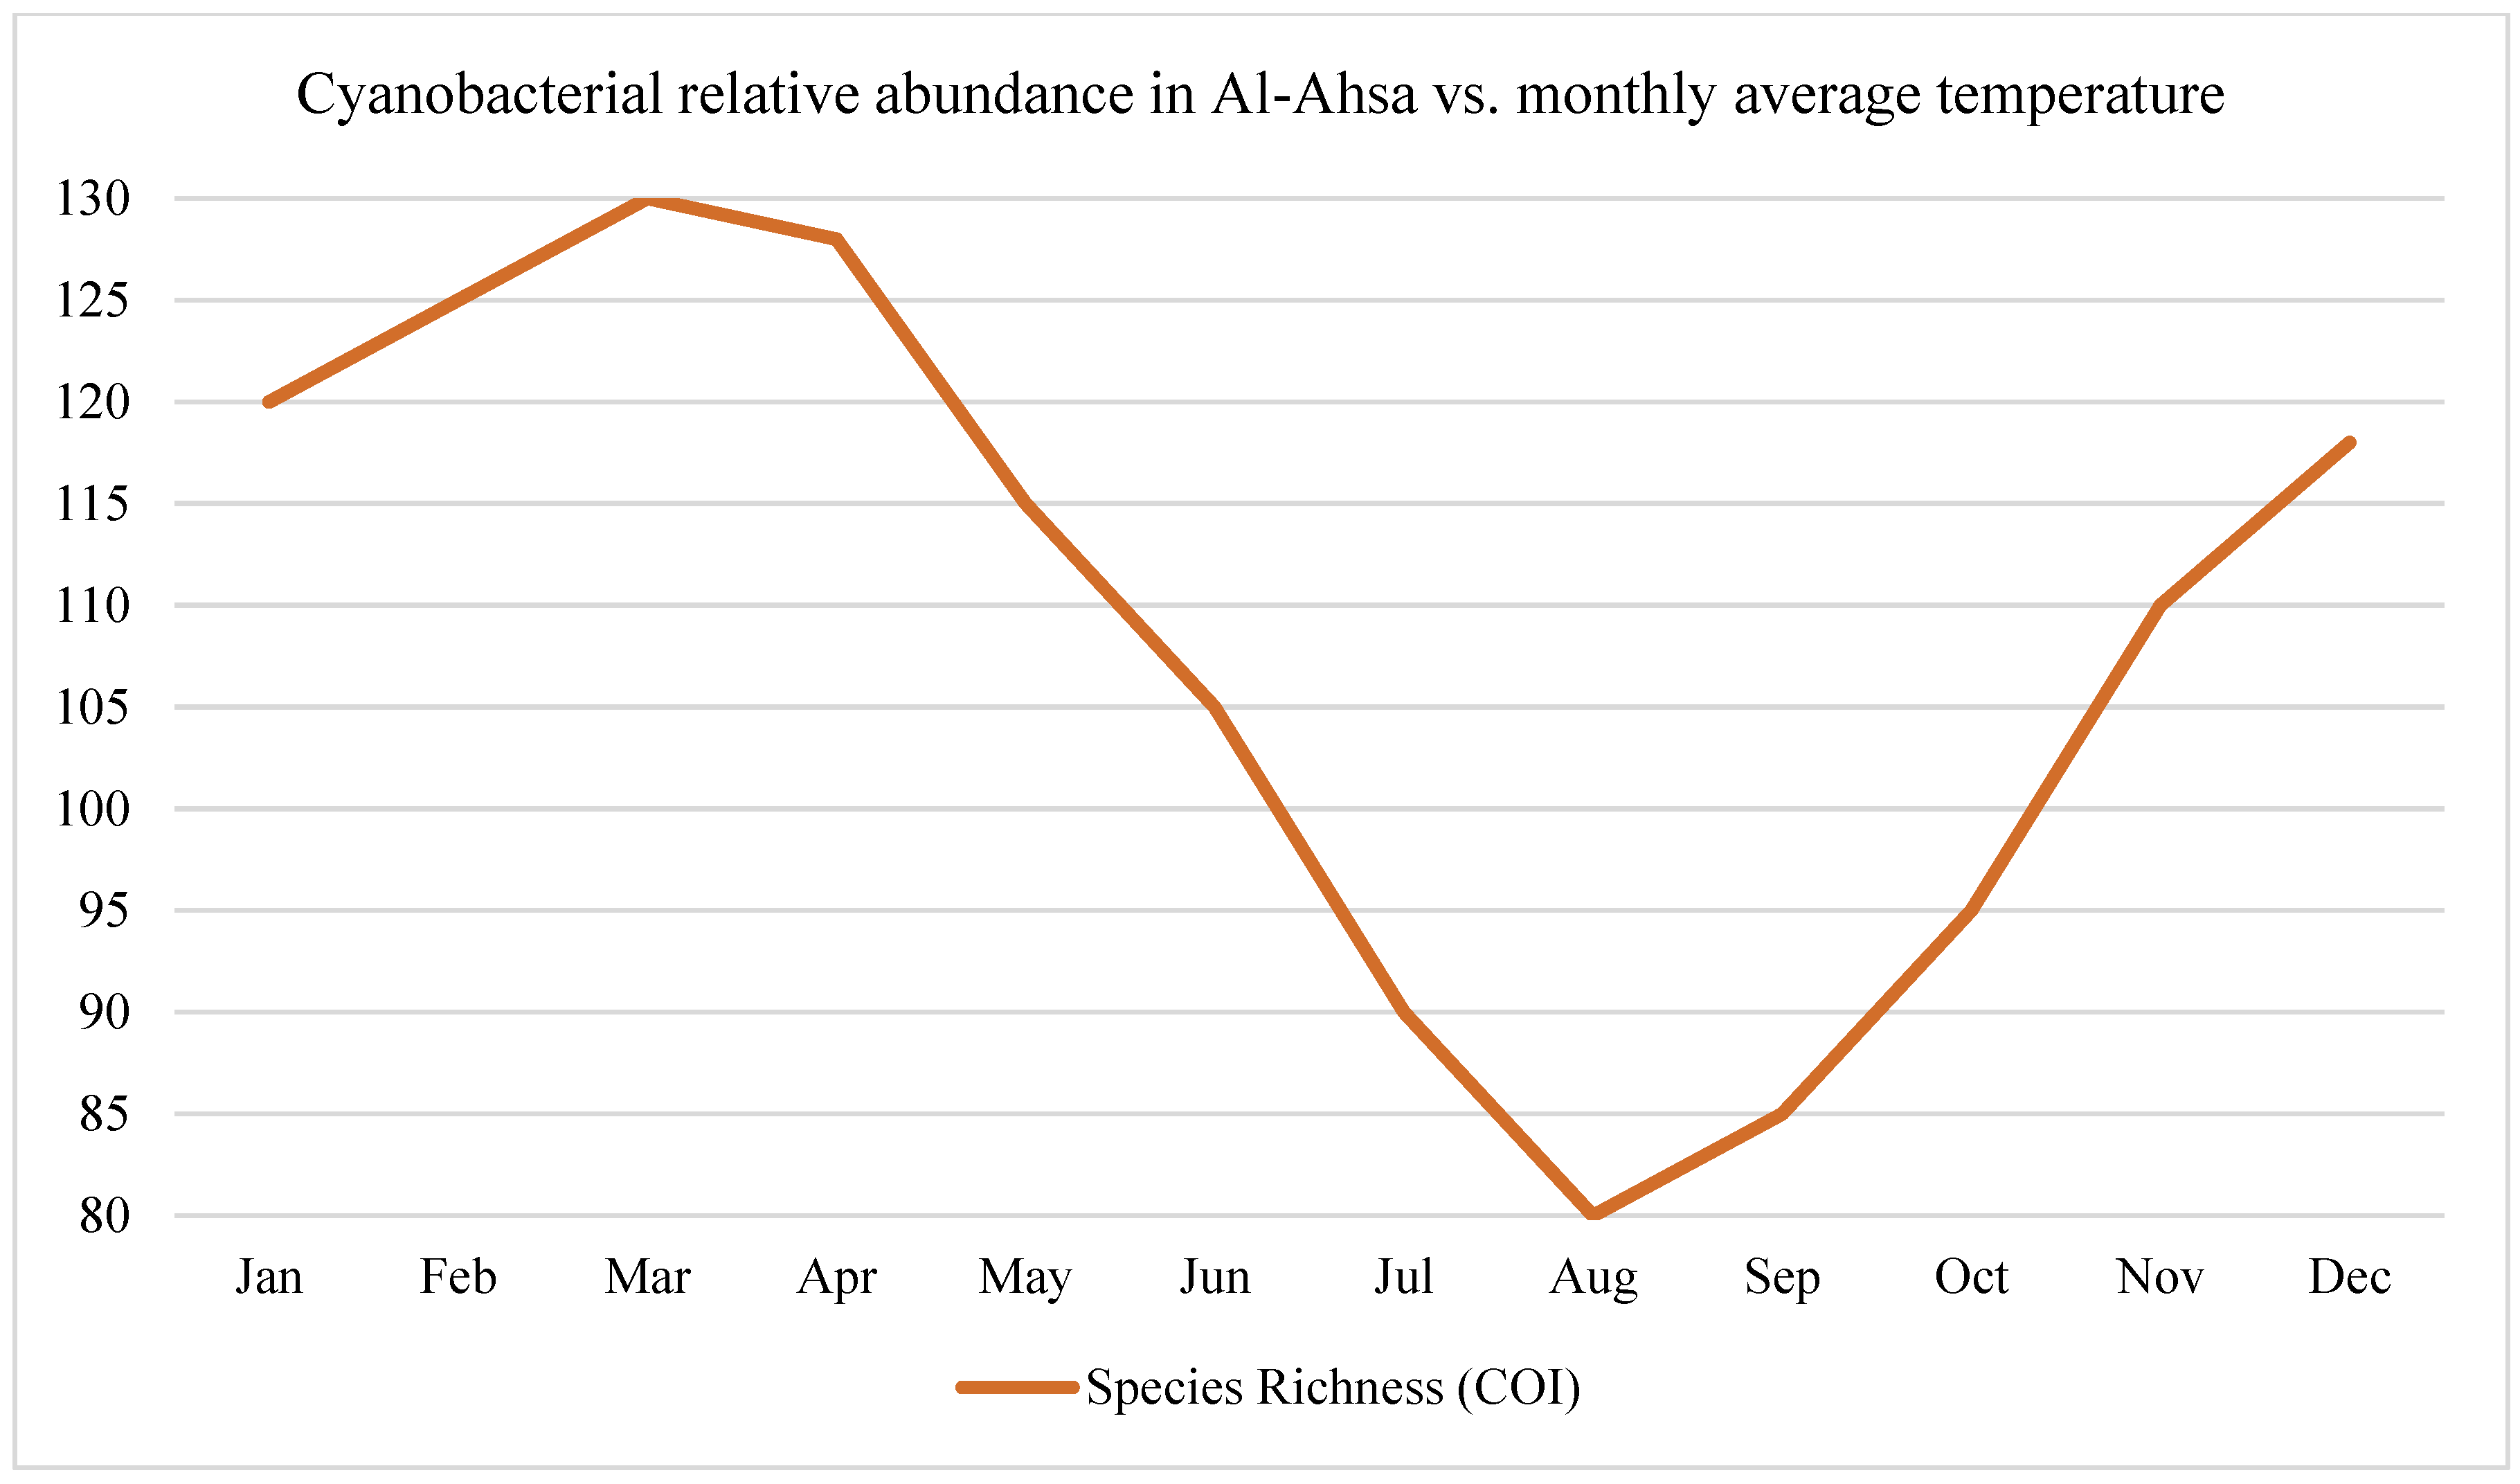
Figure 3.
Cyanobacterial relative abundance in Al-Ahsa vs. monthly average temperature.
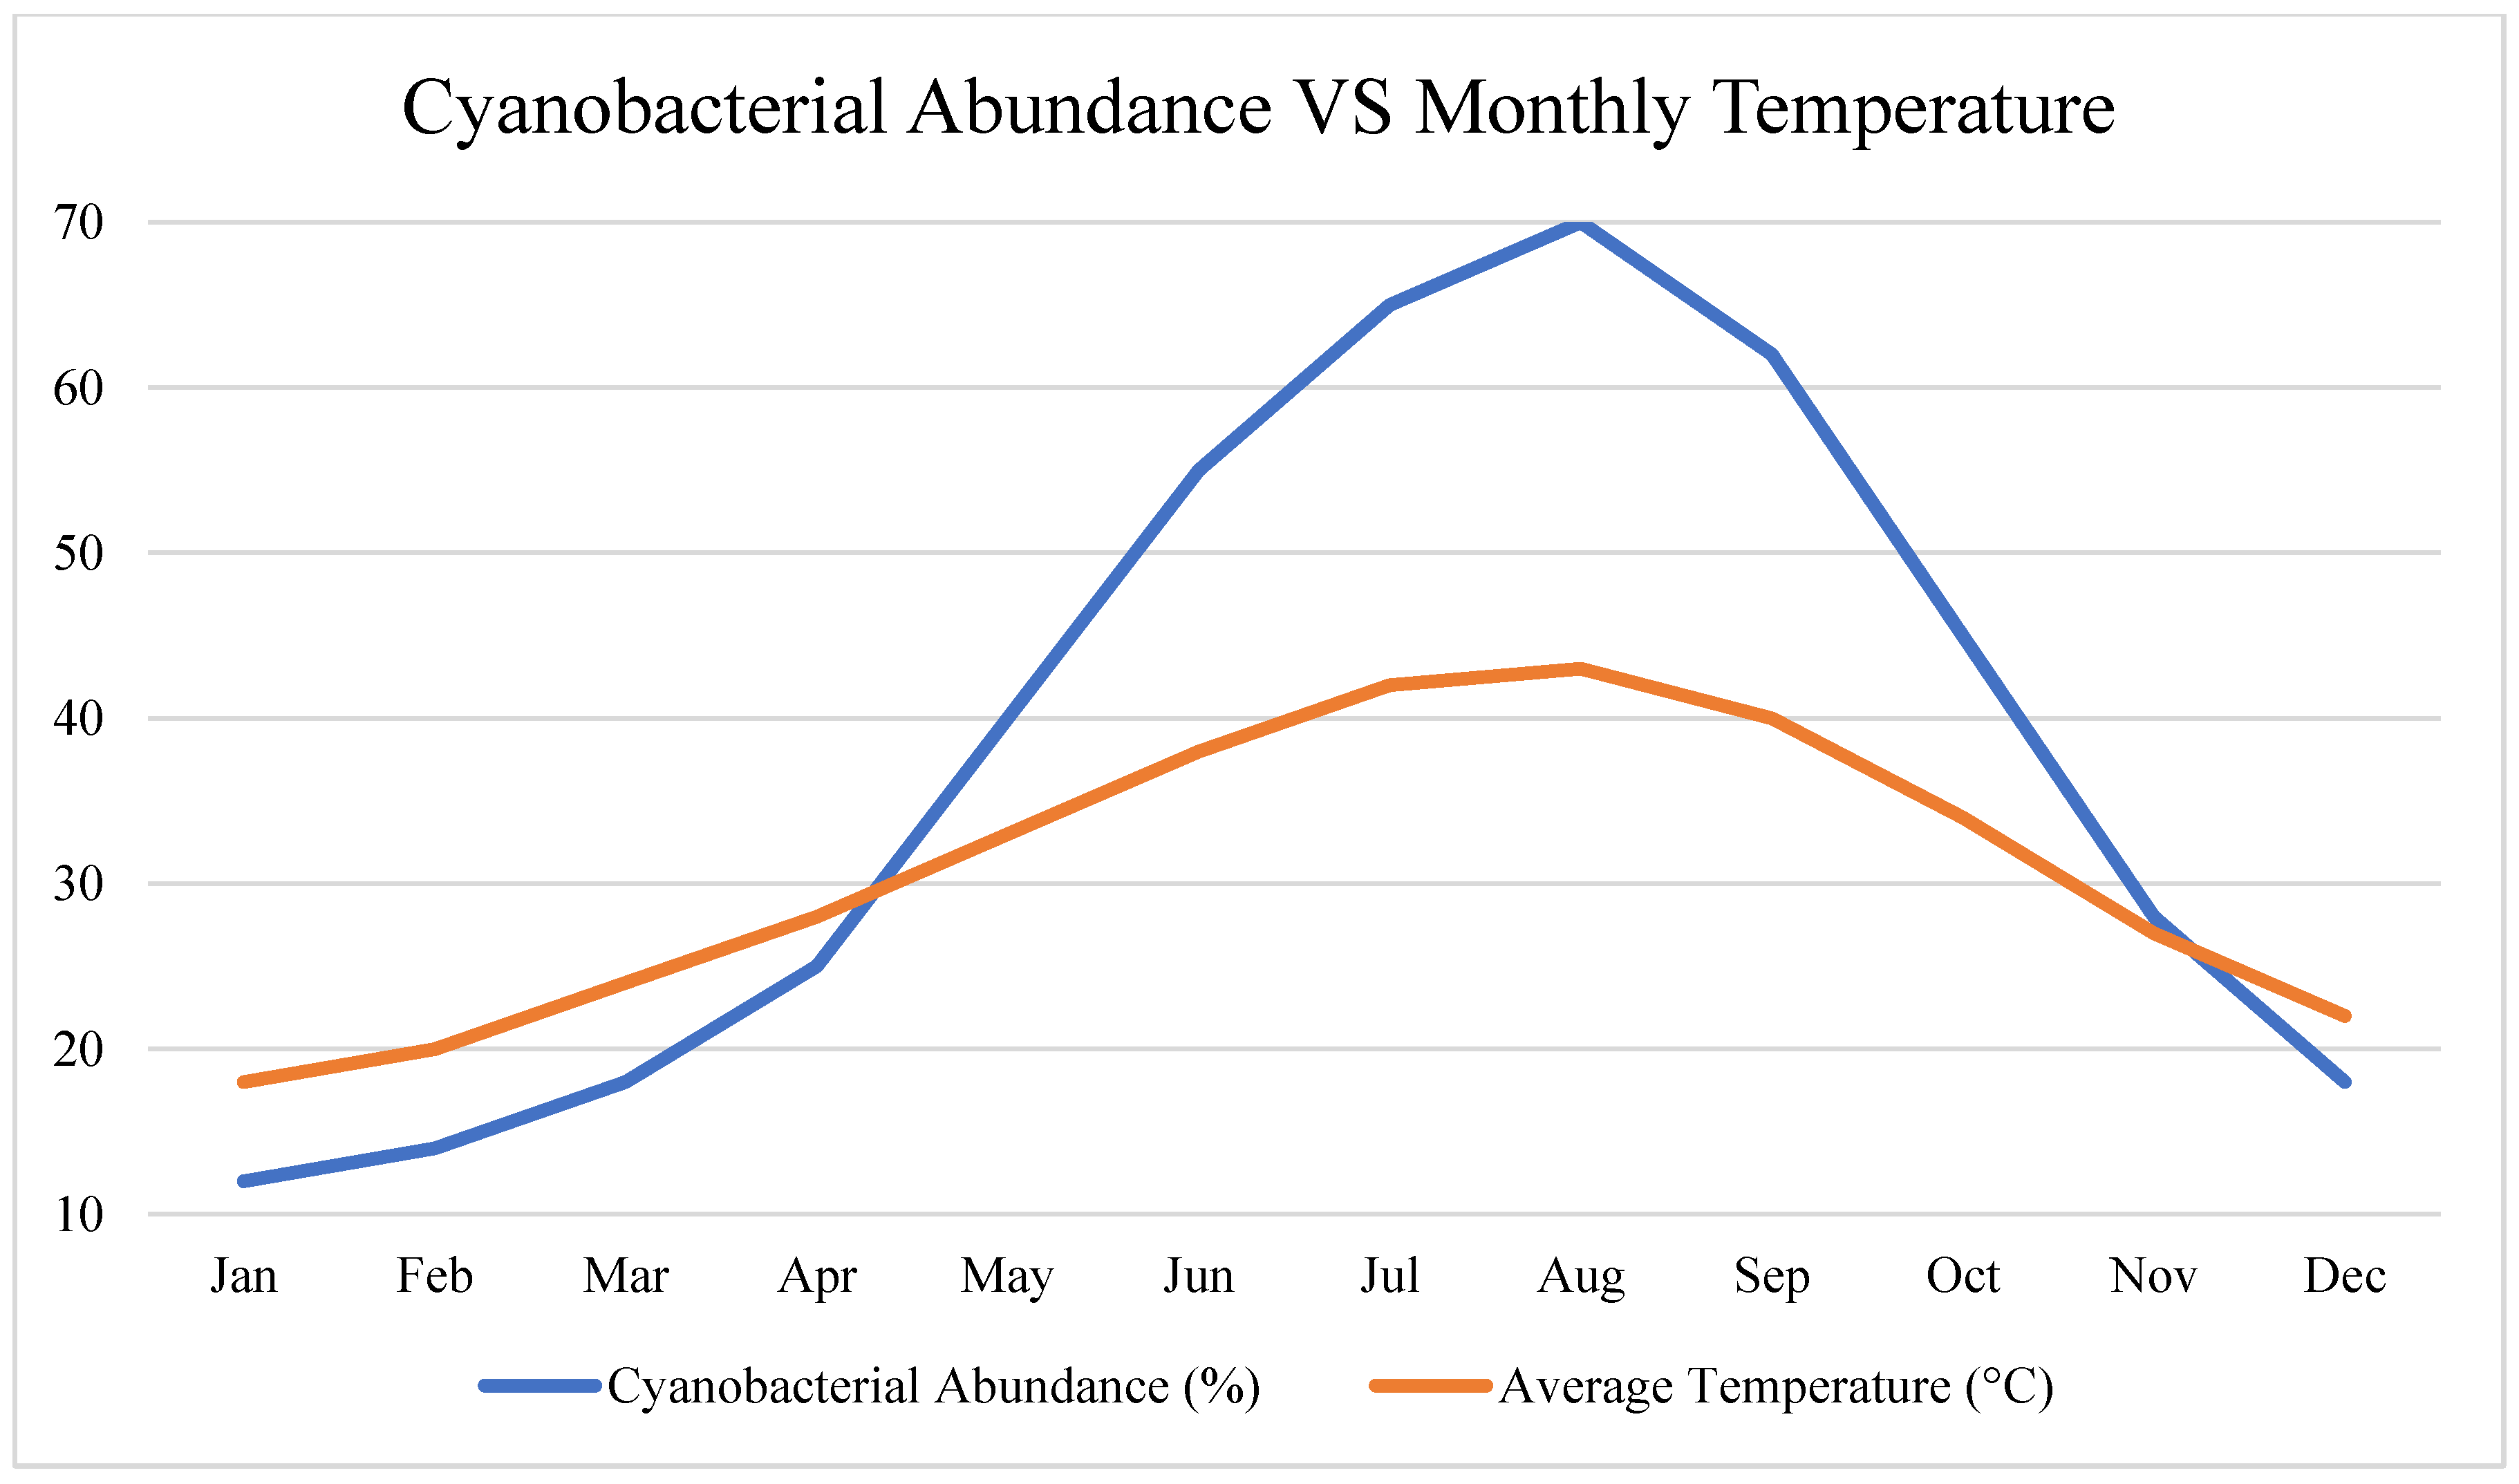
Figure 4.
Random forest variable importance for predicting biodiversity shifts.
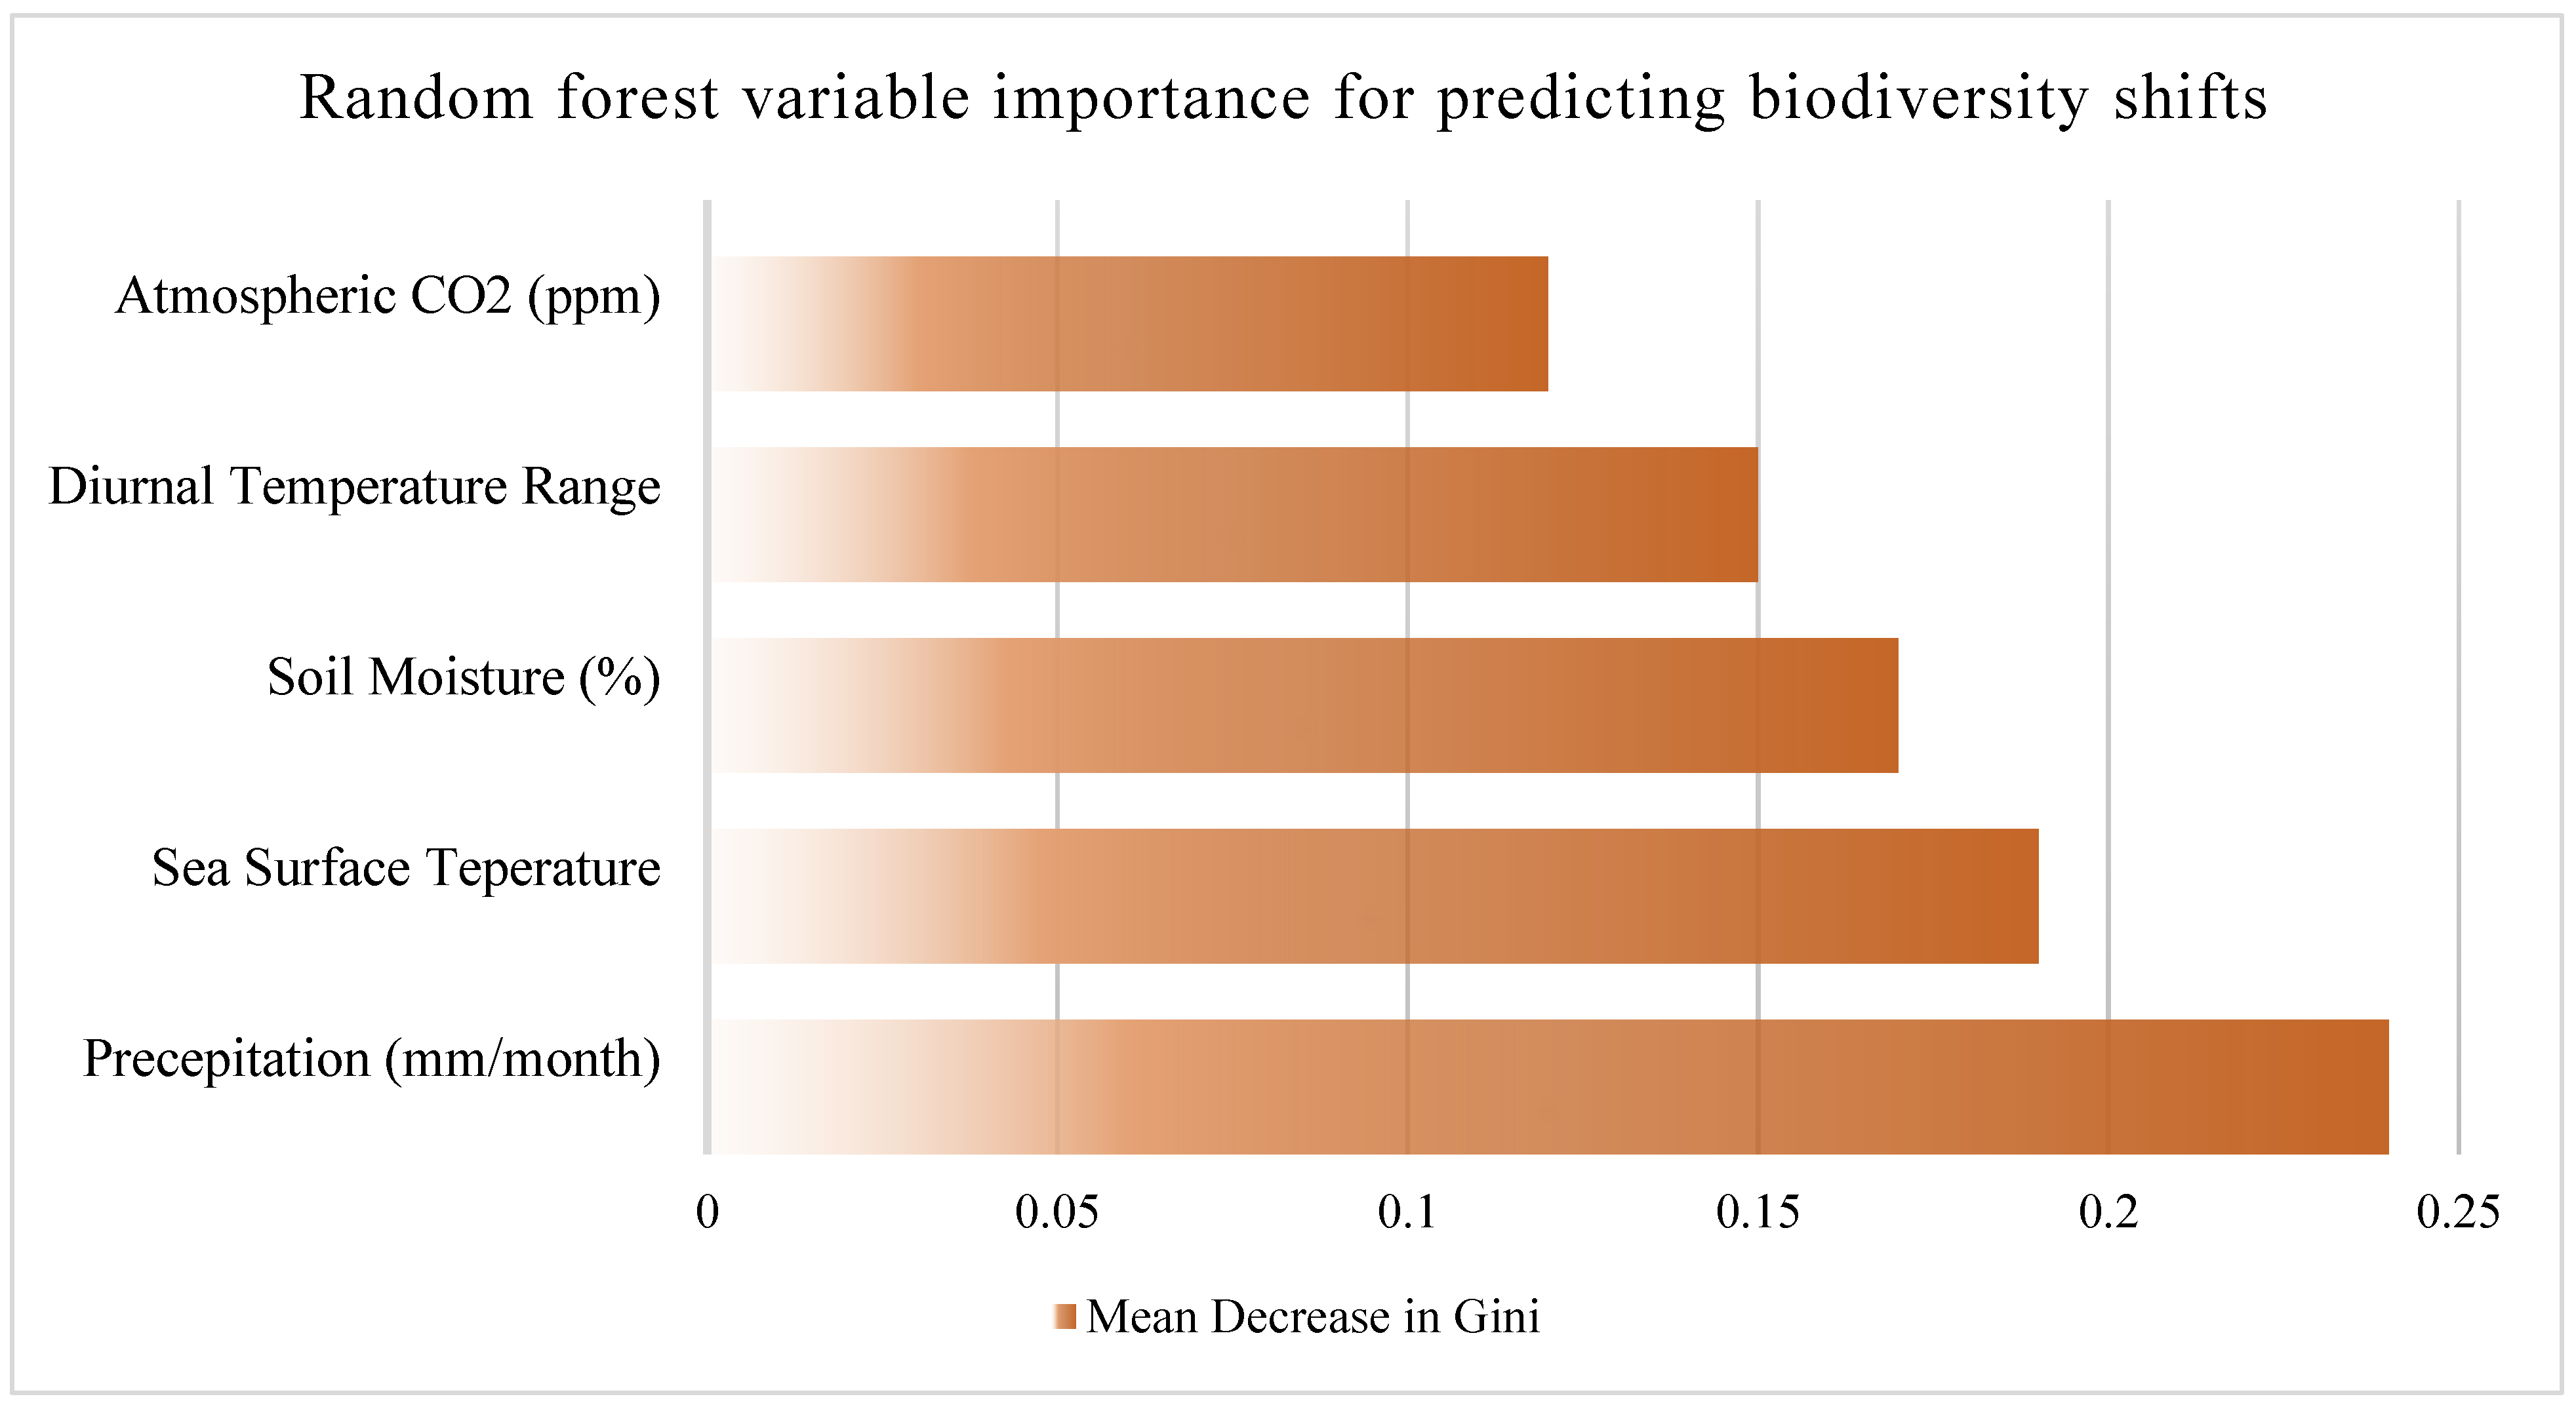
Figure 5.
Monthly Microbial OUT Richness in Asir Mountains.
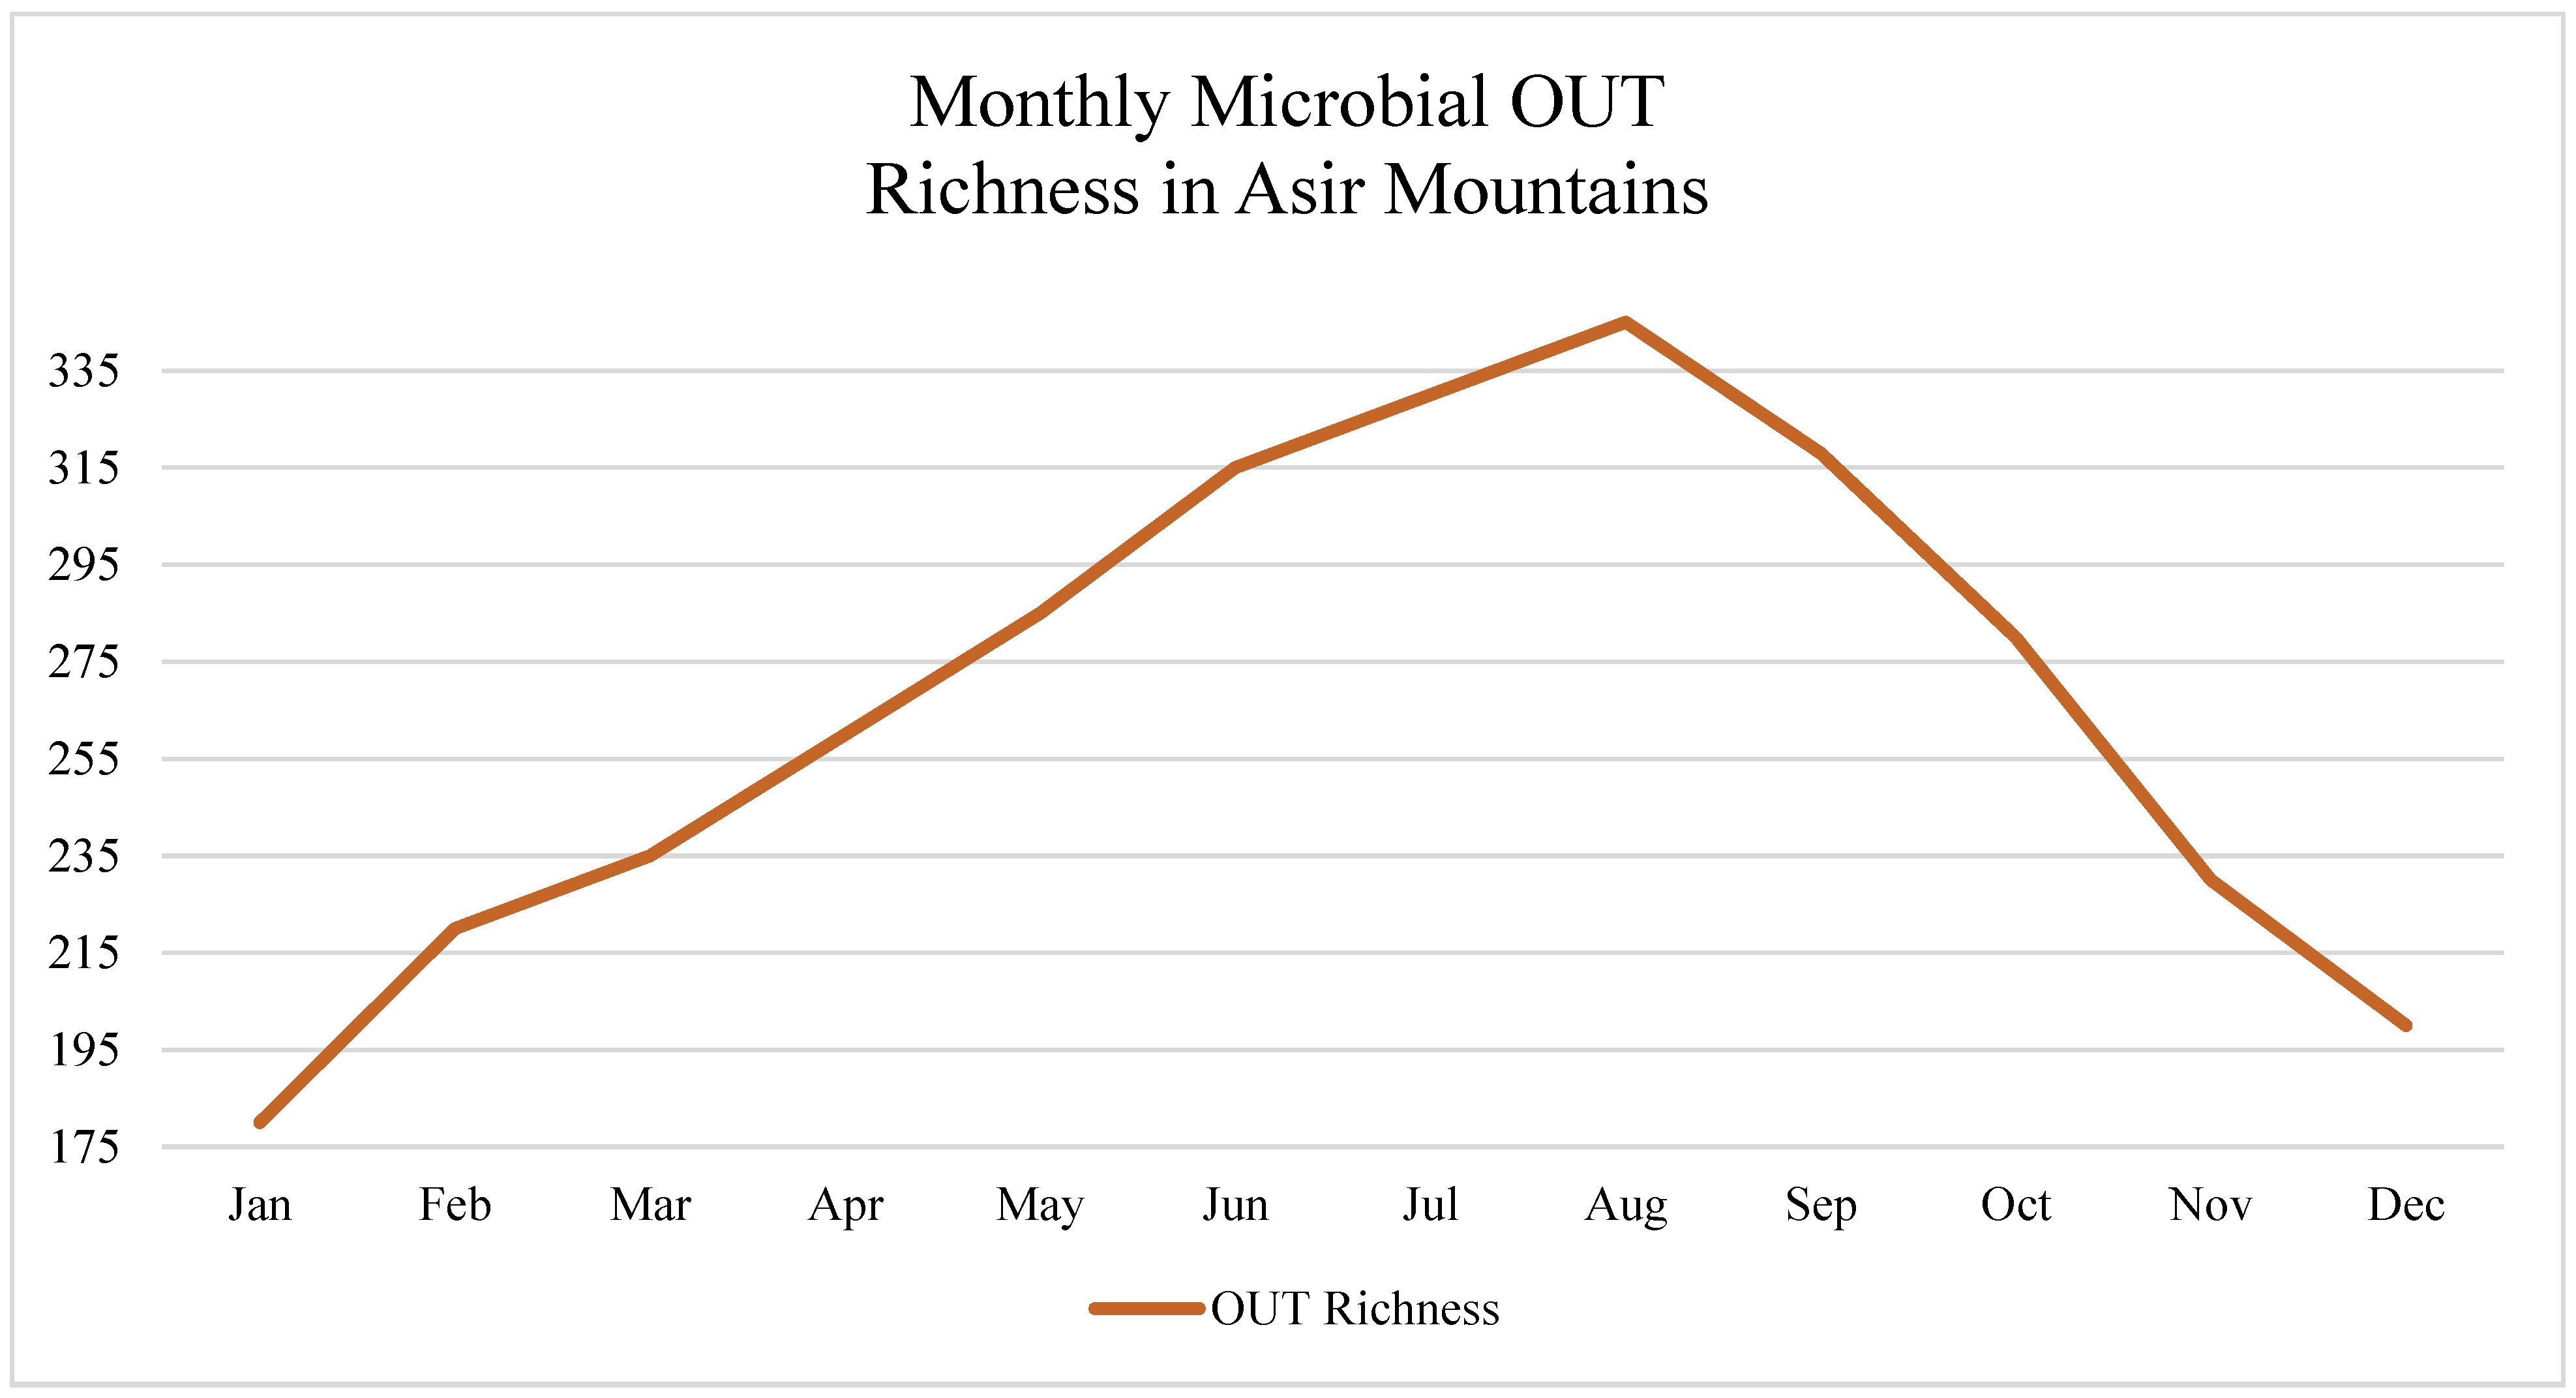
Figure 6.
ASV dynamics before, during, and after sandstorm event in Al-Ahsa.
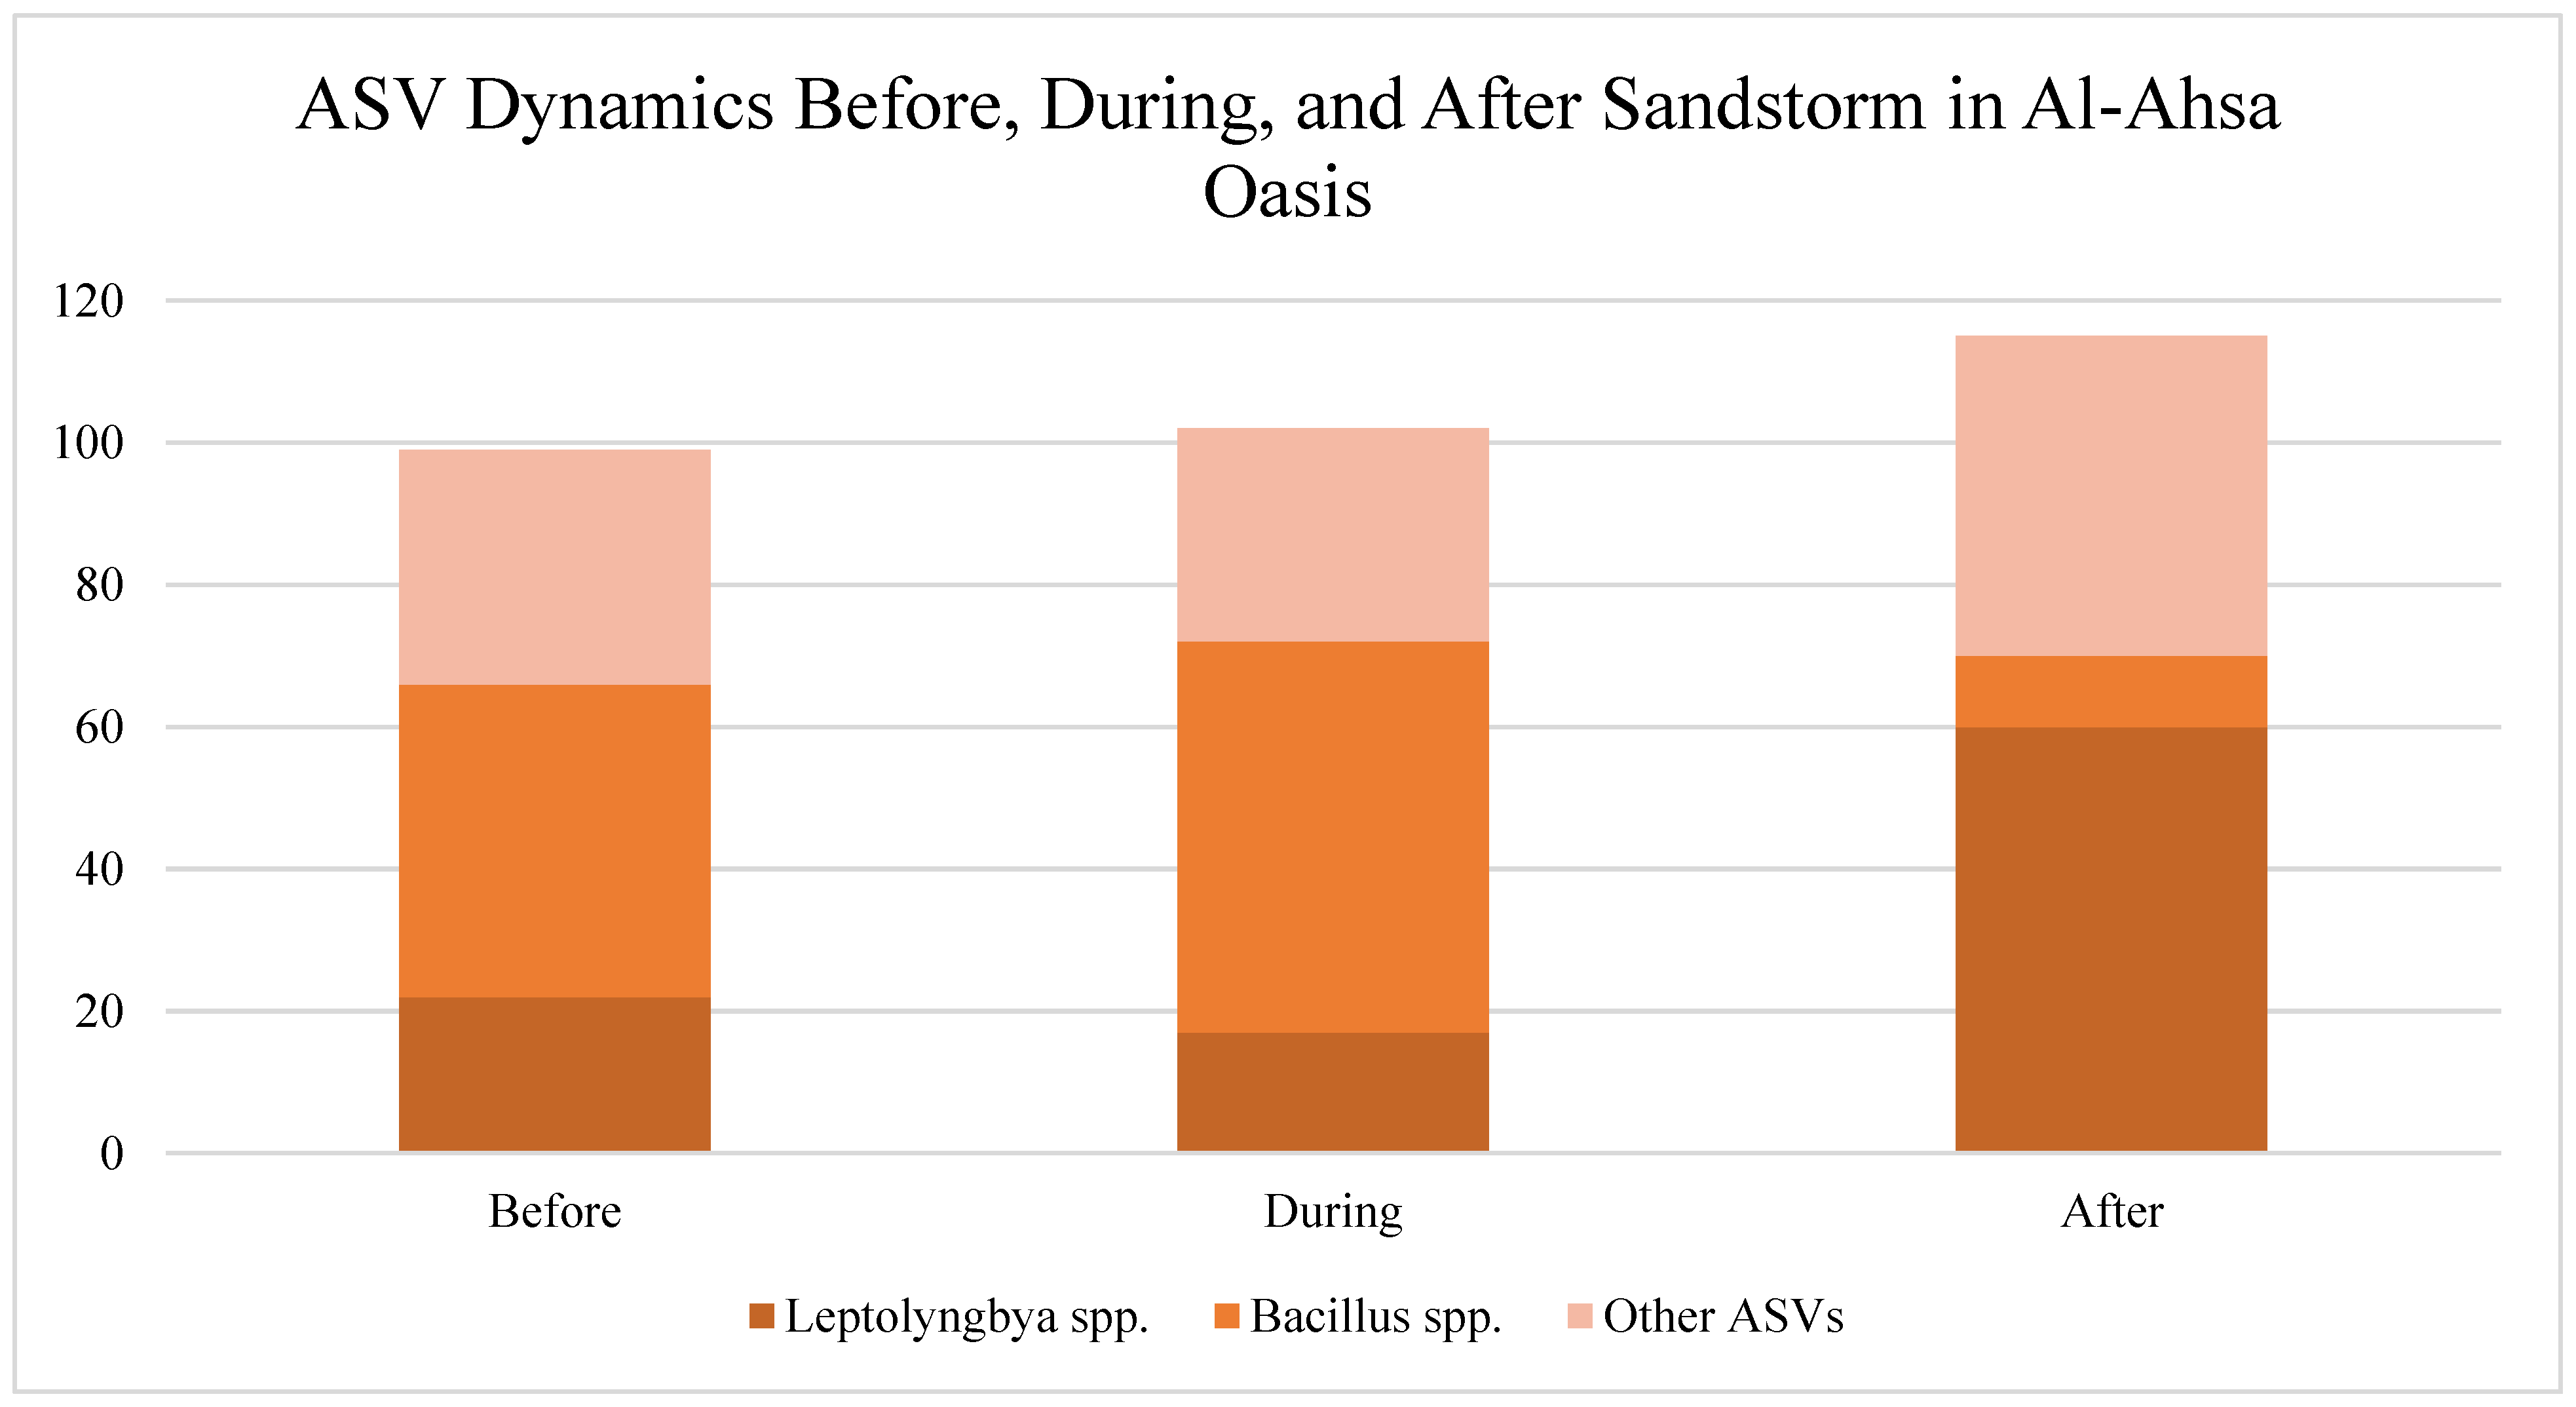

Table 1.
Indicator species analysis revealed strong correlations between climatic factors and specific taxa.
Table 1.
Indicator species analysis revealed strong correlations between climatic factors and specific taxa.
| Taxon | Ecosystem | Climate Trigger | Relative Abundance Change |
|---|---|---|---|
| Leptolyngbya spp. | Al-Ahsa Oasis | High temperature | ↑ 35–50% (summer) |
| Mortierella spp. | Asir Mountains | High rainfall | ↑ 60% (monsoon) |
| Symbiodinium spp. | Farasan Islands | Sea surface temperature >32°C | ↓ 40–60% (July–Sept) |
Table 2.
Correlation Matrix Between eDNA Metrics and Climate Variables Across Study Sites.
| eDNA Metric | Rainfall | Temperature | Humidity | Soil Moisture | SST (Sea Surface Temp.) | CO₂ (ppm) |
|---|---|---|---|---|---|---|
| Bacterial Richness (16S, Asir) | +0.81 | –0.42 | +0.66 | +0.69 | N/A | +0.30 |
| Fungal Diversity (ITS, Asir) | +0.72 | –0.38 | +0.74 | +0.77 | N/A | +0.25 |
| Cyanobacterial Abundance (Al-Ahsa) | –0.35 | +0.75 | –0.21 | +0.18 | N/A | +0.43 |
| Coral Symbionts (COI, Farasan) | +0.12 | –0.72 | +0.08 | N/A | –0.72 | –0.11 |
| OTU Evenness (Al-Ahsa) | –0.28 | –0.66 | +0.09 | +0.15 | N/A | +0.33 |
| Note:Bold values indicate statistically significant correlations (|r| > 0.7, p < 0.01)."N/A" indicates that the climate variable is not applicable to that particular ecosystem or eDNA type. | ||||||
Table 3.
Summary of biodiversity responses to climate anomalies.
| Event | Location | Climate Anomaly | Biodiversity Response | Key Taxa Affected | Interpretation |
|---|---|---|---|---|---|
| Heatwave (Aug, Year 1) | Farasan Islands | SST > 33°C for 3 consecutive weeks | 58% decline in coral-associated OTUs; severe drop in Symbiodinium spp. | Symbiodinium spp., coral fish DNA | Early signal of coral reef thermal stress and symbiont instability |
| Flooding (May, Year 2) | Asir Mountains | Over 150 mm rainfall in 48 hours | Rapid increase in fungal and bacterial OTUs; 65% spike in Trichoderma abundance | Trichoderma, Pseudomonas spp. | Post-disturbance microbial bloom due to organic matter enrichment |
| Sandstorm (Mar, Year 1) | Al-Ahsa Oasis | High wind and airborne dust deposition | Temporary spike in extremophiles; 35% decline in OTU evenness | Leptolyngbya, Bacillus spp. | Dust transport favors drought- and heat-tolerant microbial communities |
| Prolonged Drought | Al-Ahsa Oasis | <10 mm rainfall over two continuous months | Overall decline in richness; cyanobacterial dominance increases by >30% | Leptolyngbya, Halobacteria spp. | Arid stress favors thermophilic and osmoresistant taxa |
| Monsoon Surge | Asir Mountains | Rainfall peak + humidity >80% (Aug–Oct) | Strong seasonal peak in fungal OTUs; decomposer activity visibly elevated | Mortierella, Actinobacteria | Predictable enrichment of decomposer and saprotrophic guilds |
Table 4.
Climate-Responsive Sentinel Taxa Identified Across Study Sites.
| Taxonomic Group | Ecosystem | Seasonal Response | Environmental Correlate | Monitoring Utility |
|---|---|---|---|---|
| Leptolyngbya spp. | Al-Ahsa Oasis | Summer spike | Air temperature (>38°C) | Heat stress bioindicator |
| Mortierella spp. | Asir Mountains | Rainy season bloom | Soil moisture, rainfall | Humidity and rainfall marker |
| Symbiodinium spp. | Farasan Islands | Summer decline | Sea surface temperature (>32°C) | Coral bleaching precursor |
| Pseudomonas spp. | Asir Mountains | Post-flood surge | Surface runoff | Disturbance recovery agent |
| Bacillus spp. | Al-Ahsa Oasis | Windstorm spike | Aerosol transport, salinity | Dust-borne environmental stressor |
Table 5.
Correlation Between Climate Variables and eDNA Metrics.
| Ecosystem | Climate Variable | eDNA Metric | Correlation (r) | Statistical Significance (p) |
|---|---|---|---|---|
| Asir Mountains | Rainfall | Bacterial richness (16S rRNA) | +0.81 | < 0.001 |
| Al-Ahsa Oasis | Air temperature | OTU richness | –0.66 | 0.004 |
| Farasan Islands | Sea surface temperature (SST) | Coral symbiont eDNA abundance | –0.72 | < 0.001 |
| Asir Mountains | Soil moisture | Fungal diversity (ITS) | +0.69 | 0.006 |
| Al-Ahsa Oasis | Evaporation rate | Cyanobacterial dominance | +0.75 | 0.002 |
Table 6.
Key Predictors of Biodiversity Shifts (Random Forest Model).
| Rank | Predictor Variable | Mean Decrease in Gini | Interpretation |
|---|---|---|---|
| 1 | Precipitation (mm/month) | 0.241 | Most predictive of richness surges |
| 2 | Sea Surface Temperature | 0.197 | Key for coral-associated eDNA fluctuation |
| 3 | Soil Moisture (%) | 0.181 | Influences fungal and bacterial abundance |
| 4 | Diurnal Temperature Range | 0.149 | Modulates desert microbial responses |
| 5 | Atmospheric CO₂ (ppm) | 0.124 | Secondary signal of ecosystem respiration trends |
| Model performance: Accuracy = 87%; ROC-AUC = 0.91 | |||
Table 7.
Diversity Index Trends Across Ecosystems and Seasons.
| Ecosystem | Season | Shannon Index | Simpson Index | Notable Biodiversity Observations |
|---|---|---|---|---|
| Asir Mountains | Monsoon (Aug–Oct) | 3.7 ± 0.2 | 0.89 ± 0.03 | Peak in bacterial & fungal richness |
| Al-Ahsa Oasis | Summer (Jun–Aug) | 2.1 ± 0.3 | 0.72 ± 0.04 | Cyanobacterial dominance, heat stress |
| Farasan Islands | Summer (Jul–Sep) | 1.9 ± 0.4 | 0.68 ± 0.05 | Drop in coral-associated taxa during marine heatwaves |
| Asir Mountains | Winter (Dec–Feb) | 2.5 ± 0.2 | 0.83 ± 0.02 | Stable baseline diversity |
Disclaimer/Publisher’s Note: The statements, opinions and data contained in all publications are solely those of the individual author(s) and contributor(s) and not of MDPI and/or the editor(s). MDPI and/or the editor(s) disclaim responsibility for any injury to people or property resulting from any ideas, methods, instructions or products referred to in the content. |
© 2025 by the author. Licensee MDPI, Basel, Switzerland. This article is an open access article distributed under the terms and conditions of the Creative Commons Attribution (CC BY) license (http://creativecommons.org/licenses/by/4.0/).
Copyright: This open access article is published under a Creative Commons CC BY 4.0 license, which permit the free download, distribution, and reuse, provided that the author and preprint are cited in any reuse.


