
Submitted:
08 May 2025
Posted:
08 May 2025
You are already at the latest version
Abstract
Monthly variation in the community structure of ichthyoplankton in the offshore waters of the Liaoning Province, China, in the Yellow Sea was evaluated based on spawning ground and ecological survey data collected from April to December 2021. The effects of environmental factors on ichthyoplankton community structure were examined using cluster analysis, non–metric multidimensional scaling, Mantel tests, and canonical correspondence analysis. Furthermore, species distribution models were applied to forecast the potential distribution of spawning grounds for dominant species under various climate change scenarios. Results indicated that spawning in the offshore waters of Liaoning Province peaks between May and August 2021. Major spawning grounds are found around the estuaries of the Dayang and Yalu Rivers. Engraulis japonicus appearred as the dominant species within the ichthyoplankton community. Species composition of fish eggs was not significantly different from July to September, indicating minimal species turnover. A similar pattern was observed in the composition of larval fish from May to July and August to September, with low species turnover. Yet, considerable intermonthly changes occurred in other months. Seawater surface temperature, seawater bottom temperature, seawater bottom salinity, and depth were recognized as pivotal environmental variables that shape the ichthyoplankton community structure and abundance. The predicted spawning grounds indicate a continuous expansion trend under the RCP2.6 scenario, fluctuating contraction under the RCP4.5 and RCP6.0 scenarios, and severe degradation under the RCP8.5 scenario. This research offers essential data to support the conservation and sustainable utilization of fishery resources in the offshore waters of Liaoning Province, China, in the Yellow Sea.
Keywords:
early life stage
; community structure
; dominant species
; Engraulis japonicus
; environmental factors
; SDMs
1. Introduction
Early life stage (ELS) encompass the initial phases of a fish’s life cycle, specifically including the stages of eggs and larvae. Fish at ELS typically have limited swimming capabilities. Consequently, their growth, development, and survival are more susceptible to marine environmental shifts than those of adult fish (Nielsen et al. 2021). This period is also characterized by the highest mortality rate within a fish’s life cycle. The status of ELS is a pivotal indicator of fish population health and sustainability, reflecting the reproductive scale and population growth rate. The condition of ELS fish also mirrors changes in the age structure and size distribution of fish populations (Hutchings and Reynolds 2004; Stige et al. 2019; Zhang et al. 2022). These aspects are crucial to understand the dynamics and long-term viability of marine ecosystems, providing essential insights for effective fisheries management and conservation.
The offshore waters of the Liaoning Province of China in the Yellow Sea experience a complex interplay of oceanic currents and water masses. The Liaonan Coastal Current, the Yellow Sea Cold Water Mass (Lin et al. 2019), and the Yellow Sea Warm Current converging in this region creates a dynamic marine environment with considerable nutrients and organic matters along the coast (Cui et al. 2004; Wu et al. 2024). This area consequently serves at important habitats for many marine fish species and one of the crucial fishing grounds in northern China (Wang et al. 2020). Since the 1990s, fish community in this area has exhibited a pronounced shift from medium and large economic categories toward small-sized mesopelagic and epipelagic with lower trophic levels (Jin and Tang 1996; Jin et al. 2005; Sun et al. 2024). Currently, Engraulis japonicus is the predominant fish species in the system as well as the principal component of the ELS fish communities in this area (Cui et al. 2024).
Over several decades, ELS fish research in the offshore waters of the Liaoning Province in the Yellow Sea has yielded important insights into fish reproductive patterns, population structure, and ecological drivers (Ruan 1984; Wan and Jian 1998; Chen et al. 2004; Qiu et al. 2004; Chen et al. 2005; Zhao et al. 2005; Shan et al. 2014). Studies carried out in the late 1950s only focused on E. japonicus, mapping its major spawning areas and seasonal distributions (Ruan 1984). In the subsequent decades, studies broadened to examine ELS fish community structure and its relationship with environmental factors (Wan and Jiang 1998). However, most surveys were limited to specific regions or seasons, and thus lacked a comprehensive understanding of broader ecological processes. More recently, with improvements in bottom-trawl and ichthyoplankton surveys, preliminary spatial and temporal distribution models of ELS fish resources have been established (Qiu et al. 2004; Zhao et al. 2005). However, uneven station coverage and data limitations still leave uncertainties regarding the ecological dynamics between nearshore and offshore waters. While some studies have explored habitat-specific physical and biological conditions (Shan et al. 2014), gaps remain in understanding how habitat variability impacts early-stage growth and survival. Notably, the importance of nearshore spawning grounds to resource renewal gained attention in surveys from 2014 to 2018 (Dong et al. 2018), yet long-term dynamics and potential climate impacts require further assessment.
Despite the significant insights gained from decades of surveys on ELS fish in the coastal waters of the Liaoning Province, Yellow Sea, and Bohai Sea, which have revealed important information about fish reproductive patterns, habitat conditions, and ecological drivers, several unresolved issues remain. Firstly, most existing studies have concentrated on nearshore areas, resulting in a lack of understanding of the dynamics in offshore waters, which complicates a comprehensive understanding of the ecosystem's complexity. Secondly, while some research has explored environmental factors such as temperature and salinity, their specific impacts on ELS fish community structure are not yet fully understood. It is crucial to delve deeper into how these environmental conditions influence fish growth and survival. Additionally, the potential impacts of climate change on fish spawning and survival rates require further investigation, especially considering how rising water temperatures and changing currents may have profound effects on fish populations. To address these gaps, conducting long-term monitoring and comprehensive analyses will be essential in filling these knowledge voids and providing a scientific basis for future ecological management.
The distribution and survival of ELS of fish can be influenced by various physical and chemical factors such as tides, dissolved oxygen, and water temperature (Martinez et al. 2012; Vanhatalo et al. 2012; Pattrick et al. 2016; Correa et al. 2024; Jung et al. 2024). Amidst the backdrop of global climate warming, the average global seawater surface temperature (SST) has witnessed an increase of 0.67 °C since the early 20th century (Samset et al. 2023). The Yellow Sea became warmer at a faster rate, with the annual average SST climbing by a substantial 1.0°C over the period from 1957 to 2011(Belkin 2009). Additionally, the warming trend persisted in the Yellow Sea from 2012 to 2018(Wo et al. 2020). Continued warming has brought considerable challenges to the marine ecosystem (Howard et al. 2024), affecting the spawning grounds of various fish stocks, especially E. japonicus, in the coastal waters of the Yellow Sea. It is important to evaluate such spawning grounds under various climate change scenarios for understanding fishery population dynamics and sustainable utilization of fish stocks. This research utilized data from a monthly ichthyoplankton survey in the north Yellow Sea from April to December, 2021, to unveil the structure and distribution pattern of ELS fish community in the coastal water of the north Yellow Sea. It also predicts the effect of climate change under various scenarios on the spatial distribution of potential spawning grounds for dominant species such as the E. japonicus in the study area.
2. Research Methods
2.1. Data Acquisition
The ichthyoplankton survey was conducted monthly in the coastal waters of the Liaoning province of China in the north Yellow Sea. It consists of seven separate cruises at April 16–23, May 25–June 17, July 20–26, August 16–27, September 10–16, October 18–November 6, and December 8–18. And 20 distinct stations were set for each cruise (Figure 1).
Marine survey sampling methods and sample analysis procedures followed the guidelines outlined in the “Specification for Oceanographic Surveys Part 6: Marine Biological Survey” (GB/T 12763.6-2007). Fish eggs and larvae were collected using a large plankton net made of 36GG (mesh size 0.505 mm) silk gauze, with a mouth diameter of 0.800 m and a length of 270 cm. The net was used for horizontal trawling, with a 10-min surface trawl at each station and a towing speed of 2n mile/h, and a flowmeter was attached to the mouth of the net to calculate the volume of water filtered. The specimens were fixed with a 5% seawater formalin solution. Water temperatures and salinities are measured using a Seabird 19 plus from the United States or a CTD 60M from Sea & Sun Technology of Germany. The surface layer was identified as the water column from the surface down to 0.5 m, while the bottom layer was the water column within 0.5 m above the seafloor. The bathymetric depth at each station was determined using the echo sounder on ship. Surface chlorophyll-a (Chl-a) samples were collected by using a water sampler to collect 500 ml of surface seawater, which was then filtered onto a glass fiber filter membrane (with a pore size of 0.7 μm), and the samples were immediately stored and frozen at -20°C.
The taxa of the ichthyoplankton, zooplankton, and phytoplankton were identified taxonomically by using the traditional morphological method. The developmental stages of fish eggs included cleavage, gastrula, embryo, hatching, and dead eggs, while the developmental stages of juvenile fish included prelarvae, postlarvae, and juveniles. The scientific names of the species referred to the World Register of Marine Species (WoRMS, https://www.marinespecies.org/). After eliminating debris and ichthyoplankton, the residual wet weight of zooplankton is determined using a balance accurate to 0.001 grams. Chl-a was extracted using a 90% acetone solution at -20°C for 12 h from the glass fiber filter membrane, and the concentration of Chl-a was then measured with a Turner Designs Trilogy fluorometer.
2.2. Species Dominance and Ecological Density
Using Pinkas' Relative Importance Index (IRI), species dominance was evaluated as an indicator (Pinkas et al. 1971). Given that fish eggs and larvae are small in size, biomass was not considered in the calculations, and the formula was simplified as follows:
IRI = N% × F%
In Formula 1, N% represents the percentage of the abundance of a particular fish egg or larva species relative to the total abundance accounting for the month, and F% represents the occurrence frequency of that species. Species with IRI ≥1000 are defined as dominant species, species with 100 ≤ IRI<1000 are defined as important species, species with 10 ≤ IRI< 100 are defined as common species, species with 1≤ IRI < 10 are defined as general species, and species with IRI < 1 are defined as rare species.
The density of fish eggs (D) or larvae (i.e., number per unit volume of filtered water, ind/m³) was calculated as:
where d represents the distance covered by the trawl net during each station's water filtration, in meters; R represents the difference in the readings of the flow meter, rounded to the nearest whole number; q represents the ratio of distance covered by the flow meter to the number of revolutions, in meters/round, and is assumed to be 0.4 (Sánchez-Caballero et al. 2017); and r represents the radius of the trawl net opening, in meters.
2.3. Monthly Variation in Community Structure and Its Relationship to Environmental Factors
The species turnover rate reflects the changes in fish eggs and larvae species between different months (Jin et al. 2005), which was calculated as:
where E represents the species turnover rate, A represents the number of different species between months, and B represents the number of species that remain the same between months.
Cluster analysis and NMDS were performed using Primer 5.0 software to analyze changes in the community structure of fish eggs and larvae between months. The significance of differences between groups was tested using analysis of similarities (ANOSIM), and the reliability of NMDS results was tested using stress coefficients (Khalaf and Kochzius 2002; Crona et al. 2006). SIMPER analysis was used to identify the most important typical species within groups and the most important divergent species between groups based on the average dissimilarity contribution rate and the average similarity contribution rate (Clarke 1993).
The relationship between fish eggs or larvae communities and environmental factors was analyzed using the Mantel test for correlation analysis, based on the “linkET” package in R (Huang 2021). The dominant species and some important species of fish eggs and larvae during the survey period were selected as the early life stage fishery resources. The selected environmental factors included depth, SST, wet weight of zooplankton (WW), seawater surface salinity (SSS), seawater bottom temperature (SBT), seawater bottom salinity (SBS), and chlorophyll-a (Chl-a).
Additionally, constrained ordination analysis has been applied using Canoco 5.0 software to study how different species respond to changes in environmental conditions. During the months of May through August in 2021, distinct species matrices were independently compiled for fish eggs and larvae at each sampling station. Only species that occurred with a minimum occurrence frequency of 5% were included in the species matrices for these sampling periods. Prior to conducting the analysis, a log(x+1) transformation was implemented on the species matrices to fulfill the prerequisites of the analytical methods being used (Lopes et al. 2005). The environmental factors considered for analysis were SST, SBT, SSS, SBS, depth, and seawater surface Chl-a. A preanalysis procedure, where a log(x+1) transformation was applied to all variables, except for Chl-a (Flores and Barone 1998; Muylaert et al. 2000), was undertaken to ensure that the environmental data conformed to a normal distribution.
2.4. Modeling the Spawning Grounds of the Most Dominant Species, E. japonicus
E. japonicus was identified as the most dominant fish species, based on extensive surveys in the study area from 1959 to 2017 (Ruan 1984; Wan and Jiang 1998; Chen et al. 2004; Qiu et al. 2004; Chen et al. 2005; Zhao et al. 2005; Shan et al. 2014; Yu et al. 2020). Referencing the historical surveys, the details are presented in Table 1. This study focused on the records of E. japonicus eggs, specifically within the months of May to September, as a strategic choice to mitigate the variability associated with random sampling locations. Additionally, only one distribution record was retained within each grid cell (5ʹ×5ʹ, approximately 9.2 km×9.2 km) to minimize sampling bias and spatial autocorrelation among the distribution sites (Hijmans 2012; Boria RA et al. 2014). Subsequently, a binary dataset indicating species absence or presence (0–1 data) was compiled to facilitate model construction and to evaluate its predictive accuracy.
SDMs were developed to model the spawning grounds of E. japonicus (i.e., its egg distribution), using package Biomod2 in R program, while 10 types of modeling algorithms were explored, including Generalized Linear Model (GLM) (Hamada and Nelder 1997), Generalized Additive Model (GAM) (Hastie and Tibshirani 1990), Artificial Neural Network (ANN) (Yao, 1999), Maximum Entropy (Maxent) (Allouche et al. 2006), Classification Tree Analysis (CTA) (De'ath et al. 2000), Random Forest (RF) (Breiman. 2001), Flexible Discriminant Analysis (FDA) (Hastie and Tibshirani 1990), Gradient Boosting Machine (GBM) (Friedman 2002), Multivariate Adaptive Regression Splines (MARS) (De'ath et al. 2000), and Stepwise Regression Estimation (SRE) (Johnsson 1992). The performance of the 10 algorithms were determined through a five-fold cross-validation. Two common metrics, the area under the receiver operating characteristic curve (AUC) and the true skill statistics (TSS), were used to assess the accuracy of the models (Johnsson 1992; Allouche et al. 2006).
Nine environmental factors were considered as explainary variables for the SDMs, average seawater surface temperature (AMSST, °C), average seawater average chlorophyll-a concentration (Chl-a, mg/m3), average dissolved oxygen concentration (Oxy, mol/m3), average water depth (Depth, m), average offshore distance (Landis, Km), average sea surface pH (pH), average sea surface water velocity (Vel, m/s), and average primary productivity (Prip, g/m3/day). The spatial resolution of the environmental factors was consistent with the resolution of species distribution dataset (5ʹ×5ʹ). The Depth and Landis data were obtained from the Global Marine Environmental Dataset (http://gmed.auckland.ac.nz), while the other marine environmental data were obtained from the Bio-ORACLE v2.0 dataset (https://www.bio-oracle.org/).
For model prediction, current climatic conditions were represented by the average climate data from the years 2000 to 2014. Future environmental data include two time periods (2040–2050, 2090–2100) and four Representative Concentration Pathway (RCP) scenarios: RCP2.6, RCP4.5, RCP6.0, and RCP8.5. The data were sourced from the Bio-ORACLE v2.0 dataset, accessible at https://www.bio-oracle.org/. The study assumes that the Depth and Landis parameters within the research area will remain constant.
For model validation, this study adopted a variance inflation factor (VIF) cutoff at 4 (Kabacoff 2015), and set a condition number (κ) limit at 100, to address multicollinearity and ensure model accuracy. Additionally, the committee averaging approach was employed to integrate the selected models, and thus refine the predictive accuracy of all models and address their inherent limitations (Marmion et al. 2008; Hao et al. 2020). The habitat suitability range predicted by the models is from 0 to 1 000, where 0 represents the lowest probability of occurrence (i.e., 0), and 1000 represents the highest probability of occurrence (i.e., 1). Habitat suitability is graded into four levels based on predicted probabilities: 0–250 for low, 250–500 for moderate, 500–750 for high, and 750–1 000 for optimal habitats.
3. Results and Analysis
3.1. Composition, Dominant Species, Spatiotemporal Distribution of Fish Eggs and Larvae
From April to December 2021, seven surveys in Liaoning's Yellow Sea waters collected 71 202 fish eggs and 1 027 larvae. Among these, 36 fish species were identified, including 27 species of eggs and 17 species of larvae, belonging to 8 orders and 24 families. On the basis of the temperature preferences of the spawning adults, 18 species were classified as warm temperature (50.0%); 10 species were classified as warm water (27.8%); and eight species were classified as cold temperature (22.2%) (Table 2). With regard to the spawning types of the gravid fishes, 27 species were found to produce pelagic eggs (75%); six species produced adhesive eggs (16.7%); and three species were ovoviviparous (8.3%) (Table 2). From the temporal distribution of the early life stage fish resource species, the highest number of fish egg species was observed in May and June, while the highest number of larval fish species was observed in July. Throughout the period from April to December, E. japonicus eggs and larvae had the highest occurrence frequency (Table 3).
The spatial distribution of fish eggs (Figure 2) and larvae (Figure 3) varies with changes in SST and SSS. The density of fish eggs was low in April, peaking in May and June, primarily concentrated around the estuaries of the Yalu and Dayang Rivers. In July, fish eggs were concentrated from the Yalu River estuary to the Yingna River estuary, with a significant density decrease at the Dayang River estuary. In August, the spawning center shifted southward to the offshore area south of the Yalu River estuary and the southwestern waters of Zhangzi Island. After September, the density of fish eggs and larvae significantly decreased and tended to distribute more evenly. The distribution of larvae reached its annual peak in July, mainly concentrated in the Yalu River and Dayang River estuaries. After September, the density of both fish eggs and larvae significantly decreased and tended to distribute more evenly. The distribution of larvae reached its annual peak in July, mainly concentrated in the Yalu River and Dayang River estuaries. After September, the density of both fish eggs and larvae significantly decreased and tended to distribute more evenly.
3.2. Community Structure of Fish Eggs and Larvae and Their Environmental Correlation
During the study period, the species composition of fish eggs and larvae showed significant monthly variation (Table 4). Overall, the turnover rates for fish eggs and larvae exhibited a clear trend of change across different months. To further analyze, cluster analysis was conducted (Figure 4a), and the ANOSIM test results indicated significant differences among the groups (fish eggs: R=1, P<0.05; larvae: R=1, P<0.01). These results were consistent with the NMDS analysis (Figure 4b), with a stress value of less than 0.1(Bray et al. 1957). After SIMPER analysis (Clarke 1993), species with a similarity contribution rate and a dissimilarity contribution rate greater than 4% were selected as representative species and key distinctive species (Table 5).
The results of the Mantel test indicate significant correlations between the seven environmental factors and the dominant species of fish eggs and larvae (Figure 5). The CCA analysis (Braak 1986) shows that during the warming period from May to August, SST and SBS are important factors influencing the community structure of fish eggs (Figure 6a, P < 0.05), explaining 54.4% of the community variance. The CCA analysis for larvae reveals that WW is the main driving factor, accounting for 74.82% of the variance (Figure 6b). Additionally, the correlation coefficients between species and environmental factors in the CCA analysis exceed 0.60, indicating that the results effectively reveal the relationships between the abundance of fish eggs and larvae and the environmental factors.
3.3. E. japonicus Spawning Habitat Suitability Dynamics Across Climate Change Scenarios
The comprehensive review indicated that E. japonicus eggs were found at 76 distinct stations. By contrast, no evidence of these eggs was noted at six stations throughout the survey years. Ultimately, 54 distribution points for E. japonicus eggs were identified (Figure 7). These points were combined with six nonexistent points to form an absence-presence dataset (0-1 data), which was used for model construction and accuracy assessment. Finally, five environmental factors that have a considerable effect on the distribution of E. japonicus eggs in the northern Yellow Sea were selected for modeling analysis: AMSST, AMSSS, Depth, Landis, and Vel.
Among the 10 predictive models for E. japonicus spawning habitat suitability, all but the CTA model have proven to be highly effective. This study selected models based on criteria of Total Sum of Squares (TSS) over 0.4 and Area Under the Curve (AUC) over 0.7 to minimize prediction uncertainty. Consequently, ANN, FDA, GAM, GBM, GLM, MARS, Maxent, RF, and SRE were selected to construct an ensemble model for further analysis. The ensemble model had an average TSS of 0.666 and an AUC of 0.906.
Under the current climate scenario, environmental factors exert varying influences on the spawning habitat suitability for E. japonicus (Figure 8). Under the different climate scenario, the distribution proportions and average suitability of suitable habitats for E. japonicus spawning grounds are shown in Table 6. Under current climate conditions, the optimal suitable spawning grounds for E. japonicus are predominantly found situated north of 39°N, extends along the nearshore from 122.5°E to 124°E, specifically from the Yalu River Estuary to the Danyang and Yingna River Estuaries (Figure 9a). Under the RCP2.6 scenario, from 2040-2050, highly suitable habitats for anchovy spawning grounds show a trend of shifting from the coast towards the east (Figure 9b). In 2090-2100, there is little change compared to the 2050s (Figure 9f). Under the RCP4.5 scenario, habitat distribution from 2040-2050 is similar to that under RCP2.6 (Figure 9c). However, by 2090-2100, the area of highly suitable habitats decreases, and the average habitat suitability further declines compared to the 2050s (Figure 9g).Under the RCP6.0 scenario, from 2040-2050, highly suitable habitats expand eastward compared to current conditions (Figure 9d). By 2090-2100, the area of highly suitable habitats shrinks significantly, and average suitability also declines sharply compared to the 2050s (Figure 9h). Under the RCP8.5 scenario, from 2040-2050, the proportion of highly suitable habitats increases significantly compared to current conditions, although the average suitability slightly decreases (Figure 9e). By 2090-2100, medium and high suitability habitats dominate, with a small proportion of highly suitable areas and a notably low average suitability, showing a sharp decline compared to the 2050s (Figure 9i).
4. Discussion
4.1. Current Status of Early Life Stage Fish Community Structure in the Offshore Waters of Liaoning Province in the Yellow Sea
The early life stages of fish, such as fish eggs and larvae, are vital indicators of the brood fish population (Wan and Sun 2006). A comprehensive survey from 1985 to the present indicates that E. japonicus eggs and larvae have consistently been predominant in the coastal waters of Liaoning Province in the Yellow Sea (Wan and Jiang 1998; Wan and Sun 2006; Yu et al. 2020). This species dominates, especially during its peak spawning period in May and June, indicating stable spawning grounds in the area. Since the 1990s, the Yellow Sea has experienced substantial fishing pressure due to the widespread use of midwater trawling for E. japonicus, resulting in a notable decline in the species’ population, especially between 2010 and 2017 (Yu et al. 2020; Han et al. 2023). Since 2017, a strict seasonal fishing moratorium, implemented by national fisheries authorities from May 1 to September 1, has considerably aided the species' recovery by aligning with their primary spawning season. From 2017, surveys have documented a sharp rise in egg density, culminating in 2021 with record highs, signaling a notable rebound in early life stage of E. japonicus. The eggs and larvae of D. maruadsi, seldom documented in past studies, were first captured in the July 2021 survey. Predominantly located in the deeper waters south of the survey area, these findings coincide with the results of a bottom trawl survey. Between October and November, a notable population of zero-age D. maruadsi young was observed in the same sea area. These observations preliminarily confirm the existence of a spawning and nursery habitat for D. maruadsi along the southern coast of Ocean Island. By contrast, K. punctatus did not emerge as a primary species in the 2021 survey possibly due to its classification as an estuarine and bay-spawning species (Yu et al. 2020). The limited number of nearshore estuary survey stations in this investigation may have resulted in its infrequent collection. The survey data indicate substantial shifts in the early life stage fish species composition, with a noticeable transition from E. japonicus, K. punctatus, Scomberomorus niphonius, and S. japonicus in the late 20th century (Wan et al. 2004) to the current dominance of E. japonicus and H. otakii. A considerable downturn was observed in the early life stage presence of historically important economic species, such as S. niphonius and S. japonicus, with their occurrence rates falling well below previous highs. Moreover, the early life stage populations of Larimichthys polyactis and Trichiurus japonicus have not demonstrated a substantial recovery, indicating a continued conservation concern for these species.
4.2. Spatiotemporal Dynamics of Early Life Stage Fish Communities and Environmental Correlates in the Offshore Waters of Liaoning Province in the Yellow Sea
The survey revealed a distinct seasonal succession in fish egg and larval fish communities. While fish egg species showed similar composition and low turnover from July to September, and larval fish species were similar from May to July and August to September, other months exhibited considerable monthly turnover in fish egg and larval fish composition. The reasons are as follows: first, the occurrence of fish and the various stages of their life cycle are primarily controlled by physiological responses regulated by water temperature (Edwards and Richardson 2004). In their early life stages, fish lack the abilities to actively select external environment, with their distribution passively controlled by parental reproductive activities. Water temperature plays a key role in inducing gonadal development and inducing fish to spawn and reproduce (Van Der Kraak and Pankhurst 1996). Driven by water temperature variations, fish species with varying thermal preferences sequentially inhabit in the offshore waters of Liaoning Province in the Yellow Sea for spawning and reproduction. The typical species of the community reached their spawning periods in succession with the change in water temperature, spawning in the sea area alternately, thus forming the annual succession of fish egg and larval fish community structures.
In the distribution of early fish resources in marine areas, the low-temperature and dry season predominantly inhabits the nearshore areas with low salinity, typically around estuaries. Conversely, during the high-temperature, wet season, a discernible trend of migration toward the southern offshore regions is characterized by increased salinity. Adult fish choose breeding sites that boost offspring survival, aligning hatching with prey abundance over evolutionary time. This alignment results in an uneven spread of early life stage fish, shaped by prey density in specific regions (Wan et al. 2008). Salinity also serves as a critical hydrological factor influencing fish spawning activities and the concentration of early life history of fish resources. Its effect is especially pronounced near the geographical limits of spawning areas, often referred to as thermal thresholds. High (or low) SST paired with correspondingly high (or low) SSS is beneficial for boosting the potential for successful recruitment; conversely, a mismatch where high (or low) SST is coupled with low (or high) SSS can diminish the likelihood of successful fish recruitment (Piet 2002; Bian et al. 2016).
During the spring dry season of April and the months of May-June, when water temperatures are low, the distribution of fish eggs is closely related to the position of the tidal front (Vlymen 1977). Considering the distribution of tidal fronts, a clear characteristic is the SST cold water band. The bottom cold water is involved in transfrontal circulation and mixed with tide and wind actions to form surface cold water in the upper mixed layer, where the convergence and entrainment effects in the frontal zone are more likely to cause fish eggs to congregate and form dense patches (Alderdice and Forrester 1968; Vlymen 1977; Wei et al. 2003). Fish eggs aggregate at the cold-warm water interface in May-June, while high temperatures and rainfall in July-August create a coastal salinity gradient, prompting many fish to migrate offshore for improved spawning. A positive correlation between the egg distribution of the warm-temperate benthic fish C. joyneri with SBT and SBS were presented. The distribution of larvae S. japonica has been found to exhibit a significant positive correlation with SBT, a finding that corroborates the results of Zhang et al. (2019)
4.3. Response of Potential E. japonicus Spawning Grounds Under Different Climate Change Scenarios in the Offshore Waters of Liaoning Province in the Yellow Sea
Global warming is expected to exert diverse influences on the distribution of potential E. japonicus spawning habitats in the offshore waters of Liaoning Province in the Yellow Sea. The SDMs have revealed that the main environmental factors dictating the spatial distribution of potential E. japonicus spawning ground are Depth, the Landis, and the AMSST. Under the current climate scenario, the Depth within the range of 10–40 m and Landis beyond 0.3 km show a negative correlation with the habitat suitability, for potential E. japonicus spawning grounds. The AMSST between 12.7°C and 14°C is deemed optimal for the spawning grounds of E. japonicus, with coastal regions in the marine area showing a marked increase in habitat suitability. Under the condition where greenhouse gas emissions are controlled (RCP2.6 scenario), a continuous trend of expansion is observed in the distribution of potential E. japonicus spawning grounds within the marine area. With greenhouse gas emissions stabilized under the RCP4.5 and RCP6.0 scenarios, suitable E. japonicus spawning habitats may see a temporary expansion by the 2050s, yet the overall trend points toward a fluctuating decline. In the event of sustained high levels of greenhouse gas emissions (RCP8.5 scenario), the optimal spawning habitats for E. japonicus in the marine environment are at risk of disappearing, which would profoundly compromise the area’s importance as a key spawning ground for the species. Furthermore, across diverse climate change scenarios, the potential spawning grounds for anchovies in the marine environment exhibit a trend of expansion toward the eastern seaboard. Under the RCP6.0 scenario in the 2050s, new spawning grounds have been identified in the offshore waters south of the Yalu River estuary. The ongoing increase in sea surface salinity could be a pivotal factor driving this shift.
Data integrity is essential for ensuring the accuracy of model predictions (Molloy et al. 2017). In this study, some of the anchovy egg records are sourced from historical survey literature. Given the constraints of the marine survey station locations, survey frequencies, and intervals from previous investigations, obtaining high-precision records of the distribution of anchovy eggs is challenging. Consequently, the study employs model simulations to create synthetic pseudoabsence data. The model optimization process remains open to further enhancement. Implementing long-term, high-resolution surveys that encompass the full spawning season of E. japonicus is a potent strategy for remarkably elevating the quality of the data obtained.
5. Conclusions
The concentrated spawning period for fish species in the offshore waters of Liaoning Province in the Yellow Sea is from May to August, with a peak spawning period occurring between May and June. The primary spawning grounds are situated around the estuaries of the Dayang River and the Yalu River. Fish with different spawning habits and temperature preferences take turns using these waters as spawning or nursery grounds. In addition to the similar composition of fish egg species and a reduced rate of species turnover between July and September, and the similar composition of juvenile fish species and a reduced rate of species turnover between May and July and between August and September, a considerable monthly turnover in the composition of fish eggs and juvenile fish is observed in other months. Cold-temperate species such as P. herzensteini, H. otakii, K. bicoloratus, and A. personatus are the predominant early life stage resources from September to April spanning the autumn to early spring; E.japonicus is the main dominant species during the peak spawning period, with other early life stage resource species showing considerable monthly composition changes; the area also serves as a spawning and nursery ground for D. maruadsi. The integrated SDMs based on the Biomod2 framework can effectively predict the spatial distribution patterns of potential E. japonicus spawning grounds under different climate change scenarios in the offshore waters of Liaoning Province in the Yellow Sea. Depth, Landis, and AMSST are the main environmental factors influencing the spatial distribution of potential E. japonicus spawning grounds in this region. The spawning grounds of E. japonicus characterized by their coastal distribution characteristic, demonstrate varying degrees of extension toward the eastern side of the marine area, as influenced by four different climate change scenarios. They show a continuous expansion in the RCP2.6 scenario, fluctuating contractions in the RCP4.5 and RCP6.0 scenarios, and severe damage in the RCP8.5 scenario.
Author Contributions
Xuening Li (Co-first author 1): Conceptualization, Collection of sample, Formal analysis, Methodology, Validation, Investigation, Writing – original draft. Peidong Cui (Co-first author 2): Conceptualization, Code writing, Formal analysis, Methodology, Validation, Visualization, Writing – original draft. Xiaodong Bian: Data curation, Identifcation of sample, Fund acquisition, Project administration, Resources, Supervision, and Writing—review and editing. Ming Sun: Fund acquisition, Resources and Supervision. Xun Li: Participate in the original draft writing. Xilong Xu: Participate in the original draft writing.
Funding
This work was supported by the Natural Science Foundation of Shandong Province, China (No. ZR2022MD086), the National Natural Science Foundation of China (No. 41506168), the Special Financial Projects of the Ministry of Agriculture and Rural Affairs for the Survey and Monitoring of Fish Spawning Grounds in the Bohai Sea and Yellow Sea (No. C1250515), and the Taishan Industrial Experts Programme (No. tsls20231201).
Acknowledgments
The captain and chief engineer of the research vessels ‘Zhong Yu Ke 101/102’, as well as the entire crew, offered considerable support throughout the survey and sampling phase. This study could not have been carried out without the willing help of those who provided assistance with sample processing and analysis in field survey: Yuxuan Zhang and Huibin Wang. Also, the authors acknowledge the two anonymous reviewers who provided valuable reviews of the manuscript. Any fieldwork in this study complied with the current laws of Japan and China, where it was performed.
Appendix A. Supplementary Data
The scientific names of the species refer to the World Register of Marine Species (WoRMS, https://www.marinespecies.org/). The Depth and Landis data were obtained from the Global Marine Environmental Dataset (http://gmed.auckland.ac.nz), while the other marine environmental data were obtained from the Bio-ORACLE v2.0 dataset (https://www.bio-oracle.org/). The data were sourced from the Bio-ORACLE v2.0 dataset, accessible at https://www.bio-oracle.org/.
References
- Alderdice DF, Forrester CR (1968) Some effects of salinity and temperature on early development and survival of the English sole (Parophrys vetulus). J Fish Res Board Can 25(3): 495-521. [CrossRef]
- Allouche O, Tsoar A, Kadmon R (2006) Assessing the accuracy of species distribution models: prevalence, kappa and the true skill statistic (TSS); 1223-1232: J Appl Ecol 43(6). [CrossRef]
- Belkin IM (2009) Rapid warming of large marine ecosystems. Prog Oceanogr 81(1-4): 207-213. Bian XD, Zhang XM, Jin XS Wan RJ, Gao TX, Yamamoto J (2016) Interactive effects of incubation temperature and salinity on the early life stages of pacific cod Gadus macrocephalus. Deep Sea Res Part II 124: 117-128. 207-213: Prog Oceanogr 81(1-4). [CrossRef]
- Boria RA, Olson LE, Goodman SM, Anderson RP (2014) Spatial filtering to reduce sampling bias can improve the performance of ecological niche models; 73-77: Ecol Modell 275. [CrossRef]
- Braak C (1986) Canonical correspondence analysis: a new eigenvector technique for multivariate direct gradient analysis; 1167-1179: Ecol 67. [CrossRef]
- Bray JR, Curtis JT (1957) An ordination of the upland forest communities of southern Wisconsin; 326-349: Ecol Monogr 27(4). [CrossRef]
- Breiman, L. Random Forests. Machine Learning 45, 5–32 (2001). [CrossRef]
- Chen JF, Xin FY, Cui Y, Lü RH, Wang J, Wan RJ (2005) Biological resources habitat; Jin XS, Zhao XY, Meng TX, Cui Y (eds) Biological resources and habitat of the Yellow and Bohai Sea. Scientific Publishers, Beijing: In; pp. 110–126.
- Chen JF, Zhang YS, Liu HY, Sun JM (2004) Temporal and spatial variations in water temperature; Cheng J S (ed) Ecological environment and biological communities in the Coastal Waters of the Yellow Sea and Bohai Sea. Ocean Press, Beijing: In; pp. 11–16.
- Clarke KR (1993) Non-parametric multivariate analyses of changes in community structure. 117-143: Aust J Ecol 18(1). [CrossRef]
- Correa GM, Hurst TP, Stockhausen WT, Ciannelli L, Kristiansen T, Pilcher DJ (2024) Modeling the larval growth and survival of Pacific cod (Gadus macrocephalus) in the eastern Bering Sea. Prog Oceanog 225: 103282. [CrossRef]
- Crona BI, Holmgren S, Rönnbäck P (2006) Re-establishment of epibiotic communities in reforested mangroves of Gazi Bay Kenya; 527-538: Wetl Ecol Mana 14. [CrossRef]
- Cui PD, Bian XD, Zhang YX, Shan XJ, Jin XS, Wang HB (2024) Distribution patterns and influencing factors of Engraulis japonicus spawning grounds in offshore waters of the Liaoning Province in the North Yellow Sea. Prog Fish Sci 45(3): 31-45. [CrossRef]
- Cui Y, Wang AZ, Liu HY Xin FY (2004) Spatial and temporal variations in reactive phosphate; Cheng JS (ed) Ecological environment and biological communities in the Coastal Waters of the Yellow Sea and Bohai Sea. Ocean Press, Beijing: In; pp. 68–75.
- De'ath G, Fabricius KE (2000) Classification and regression Trees: a powerful yet simple technique for ecological data analysis; 3178-3192: Ecol 81(11). [CrossRef]
- Dong J, Liu XZ, Wang AY (2018) Fishery Resources in Coastal and Estuarine Waters of Liaoning, Beijing, pp 103-138 (in Chinese).
- Edwards M, Richardson A (2004) Impact of climate change on marine pelagic phenology and trophic mismatch; 881-884: Nature 430. [CrossRef]
- Flores LN, Barone R (1998) Phytoplankton dynamics in two reservoirs with different trophic state (Lake Rosamarina and Lake Arancio, Sicily, Italy); 163-78: Hydrobiologia 369. [CrossRef]
- Friedman JH (2002) Stochastic gradient boosting. Comput Stat Data Anal 38: 367-378. [CrossRef]
- Hamada M, Nelder JA (1997) Generalized linear models for quality-improvement experiments; 292-304: J Qual Technol 29(3). [CrossRef]
- Han QP, Shan XJ, Gorfine H, Jin XS (2023) Recruitment of Engraulis japonicus and its environmental drivers: An EDM analysis. Prog Oceanogr 219: 103143. [CrossRef]
- Hao T, Elith J, Lahoz-Monfort JJ, Guillera-Arroita G (2020) Testing whether ensemble modelling is advantageous for maximising predictive performance of species distribution models; 549-558: Ecography 43(4). [CrossRef]
- Hastie TJ, Tibshirani RJ (1990) Generalized additive models, 1st edn. Chapman & Hall, New York.
- Hijmans RJ (2012) Cross-validation of species distribution models: removing spatial sorting bias and calibration with a null model; 679-688: Ecol 93(3). [CrossRef]
- Howard RA, Rogers LA, Kearney KA, Vary LL, Ciannelli L (2024) Projecting marine fish distributions during early life stages under future climate scenarios; 733-749: Fish Fish 25(4). [CrossRef]
- Huang HY (2021). linkET: Everything is Linkable. R package version 0.0.3.
- Hutchings JA, Reynolds JD (2004) Marine fish population collapses: consequences for recovery and extinction risk; 297-309: Biosci 54(4). [CrossRef]
- Jin XS, Meng TX, Zhao XY (2005) Types and quantities of fishery resources; Jin XS, Zhao XY, Meng TX, Cui Y (eds) Biological resources and habitat of the Yellow and Bohai Sea. Scientific Publishers, Beijing: In; pp. 144–162.
- Jin XS, Tang QS (1996) Changes in fish species diversity and dominant species composition in the Yellow Sea; 337-352: Fish Res 26(3-4). [CrossRef]
- Johnsson T (1992) A procedure for stepwise regression analysis. Stat Pap 33:21–29. [CrossRef]
- Jung JH, Moon SY, Park JH, Han KH, Kim C (2024) Spatiotemporal distribution and feeding ecology of the brown croaker (Miichthys miiuy) in the southwestern sea of Korea. Environ Biol Fish Nov 26: 1-21. [CrossRef]
- Kabacoff RI (2015) R in action: data analysis and graphics with R, 2nd edn. Manning Publications, New York, pp171-181.
- Khalaf MA, Kochzius M (2002) Changes in trophic community structure of shore fishes at an industrial site in the Gulf of Aqaba Red Sea; 287-299: Mar Ecol Prog Ser 239. [CrossRef]
- Lin F, Asplin L, Budgell WP, Wei H, Fang JG (2019) Currents on the northern shelf of the Yellow Sea; 100821: Reg Stud Mar Sci 32. [CrossRef]
- Lopes MRM, Bicudo CEDM, Ferragut MC (2005) Short term spatial and temporal variation of phytoplankton in a shallow tropical oligotrophic reservoir southeast Brazil; 235-247: Hydrobiologia, 542. [CrossRef]
- Marmion M, Parviainen M, Luoto M,Heikkinen RK, Thuiller W (2008) Evaluation of consensus methods in predictive species distribution modelling; 59-69: Divers Distrib 15(1). [CrossRef]
- Martinez S, Belcher M, Haak C, Kennedy C, Koske A, Stormer D, Terkanian K, Juanes F (2012) Bruce S; 371-373: Miller and Arthur W. Kendall, Jr.: Review of “Early life history of marine fishes”. Rev Fish Biol Fish 22. [CrossRef]
- Molloy SW, Davis RA, Dunlop JA, Etten EJBV (2017) Applying surrogate species presences to correct sample bias in species distribution models: a case study using the Pilbara population of the Northern Quoll; 12235: Nat Commun18. [CrossRef]
- Muylaert K, Sabbe K, Vyverman W (2000) Spatial and temporal dynamics of phytoplankton communities in a freshwater tidal estuary (Schelde Belgium); 673-687: Estuarine Coastal Shelf Sci 50(5). [CrossRef]
- Nielsen JM, Rogers LA, Brodeur RD, Thompson AR, Auth TD, Deary AL, Duffy-Anderson JT, Galbraith M, Anthony Koslow J, Ian Perry R (2021) Responses of ichthyoplankton assemblages to the recent marine heatwave and previous climate fluctuations in several Northeast Pacific marine ecosystems; 506-520: Global Change Biol 27(3). [CrossRef]
- Pattrick P, Strydom N, Harris L, Goschen W (2016) Predicting spawning locations and modelling the spatial extent of post hatch areas for fishes in a shallow coastal habitat in South Africa; 223-235: Mar Ecol Prog Ser 560. [CrossRef]
- Piet GJ (2002) Using external information and GAMs to improve catch-at-age indices for North Sea plaice and sole; 624-632: ICES J Mar Sci 59(3). [CrossRef]
- Pinkas L, Oliphant MS, Iverson ILK (1971) Food habits of albacore, bluefin tuna, and bonito California Waters. Fish Bull 152: 1-105. https://escholarship.org/uc/item/7t5868rd.
- Qiu SY, Li PJ, Cheng JS, Liu HY, Zhang ZW, Yang JM (2004) The structure of biological resource communities; Cheng JS (ed) Ecological environment and biological communities in the coastal waters of the Yellow Sea and Bohai Sea. Ocean Press, Beijing: In; pp. 239–244.
- Ruan HC (1984) Studies on the eggs and larvae of Engraulis japonicus. Stud Mar Sin 22(3): 30-56.
- Samset BH, Zhou C, Fuglestvedt JS, Lund MT, Marotzke J, Zelinka MD (2023) Steady global surface warming from 1973 to 2022 but increased warming rate after 1990; 400: Commun Earth Environ 4. [CrossRef]
- Sánchez-Caballero CA, Borges-Souza JM, De La Cruz-Agüero G, Ferse SCA (2017) Links between fish community structure and habitat complexity of a rocky reef in the Gulf of California threatened by development: implications for mitigation measures; 96-106: Ocean Coast Manag 137. [CrossRef]
- Shan XJ, Jin XS, Wu Q, Wan RJ, Chen YL, Bian XD, Sun PF (2014) Fishery resource structure; Jin XS (ed) Basis and prospects for enrichment of fishery resources in the Yellow Bohai Sea. Scientific Publishers, Beijing: In; pp. 57–74.
- Stige LC, Rogers LA, Neuheimer AB, Hunsicker ME, Yaragina NA, Ottersen G, Ciannelli L, Langangen Ø, Durant JM (2019) Density-and size-dependent mortality in fish early life stages; 962-976: Fish Fish 20(5). [CrossRef]
- Sun RL, Sun P, Yu HQ Ju PL, Ma SY, Liang ZL, Heino M, Shin Y, Barrier N, Tian YJ (2024) Exploring fishing impacts on the structure and functioning of the Yellow Sea ecosystem using an individual-based modeling approach; 103946: J Mar Syst 242. [CrossRef]
- Van Der Kraak G, Pankhurst NW (1996) Temperature effects on the reproductive performance of fish; implications for freshwater and marine fish, Society for experimental biology seminar series 61. Cambridge University Press, Cambridge: In: MacDonald DG, Wood CM (eds) Global warming; pp. 159–176.
- Vanhatalo J, Veneranta L, Hudd R (2012) Species distribution modeling with Gaussian processes: A case study with the youngest stages of sea spawning whitefish (Coregonus lavaretus L. s.l.) larvae. Ecol Modell 228: 49-58. [CrossRef]
- Vlymen WJ (1977) A mathematical model of the relationship between larval anchovy (Engraulis mordax) growth prey microdistribution, and larval behavior. Environ Biol Fishes 2: 211-233. [CrossRef]
- Wan RJ, Cheng JS, Chen JQ (2004) Sustainable utilisation of biological resources in the Nearshore Waters of the Yellow Bohai Sea; Cheng JS (ed) Ecological environment and biological communities in the coastal waters of the Yellow Sea and Bohai Sea. Ocean Press, Beijing: In; pp. 386–388.
- Wan RJ, Jiang YW (1998) Studies on the ecology of eggs and larvae of osteichthyes in the Yellow Sea; 60-73: Marine Fish Res 19(1).
- Wan RJ, Sun S (2006) The category composition and abundance of ichthyoplankton in the ecosystem of the Yellow Sea and the East China Sea; 28-44: Acta Zool Sin 52(1). [CrossRef]
- Engraulis japonicus in the spawning ground of the Southern Shandong Peninsula∗Ⅰ, Abundance and distribution characters of the Engraulis japonicus; 35-47: eggs and larvae. Acta Zool Sin 54(5).
- Wan RJ, Zhang PC, Li PJ, Li PJ, Qiu SY (2004) Fish eggs and larvae and their ecological characteristics; Cheng JS (ed) Ecological environment and biological communities in the Coastal Waters of the Yellow Sea and Bohai Sea. Ocean Press, Beijing: In; pp. 346–367.
- Wang M, Guo JR, Song J, Fu YZ, Sui WY, Li YQ, Zhu ZM, Li S, Li LL, Guo XF, Zuo WT (2020) The correlation between ENSO events and sea surface temperature anomaly in the Bohai Sea and Yellow Sea; 101228: Reg Stud Mar Sci 35. [CrossRef]
- Wei H, Su J, Wan RJ, Wang L, Lin YA (2003) Tidal front and the convergence of anchovy (Engraulis japonicus) eggs in the Yellow Sea. Fish Oceanogr 12(4-5): 434-442. [CrossRef]
- Wo J, Zhang CL, Pan XJ, Xu BD, Xue Y, Ren YP (2020); 524463: Modeling the dynamics of multispecies fisheries: A case study in the coastal water of North Yellow Sea, China. Front Mar Sci 7. [CrossRef]
- Wu JH, Wang ZH, Tian JS, Wang K, Li A, Li N, Song L, Song GD (2024) Comparison of nutrients status in Liaodong Bay and Northern Yellow Sea, China: Controlling factors and nutrient budgets; 106338: Mar Environ Res 194. [CrossRef]
- Yao X (1999) Evolving artificial neural networks. P IEEE 87(9): 1423-1447. [CrossRef]
- Yu HQ, Yu HM, Ito SI, Tian YJ, Wang H, Liu Y, Xing QW, Bakun Kelly RM (2020) Potential environmental drivers of Japanese anchovy (Engraulis japonicus) recruitment in the Yellow Sea. J Mar Syst 212: 103431. [CrossRef]
- Zhang H, Li Y, Jiang C (2022) Editorial: biological and ecological studies on marine ichthyoplankton. Front Mar Sci 9:948521. [CrossRef]
- Zhang ZX, Xu SY, Capinha C, Weterings R, Gao TX (2019) Using species distribution model to predict the impact of climate change on the potential distribution of Japanese whiting Sillago japonica. Ecol Indic 104: 333-340. [CrossRef]
- Zhao XY, Meng TX, Cui Y (2005) Methods of investigation and research; Jin XS, Zhao XY, Meng TX, Cui Y (eds) Biological resources and habitat of the Yellow and Bohai Sea. Scientific Publishers, Beijing: In; pp. 1–20.
Figure 1.
The sampling stations in offshore waters of the Liaoning Province in the north Yellow Sea.
Figure 1.
The sampling stations in offshore waters of the Liaoning Province in the north Yellow Sea.
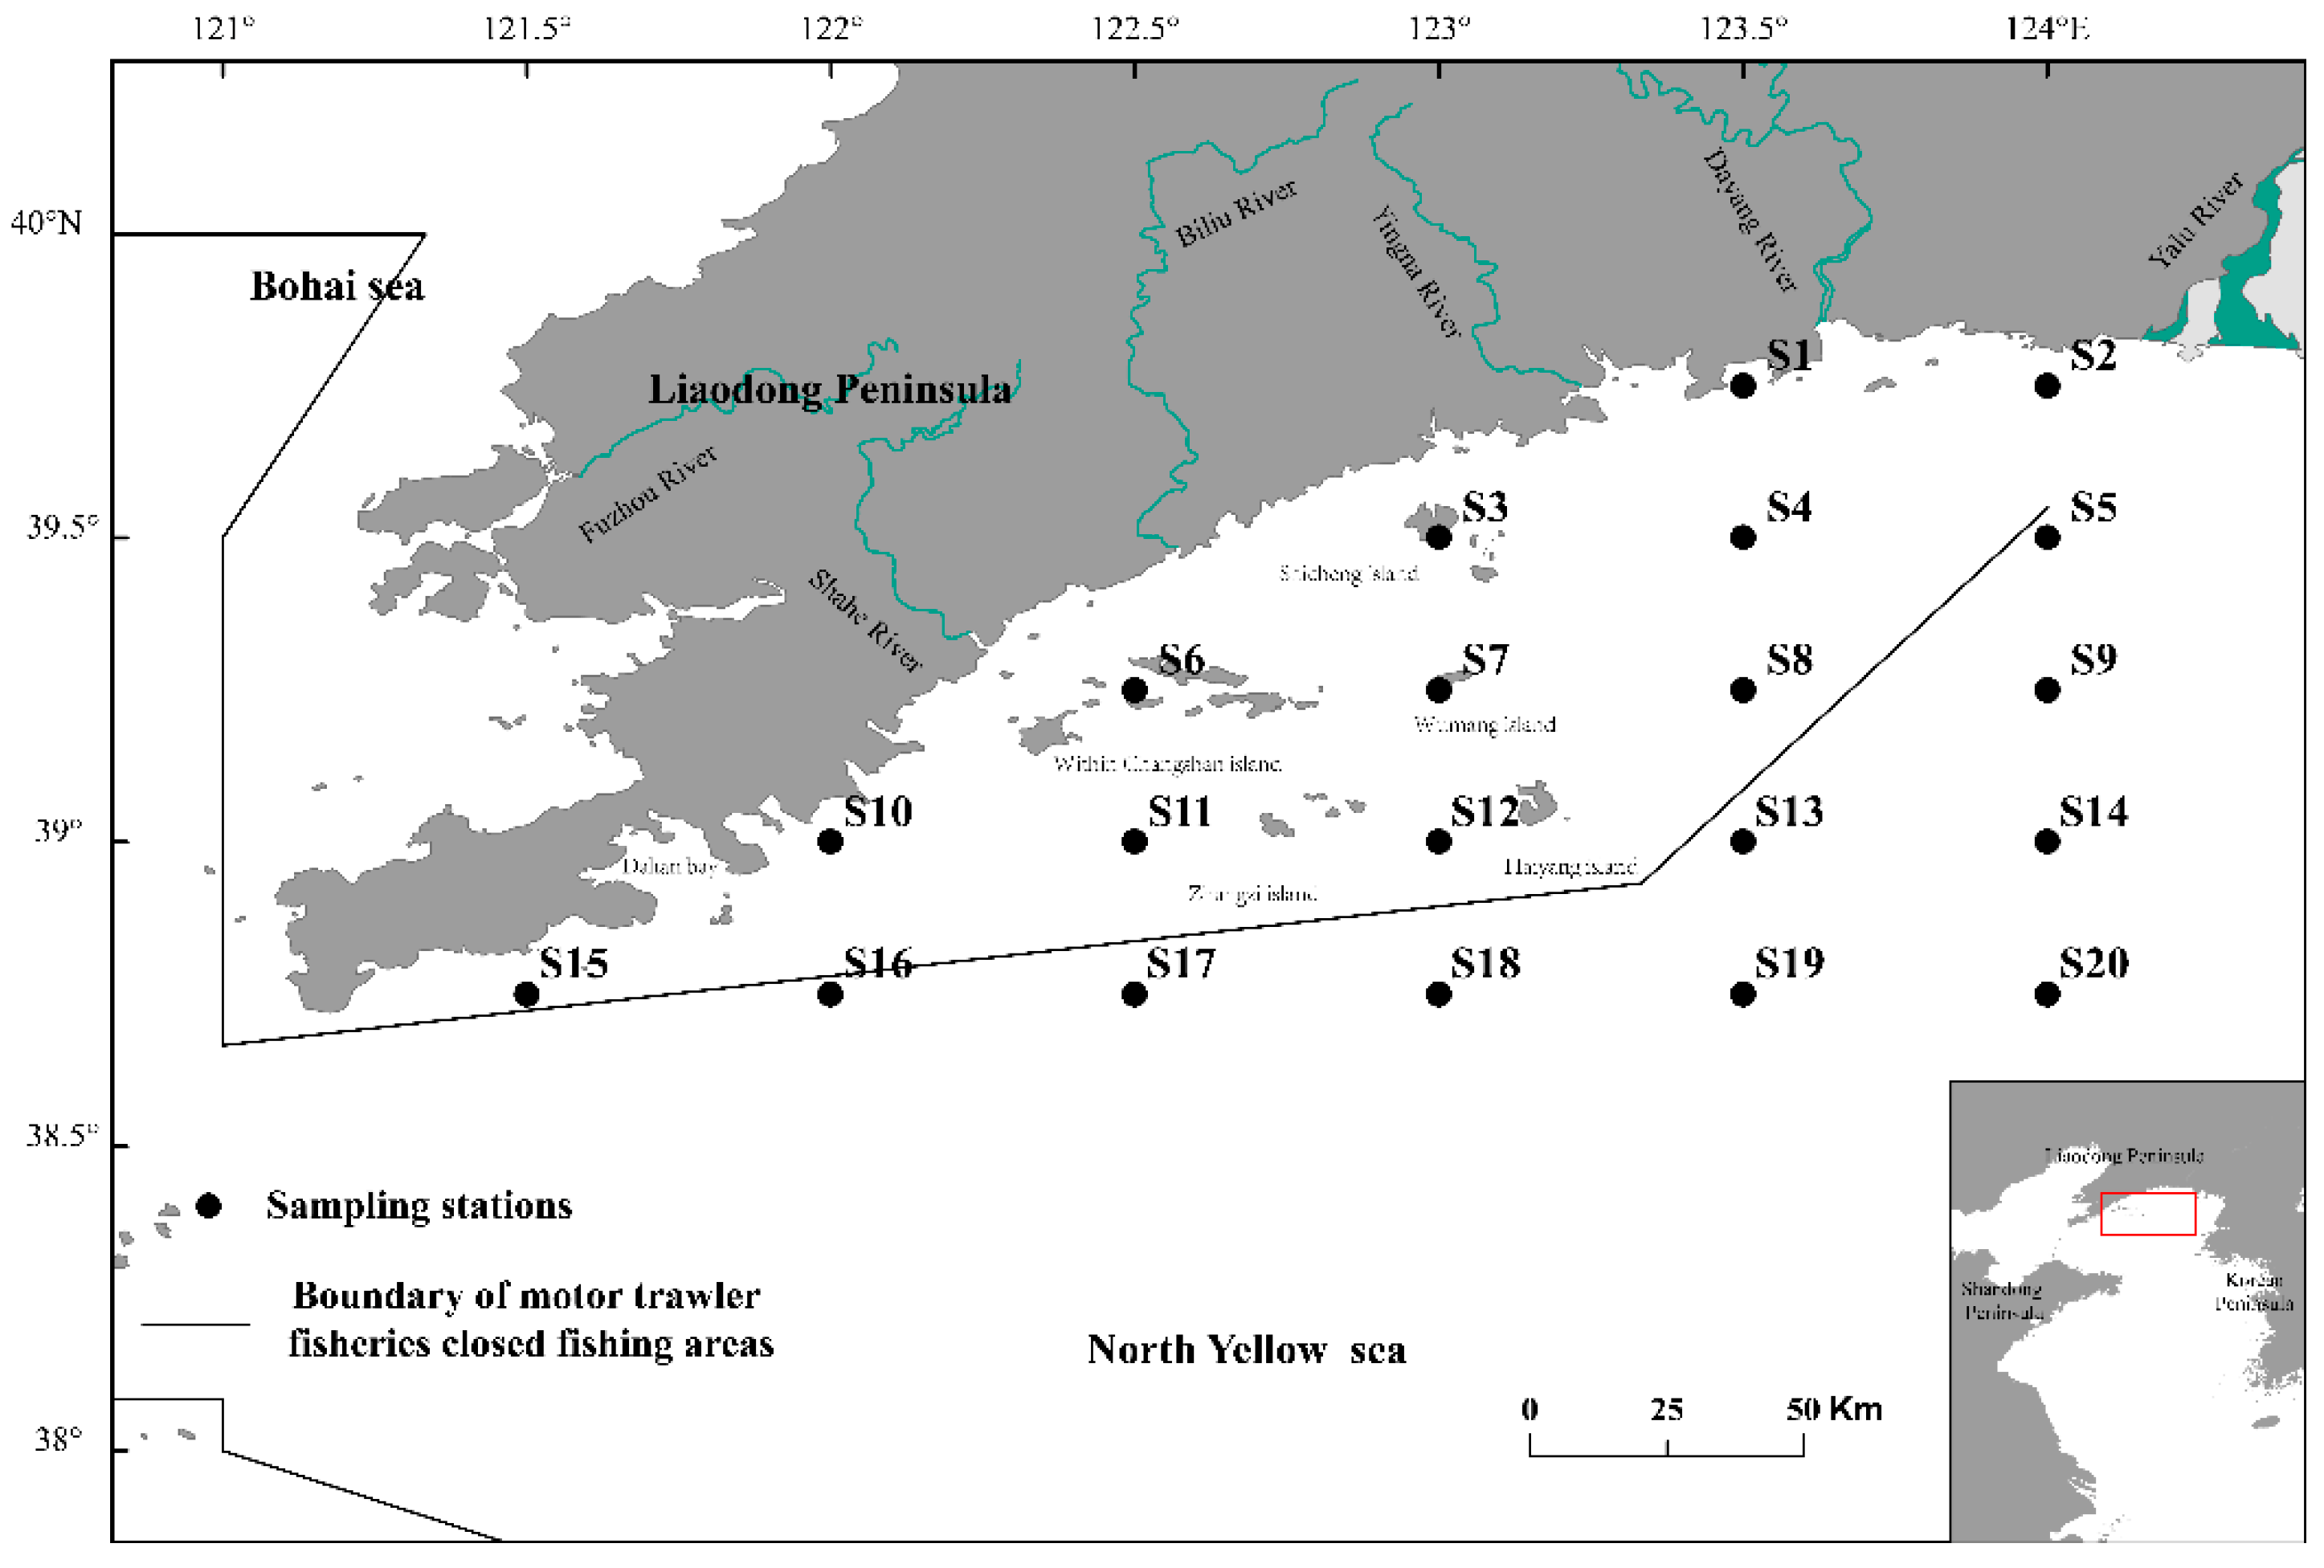
Figure 2.
Fish egg density and its monthly variation with SST and SSS in offshore waters of the Liaoning Province in the Yellow Sea from April to December 2021 (a, h April; b, i May and June; c, j July; d, k August; e, l September; f, m October to November; g, n December).
Figure 2.
Fish egg density and its monthly variation with SST and SSS in offshore waters of the Liaoning Province in the Yellow Sea from April to December 2021 (a, h April; b, i May and June; c, j July; d, k August; e, l September; f, m October to November; g, n December).
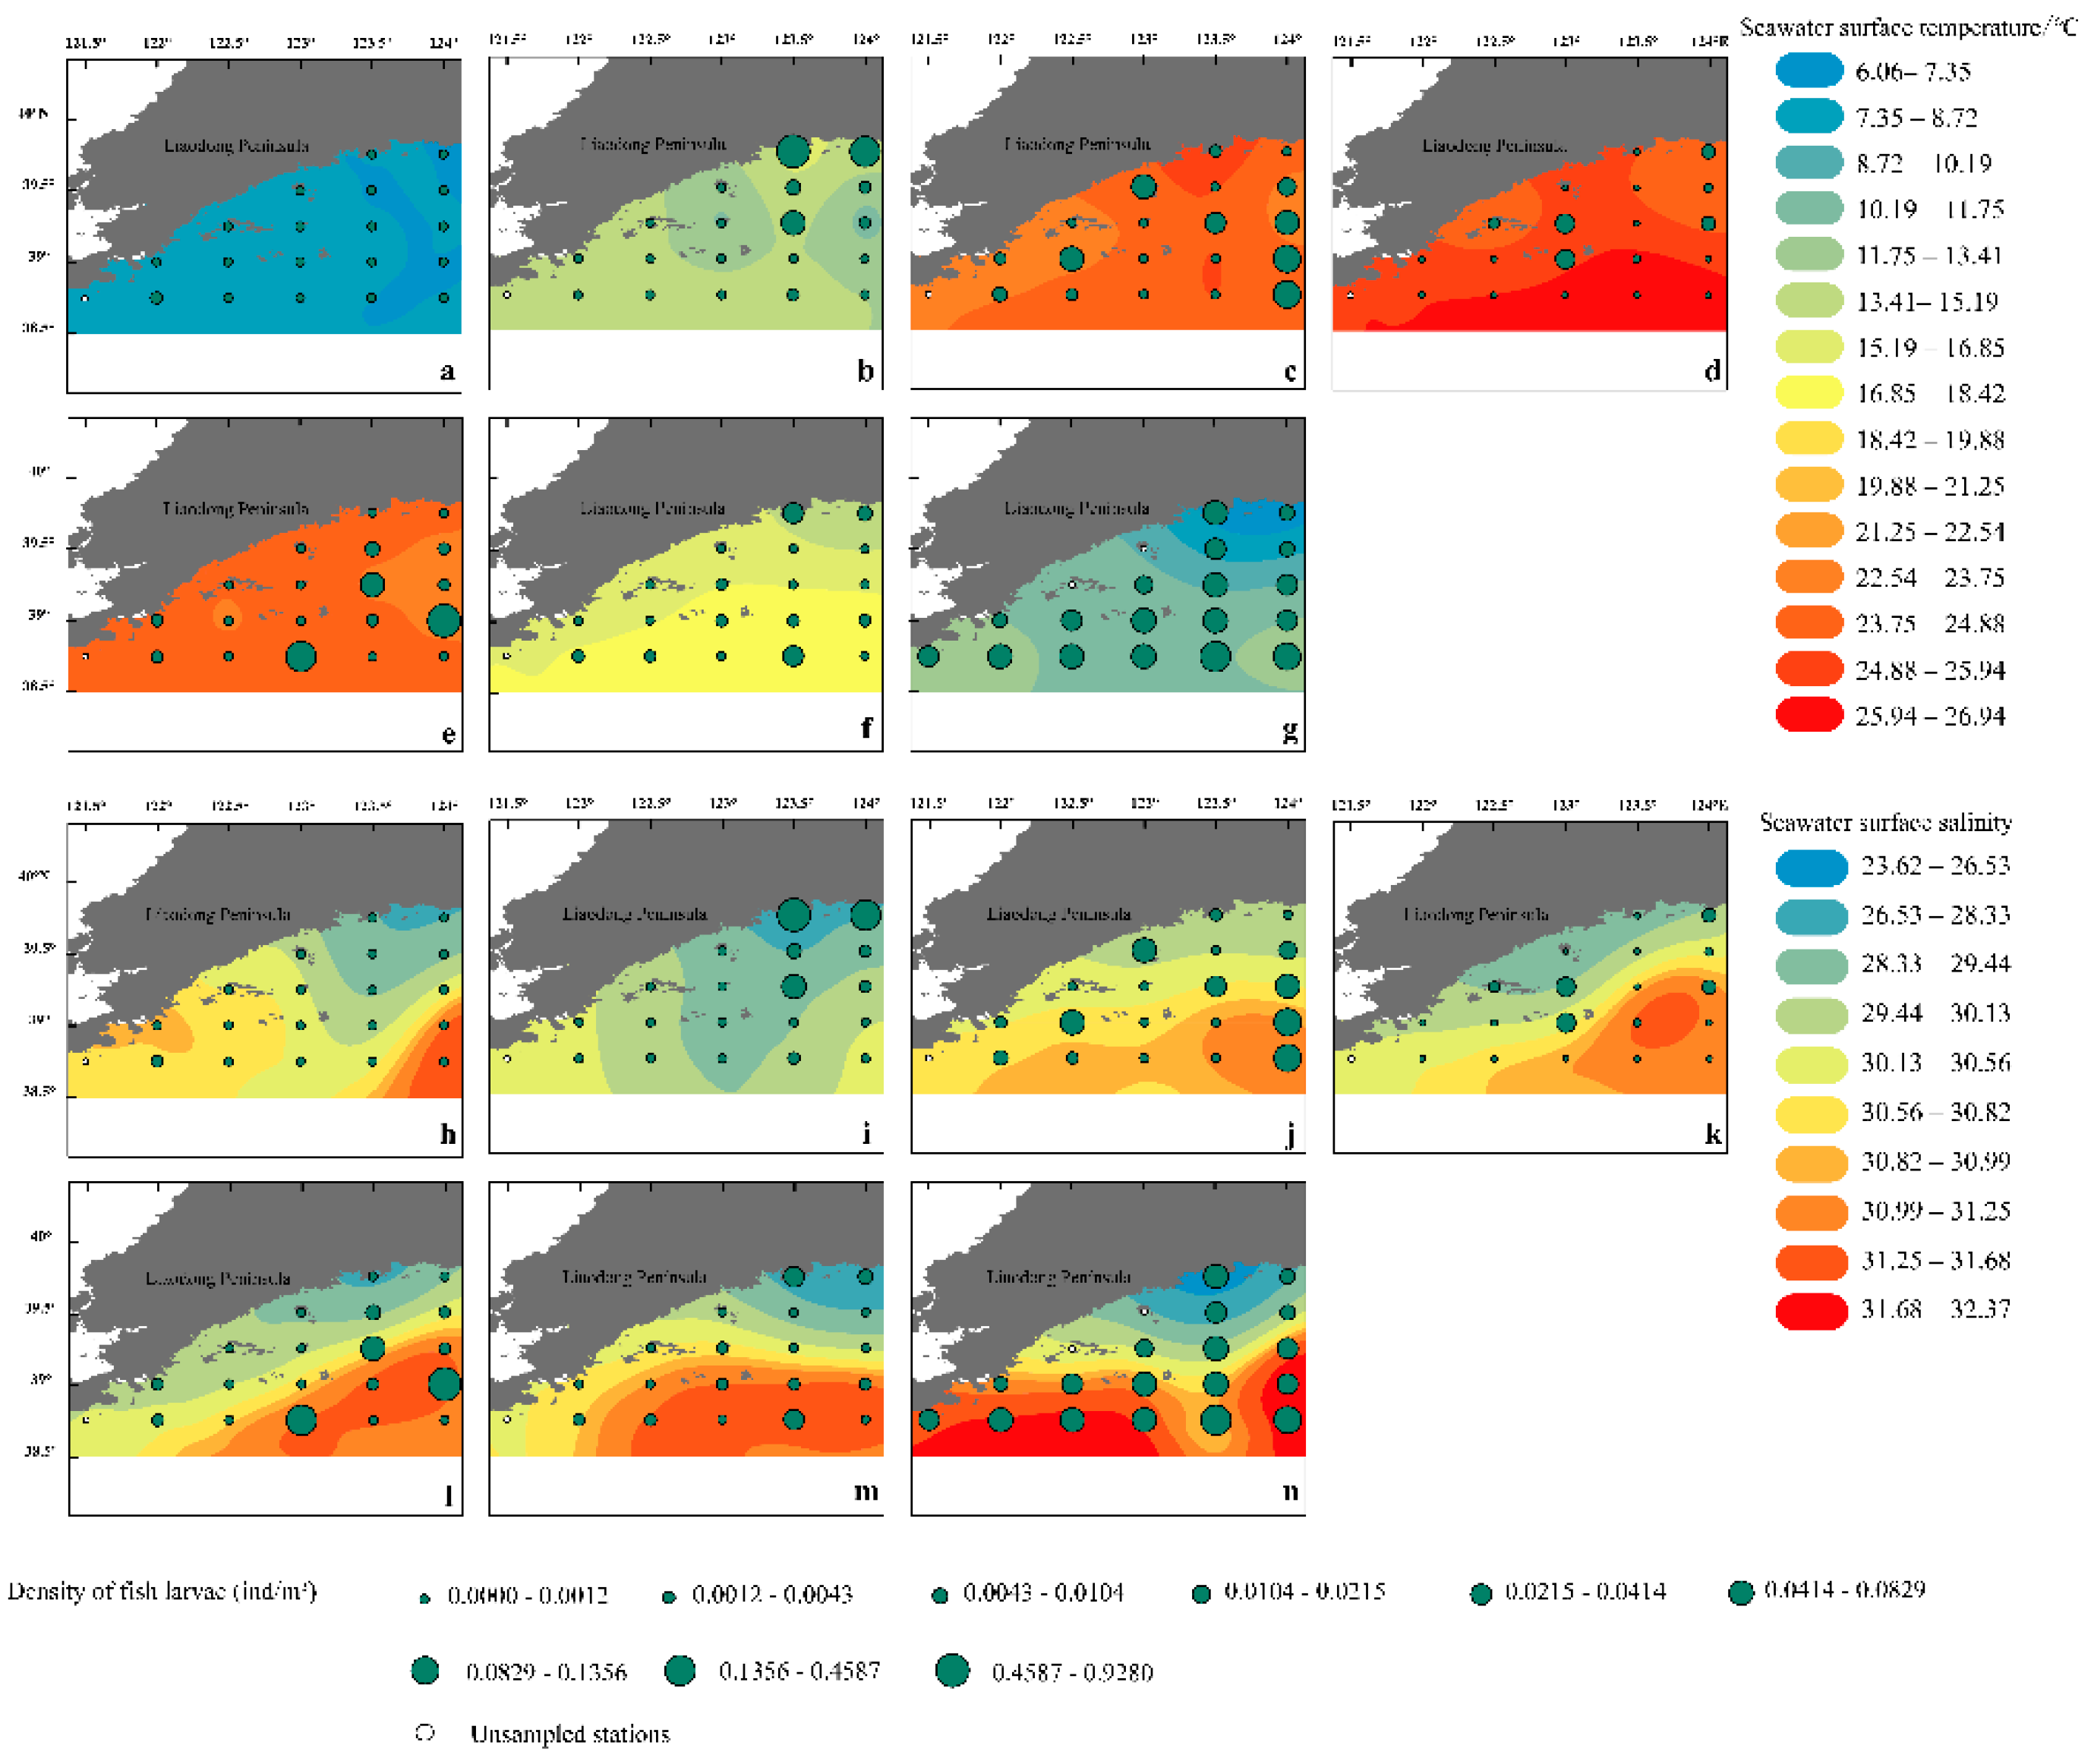
Figure 3.
Fish larvae density and its monthly variation with SST (a to g) and SSS (h to n) in offshore waters of the Liaoning Province in the Yellow Sea from April to December 2021 (a, h April; b, i May and June; c, j July; d, k August; e, l September; f, m October to November; g, n December).
Figure 3.
Fish larvae density and its monthly variation with SST (a to g) and SSS (h to n) in offshore waters of the Liaoning Province in the Yellow Sea from April to December 2021 (a, h April; b, i May and June; c, j July; d, k August; e, l September; f, m October to November; g, n December).
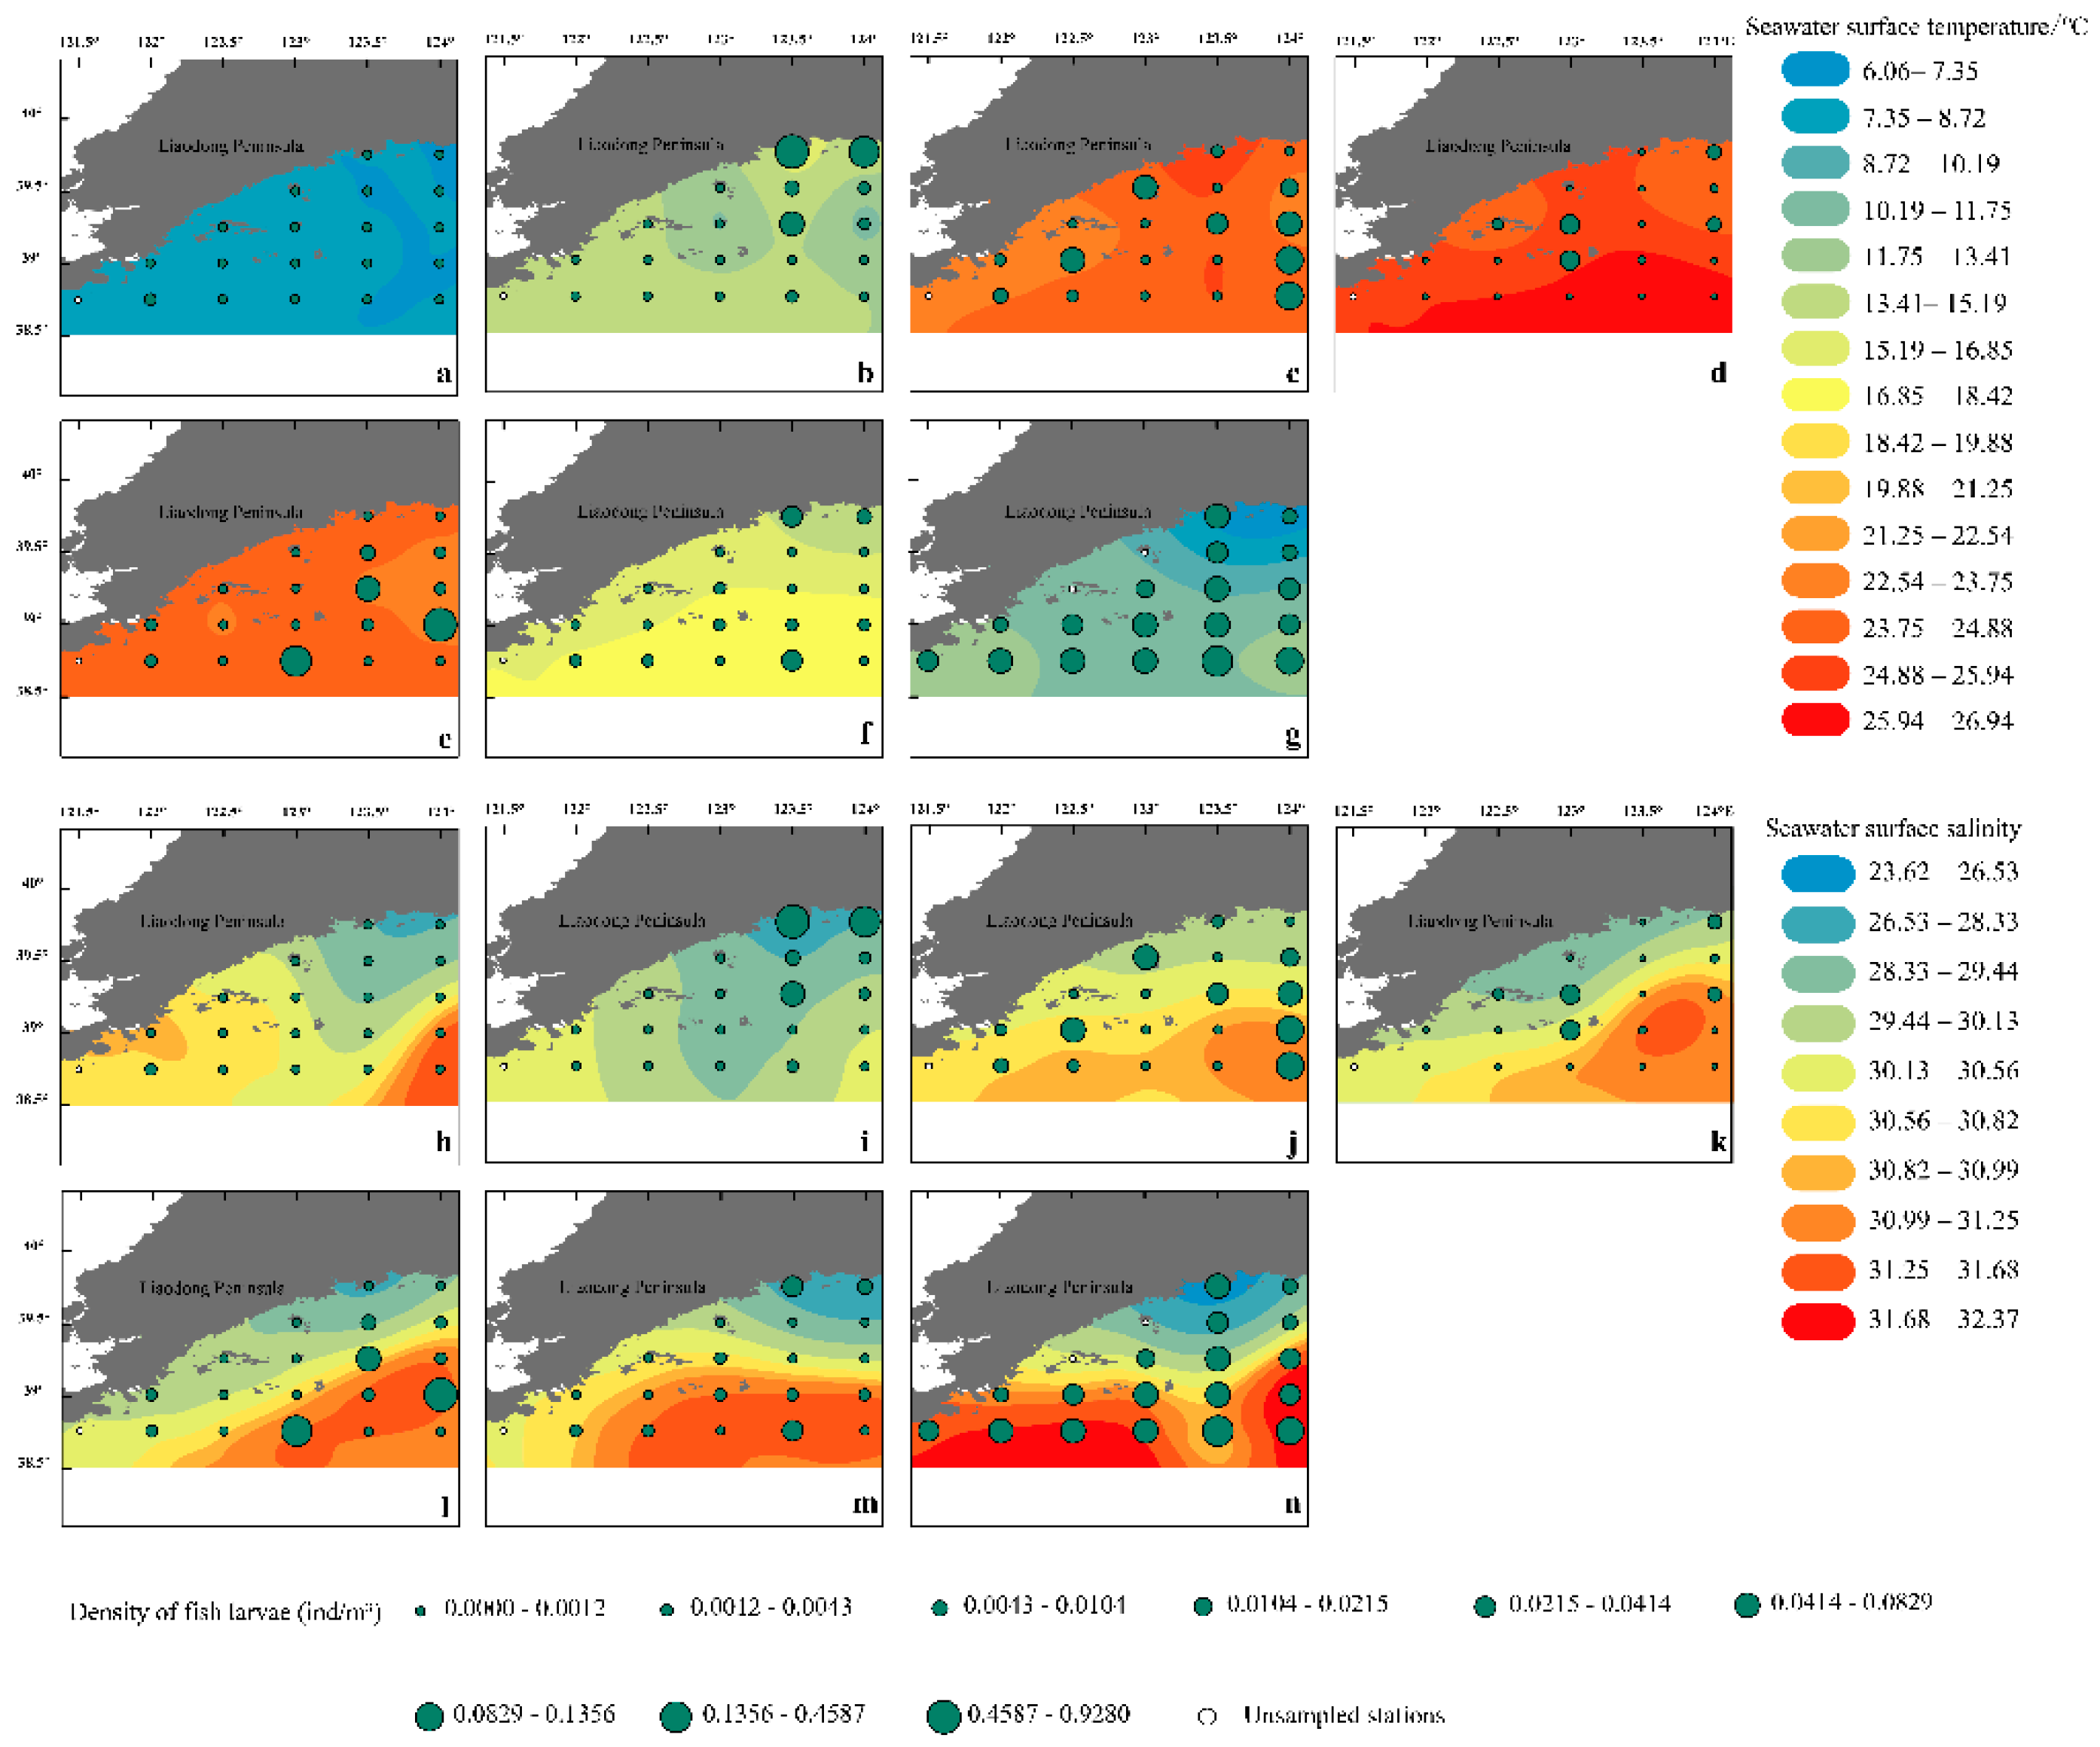
Figure 4.
Monthly scale clustering diagram (a, c) and NMDS ordination diagram (b, d) of fish eggs and larvae from April to December 2021 (a, b Based on the abundance of fish eggs; c, d Based on abundance the of fish larvae).
Figure 4.
Monthly scale clustering diagram (a, c) and NMDS ordination diagram (b, d) of fish eggs and larvae from April to December 2021 (a, b Based on the abundance of fish eggs; c, d Based on abundance the of fish larvae).
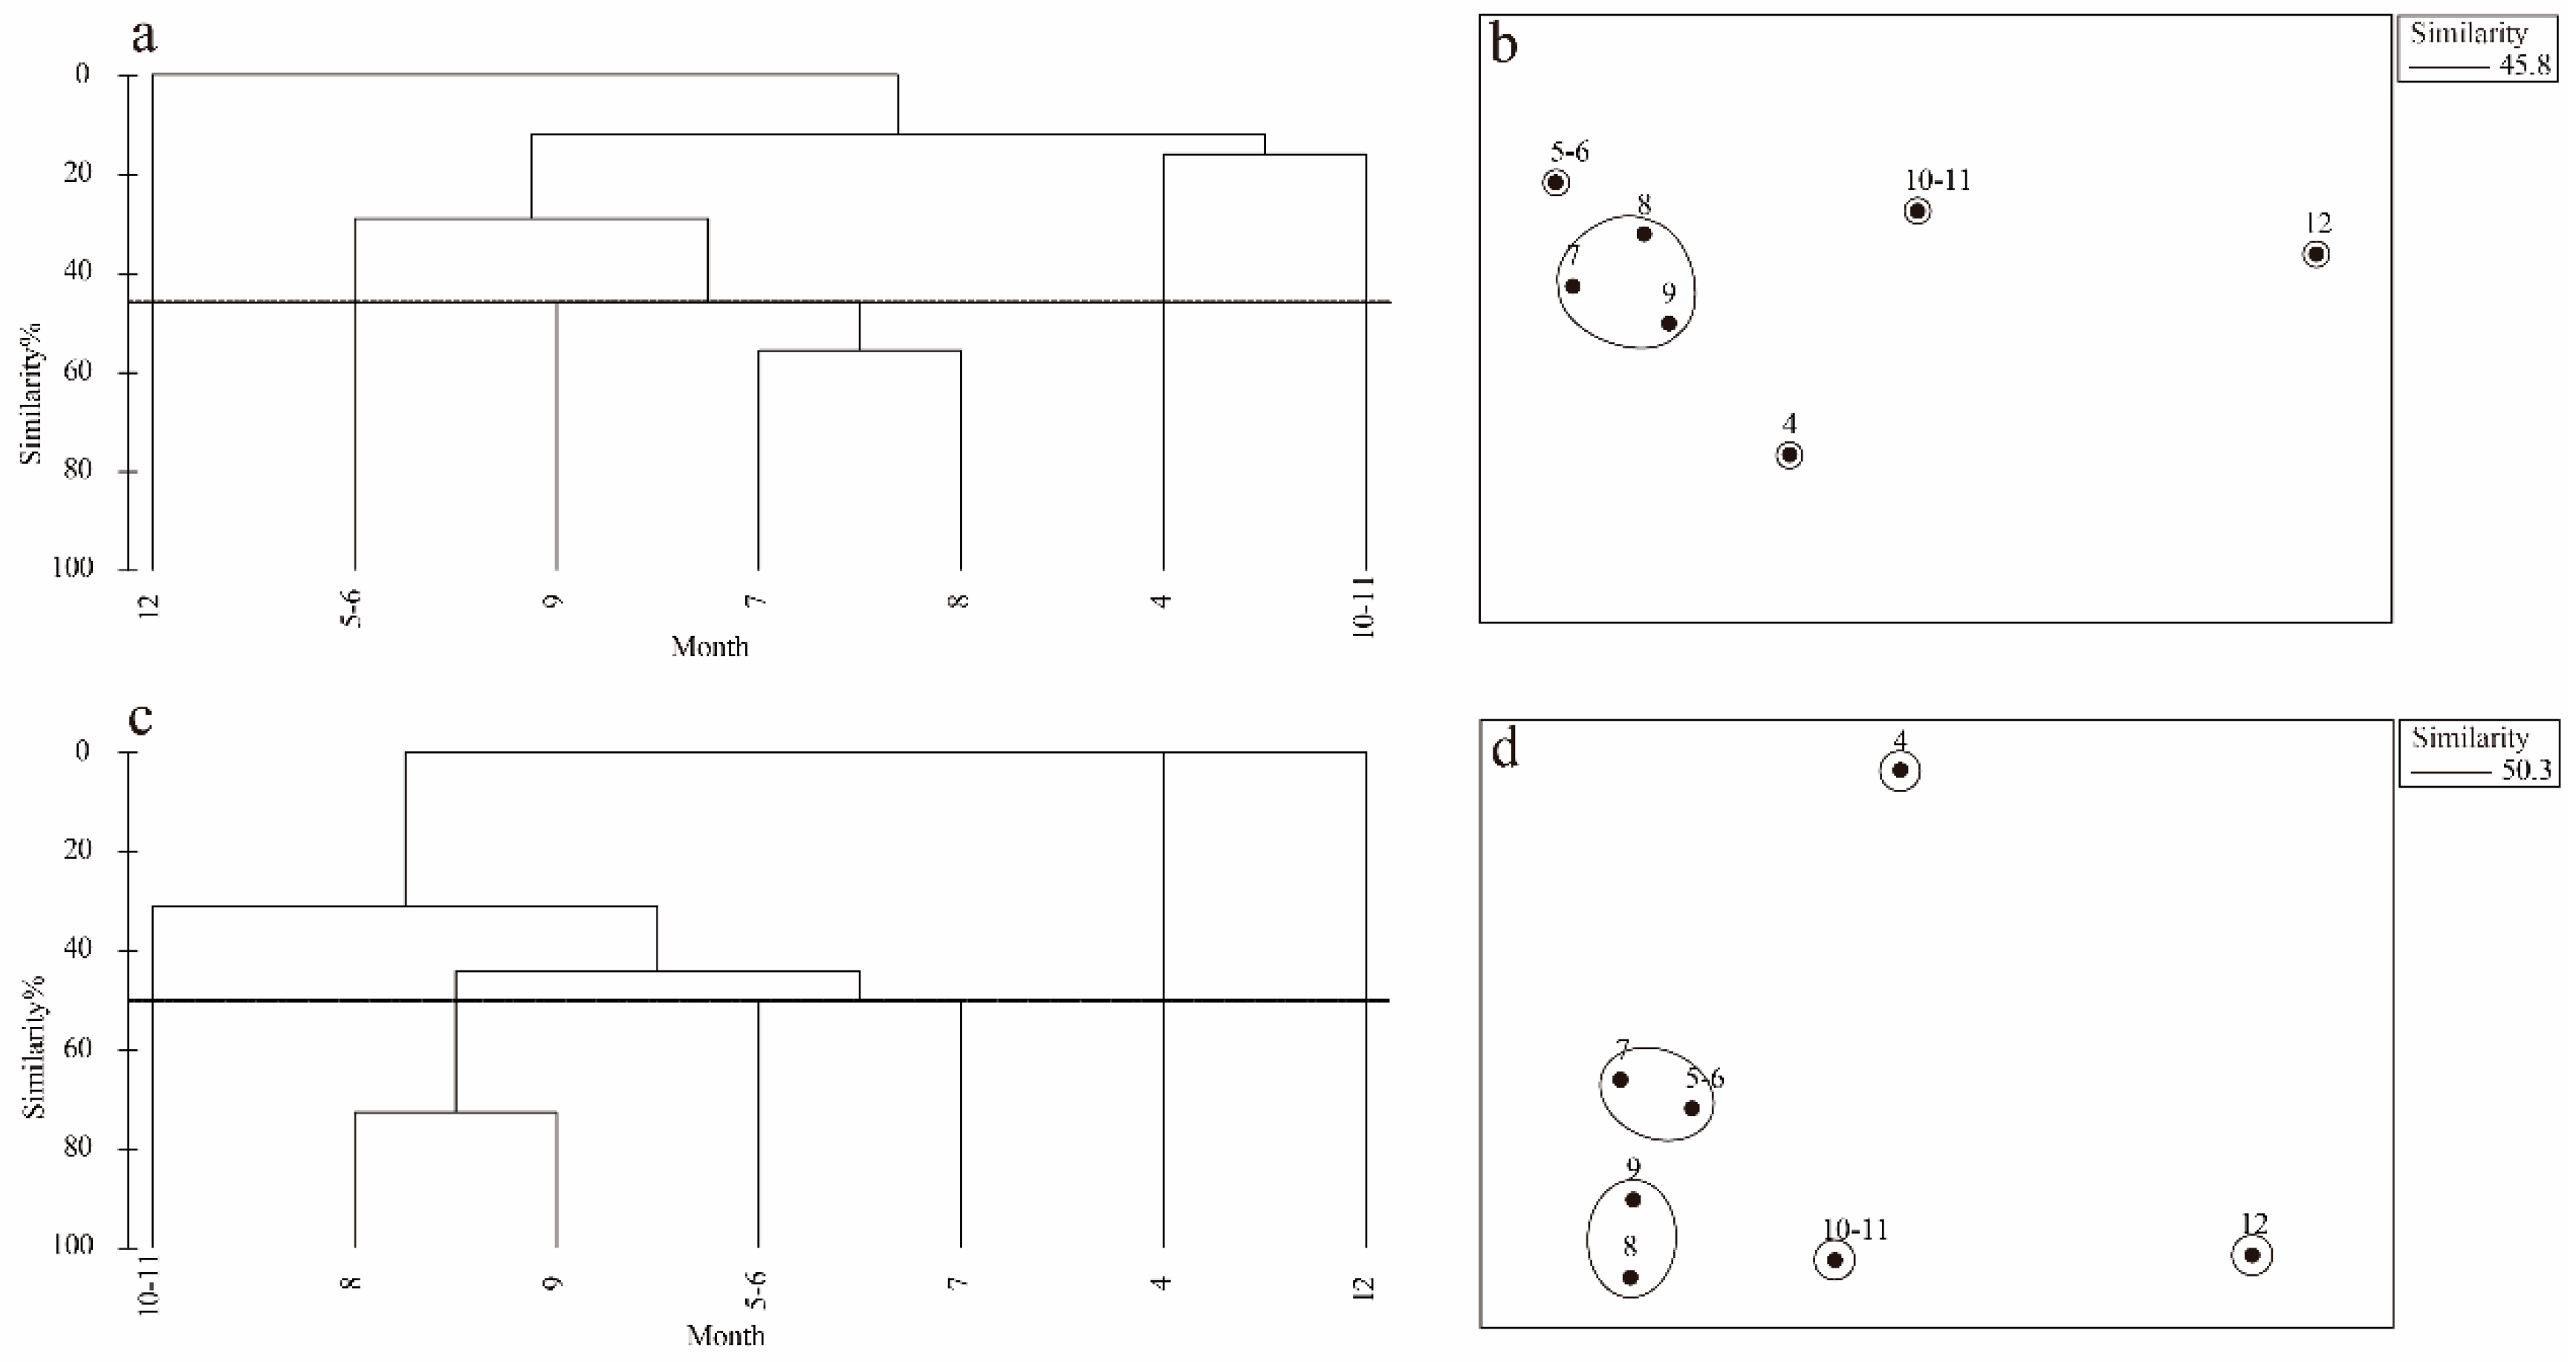
Figure 5.
Mantel test correlation analysis between fish eggs (a) and larvae (b) communities and environmental factors in the offshore waters of Liaoning in the Yellow Sea from May to August 2021 (SST seawater surface temperature; SSS seawater surface salinity; SBT seawater bottom temperature; SBS seawater bottom salinity; depth Sea water depth; WW wet weight; chla chlorophyll a).
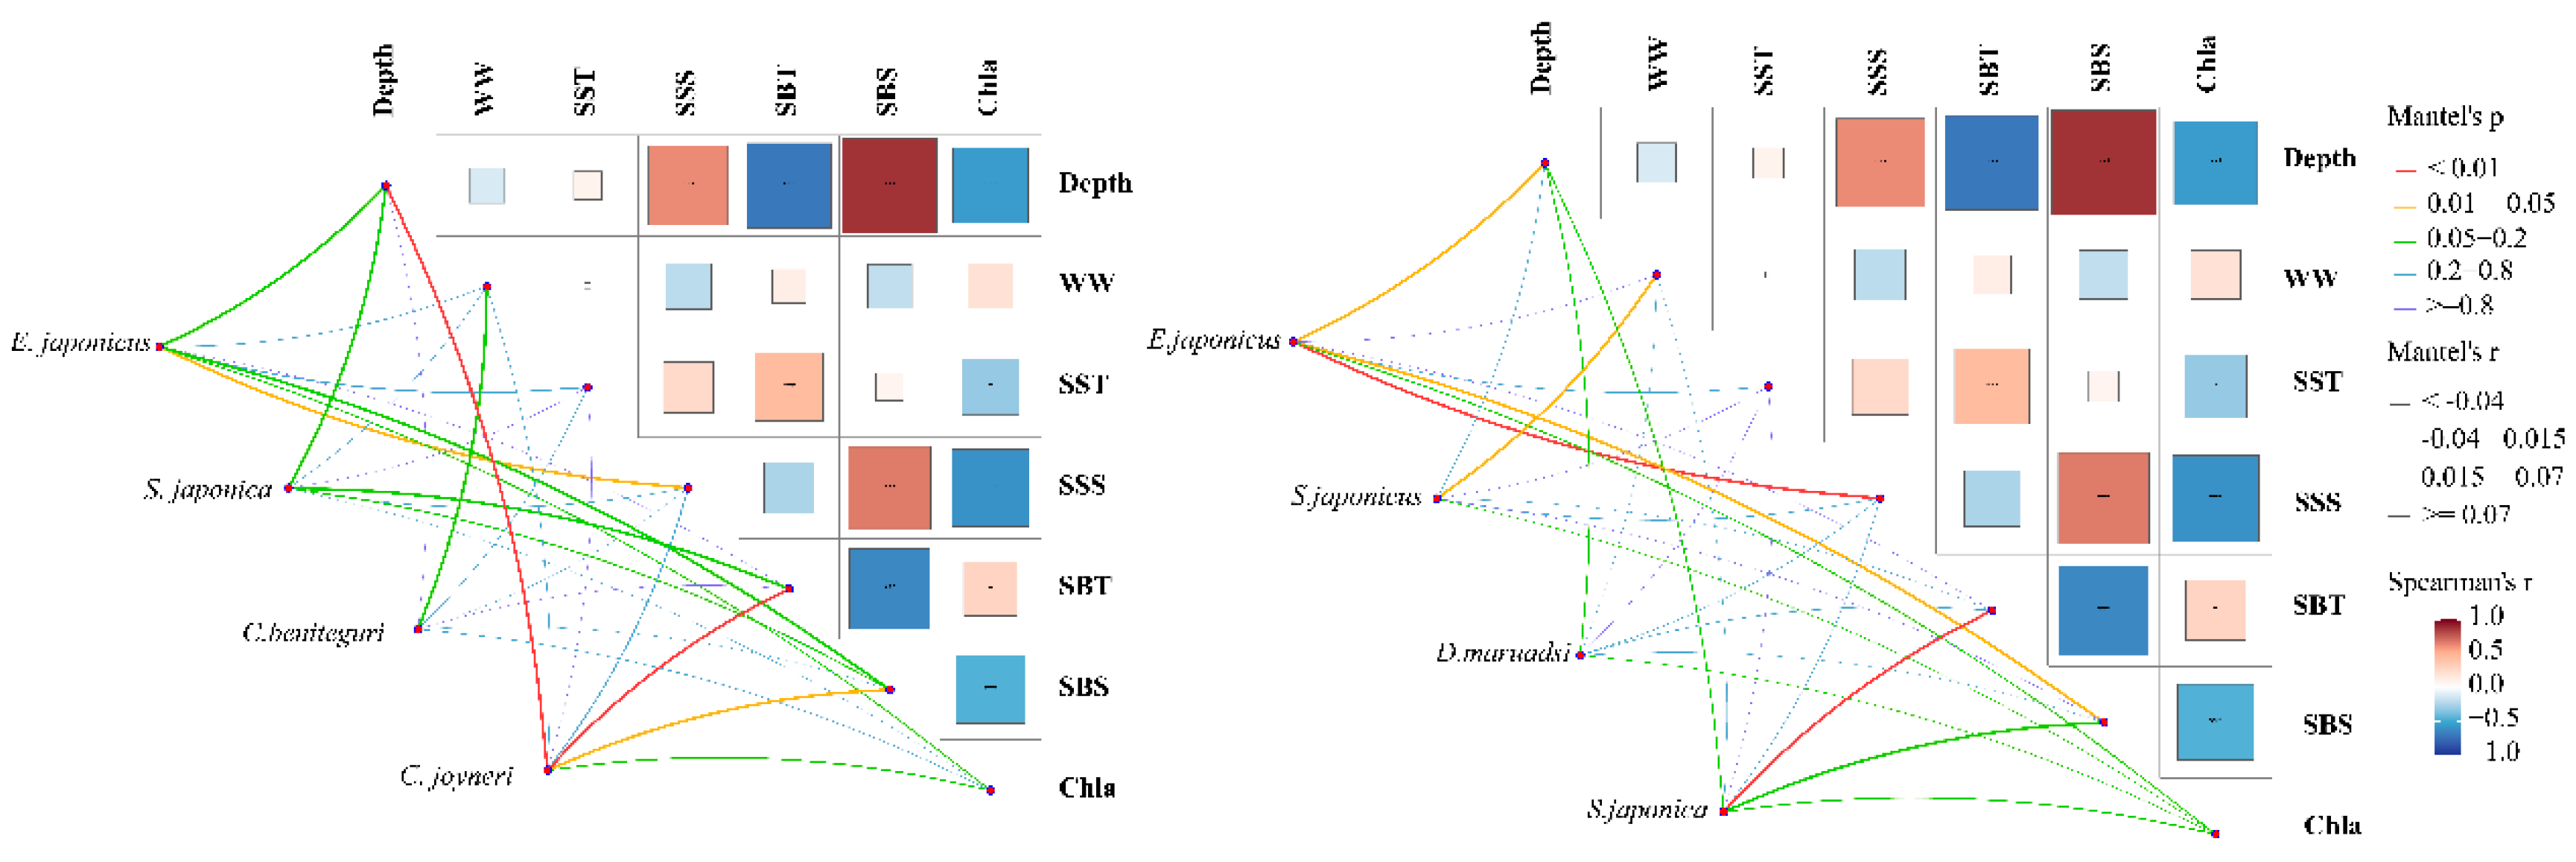
Figure 6.
CCA ordination of fish eggs (a) and larvae (b) distribution with environmental factors from May to August in offshore waters of the Liaoning Province in the Yellow Sea (SST seawater surface temperature; SSS seawater surface salinity; SBT seawater bottom temperature; SBS seawater bottom salinity; depth Sea water depth; WW wet weight; chla chlorophyll a).
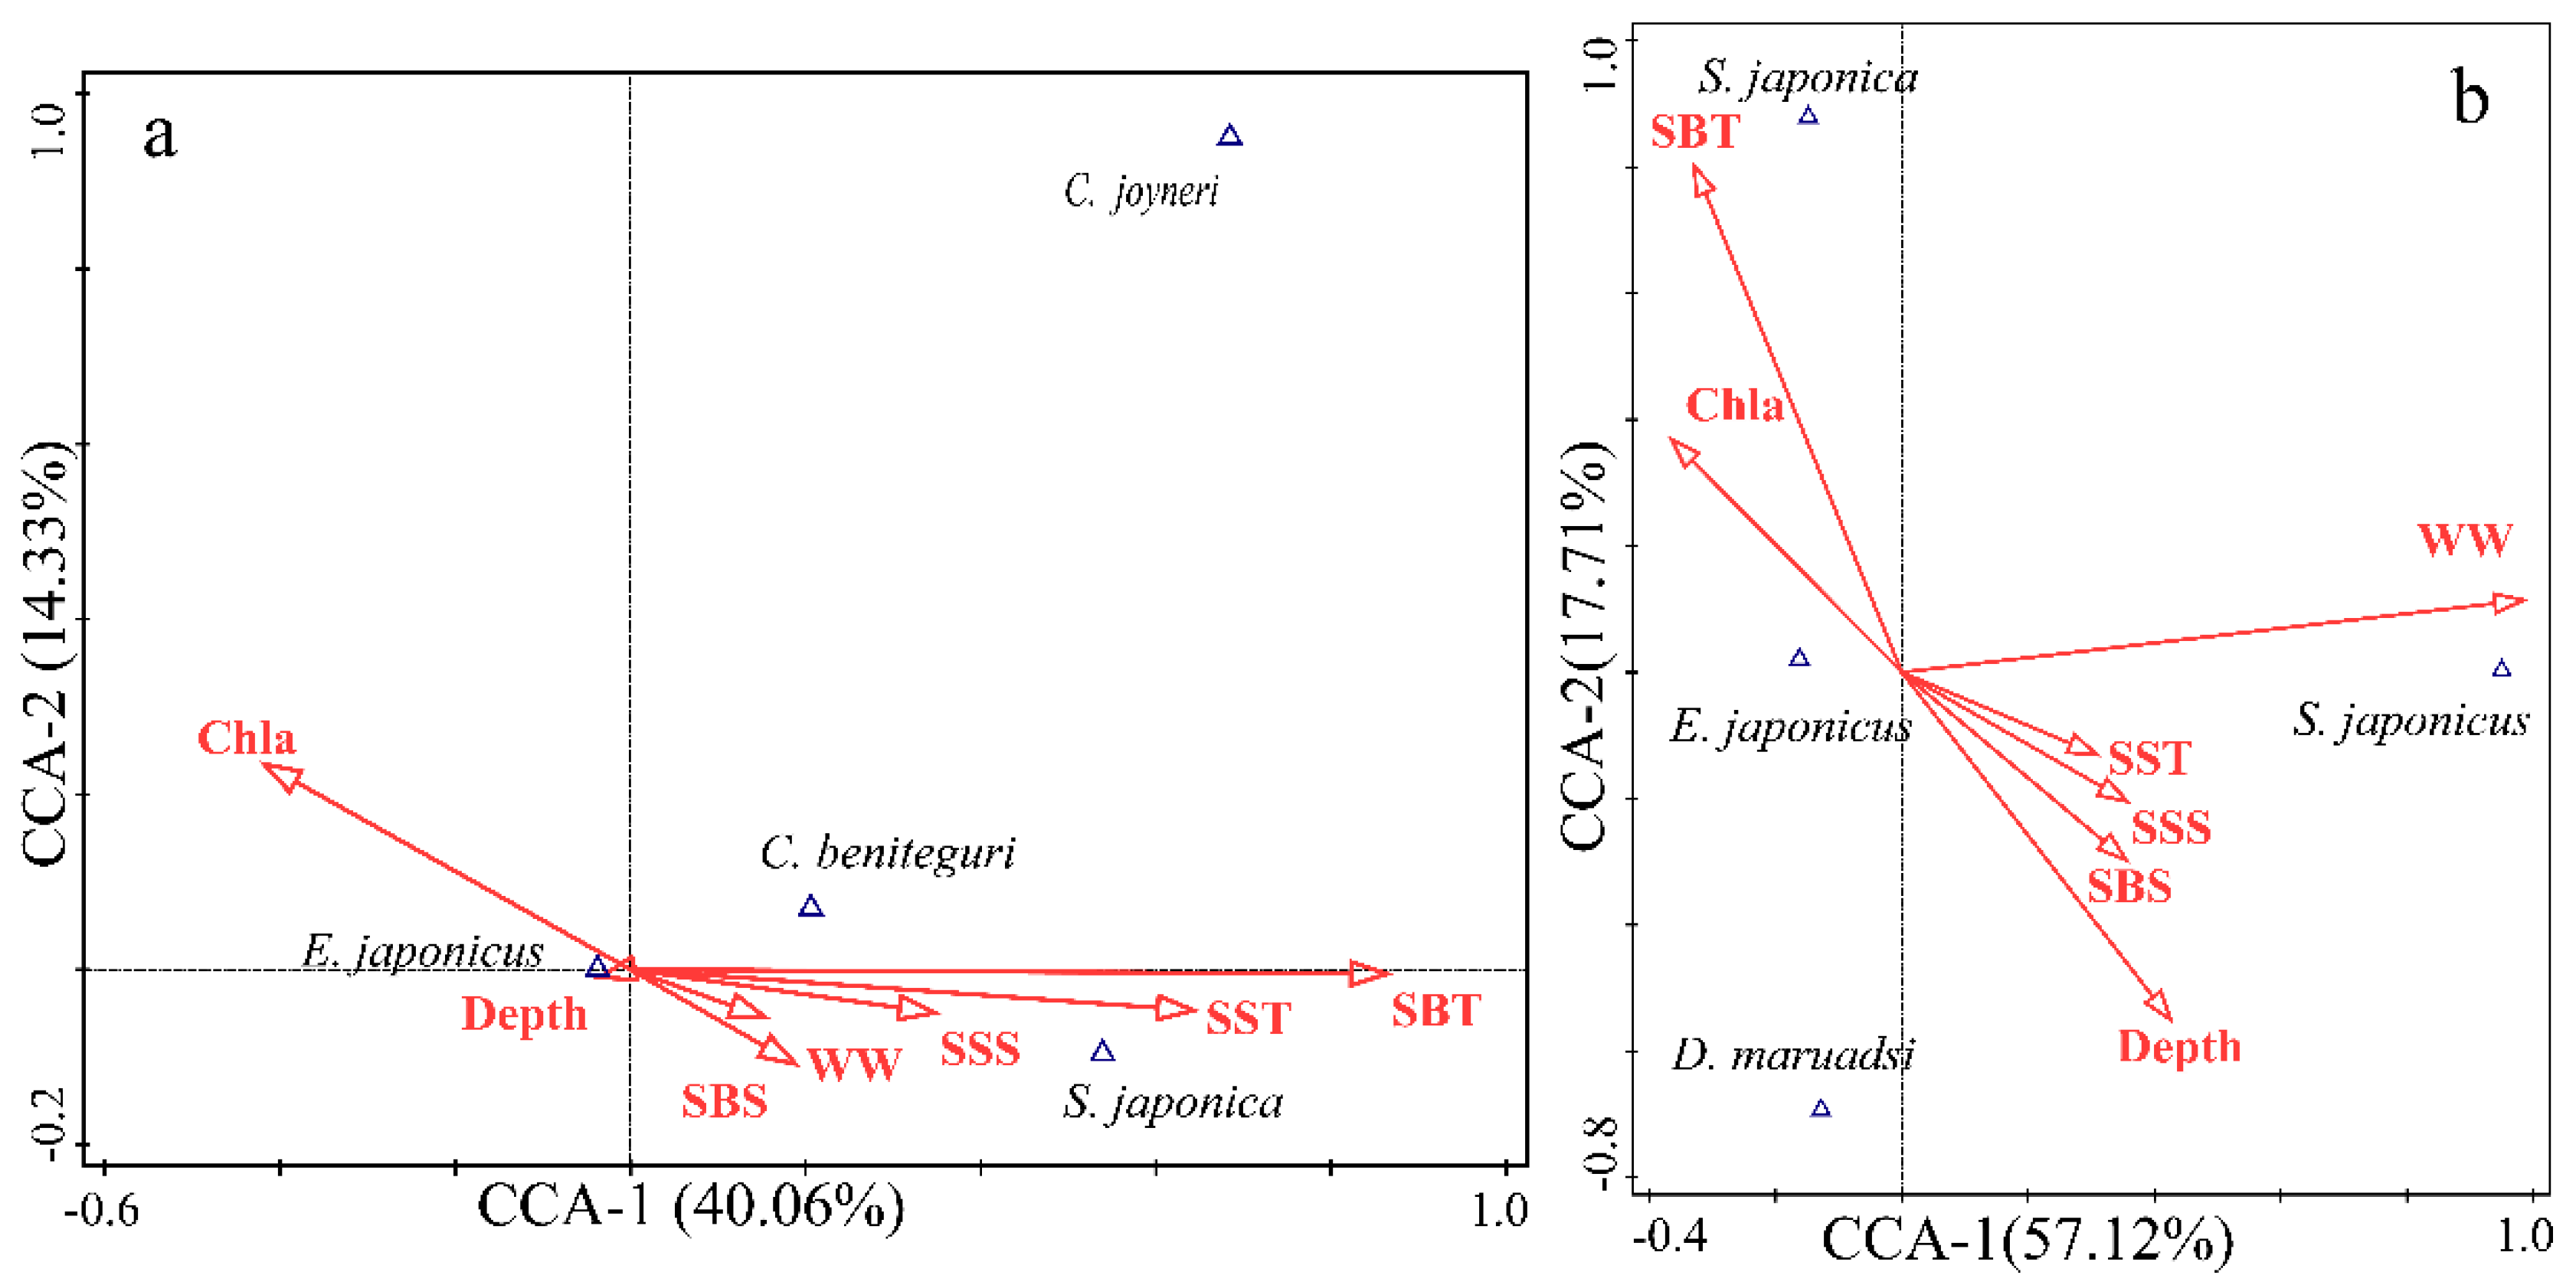
Figure 7.
Absence-presence records of E. japonicus eggs in offshore waters of the Liaoning Province in the Yellow Sea from 1998 to 2017.
Figure 7.
Absence-presence records of E. japonicus eggs in offshore waters of the Liaoning Province in the Yellow Sea from 1998 to 2017.
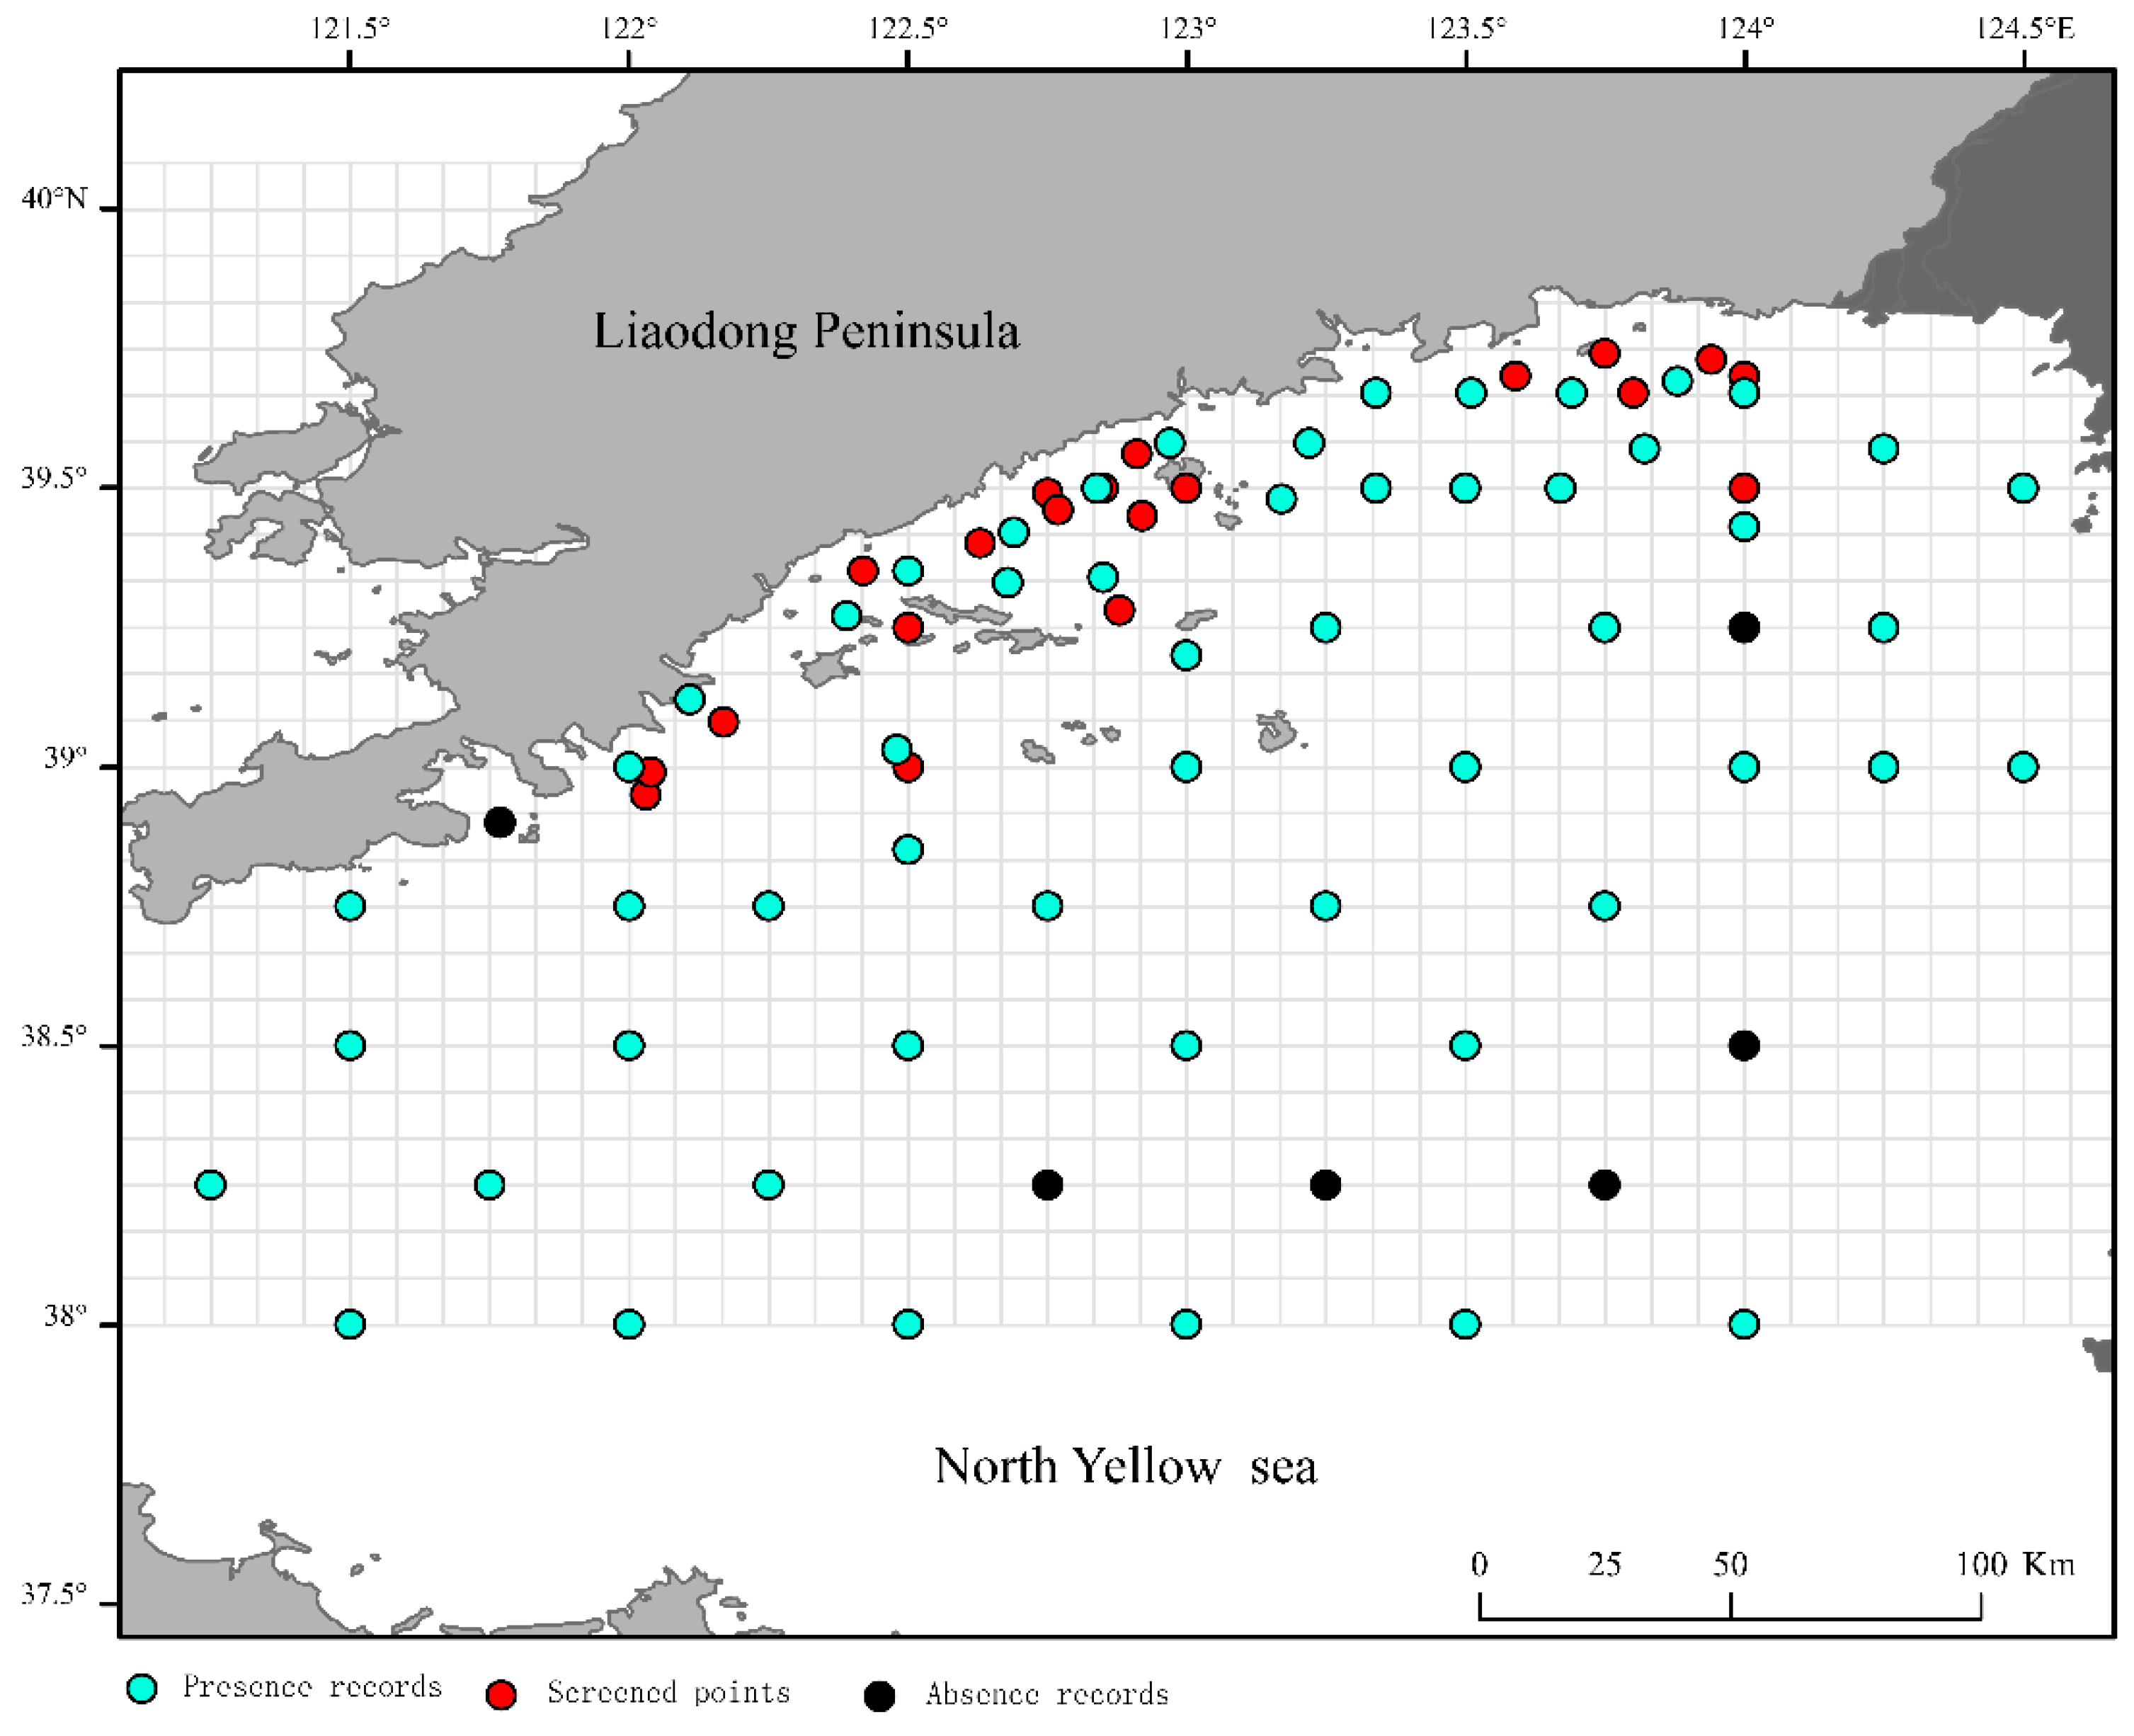
Figure 8.
The trend of distribution suitability of E. japonicus eggs with environmental factors in offshore waters of the Liaoning Province in the Yellow Sea (a Sea water depth; b Offshore distance; c Annual mean seawater surface salinity; d Annual mean seawater surface temperature; e Seawater surface velocity).
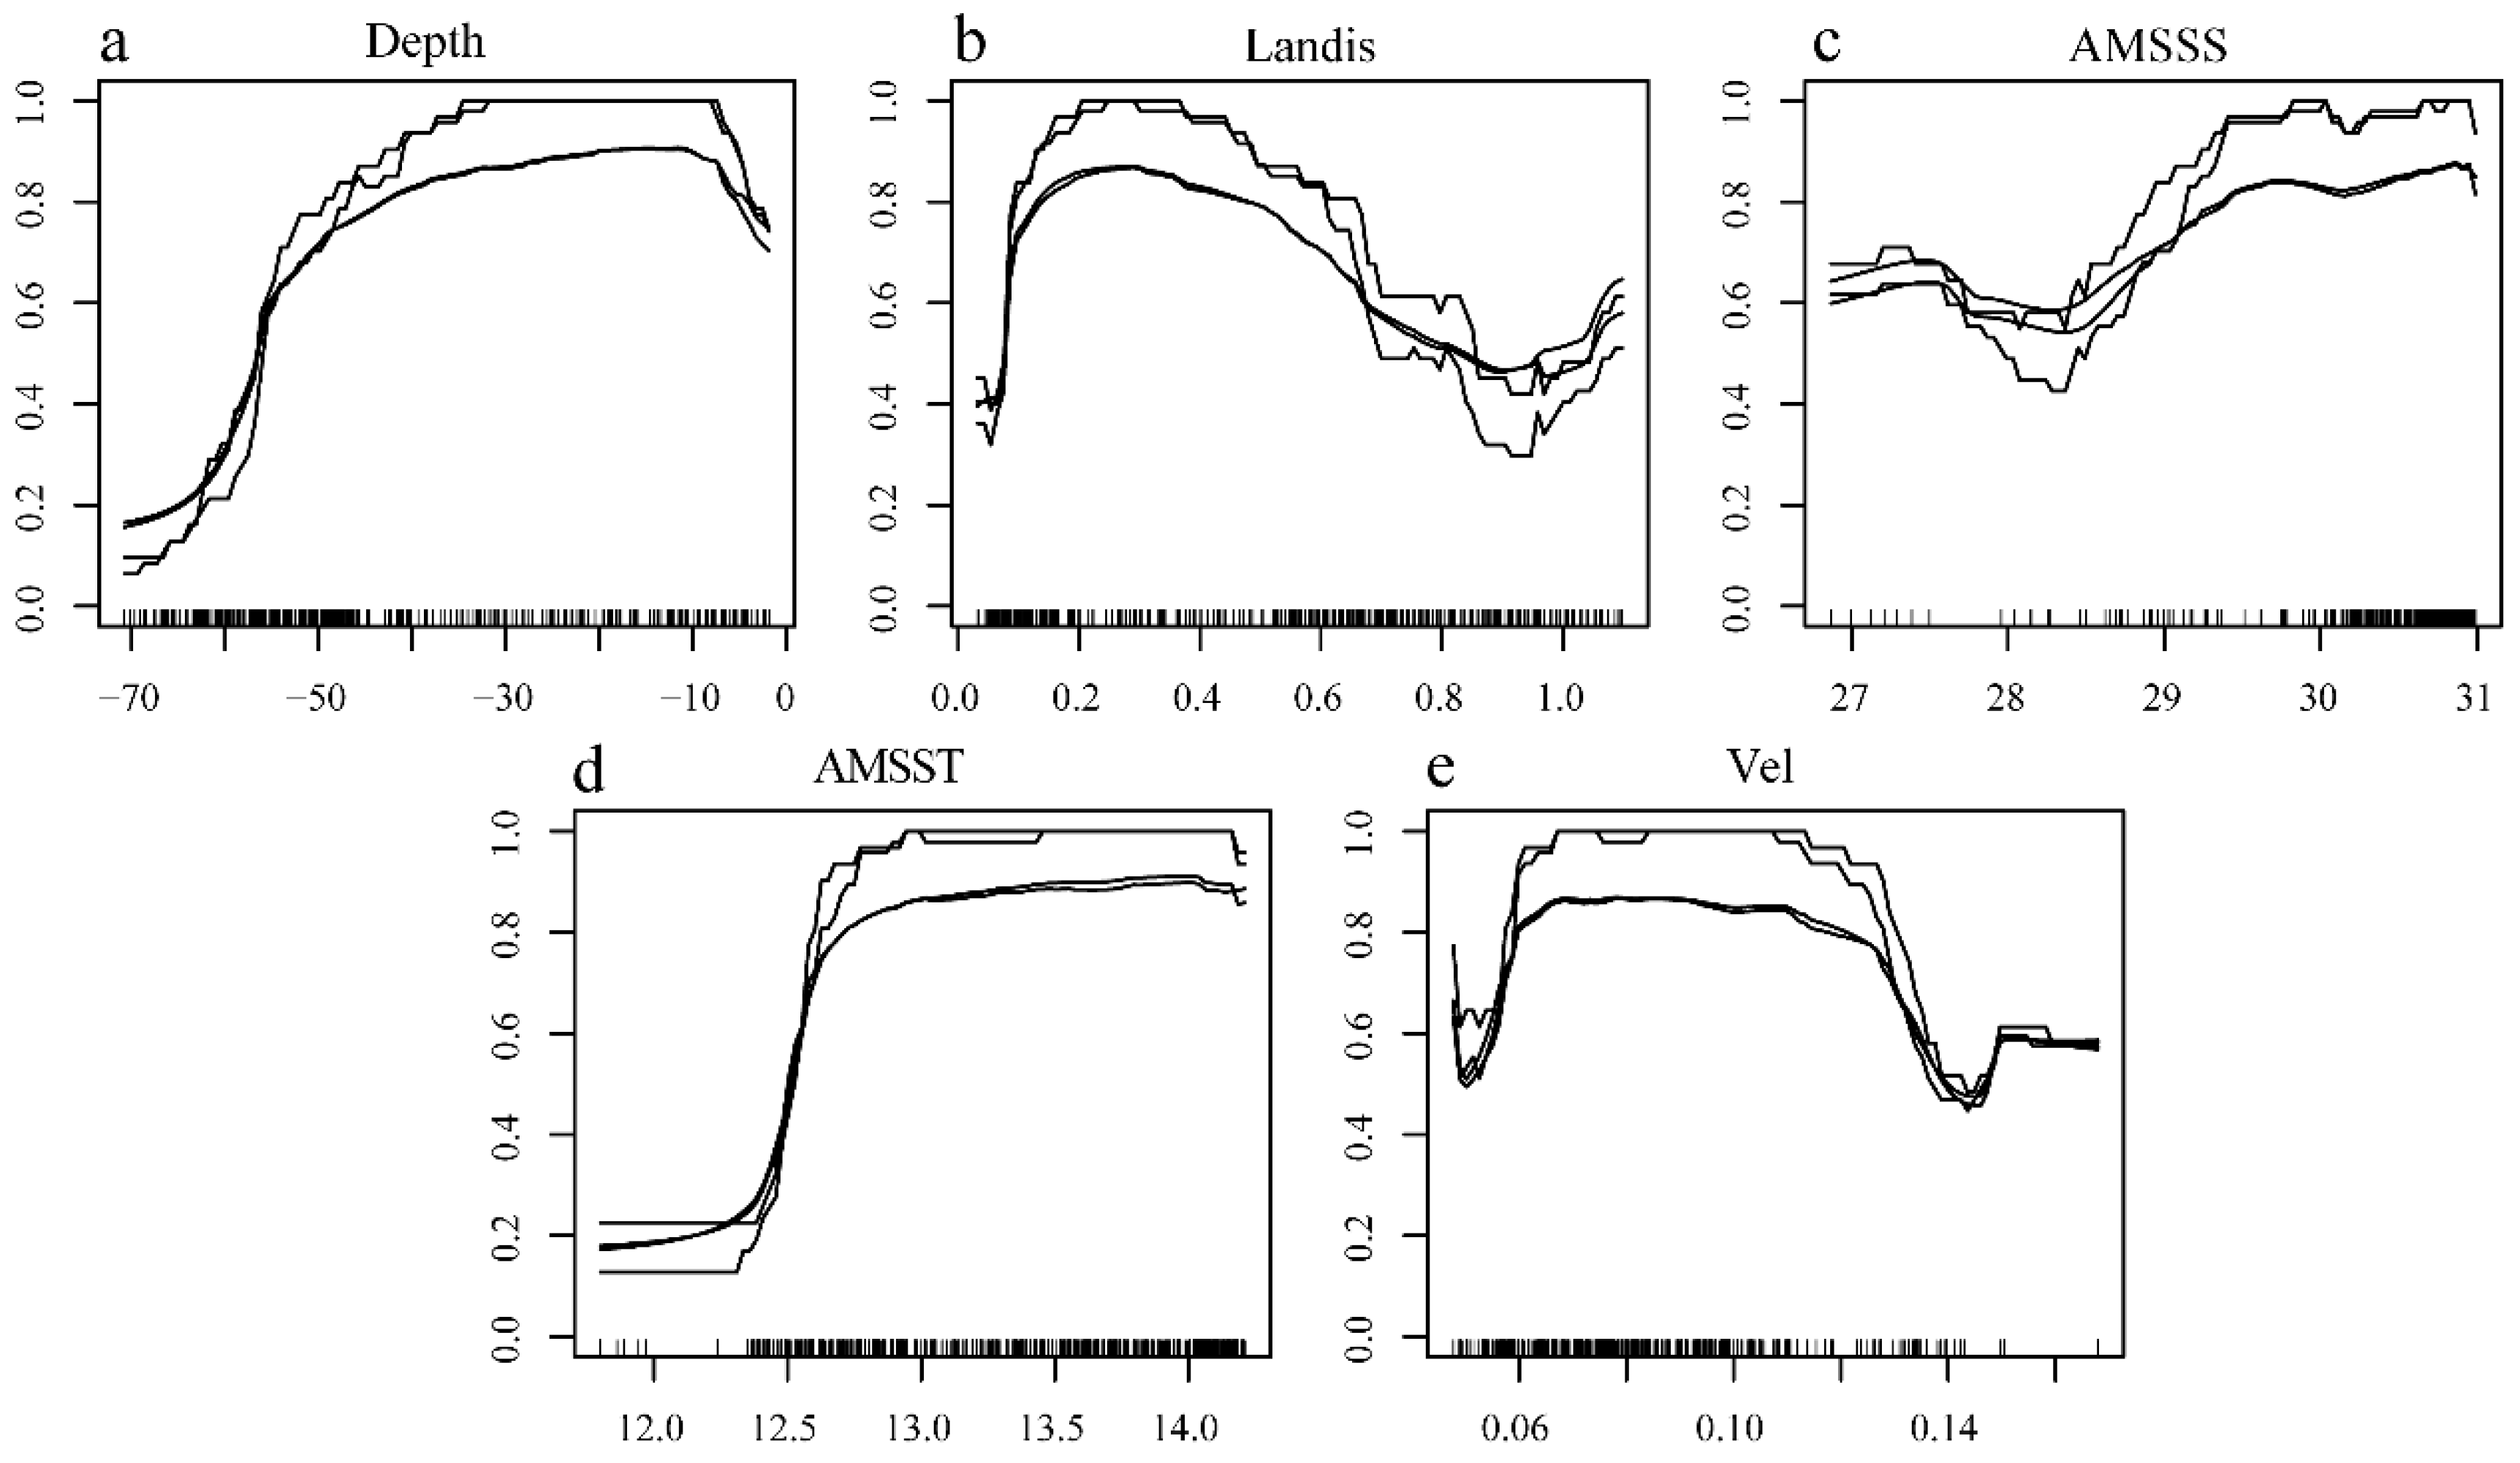
Figure 9.
Forecasting the habitat suitability for spawning to the E. japonicus under various climate scenarios in offshore waters of the Liaoning Province in the Yellow Sea (a, h April; b, i May to June; c, j July; d, k August; e, l September; f, m October to November; g, n December).
Figure 9.
Forecasting the habitat suitability for spawning to the E. japonicus under various climate scenarios in offshore waters of the Liaoning Province in the Yellow Sea (a, h April; b, i May to June; c, j July; d, k August; e, l September; f, m October to November; g, n December).
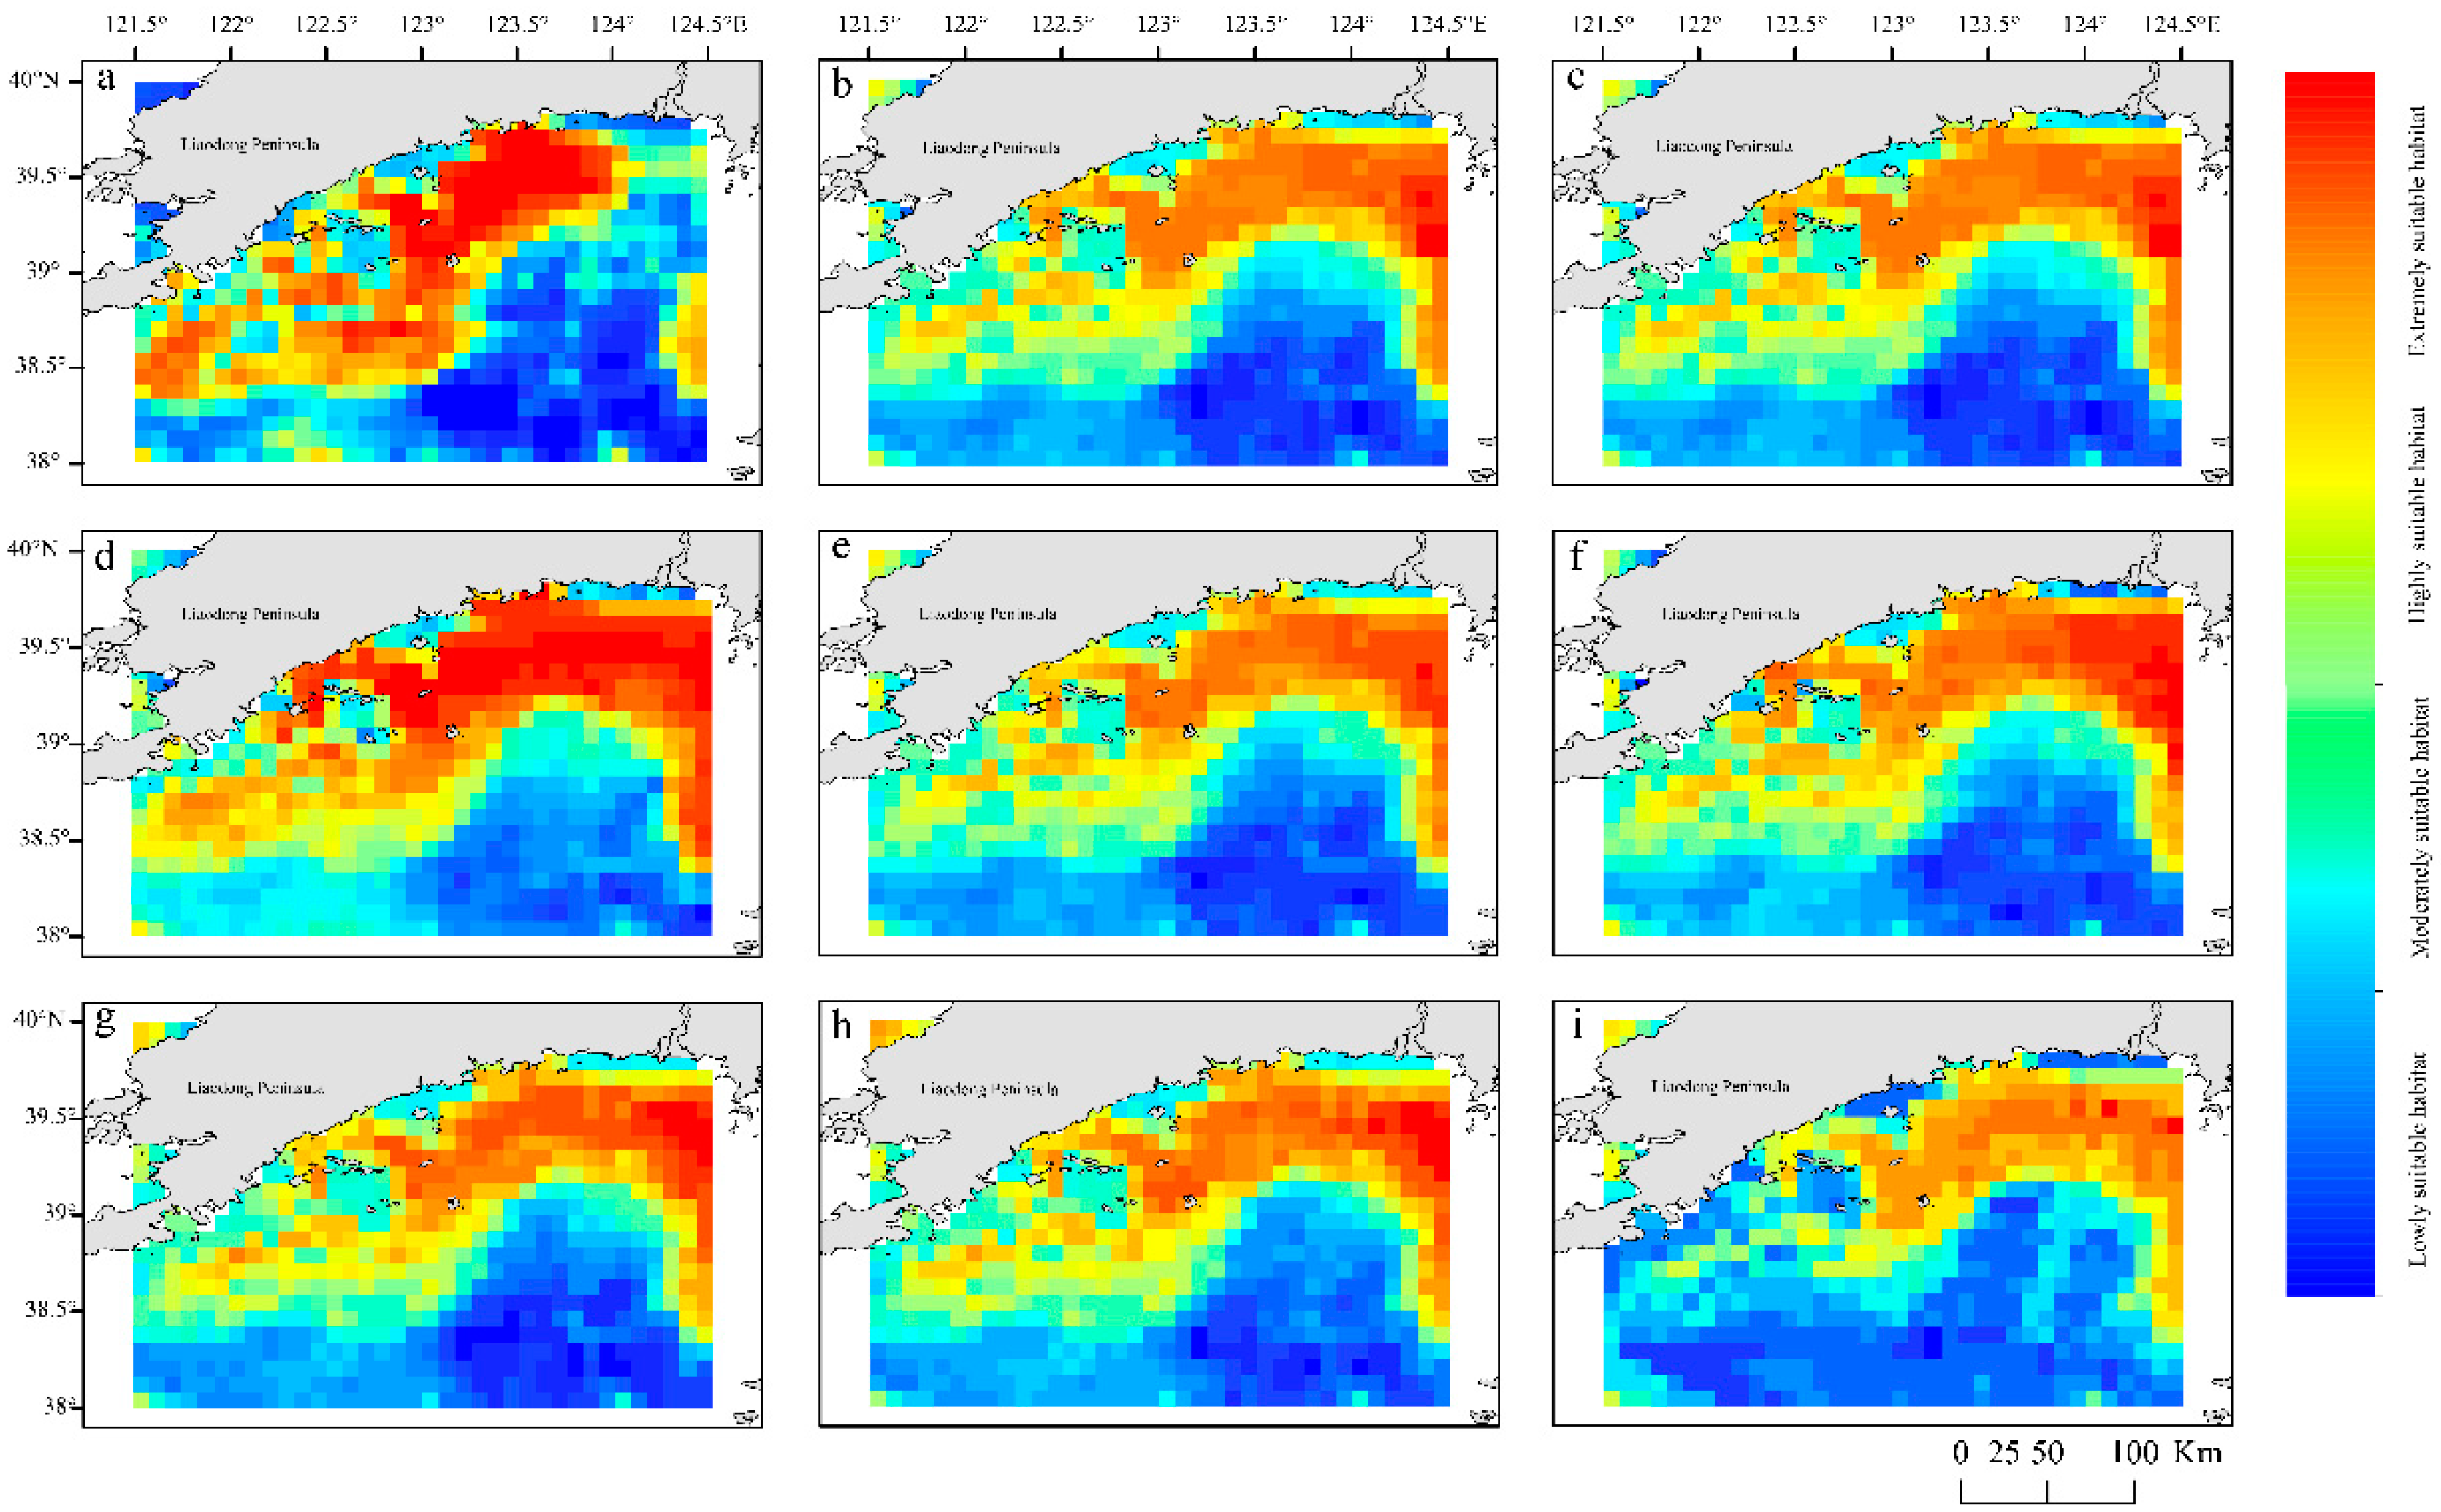

Table 1.
Summary of historical surveys on early life stage (ELS) fish in the offshore waters of the Liaoning Province in the Yellow Sea.
Table 1.
Summary of historical surveys on early life stage (ELS) fish in the offshore waters of the Liaoning Province in the Yellow Sea.
| Year | Survey content | Main purpose | References |
|---|---|---|---|
| 1959 | Twelve cruises for E. japonicus eggs and larvae monthly surveys in the Yellow and Bohai Seas | Assessment of fishing resources and habitat conditions of E. japonicus in the Yellow and Bohai Seas | Ruan 1984 |
| 1985-1986 | Thirteen cruises for fishery resource bottom trawl and habitat assessments in the Yellow Sea | Studies of ichthyoplankton to support fishery life | Wan and Jiang 1998 |
| 1987-1988 | Three cruises for spawning ground surveys in the nearshore areas of the Yellow Sea | Determination and monitoring of spawning grounds | Wan and Jiang 1998 |
| 1998 | Two cruises for bottom-trawling surveys in the northern Yellow Sea, including fixed station observations and sampling for the hydrological environment, primary productivity, fish eggs, and larvae, as well as plankton surveys. | Investigation of the physical and chemical environment that supports marine biological resources and their habitats | Qiu et al. 2004 |
| 1998-2000 | Five cruises for studying zooplankton species, abundance, and distribution, as well as fish eggs and larvae in the Yellow and Bohai Seas | Researching the physicochemical environment of marine biological resources and their habitats | Zhao et al. 2005 |
| 2009 | Four cruises for surveying fish eggs and larvae in the nearshore area of the North Yellow Sea | Concentrated study on fish egg and larval populations in the nearshore region | Yu et al. 2020 |
| 2009-2010 | Four cruises exploring ecological foundation for enhancing fishery resources and fish egg and larval surveys in key waters of the Yellow and Bohai Seas | Investigating enhancement strategies for fishery resources through understanding key water habitats | Shan et al. 2014 |
| 2014-2017 | Ten cruises for spawning ground surveys and fish egg and larval investigations in the nearshore waters of the northern Yellow Sea | Longitudinal studies on fish egg and larval dynamics in specific regions of interest | Dong et al. 2018 |
Table 2.
Species composition of fish eggs and larvae community in offshore waters of the Liaoning Province in the Yellow Sea from April to December 2021.
Table 2.
Species composition of fish eggs and larvae community in offshore waters of the Liaoning Province in the Yellow Sea from April to December 2021.
| Species | Egg type | Temperature adaptation | 4 | 5-6 | 7 | 8 | 9 | 10-11 | 12 |
|---|---|---|---|---|---|---|---|---|---|
| E. japonicus | Pel | WT | ○ | ○● | ○● | ○ ● | ○ ● | ○ ● | |
| T. kammalensis | Pel | WW | ○ | ○ | |||||
| K. punctatus | Pel | WW | ○ | ||||||
| S. elongata | Pel | WT | ○ | ○ | |||||
| P. brevipinnis | adh | WT | ● | ||||||
| S. schlegeli | ovo | WW | ● | ||||||
| H. mohnikei | ovo | WT | ● | ||||||
| P. haematocheilus | Pel | WT | ○● | ||||||
| S. pinguis | Pel | WT | ○ | ||||||
| L. maculatus | Pel | WT | ○ | ● | |||||
| S. japonica | Pel | WW | ○● | ○● | ○● | ||||
| D. maruadsi | Pel | WW | ○● | ○ | |||||
| S. aureovittata | Pel | WT | ○ | ||||||
| C. hippurus | Pel | WW | ○ | ||||||
| L. polyactis | Pel | WT | ○ | ||||||
| P. argentata | Pel | WW | ○ | ○ | |||||
| P. major | Pel | WT | ○ | ||||||
| T. lepturus | Pel | WT | ○ | ○ | ○ | ||||
| E.muticus | Pel | WT | ○ | ||||||
| S. japonicus | Pel | WW | ○ | ○● | |||||
| S. niphonius | Pel | WT | ○ | ||||||
| A. tapeionosoma | Pel | WW | ○ | ||||||
| G. mororanus | adh | WT | ● | ||||||
| A. personatus | Adh | CT | ● | ||||||
| A.emmnion | Adh | CT | ● | ||||||
| C. richardsoni | Pel | WT | ○ | ||||||
| C.beniteguri | Pel | WT | ○ | ○ | ○● | ○● | |||
| C. joyneri | Pel | WT | ○ | ○ | ○ | ||||
| C. herzensteini | Pel | CT | ○ | ○ | ○ | ○ | |||
| P.herzensteini | Pel | CT | ○ | ||||||
| P. cornutus | Pel | WT | ○● | ||||||
| P. bicoloratus | Pel | CT | ○ | ||||||
| P. olivaceus | Pel | WT | ○ | ||||||
| S. schlegelii | ovo | CT | ● | ● | |||||
| H. otakii | Adh | CT | ● | ||||||
| A. agrammus | Adh | CT | ● |
Note: “○” means the presence of fish eggs, “●” means the presence of fish larvae; Pel: Pelagic, Adh: adhesion (the eggs with adhesive egg filaments), ovo: ovoviviparity; WT: warm temperature, WW: warm water, CT: cold temperature.
Table 3.
Dominant and important species of eggs and larvae community in offshore waters of the Liaoning Province in the Yellow Sea from April to December 2021.
Table 3.
Dominant and important species of eggs and larvae community in offshore waters of the Liaoning Province in the Yellow Sea from April to December 2021.
| Month | Fish eggs | Fish larvae | ||
|---|---|---|---|---|
| Species | IRI | Species | IRI | |
| April | E. japonicus | 345.9* | A.personatus | 526.3* |
| P.herzensteini | 180.5* | |||
| May–June | E.japonicus | 9576.2** | E.japonicus | 1479.3** |
| July | E.japonicus | 5520.8** | E. japonicus | 2940.1** |
| S. japonica | 1029.0** | S. japonicus | 145.2* | |
| August | E.japonicus | 2129.4** |
E. japonicus S. japonica |
2801.4** 127.3* |
| S. japonica | 403.4* | |||
| C.valenciennei | 115.7* | |||
| September | E. japonicus | 1624.1** | E. japonicus | 3459.2** |
| S. japonica | 244.9* | |||
| C.valenciennei | 335.1* | |||
| C. joyneri | 128.9* | |||
| C.herzensteini | 193.3* | |||
| October–November | P. cornutus | 3577.8** | E. japonicus | 1731.7** |
| P. cornutus | 611.2* | |||
| December | P. bicoloratus | 6666.7** | H.osotakii | 9809.9.3** |
| Annual | E. japonicus | 3792.3** | E.japonicus | 1455.2** |
| H.otakii | 342.2* | |||
Note: “**” means dominant species, “*” means important species.
Table 4.
Monthly species turnover rates (%) for fish eggs (the lower triangular portion) and larvae (the upper triangular portion).
Table 4.
Monthly species turnover rates (%) for fish eggs (the lower triangular portion) and larvae (the upper triangular portion).
| Month | April | May–June | July | August | September | October | Nov–Dec |
|---|---|---|---|---|---|---|---|
| April | 98.12 | 98.11 | 94.44 | 98.16 | 90.70 | 98.56 | |
| May–June | 99.95 | 53.31 | 72.85 | 30.28 | 90.43 | 98.75 | |
| July | 99.73 | 90.67 | 70.97 | 61.38 | 89.43 | 98.32 | |
| August | 99.36 | 96.90 | 79.57 | 74.63 | 70.93 | 97.32 | |
| September | 89.85 | 99.69 | 98.07 | 94.03 | 90.91 | 98.13 | |
| October | 97.75 | 99.98 | 99.92 | 99.71 | 96.73 | 96.39 | |
| Nov–Dec | 94.50 | 99.99 | 99.89 | 99.72 | 95.90 | 95.65 |
Table 5.
Representative species of each community group, intergroup differentiating species, and average dissimilarity rate of fish egg and larval fish between different community groups.
Table 5.
Representative species of each community group, intergroup differentiating species, and average dissimilarity rate of fish egg and larval fish between different community groups.
| Category | RS | KDS | ||||
|---|---|---|---|---|---|---|
| Fish eggs | P.herzensteini | April | E. japonicus | S. japonica, | P. cornutus, | E. japonicus, |
| E. japonicus | K.punctatus | C. beniteguri | L. maculatus | P. argentata, | ||
| P.argentata | E.japonicus | K. punctatus | ||||
| 92.03 | May-June | K. punctatus | E. japonicus, | E. japonicus, | ||
| P.argentata | E. japonicus, | P. argentata, | P. argentata, | |||
| E. japonicus | P. argentata, | K. punctatus | K. punctatus | |||
| E. japonicus, | 85.3 | 70.95 | July-Sept | P. cornutus, | S. japonica, | |
| C.beniteguri | S. japonica, | E. japonicus, | ||||
| S. japonica | P. argentata | C.beniteguri | ||||
| P.cornutus, | 83.96 | 91.86 | 88.13 | Oct-Nov | P.cornutus, | |
| L.maculatus | P.bicoloratus | |||||
| P.bicoloratus | 100 | 100 | 100 | 100 | December | |
| Larvae | April | E.japonicus, | E. japonicus, | E. japonicus, | H. otakii, | |
| A.personatus | S. schlegelii | S. japonica | P. cornutus | A.agrammus | ||
| E.japonicus, | 100 | May-July | S. schlegelii, | E. japonicus, | H. otakii, | |
| S. schlegelii | S. japonica | P. cornutus | E.japonicus | |||
| S. japonica, | 100 | 55.76 | Aug-Sept | P. cornutus, | H. otakii, | |
| E. japonicus, | S.japonica | E. japonicus | ||||
| C. beniteguri | P.bicoloratus | |||||
| E.japonicus, | 100 | 77.85 | 66.67 | Oct-Nov | P. cornutus | |
| P.cornutus | ||||||
| H.otakii, | 100 | 100 | 100 | 100 | December | |
| A agrammus | ||||||
Note: RS represents representative species, key dissimilarity species on the diagonal represents the key species contributing to the dissimilarity between communities, average dissimilarity below the diagonal indicates the average level of dissimilarity between communities.
Table 6.
Average spawning habitat suitability range of E. japonicus across climate change scenarios in offshore waters of the Liaoning Province in the Yellow Sea.
Table 6.
Average spawning habitat suitability range of E. japonicus across climate change scenarios in offshore waters of the Liaoning Province in the Yellow Sea.
| Period | Climate scenarios | Lowly suitable habitat/% | Moderately suitable habitat/% | Highly suitable habitat/% | Extremely suitable habitat/% | Average suitability |
| current | -------- | 35.90 | 23.40 | 13.52 | 27.18 | 899.14 |
| 2050s | RCP2.6 | 0.00 | 32.66 | 35.27 | 32.08 | 870.68 |
| RCP4.5 | 0.00 | 32.66 | 35.27 | 32.08 | 870.68 | |
| RCP6.0 | 0.14 | 33.82 | 25.54 | 40.49 | 905.47 | |
| RCP8.5 | 0.00 | 33.09 | 37.45 | 29.46 | 859.01 | |
| 2100s | RCP2.6 | 0.00 | 33.82 | 31.93 | 34.25 | 876.78 |
| RCP4.5 | 0.00 | 33.53 | 38.32 | 28.16 | 843.20 | |
| RCP6.0 | 0.00 | 34.69 | 40.49 | 24.82 | 818.60 | |
| RCP8.5 | 0.00 | 47.02 | 52.69 | 0.29 | 760.00 |
Note: The average suitability is the average value of the predicted suitability for Extremely suitable habitat.
Disclaimer/Publisher’s Note: The statements, opinions and data contained in all publications are solely those of the individual author(s) and contributor(s) and not of MDPI and/or the editor(s). MDPI and/or the editor(s) disclaim responsibility for any injury to people or property resulting from any ideas, methods, instructions or products referred to in the content. |
© 2025 by the authors. Licensee MDPI, Basel, Switzerland. This article is an open access article distributed under the terms and conditions of the Creative Commons Attribution (CC BY) license (http://creativecommons.org/licenses/by/4.0/).
Copyright: This open access article is published under a Creative Commons CC BY 4.0 license, which permit the free download, distribution, and reuse, provided that the author and preprint are cited in any reuse.


