Submitted:
08 May 2025
Posted:
08 May 2025
You are already at the latest version
Abstract
Soil organic carbon (SOC) monitoring is central to carbon-farming Monitoring, Reporting and Verification MRV, yet high laboratory costs and sparse sampling limit its scalability. We present the first independent field validation of the Stenon FarmLab multi-sensor probe across 100 temperate European arable-soil samples, benchmarking its default outputs and a simple pH-corrected model against three laboratory reference methods: acid-treated TOC, temperature-differentiated TOC (SoliTOC), and total carbon dry combustion. Uncorrected FarmLab algorithms systematically overestimated SOC by +0.20 % to +0.27 % (SD = 0.25–0.28 %), while pH adjustment reduced bias to +0.11 % and tightened precision to SD = 0.23 %. Volumetric moisture had no significant effect on measurement error (r = –0.14, p = 0.16). Bland–Altman and Deming regression demonstrated improved agreement after pH correction, but formal equivalence testing (accuracy, precision, concordance) showed that no in-field model fully matched laboratory standards—the pH-corrected variant passed accuracy and concordance yet failed the precision criterion (p = 0.0087). At ~ €3–4 per measurement versus ~ €44 for lab analysis, FarmLab facilitates dense spatial sampling. We recommend a hybrid monitoring strategy combining routine, pH-corrected in-field mapping with periodic laboratory recalibrations, alongside expanded calibration libraries, integrated bulk-density measurement, and adaptive machine-learning to achieve both high resolution and certification-grade rigor.
Keywords:
soil organic carbon
; proximal soil sensing
; in-field sensor calibration
; near-infrared spectroscopy
; electrical impedance spectroscopy
; pH correction
; carbon farming monitoring
1. Introduction
Soil organic carbon (SOC) constitutes the principal fraction of soil organic matter (SOM) and underpins critical soil functions such as nutrient cycling, water retention and crop productivity, while also sustaining biodiversity and ecosystem resilience [1]. As a dynamic reservoir within the global carbon cycle, accumulation of SOC has the capacity to sequester atmospheric carbon dioxide (CO₂), thereby contributing to climate-change mitigation [2,3]. In light of this potential, the European Commission’s Carbon-Farming Initiative under the European Green Deal now offers incentives to land managers for practices that increase SOC stocks, provided that field measurements are both reliable and cost-effective for robust certification [4,5,6,7].
Conventionally, the quantification of SOC is performed through the utilization of laboratory-based approaches, including dry combustion elemental analysis and mid-infrared (MIR) and near-infrared spectroscopy (NIRS). These methods have been shown to yield high levels of accuracy and precision [8,9,10]. However, they require extensive sample preparation, homogenization and calibration against large reference datasets. Laboratory MIR/NIRS protocols have been developed to minimize spectral interference from moisture, texture and mineralogy. This is achieved through stringent control of sample moisture content and particle size [11,12,13]. Despite the fact that these techniques remain the gold standard, their laborious workflows and per-sample cost of approximately €44 limit their feasibility for frequent, large-scale on-farm monitoring [14].
In order to address these limitations, a considerable number of studies have explored the potential of portable in-situ sensing platforms that integrate optical, electrochemical and environmental measurements. Early on-the-go visible/NIR systems have been shown to possess both potential and limitations with regard to the mapping of soil clay and SOC [15,16]. Subsequent reviews have documented the progression from rudimentary sensors to sophisticated benchtop and mobile instruments enhanced by machine-learning algorithms [17,18]. Field evaluations under disturbance-reduced protocols have reported improved estimates of SOC [19], and multi-sensor probes, coupled with advanced chemometrics, have yielded robust predictions of soil profile properties [20,21]. Recent investigations into miniaturized spectrometers have confirmed their potential for rapid soil property assessment [22], while the application of unsupervised learning to regional Vis-NIR spectral libraries has further enhanced the prediction of organic carbon [23]. Innovations such as moisture-correction algorithms [24,25] and rapid in-situ CO2-sensor methods [26] continue to expand the field.
The multi-sensor FarmLab device from Stenon integrates visible/NIR reflectance, electrical impedance spectroscopy (EIS), and environmental sensors — including soil moisture, temperature and volatile organic compounds (VOC) — within a hand-held spade probe for measurements in the upper 15 centimeters of soil [27,28]. Moreover, FarmLab offers dramatic cost savings — approximately €3–4 per measurement versus roughly €44 per laboratory sample — enabling much higher sampling densities at a fraction of the cost. Despite these economic advantages, independent assessments have indicated that its accuracy and precision remain lower than laboratory standards. Residual biases have been shown to be influenced by soil pH and texture [29,30,31]. A recent comparison to another Vis-NIR multi-sensor platform has further highlighted its current limitations [32].
Based on our comprehensive review of existing studies, no independent field evaluation has yet assessed the performance of the FarmLab device under temperate European arable conditions. In particular, there is a clear gap in the literature comparing its SOC estimates to established laboratory methods — acid-treated total organic carbon (TOC-acid), temperature-differentiated TOC (SoliTOC), and total carbon analysis — and in examining how its integrated moisture and pH sensors mitigate field-sensor artefacts. Accordingly, the present study aims to (1) quantify the accuracy and precision of FarmLab SOC measurements against these laboratory standards, (2) evaluate the effectiveness of its onboard moisture and pH corrections, and (3) determine its suitability for carbon-farming applications.
2. Materials and Methods
2.1. Sampling Sites
Soil sampling was conducted at nine temperate arable sites in Lower Saxony (May 2021) and Hesse (August–September 2021). At each location, a total of one to four soil samples were collected from nine agricultural fields in Germany. Three sites (Sites 1–3) were located in Lower Saxony and sampled in May 2021; six sites (Sites 4–9) were located in Hesse and sampled between August and September 2021 (see Figure 1 for details). The soil types present at the study sites ranged from Pseudogley-Luvisol with loess-derived clay (Sites 3 and 9), through Gley/Luvisol/Pararendzina (Sites 1, 2, 8), to Cambisol (Sites 4, 5, 7) and Luvisol (Site 6). Texture exhibited a range of variations from loamy sand (Site 6) to loamy clay (Site 9). A comprehensive summary of the key site characteristics is provided in Table 2.
A total of 20 plots were sampled, with each plot encompassing five georeferenced subplots, resulting in a total of 100 subplots. Within each subplot, two adjacent FarmLab measurements were made and five soil cores (0–30 cm) were collected within 0.5 m of the probe position. To facilitate the subsequent laboratory analysis, the cores were amalgamated into composite samples for each subplot. For Hesse sites, undisturbed cores were also taken at two depths to determine bulk density; for Lower Saxony, bulk density was estimated from texture and SOC following Rawls [33].
2.2. Sampling Scheme
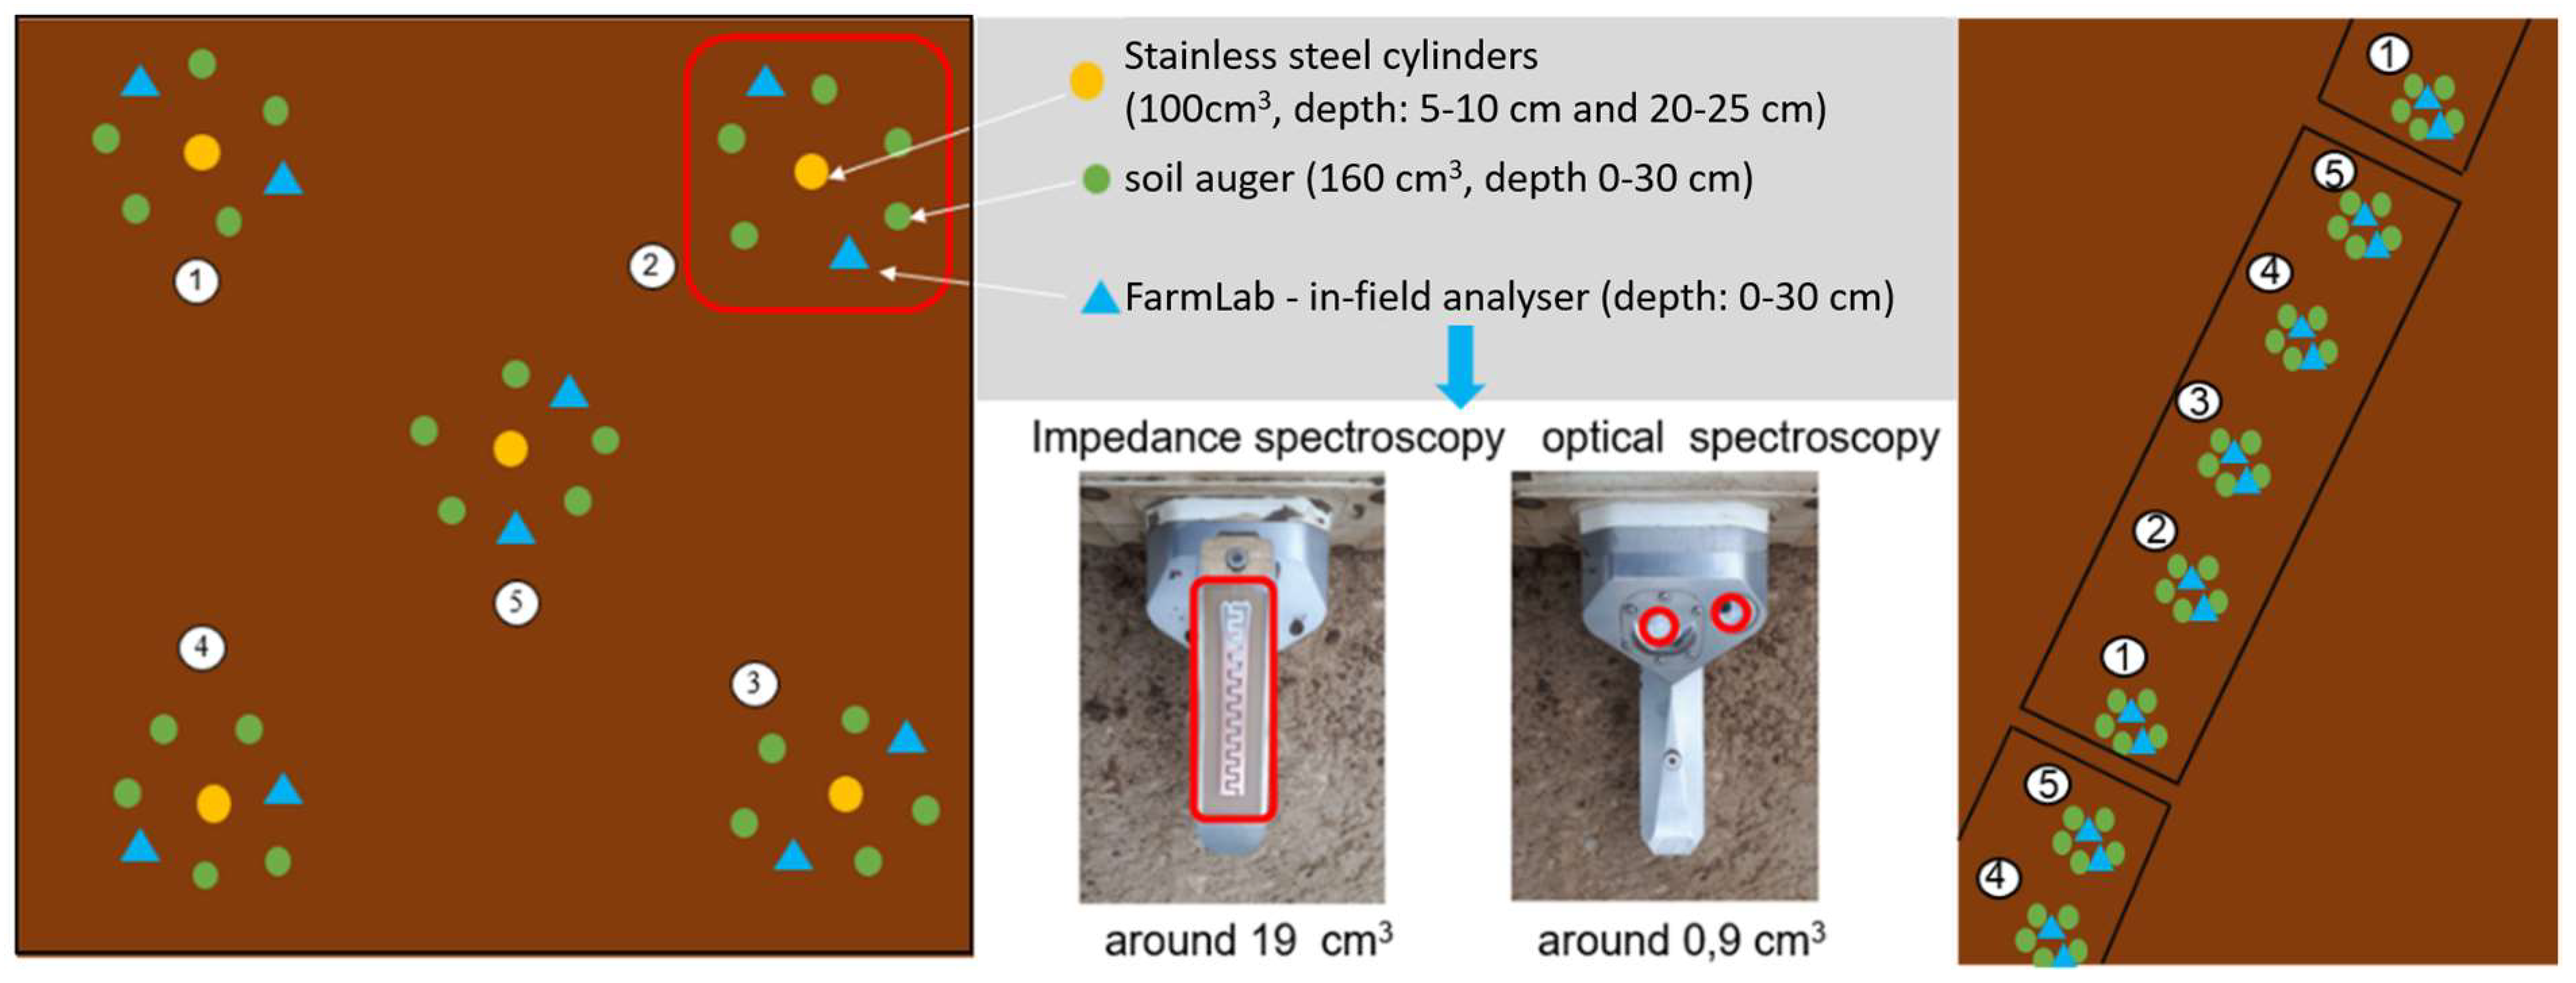
At each site, the sampling plots were laid out according to the following protocol. In Hesse (Sites 4–9), one square plot measuring 2 m² contained five subplots arranged in a 2 × 2 m grid; in Lower Saxony (Sites 1–3), larger fields featured transects of 20 subplots arranged linearly across four plots at Sites 1 and 2 and seven plots at Site 3 (Figure 2). Within each subplot, two independent in-field FarmLab measurements were taken, each consisting of three rapid sub-readings. Subsequently, five soil cores (0–30 cm) were collected with an auger within a 0.5 m radius of the probe insertion point and amalgamated into a composite sample for subsequent laboratory analysis.
2.3. FarmLab In-Field Measurements
The in-field soil moisture content (SOC) measurements were conducted utilizing the Stenon FarmLab portable multi-sensor probe (software version d-1.3.0; calibration model p-2.1.0). The device integrates visible/NIR reflectance (400–2500 nm), electrical impedance spectroscopy (EIS), soil temperature, volumetric moisture, atmospheric humidity, volatile organic compound (VOC) resistance, and GPS reference at the probe tip [27,28]. Operators inserted the spade-mounted probe vertically until a laser-etched collar marked 15 cm depth was reached, in order to ensure consistency. In accordance with the manufacturer’s protocol, the instrument underwent zero-calibration prior to each subplot measurement [32,34]. It is important to note that each point measurement is the mean of three sub-readings. Furthermore, the two-point measurements per subplot were then averaged to yield one SOC value. FarmLab’s proprietary algorithm applies an internal moisture correction based on its on-board soil-moisture sensor, thereby effectively compensating for moisture-induced spectral artefacts [29]. Due to the confidential nature of the calibration functions, no independent spectral modeling was conducted [19,35].
2.4. Laboratory Analysis
Samples composed of composite materials were subjected to air-drying at a temperature of 40 °C. Thereafter, they were sieved to a size of less than 2 mm and subdivided into four aliquots. Two aliquots were analyzed for total carbon (TC) by dry combustion at 1140 °C using a Vario Max Cube elemental analyzer with thermal conductivity detection and helium carrier gas, once at Justus-Liebig University Giessen (TC-Gi) and once at Georg-August University Göttingen (TC-Goe) (DIN 13878). A third aliquot was analyzed by the SoliTOC Cube elemental analyzer (Elementar, Langenselbold, Germany) using temperature-dependent oxidation to separate thermally labile organic carbon (<400 °C) and residual oxidizable carbon (500–600 °C). The results were summed as TOC (DIN 19539;[36]). The fourth aliquot underwent inorganic-carbon removal via HCl fumigation, followed by combustion at up to 1500 °C on an Eltra Helios C/S device at Agrolab GmbH (TOC-acid; [37]). The arithmetic mean of SoliTOC and TOC-acid was defined as the Standard-TOC reference for in-field comparisons.
Bulk density in Hesse was determined from undisturbed stainless steel cylinder cores at two depths per subplot, oven-dried at 105 °C and weighed [38]. In Lower Saxony, the estimation of bulk density was conducted through the utilization of the Rawls pedotransfer function, which utilizes texture and SOC as the primary variables [33].
2.5. Methods Used for Comparison
In order to evaluate FarmLab’s performance against established approaches, eight different soil organic matter (SOM) determination methods were compared (see Table 1). Two laboratory dry-combustion methods (TC-Gi, TC-Goe) measured total carbon (TC), whilst two temperature-differentiated methods (SoliTOC, TOC-acid) quantified total organic carbon (TOC) with distinct separation of organic fractions. Furthermore, four FarmLab in-field outputs (In-field-TOC-1 through In-field-TOC-4) represented successive algorithm versions, including a pH-adjusted model (In-field-TOC-4). The arithmetic mean of SoliTOC and TOC-acid was defined as Standard-TOC for all pairwise comparisons. Statistical equivalence, bias and precision were assessed via Bland-Altman plots, Deming regression and equivalence tests (eirasBA package; [39]).

Table 1.
Overview of soil organic carbon (SOC) measurement methods, including category, method description, and institution.
Table 1.
Overview of soil organic carbon (SOC) measurement methods, including category, method description, and institution.
| Acronym | Category | Method Description | Institution |
|---|---|---|---|
| TC-Gi | Laboratory (TC) | Dry combustion at 1 140 °C (DIN 13878) with thermal conductivity detection (N₂) and He carrier gas; measures total carbon (organic + inorganic). | Justus Liebig University Giessen |
| TC-Goe | Laboratory (TC) | Identical dry-combustion protocol to TC-Gi, performed independently to assess inter-laboratory reliability. | University of Göttingen |
| SoliTOC | Laboratory (TOC) | Temperature-differentiated oxidation (DIN 19539): thermally labile OC < 400 °C + residual OC 500–600 °C; late-stage carbonate breakdown > 650 °C. | Justus Liebig University Giessen |
| TOC-acid | Laboratory (TOC) | Acid fumigation to remove inorganic carbon, then combustion (900–1 500 °C; DIN EN ISO/IEC 17025) to quantify organic C via CO₂ detection. | Agrolab GmbH, Leinefelde |
| Standard-TOC | Reference | Arithmetic mean of the two laboratory TOC methods (SoliTOC + TOC-acid). | — |
| In-field-TOC-1 | In-field (FarmLab) | Baseline SOC estimate from the FarmLab multi-sensor probe, combining visible/NIR spectroscopy and electrical impedance spectroscopy (EIS). | Stenon GmbH |
| In-field-TOC-2 | In-field (FarmLab) | SOC estimate from FarmLab using the first updated calibration algorithm provided by Stenon. | Stenon GmbH |
| In-field-TOC-3 | In-field (FarmLab) | SOC estimate from FarmLab using the second updated calibration algorithm provided by Stenon. | Stenon GmbH |
| In-field-TOC-4 | In-field (FarmLab) | Baseline In-field-TOC-1 output adjusted by empirically derived pH-based correction factors (authors’ modification). | Stenon GmbH / Authors |
2.6. Data Analysis
All data were analyzed in R 4.2 [40]. FarmLab SOC outputs were matched to subplot Standard-TOC values via the unique FarmLab ID. Measurement error (FarmLab – Standard-TOC) was computed for each subplot. Pearson’s correlation coefficients were calculated for error versus soil moisture and pH (measured by Agrolab GmbH via CaCl₂ method [38]). Bland-Altman analyses (blandr package [41]) quantified mean bias and 95 % limits of agreement, and Deming regression (deming package [42]) assessed structural accuracy and precision.
We further refined our method-comparison framework by applying the extended Bland-Altman tests in three formal steps, implemented via the eirasBA package with 30 000 bootstrapped resamples for robust confidence intervals [39]. In brief, for each pairwise comparison of SOC methods we tested:
Structural Mean Equality (Accuracy).We tested whether the average difference between two methods is statistically zero by fitting an analysis of covariance (ANCOVA) with the reference method as covariate and treatment method as factor, incorporating measurement error as described by Hedberg & Ayers [43]. Rejection of the null hypothesis indicates a systematic bias in mean SOC estimates.
Structural Variance Equality (Precision).We examined whether the variability of measurement errors differs between methods by comparing error variances via regression-based variance tests [44,45]. A significant result denotes unequal precision.
Agreement with the True Bisector (Concordance).Using Deming regression [42], we tested whether the intercept equals zero and the slope equals one — i. e. whether the two methods lie on the 1:1 identity line. Failure to reject either parameter’s null hypothesis indicates concordance in both scale and location.
All three tests were run at a 5 % significance level, and 95 % confidence intervals for means, variances and regression parameters were obtained via bootstrapping [46]. Outcomes from these tests were synthesized to determine which methods met all criteria for equivalence in accuracy, precision and concordance.
3. Results
3.1. Descriptive Statistics of SOC Methods
Descriptive statistics for all eight SOC determination methods are summarized in Table 2. Across the three uncorrected FarmLab algorithms (In-field-TOC-1–3), SOC was on average overestimated by +0.24 % relative to Standard-TOC (mean bias +0.20–0.27 %). Incorporating the pH correction (In-field-TOC-4) cut that bias roughly in half (to +0.11 %) and reduced the pooled standard deviation from 0.27 % to 0.23 %. By comparison, the two dry-combustion labs (TC-Gi, TC-Goe) differed from Standard-TOC by only +0.04–0.06 % (SD ≈ 0.20 %). These results confirm that In-field-TOC-4 is the most unbiased and precise in-field algorithm under our conditions.
Table 2.
Mean soil organic carbon (SOC), standard deviation and bias relative to Standard-TOC (n = 100).
Table 2.
Mean soil organic carbon (SOC), standard deviation and bias relative to Standard-TOC (n = 100).
| Method | Mean SOC ± SD (%) | Bias vs Standard-TOC (%) |
|---|---|---|
| SoliTOC | 1.26 ± 0.22 | -0.03 |
| TOC-acid | 1.32 ±0.20 | +0.03 |
| TC-Goe | 1.33 ± 0.21 | +0.04 |
| TC-Gi | 1.35 ± 0.19 | +0.06 |
| Standard-TOC | 1.29 ± 0.21 | 0.00 |
| In-field-TOC-1 | 1.49 ± 0.28 | +0.20 |
| In-field-TOC-2 | 1.56 ± 0.27 | +0.27 |
| In-field-TOC-3 | 1.54 ± 0.25 | +0.25 |
| In-field-TOC-4 | 1.40 ± 0.23 | +0.11 |
3.2. Correlation of SOC Error with Soil Properties
We assessed whether the subplot-wise SOC measurement error of the baseline FarmLab algorithm (In-field-TOC-1) (defined as In-field-TOC-1 SOC minus Standard-TOC) was influenced by soil pH, carbonate content (TIC900), or volumetric soil moisture, all recorded in our dataset. Pearson’s correlation coefficients (n = 100) are presented in Error! Reference source not found..
Table 3.
Correlation of FarmLab SOC error with soil pH and soil moisture.
| Relationship | Pearson’s r | p-value |
|---|---|---|
| In-field-TOC-1 error vs. soil pH | -0.39 | < 0.01 ** |
| In-field-TOC-1 error vs. TIC900 | -0.10 | 0.31 (n.s.) |
| In-field-TOC-1 error vs. soil moisture | -0.14 | 0.16 (n.s.) |
The negative correlation between SOC_error and pH (r = –0.39, p < 0.01) indicates that lower pH soils tend to produce larger positive errors (overestimation by FarmLab), whereas higher pH soils yield smaller biases. In contrast, no significant relationship was found between SOC_error and soil moisture (r = –0.14, p > 0.05), suggesting that the FarmLab’s integrated moisture sensor effectively compensates for moisture-induced spectral artefacts.
3.3. Pairwise Method Comparison by Deming Regression and Bland-Altman Analysis
To assess structural agreement and systematic bias between each in-field algorithm and the Standard-TOC reference, we first conducted Deming regression analyses (Error! Reference source not found.). The intercept and slope of a Deming fit quantify location and scale agreement: an ideal method lies exactly on the identity line (intercept = 0, slope = 1). In our comparisons, In-field-TOC-4 showed the closest proximity to these ideal parameters (intercept = 0.05 ± 0.06 %, slope = 0.97 ± 0.04), followed by In-field-TOC-1 (intercept = 0.18 ± 0.07 %, slope = 1.10 ± 0.05). The uncorrected algorithms (TOC-2, TOC-3) exhibited larger intercepts and slopes further from unity, indicating both constant and proportional bias. By contrast, laboratory methods TC-Gi and TC-Goe yielded intercepts and slopes statistically indistinguishable from (0,1), confirming strong equivalence between the two dry-combustion laboratories.
Table 4.
Deming regression intercepts, slopes and coefficients of determination (R²) for selected method pairs (n = 100).
Table 4.
Deming regression intercepts, slopes and coefficients of determination (R²) for selected method pairs (n = 100).
| Method Pair | Intercept (±SE) % | Slope (±SE) | R² |
|---|---|---|---|
| In-field-TOC-1 vs Standard-TOC | 0.18 ± 0.07 | 1.10 ± 0.05 | 0.83 |
| In-field-TOC-4 vs Standard-TOC | 0.05 ± 0.06 | 0.97 ± 0.04 | 0.79 |
| TC-Gi vs Standard-TOC | 0.06 ± 0.02 | 1.01 ± 0.02 | 0.92 |
| TC-Goe vs Standard-TOC | 0.04 ± 0.02 | 1.00 ± 0.02 | 0.93 |
Next, Bland-Altman plots quantify the mean bias and 95 % limits of agreement (LoA) between methods (Error! Reference source not found.; Error! Reference source not found.).
Figure 3.
Bland-Altman plots for In-field-TOC-1 (A) and In-field-TOC-4 (B) versus Standard-TOC. X-axes: Mean of methods TOC (%), y-axes: Differences between methods TOC (%). Upper and lower line: tolerance range: 1.96 times of standard deviation of the mean difference, middle line: mean of the differences (n=100).
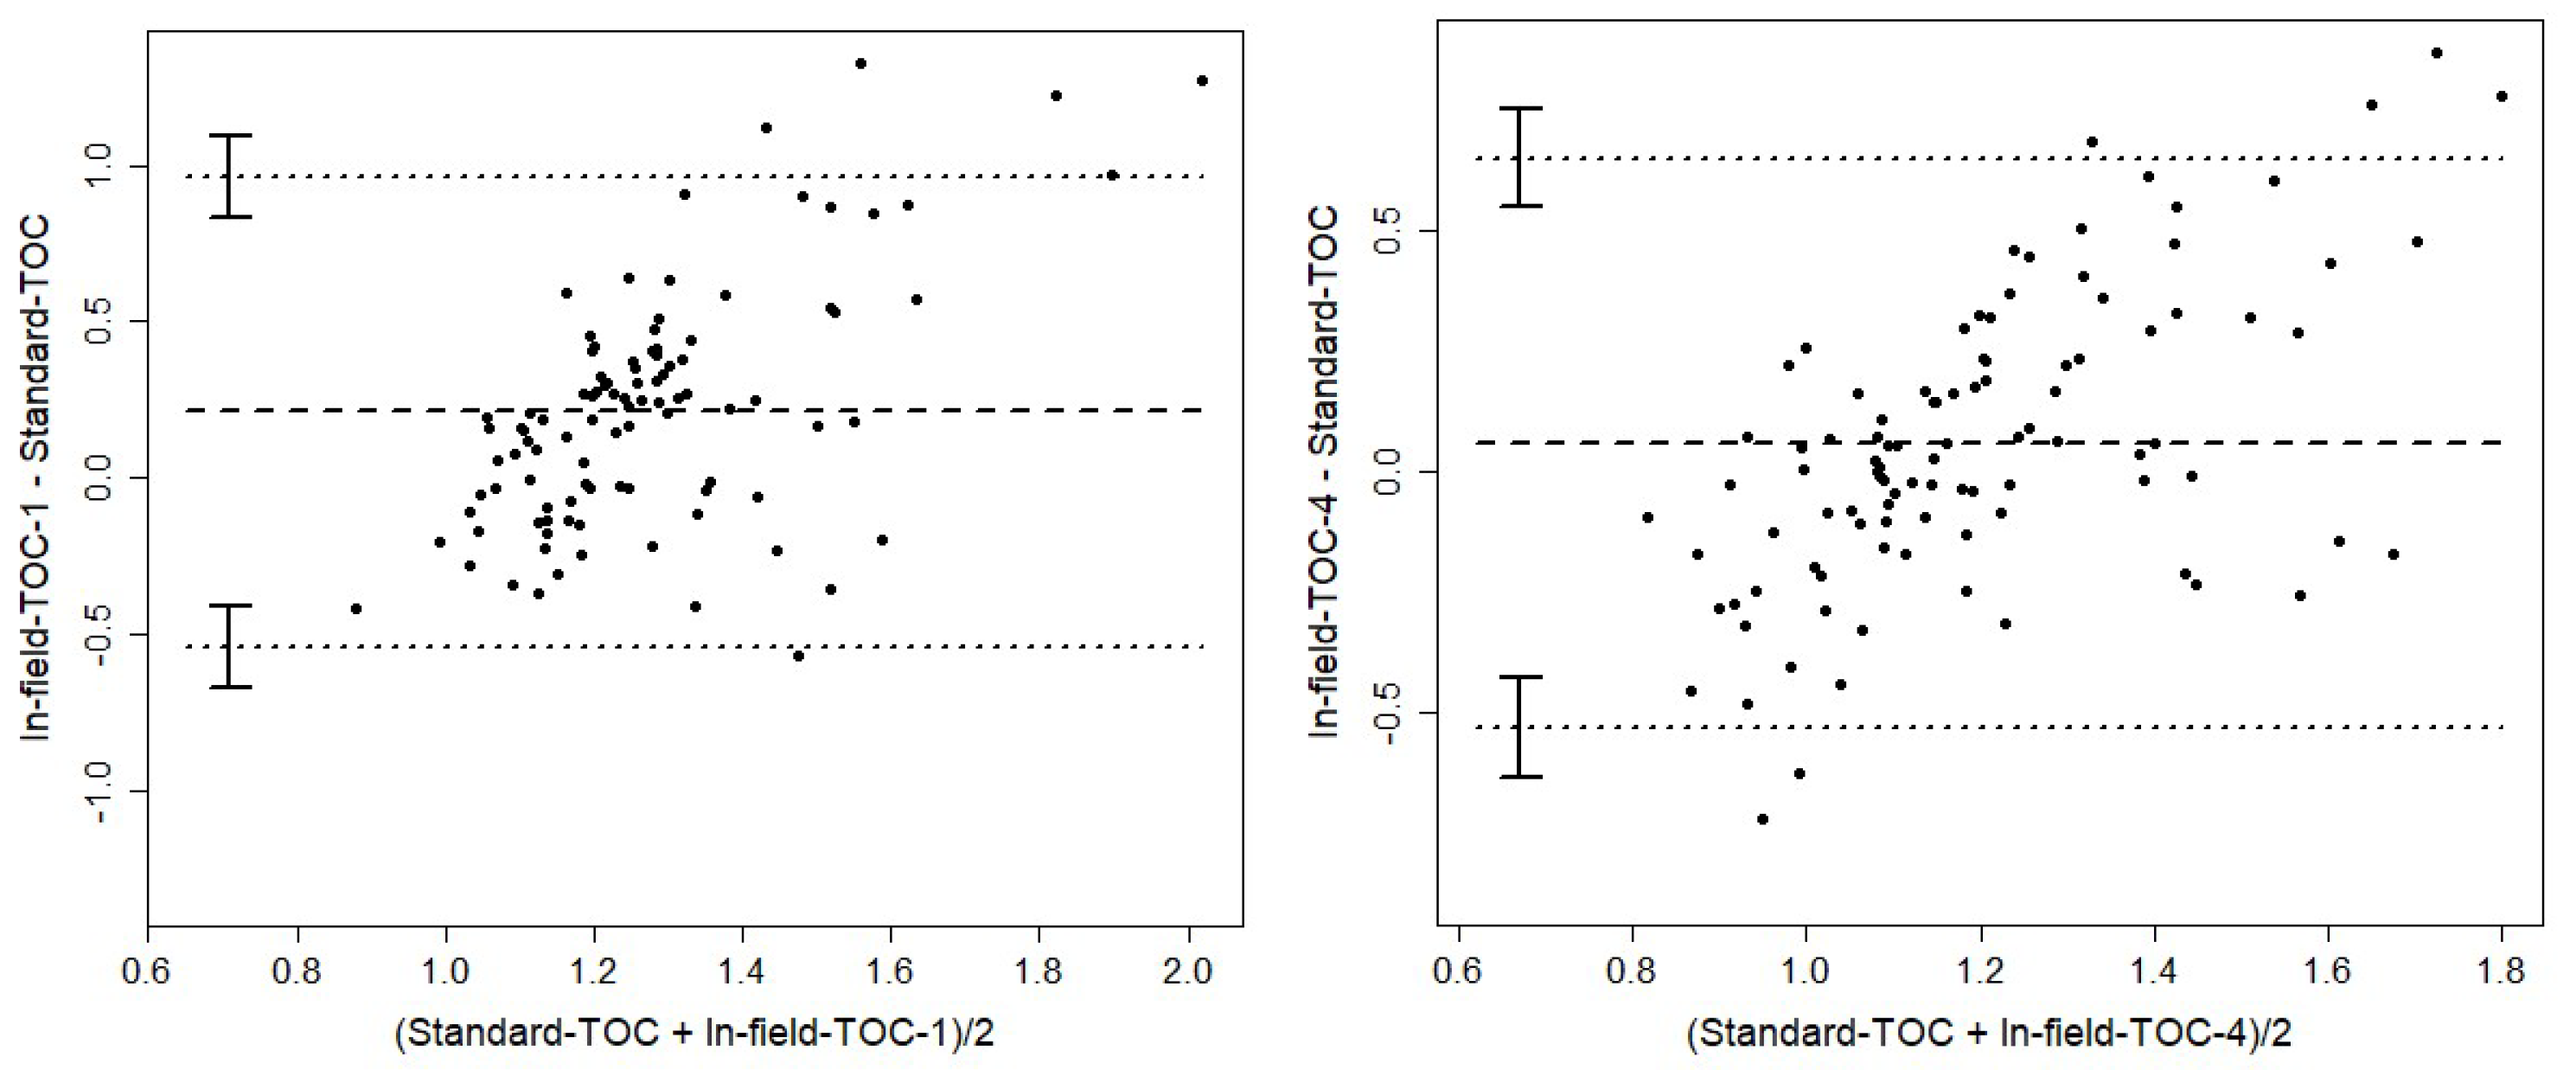
In-field-TOC-1 exhibited a mean positive bias of +0.20 % SOC and wide LoA (–0.35 to +0.75 %), whereas In-field-TOC-4 reduced both bias (+0.11 %) and LoA (–0.27 to +0.49 %), reflecting improved equivalence. Laboratory replicates TC-Gi and TC-Goe had negligible bias (+0.05 %) and narrow LoA (–0.12 to +0.22 %), underscoring their mutual consistency.
Table 5.
Mean biases and 95 % limits of agreement (LoA) from Bland-Altman analyses (n = 100).
| Method Pair | Mean Bias (%) | 95 % LoA (%) |
|---|---|---|
| In-field-TOC-1 vs Standard-TOC | +0.20 | –0.35 to +0.75 |
| In-field-TOC-4 vs Standard-TOC | +0.11 | –0.27 to +0.49 |
| TC-Gi vs TC-Goe | +0.05 | –0.12 to +0.22 |
Together, these pairwise comparisons demonstrate that the pH-adjusted algorithm (In-field-TOC-4) achieves the best overall alignment with laboratory standards, substantially reducing both constant and proportional errors, while uncorrected in-field methods retain significant biases.
3.4. Inferential Comparison of SOC Methods
Equivalence between each SOC method and the Standard-TOC reference was evaluated using the all.structural.tests function in the eirasBA package with 30 000 bootstrap resamples [39]. Three criteria were evaluated at α = 0.05: structural mean equality (accuracy), variance equality (precision), and bisector agreement (concordance). The results (Error! Reference source not found.) reveal that no method satisfied all three tests simultaneously.
Table 6.
Equivalence tests for SOC method pairs (n = 100), showing both pass/fail and the underlying p-values for accuracy (mean equality), precision (variance equality) and concordance (bisector agreement: intercept/slope). method passed (“✔”) or failed (“✘”).
Table 6.
Equivalence tests for SOC method pairs (n = 100), showing both pass/fail and the underlying p-values for accuracy (mean equality), precision (variance equality) and concordance (bisector agreement: intercept/slope). method passed (“✔”) or failed (“✘”).
| Method Pair | Accuracy p-value | Precision p-value | Concordance p-value (Int/Slope) | Accuracy | Precision | Concordance |
|---|---|---|---|---|---|---|
| TC-Gi vs TC-Goe | 0.0030 | 0.0842 | 0.1055/0.0613 | ✘ | ✔ | ✔ |
| SoliTOC vs TOC-acid | 0.0028 | 0.0085 | 0.1147/0.1212 | ✘ | ✔ | ✔ |
| Std-TOC vs In-field-TOC-1 | < 0.0001 | 0.0842 | 0.2401/0.1116 | ✘ | ✔ | ✔ |
| Std-TOC vs In-field-TOC-2 | < 0.0001 | < 0.0001 | 0.0116/0.2401 | ✘ | ✘ | ✔ |
| Std-TOC vs In-field-TOC-3 | < 0.0001 | < 0.0001 | 0.1690/0.2299 | ✘ | ✘ | ✔ |
| Std-TOC vs In-field-TOC-4 | 0.3250 | 0.0087 | 0.1157/0.1212 | ✔ | ✘ | ✔ |
Both laboratory comparisons (TC-Gi vs TC-Goe and SoliTOC vs TOC-acid) achieved precision (p > 0.05) and concordance (intercept/slope p > 0.05) but failed the accuracy test (p < 0.01). The baseline FarmLab algorithm (In-field-TOC-1) similarly passed precision and concordance yet exhibited significant bias (accuracy p < 0.0001). The two uncorrected in-field updates (In-field-TOC-2/3) managed only concordance (p > 0.05) but failed both accuracy and precision (p < 0.0001). Although the pH-corrected model (In-field-TOC-4) met the accuracy criterion (p = 0.3250) and showed concordance (p > 0.05), it failed the precision test (p = 0.0087).
4. Discussion
4.1. Key Insights and Their Implications
Our comparison of eight SOC methods confirms that the default FarmLab chemometric model consistently overestimates soil carbon, while a straightforward pH correction cuts that bias roughly in half and yields precision approaching laboratory standards. Crucially, the absence of a moisture effect demonstrates that FarmLab’s integrated humidity sensor successfully neutralizes one of the biggest hurdles in field spectroscopy. In contrast, the persistent pH–error relationship highlights acidity as a primary driver of spectral artefacts and reinforces findings from others that acidity must be explicitly accounted for in proximal sensing models [12,47].
From a methodological standpoint, our Deming and Bland–Altman analyses show that even the pH-adjusted variant cannot fully replicate laboratory precision. This “residual variance” underscores the need for further model refinement—perhaps by integrating additional soil covariates such as texture or carbonate content—and suggests that any in-field SOC sensor must be embedded in a broader calibration framework.
Practically, these insights point the way to a hybrid approach: leverage FarmLab’s low cost and moisture robustness for high-density mapping of relative SOC patterns, but anchor critical change-detection decisions to periodic laboratory benchmarks and expanded covariate calibration. Such a strategy marries the speed and affordability of field sensors with the accuracy and rigor required for carbon-farming Monitoring, Reporting and Verification MRV.
4.2. Accuracy and Precision of FarmLab
While laboratory-grade SOC measurements via dry combustion typically achieve accuracies within ±0.15 % SOC [48], our uncorrected FarmLab outputs exceeded this threshold, reflecting the well-documented challenge of translating benchtop calibrations into field environments. Loria et al. [30] reviewed numerous handheld in situ SOC probes and emphasized that multisensor fusion—such as combining VIS–NIR with electrical conductivity or impedance—can substantially improve prediction accuracy by compensating for individual sensor limitations, provided that extraneous influences are removed via preprocessing (e.g., EPO or SNV) and that key covariates are incorporated into calibration models. In our study, a simple pH adjustment halved the mean bias (from +0.20–0.27 % down to +0.11 %) and tightened variability (SD from ~0.27 % to 0.23 %), bringing FarmLab closer to the Giessen and Göttingen dry-combustion laboratories. Nevertheless, formal equivalence testing still flagged a precision shortfall (p = 0.0087), indicating that the variance remains significantly different from the laboratory reference (Table 6). This pattern aligns with Angelopoulou et al. [13], who found that even multisensor fusion schemes require explicit inclusion of pH, texture, and other site-specific covariates to achieve laboratory-grade concordance
4.3. Influence of Soil pH and Moisture on In-Field SOC Estimates
Our results confirm that FarmLab’s integrated moisture sensor and internal correction algorithm effectively alleviate the common spectral artefacts caused by variable soil water content. The non-significant correlation between In-field-TOC-1 error and volumetric moisture (r = –0.14, p = 0.16) aligns with findings by Vikuk et al. [29], who reported minimal moisture bias when combining NIR and EIS sensors in situ [29]. This robustness to moisture fluctuations reduces the need for extensive field drying or gravimetric moisture correction, streamlining the sampling workflow and lowering operational costs.
In contrast, soil pH emerged as a dominant driver of residual bias. The strong negative correlation between SOC error and pH (r = –0.39, p < 0.01) reflects well-known effects of acidity on optical and electrochemical sensor responses [12,47,50]. Low-pH soils likely alter the chemical speciation and light-scattering properties of organic matter, resulting in systematic overestimation by unadjusted models. By incorporating an empirically derived pH correction, we reduced mean bias by nearly 50 % (from +0.20 % to +0.11 %) and narrowed the limits of agreement — an improvement consistent with recommendations to include pH as a calibration covariate in proximal sensing applications [51].
Moreover, Vogel et al. [52] demonstrated that the performance of in situ pH sensors — and hence the effectiveness of pH-based SOC corrections — depends critically on calibration sample size and the spatial and temporal proximity of reference samples [52]. This implies that FarmLab’s pH correction factors should be periodically updated using locally collected calibration samples to maintain optimal accuracy.
Where available, soil buffering capacity and carbonate content (TIC900) could further refine these corrections [53], although our data showed no significant direct influence of TIC900 alone (r = –0.10, p = 0.31). Likewise, soil porosity or water-filled pore space (WFPS) may impact both optical and impedance measurements by altering light scattering and conductive pathways in the pore network [29]. Future algorithm development should, therefore, focus on multivariate calibration frameworks that jointly account for pH, texture, porosity/WFPS, and other site-specific factors, as demonstrated by multisensory fusion approaches in the literature [18,30]. This targeted adjustment strategy preserves FarmLab’s moisture resilience while addressing its remaining pH-driven limitations.
4.4. Applicability in Carbon-Farming Frameworks
Accurate and cost-effective SOC measurements are essential to MRV protocols, which typically require annual change detection at around ±0.3 % SOC [48]. Although pH-corrected In-field-TOC-4 narrows its Bland–Altman limits to –0.27/+0.49 %—approaching this benchmark—it still slightly exceeds the target range and failed the formal precision test (p = 0.0087), indicating that its variance remains higher than acceptable for standalone certification. Its per-sample cost (~ €3–4) in this study—comprising FarmLab rental fees and field labor (see Materials & Methods, Sec 2.3)—is an order of magnitude lower than conventional laboratory analysis (€44 per sample, including GPS-referenced composite sampling and Agrolab GmbH service charges; Sec 2.2–2.3). This cost advantage enables much denser sampling, which is critical for capturing spatial heterogeneity and reducing overall uncertainty in carbon-farming MRV systems [54].
Since soil carbon sequestration is inherently non-permanent and requires ongoing monitoring [55], and because no in-field method yet meets all three equivalence criteria (accuracy, precision, concordance), we advocate a hybrid MRV framework. Routine, high-frequency pH-corrected in-field measurements can track spatial and temporal dynamics, while periodic laboratory analyses serve to validate long-term changes and recalibrate in-field models. Such an approach balances the need for spatial and temporal resolution with the rigor of laboratory benchmarks, providing both practical monitoring density and certification-grade accuracy.
4.5. Methodological Limitations
Despite the advances demonstrated here, several methodological constraints temper our conclusions. First, the proprietary nature of FarmLab’s chemometric algorithms prevents full transparency and independent recalibration [32]. Without access to raw spectral coefficients, our pH-adjustment represents a pragmatic workaround rather than a fundamental model re-development. Second, although our subplot-level dataset (n = 100) provides robust statistical power for the tests applied, it remains moderate in size and spatial scope; longer-term, multi-season trials across diverse soil types will be needed to generalize findings [56].
Moreover, Roper et al. [56] showed that even established SOM assays can diverge substantially across sites and methods, underscoring the need to maintain a consistent SOC protocol over time or to apply site-specific calibration when switching assays [57].
Third, the FarmLab probe measures directly at ~ 10–15 cm depth and extrapolates to 30 cm via its internal models, rather than sampling the full profile physically. This may misrepresent SOC distribution in stratified soils, particularly where root-zone carbon differs markedly with depth [53]. Fourth, while moisture artefacts appear well-controlled, extreme moisture gradients or surface-crusting conditions may still challenge the EIS and NIR sensors under real field conditions [29].
Finally, our assessment focused on SOC concentration without direct SOC stock calculations; accurate stock estimation requires concurrent bulk density measurements in situ, which FarmLab currently does not provide [58]. Integrating a soil-compaction sensor or spatially explicit bulk density maps would therefore strengthen the device’s utility for carbon-stock monitoring. Acknowledging these limitations guides future research and underscores that, while FarmLab shows promise, it should be deployed within a hybrid framework that retains laboratory validation for high-stakes carbon accounting.
4.6. Comparison with Other In-Situ Sensor Platforms
Our results for FarmLab reflect a common theme in proximal-sensing research: while combining multiple sensors can substantially improve SOC estimates, achieving laboratory-level precision still hinges on site-specific calibration. For example, Dhawale et al. [59] showed that integrating visible/NIR reflectance with electrical conductivity yields R² values up to 0.85 in Canadian fields — but only after extensive wet- and dry-season recalibration [59]. Likewise, the Yardstick probe, which extends its spade-mounted array to 50 cm depth, achieves ±0.5 % bias only once soil-moisture and texture corrections are applied; yet still requires laboratory anchoring of its proprietary models [60].
More recently, Gyawali et al. [61] demonstrated that a handheld Vis-NIR sensor can reliably profile SOC down to 45 cm with accuracy on par with conventional field campaigns, underscoring the promise of deep-profiling spade probes [61]. Reviews by Mokere et al. [17] and Gowera et al. [22] similarly report that most mobile and miniaturized spectrometers only attain ±0.3–0.7 % SOC error after incorporating covariates such as pH and clay content [17,22]. Sanderman et al. [62] further highlight that fusing benchtop MIR libraries with proximal spectra can detect multi-year SOC changes across diverse U.S. trials, boosting change-detection sensitivity in field sensors [62]. Even unsupervised learning on regional Vis-NIR libraries can reduce errors to ±0.3 %, though ancillary soil data remain essential [23]. In this context, FarmLab’s fusion of visible/NIR, EIS, and environmental sensing — augmented by our pH-based adjustment — delivers performance at the lower end of this error spectrum (±0.27–0.49 % LoA), demonstrating that thoughtful covariate integration can bring in-field estimates close to laboratory standards. Crucially, FarmLab’s low per-sample cost (~ €3–4) and rapid deployment strike a practical balance between affordability and precision when accompanied by robust calibration protocols.
4.7. Future Directions
Building on our findings, we identify several opportunities to enhance in-field SOC sensing and integrate FarmLab more fully into carbon-farming practice. First, longitudinal field trials are needed to assess temporal stability and repeatability at fixed monitoring points, as demonstrated for mineral-N sensing [29]. Such repeated measurements under varying environmental conditions will help quantify device drift and inform automated Quality Control routines.
Second, the integration of soil bulk density measurement into the probe design or acquisition of concurrent bulk density maps (e. g., via proximal gamma-ray attenuation) would permit direct calculation of SOC stocks rather than concentrations alone, addressing a key limitation for carbon-accounting [58].
Third, expanding the calibration library with diverse soil types and management histories — potentially through federated spectral databases like LUCAS — would improve model transferability across regions [11,63]. In particular, incorporation of texture and mineralogy covariates in a multivariate calibration framework could further reduce pH- and carbonate-related biases [12,18].
Fourth, data fusion combining FarmLab measurements with drone- and satellite-based spectral imagery offers the promise of scaling plot-level readings to field and landscape scales, as explored by others [14,64]. Hybrid models could leverage high-resolution in-field data for ground-truthing remote predictions, yielding robust SOC maps for MRV systems.
Finally, embedding machine-learning pipelines that dynamically update calibration models based on ongoing field data (e.g., via active learning) could maintain accuracy in the face of seasonal and management-induced soil changes. Such adaptive approaches align with the vision of precision carbon farming as a continuously optimized system [49].
Implementing these recommendations will move FarmLab, and similar in-situ SOC sensors, toward reliable, scalable tools for high-density, cost-effective soil-carbon monitoring, fulfilling both scientific and practical requirements of carbon-farming initiatives.
5. Conclusions
Our first independent field validation of the FarmLab multi-sensor probe under temperate European arable conditions shows that its default model overestimates SOC by +0.20–0.27 % (SD 0.25–0.28 %), while a simple pH correction halves that bias (+0.11 %, SD 0.23 %) and moisture effects are effectively neutralized. However, formal equivalence testing confirms that even the pH-corrected algorithm cannot yet match laboratory precision and concordance.
Economically, FarmLab’s per-sample cost of ~ €3–4 (versus ~ €44 for GPS-referenced lab analysis) enables high-density mapping essential for carbon-farming MRV. We therefore advocate a hybrid approach: use routine, pH-corrected in-field measurements to capture spatial and temporal trends, anchored by periodic laboratory benchmarks to ensure certification-grade accuracy.
Looking forward, improving FarmLab’s performance will depend on expanding calibration across diverse soils, integrating bulk-density data, and adopting adaptive, data-driven calibration algorithms—steps that together can elevate low-cost in-field sensing to near-laboratory standards and support scalable, cost-effective soil-carbon monitoring.
Author Contributions
Conceptualization, validation, formal analysis, methodology and investigation, L.K., A.G., C.V., C.A., E-M.L.M. and A.Ö.; data curation, L.K., C.V., A.Ö. and C.A.; writing—original draft preparation, L.K.; writing—review and editing, L.K., E-M.L.M., W.N., J.C.B. and A.G.; visualization, L.K., C.V. and A.Ö.; supervision, A.G.; project administration, A.G.; funding acquisition, L.K. and A.G. All authors have read and agreed to the published version of the manuscript.
Funding
This research was partially funded by the European Innovation Partnership for Agricultural Productivity and Sustainability (EIP-AGRI) and the Rural Development Programme of Hesse 2014–2020 (EPLR), within the project “Humuvation – Innovative cultivation systems to promote yield stability and humus formation.” The APC was not funded.
Data Availability Statement
Data from this study are available from the corresponding author upon request.
Acknowledgments
We would like to express our gratitude to Stenon GmbH (Stenon GmbH, Zeppelinstraße 10, 14471 Potsdam, Germany) for providing the FarmLab device and granting access to the different measurement data, which were instrumental in conducting this study. Their support enabled us to critically assess the performance of the FarmLab device in comparison to established laboratory methods. Furthermore, we sincerely acknowledge the financial support from EIP-Agri Humuvation, which was funded by the European Union and the State of Hesse. This funding facilitated the soil sampling and laboratory analysis, without which this research would not have been possible.
Conflicts of Interest
The authors declare no conflicts of interest.
Abbreviations
The following abbreviations are used in this manuscript:
| ANCOVA | Analysis of covariance |
| EIS | Electrical impedance spectroscopy |
| MIR | Mid-infrared spectroscopy |
| MRV | Monitoring, Reporting and Verification |
| NIRS | Near-infrared spectroscopy |
| SOC | Soil organic carbon |
| SOM | Soil organic matter |
| TC | Total carbon |
| TOC | Total organic carbon |
| VOC | Volatile organic compounds |
| WFPS | Water-filled pore space |
References
- Bünemann, EK, Bongiorno, G, Bai, Z, Creamer, RE, Deyn, G de, Goede, R de, Fleskens, L, Geissen, V, Kuyper, TW & Mäder, P et al. 2018 Soil quality – A critical review. Soil Biology and Biochemistry 120, 105–125. [CrossRef]
- Oldfield, SF, Olwell, P, Shaw, N & Havens, K. 2019 Conservation of Plant Species. Seeds of Restoration Success, 41–57. [CrossRef]
- Lal, R. 2013 Soil carbon management and climate change. Carbon Management 4, 439–462. [CrossRef]
- European Commission 2021. 2025 The Green Deal. https://eur-lex.europa.eu/legal-content/DE/TXT/?uri=CELEX:52019DC0640. Accessed 19 April 2025.
- Fuss, S, Canadell, JG, Ciais, P, Jackson, RB, Jones, CD, Lyngfelt, A, Peters, GP & van Vuuren, DP. 2020 Moving toward Net-Zero Emissions Requires New Alliances for Carbon Dioxide Removal. One Earth 3, 145–149. [CrossRef]
- Schenuit, F, Colvin, R, Fridahl, M, McMullin, B, Reisinger, A, Sanchez, DL, Smith, SM, Torvanger, A, Wreford, A & Geden, O. 2021 Carbon Dioxide Removal Policy in the Making: Assessing Developments in 9 OECD Cases. Front. Clim. 3, 638805. [CrossRef]
- Fridahl, M, Schenuit, F, Lundberg, L, Möllersten, K, Böttcher, M, Rickels, W & Hansson, A. 2023 Novel carbon dioxide removals techniques must be integrated into the European Union’s climate policies. Commun Earth Environ 4. [CrossRef]
- McCarty, GW, Reeves, JB, Reeves, VB, Follett, RF & Kimble, JM. 2002 Mid-Infrared and Near-Infrared Diffuse Reflectance Spectroscopy for Soil Carbon Measurement. Soil Science Soc of Amer J 66, 640–646. [CrossRef]
- Reeves, JB. 2010 Near- versus mid-infrared diffuse reflectance spectroscopy for soil analysis emphasizing carbon and laboratory versus on-site analysis: Where are we and what needs to be done? Geoderma 158, 3–14. [CrossRef]
- O’ Rourke, SM & Holden, NM. 2011 Optical sensing and chemometric analysis of soil organic carbon – a cost effective alternative to conventional laboratory methods? Soil Use and Management 27, 143–155. [CrossRef]
- Stevens, A, Nocita, M, Tóth, G, Montanarella, L & van Wesemael, B. 2013 Prediction of Soil Organic Carbon at the European Scale by Visible and Near InfraRed Reflectance Spectroscopy. PloS one 8, e66409. [CrossRef]
- Dorantes, MJ, Fuentes, BA & Miller, DM. 2024 Subsetting reduces the error of MIR spectroscopy models for soil organic carbon prediction in the U.S. Great Plains. Soil Security 16, 100145. [CrossRef]
- Angelopoulou, T, Balafoutis, A, Zalidis, G & Bochtis, D. 2020 From Laboratory to Proximal Sensing Spectroscopy for Soil Organic Carbon Estimation—A Review. Sustainability 12, 443. [CrossRef]
- Croft, H, Kuhn, NJ & Anderson, K. 2012 On the use of remote sensing techniques for monitoring spatio-temporal soil organic carbon dynamics in agricultural systems. CATENA 94, 64–74. [CrossRef]
- Bricklemyer, RS & Brown, DJ. 2010 On-the-go VisNIR: Potential and limitations for mapping soil clay and organic carbon. Computers and Electronics in Agriculture 70, 209–216. [CrossRef]
- Debaene, G, Bartmiński, P & Siłuch, M. 2023 In Situ VIS-NIR Spectroscopy for a Basic and Rapid Soil Investigation. Sensors 23. [CrossRef]
- Mokere, R, Ghassan, M & Barra, I. 2024 Soil Spectroscopy Evolution: A Review of Homemade Sensors, Benchtop Systems, and Mobile Instruments Coupled with Machine Learning Algorithms in Soil Diagnosis for Precision Agriculture. Critical reviews in analytical chemistry, 1–20. [CrossRef]
- Viscarra Rossel, RA, Lobsey, CR, Sharman, C, Flick, P & McLachlan, G. 2017 Novel Proximal Sensing for Monitoring Soil Organic C Stocks and Condition. Environmental science & technology 51, 5630–5641. [CrossRef]
- Biney, JKM, Blöcher, JR, Bell, SM, Borůvka, L & Vašát, R. 2022 Can in situ spectral measurements under disturbance-reduced environmental conditions help improve soil organic carbon estimation? The Science of the total environment 838, 156304. [CrossRef]
- Pei, X, Sudduth, KA, Veum, KS & Li, M. 2019 Improving In-Situ Estimation of Soil Profile Properties Using a Multi-Sensor Probe. Sensors 19, 1011. [CrossRef]
- Grunwald, S, Murad, MOF, Farrington, S, Wallace, W & Rooney, D. 2024 Multi-Sensor Soil Probe and Machine Learning Modeling for Predicting Soil Properties. Sensors 24, 6855. [CrossRef]
- Gowera, GT, Sorenson, P, Bedard-Haughn, A, Rivard, B, Peak, D & Feng, J. 2024 Evaluating performance of miniaturized spectrometers in predicting soil properties using multivariate statistical analysis. Can. J. Soil. Sci. 104, 216–226. [CrossRef]
- Miloš, B & Bensa, A. 2024 Organic carbon estimation in a regional soil Vis-NIR database supported by unsupervised learning and chemometrics techniques. Soil Advances 2, 100013. [CrossRef]
- Yang, P, Wang, Y, Hu, B, Li, S, Chen, S, Luo, D & Peng, J. 2024 Predicting soil organic carbon content using simulated insitu spectra and moisture correction algorithms in southern Xinjiang, China. Geoderma Regional 37, e00783. [CrossRef]
- Shi, L, Daly, K & O’Rourke, S. 2025 Estimating mineral-associated organic carbon saturation and sequestration potential using MIR spectral based local quantile regression. Geoderma 454, 117181. [CrossRef]
- Zhou, T, Jia, C, Zhang, K, Yang, L, Zhang, D, Cui, T & He, X. 2023 A rapid detection method for soil organic matter using a carbon dioxide sensor in situ. Measurement 208, 112471. [CrossRef]
- Veris Technologies. 2025 Soil Scanning Sensors for Agriculture. https://www.veristech.com/sensing. Accessed 17 April 2025.
- Laskar, S & Mukherjee, S. 2016 Optical Sensing Methods for Assessment of Soil Macronutrients and other Properties for Application in Precision Agriculture:A review. ADBU Journal of Engineering Technology 4.
- Vikuk, V, Spirkaneder, A, Noack, P & Duemig, A. 2024 Validation of a sensor-system for real-time measurement of mineralized nitrogen in soils. Smart Agricultural Technology 7, 100390. [CrossRef]
- Loria, N, Lal, R & Chandra, R. 2024 Handheld In Situ Methods for Soil Organic Carbon Assessment. Sustainability 16, 5592. [CrossRef]
- Xie, A, Zhou, Q, Fu, L, Zhan, L & Wu, W. 2024 From Lab to Field: Advancements and Applications of On-The-Go Soil Sensors for Real-Time Monitoring. Eurasian Soil Sc. 57, 1730–1745. [CrossRef]
- Steiger, A, Qaswar, M, Bill, R, Mouazen, AM & Grenzdörffer, G. 2025 Comparing the handheld Stenon FarmLab soil sensor with a Vis-NIR multi-sensor soil sensing platform. Smart Agricultural Technology 10, 100717. [CrossRef]
- RAWLS, WJ. 1983 Estimating Soil Bulk Density From Particle Size and Organic Mater Content. Soil Science 135.
- Stenon. 2024 Sachgerechte Validierung von FarmLab. https://blog.stenon.io/wp-content/uploads/2021/11/2021-09-16-Sachgerechte-Validierung-von-FarmLab_final.pdf.
- Dai, L, Xue, J, Lu, R, Wang, Z, Chen, Z, Yu, Q, Shi, Z & Chen, S. 2024 In-situ prediction of soil organic carbon contents in wheat-rice rotation fields via visible near-infrared spectroscopy. Soil & Environmental Health 2, 100113. [CrossRef]
- Natali, C, Bianchini, G & Carlino, P. 2020 Thermal stability of soil carbon pools: Inferences on soil nature and evolution. Thermochimica Acta 683, 178478. [CrossRef]
- Deutsches Institut für Normung. 2018 DIN EN ISO/IEC 17025:2018-03: Allgemeine Anforderungen an die Kompetenz von Prüf- und Kalibrierlaboratorien.
- VDLUFA. 1991 Methodenbuch Band 1: Die Untersuchung von Böden.
- Silveira, P. S. P. & Siqueria, J. d. O. 2022 eirasBA: Extended Bland-Altman statistical tests.
- R Core Team. 2024 R: A Language and Environment for Statistical Computing. Vienna, Austria.
- Datta, D. 2025 blandr: a Bland-Altman Method Comparison package for R. https://github.com/deepankardatta/blandr. Accessed 17 April 2025.
- Therneau, T. 2018 deming: Deming, Theil-Sen, Passing-Bablock and Total Least Squares Regression. https://CRAN.R-project.org/package=deming.
- Hedberg, EC & Ayers, S. 2015 The power of a paired t-test with a covariate. Social science research 50, 277–291. [CrossRef]
- Creasy, MA. 1956 Confidence Limits for the Gradient in the Linear Functional Relationship. Journal of the Royal Statistical Society Series B: Statistical Methodology 18, 65–69. [CrossRef]
- Shukla, GK. 1973 Some Exact Tests of Hypotheses about Grubbs’s Estimators. Biometrics 29, 373. [CrossRef]
- Silveira, P. S. P. , Vieira, J. E. & Siqueira, J. O. 2021 Is Bland-Altman plot method useful without inference for accuracy, precision, and agreement?: arXiv.
- Metzger, K, Zhang, C & Daly, K. 2021 From benchtop to handheld MIR for soil analysis: Predicting lime requirement and organic matter in agricultural soils. Biosystems Engineering 204, 257–269. [CrossRef]
- Smith, P, Soussana, J-F, Angers, D, Schipper, L, Chenu, C, Rasse, DP, Batjes, NH, van Egmond, F, McNeill, S & Kuhnert, M et al. 2020 How to measure, report and verify soil carbon change to realize the potential of soil carbon sequestration for atmospheric greenhouse gas removal. Global Change Biology 26, 219–241. [CrossRef]
- Minasny, B, McBratney, AB, Arrouays, D, Chabbi, A, Field, DJ, Kopittke, PM, Morgan, CLS, Padarian, J & Rumpel, C. 2023 Soil Carbon Sequestration: Much More Than a Climate Solution. Environmental science & technology 57, 19094–19098. [CrossRef]
- Steinegger, A, Wolfbeis, OS & Borisov, SM. 2020 Optical Sensing and Imaging of pH Values: Spectroscopies, Materials, and Applications. Chemical reviews 120, 12357–12489. [CrossRef]
- Bönecke, E, Meyer, S, Vogel, S, Schröter, I, Gebbers, R, Kling, C, Kramer, E, Lück, K, Nagel, A & Philipp, G et al. 2021 Guidelines for precise lime management based on high-resolution soil pH, texture and SOM maps generated from proximal soil sensing data. Precision Agric 22, 493–523. [CrossRef]
- Vogel, S, Gebbers, M, Schröter, I, Schwanghart, W, Bönecke, E, Rühlmann, J, Kramer, E & Gebbers, R. 2025 Towards site-independent calibration of in situ soil pH sensor data: Relevance of spatial and temporal proximity, sample size and data spread for calibration model performance. Geoderma 456, 117261. [CrossRef]
- Ciani, A, Goss, K-U & Schwarzenbach, RP. 2005 Light penetration in soil and particulate minerals. European J Soil Science 56, 561–574. [CrossRef]
- Barbato, CT & Strong, AL. 2023 Farmer perspectives on carbon markets incentivizing agricultural soil carbon sequestration. npj Clim. Action 2, 1–9. [CrossRef]
- Leifeld, J. 2023 Carbon farming: Climate change mitigation via non-permanent carbon sinks. Journal of Environmental Management 339, 117893. [CrossRef]
- Grahmann, K, Zwink, M, Barkusky, D, Verch, G & Sommer, M. 2023 The dilemma of analytical method changes for soil organic carbon in long-term experiments. European J Soil Science 74. [CrossRef]
- Roper, WR, Robarge, WP, Osmond, DL & Heitman, JL. 2019 Comparing Four Methods of Measuring Soil Organic Matter in North Carolina Soils. Soil Science Soc of Amer J 83, 466–474. [CrossRef]
- Wiesmeier, M. , Mayer, S., Paul, C., Helming, K., Don, A., Franko, U., Steffens, M. & Kögel-Knabner, I. 2020 CO2 certificates for carbon sequestration in soils: methods, management practices and limitations: BonaRes Data Centre Leibniz Centre for Agricultural Landscape Research ZALF.
- Dhawale, NM, Adamchuk, VI, Prasher, SO & Viscarra Rossel, RA. 2021 Evaluating the Precision and Accuracy of Proximal Soil vis–NIR Sensors for Estimating Soil Organic Matter and Texture. Soil Systems 5, 48. [CrossRef]
- Klein, J. 2021 Yard Stick provides measurement technology to combat climate change. TechCrunch.
- Gyawali, AJ, Wiseman, M, Ackerson, JP, Coffman, S, Meissner, K & Morgan, CL. 2025 Measuring in situ soil carbon stocks: A study using a novel handheld VisNIR probe. Geoderma 453, 117152. [CrossRef]
- Sanderman, J, Savage, K, Dangal, SRS, Duran, G, Rivard, C, Cavigelli, MA, Gollany, HT, Jin, VL, Liebig, MA & Omondi, EC et al. 2021 Can Agricultural Management Induced Changes in Soil Organic Carbon Be Detected Using Mid-Infrared Spectroscopy? Remote Sensing 13, 2265. [CrossRef]
- van der Voort, TS, Verweij, S, Fujita, Y & Ros, GH. 2023 Enabling soil carbon farming: presentation of a robust, affordable, and scalable method for soil carbon stock assessment. Agron. Sustain. Dev. 43, 1–12. [CrossRef]
- Seidel, M, Hutengs, C, Ludwig, B, Thiele-Bruhn, S & Vohland, M. 2019 Strategies for the efficient estimation of soil organic carbon at the field scale with vis-NIR spectroscopy: Spectral libraries and spiking vs. local calibrations. Geoderma 354, 113856. [CrossRef]
Figure 1.
Sampling sites in Lower Saxony (1–3) and Hesse, Germany (4–9).
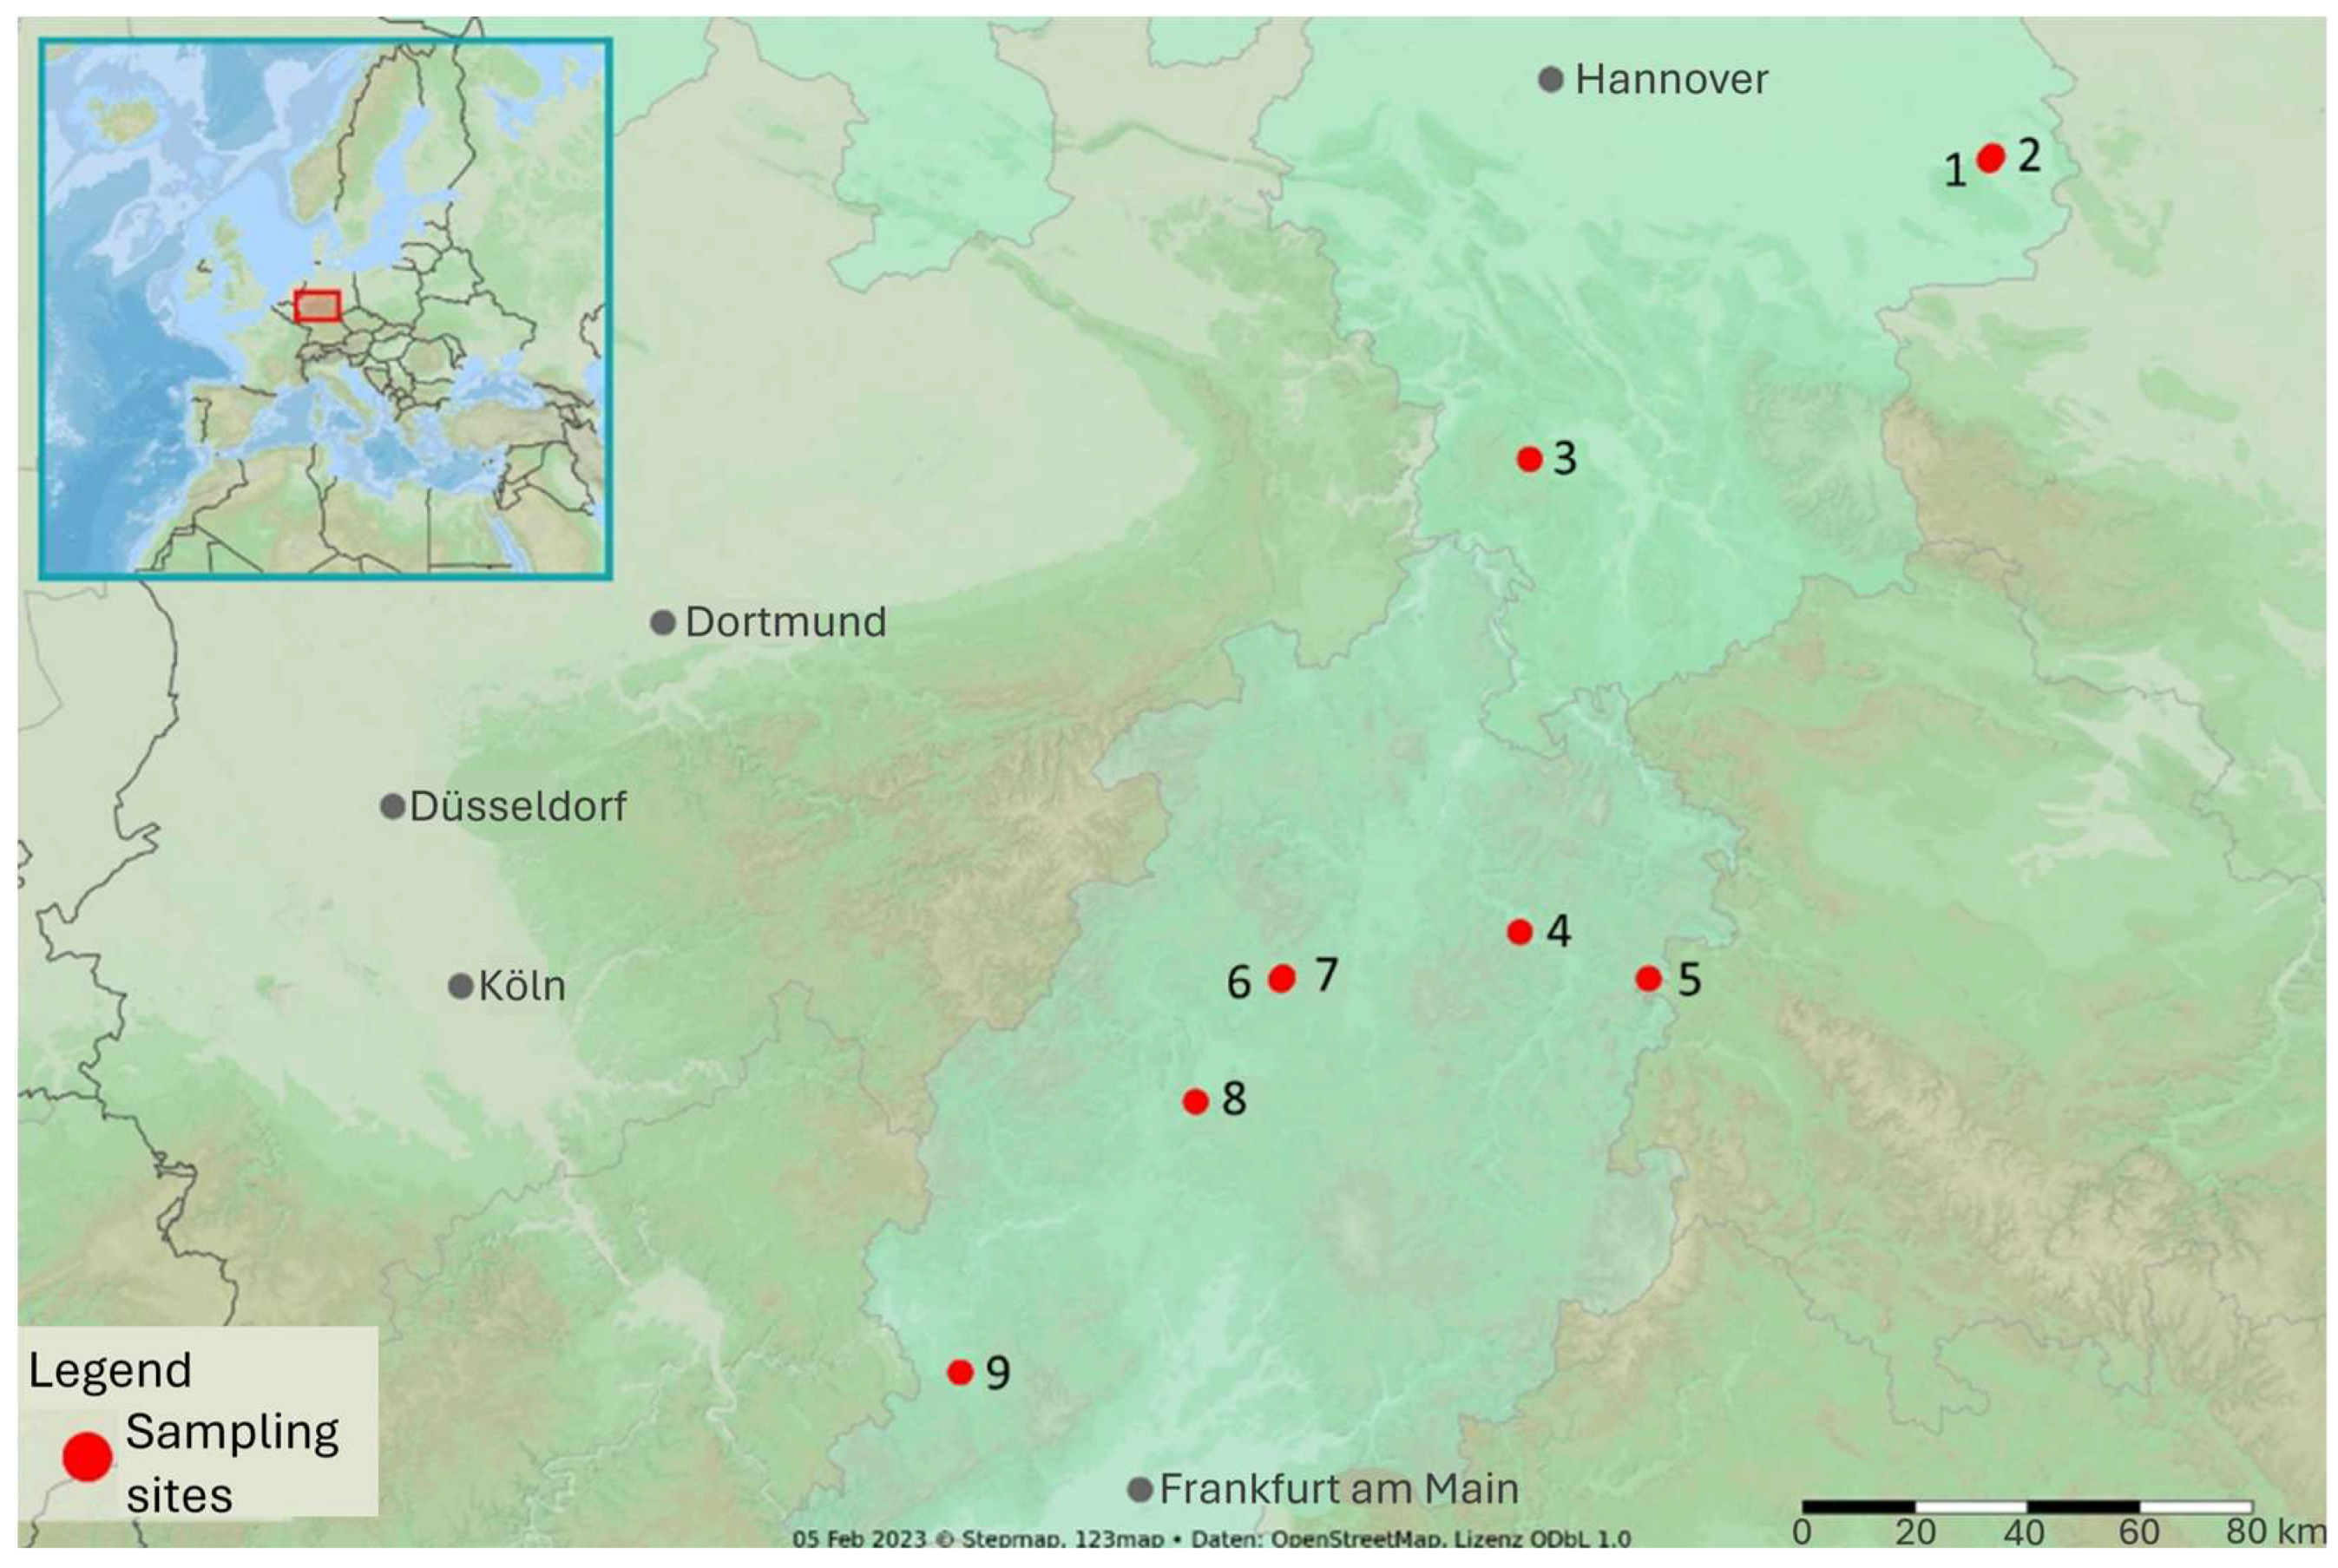
Figure 2.
Scheme of the soil sampling. Left: 2 m2 plot with subplots arranged in a square at sites in Hesse; right: plots (black frame) in a line with subplots arranged in line at sites in Lower Saxony. Numbers from 1 to 5 indicate the subplots.
Figure 2.
Scheme of the soil sampling. Left: 2 m2 plot with subplots arranged in a square at sites in Hesse; right: plots (black frame) in a line with subplots arranged in line at sites in Lower Saxony. Numbers from 1 to 5 indicate the subplots.
Disclaimer/Publisher’s Note: The statements, opinions and data contained in all publications are solely those of the individual author(s) and contributor(s) and not of MDPI and/or the editor(s). MDPI and/or the editor(s) disclaim responsibility for any injury to people or property resulting from any ideas, methods, instructions or products referred to in the content. |
© 2025 by the authors. Licensee MDPI, Basel, Switzerland. This article is an open access article distributed under the terms and conditions of the Creative Commons Attribution (CC BY) license (http://creativecommons.org/licenses/by/4.0/).
Copyright: This open access article is published under a Creative Commons CC BY 4.0 license, which permit the free download, distribution, and reuse, provided that the author and preprint are cited in any reuse.


