
Submitted:
05 May 2025
Posted:
08 May 2025
You are already at the latest version
Abstract
Growth traits are critical economic characteristics in aquaculture. This study aimed to identify candidate genes associated with the growth of C. fuscus by integrating QTL mapping for growth traits and RNA-seq analysis of differentially expressed genes (DEGs) between two extreme body size groups (big-sized group and small-sized group). QTL mapping was performed on eight growth traits—body weight, body height, body length, body width, orbital diameter, caudal peduncle length, caudal peduncle height, and pre-dorsal length—using 200 individuals from a full-sibling line. Seventeen growth-related QTL loci were identified across 8 linkage groups, explaining phenotypic variance ranging from 8.00% to 11.90%. A total of 162 functional genes were annotated within these QTL intervals. RNA-seq analysis identified 3,824 DEGs between the big-sized and small-sized groups, with 2,252 genes upregulated and 1,572 downregulated in the big group. By integrating QTL mapping and RNA-seq data, 27 candidate genes were identified, including myostatin (mstnb), epidermal growth factor receptor (egfr), and sarcoplasmic/endoplasmic reticulum calcium ATPase 1 (serca1). These findings provide crucial insights into the genetic regulation of growth in C. fuscus and lay a foundation for future genetic selection strategies.
Keywords:
Clarias fuscus
; growth traits
; transcriptome
; QTL mapping
; candidate gene
1. Introduction
Growth traits are among the most critical economic features in aquaculture species. Enterprises focusing on fish with superior growth performance can benefit from reduced rearing cycles, lower production costs, and significant increases in yield and economic returns. Consequently, selecting and breeding fish species with exceptional growth potential has become a central goal for the sustainable development of the aquaculture industry [1]. Growth traits are regulated by numerous small-effect polygenes, known as quantitative trait loci (QTL). While most of these loci have minor effects, a few key genes exert a substantial influence on growth [2]. Several genes involved in growth regulation have been identified in fish. Genes within the growth hormone/insulin-like growth factor (GH/IGF) axis , such as growth hormone (gh), growth hormone receptor (ghr), insulin-like growth factor 1 (igf-I), insulin-like growth factor 2 (igf-II), and insulin-like growth factor binding proteins (igfbps), play critical roles in regulating metabolic processes and cell growth [3]. Additionally, members of the myogenic regulatory factors (MRFs) gene family, including myogenin (myog), myogenic differentiation 1 (myod), and myogenic factor 5 (myf-5), are primarily expressed in vertebrate skeletal muscle and are crucial for muscle development through the regulation of cell proliferation and activation of muscle-specific genes [4]. Other genes, such as melanocortin receptor-4 (mc4r), influence growth by regulating energy metabolism, while gastric hunger hormone (ghrelin) plays a role in growth regulation by enhancing feeding and digestive efficiency [5,6]. These genes interact through a complex signaling network that collectively influences growth-related phenotypic variation in fish. Given the species-specific nature of growth regulation, screening growth-related genes across different species is essential for gaining a comprehensive understanding of the genetic mechanisms behind growth regulation in fish.
QTL mapping is a crucial tool for investigating the genetic basis of economic traits in aquaculture species, playing a key role in guiding the identification of candidate genes [7]. Traditional breeding methods rely on the careful selection of individuals with desirable characteristics followed by successive generations of breeding to produce seedlings with superior economic traits. However, this process is time-consuming, costly, and highly susceptible to external factors such as environmental influences, limiting its practical application in production [8]. In contrast, QTL mapping enables the identification of complex traits by pinpointing specific genomic regions, facilitating the early selection of superior individuals. This approach not only significantly shortens the breeding cycle but also improves breeding efficiency and enhances economic returns. Currently, QTL mapping is widely applied in breeding studies of aquaculture species, addressing key economic traits such as sex determination[9,10], hypoxia tolerance [11,12] and body color[13,14]. For growth traits, QTL mapping studies have been conducted in various aquaculture species, including common carp (Cyprinus carpio)[15], mirror carp (Cyprinus carpiovar. specularis)[16]. These studies have enriched genetic resources for fish breeding and provided valuable insights into the genetic basis of growth traits in fish.
While QTL mapping is valuable for identifying chromosomal regions linked to growth traits by analyzing the genetic structure of economic traits, it primarily locates broader chromosomal regions where candidate genes are mapped. Without further fine-mapping, its ability to provide detailed candidate gene information is limited [17]. On the other hand, RNA-seq offers insights into gene expression dynamics, revealing how gene expression varies across individuals of different sizes [18,19]. In recent years, transcriptomics analysis has been widely used to identify differentially expressed genes (DEGs) associated with growth traits in aquaculture species, for example rainbow trout (Oncorhynchus mykiss)[20], mandarin fish (Siniperca chuatsi)[21], and fine flounder (Paralichthys adspersus)[22]. Combining QTL mapping with RNA-seq allows for the narrowing of the candidate gene range through co-mapping strategies like eQTL analysis, leading to more accurate gene mapping. For instance, a co-analysis in giant grouper (Epinephelus Lanceolatus) identified 34 candidate genes related to growth and six growth-related QTL [23]. Similarly, in Pacific whiteleg shrimp (Litopenaeus vannamei), four candidate genes were identified from nine growth-related QTLs using conjoint analysis [24]. This integrated approach improves the identification of growth-related candidate genes and enhances our understanding of the genetic mechanisms underlying growth traits in aquaculture species.
The Hong Kong catfish (Clarias fuscus) is the only native species of the Clariidae family in China [25]. This species is highly valued for its desirable traits, including strong adaptability, tender meat, and a high content of essential amino acids with low fat content [26]. It has become one of the important economic aquaculture species in southern China [27]. However, the development of the aquaculture industry for this species is hindered by the lack of targeted selective breeding programs. Therefore, there is an urgent need to enhance key economic traits, particularly growth, and to select seedlings with superior growth potential. Currently, the whole genome sequences and high-density genetic linkage map of C. fuscus have been constructed [25,26,28]. The acquisition of these whole genome sequences and high-density genetic maps has laid the groundwork for identifying economic traits in this species. However, the genetic mechanisms underlying growth traits remain poorly understood. In this study, we performed QTL mapping for eight growth traits of C. fuscus using the established genetic map [28] and integrated muscle RNA-seq data to identify growth-related candidate genes. The findings will provide a scientific foundation for understanding the genetic basis of growth traits in C. fuscus and contribute to the development of C. fuscus lines with improved growth performance.
2. Materials and Methods
2.1. Ethics Statement
All experimental protocols in this study were conducted in accordance with the standards of the Guangdong Ocean University Animal Research and Ethics Committee (NIH Pub. No.85-23, revised in 1996). The subjects of this study are not endangered or protected species.
2.2. Sample Preparation and Phenotyping
The family group used for QTL mapping of growth traits in C. fuscus in this study originates from the same family group previously employed for genetic linkage map construction [28]. Specifically, a mapping family of Hong Kong catfish was provided by the Guangxi Hongtai Aquatic Product Farm in Guangxi Province, China. This family was established by randomly selecting 200 F1 individuals for the construction of a genetic linkage map [28], which was subsequently used for QTL mapping of growth traits. In this study, eight growth-related traits, including body weight (BW), body height (BH), body length (BL), body width (BWI), orbital diameter (OD), caudal peduncle length (CPL), caudal peduncle height (CPH), and pre-dorsal length (PDL), were measured in 200 individuals of a full-sibling F1 family group of C. fuscus for which the genetic map was constructed [28]. The raw data for these traits were initially preprocessed using Microsoft Excel. Subsequent analyses, including descriptive statistics, correlation analysis, and analysis of variance (ANOVA), were conducted using SPSS software.
For transcriptome sequencing, a mixed family group of C. fuscus was provided by the Guangxi Hongtai Aquatic Product Farm, Guangxi Province, China. Selected same-size 1-month-old C. fuscus were transferred from the farm to the freshwater aquaculture base of Guangdong Ocean University. They were cultured in the same pond and fed pellet feed three times a day. At 6 months of age, 254 individuals were randomly selected for body weight measurement. From these, the 9 largest and 9 smallest individuals were chosen to form 3 big-sized groups (B1, B2, B3) and 3 small-sized groups (S1, S2, S3). The average body weight of the large-sized groups was 100.13±12.96g, while that of the small-sized groups was 32.29±7.48g. The fish were fasted for 24 h before sample collection. Before dissection, the fish were anesthetized with eugenol (Shandong Keyuan Biochemical Co., Ltd., China). Muscle tissues were harvested, rapidly frozen in liquid nitrogen and stored at -80°C. For each group, muscle tissues from three individuals were mixed to a single sample for subsequent sequencing and analysis.
2.3. QTL Mapping for Growth Traits
QTL mapping for for growth traits was conducted using the genetic linkage map of C. fuscus [28]. Eight growth traits were analyzed using the Permutation Test (PT) in MapQTL 6.0. The PT was performed with 1000 permutations to determine the LOD threshold for each trait at a 95% confidence level. The results from the PT were combined with the actual QTL significance levels obtained from the analysis to establish uniform thresholds for the eight growth traits. Interval mapping (IM) in MapQTL 6.0 was then used to analyze these traits, and the corresponding QTL segments were identified based on the established thresholds [29].
2.4. Screening of Candidate Genes for Growth Traits QTL and Functional Enrichment Analysis
Candidate genes and functional annotations within the QTL intervals for growth traits were identified using the reference genome of C. fuscus (https://www.ncbi.nlm.nih.gov/datasets/genome/GCA_030347435.1/). Functional genes within the QTL intervals identified through linkage analysis were selected based on this reference genome. The corresponding sequences within each QTL region were extracted and annotated by BLAST analysis. Subsequently, Gene Ontology (GO) and Kyoto Encyclopedia of Genes and Genomes (KEGG) enrichment analyses were performed on the annotated genes using TBtools software. The resulting visualizations were generated using the R package clusterProfiler [30].
2.5. Transcriptome Library Creation and Raw Data Processing
Total RNA was extracted from six samples in the big-sized and small-sized individual groups. mRNA was randomly fragmented using NEB Fragmentation Buffer. The first strand of cDNA was synthesized using random oligonucleotides as primers in the M-MuLV reverse transcriptase system. The RNA strand was then degraded with RNaseH, and the second strand of cDNA was synthesized with dNTPs in the DNA polymerase I system. The purified double-stranded cDNA underwent end repair, A-tail addition, and ligation of sequencing junctions. cDNAs of approximately 250-300 bp were selected using AMPure XP beads, followed by PCR amplification, and the PCR products were purified again. The libraries were then constructed [30]. Raw data were filtered to remove adapters and low-quality reads (those with an average read quality score below 5), resulting in clean reads [31]. These high-quality reads were aligned to the reference genome using HISAT2 software, ensuring fast and accurate alignment to obtain the localization information of the reads on the reference genome(https://www.ncbi.nlm.nih.gov/datasets/genome/GCA_046453815.1/) [32]. Finally, new transcripts were assembled using StringTie software [33].
2.6. Screening of DEGs and Functional Enrichment Analysis
The big-sized individual group was used as the experimental group, while the small-sized individual group served as the control group. Differential expression analysis between the two groups was conducted using the DESeq2 R package (version 1.6.3), identifying differentially expressed genes (DEGs) with a p-value < 0.05 and |fold change| ≥ 1. Gene Ontology (GO) and Kyoto Encyclopedia of Genes and Genomes (KEGG) enrichment analyses of the DEGs were performed using TBtools software, and the results were visualized using the R clusterProfiler package.
2.7. QTL and Transcriptome Association Analysis
By integrating the results from the QTL mapping analysis of significant regions and transcriptome differential gene analysis, a set of common genes between the two datasets was identified for further quantitative analysis and expression profiling. For gene expression analysis, expression levels were log2-transformed, and heatmaps were generated using the R package pheatmap. The heatmaps were constructed using a fully interlocked clustering method and the Euclidean distance measurement metric.
2.8. Real-Time Fluorescence Quantitative PCR (qRT-PCR) Validation
The expression of candidate genes in the muscle of C. fuscus was quantified using qRT-PCR. The RNA used for transcriptome sequencing was reverse transcribed into complementary DNA (cDNA) using HiScript III All-in-One RT SuperMix (Vazyme, China), optimized for quantitative PCR (qPCR). qRT-PCR was performed using PerfectStart Green qPCR SuperMix (Code#TG-AQ601-02) on a LightCycler® 480 detection system (Roche Diagnostics Ltd., USA), with each sample analyzed in triplicate. Primers for qPCR were designed using the NCBI tool, with the β-actin gene serving as the internal reference gene. The reaction mixture was prepared in a total volume of 10 μL, consisting of 5.0 μL of 2× PerfectStart Green qPCR SuperMix, 1.0 μL of cDNA, 3.4 μL ddH2O, 0.3 μL of the forward primer, and 0.3 μL of the reverse primer. The reaction procedure was as follows: 1) Preincubation: 94°C for 300s; 2) Amplification: (95°C for 20s, 60°C for 20s, 72°C for 20s) × 40 cycles; 3) Melting: 95°C for 10s, 65°C for 60s, 97°C for 1s; 4) Cooling: 37°C for 300s. The comparative CT (2−(ΔΔCT)) method was used to assess relative gene expression levels. The primers for candidate genes and internal control gene (β-actin) are shown in Table S1.
3. Results
3.1. Morphological Statistics
In this study, eight morphological traits (BW, BL, BH, BWI, OD, CPL, CPH, and PDL) were measured in 200 F1 individuals of C. fuscus. The morphological analyses showed that the frequency distribution of these traits conformed to a normal distribution (Figure 1). The coefficients of variation (CV) for the eight traits ranged from 8.00% to 11.90% (Table S2), indicating substantial variability, which makes these traits suitable candidates for QTL analysis.
3.2. QTL Analysis and Candidate Gene Identification
Using QTL composite interval mapping with the MapQTL 6.0 software, we analyzed eight growth traits of C. fuscus. The analysis identified 17 QTLs (LOD > 3.5) distributed across eight linkage groups, including LG06, LG07, LG09, LG13, LG14, LG17, LG18, and LG20 (Figure 2). The peak positions of these QTLs ranged from 5.62 cM (qCPH-8) to 186.52 cM (qCPH-5). The phenotypic variance explained (PVE) by these QTLs ranged from 8.00% (qBL-4) to 11.90% (qCPH-6), with an average PVE of 9.04% (Table 1). Multiple growth trait QTLs were clustered on LG06, LG09, and LG17. Specifically, three QTLs for CPH, CPL, and BH were identified on LG06, On LG09, four QTLs were identified for BW, BL, PDL, and BWI, with a notable overlap between the significant regions for BW (41.931–45.835 cM) and BWI. Similarly, QTLs for BW, BWI, and PDL were on LG17, with the significant region for BW (13.520–17.098 cM) overlapping with that for BWI. A total of 162 candidate genes were identified within these 17 QTL intervals (Table S3).
3.3. Functional Annotation of QTL Candidate Genes
To explore the functions and associated pathways of the QTL candidate genes, GO and KEGG enrichment analyses were performed. The GO analysis revealed five significantly enriched terms within the biological process (BP) category, including cell adhesion (GO:0007155) and RNA metabolic process (GO:0016070). In the molecular function (MF) category, three terms were significantly enriched, such as calcium ion binding (GO:0005509) and structural molecule activity (GO:0005198). No significant enrichment was observed in the cellular component (CC) category (Figure 3A). KEGG pathway analysis identified nine significantly enriched pathways, including Brite Hierarchies, Propanoate metabolism, and Transcription machinery (Figure 3B).
3.4. Quality Control of Transcriptome Sequencing Data
Following quality control procedures, low-quality reads from the raw sequencing data were removed, resulting in an average of 50,513,416 (98.25%) clean reads for the big-sized group and 44,737,262 (95.63%) clean reads for the small-sized group. The average Q20 and Q30 values for the big-sized individuals were 98.69% and 96.20%, respectively, while for the small-sized individuals, these values were 98.10% and 95.03%, respectively. After quality control, the clean reads from both groups were mapped to the reference genome of the C. fuscus. On average, 90.47% of the clean reads from the big-sized group and 83.57% from the small-sized group were successfully mapped to the reference genome (Table 2). These results indicate that the sequencing results are of high quality and suitable for subsequent analyses.
3.5. Differential Gene Expression Analysis Related to Body Size
Gene expression changes in muscle tissue samples from big-sized and small-sized individuals were compared, identifying a total of 3,824 differentially expressed genes (DEGs) associated with individual size in C. fuscus. Of these, 2,252 genes were up-regulated, and 1,572 genes were down-regulated (p < 0.05 and |log2(fold change) | ≥ 1, Figure 4A). Table 3 presents the top 20 genes ranked by fold change between the big-sized and small-sized individual groups.
3.6. Functional Classification of DEGs
To further explore the biological significance of the DEGs, GO and KEGG enrichment analyses were conducted. The GO enrichment analysis revealed significant enrichment of DEGs in two functional categories, with 94 subcategories identified within the Biological Process (BP) category and 16 subcategories within the Cellular Component (CC) category. No significant enrichment was observed in the MF category. The DEGs were significantly enriched in terms such as Envelope (GO:0031975), Mitochondrion (GO:0005739), ATP metabolic process (GO:0046034), and Translation (GO:0006412) (Figure 4B). KEGG pathway analysis indicated that DEGs were significantly enriched in nine pathways, including Carbon metabolism, 2-Oxocarboxylic acid metabolism, and Glycolysis/Gluconeogenesis. Among these pathways, the Biosynthesis of Amino Acids pathway was the most significantly enriched, while the Insulin Signaling pathway had the highest number of enriched DEGs (Figure 4C).
3.7. Carbohydrate Metabolism Pathway Analysis
To investigate the molecular mechanisms underlying size variation in C. fuscus, we examined the expression patterns of key DEGs in major carbohydrate metabolism pathways across two groups (Figure 5). The analysis revealed that genes involved in glycolysis and the tricarboxylic acid (TCA) cycle, such as glucose-6-phosphate isomerase (gpi), ATP-dependent 6-phosphofructokinase (pfkm), and fructose-1,6-bisphosphatase isozyme 2 (fbp2), were upregulated in the large-sized individuals. Conversely, genes associated with odd-chain fatty acid catabolism, isoleucine catabolism, and ethanol metabolism, including alcohol dehydrogenase class-3 (adh3) and peroxisomal acyl-coenzyme A oxidase 1 (acox1), exhibited higher expression levels in the small-sized individuals.
3.8. Integration of QTL Mapping and Transcriptome Data
By integrating the results of QTL mapping and transcriptome differential expression analysis, we identified 27 candidate genes associated with growth, including epidermal growth factor receptor (egfr), ataxin-7protein 3 (atxn7), glutamine-rich protein 1 (qrich1), and nucleophosmin (npm1) (Table 4). The expression analysis of the 27 growth candidate genes is shown in Figure 6A. To validate the expression patterns of these growth-related candidate genes, we performed qRT-PCR analysis on five randomly selected genes in muscle tissues from both big-sized and small-sized C. fuscus individuals. The expression patterns observed through qRT-PCR were consistent with those from the transcriptome data, confirming the accuracy and reliability of the transcriptome results (Figure 6B).
4. Discussion
Growth traits are critical economic traits in aquaculture species and have garnered considerable attention [34]. While existing studies have offered valuable insights into the regulatory mechanisms of growth genes in fish, the complexity of growth regulation has limited the identification of related genes. In this study, we identified QTLs associated with growth in C. fuscus, by integrating transcriptome data related to body size, pinpointed candidate genes and relevant pathways. This work provides a foundation for further investigation into the growth regulatory mechanisms in C. fuscus and offers key data for developing fast-growing strains.
4.1. QTL Mapping of Growth Traits in C. fuscus
Numerous studies have demonstrated that QTL mapping is a primary method for identifying quantitative trait loci and understanding the underlying mechanisms of quantitative traits [35]. One critical metric in QTL mapping is the proportion of variance explained (PVE), which quantifies the extent to which a QTL contributes to phenotypic trait variation. A higher PVE value indicates a greater influence of the QTL on the trait, while a lower PVE suggests a lesser effect, implying that other genetic or environmental factors may also significantly shape the trait [36]. In fish, growth traits are classic quantitative traits, with associated QTLs typically exhibiting relatively low PVE values. For example, mirror carp (9.6-24.2%) [16], crucian carp (Carassius auratus) (PVE, 10.1-13.2%) [37], ussuri catfish (Pseudobagrus ussuriensis) (11.9-20.5%) [38], and dusky kob (Argyrosomus japonicus) (9.3-29.5%) [39] all demonstrate this pattern.
Based on the available genetic map of C. fuscus, this study analyzed eight growth traits using QTL mapping. Except for OD, CPL, and BWI, all other traits were mapped to two or more significant QTL intervals, resulting in the identification of 17 growth-related QTLs. The PVE of these 17 QTLs ranged from 8.00 to 11.90%. These results suggest that growth traits in C. fuscus are complex and influenced by multiple genes. Additionally, the QTL intervals for single growth trait in C. fuscus are more concentrated compared to other fish species. For example, two BW-related QTLs in this study were mapped to LG09 and LG17, while in red-tail catfish (Hemibagrus wyckioides), 12 BW-related QTLs are distributed across eight LGs [40], and in crucian carp, eight BW-related QTLs span five LGs [37]. Among these 17 growth QTLs, 11 growth QTLs were distributed on LG06, LG09, and LG17. Notably, two overlapping intervals were identified: BW and BWI on LG09 (44.543 cM–45.835 cM), and BW and BL on LG17 (13.520 cM-14.832 cM). These findings indicate that, although growth traits in C. fuscus are regulated by multiple genes, the regulatory genes are mapped to a few major chromosomes. Similar observations have been made in black carp [1] and pikeperch (Sander lucioperca) [40].
4.2. Transcriptome Enrichment Pathways Associated with body Size in C. fuscus
To further explore the genes associated with the growth of C. fuscus, a comprehensive transcriptome analysis was conducted, identifying 3,824 DEGs. Among these, 2,252 genes were highly expressed, while 1,572 were lowly expressed. The functional roles and biological pathways of these DEGs were examined using GO and KEGG enrichment analyses.
In the GO enrichment analysis, the majority of DEGs were found to be enriched in biological processes (94 out of 110 pathways, 85%), a trend observed in other species as well, such as grass carp (Ctenopharyngodon idella) (42%), black porgy (Acanthopagrus schlegelii) (52%), and Zig-Zag eel (Mastacembelus armatus) (60%) [41,42,43]. These results suggest that DEGs related to biological processes are likely central to the growth rate differences observed among individuals. The most significantly enriched pathways were related to organic metabolism, particularly "pyruvate metabolism" and "ATP metabolism," consistent with the known biological roles of these genes. Pathways related to ATP precursor synthesis, including "ribonucleoside triphosphate biosynthetic process" and "ATP biosynthesis," were predominantly enriched in small-sized individuals. In contrast, big-sized individuals exhibited greater enrichment in metabolic pathways for the synthesis of various organic compounds, such as "pyruvate metabolic process" and "regulation of cellular component biosynthesis." The upregulation of the tricarboxylic acid cycle (TCA cycle) in bigger C. fuscus suggests an enhanced capacity to utilize TCA intermediates for biosynthetic pathways, thus supporting cellular function and homeostasis [44]. Conversely, smaller individuals rely on oxidative phosphorylation to rapidly generate large amounts of ATP, which is crucial for cell proliferation and tissue growth.
KEGG analysis of carbohydrate metabolism pathways revealed that genes related to glycolysis, the TCA cycle, and propionate metabolism were upregulated in bigger individuals, supporting the maintenance of cellular functions and homeostasis [45]. In contrast, smaller individuals showed a greater tendency to convert odd-chain fatty acids and amino acids into TCA cycle intermediates. This observation, consistent with previous studies [46], was supported by the increased expression of key enzymes involved in the catabolism of isoleucine and the β-oxidation of odd-chain fatty acids. These enzymes include acyl-coA oxidase 1 (acox1) [47], lipoamide acyltransferase component of branched-chain alpha-keto acid dehydrogenase (dbt) [48], and ethylmalonyl-CoA decarboxylase (echdc1) [49], which facilitate the conversion of succinyl-CoA to succinate, releasing GTP [50,51]. This observation highlights the need for rapid energy generation in smaller individuals to support growth and proliferation.
4.3. Identification and Characterization of Growth-Associated Genes in in C. fuscus
In this study, we conducted a comprehensive analysis integrating QTL mapping and transcriptome data to identify growth-associated candidate genes in C. fuscus. A total of 27 candidate genes were successfully identified across 17 QTL regions linked to growth traits. Notably, compared to small-sized individuals, several genes including eya4, serca1, f11r, npm1, and tecta were significantly upregulated in big-sized individuals. The eya4 gene, part of the EYA gene family, has been implicated in various biological processes such as organogenesis and cell differentiation [52]. Previous studies have shown that eya4 can influence the development of the zebrafish sensory system by modulating Na+/K ATPase (atp1b2b) activity [53]. Additionally, eya4 has been found to dephosphorylate polo-like kinase 1 (plk1), thereby promoting mitotic progression and enhancing cell differentiation [54]. Similarly, the gene encoding the protein serca1, a key regulator in growth promotion, has been associated with asymmetric embryonic development [55]. Mutations in serca1 disrupt left-right asymmetry during embryogenesis, leading to altered lateralization [56].Other genes such as f11r [57], npm1 [58], and tecta [59] have also been linked to cellular differentiation and organ development. The upregulation of these genes in big-sized individuals suggests their pivotal role in the growth and development of C. fuscus.
In contrast, small-sized individuals exhibited higher expression levels of genes such as mstn, egfr, mto1, ikzf2, and mks1. Mstn, a member of the transforming growth factor-β (TGF-β) superfamily, has been shown to inhibit muscle production, thereby affecting vertebrate growth [60]. Gene knockout studies have demonstrated that disrupting mstn expression can stimulate myoblast proliferation, leading to increased fish weight [61,62]. Additionally, egfr plays a critical role during early development in species such as Japanese medaka (Oryzias latipes), where it is involved in cleavage, protocole formation, and organogenesis [63]. Other studies have shown that egfr is also implicated in the maturation of zebrafish ovaries [64]. The genes mto1[65], ikzf2 [66], and mks1[67] are associated with embryonic development and organogenesis.
Our findings suggest that these genes generally promote embryonic development, cell differentiation, and proliferation, consistent with observations from enrichment analyses, which showed that many genes are enriched in biological process-related pathways. However, a key distinction emerged: genes upregulated in big-sized individuals appeared to primarily support the development of sensory systems, while those upregulated in small-sized individuals favored the development of various tissues and organs. This observation implies that energy allocation differences, stemming from varying cellular differentiation processes, may account for the observed growth and developmental discrepancies between C. fuscus individuals [68].
5. Conclusions
In this study, we conducted QTL mapping for eight growth traits in C. fuscus, identifying 17 growth-related QTLs across eight intervals, which encompass 162 functional genes. RNA-seq analysis of individuals with different sizes revealed 3,824 differentially expressed genes, with the big-sized group showing 2,252 highly expressed and 1,572 lowly expressed genes compared to the small-sized group. By integrating QTL mapping and RNA-seq data, we identified 27 candidate genes, including eya4, serca1, f11r, and npm1. This combined approach offers a more precise list of candidate genes for growth traits in C. fuscus, providing valuable genetic insights to enhance growth performance in this species.
Supplementary Materials
The following supporting information can be downloaded at: Preprints.org, Table S1: Quantitative real time PCR (qRT-PCR) primer sequences data; Table S2: Phenotypic data on eight growth trait-related phenotypes from 200 offspring of C. fuscus; Table S3: 162 functional genes identified in the QTL interval for growth of C.fuscus.
Author Contributions
Conceptualization, methodology, software, visualization, data curation, writing—original draft preparation, Y.Z. and D.Z.; validation, formal analysis, investigation, Y.S. and C.P.; resources, data curation, Y.C., B.Y., and Y.Z.; writing—review and editing, G.L., H.C., and C.T.; supervision, project administration, funding acquisition, C.T. All authors have read and agreed to the published version of the manuscript.
Funding
This research was funded by Guangdong Basic and Applied Basic Research Foundation (2025A1515012346), the Department of Education of Guangdong Province (2023KTSCX042), the Self-financing Project of Guangxi Agricultural Science and Technology (Z2019123), the National College Students Innovation and Entrepreneurship Training Program (202310566002, 202410566002), the Undergraduate Innovation Team Project of Guangdong Ocean University (CXTD2023003), and the Youth Science and Technology Innovation Talent of Guangdong TeZhi plan talent (2023TQ07A888).
Institutional Review Board Statement
Not applicable.
Informed Consent Statement
Not applicable.
Data Availability Statement
RNA-Seq data have been deposited in the NCBI database under the project accession number PRJNA1258690.
Acknowledgments
We wish to thank the anonymous reviewers and the editor of the journal for their valuable comments.
Conflicts of Interest
The authors declare no conflicts of interest.
References
- Guo, J.; Wang, A.; Mao, S.; Xu, X.; Li, J.; Shen, Y. Construction of High-Density Genetic Linkage Map and QTL Mapping for Growth Performance in Black Carp (Mylopharyngodon Piceus). Aquaculture 2022, 549, 737799. [Google Scholar] [CrossRef]
- Ashton, D.T.; Ritchie, P.A.; Wellenreuther, M. Fifteen Years of Quantitative Trait Loci Studies in Fish: Challenges and Future Directions. Molecular Ecology 2017, 26, 1465–1476. [Google Scholar] [CrossRef] [PubMed]
- Ndandala, C.B.; Dai, M.; Mustapha, U.F.; Li, X.; Liu, J.; Huang, H.; Li, G.; Chen, H. Current Research and Future Perspectives of GH and IGFs Family Genes in Somatic Growth and Reproduction of Teleost Fish. Aquaculture Reports 2022, 26, 101289. [Google Scholar] [CrossRef]
- Hernández-Hernández, J.M.; García-González, E.G.; Brun, C.E.; Rudnicki, M.A. The Myogenic Regulatory Factors, Determinants of Muscle Development, Cell Identity and Regeneration. Seminars in Cell & Developmental Biology 2017, 72, 10–18. [Google Scholar] [CrossRef]
- Liu, T.; Deng, Y.; Zhang, Z.; Cao, B.; Li, J.; Sun, C.; Hu, Z.; Zhang, J.; Li, J.; Wang, Y. Melanocortin Receptor 4 (MC4R) Signaling System in Nile Tilapia. IJMS 2020, 21, 7036. [Google Scholar] [CrossRef]
- Blanco, A.M.; Bertucci, J.I.; Sánchez-Bretaño, A.; Delgado, M.J.; Valenciano, A.I.; Unniappan, S. Ghrelin Modulates Gene and Protein Expression of Digestive Enzymes in the Intestine and Hepatopancreas of Goldfish (Carassius Auratus) via the GHS-R1a: Possible Roles of PLC/PKC and AC/PKA Intracellular Signaling Pathways. Molecular and Cellular Endocrinology 2017, 442, 165–181. [Google Scholar] [CrossRef] [PubMed]
- Tong, J.; Sun, X. Genetic and Genomic Analyses for Economically Important Traits and Their Applications in Molecular Breeding of Cultured Fish. Sci. China Life Sci. 2015, 58, 178–186. [Google Scholar] [CrossRef] [PubMed]
- Rhode, C.; Jackson, T.K.; Le Cordeur, N.S.; Jenkins, S.F.; Sampson, J.E.; Vervalle, J. Performance, Heritability, and Candidate Genes for Growth in Dusky Kob (Argyrosomus Japonicus): Implications for Genetic Improvement during Early Phase Domestication. Aquaculture 2023, 577, 739971. [Google Scholar] [CrossRef]
- Wei, J.; Chen, Y.; Wang, W. A High-Density Genetic Linkage Map and QTL Mapping for Sex and Growth-Related Traits of Large-Scale Loach (Paramisgurnus Dabryanus). Front. Genet. 2019, 10, 1023. [Google Scholar] [CrossRef]
- Palaiokostas, C.; Bekaert, M.; Khan, M.G.; Taggart, J.B.; Gharbi, K.; McAndrew, B.J.; Penman, D.J. A Novel Sex-Determining QTL in Nile Tilapia (Oreochromis Niloticus). BMC Genomics 2015, 16, 171. [Google Scholar] [CrossRef]
- Li, H.L.; Gu, X.H.; Li, B.J.; Chen, C.H.; Lin, H.R.; Xia, J.H. Genome-Wide QTL Analysis Identified Significant Associations Between Hypoxia Tolerance and Mutations in the GPR132 and ABCG4 Genes in Nile Tilapia. Mar Biotechnol 2017, 19, 441–453. [Google Scholar] [CrossRef] [PubMed]
- Wang, X.; Liu, S.; Jiang, C.; Geng, X.; Zhou, T.; Li, N.; Bao, L.; Li, Y.; Yao, J.; Yang, Y.; et al. Multiple Across-Strain and within-Strain QTLs Suggest Highly Complex Genetic Architecture for Hypoxia Tolerance in Channel Catfish. Mol Genet Genomics 2017, 292, 63–76. [Google Scholar] [CrossRef] [PubMed]
- Li, B.J.; Zhu, Z.X.; Gu, X.H.; Lin, H.R.; Xia, J.H. QTL Mapping for Red Blotches in Malaysia Red Tilapia (Oreochromis Spp.). Mar Biotechnol 2019, 21, 384–395. [Google Scholar] [CrossRef] [PubMed]
- O’Quin, C.T.; Drilea, A.C.; Conte, M.A.; Kocher, T.D. Mapping of Pigmentation QTL on an Anchored Genome Assembly of the Cichlid Fish, Metriaclima Zebra. BMC Genomics 2013, 14, 287. [Google Scholar] [CrossRef]
- Lv, W.; Zheng, X.; Kuang, Y.; Cao, D.; Yan, Y.; Sun, X. QTL Variations for Growth-Related Traits in Eight Distinct Families of Common Carp (Cyprinus Carpio). BMC Genet 2016, 17, 65. [Google Scholar] [CrossRef]
- Zhang, X.; Li, P.; Hu, G.; Li, C.; Lu, C.; Chao, D. QTL Analysis of Body Weight, Body Length, Body Depth and Body Thickness in Mirror Carp Cyprinus Carpio. Chinese Journal of Fisheries 2023, 36, 1–9. [Google Scholar] [CrossRef]
- Rockman, M.V. THE QTN PROGRAM AND THE ALLELES THAT MATTER FOR EVOLUTION: ALL THAT’S GOLD DOES NOT GLITTER. Evolution 2012, 66, 1–17. [Google Scholar] [CrossRef]
- Cai, C.; Yang, P.; Shi, Y.; Wang, X.; Chen, G.; Zhang, Q.; Cheng, G.; Kong, W.; Xu, Z. Transcriptomic and Metabolomic Analysis Revealed Potential Mechanisms of Growth and Disease Resistance Dimorphism in Male and Female Common Carp (Cyprinus Carpio). Fish & Shellfish Immunology 2025, 158, 110150. [Google Scholar] [CrossRef]
- Chen, F.; Ouyang, X.; Liao, Z.; Huang, T.; Tong, G.; Tan, H.; Zhou, M.; Lu, X.; Wei, X.; Yang, X.; et al. Comprehensive Transcriptomic, Proteomic, and Intestinal Microbiota Analyses of Largemouth Bass (Micropterus Salmoides) Intestines Reveal New Insights into Immune Responses to Aeromonas Hydrophila Infection. Fish & Shellfish Immunology 2025, 156, 110057. [Google Scholar] [CrossRef]
- Salem, M.; Vallejo, R.L.; Leeds, T.D.; Palti, Y.; Liu, S.; Sabbagh, A.; Rexroad, C.E.; Yao, J. RNA-Seq Identifies SNP Markers for Growth Traits in Rainbow Trout. PLoS ONE 2012, 7, e36264. [Google Scholar] [CrossRef]
- Ding, W.; Cao, L.; Cao, Z.; Bing, X. Characterization of the Growth-Related Transcriptome in the Liver and Brain of Mandarin Fish (Siniperca Chuatsi) through RNA-Seq Analysis. Journal of Applied Animal Research 2024, 52, 2440045. [Google Scholar] [CrossRef]
- Mendez, K.N.; Zuloaga, R.; Valenzuela, C.A.; Bastias-Molina, M.; Meneses, C.; Vizoso, P.; Valdés, J.A.; Molina, A. RNA-Seq Analysis of Compensatory Growth in the Skeletal Muscle of Fine Flounder (Paralichthys Adspersus). Aquaculture 2018, 490, 270–280. [Google Scholar] [CrossRef]
- Wu, L.; Yang, Y.; Wang, X.; Weng, Z.; Hua, S.; Li, D.; Xia, J.; Liu, X.; Meng, Z. Genome-Wide QTL Mapping and RNA-Seq Reveal the Genetic Variation Influencing Growth Traits in Giant Grouper (Epinephelus Lanceolatus). Aquaculture 2023, 563, 738944. [Google Scholar] [CrossRef]
- Ma, B.; Liu, Y.; Zhang, X.; Chen, T.; Zhang, L.; Hu, C.; Yu, S.; Chen, G.; Liu, L.; Zhu, J.; et al. Genome-Wide QTL Mapping and RNA-Seq Reveal Genetic Mechanisms behind Discrepant Growth Traits in Pacific Whiteleg Shrimp, Litopenaeus Vannamei. Aquaculture 2025, 599, 742084. [Google Scholar] [CrossRef]
- Tian, C.-X.; Lin, X.-H.; Zhou, D.-Y.; Chen, Y.; Shen, Y.-J.; Ye, M.-H.; Duan, C.-Y.; Zhang, Y.-L.; Yang, B.-L.; Deng, S.-P.; et al. A Chromosome-Level Genome Assembly of Hong Kong Catfish (Clarias Fuscus) Uncovers a Sex-Determining Region. BMC Genomics 2023, 24, 291. [Google Scholar] [CrossRef] [PubMed]
- Chen, Y.; Lin, X.; Zhu, Y.; Zhou, D.; Zhang, Y.; Huang, Y.; Chen, H.; Li, G.; Tian, C. A Time-Course Transcriptome Analysis of Gonads from HongKong Catfish (Clarias Fuscus) Reveals Genes and Pathways Associated with Gonadal Development. Aquaculture Reports 2024, 37, 102247. [Google Scholar] [CrossRef]
- Anderson, M.J.; Fast, A.W. Temperature and Feed Rate Effects on Chinese Catfish, Clarias Fuscus (Lacepède), Growth. Aquaculture Res 1991, 22, 435–442. [Google Scholar] [CrossRef]
- Lin, X.; Tan, J.; Shen, Y.; Yang, B.; Zhang, Y.; Liao, Y.; Wang, P.; Zhou, D.; Li, G.; Tian, C. A High-Density Genetic Linkage Map and QTL Mapping for Sex in Clarias Fuscus. Aquaculture 2022, 561, 738723. [Google Scholar] [CrossRef]
- Van, O. MapQTL6, Software for the Mapping of Quantitative Trait Loci in Experimental Population of Diploid Species. Wageningen, Netherlands, Kyazma B.V. 2009. [Google Scholar]
- Parkhomchuk, D.; Borodina, T.; Amstislavskiy, V.; Banaru, M.; Hallen, L.; Krobitsch, S.; Lehrach, H.; Soldatov, A. Transcriptome Analysis by Strand-Specific Sequencing of Complementary DNA. Nucleic Acids Research 2009, 37, e123–e123. [Google Scholar] [CrossRef]
- Yan, L.; Yang, M.; Guo, H.; Yang, L.; Wu, J.; Li, R.; Liu, P.; Lian, Y.; Zheng, X.; Yan, J.; et al. Single-Cell RNA-Seq Profiling of Human Preimplantation Embryos and Embryonic Stem Cells. Nat Struct Mol Biol 2013, 20, 1131–1139. [Google Scholar] [CrossRef]
- Mortazavi, A.; Williams, B.A.; McCue, K.; Schaeffer, L.; Wold, B. Mapping and Quantifying Mammalian Transcriptomes by RNA-Seq. Nat Methods 2008, 5, 621–628. [Google Scholar] [CrossRef] [PubMed]
- Pertea, M.; Pertea, G.M.; Antonescu, C.M.; Chang, T.-C.; Mendell, J.T.; Salzberg, S.L. StringTie Enables Improved Reconstruction of a Transcriptome from RNA-Seq Reads. Nat Biotechnol 2015, 33, 290–295. [Google Scholar] [CrossRef]
- Valente, L.M.P.; Moutou, K.A.; Conceição, L.E.C.; Engrola, S.; Fernandes, J.M.O.; Johnston, I.A. What Determines Growth Potential and Juvenile Quality of Farmed Fish Species? Reviews in Aquaculture 2013, 5. [Google Scholar] [CrossRef]
- Laghari, M.Y.; Lashari, P.; Zhang, Y.; Sun, X. Identification of Quantitative Trait Loci (QTLs) in Aquaculture Species. Reviews in Fisheries Science & Aquaculture 2014, 22, 221–238. [Google Scholar] [CrossRef]
- Mackay, T.F.C. The Genetic Architecture of Quantitative Traits. Annu. Rev. Genet. 2001, 35, 303–339. [Google Scholar] [CrossRef] [PubMed]
- Liu, H.; Fu, B.; Pang, M.; Feng, X.; Yu, X.; Tong, J. A High-Density Genetic Linkage Map and QTL Fine Mapping for Body Weight in Crucian Carp (Carassius Auratus) Using 2b-RAD Sequencing. G3 Genes|Genomes|Genetics 2017, 7, 2473–2487. [Google Scholar] [CrossRef]
- Zhu, C.; Liu, H.; Pan, Z.; Chang, G.; Wang, H.; Wu, N.; Ding, H.; Yu, X. Construction of a High-Density Genetic Linkage Map and QTL Mapping for Growth Traits in Pseudobagrus Ussuriensis. Aquaculture 2019, 511, 734213. [Google Scholar] [CrossRef]
- Jackson, T.K.; Rhode, C. A High-Density Genetic Linkage Map and QTL Identification for Growth Traits in Dusky Kob (Argyrosomus Japonicus). Aquaculture 2024, 586, 740786. [Google Scholar] [CrossRef]
- Guo, J.; Li, C.; Teng, T.; Shen, F.; Chen, Y.; Wang, Y.; Pan, C.; Ling, Q. Construction of the First High-Density Genetic Linkage Map of Pikeperch (Sander Lucioperca) Using Specific Length Amplified Fragment (SLAF) Sequencing and QTL Analysis of Growth-Related Traits. Aquaculture 2018, 497, 299–305. [Google Scholar] [CrossRef]
- Lu, X.; Chen, H.-M.; Qian, X.-Q.; Gui, J.-F. Transcriptome Analysis of Grass Carp (Ctenopharyngodon Idella) between Fast- and Slow-Growing Fish. Comparative Biochemistry and Physiology Part D: Genomics and Proteomics 2020, 35, 100688. [Google Scholar] [CrossRef]
- Lin, Z.; Zhang, Z.; Solberg, M.F.; Chen, Z.; Wei, M.; Zhu, F.; Jia, C.; Meng, Q.; Zhang, Z. Comparative Transcriptome Analysis of Mixed Tissues of Black Porgy (Acanthopagrus Schlegelii) with Differing Growth Rates. Aquaculture Research 2021, 52, 5800–5813. [Google Scholar] [CrossRef]
- Yang, J.; Lu, B.; Yu, Z.; Zhang, L.; Chen, Y.; Chen, Z.; Han, C.; Shu, H. Multiple Tissues Transcriptome of Zig-Zag Eel (Mastacembelus Armatus) with Different Growth Rates. Animals 2024, 14, 248. [Google Scholar] [CrossRef] [PubMed]
- Wellen, K.E.; Hatzivassiliou, G.; Sachdeva, U.M.; Bui, T.V.; Cross, J.R.; Thompson, C.B. ATP-Citrate Lyase Links Cellular Metabolism to Histone Acetylation. Science 2009, 324, 1076–1080. [Google Scholar] [CrossRef]
- Kleiber, M. BODY SIZE AND METABOLIC RATE. Physiological Reviews 1947, 27, 511–541. [Google Scholar] [CrossRef] [PubMed]
- Tocher, D.R. Metabolism and Functions of Lipids and Fatty Acids in Teleost Fish. Reviews in Fisheries Science 2003, 11, 107–184. [Google Scholar] [CrossRef]
- Varanasi, U.; Chu, R.; Chu, S.; Espinosa, R.; LeBeau, M.M.; Reddy, J.K. Isolation of the Human Peroxisomal Acyl-CoA Oxidase Gene: Organization, Promoter Analysis, and Chromosomal Localization. Proc. Natl. Acad. Sci. U.S.A. 1994, 91, 3107–3111. [Google Scholar] [CrossRef]
- Patel, M.S.; Roche, T.E. Molecular Biology and Biochemistry of Pyruvate Dehydrogenase Complexes. FASEB J. 1990, 4, 3224–3233. [Google Scholar] [CrossRef]
- Linster, C.L.; Noël, G.; Stroobant, V.; Vertommen, D.; Vincent, M.-F.; Bommer, G.T.; Veiga-da-Cunha, M.; Van Schaftingen, E. Ethylmalonyl-CoA Decarboxylase, a New Enzyme Involved in Metabolite Proofreading. Journal of Biological Chemistry 2011, 286, 42992–43003. [Google Scholar] [CrossRef]
- Panov, A.V.; Mayorov, V.I.; Dikalov, S.I. Role of Fatty Acids β-Oxidation in the Metabolic Interactions Between Organs. IJMS 2024, 25, 12740. [Google Scholar] [CrossRef]
- Trefely, S.; Lovell, C.D.; Snyder, N.W.; Wellen, K.E. Compartmentalised Acyl-CoA Metabolism and Roles in Chromatin Regulation. Molecular Metabolism 2020, 38, 100941. [Google Scholar] [CrossRef]
- Modrell, M.S.; Baker, C.V.H. Evolution of Electrosensory Ampullary Organs: Conservation of Eya4 Expression during Lateral Line Development in Jawed Vertebrates. Evolution and Development 2012, 14, 277–285. [Google Scholar] [CrossRef] [PubMed]
- Wang, L.; Sewell, W.F.; Kim, S.D.; Shin, J.T.; MacRae, C.A.; Zon, L.I.; Seidman, J.G.; Seidman, C.E. Eya4 Regulation of Na+/K+-ATPase Is Required for Sensory System Development in Zebrafish. Development 2008, 135, 3425–3434. [Google Scholar] [CrossRef] [PubMed]
- Nelson, C.B.; Rogers, S.; Roychoudhury, K.; Tan, Y.S.; Atkinson, C.J.; Sobinoff, A.P.; Tomlinson, C.G.; Hsu, A.; Lu, R.; Dray, E.; et al. The Eyes Absent Family Members EYA4 and EYA1 Promote PLK1 Activation and Successful Mitosis through Tyrosine Dephosphorylation. Nat Commun 2024, 15, 1385. [Google Scholar] [CrossRef] [PubMed]
- Abdel-Razek, O.; Marzouk, A.; MacKinnon, M.; Guy, E.T.; Pohar, S.A.; Zhushma, E.; Liu, J.; Sia, I.; Gokey, J.J.; Tay, H.G.; et al. Calcium Signaling Mediates Proliferation of the Precursor Cells That Give Rise to the Ciliated Left-Right Organizer in the Zebrafish Embryo. Front. Mol. Biosci. 2023, 10, 1292076. [Google Scholar] [CrossRef]
- Nakamura, T.; Hamada, H. Left-Right Patterning: Conserved and Divergent Mechanisms. Development 2012, 139, 3257–3262. [Google Scholar] [CrossRef]
- Ebnet, K. Junctional Adhesion Molecules (JAMs): Cell Adhesion Receptors with Pleiotropic Functions in Cell Physiology and Development. Physiological Reviews 2017, 97, 1529–1554. [Google Scholar] [CrossRef]
- Wu, N.; Li, C.-J.; Gui, J.-F. Molecular Characterization and Functional Commonality of Nucleophosmin/Nucleoplasmin in Two Cyprinid Fish. Biochem Genet 2009, 47, 749–762. [Google Scholar] [CrossRef]
- Stooke-Vaughan, G.A.; Obholzer, N.D.; Baxendale, S.; Megason, S.G.; Whitfield, T.T. Otolith Tethering in the Zebrafish Otic Vesicle Requires Otogelin and α-Tectorin. Development 2015, 142, 1137–1145. [Google Scholar] [CrossRef]
- Thomas, M.; Langley, B.; Berry, C.; Sharma, M.; Kirk, S.; Bass, J.; Kambadur, R. Myostatin, a Negative Regulator of Muscle Growth, Functions by Inhibiting Myoblast Proliferation. Journal of Biological Chemistry 2000, 275, 40235–40243. [Google Scholar] [CrossRef]
- Coogan, M.; Alston, V.; Su, B.; Khalil, K.; Elaswad, A.; Khan, M.; Simora, R.M.C.; Johnson, A.; Xing, D.; Li, S.; et al. CRISPR/Cas-9 Induced Knockout of Myostatin Gene Improves Growth and Disease Resistance in Channel Catfish (Ictalurus Punctatus). Aquaculture 2022, 557, 738290. [Google Scholar] [CrossRef]
- Zhong, Z.; Niu, P.; Wang, M.; Huang, G.; Xu, S.; Sun, Y.; Xu, X.; Hou, Y.; Sun, X.; Yan, Y.; et al. Targeted Disruption of Sp7 and Myostatin with CRISPR-Cas9 Results in Severe Bone Defects and More Muscular Cells in Common Carp. Sci Rep 2016, 6, 22953. [Google Scholar] [CrossRef] [PubMed]
- Boomsma, R.A.; Scott, H.; Walters, K. Immunocytochemical Localization of Epidermal Growth Factor Receptor in Early Embryos of the Japanese Medaka Fish (Oryzias Latipes). Histochem. J. 2001, 33, 37–42. [Google Scholar] [CrossRef]
- Xie, L.; Tang, Q.; Yang, L.; Chen, L. Insulin-like Growth Factor I Promotes Oocyte Maturation through Increasing the Expression and Phosphorylation of Epidermal Growth Factor Receptor in the Zebrafish Ovary. Molecular and Cellular Endocrinology 2016, 419, 198–207. [Google Scholar] [CrossRef]
- Zhang, Q.; He, X.; Yao, S.; Lin, T.; Zhang, L.; Chen, D.; Chen, C.; Yang, Q.; Li, F.; Zhu, Y.-M.; et al. Ablation of Mto1 in Zebrafish Exhibited Hypertrophic Cardiomyopathy Manifested by Mitochondrion RNA Maturation Deficiency. Nucleic Acids Research 2021, 49, 4689–4704. [Google Scholar] [CrossRef] [PubMed]
- Fan, Y.; Lu, D. The Ikaros Family of Zinc-Finger Proteins. Acta Pharmaceutica Sinica B 2016, 6, 513–521. [Google Scholar] [CrossRef] [PubMed]
- Weatherbee, S.D.; Niswander, L.A.; Anderson, K.V. A Mouse Model for Meckel Syndrome Reveals Mks1 Is Required for Ciliogenesis and Hedgehog Signaling. Human Molecular Genetics 2009, 18, 4565–4575. [Google Scholar] [CrossRef]
- Kozłowski, J.; Konarzewski, M.; Czarnoleski, M. Coevolution of Body Size and Metabolic Rate in Vertebrates: A Life-history Perspective. Biological Reviews 2020, 95, 1393–1417. [Google Scholar] [CrossRef]
Figure 1.
Frequency distribution of growth traits in the F1 full-sibling population (N = 200): (A) body weight, (B) body height, (C) body length, (D) body width, (E) orbital diameter, (F) caudal peduncle length, (G) caudal peduncle height, and (H) pre-dorsal length. The vertical axis represents the percentage of individuals within each interval relative to the total population.
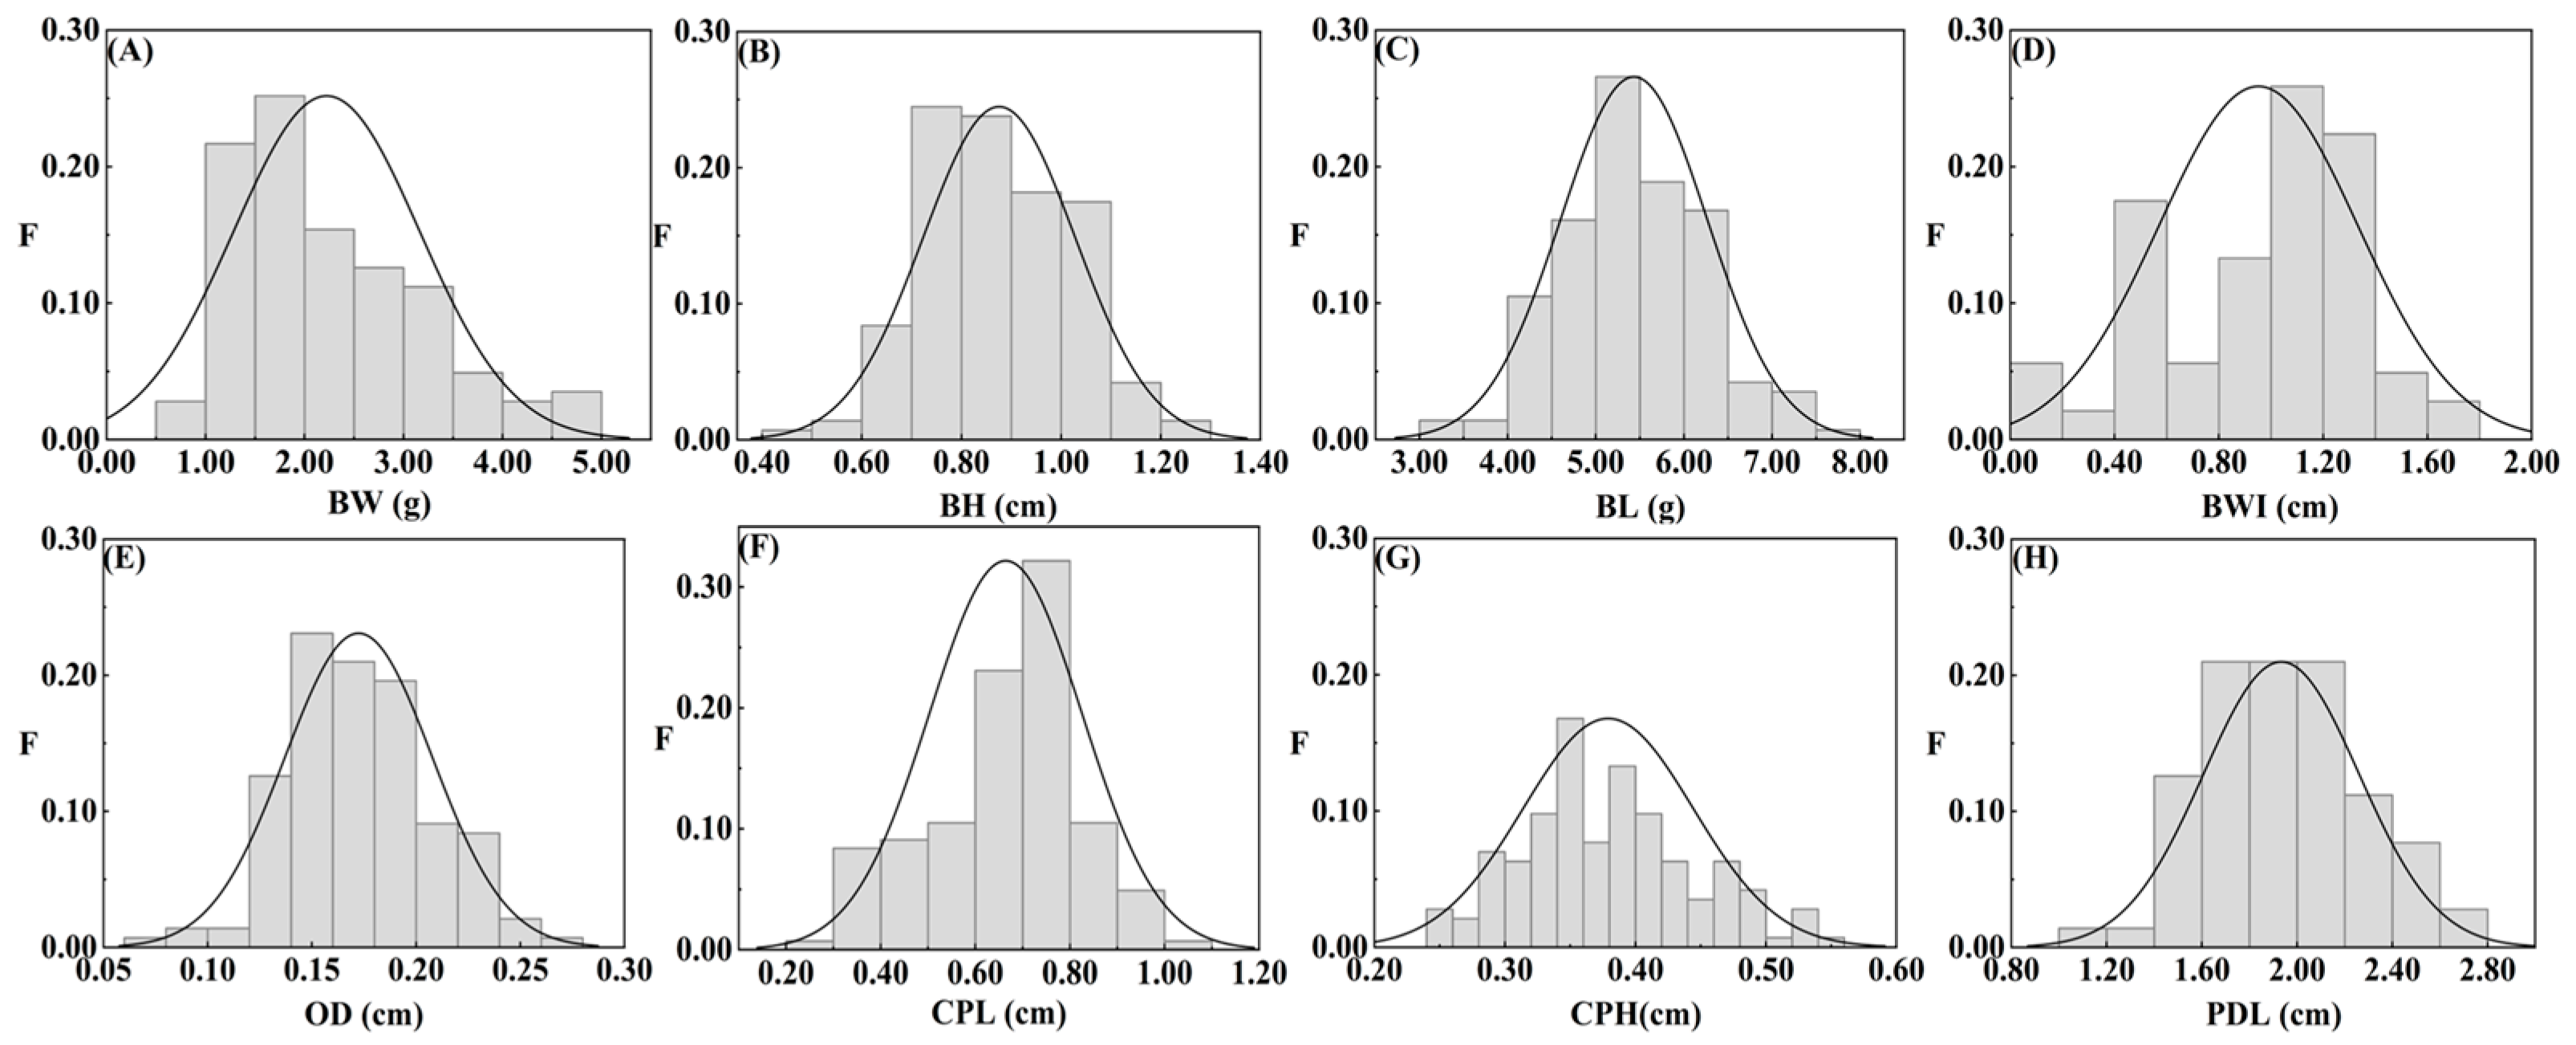
Figure 2.
LOD scores along the 28 linkage groups for variation in eight growth-related traits in C. fuscus. The horizontal axis represents the positions of the linkage groups, while the vertical axis shows the corresponding LOD values. The red dashed horizontal line indicates the LOD significance threshold of 3.5 for the linkage population.
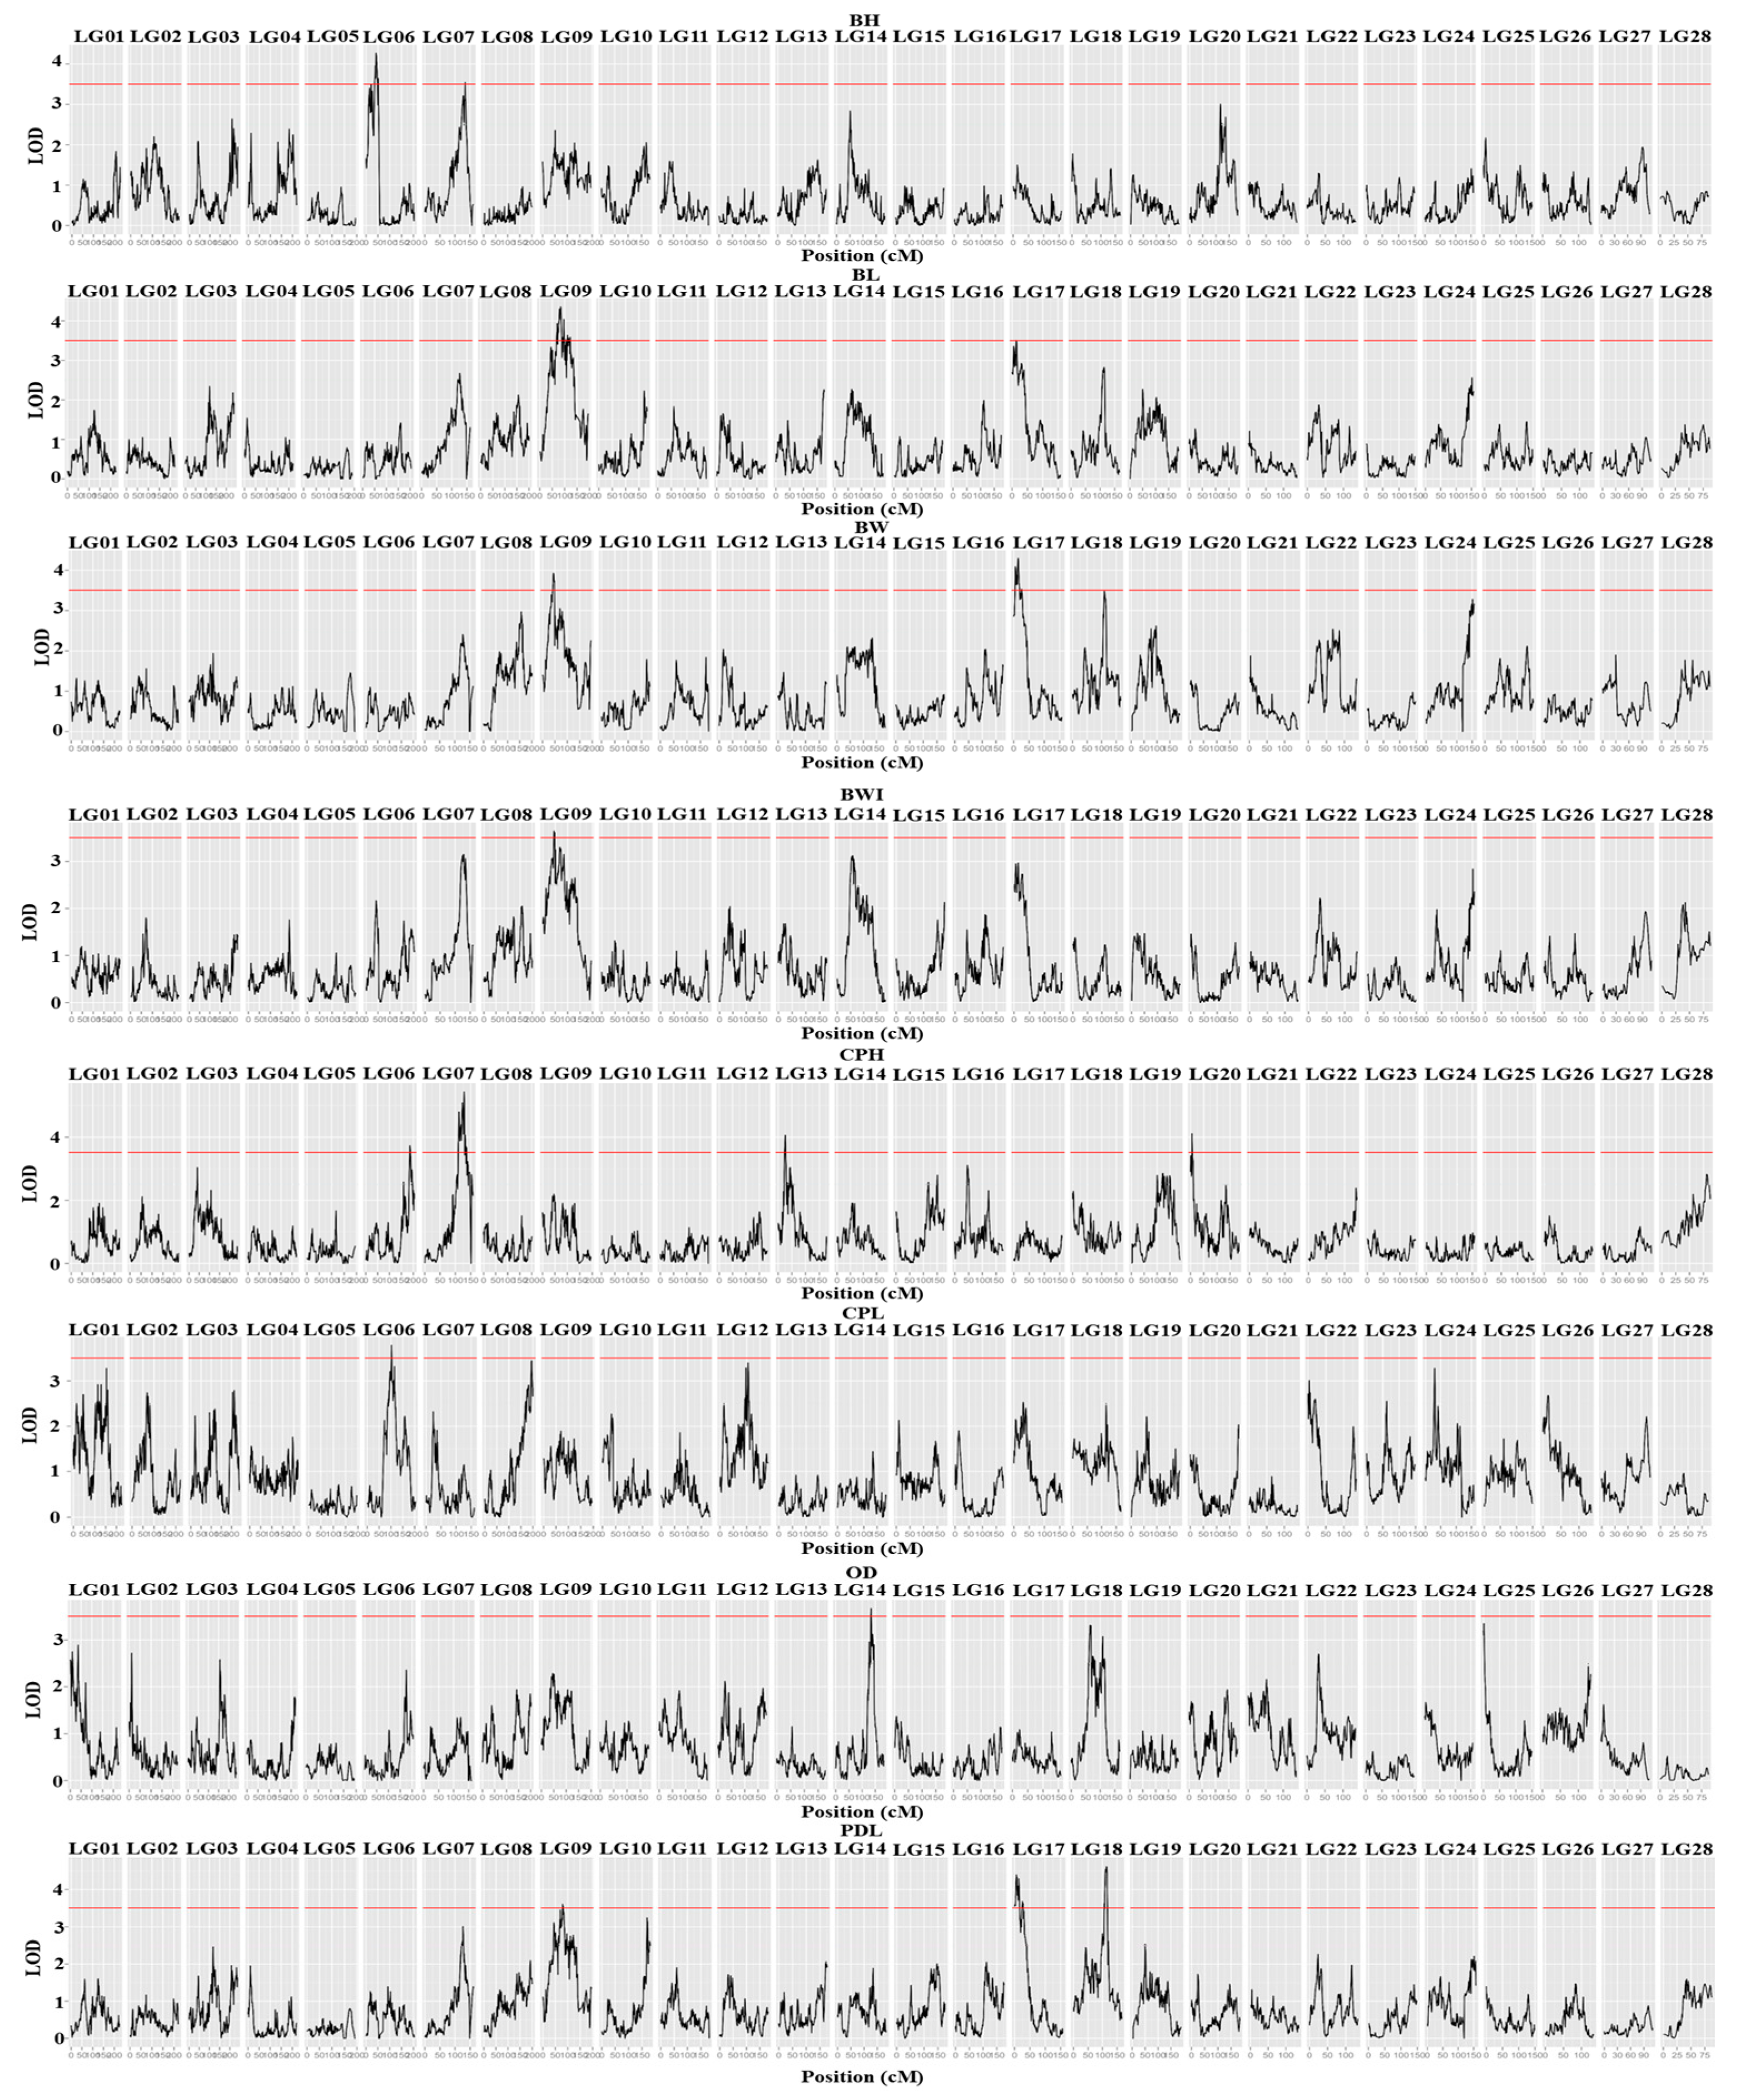
Figure 3.
Functional enrichment analysis of QTL intervals for growth traits in C. fuscus. (A) Cluster diagram of GO enrichment analysis for QTL intervals associated with growth traits. The color of the bars indicates the gene enrichment category, while the bar length represents the significance level of gene expression. (B) Bubble plot of KEGG enrichment analysis for QTL intervals related to growth traits. The size of the circles reflects the number of genes, and the color of the circles indicates the significance level of gene expression.
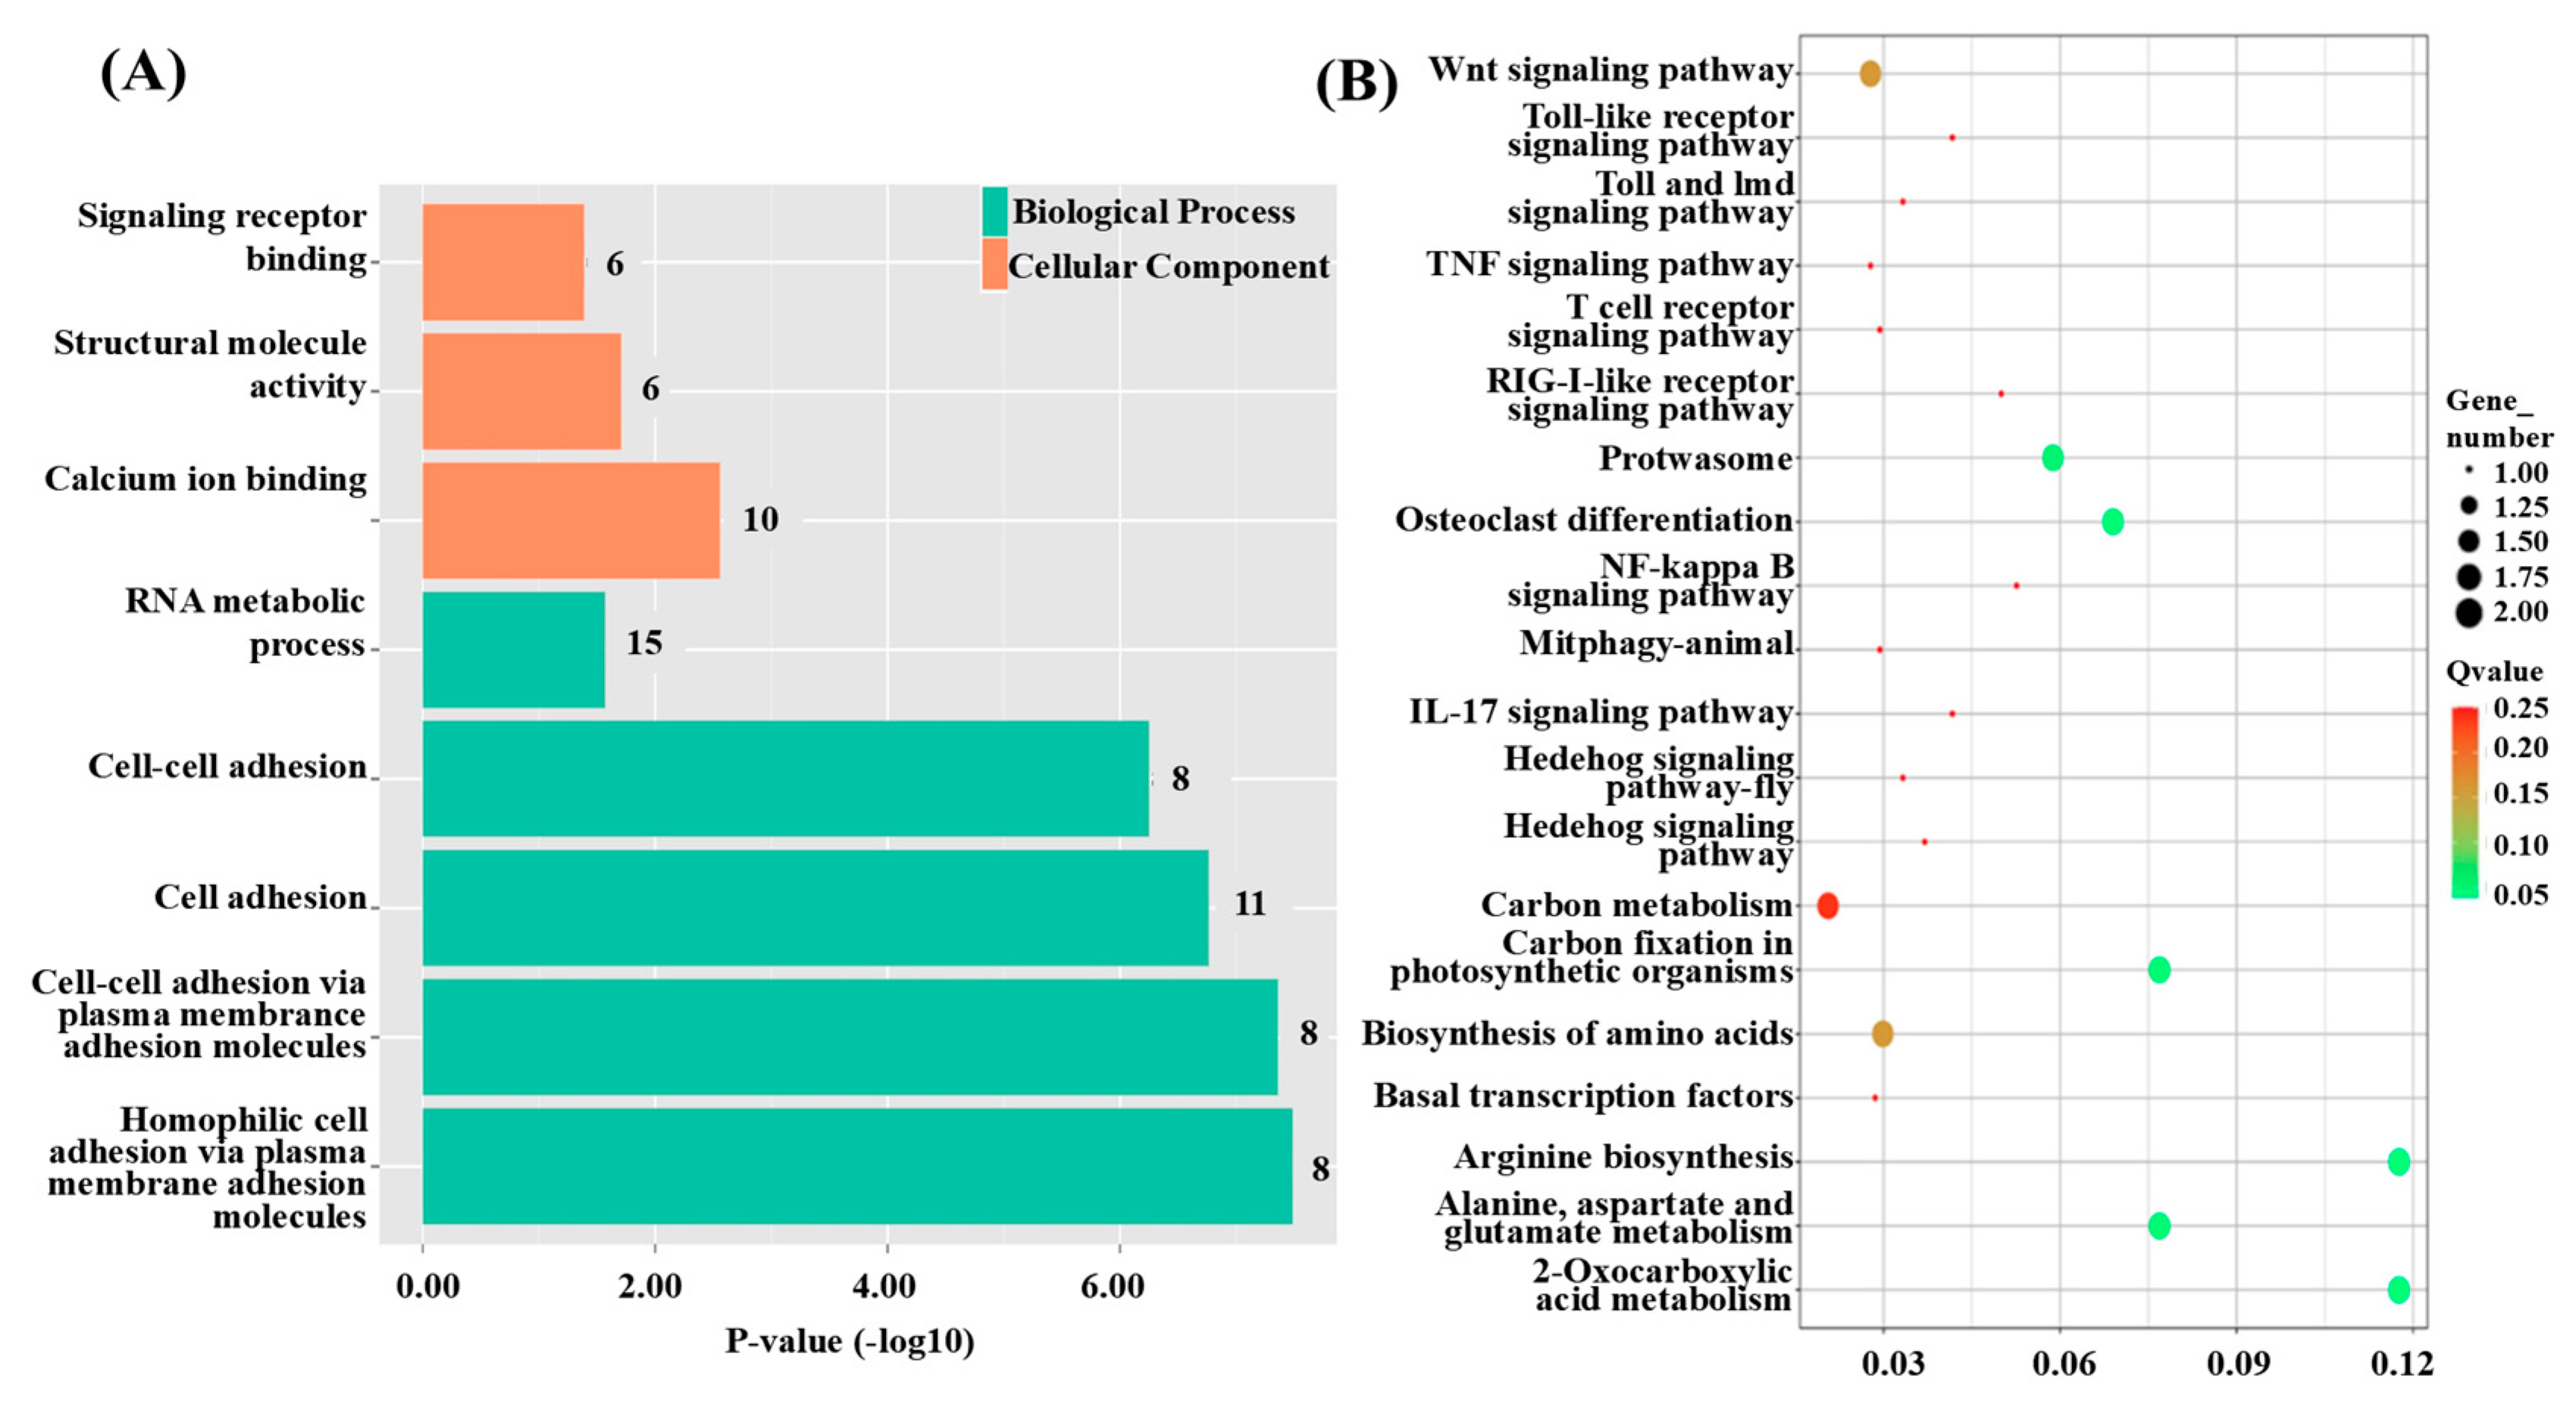
Figure 4.
Transcriptional profiles of big-sized and small-sized groups for growth traits in C. fuscus. (A) Differentially expressed genes between big-sized and small-sized groups. (B) Analysis of the top 20 enriched GO terms in "Biological Processes" and "Cellular Components" based on adjusted p-values. The color of the bars indicates the gene enrichment category, and the bar length represents the significance level of gene expression. (C) KEGG pathway enrichment analysis of the top 20 adjusted p-values. The size of the circles represents the number of genes, and the color indicates the significance level of gene expression.
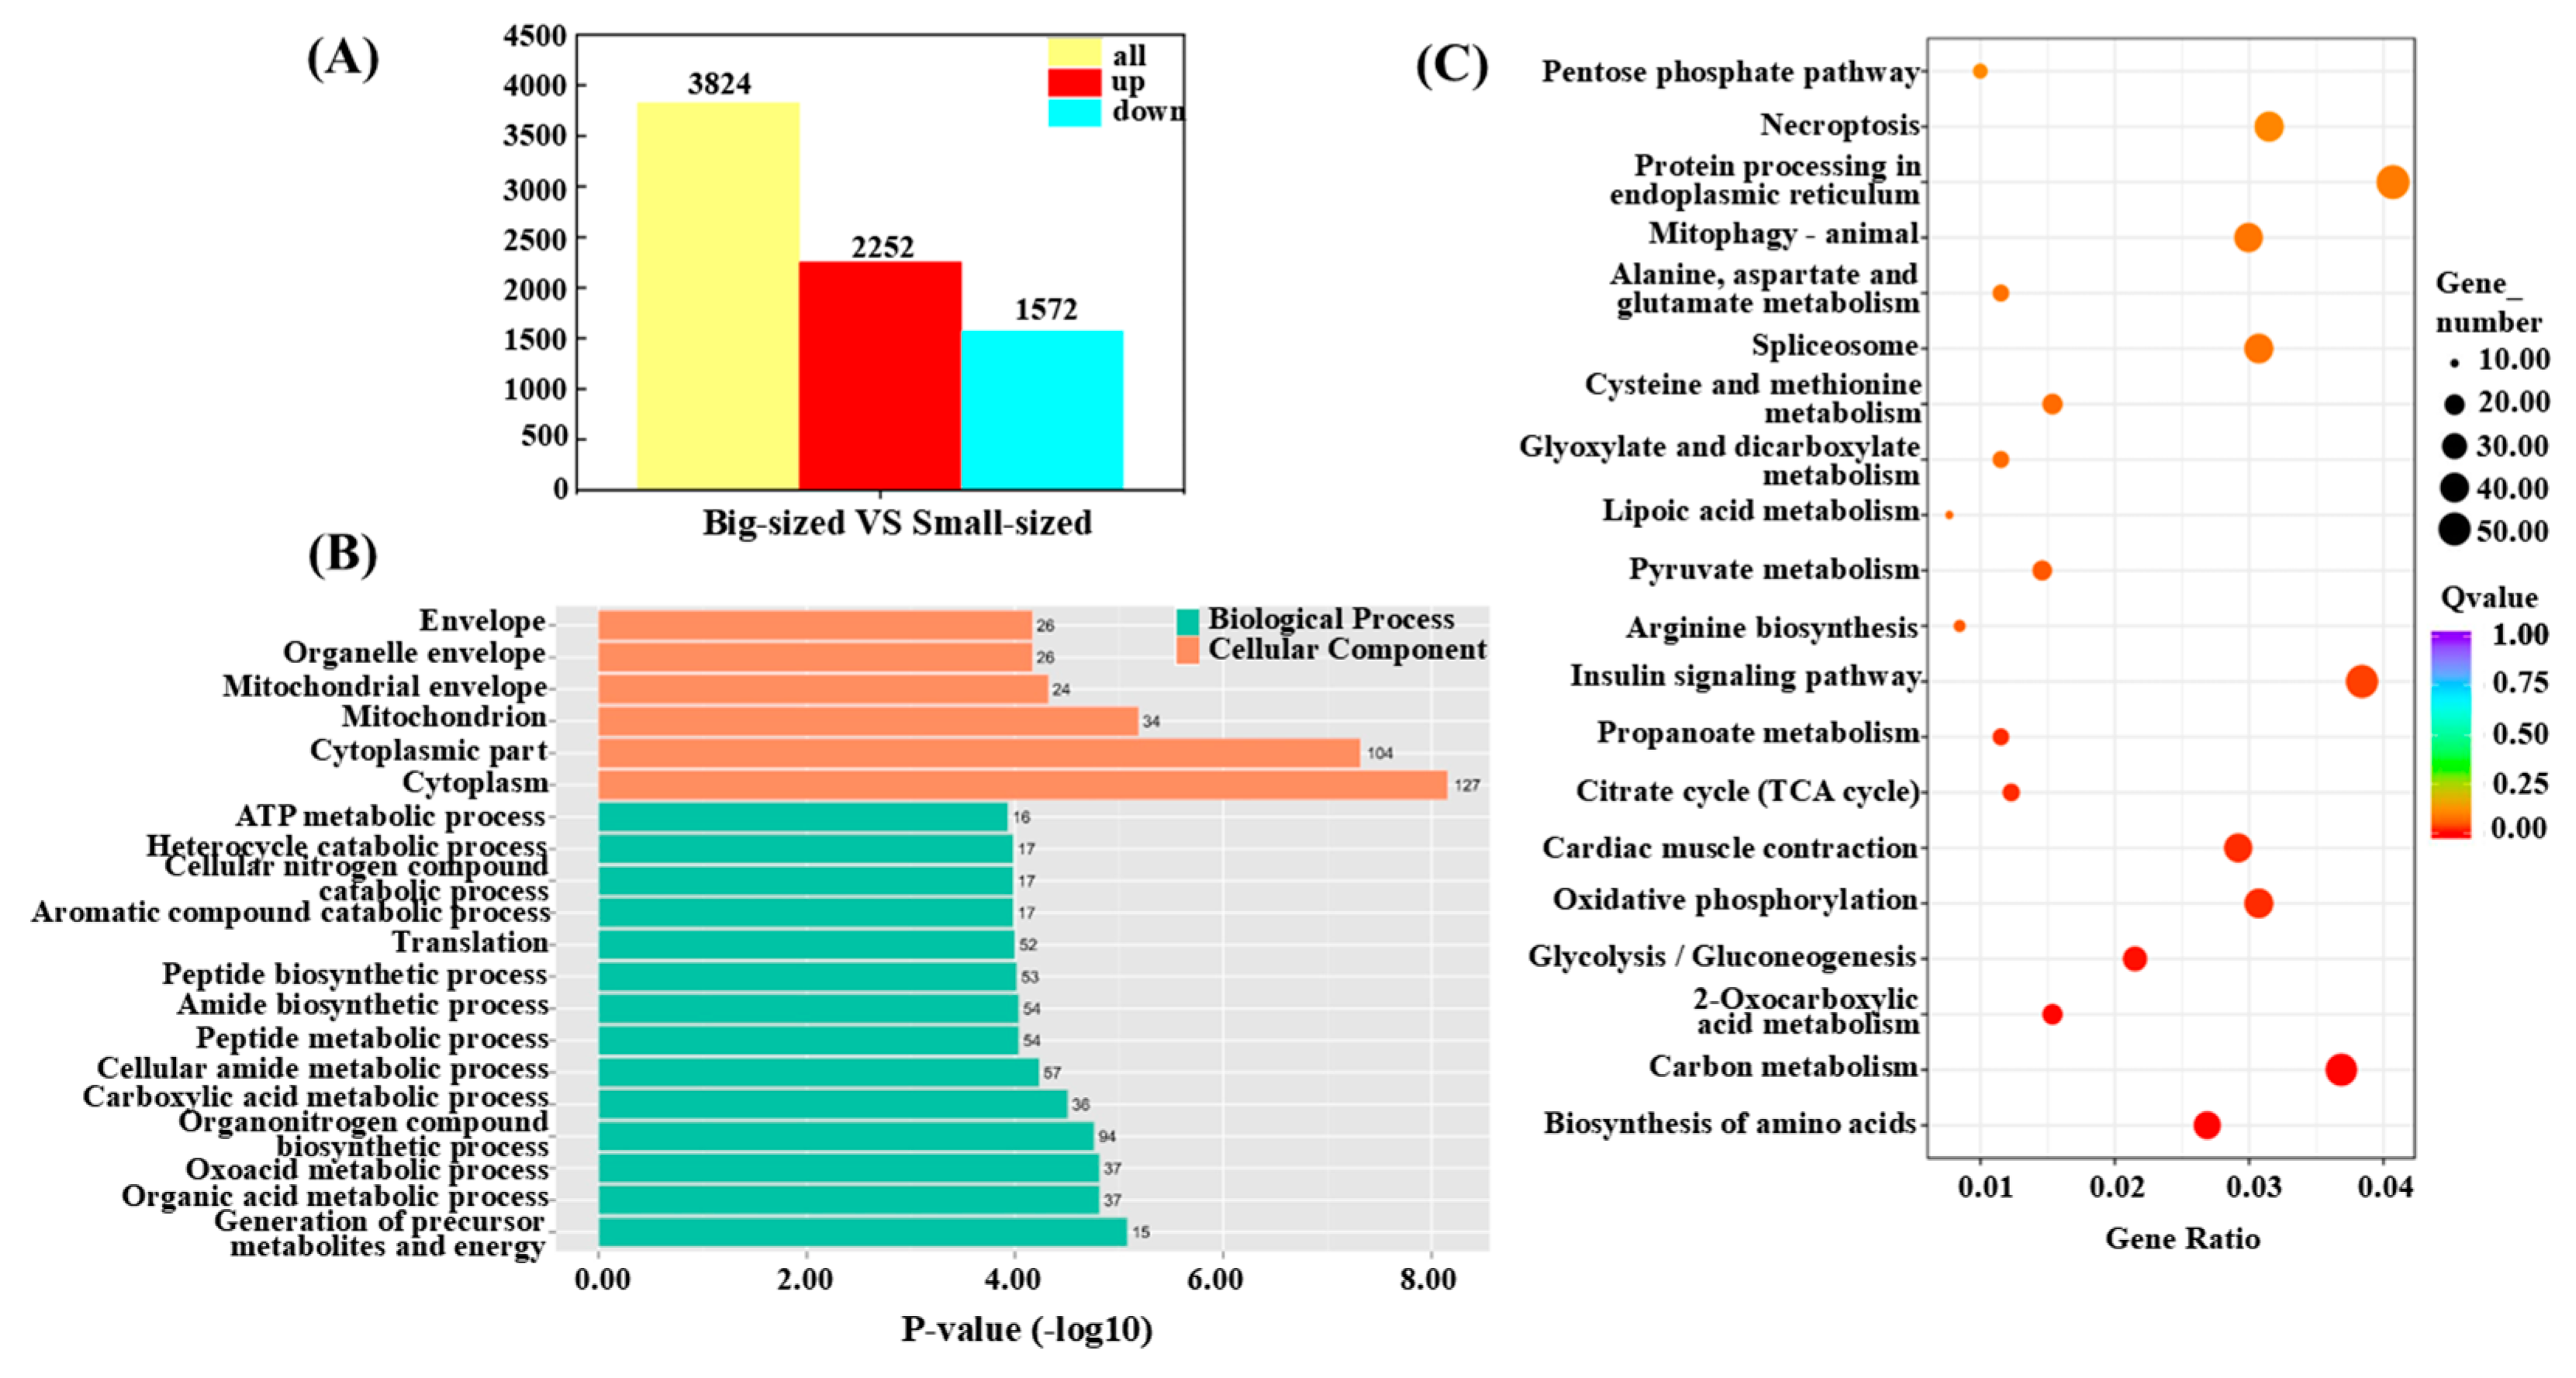
Figure 5.
(A) Carbohydrate metabolism pathways in muscle tissue of C. fuscus (partial). Red indicates upregulated gene expression in big-sized individuals, while blue indicates upregulated gene expression in small-sized individuals. (B) Hierarchical clustering analysis of differentially expressed genes (DEGs) in carbohydrate metabolism pathways between big-sized and small-sized groups.
Figure 6.
(A) Hierarchical clustering analysis of growth candidate genes jointly analyzed by QTL and RNA-seq. Red indicates upregulated gene expression, while blue indicates drowregulated gene expression. (B) Comparative analysis of qRT-PCR results and RNA-seq data.
Figure 6.
(A) Hierarchical clustering analysis of growth candidate genes jointly analyzed by QTL and RNA-seq. Red indicates upregulated gene expression, while blue indicates drowregulated gene expression. (B) Comparative analysis of qRT-PCR results and RNA-seq data.

Table 1.
QTL Mapping Results for Growth Traits in C. fuscus Using the Composite Interval Mapping Method.
Table 1.
QTL Mapping Results for Growth Traits in C. fuscus Using the Composite Interval Mapping Method.
| Trait | QTL | Linkage group | Marking interval (cM) | peak marker (cM) | LOD | PVE (%) | LOD Peek (cM) | Corresponding markers for LOD peaks | Candidate gene |
|---|---|---|---|---|---|---|---|---|---|
| BW | qBW-1 | LG09 | 41.931-45.835 | np27 | 3.910 | 8.70 | 44.543 | LG9 6545823 | --- |
| qBW-2 | LG17 | 13.52-17.098 | np1240 | 4.280 | 9.50 | 14.832 | LG17 28458728 | slc4a1 | |
| BL | qBL-3 | LG09 | 82.998-85.093 | lm55 | 4.350 | 9.80 | 83.615 | LG9 13097329 | --- |
| qBL-4 | LG17 | 11.779-14.832 | lm1144 | 3.510 | 8.00 | 13.520 | LG17 28458720 | slc4a1 | |
| CPH | qCPH-5 | LG06 | 184.207-186.967 | lm3244 | 3.730 | 8.30 | 186.516 | LG6 4577776 | pgap1 |
| qCPH-6 | LG07 | 128.571-129.622 | lm3434 | 5.440 | 11.90 | 128.590 | LG7 8175232 | --- | |
| qCPH-7 | LG13 | 24.138-31.262 | np671 | 4.060 | 9.00 | 26.118 | LG13 30699773 | ltk | |
| qCPH-8 | LG20 | 5.037-6.976 | lm1639 | 4.110 | 9.10 | 5.619 | LG20 1586316 | --- | |
| CPL | qCPL-9 | LG06 | 102.507-103.569 | np3359 | 3.790 | 9.50 | 102.644 | LG6 22085749 | pdk1 |
| OD | qOD-10 | LG14 | 132.742-134.846 | hk257 | 3.580 | 8.00 | 134.365 | LG14 25875874 | qrich1 |
| PDL | qPDL-11 | LG09 | 77.872-80.447 | lm52 | 3.610 | 8.10 | 79.160 | LG9 12492904 | pp2a |
| qPDL-12 | LG17 | 2.533-6.695 | np1243 | 4.400 | 9.80 | 5.627 | LG17 29429338 | mto1 | |
| qPDL-13 | LG18 | 112.055-115.500 | lm1230 | 4.580 | 10.20 | 112.554 | LG18 25096181 | --- | |
| BWI | qBWI-14 | LG09 | 44.543-46.478 | np28 | 3.630 | 8.10 | 45.835 | LG9 6720412 | --- |
| BH | qBH-15 | LG06 | 21.046-22.095 | np3410 | 3.500 | 8.00 | 21.431 | LG6 36044360 | cps |
| qBH-16 | LG06 | 41.649-44.768 | np3396 | 4.220 | 9.60 | 41.702 | LG6 34731920 | --- | |
| qBH-17 | LG07 | 134.41-134.773 | lm3428 | 3.550 | 8.10 | 134.410 | LG7 7360877 | --- |
Table 2.
Summary of transcriptome data generated from C. fuscus samples.
| Sample | Raw-reads | Clean-reads | Clean-reads rate (%) | Total-map | Total-map rate (%) | Q20 | Q30 |
|---|---|---|---|---|---|---|---|
| S1 | 49640720 | 47460188 | 95.61 | 41564096 | 87.58 | 98.16 | 95.10 |
| S2 | 46547234 | 44737262 | 96.11 | 35866634 | 80.17 | 98.12 | 95.23 |
| S3 | 42787644 | 40724206 | 95.18 | 33787631 | 82.97 | 98.01 | 94.76 |
| B1 | 51865132 | 50973770 | 98.38 | 46109511 | 90.46 | 98.61 | 95.99 |
| B2 | 50052990 | 49099298 | 98.09 | 43891232 | 89.39 | 98.76 | 96.40 |
| B3 | 52370048 | 51467180 | 98.28 | 47125928 | 91.57 | 98.71 | 96.22 |
Table 3.
The top 20 genes in the transcriptome associated with body size in C. fuscus.
| Gene ID | Gene name | Gene annotation | log2 (FC) |
|---|---|---|---|
| cfu_9G0006470 | trim32 | E3 ubiquitin-protein ligase TRIM32 | 9.534 |
| cfu_15G0008560 | bloc-1 | Biogenesis of lysosome-related organelles complex 1 | 9.487 |
| cfu_16G0005300 | wwtr1 | WW domain-containing transcription regulator protein 1 | 8.941 |
| cfu_26G0005640 | scfd2 | Sec1 family domain-containing protein 2 | 8.833 |
| cfu_1G0009900 | nipsnap3a | Protein NipSnap homolog 3A | 8.720 |
| cfu_27G0004410 | camlg | Guided entry of tail-anchored proteins factor | 8.636 |
| cfu_10G0006000 | slc16a4 | Monocarboxylate transporter 5 | 8.621 |
| cfu_26G0004610 | atraid | All-trans retinoic acid-induced differentiation factor | 8.559 |
| cfu_27G0003260 | efemp2 | EGF-containing fibulin-like extracellular matrix protein 2 | 8.472 |
| cfu_5G0009050 | aadac | Arylacetamide deacetylase | 8.306 |
| cfu_3G0006820 | rims4 | Regulating synaptic membrane exocytosis protein 4 | -6.820 |
| cfu_9G0008290 | shc3 | SHC-transforming protein 3 | -6.933 |
| cfu_6G0004030 | lpa1 | High-affinity lysophosphatidic acid receptor | -6.988 |
| cfu_15G0007480 | nos2 | Nitric oxide synthase | -7.002 |
| cfu_3G0009150 | tcf23 | Transcription factor 23 | -7.015 |
| cfu_14G0005780 | hrh1 | Histamine H1 receptor | -7.032 |
| cfu_4G0003010 | apoc-1 | Apolipoprotein C-I | -7.104 |
| cfu_14G0006580 | chia | Acidic mammalian chitinase | -7.329 |
| cfu_11G0001850 | fgfbp2 | Fibroblast growth factor-binding protein 2 | -7.474 |
| cfu_22G0000210 | itln | Intelectin | -7.841 |
Table 4.
Candidate genes associated with growth in C. fuscus identified based on QTL mapping and transcriptome analysis.
Table 4.
Candidate genes associated with growth in C. fuscus identified based on QTL mapping and transcriptome analysis.
| Gene ID | Gene name | Gene annotation | log2 (FC) |
|---|---|---|---|
| cfu_6G0008310 | calcrla | calcitonin gene-related peptide type 1 receptorisoform X1 | 2.397 |
| cfu_6G0008340 | wdr75 | WD repeat-containing protein 75 | 1.554 |
| cfu_6G0008350 | asnsd1 | asparagine synthetase domain-containing protein 1 | -1.380 |
| cfu_6G0008380 | osgepl1 | probable tRNA N6-adenosine threonylcarbamoyltransferase | -1.102 |
| cfu_6G0008410 | pms1 | PMS1 protein homolog 1 | -1.197 |
| cfu_6G0008420 | mstnb | myostatin | -2.353 |
| cfu_6G0008440 | pofut2 | GDP-fucose protein O-fucosyltransferase 2 | 6.582 |
| cfu_6G0008510 | ikzf2 | IKAROS Family Zinc Finger 2 | -2.744 |
| cfu_6G0008520 | egfr | Epidermal Growth Factor Receptor | -2.210 |
| cfu_6G0008530 | cps1 | carbamoyl-phosphate synthase | -1.581 |
| cfu_9G0003920 | c9orf78 | Telomere length and silencing protein 1 homolog | -1.118 |
| cfu_9G0003990 | tecta | alpha-tectorin | 2.098 |
| cfu_9G0004000 | tbcel | Tubulin-specific chaperone cofactor E-like protein | 1.174 |
| cfu_9G0004050 | f11r | Junctional adhesion molecule A | 4.879 |
| cfu_9G0003810 | glipr2 | Golgi-associated plant pathogenesis-related protein 1 | -2.428 |
| cfu_9G0002330 | mks1 | Meckel syndrome type 1 protein | -1.804 |
| cfu_14G0007230 | qrich1 | glutamine-rich protein 1 | 1.404 |
| cfu_17G0007930 | atxn7l3 | ataxin-7protein 3 | -1.171 |
| cfu_17G0008220 | mto1 | protein MTO1 homolog | -2.294 |
| cfu_17G0008240 | tctn3 | tectonic-3 | -1.298 |
| cfu_17G0008260 | sult1c1 | sulfotransferase family cytosolic 1B member 1 | -1.707 |
| cfu_17G0008270 | atp2a1 | sarcoplasmic/endoplasmic reticulum calcium ATPase 1 | 1.895 |
| cfu_17G0008530 | ccser2 | serine-rich coiled-coil domain-containing protein 2 | 2.420 |
| cfu_18G0007570 | lca5 | lebercilin | 7.172 |
| cfu_18G0007610 | eya4 | eyes absent homolog 4 isoform X2 | 1.161 |
| cfu_20G0000670 | tlx3 | T-cell leukemia homeobox protein 3 | -6.172 |
| cfu_20G0000680 | npm1 | nucleophosmin | 1.503 |
Disclaimer/Publisher’s Note: The statements, opinions and data contained in all publications are solely those of the individual author(s) and contributor(s) and not of MDPI and/or the editor(s). MDPI and/or the editor(s) disclaim responsibility for any injury to people or property resulting from any ideas, methods, instructions or products referred to in the content. |
© 2025 by the authors. Licensee MDPI, Basel, Switzerland. This article is an open access article distributed under the terms and conditions of the Creative Commons Attribution (CC BY) license (http://creativecommons.org/licenses/by/4.0/).
Copyright: This open access article is published under a Creative Commons CC BY 4.0 license, which permit the free download, distribution, and reuse, provided that the author and preprint are cited in any reuse.


