1. Introduction
The octopus (
Octopus minor), a mollusk species distributed in Korea, Japan, and China, is an essential seafood product in the coastal mudflats of Korea’s southwest region, with significant industrial value [
1]. Ecologically, octopuses serve as energy transmitters, preying on lower trophic organisms such as crustaceans and mollusks [
2,
3]. As a low-calorie, taurine-containing food, it is rich in protein, phosphorus, iron, and vitamins, beneficial for cholesterol suppression and anemia prevention, making it suitable for patients recovering from illness or pregnant women [
4]. Despite its importance, challenges persist in octopus reproduction, spawning, and aquaculture due to their limited distribution, mudflat pollution, short lifespan (1–1.5 years), and low spawning numbers. Artificial breeding and breeding technology development are urgently required for creating superior traits. Particularly, sexual maturation is essential for reproduction, necessitating bodily growth and development. Previous studies on octopus biology include morphological and biological research in Gyeonggi Bay [
5], behavior studies [
6], and growth and spawning studies in the southern coastal areas [
7]. Topics related to reproduction have focused on spawning and hatching [
8].
Recently, molecular-level research has enabled genome and transcriptome analysis using next-generation sequencing (NGS) technologies [
9]. While microarrays were traditionally used to identify gene expression patterns, they are limited in scope when reference sequences are unavailable. RNA-seq offers a revolutionary approach for non-model organisms, enabling expression level and differential expression analysis without prior reference genome information. Compared to microarrays, RNA-seq provides higher sensitivity and dynamic range due to its sequence-based calculation [
10].
This study employed RNA-seq to explore and identify sexual maturation-related genes and DEGs in Octopus minor. The research analyzed gonads and optic lobes at different sexual maturation stages and sexes, generating data in triplicates for reproducibility. Reference transcriptome sequences were constructed de novo for expression quantification, normalized for comparative analysis, and DEGs were identified for further functional analysis, focusing on sexual maturation.
2. Materials and Methods
2.1. Sample Collection and RNA Extraction
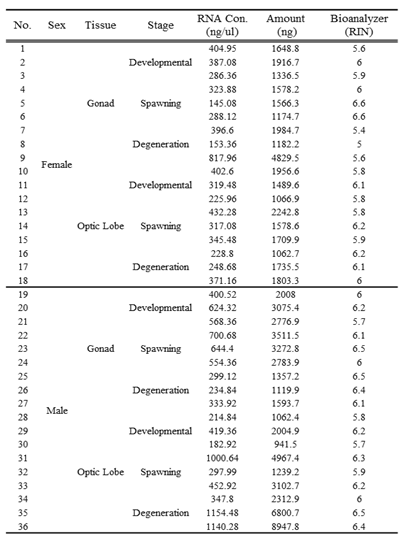
Samples of gonads and optic lobes were collected from female and male octopuses at developmental, spawning, and degeneration stages. A total of 36 samples were used, analyzed in triplicates for reproducibility. RNA was extracted using the TruSeq RNA Sample Prep Kit (Illumina, USA), and RNA quality was assessed using a 2100 BioAnalyzer (
Table 1).
2.2. Library Construction and Reference Transcriptome Assembly
Sequencing libraries were prepared by attaching adapters to 200–300 bp fragments, followed by sequencing using the NextSeq 500 platform. To assemble the reference transcriptome sequence of
Octopus minor, a de novo assembly was conducted [
12]. The assembly process utilized Trinity (v2.2.0) software [
13], which operates in three steps: Inchworm, Chrysalis, and Butterfly. During the Inchworm step, overlapping sequences were grouped into subunits. In the Chrysalis step, contigs produced during the Inchworm step were clustered, and detailed de Bruijn graphs [
14] were created within each cluster. Finally, the Butterfly step interpreted these graphs to predict transcript sequences. For the assembled reference transcriptome of
Octopus minor, statistics such as contig count, GC content, and N50 length were examined to evaluate the assembly quality. Additionally, the presence of conserved orthologs was verified by identifying essential genes across different taxa. These assessments were conducted using the Trinity tool and the BUSCO program [
15]. TransDecoder [
12] was then used to identify the longest Open Reading Frames (ORFs) for each transcript. ORFs were predicted in six frames, and the most probable sequences were extracted. These predicted ORFs were annotated through homology searches against the NCBI NR database, which comprises non-redundant protein sequences. Functional category analysis was further performed using Blast2GO to assign Gene Ontology and KEGG pathway annotations [
16,
17,
18].
2.3. Identification of Octopus minor-Specific Sexual Maturation Genes
To identify Octopus minor-specific candidate sexual maturation genes, a comparative analysis was conducted with the full gene sequences of ten other species: humans (Homo sapiens), mice (Mus musculus), lancelets (Branchiostoma floridae), zebrafish (Danio rerio), pufferfish (Takifugu rubripes), limpets (Lottia gigantea), oysters (Crassostrea gigas), sea hares (Aplysia californica), sea urchins (Strongylocentrotus purpuratus), and octopuses (Octopus bimaculoides). Transcripts without homologous sequences were classified as Octopus minor-specific. Among these, transcripts showing differential expression across maturation stages, tissues, and sexes were further identified as candidate sexual maturation-specific transcripts.
2.4. Gene Expression Patterns and DEG Identification
Gene expression levels for each sample were calculated based on the constructed reference transcriptome. Bowtie and RSEM [
21] were employed for reference mapping and normalization. Expression levels, measured as the expected read counts of mapped sequencing reads, were used to analyze differential expression. DEGs based on maturation stages were identified using ANOVA (p-value < 0.01) in R, while tissue- and sex-specific DEGs were identified using the edgeR package in R, with a Log Fold Change (LogFC) threshold of ≥6 and a False Discovery Rate (FDR) threshold of ≤0.01. The results were visualized using heatmaps to represent expression profiles.
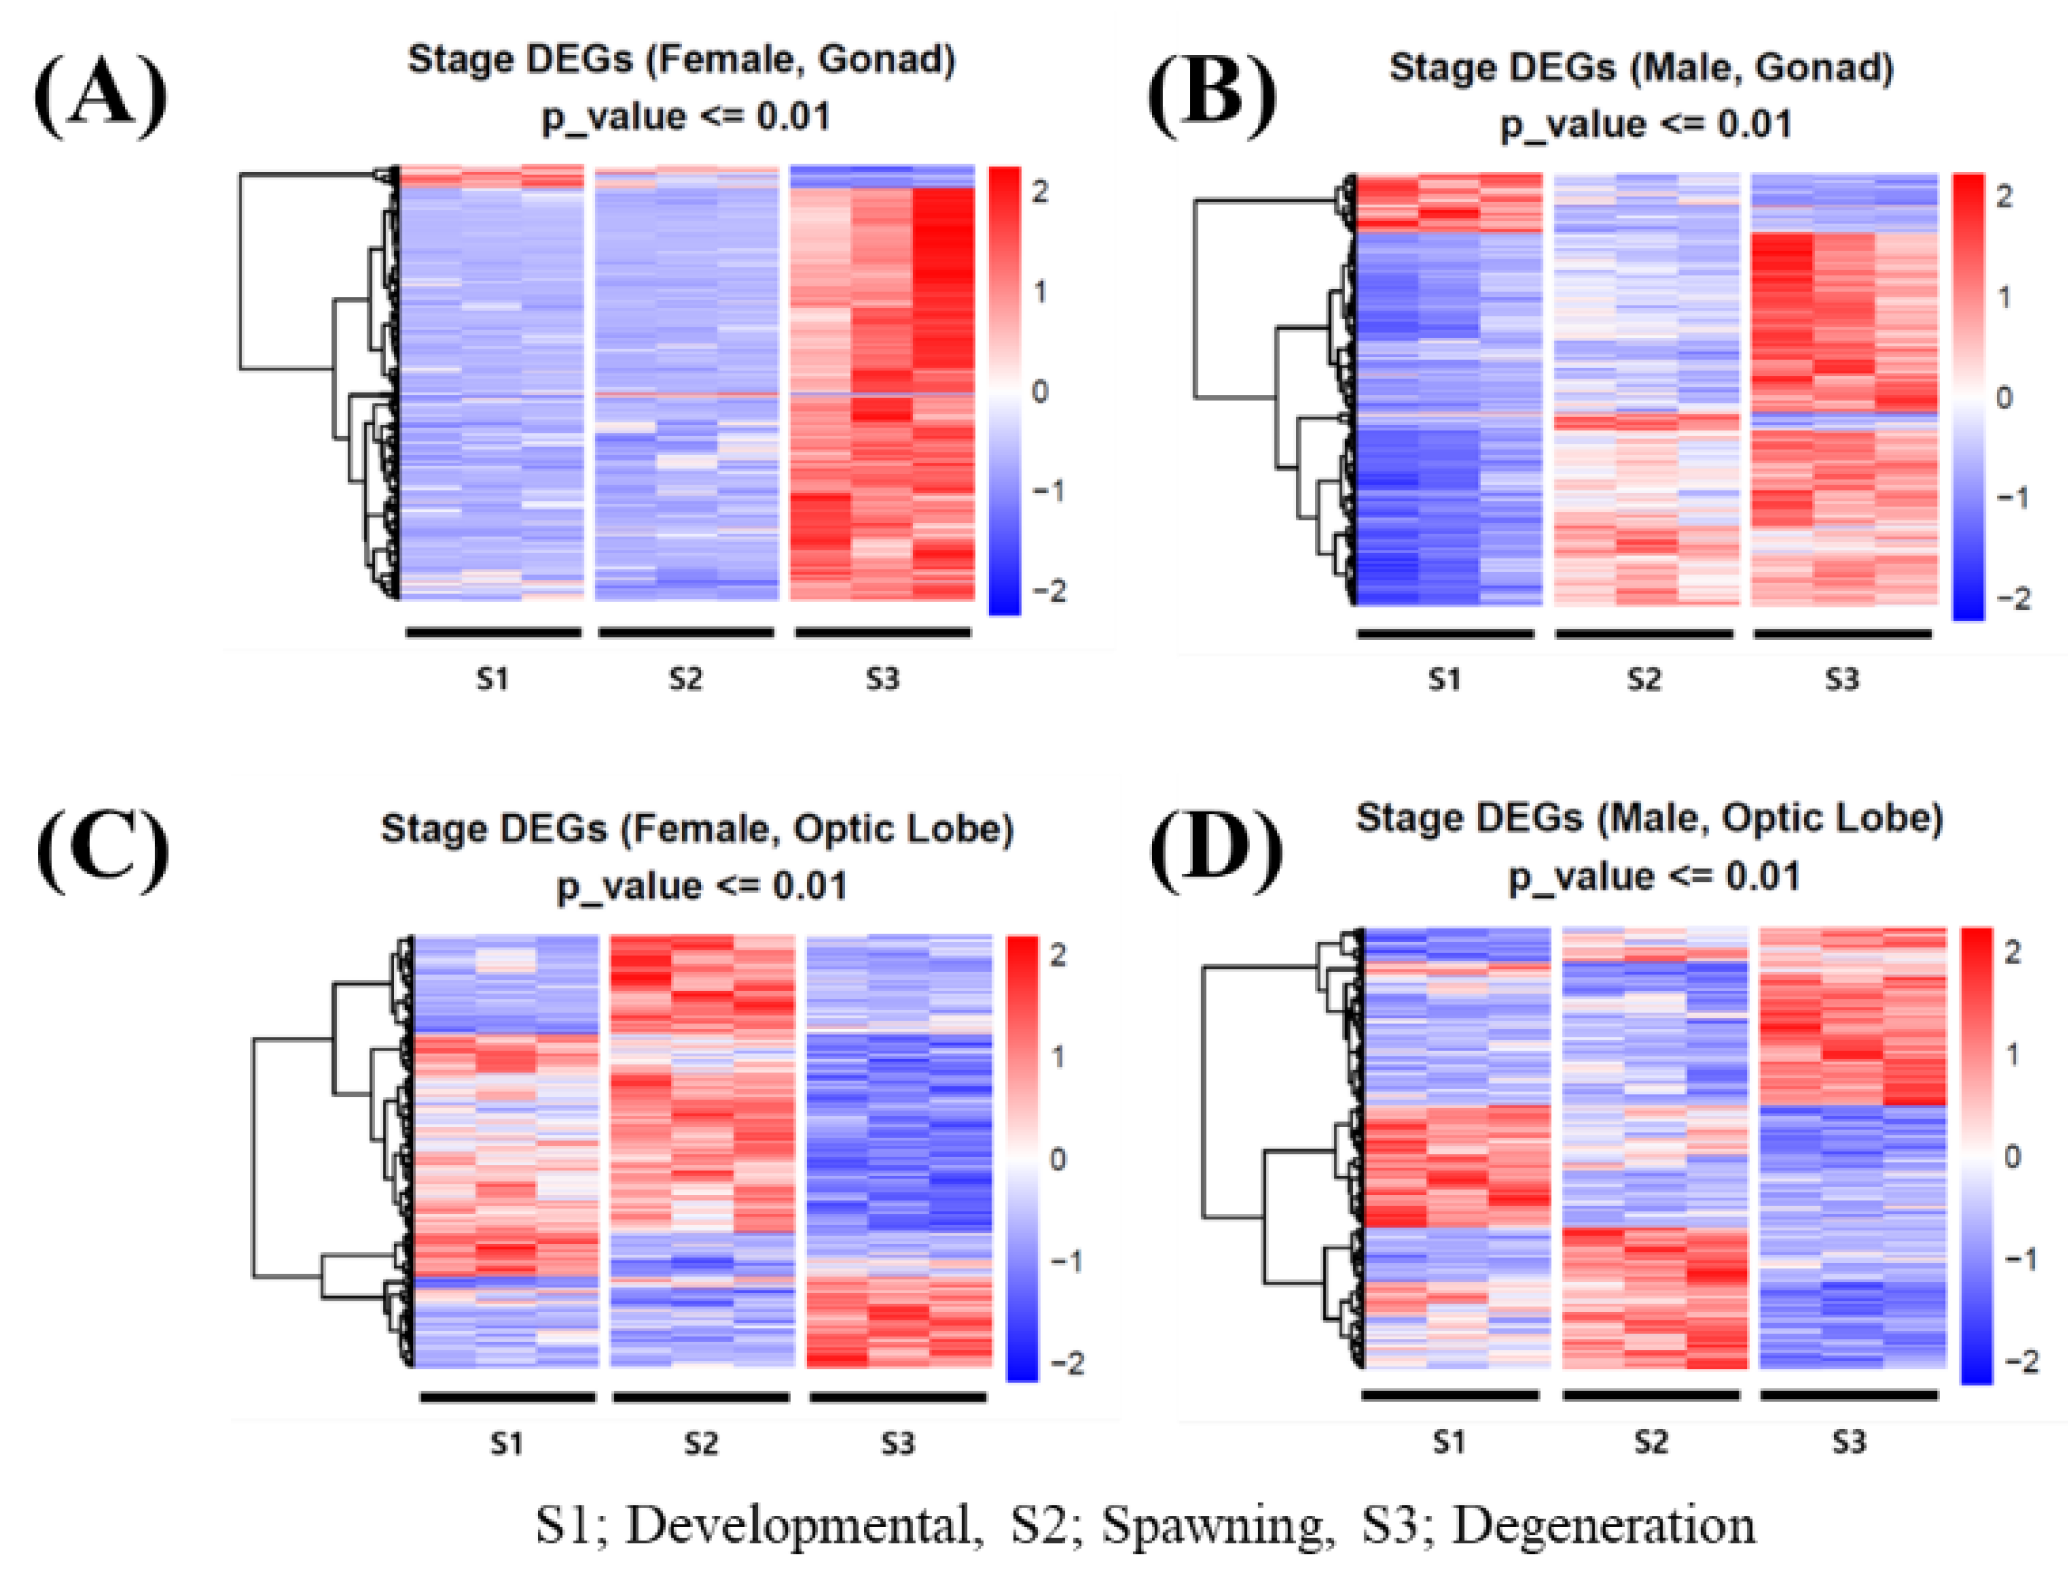
Expression levels were quantified using Bowtie and RSEM, normalized, and analyzed for DEGs using R-packages. ANOVA (p < 0.01) identified stage-specific DEGs, while edgeR analysis (LogFC ≥6, FDR ≤0.01) identified sex- and tissue-specific DEGs. Heatmaps visualized expression patterns (Figure 5).
3. Results
3.1. Reference Transcriptome Construction
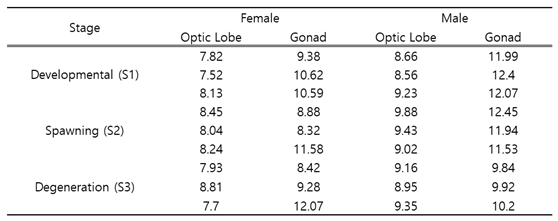
Using the NextSeq 500 platform, an average of 7.7–12.45 gigabytes of sequencing data was generated (
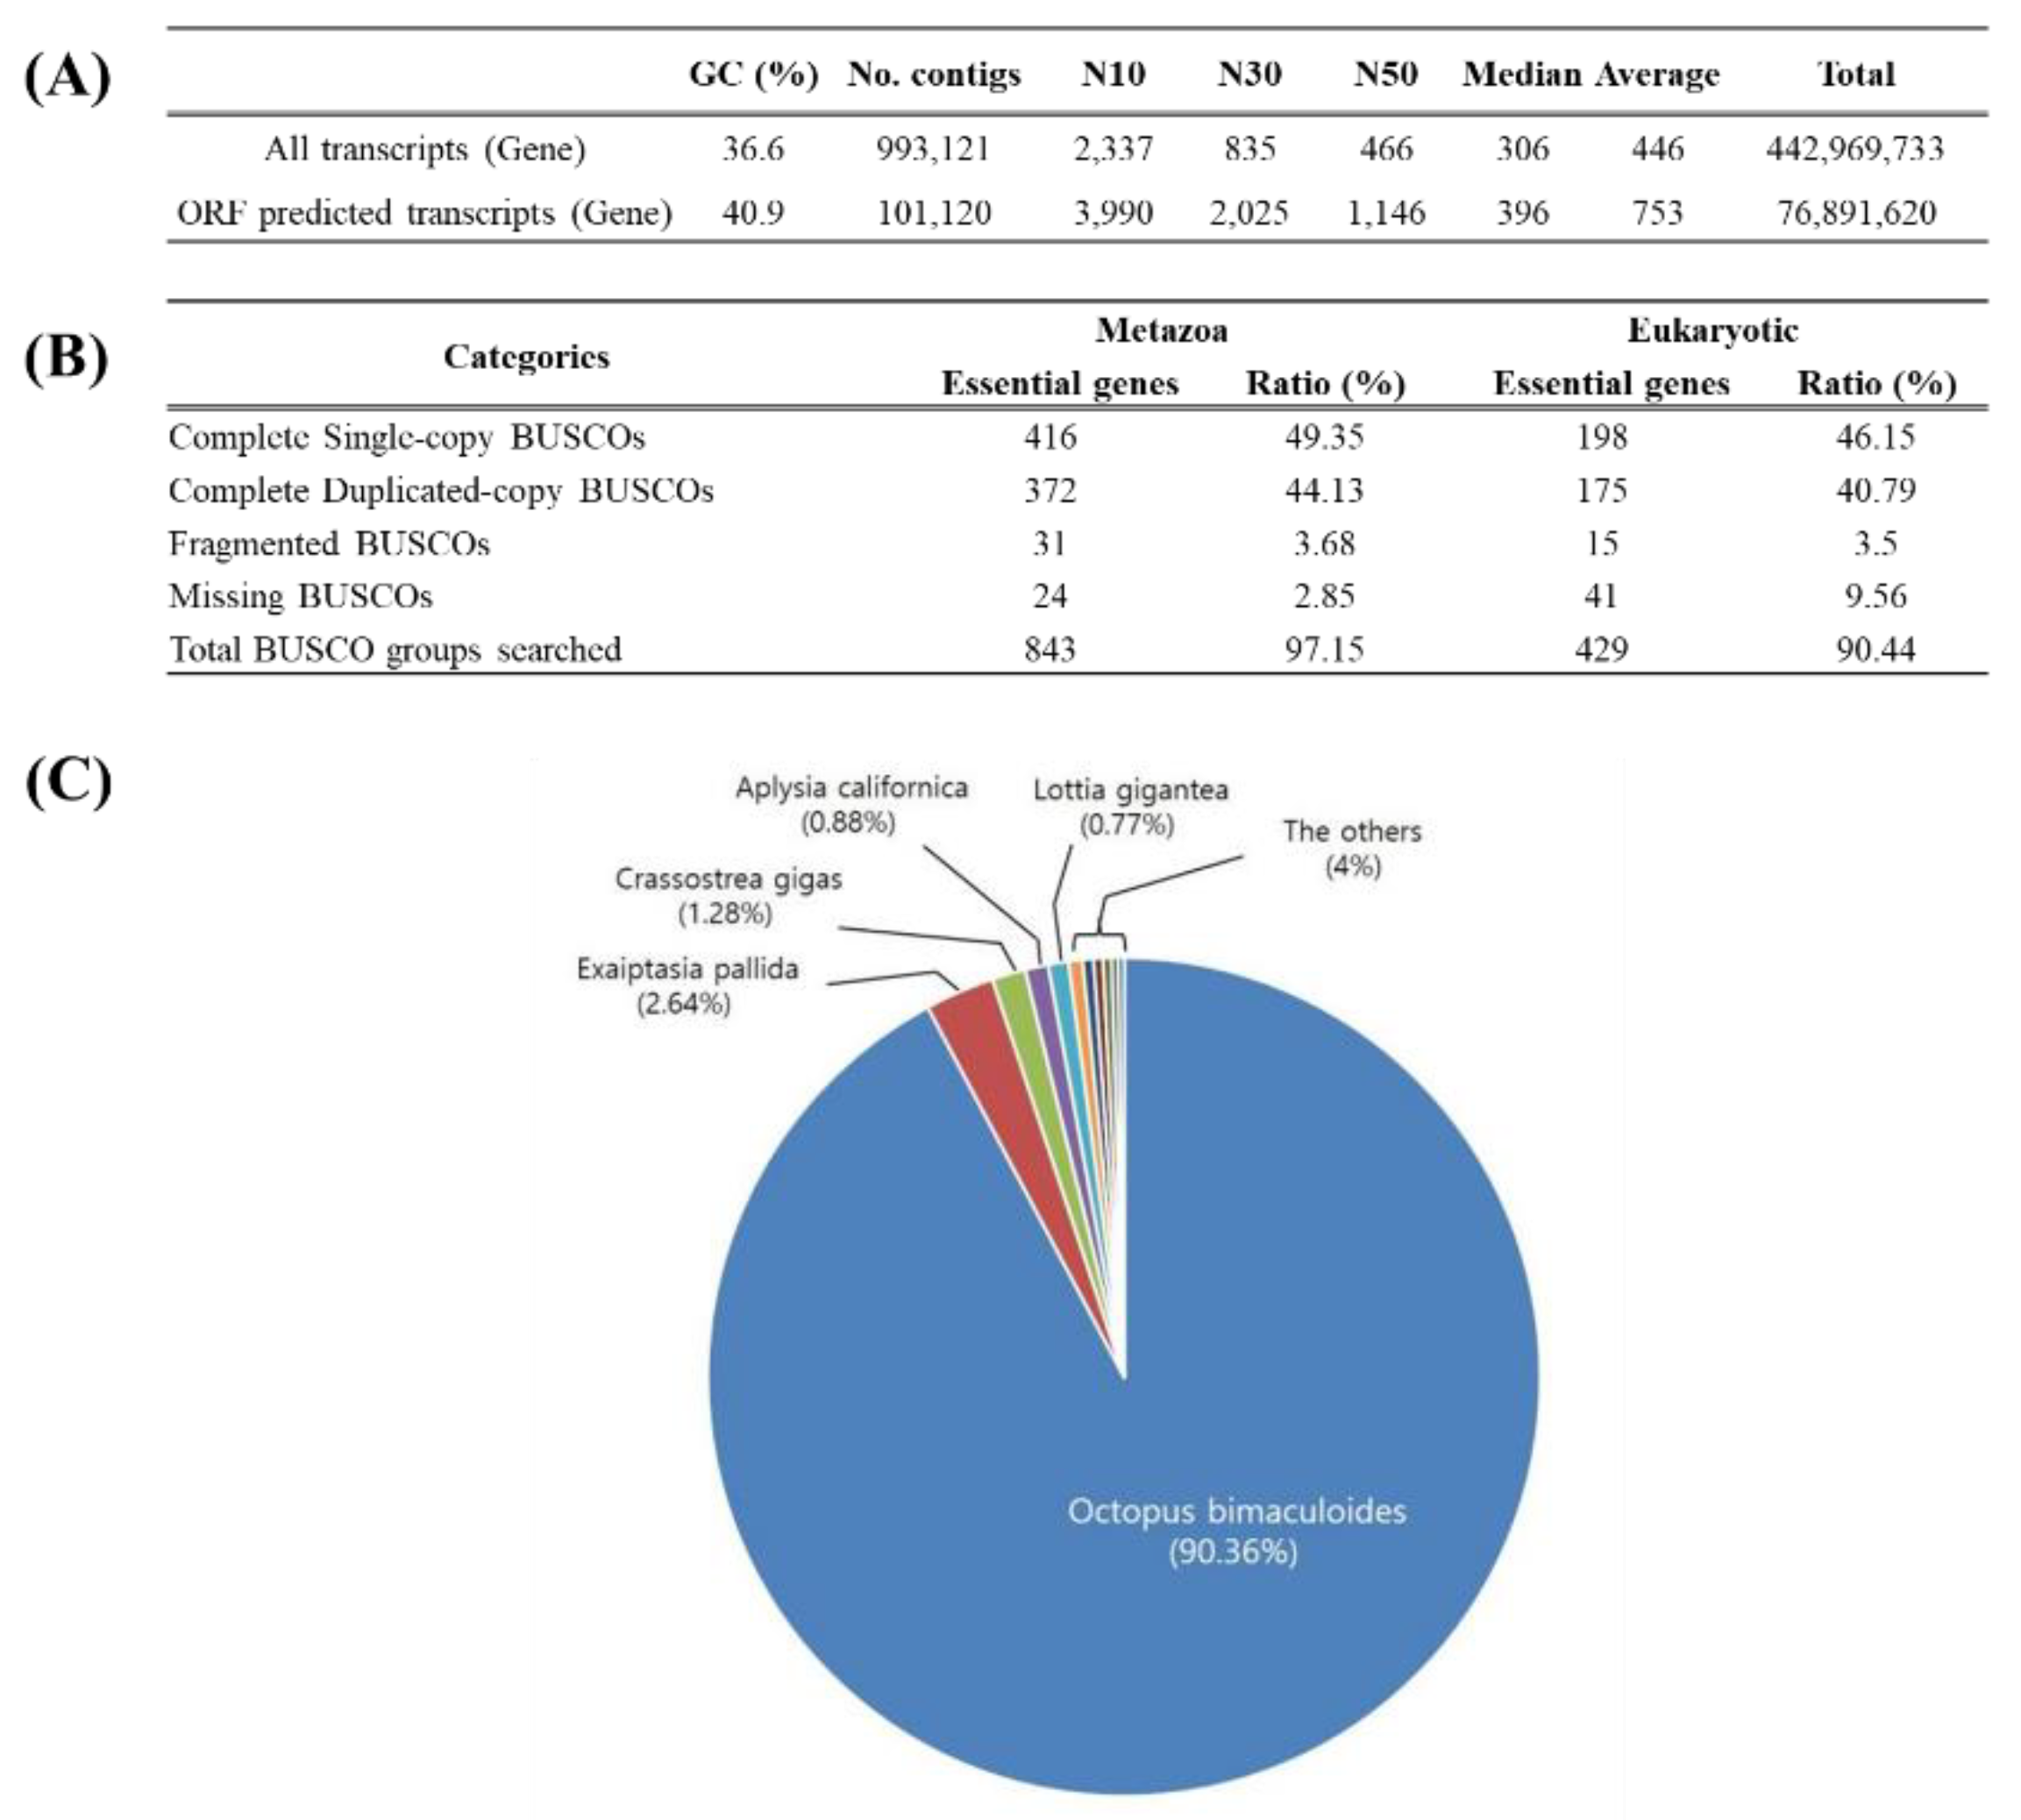
Table 2). A total of 993,121 transcripts were obtained from the octopus samples based on sex, tissue, and maturation stage. Of these, 102,120 transcripts with ORFs (Open Reading Frames) were identified, showing improvements in N50, length, and GC content (
Figure 1A). Using BUSCO, the proportion of essential genes was calculated for each taxonomic group, revealing high coverage rates of 97.15% for metazoans and 90.44% for eukaryotes (
Figure 1B). To analyze the functional distribution of sequences, BLASTX searches were performed against the NCBI NR database. The results showed the highest homology with cephalopods such as octopuses, followed by sea anemones, oysters, and sea snails (
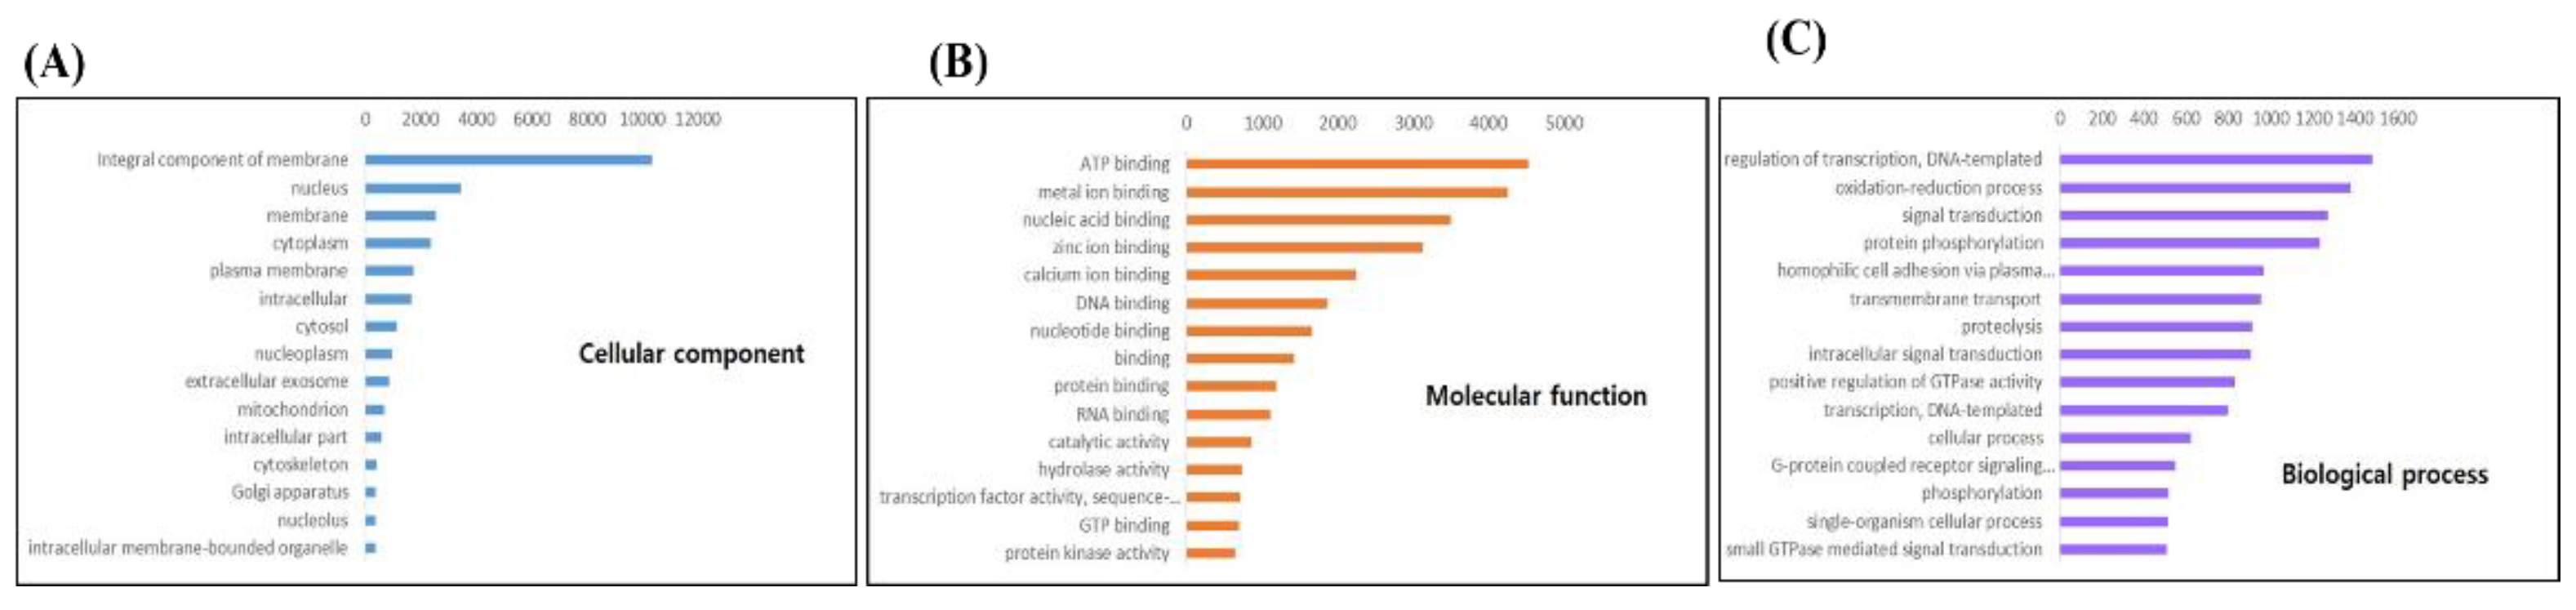
Figure 1C). Non-cephalopod species contributed less than 10%, highlighting the close evolutionary relationship within cephalopods. Additionally, Gene Ontology analysis was conducted to categorize functions into Cellular Component, Molecular Function, and Biological Process. The Integral component of the membrane was highly represented in Cellular Component, with nucleus and membrane-related functions prominently expressed. Molecular Function was dominated by binding-related categories such as ATP binding and metal ion binding, while Biological Process included regulation of transcription, DNA-templated processes, and oxidation-reduction processes. G-protein receptor activity, critical for physiological regulation, was also notably observed (
Figure 2 A-C).Sequencing produced 7.7–12.45 GB of data per group. From 993,121 transcripts, 102,120 ORF-predictable transcripts were identified, with improved N50, length, and GC content (
Figure 1A). BUSCO revealed essential gene content rates of 97.15% for metazoans and 90.44% for eukaryotes (
Figure 1B). Functional annotation identified high homology with cephalopods, including octopuses, sea anemones, and oysters (
Figure 1C). Gene Ontology analysis showed significant categories such as ATP binding and transcription regulation (
Figure 2).
3.2. Principal Component Analysis (PCA) of Expression Patterns
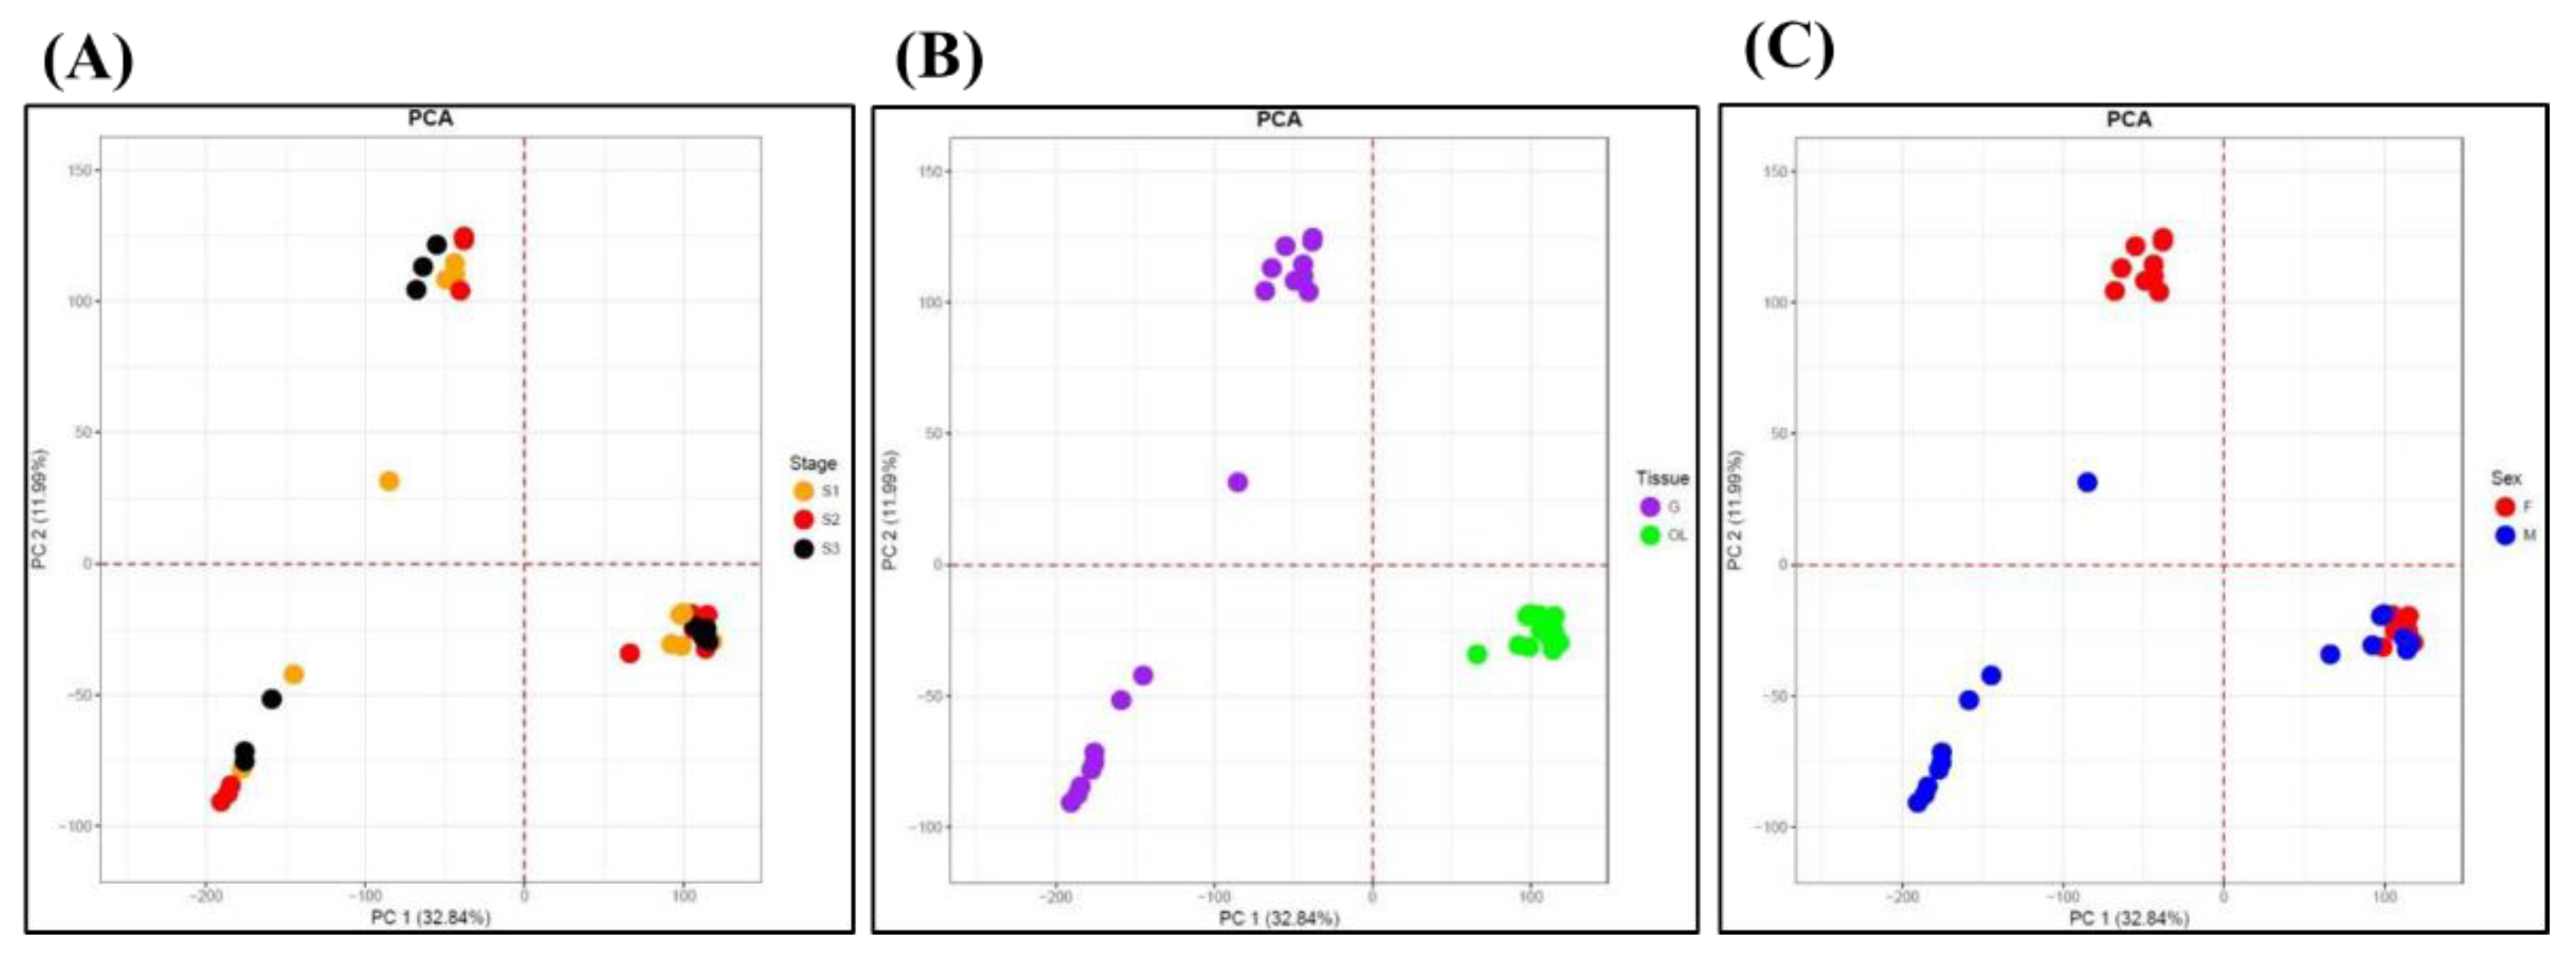
Annotation of the 102,120 transcripts was performed using the NCBI NR database and reproductive-related genes. PCA (Principal Component Analysis) was conducted on normalized expression data to identify any potential experimental biases, including variations in experiment timing, personnel, or platform. The analysis revealed that tissue type (gonad and optic lobe) exhibited the clearest separation (
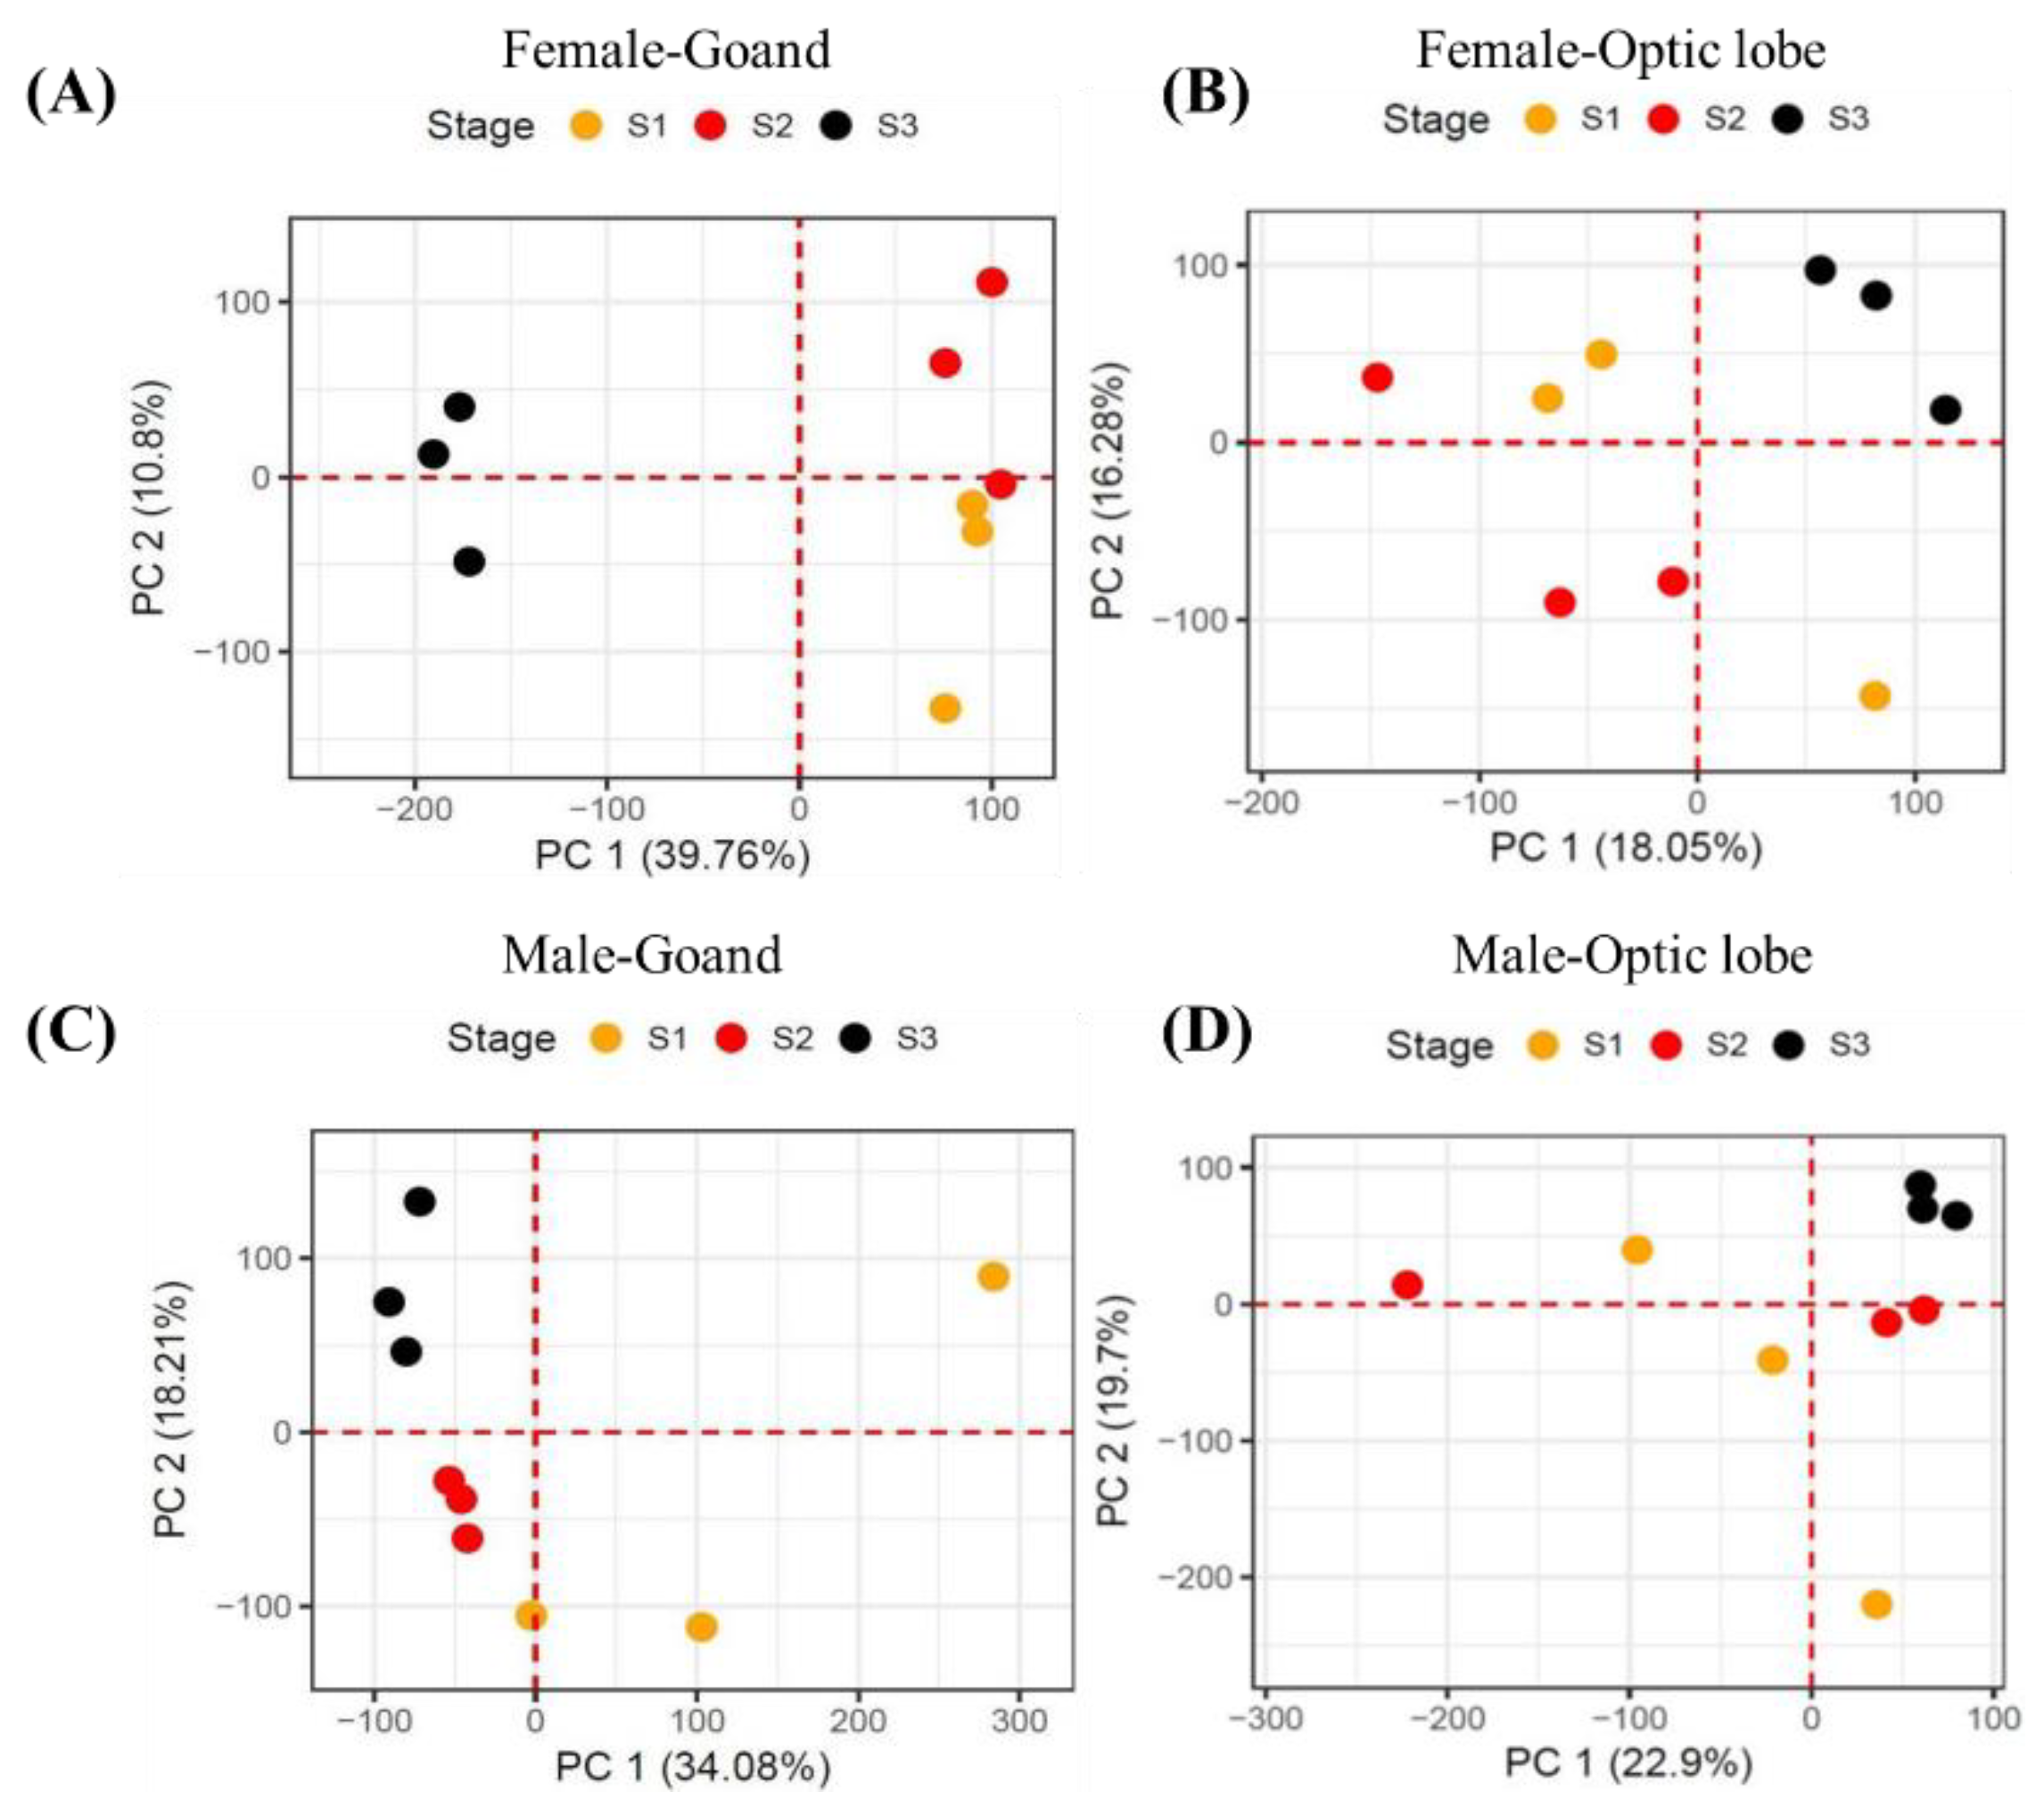
Figure 3A-C). Within the optic lobe, differences in expression patterns by sex and stage were minimal, whereas in the gonads, males displayed pronounced differences across stages compared to females (
Figure 4A-D). Overall, variations in expression were most distinct by tissue type, followed by sex and stage. Notably, in the female gonads, developmental and spawning stages showed similar patterns, while the degeneration stage exhibited significant differences. In males, the developmental stage was the most distinct, with sustained expression levels across stages, in contrast to the sharp changes observed in female degeneration stages. Further examination of sex-specific differences revealed significant variability in gonads but minimal differences in optic lobes.
3.3. Identification of Differentially Expressed Genes (DEGs)
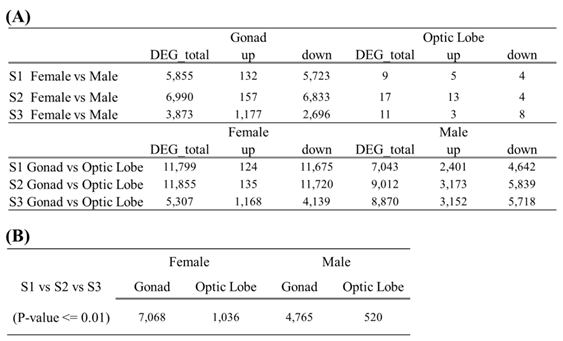
The number of differentially expressed transcripts per condition ranged from 3 to 11,855 (
Table 3A). Tissue-specific differences were the most significant, with gonads showing more DEGs compared to optic lobes. Heat-map analysis revealed that transcripts in the degeneration stage were predominantly upregulated, while male gonads showed gradual expression increases across the developmental, spawning, and degeneration stages (
Table 3B). In contrast, expression patterns in the optic lobes of males and females were relatively uniform compared to the gonads. Sex-specific DEG analysis showed similar transcript numbers in male and female optic lobes, whereas male gonads exhibited significantly fewer DEGs compared to female gonads(
Table 3A). This discrepancy was particularly notable during the developmental and spawning stages. Across all stages, male gonads demonstrated increased gene expression compared to females. Tissue-specific DEG analysis revealed that both sexes had more DEGs in gonads compared to optic lobes. Female gonads exhibited an approximately 100-fold higher number of DEGs compared to optic lobes during the developmental and spawning stages (
Table 3A).
3.4. Identification of Octopus-Specific Sexual Maturation Genes
Of the 102,120 transcripts expressed in O. minor, 9,068 were identified as species-specific, having no homologous sequences in other species. Among these, transcripts showing differential expression by sex, tissue, and maturation stage were identified as candidate octopus-specific sexual maturation genes. In female gonads, 7,068 genes were differentially expressed, with the highest expression observed during the degeneration (S3) stage (
Figure 5A). Male gonads exhibited 4,766 differentially expressed genes, with a similar peak during the degeneration stage (
Figure 5B). In contrast, the optic lobe exhibited fewer DEGs, with females expressing 1,036 genes and males expressing only 520 genes (
Figure 5C, D). Gonadal tissues showed significantly increased expression during the degeneration stage compared to the optic lobe, with females exhibiting much higher gene expression levels than males (
Figure 5).
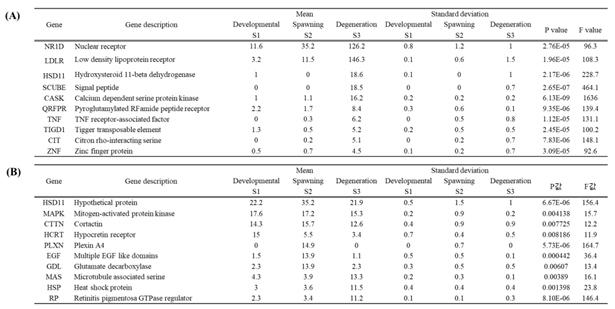
The top 10 differentially expressed genes by developmental stage in female
Octopus minor are shown in
Table 4. In the gonads of females, the NRID gene exhibited the highest expression, with expression levels changing from 11.6 in the developmental stage (S1) to 35.2 in the spawning stage (S2), and further increasing to 126.2 in the degeneration stage (S3) (
Table 4A). In the optic lobes, the HSD11 gene showed the highest expression, followed by MAPK, CTTN, and HCRT in descending order (
Table 4B).
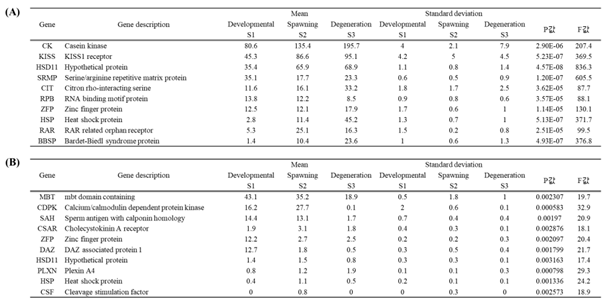
Similarly, the top 10 differentially expressed genes by developmental stage in male
Octopus minor were identified. In male gonads, the CK gene demonstrated the highest expression changes (
Table 5A), while in the optic lobes, the MBT and CDPK genes exhibited the highest expression levels (
Table 5B).
4. Discussion
Octopus minor is an economically valuable species in Korea; however, transcriptomic studies on gene expression related to sexual maturation are still limited. Identifying and categorizing maturation stages are essential for artificial breeding and fisheries management, and predicting sexual maturation stages through transcriptome analysis is expected to provide significant support. This study divided developmental stages into three phases based on sex and identified genes differentially expressed in gonads and optic lobes. Like most cephalopods, O. minor is a short-lived organism with rapid growth [
21,
22]. Cephalopods primarily consist of muscle tissues composed of proteins that act as major energy reserves, while lipids serve as critical energy sources in ovaries and play an important role in their life cycle [
23,
24]. Moreover, it has been demonstrated in various studies that protein and lipid contents in the gonads and optic lobes of cephalopods significantly decrease during the spawning period [
25,
26,
27]. Despite these findings, research on the metabolic mechanisms and transcriptome of O. minor remains insufficient.
This study revealed significant differential expression of genes related to oxidative phosphorylation, carbon metabolism, and glycolytic pathways during sexual maturation (
Table 5 and Table 6). These findings can be explained by reduced energy metabolism and regulated energy supply during the maturation process. Specifically, differential expression of genes associated with oxidative phosphorylation pathways, such as LDLR, HSD11, CASK, and CK genes, influences sperm quantity and quality by functioning in the mitochondria of reproductive cells [
28]. In addition, heat shock protein (HSP) genes identified in this study showed differential expression in male gonads and optic lobes. Previous research on HSP90 in mice demonstrated its role as a molecular chaperone involved in numerous cellular metabolic processes, where HSP90 depletion significantly reduces HIF-1α levels, disrupting gamete formation and ultimately causing infertility [
29]. Conversely, HSPs may also reduce cell apoptosis by regulating glycolytic pathways [
29]. These findings suggest that differential expression of HSP genes plays a critical role in maintaining reproductive cell homeostasis in male octopuses during the spawning stage.
Our Gene Ontology analysis also highlighted the importance of various differentially expressed genes in cell cycle regulation and meiosis in the gonads and optic lobes of O. minor. Notably, genes related to the integral component of the membrane showed remarkably high expression, while genes involved in ATP, metal ion, and nucleic acid binding were prominently expressed in molecular function categories (
Figure 2). These results indicate the potential of these genes as biomarkers for monitoring biological pathways in O. minor across sexes and growth stages. In summary, this study classified the growth stages of O. minor into three phases based on sex and identified candidate DEGs involved in these processes. Large-scale differential gene expression was observed during the sexual maturation stages, clearly distinguishing signaling pathways regulated by various genes in a sex-specific manner (ovaries vs. testes). These findings suggest that specific genes related to various metabolic processes may provide insights into the molecular mechanisms underlying the development, hatching, and survival of O. minor.
5. Conclusions
Using RNA-seq, this study identified a large number of transcriptome genes in O. minor and explored genes related to sexual maturation, selecting differentially expressed genes that showed significant variation. Sexual maturation stages were classified into three phases based on gonadal and optic lobe tissues associated with sex and maturation, and DEGs were identified accordingly. As a result, 3 to 11,855 DEGs were identified under various conditions. A notably higher number of genes were expressed in females compared to males, and gonads exhibited significantly more DEGs than optic lobes. The identified genes are essential for metabolic processes related to cell formation, development, and survival in O. minor. This study is expected to provide valuable insights for transcriptome research on various aquaculture species.
Author Contributions
Conceptualization, D.-Y.K.; Methodology, J.H. and D.-Y.K.; Field investigation, J.H.; Software, J.H; Writing-original draft preparation, J.H.; Writing-review and editing. D.-Y.K.; Project administration. D.K All authors have read and agreed to the published version of the manuscript.
Funding
This study was supported by the project ‘Sanitary evaluation on the shellfish growing area for export and fisheries products’(R2024057) of the National Institute of Fisheries Science (NIFS), Incheon, Republic of Korea.
Institution Review Board Statement
Not applicable.
Informed Consent statement
Not applicable.
Data Availability Statement
The original contributions presented in the study are included in the article/supplementary material, further inquiries can be directed to the corresponding author
Conflicts of Interest
The authors declare no conflicts of interest.
References
- Oh, T.-Y.; Kim, J.-I.; Seo, Y.-I.; Lee, S.-K.; Choi, M.-S. Distribution characteristic of Octopus minor in the Tando Bay on the southwest coast of Korea. Journal of the Korean Society of Fisheries and Ocean Technology 2012, 48, 370–378. [Google Scholar] [CrossRef]
- Vaz-Pires, P.; Seixas, P.; Barbosa, A. Aquaculture potential of the common octopus (Octopus vulgaris Cuvier, 1797): a review. Aquaculture 2004, 238, 221–238. [Google Scholar] [CrossRef]
- Bo, Q.-K.; Zheng, X.-D.; Chen, Z.-W. Feeding intensity and molecular prey identification of the common long-armed octopus, Octopus minor (Mollusca: Octopodidae) in the wild. Plos one 2020, 15, e0220482. [Google Scholar] [CrossRef] [PubMed]
- Lee, W.; Han, E.J.; Park, E.; Shin, E.-J.; Han, H.-J.; Jung, K.; Heo, S.-J.; Kim, E.-A.; Kim, K.-N.; Kwak, I.-S. Hepatoprotective Activity of a Taurine-Rich Water Soluble Extract from Octopus vulgaris Meat. In Proceedings of the Taurine 11; 2019; pp. 691–703. [Google Scholar]
- Moon, S. A study on the morphology and biology of Octopus minor in Kyoungi bay, Yellow sea. Master's degree dissertation, Inha University, 1989. [Google Scholar]
- Jong, C.D.; An, K.D. Characteristics by the behaviour and habits of the common octopus (Octopus minor). Korean Journal of Fisheries and Aquatic Sciences 2003, 36, 735–742. [Google Scholar]
- Chung, E.; Kim, B.; Kim, S.; Ko, T. Reproductive ecology of Octopus ocellatus on the west coast of Korea. Yellow Sea 1999, 5, 33–45. [Google Scholar]
- Zheng, X.-D.; Qian, Y.-S.; Liu, C.; Li, Q. Octopus minor . Cephalopod culture 2014, 415–426. [Google Scholar]
- Shendure, J.; Ji, H. Next-generation DNA sequencing. Nature biotechnology 2008, 26, 1135–1145. [Google Scholar] [CrossRef]
- Roh, S.W.; Abell, G.C.; Kim, K.-H.; Nam, Y.-D.; Bae, J.-W. Comparing microarrays and next-generation sequencing technologies for microbial ecology research. Trends in biotechnology 2010, 28, 291–299. [Google Scholar] [CrossRef] [PubMed]
- Subramanian, A.; Tamayo, P.; Mootha, V.K.; Mukherjee, S.; Ebert, B.L.; Gillette, M.A.; Paulovich, A.; Pomeroy, S.L.; Golub, T.R.; Lander, E.S. Gene set enrichment analysis: a knowledge-based approach for interpreting genome-wide expression profiles. Proceedings of the National Academy of Sciences 2005, 102, 15545–15550. [Google Scholar] [CrossRef]
- Haas, B.J.; Papanicolaou, A.; Yassour, M.; Grabherr, M.; Blood, P.D.; Bowden, J.; Couger, M.B.; Eccles, D.; Li, B.; Lieber, M. De novo transcript sequence reconstruction from RNA-seq using the Trinity platform for reference generation and analysis. Nature protocols 2013, 8, 1494–1512. [Google Scholar] [CrossRef] [PubMed]
- Grabherr, M.G.; Haas, B.J.; Yassour, M.; Levin, J.Z.; Thompson, D.A.; Amit, I.; Adiconis, X.; Fan, L.; Raychowdhury, R.; Zeng, Q. Trinity: reconstructing a full-length transcriptome without a genome from RNA-Seq data. Nature biotechnology 2011, 29, 644. [Google Scholar] [CrossRef] [PubMed]
- Compeau, P.E.; Pevzner, P.A.; Tesler, G. How to apply de Bruijn graphs to genome assembly. Nature biotechnology 2011, 29, 987–991. [Google Scholar] [CrossRef]
- Simão, F.A.; Waterhouse, R.M.; Ioannidis, P.; Kriventseva, E.V.; Zdobnov, E.M. BUSCO: assessing genome assembly and annotation completeness with single-copy orthologs. Bioinformatics 2015, 31, 3210–3212. [Google Scholar] [CrossRef]
- Ashburner, M.; Ball, C.A.; Blake, J.A.; Botstein, D.; Butler, H.; Cherry, J.M.; Davis, A.P.; Dolinski, K.; Dwight, S.S.; Eppig, J.T. Gene ontology: tool for the unification of biology. Nature genetics 2000, 25, 25–29. [Google Scholar] [CrossRef]
- Conesa, A.; Götz, S. Blast2GO: a comprehensive suite for functional analysis in plant genomics. International journal of plant genomics 2008, 2008, 619832. [Google Scholar] [CrossRef] [PubMed]
- Kanehisa, M.; Sato, Y.; Kawashima, M.; Furumichi, M.; Tanabe, M. KEGG as a reference resource for gene and protein annotation. Nucleic acids research 2016, 44, D457–D462. [Google Scholar] [CrossRef] [PubMed]
- Li, P.; Piao, Y.; Shon, H.S.; Ryu, K.H. Comparing the normalization methods for the differential analysis of Illumina high-throughput RNA-Seq data. BMC bioinformatics 2015, 16, 1–9. [Google Scholar] [CrossRef]
- Robinson, M.D.; McCarthy, D.J.; Smyth, G.K. edgeR: a Bioconductor package for differential expression analysis of digital gene expression data. bioinformatics 2010, 26, 139–140. [Google Scholar] [CrossRef]
- Lee, P. Nutrition of cephalopods: fueling the system. Marine and Freshwater Behaviour and Physiology 1995, 25, 35–51. [Google Scholar] [CrossRef]
- Moltschaniwskyj, N.A. Understanding the process of growth in cephalopods. Marine and freshwater research 2004, 55, 379–386. [Google Scholar] [CrossRef]
- Rosa, R.; Marques, A.M.; Nunes, M.L.; Bandarra, N.; Reis, C.S. Spatial-temporal changes in dimethyl acetal (octadecanal) levels of Octopus vulgaris (Mollusca, Cephalopoda): relation to feeding ecology. Scientia Marina 2004, 68, 227–236. [Google Scholar] [CrossRef]
- Rosa, R.; Pereira, J.; Nunes, M.L. Biochemical composition of cephalopods with different life strategies, with special reference to a giant squid, Architeuthis sp. Marine Biology 2005, 146, 739–751. [Google Scholar] [CrossRef]
- Kilada, R.; Riad, R. Seasonal variations in biochemical composition of Loligo forbesi (Cephalopoda: Loliginidae) in the Mediterranean Sea and the Gulf of Suez, Egypt. Journal of Shellfish Research 2008, 27, 881–887. [Google Scholar] [CrossRef]
- Morillo-Velarde, P.S.; Valverde, J.C.; Serra Llinares, R.M.; García, B.G. Changes in lipid composition of different tissues of common octopus (O ctopus vulgaris) during short-term starvation. Aquaculture Research 2013, 44, 1177–1189. [Google Scholar] [CrossRef]
- Nilsen, T.W. The spliceosome: the most complex macromolecular machine in the cell? Bioessays 2003, 25, 1147–1149. [Google Scholar] [CrossRef]
- Wang, N.; Gu, H.; Gao, Y.; Li, X.; Yu, G.; Lv, F.; Shi, C.; Wang, S.; Song, M.; Zhang, S. Study on influencing factors of semen quality in fertile men. Frontiers in Physiology 2022, 13, 813591. [Google Scholar] [CrossRef]
- Tang, X.; Chang, C.; Hao, M.; Chen, M.; Woodley, D.T.; Schönthal, A.H.; Li, W. Heat shock protein-90alpha (Hsp90α) stabilizes hypoxia-inducible factor-1α (HIF-1α) in support of spermatogenesis and tumorigenesis. Cancer gene therapy 2021, 28, 1058–1070. [Google Scholar] [CrossRef]
Figure 1.
Statistical analysis of the assembled octopus reference transcriptome and ORF sequences. All transcripts and ORF-predicted transcripts (A), BUSCO statistics for essential gene identification (B), Homology search results using BLAST (C).
Figure 1.
Statistical analysis of the assembled octopus reference transcriptome and ORF sequences. All transcripts and ORF-predicted transcripts (A), BUSCO statistics for essential gene identification (B), Homology search results using BLAST (C).
Figure 2.
Gene Ontology analysis for the top 15 categories in O. minor ORF transcripts. Cellular Component (A), Molecular Function (B), Biological Process (C).
Figure 2.
Gene Ontology analysis for the top 15 categories in O. minor ORF transcripts. Cellular Component (A), Molecular Function (B), Biological Process (C).
Figure 3.
PCA analysis of 102,120 octopus transcripts based on developmental stage, tissue, and sex. Stage: Developmental S1 (Orange dot), Spawning S2 (Red dot), Degeneration S3 (Black dot) (A), Tissue: Gonad G (Purple dot), Optic lobe OL (Green dot) (B), Sex: Female F (Red dot), Male M (Blue dot) (C).
Figure 4.
PCA results for expression similarity by sexual maturation stage across tissues (gonads and optic lobes) in males and females. PCA analysis by developmental stage for female gonads (A), PCA analysis by developmental stage for female optic lobes (B), PCA analysis by developmental stage for male gonads (C), PCA analysis by developmental stage for male optic lobes (D).
Figure 5.
Heat-map analysis of differentially expressed genes by developmental stage: 7,068 genes in female gonads (A), 4,766 genes in male gonads (B), 1,036 genes in female optic lobes (C), 520 genes in male optic lobes (D).
Figure 5.
Heat-map analysis of differentially expressed genes by developmental stage: 7,068 genes in female gonads (A), 4,766 genes in male gonads (B), 1,036 genes in female optic lobes (C), 520 genes in male optic lobes (D).
Table 1.
QC results for O. minor samples based on sex, tissue, and developmental stage using Bioanalyzer.
Table 1.
QC results for O. minor samples based on sex, tissue, and developmental stage using Bioanalyzer.
Table 2.
Transcriptome data production results for Octopus minor (Gbp).
Table 2.
Transcriptome data production results for Octopus minor (Gbp).
Table 3.
Number of differentially expressed genes by sex, tissue, and developmental stage. Upregulated and downregulated genes across three developmental stages (A), Number of differentially expressed genes by sex and tissue at each developmental stage (B).
Table 3.
Number of differentially expressed genes by sex, tissue, and developmental stage. Upregulated and downregulated genes across three developmental stages (A), Number of differentially expressed genes by sex and tissue at each developmental stage (B).
Table 4.
Top 10 differentially expressed genes by developmental stage in female O. minor. Female gonads (A), Female optic lobes (B).
Table 4.
Top 10 differentially expressed genes by developmental stage in female O. minor. Female gonads (A), Female optic lobes (B).
Table 5.
Top 10 differentially expressed genes by developmental stage in female O. minor. male gonads (A), male optic lobes (B).
Table 5.
Top 10 differentially expressed genes by developmental stage in female O. minor. male gonads (A), male optic lobes (B).
|
Disclaimer/Publisher’s Note: The statements, opinions and data contained in all publications are solely those of the individual author(s) and contributor(s) and not of MDPI and/or the editor(s). MDPI and/or the editor(s) disclaim responsibility for any injury to people or property resulting from any ideas, methods, instructions or products referred to in the content. |
© 2025 by the authors. Licensee MDPI, Basel, Switzerland. This article is an open access article distributed under the terms and conditions of the Creative Commons Attribution (CC BY) license (https://creativecommons.org/licenses/by/4.0/).