
Submitted:
23 January 2025
Posted:
24 January 2025
You are already at the latest version
Abstract
The six6 and vgll3 genes play evolutionarily conserved roles in developmental processes and life history traits across species, including teleosts. Notable differences in genotype and allele frequencies of these genes have been observed between farmed and wild populations of European seabass and gilthead seabream, suggesting potential roles in traits associated with domestication. Here, we hypothesized that genetic variations in the six6 and vgll3 are associated with distinct expression profiles underlining domestication-related traits in the two species. Using quantitative PCR (qPCR), we examined the expression profiles of these genes in early developmental stages across genotypes linked to domestication. Our results confirmed that vgll3 and partially six6 genotypes significantly influenced their expression in gilthead seabream, with statistically significant differences between genotypes. In European seabass, six6 expression showed no significant genotype variation but higher variability in heterozygous larvae, decreasing in juveniles, while no genetic variation was observed in vgll3, precluding genotype-specific expression analysis. Altogether, our findings provide the first evidence confirming that prior DNA-based associations of these genes with domestication traits are reflected at the mRNA level, particularly in vgll3 in gilthead seabream. This highlights the potential functional relevance of these genetic variations in shaping expression profiles linked to domestication in the species.
Keywords:
developmental process
; gene expression profiling
; genetic variation
; marine teleost
; quantitative PCR (qPCR)
1. Introduction
The SIX homeobox 6 (six6) and vestigial-like family member 3 (vgll3) genes function in an evolutionarily conserved manner in developmental processes and life-history traits across a wide range of taxa, including mammals and teleosts [1,2,3,4,5,6,7,8]. The six6 gene encodes a transcription factor involved in sexual maturation [3,7,8,9]. A locus near the six6 gene has been linked to age at maturity and spawning ecotype in different salmonid species [7,8]. Additionally, six6 has been associated with maturation in mammals, specifically age-at-menarche in humans [2] and puberty timing in beef cattle [3]. The vgll3 gene encodes a transcriptional cofactor involved in adipogenesis and the Hippo signaling pathway [9,10,11] that has been linked to pubertal timing and growth in humans [1]. In Atlantic salmon (Salmo salar Linnaeus), a single nucleotide polymorphism (SNP) in the vgll3 gene correlates with maturation timing [5,6], with different genotypes of this SNP influencing the expression profiles of reproductive axis genes in juvenile males [12]. It was further demonstrated that vgll3 influences the body condition of the species [13,14]. Both six6 and vgll3 are expressed during early development in salmon and are associated with adipogenesis and gametogenesis [9]. This growing body of evidence highlights that six6 and vgll3 play key roles not only in reproductive traits but also in growth and growth-related processes. In aquaculture, growth rate is a critical trait for productivity, and understanding how these genes regulate developmental processes may provide insights into improving growth performance in commercially farmed species [15,16,17]. By leveraging candidate genes identified in one species and assuming their evolutionarily conserved roles, we can investigate their potential for similar effects in other species [8]. It remains an open question whether six6 and vgll3 also influence developmental processes and life-history traits in other economically important teleost fish.
The gilthead seabream (Sparus aurata Linnaeus) and the European seabass (Dicentrarchus labrax Linnaeus) are among the most economically important fish species in the Mediterranean region. A recent study on genetic differentiation between farmed and wild populations of these species investigated how the domestication process impacts the genetic diversity of the six6 and vgll3 genes [18]. Significant differences in genotype and allele frequencies were observed in an exonic SNP on vgll3 and in two intronic SNPs on six6 between farmed and wild populations of both species [18]. Given this evidence and the high level of functional conservation of vgll3 and six6, further investigations, including gene expression profiling across various developmental stages in these species, could yield highly informative insights. Such studies would be particularly valuable for the aquaculture sector and future selective breeding programs targeting maturation and growth performance [8,18,19]. Research in this direction could also enhance our understanding of the genotype- phenotype link and shed light on the genomic architecture of domestication.
To investigate the functional roles of six6 and vgll3 in the developmental processes of European seabass and gilthead seabream, we performed a gene expression analysis using quantitative real-time PCR (qPCR) in early developmental stages. Gene expression studies are essential for understanding the functional impact of genetic variants and for bridging the gap between genotype and phenotype [20,21]. By examining six6 expression across genotypes and developmental stages (larvae and juveniles) in European seabass, and vgll3 and six6 expression patterns across genotypes in gilthead seabream juveniles, we aimed to explore the association of previously identified domestication-related genes with their gene expression patterns [18]. This study sought to provide deeper insights into the roles of these genes in the developmental processes of European seabass and gilthead seabream, as well as their potential evolutionarily conserved functions.
2. Materials and Methods
2.1. Sampling
Fifty larvae at 34 days post-hatch (dph) and 50 juveniles at 71 dph of European seabass, along with 50 juveniles at 69 dph of gilthead seabream, were collected from a fish farm. Both the larval and juvenile stages represent critical time points in the developmental process of fish. All individuals were reared under the same controlled conditions, which included a temperature of 19°C, salinity of 40‰, a pH range of 7.6 to 7.8, and O₂ saturation levels of 6-7 ppm. Samples were preserved in RNAlater stabilization solution (Invitrogen) before being frozen at -20°C.
2.2. Genotyping
DNA extractions from each individual were carried out using the TRIzol reagent (Thermo Fisher Scientific) [22]. The primer sequences, amplicons sizes, and annealing temperatures for each studied genomic region are listed in Table 1 [18]. For PCR, we used a total reaction volume of 25 μL, which included 100 ng of genomic DNA as the template, 0.05 units of Qiagen Taq polymerase, 2 mM dNTPs, 0.25 μL of each primer (100 μΜ), and 2.5 μL of 10x Reaction Buffer (Qiagen, Hilden, Germany). The PCR products were analysed by electrophoresis in 1.5% (w/v) agarose gels. Enzymatic cleanup and Sanger sequencing were outsourced to Genewiz (Leipzig, Germany). SNP genotyping was performed by aligning the resulting sequences with the corresponding reference sequences from GenBank (assemblies S. aurata: GCA_900880675.1; D. labrax: GCA_000689215.1) using the Geneious v.10.2.6 program [23].
2.3. RNA Extraction and cDNA Synthesis
Total RNA was extracted from whole European seabass and gilthead seabream individuals using the TRIzol reagent (Thermo Fisher Scientific, Waltham, USA) [22]. In total, 27 European seabass individuals (nine biological replicates per SNP genotype) and 24 gilthead seabream individuals (eight biological replicates per SNP genotype) were selected for analysis. The quality and quantity of RNA were assessed using a Nanodrop 2000 spectrophotometer (Thermo Fisher Scientific, Waltham, USA) and by electrophoresis on 1.5% (w/v) agarose gels. The cDNA synthesis was performed using the PrimeScript RT reagent Kit with gDNA Eraser (TaKaRa, Shiga, Japan) following the manufacturer’s instructions.
2.4. Quantitative Real-Time PCR
We selected ribosomal protein L13 (rpl13), FAU ubiquitin-like and ribosomal protein S30 fusion (fau), and elongation factor 1-alpha 1 (ef1α) as candidate reference genes for both species. Primers and probes for the reference and target genes were designed using the qPCR Primer & Probe Design Tool (Eurofins, Luxembourg City, Luxembourg) (Table 2). Gene locations and intron/exon information were retrieved from annotations deposited in Ensembl for both species (assemblies S aurata: GCA_900880675.1; D. labrax: GCA_000689215.1). Gene expression profiles were quantified using quantitative real-time PCR with the KAPA® PROBE FAST Universal reagent (Kapabiosystems, Cape Town, South Africa) in three technical replicates per sample, performed on the ABI StepOne™ platform (Applied Biosystems, CA, USA).
2.5. Analysis of Gene Expression Data
The Ct values were converted to quantities using the comparative Ct method. The most stable reference genes were identified using the NormFinder and geNorm algorithms, which ranked the genes based on their expression stability [24,25]. The normalization factor was calculated as the geometric mean of the two most stable reference genes for each species (rpl13 and fau in European seabass; rpl13 and ef1α in gilthead seabream). The normalized expression levels of the target genes were determined by dividing the raw target gene quantities for each sample by the corresponding normalization factor. The Kruskal-Wallis test was used to compare the normalized expression levels of the target genes among the different SNP genotypes [26]. Additionally, the distribution of the expression data was assessed using the Shapiro-Wilk normality test, followed by the Bartlett’s test for homogeneity of variances [27,28].
3. Results
3.1. six6 and vgll3 Genotypes
We analysed independent datasets from two developmental stages (larvae at 34 dph and juveniles at 71 dph) in European seabass and one developmental stage (juveniles at 69 dph) in gilthead seabream. For both species, we genotyped two intronic SNPs of six6, previously associated with the domestication process, and selected the SNPs with sufficient sample sizes for each genotype (S. aurata 16:14406442 and D. labrax 12:11591053) [18]. No genetic variation in vgll3 was observed in the studied European seabass individuals; thus, the expression profile per genotype was not examined. In contrast, all genotypes for the vgll3 SNP (S. aurata 9:24911884) were identified in the studied juveniles of gilthead seabream [18]. The sample sizes for each studied genotyped SNP are shown in Table 3.
3.2. Expression Patterns of vgll3 and six6 per Genotype in Gilthead Seabream
In gilthead seabream, six6 and vgll3 expression levels were analysed in juveniles (69 dph). For vgll3, the expression levels were highest in the AA genotype, followed by AG, with the GG genotype showing the lowest expression levels (Figure 1a). The differential expression across genotypes was statistically significant (p = 0.040), and pairwise comparisons revealed that the AA genotype was significantly different from the other two genotypes (AA-AG: p = 0.030; AA-GG: p = 0.027). Variance differences were also significant across genotypes (p = 0.002), as well as between AA-AG (p = 0.016) and AA-GG (p = 0.003). A similar trend was observed for six6, where the CC genotype exhibited the highest expression levels, followed by CT, with the TT genotype displaying the lowest (Figure 1b). A significant differential expression was detected between the CT and TT genotypes (p = 0.027), but no significant differences in variability were observed.
3.3. Expression Patterns of six6 per Genotype and Developmental Stage in European Seabass
All observed trends in expression levels among genotypes at both developmental stages were not statistically significant. However, in larvae at 34 dph, the heterozygous genotype (AT) exhibited high variability compared with homozygous genotypes (AT-AA: p = 0.040; AT-TT: p = 0.046; Figure 2a). At the 71 dph juveniles, this pattern had disappeared with all genotypes exhibiting a similar range of expression levels (Figure 2b). Overall, the variation in six6 expression for the heterozygous genotype showed a decreasing trend between larvae and juveniles (p = 0.030).
4. Discussion
In this study, we investigated the gene expression profiles of vgll3 and six6 in the early developmental stages of two commercially important fish species, the gilthead seabream and the European seabass. We aimed to provide the first evidence that prior SNP associations of these genes with domestication [18] are also reflected at the mRNA level. Gene expression profiling was performed using quantitative real-time PCR (qPCR) with probes, due to its high accuracy, low background signal [29], and efficiency [30]. We identified differences in both the means and variances of mRNA expression across genotypes of vgll3 and six6 in gilthead seabream at the developmental stage examined (69 dph juveniles). Additionally, significant variability in six6 expression levels was observed in the heterozygous genotype during the larval stage (34 dph), which was reduced in juveniles (71 dph) in European seabass. These observations support a functional role for vgll3 and six6 in domestication and developmental processes in the studied species. Given the suggested roles of these genes in growth and growth-related processes [13,31,32,33], our findings further underscore their potential relevance to the aquaculture sector. These insights open up new opportunities to enhance desirable traits in cultured populations of the species, ultimately benefiting the aquaculture industry [34,35].
Our findings indicate that gene expression profiles are influenced by both genetic variation (Figure 1) [36,37,38] and developmental stage (Figure 2) [9,39,40]. Specifically, we report a statistically significant difference in expression levels between the two homozygous genotypes (AA and GG) of vgll3 in gilthead seabream (Figure 1a). The AA genotype exhibited significantly higher expression levels and variance compared to the GG genotype, which was associated with domestication in previous DNA-based analysis [18]. A similar pattern was observed in juveniles of Atlantic salmon, Verta et al. (2020) previously found that the late-maturing vgll3 genotype exhibited 14% higher expression and variation within the testis compared to the early-maturing genotype [36]. Beyond their association with maturation, the vgll3 genotypes influenced body condition, with the early-maturing genotype exhibiting higher body condition [13] and seasonally increasing lipid storage in immature Atlantic salmon [37]. The consistent in vgll3 expression patterns among genotypes between juveniles gilthead seabream and Atlantic salmon prompt a key question about the potential role of vgll3 genotypes in physiological processes in gilthead seabream.
The six6 differential expression was statistically significant between the CT and TT genotypes in gilthead seabream, with the TT genotype exhibiting the lowest expression levels compared to the other two genotypes (Figure 1b). Notably, the TT genotype was associated with domestication in a previous DNA-based analysis using farmed and wild populations [18]. Additionally, in Atlantic salmon, six6 expression patterns have been associated with the early developmental process, particularly in sensory, musculoskeletal, and cardiovascular systems [9,33]. However, there is a lack of literature on the effects of six6 genotypes on expression levels and whole transcriptome profiles. The observed differential expression among genotypes in this study suggests a potential role of six6 expression in the juvenile stage in gilthead seabream, warranting further investigation to clarify its specific functions and regulatory mechanisms.
Observations of six6 in European seabass also indicate its potential significance in this species, with the variation in expression levels for heterozygous genotype in larvae being higher than those observed in homozygous genotypes. The expression variance may suggest an association with the molecular basis of complex traits, diseases [41,42], and environmental adaptation mechanisms [43]. Early development is a highly dynamic period in an organism’s life, during which constant changes in gene expression are crucial for regulating processes that govern growth, cell differentiation, organogenesis, and the physiological adaptations of each stage [9,39,40]. A decreasing trend in six6 expression was also noted from the embryonic stages toward fry in Atlantic salmon, highlighting the importance of the gene’s role during the early stages for the hypothalamic-pituitary-gonadal (HPG) axis and eye development [9]. These findings collectively underscore the potential role of six6 in early developmental processes across multiple fish species, warranting further investigation to uncover its specific roles in them.
It remains unclear how the studied SNPs are associated with the observed patterns in DNA and expression levels. The vgll3 SNP in gilthead seabream is a synonymous mutation and the six6 SNPs are intronic in both species [18]. The literature provides evidence that synonymous and intronic mutations can alter the regulation of gene expression and potentially play a role in fish domestication and traits linked to aquaculture [44,45,46]. Synonymous mutations do not alter the protein sequence, but they may affect mRNA stability, translation efficiency, and protein folding [47,48]. Intronic variation can also affect gene expression levels and phenotype by modifying splice site activity, altering cis-regulatory elements like enhancers and silencers, and changing the formation of chromatin loops [49,50,51,52]. Furthermore, it is recognized that alternative splicing contributes to transcriptional diversity in genes associated with developmental processes [53], such as those under study. However, the presence of these SNPs does not necessarily mean they are the causative variants affecting gene expression, as they may be in linkage disequilibrium with the actual causative variant. Further studies are needed to determine if the SNPs have a functional effect or are merely markers for a linked variant.
Our study focused on the expression of targeted genes at specific developmental stages (larvae and juveniles), providing important insights into the roles of vgll3 and six6 in gilthead seabream and European seabass. Notably, research on Atlantic salmon has identified these stages as relevant for studying the expression of these genes [9]. Future research should include more developmental stages and omic-wide approaches, such as genomic and transcriptomics, to confirm our present observations.
5. Conclusions
In conclusion, this study provides new insights into the expression profiles of six6 and vgll3 in developmental stages in gilthead seabream and European seabass, linking these gene expression patterns to domestication-associated SNPs previously identified in DNA-based study. These findings, combined with the evolutionarily conserved functions of these genes and their involvement in developmental processes and life history traits across vertebrates, including teleosts, highlighting the potential roles of these genes in growth, development, and adaptation to domesticated environments. Particularly, the expression differences observed in vgll3 and six6 between gilthead seabream genotypes and the variance of six6 expression between larval and juvenile stages in European seabass, support the notion that these genes influence growth-related processes and physiological traits relevant to aquaculture. Future studies expanding to additional developmental stages and incorporating transcriptome-wide approaches could validate these observations and enhance our understanding of the genetic underpinnings of domestication and growth in cultured fish, ultimately contributing to improved breeding strategies in aquaculture.
Author Contributions
Conceptualization, A.T. and S.P.; methodology, A.M, E.K, S.M., K.G., A.K., E.A., A.T. and S.P.; validation, E.K. and S.P.; formal analysis, A.M., E.K., S.M. and S.P.; investigation, A.M., E.A, A.T. and S.P; resources, S.P.; data curation, A.M., E.K., S.M. and S.P.; writing—original draft preparation, A.M, E.K, S.M. and S.P.; writing—review and editing, K.G., A.K., E.A., A.T.; visualization, A.M.; supervision, E.A, A.T. and S.P.; project administration, K.G., A.T. and S.P.; funding acquisition, A.T. and S.P. All authors have read and agreed to the published version of the manuscript.
Funding
This study was conducted under the project “SEaLIFT: SystEms Biology Modelling of Key LIFe History Traits for Sustainable Aquaculture Production in the Mediterranean Region,” funded by Hellenic Foundation for Research & Innovation (H.F.R.I.).
Data Availability Statement
Τhe data presented in this study are available on request from the corresponding authors.
Conflicts of Interest
The authors declare no conflicts of interest.
References
- Cousminer, D.L.; Berry, D.J.; Timpson, N.J.; Ang, W.; Thiering, E.; Byrne, E.M.; Rob Taal, H.; Huikari, V.; Bradfield, J.P.; Kerkhof, M.; et al. Genome-wide association and longitudinal analyses reveal genetic loci linking pubertal height growth, pubertal timing and childhood adiposity. Hum. Mol. Genet. 2013, 22, 2735–2747. [Google Scholar] [CrossRef] [PubMed]
- Perry, J.R.B.; Day, F.; Elks, C.E.; Sulem, P.; Thompson, D.J.; Ferreira, T.; He, C.; Chasman, D.I.; Esko, T.; Thorleifsson, G.; et al. Parent-of-origin-specific allelic associations among 106 genomic loci for age at menarche. Nature 2014, 514, 92–97. [Google Scholar] [CrossRef] [PubMed]
- Cánovas, A.; Reverter, A.; DeAtley, K.L.; Ashley, R.L.; Colgrave, M.L.; Fortes, M.R.S.; Islas-Trejo, A.; Lehnert, S.; Porto-Neto, L.; Rincón, G.; et al. Multi-tissue omics analyses reveal molecular regulatory networks for puberty in composite beef cattle. PLoS One 2014, 9, e102551. [Google Scholar] [CrossRef]
- Pennonen, J. Characterization of human pubertal timing gene vgll3 in zebrafish development. Master thesis, Degree Programme in Molecular Biosciences, Department of Biosciences, Faculty of Environmental and Biological Sciences, University of Helsinki, Finland, 2017.
- Barson, N.J.; Aykanat, T.; Hindar, K.; Baranski, M.; Bolstad, G.H.; Fiske, P.; Jacq, C.; Jensen, A.J.; Johnston, S.E.; Karlsson, S.; et al. Sex-dependent dominance at a single locus maintains variation in age at maturity in salmon. Nature 2015, 528, 405–408. [Google Scholar] [CrossRef]
- Ayllon, F.; Kjærner-Semb, E.; Furmanek, T.; Wennevik, V.; Solberg, M.F.; Dahle, G.; Taranger, G.L.; Glover, K.A.; Almén, M.S.; Rubin, C.J.; et al. The vgll3 locus controls age at maturity in wild and domesticated Atlantic salmon (Salmo salar L.) males. PLoS Genet. 2015, 11, 1–15. [Google Scholar] [CrossRef]
- Sinclair-Waters, M.; Ødegård, J.; Korsvoll, S.A.; Moen, T.; Lien, S.; Primmer, C.R.; Barson, N.J. Beyond large-effect loci: large-scale GWAS reveals a mixed large-effect and polygenic architecture for age at maturity of Atlantic salmon. Genet. Sel. Evol. 2020, 52, 1–11. [Google Scholar] [CrossRef] [PubMed]
- Waters, C.D.; Clemento, A.; Aykanat, T.; Garza, J.C.; Naish, K.A.; Narum, S.; Primmer, C.R. Heterogeneous genetic basis of age at maturity in salmonid fishes. Mol. Ecol. 2021, 30, 1435–1456. [Google Scholar] [CrossRef] [PubMed]
- Kurko, J.; Debes, P. V.; House, A.H.; Aykanat, T.; Erkinaro, J.; Primmer, C.R. Transcription profiles of age-at-maturity-associated genes suggest cell fate commitment regulation as a key factor in the Atlantic salmon maturation process. G3 Genes, Genomes, Genet. 2020, 10, 235–246. [Google Scholar] [CrossRef] [PubMed]
- Kjærner-Semb, E.; Ayllon, F.; Kleppe, L.; Sørhus, E.; Skaftnesmo, K.; Furmanek, T.; Segafredo, F.T.; Thorsen, A.; Fjelldal, P.G.; Hansen, T.; et al. Vgll3 and the Hippo pathway are regulated in Sertoli cells upon entry and during puberty in Atlantic salmon testis. Sci. Rep. 2018, 8, 1–11. [Google Scholar] [CrossRef]
- Hori, N.; Okada, K.; Takakura, Y.; Takano, H.; Yamaguchi, N.; Yamaguchi, N. Vestigial-like family member 3 (VGLL3), a cofactor for TEAD transcription factors, promotes cancer cell proliferation by activating the hippo pathway. J. Biol. Chem. 2020, 295, 8798–8807. [Google Scholar] [CrossRef] [PubMed]
- Ahi, E.P.; Sinclair-Waters, M.; Moustakas-Verho, J.; Jansouz, S.; Primmer, C.R. Strong regulatory effects of vgll3 genotype on reproductive axis gene expression in juvenile male Atlantic salmon. Gen. Comp. Endocrinol. 2022, 325, 114055. [Google Scholar] [CrossRef]
- Debes, P. V.; Piavchenko, N.; Ruokolainen, A.; Ovaskainen, O.; Moustakas-Verho, J.E.; Parre, N.; Aykanat, T.; Erkinaro, J.; Primmer, C.R. Polygenic and major-locus contributions to sexual maturation timing in Atlantic salmon. Mol. Ecol. 2021, 30, 4505–4519. [Google Scholar] [CrossRef]
- House, A.H.; Debes, P. V.; Holopainen, M.; Käkelä, R.; Donner, I.; Frapin, M.; Pashay, E.; Kurko, J.; Ruhanen, H.; Primmer, C.R. Seasonal and genetic effects on lipid profiles of juvenile Atlantic salmon. bioRxiv 2023, 1870, 2023.02–22.529528. [Google Scholar] [CrossRef]
- Gjedrem, T.; Baranski, M. Domestication and the application of genetic improvement in aquaculture. In Selective Breeding in Aquaculture: An Introduction; Springer: Dordrecht, The Netherlands, 2009; Volume 10, pp. 5–11. [Google Scholar] [CrossRef]
- Gutierrez, A.P.; Yáñez, J.M.; Davidson, W.S. Evidence of recent signatures of selection during domestication in an Atlantic salmon population. Mar. Genomics 2016, 26, 41–50. [Google Scholar] [CrossRef] [PubMed]
- Houston, R.D. Future directions in breeding for disease resistance in aquaculture species. Rev. Bras. Zootec. 2017, 46, 545–551. [Google Scholar] [CrossRef]
- Moulistanos, A.; Nikolaou, T.; Sismanoglou, S.; Gkagkavouzis, K.; Karaiskou, N.; Antonopoulou, E.; Triantafyllidis, A.; Papakostas, S. Investigating the role of genetic variation in vgll3 and six6 in the domestication of gilthead seabream (Sparus aurata Linnaeus) and European seabass (Dicentrarchus labrax Linnaeus). Ecol. Evol. 2023, 13, 1–17. [Google Scholar] [CrossRef]
- Mobley, K.B.; Aykanat, T.; Czorlich, Y.; House, A.; Kurko, J.; Miettinen, A.; Moustakas-Verho, J.; Salgado, A.; Sinclair-Waters, M.; Verta, J.P.; Primmer, C.R. Maturation in Atlantic salmon (Salmo salar, Salmonidae): A synthesis of ecological, genetic, and molecular processes. Rev Fish Biol Fisheries 2021, 31, 523–571. [Google Scholar] [CrossRef]
- Albert, F.W.; Kruglyak, L. The role of regulatory variation in complex traits and disease. Nat. Rev. Genet. 2015, 16, 197–212. [Google Scholar] [CrossRef] [PubMed]
- Aguet, F.; Brown, A.A.; Castel, S.E.; Davis, J.R.; He, Y.; Jo, B.; Mohammadi, P.; Park, Y.S.; Parsana, P.; Segrè, A. V.; et al. Genetic effects on gene expression across human tissues. Nature 2017, 550, 204–213. [Google Scholar] [CrossRef]
- Rio, D.C.; Ares, M.J.; Hannon, G.J.; Nilsen, T.W. Purification of RNA using trizol (TRI reagent). Cold Spring Harb. Protoc. 2010, 2010, pdb.prot5439. [Google Scholar] [CrossRef] [PubMed]
- Kearse, M.; Moir, R.; Wilson, A.; Stones-Havas, S.; Cheung, M.; Sturrock, S.; Buxton, S.; Cooper, A.; Markowitz, S.; Duran, C.; et al. Geneious basic: An integrated and extendable desktop software platform for the organization and analysis of sequence data. Bioinformatics 2012, 28, 1647–1649. [Google Scholar] [CrossRef]
- Andersen, C.L.; Jensen, J.L.; Ørntoft, T.F. Normalization of real-time quantitative reverse transcription-PCR data: A model-based variance estimation approach to identify genes suited for normalization, applied to bladder and colon cancer data sets. Cancer Res. 2004, 64, 5245–5250. [Google Scholar] [CrossRef] [PubMed]
- Vandesompele, J.; De Preter, K.; Pattyn, F.; Poppe, B.; Van Roy, N.; De Paepe, A.; Speleman, F. Accurate normalization of real-time quantitative RT-PCR data by geometric averaging of multiple internal control genes. Genome Biol. 2002, 3, research0034.1. [Google Scholar] [CrossRef]
- Kruskal, W.H.; Wallis, W.A. Use of ranks in one-criterion variance analysis. J. Am. Stat. Assoc. 1952, 47, 583. [Google Scholar] [CrossRef]
- Shapiro, S.S.; Wilk, M.B. An analysis of variance test for normality (complete samples). Biometrika 1965, 52, 591–611. [Google Scholar] [CrossRef]
- Bartlett, M.S. Properties of Sufficiency and Statistical Tests. Proc. R. Soc. Lond. A. Math. Phys. Sci. 1937, 160, 268–282. [Google Scholar] [CrossRef]
- Cao, H.; Shockey, J.M. Comparison of TaqMan and SYBR Green QPCR methods for quantitative gene expression in tung tree tissues. J. Agric. Food Chem. 2012, 60, 12296–12303. [Google Scholar] [CrossRef]
- Kesmen, Z.; Gulluce, A.; Sahin, F.; Yetim, H. Identification of meat species by TaqMan-based real-time PCR assay. Meat Sci. 2009, 82, 444–449. [Google Scholar] [CrossRef] [PubMed]
- Fraser, T.W.K.; Hansen, T.J.; Fjelldal, P.G. Environmental and genetic (Vgll3) effects on the prevalence of male maturation phenotypes in domesticated Atlantic salmon. Fishes 2023, 8. [Google Scholar] [CrossRef]
- Fraser, T.W.K.; Tjølsen, A.; Madaro, A.; Hansen, T.J.; Fjelldal, P.G. Vgll3 regulates the timing of puberty in farmed Atlantic salmon, but it does not explain family discordance in male maturation following different smolt production regimes. Aquaculture 2024, 593. [Google Scholar] [CrossRef]
- Moustakas-Verho, J.E.; Kurko, J.; House, A.H.; Erkinaro, J.; Debes, P.; Primmer, C.R. Developmental expression patterns of six6: A gene linked with spawning ecotypes in Atlantic salmon. Gene Expr. Patterns 2020, 38, 119149. [Google Scholar] [CrossRef]
- Chavanne, H.; Janssen, K.; Hofherr, J.; Contini, F.; Haffray, P.; Aquatrace Consortium; Komen, H.; Nielsen, E.E.; Bargelloni, L. A comprehensive survey on selective breeding programs and seed market in the European aquaculture fish industry. Aquac. Int. 2016, 24, 1287–1307. [CrossRef]
- Yue, G.H. Recent advances of genome mapping and marker-assisted selection in aquaculture. Fish Fish. 2014, 15, 376–396. [Google Scholar] [CrossRef]
- Verta, J.-P.; Debes, P.V.; Piavchenko, N.; Ruokolainen, A.; Ovaskainen, O.; Moustakas-Verho, J.E.; Tillanen, S.; Parre, N.; Aykanat, T.; Erkinaro, J.; Primmer, C.R. Cis-regulatory differences in isoform expression associate with life history strategy variation in Atlantic salmon. PLoS Genet. 2020, 16, 1–23. [Google Scholar] [CrossRef] [PubMed]
- Ahi, E.P.; Verta, J.P.; Kurko, J.; Ruokolainen, A.; Singh, P.; Debes, P.V.; Erkinaro, J.; Primmer, C.R. Gene co-expression patterns in Atlantic salmon adipose tissue provide a molecular link among seasonal changes, energy balance and age at maturity. Mol. Ecol. 2024, 1–16. [Google Scholar] [CrossRef] [PubMed]
- Robert, F.; Pelletier, J. Exploring the impact of single-nucleotide polymorphisms on translation. Front. Genet. 2018, 9, 1–11. [Google Scholar] [CrossRef] [PubMed]
- Kaitetzidou, E.; Xiang, J.; Antonopoulou, E.; Tsigenopoulos, C.S.; Sarropoulou, E. Dynamics of gene expression patterns during early development of the European seabass (Dicentrarchus labrax). Physiol. Genomics 2015, 47, 158–169. [Google Scholar] [CrossRef] [PubMed]
- Kaitetzidou, E.; Ludwig, A.; Gessner, J.; Sarropoulou, E. Expression patterns of Atlantic sturgeon (Acipenser oxyrinchus) during embryonic development. G3 (Bethesda) 2017, 7, 533–542. [Google Scholar] [CrossRef] [PubMed]
- Wolf, S.; Melo, D.; Garske, K.M.; Pallares, L.F.; Lea, A.J.; Ayroles, J.F. Characterizing the landscape of gene expression variance in humans. PLoS Genet. 2023, 19, e1010833. [Google Scholar] [CrossRef] [PubMed]
- De Jong, T. V.; Moshkin, Y.M.; Guryev, V. Gene expression variability: The other dimension in transcriptome analysis. Physiol. Genomics 2019, 51, 145–158. [Google Scholar] [CrossRef] [PubMed]
- Papakostas, S.; Vasemägi, A.; Himberg, M.; Primmer, C.R. Proteome variance differences within populations of European whitefish (Coregonus lavaretus) originating from contrasting salinity environments. J. Proteomics 2014, 105, 144–150. [Google Scholar] [CrossRef] [PubMed]
- Piferrer, F.; Miska, E.A.; Anastasiadi, D. Chapter 10 - Epigenetics in fish evolution. In On Epigenetics and Evolution; Guerrero-Bosagna, C.M., Ed.; Translational Epigenetics; Academic Press, 2024; pp. 283–306 ISBN 978-0-443-19051-3.
- Konstantinidis, I.; Sætrom, P.; Mjelle, R.; Nedoluzhko, A. V.; Robledo, D.; Fernandes, J.M.O. Major gene expression changes and epigenetic remodelling in Nile tilapia muscle after just one generation of domestication. Epigenetics 2020, 15, 1052–1067. [Google Scholar] [CrossRef]
- Moulistanos, A.; Papasakellariou, K.; Kavakiotis, I.; Gkagkavouzis, K. Genomic signatures of domestication in European seabass (Dicentrarchus labrax L.) reveal a potential role for epigenetic regulation in adaptation to captivity. Ecol. Evol. [CrossRef]
- Oelschlaeger, P. Molecular mechanisms and the significance of synonymous mutations. Biomolecules 2024, 14. [Google Scholar] [CrossRef] [PubMed]
- Mitra, S.; Ray, S.K.; Banerjee, R. Synonymous codons influencing gene expression in organisms. Res. Reports Biochem. 2016, 6, 57–65. [Google Scholar] [CrossRef]
- Chen, R.; Davydov, E. V.; Sirota, M.; Butte, A.J. Non-synonymous and synonymous coding snps show similar likelihood and effect size of human disease association. PLoS One 2010, 5, e13574. [Google Scholar] [CrossRef]
- Campbell, T.M.; Castro, M.A.A.; de Santiago, I.; Fletcher, M.N.C.; Halim, S.; Prathalingam, R.; Ponder, B.A.J.; Meyer, K.B. FGFR2 risk SNPs confer breast cancer risk by augmenting oestrogen responsiveness. Carcinogenesis 2016, 37, 741–750. [Google Scholar] [CrossRef] [PubMed]
- Wright, J.B.; Brown, S.J.; Cole, M.D. Upregulation of c-myc in cis through a large chromatin loop linked to a cancer risk-associated single-nucleotide polymorphism in colorectal cancer cells. Mol. Cell. Biol. 2010, 30, 1411–1420. [Google Scholar] [CrossRef] [PubMed]
- Blinova, E.A.; Nikiforov, V.S.; Yanishevskaya, M.A.; Akleyev, A.А. Single nucleotide polymorphism and expression of genes for immune competent cell proliferation and differentiation in radiation-exposed individuals. Vavilovskii Zhurnal Genet. Selektsii 2020, 24, 399–406. [Google Scholar] [CrossRef]
- Verta, J.P.; Jacobs, A. The role of alternative splicing in adaptation and evolution. Trends Ecol. Evol. 2022, 37, 299–308. [Google Scholar] [CrossRef]
Figure 1.
Boxplots showing the expression levels of vgll3 and six6 genes in gilthead seabream juveniles at 69 dph. Panel a illustrates the expression levels of the vgll3 gene across AA, AG and GG genotypes, with red brackets and asterisks indicating significant differences between AA and AG genotypes and AA and GG genotypes (* p < 0.05). Panel b depicts the expression levels of the six6 gene across CC, CT, and TT genotypes, with red brackets and asterisks highlighting significant differences between CT and TT genotypes (* p < 0.05).
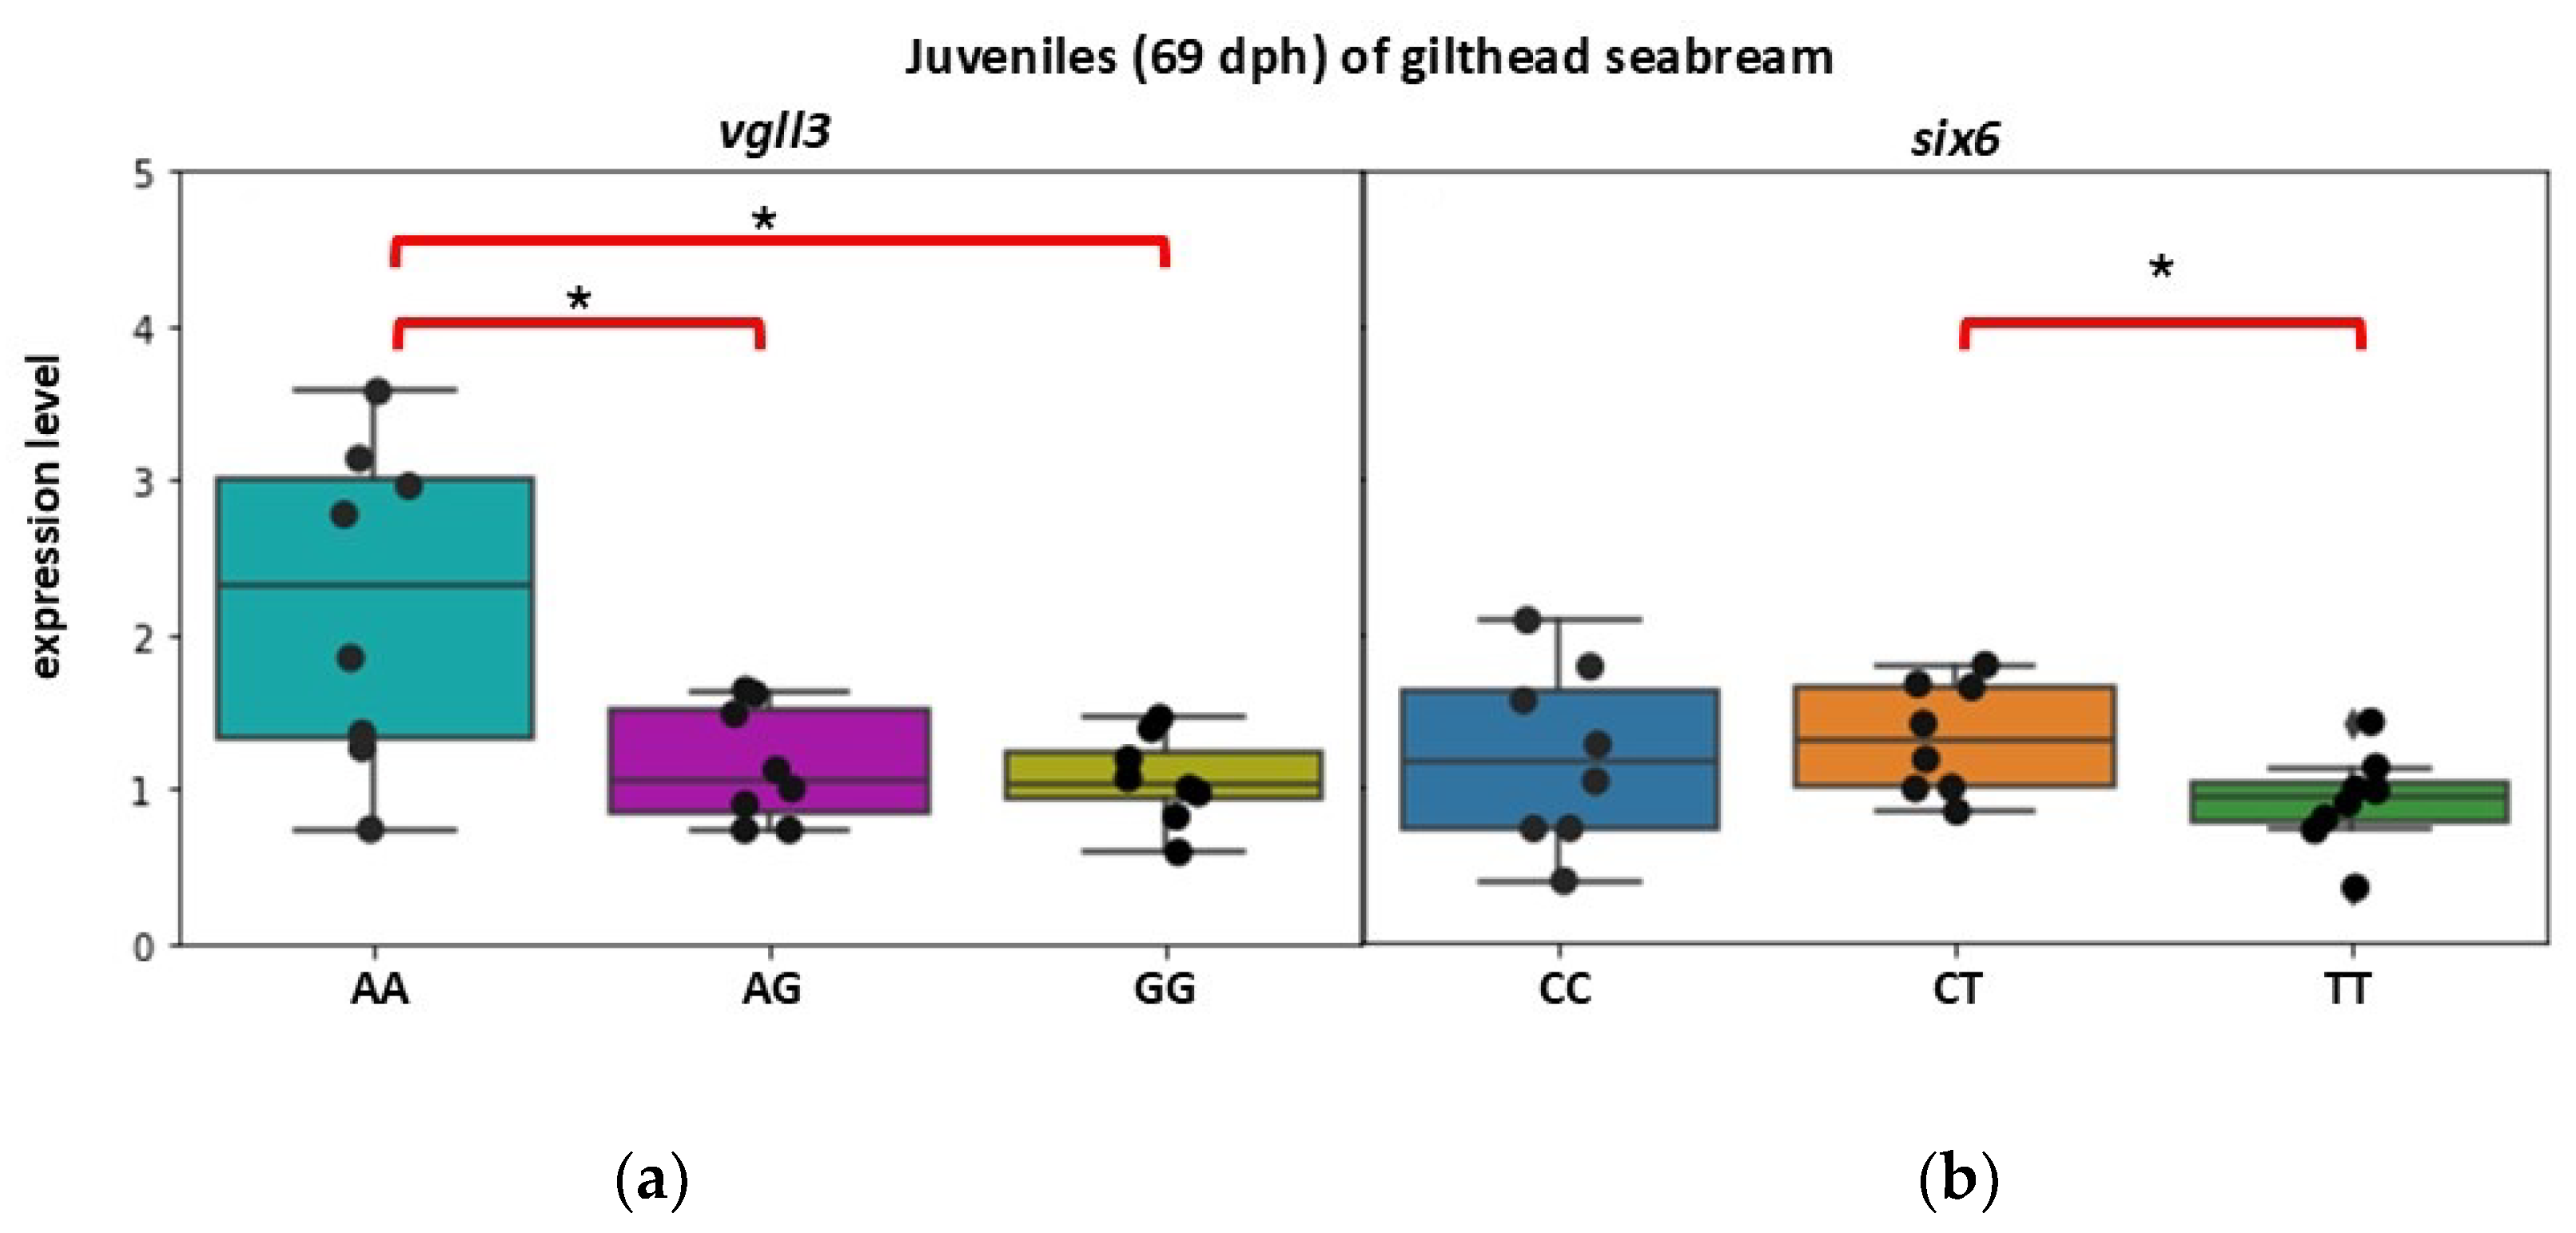
Figure 2.
Boxplots showing the expression levels of six6 gene in larvae (34 dph) and juveniles (71 dph) of European seabass. Panels a and b depict the expression levels of the six6 gene across AA, AT, and TT genotypes in larvae and juveniles, respectively.
Figure 2.
Boxplots showing the expression levels of six6 gene in larvae (34 dph) and juveniles (71 dph) of European seabass. Panels a and b depict the expression levels of the six6 gene across AA, AT, and TT genotypes in larvae and juveniles, respectively.
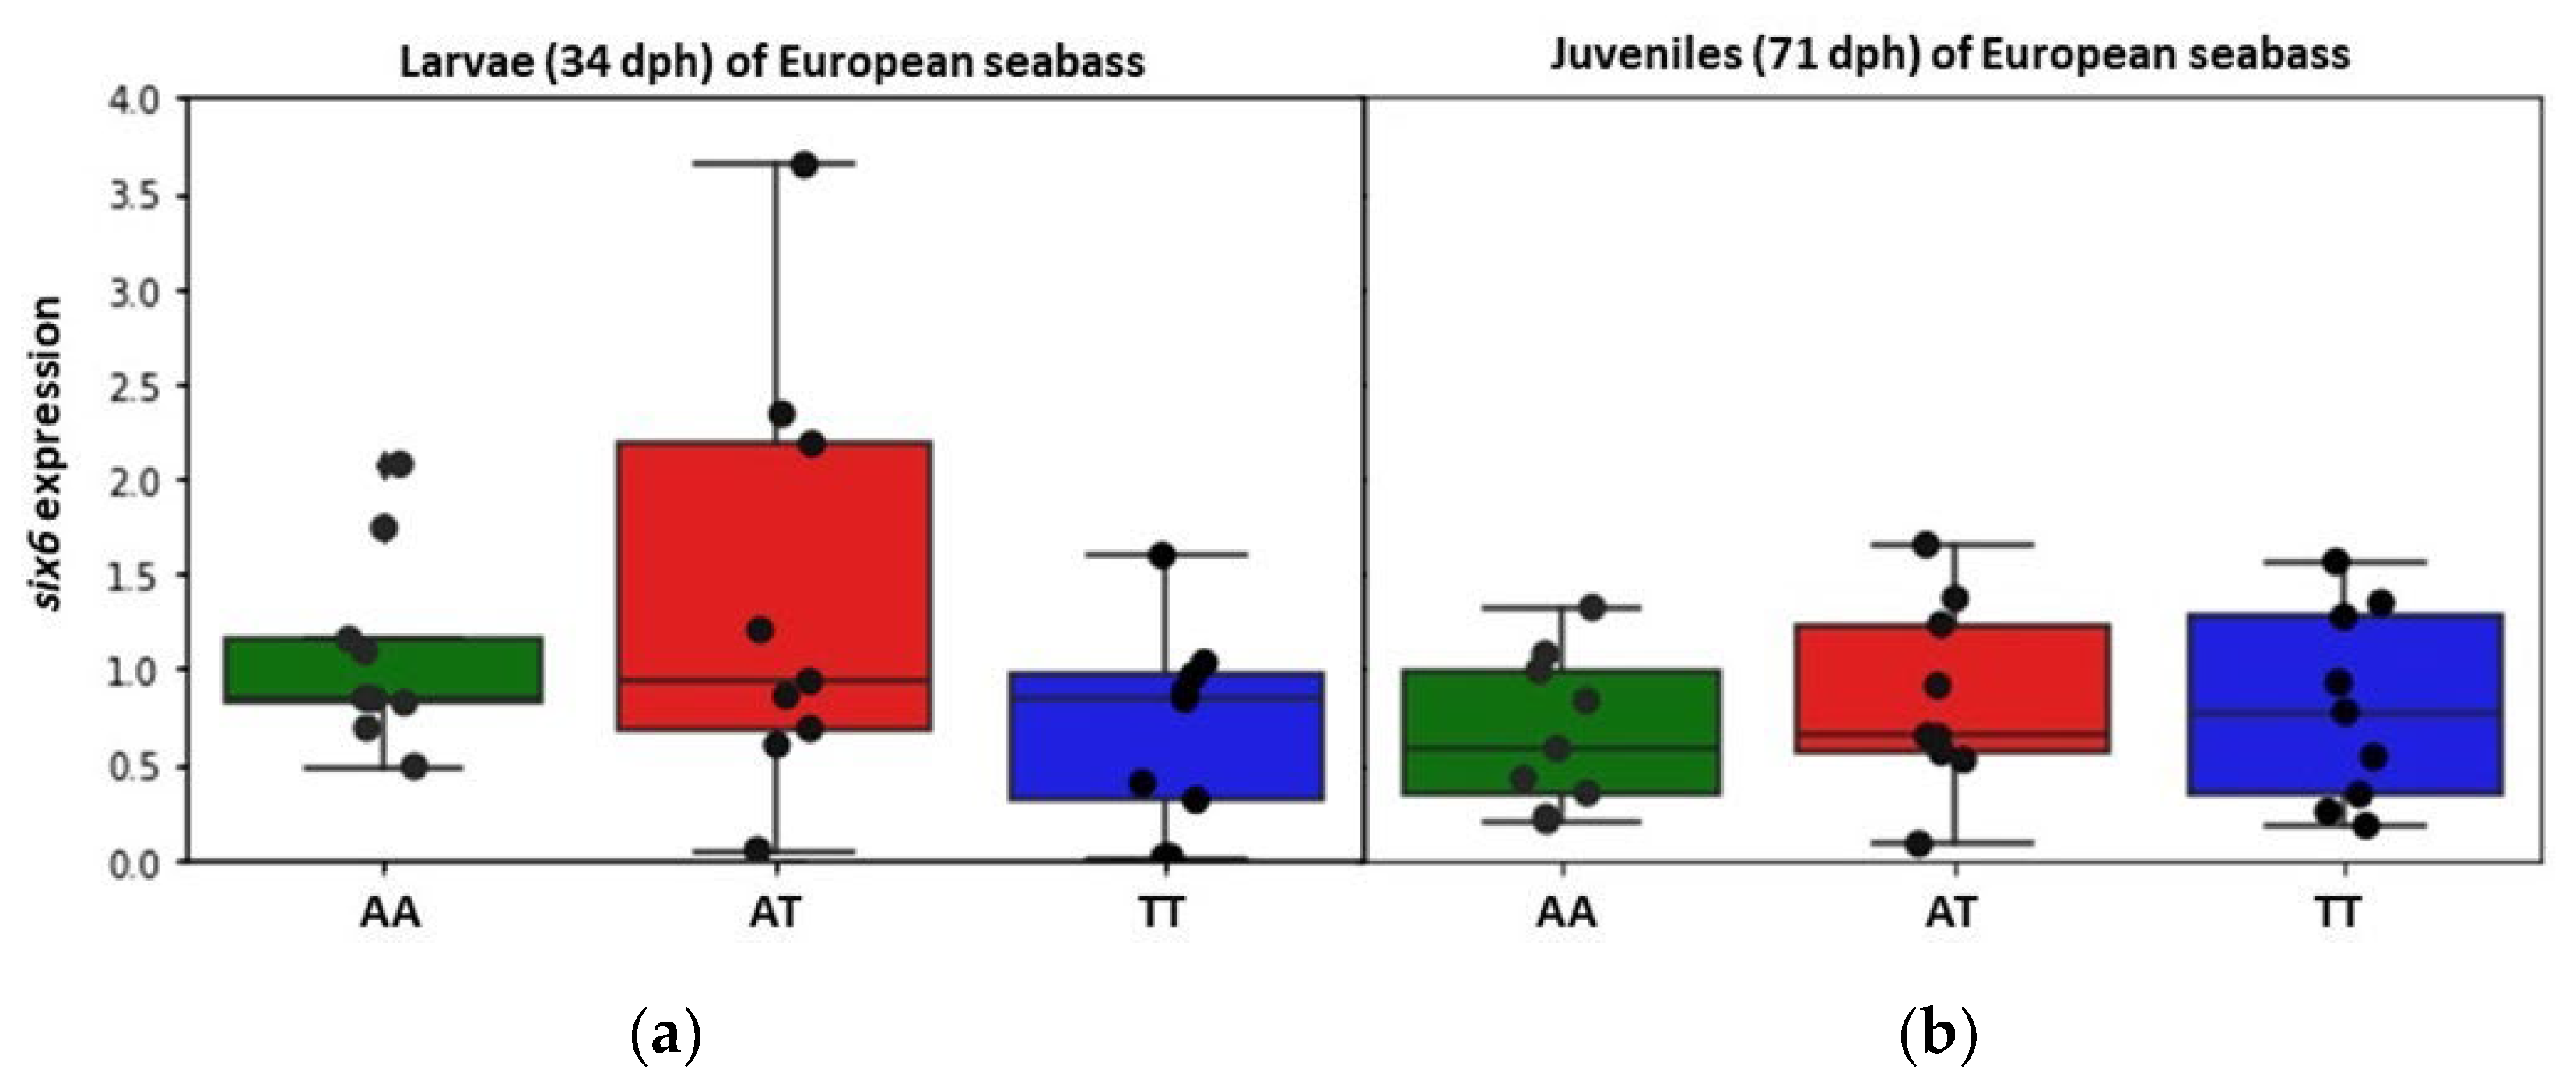

Table 1.
Primer sequences, amplicon sizes, genomic coordinates (assemblies S aurata: GCA_900880675.1; D. labrax: GCA_000689215.1), and annealing temperature for each studied genomic region.
Table 1.
Primer sequences, amplicon sizes, genomic coordinates (assemblies S aurata: GCA_900880675.1; D. labrax: GCA_000689215.1), and annealing temperature for each studied genomic region.
| Species | Gene | Genomic coordinates | Annealing temperature | Primer Sequence (5’-3’) | Amplicon size (bp) |
|---|---|---|---|---|---|
| D. labrax | vgll3 | 9203305 – 9203951 | 63°C | TACCCTCCCCGATACCTGG | 646 |
| TGTGTGGACAGTGCAGGAC | |||||
| six6 | 11590632 - 11591488* | 63°C | GGCTACAGGACTTACACCCA | 856 | |
| AAGTACCACAGCAAGATCGC | |||||
| S. aurata | vgll3 | 24911798 - 24912208 * | 63°C | AACGTCTATCACCCTCACCC | 410 |
| ACCAAACTGACGTCTTTGCT | |||||
| six6 | 14406022 - 14406799 * | 63°C | AACCGCAGACAAAGAGACAG | 777 | |
| ACCCCTTATTAAACAACAAGCAC |
Table 2.
Primers and probe sequence, amplicon sizes, and annealing temperatures for the reference and target genes.
Table 2.
Primers and probe sequence, amplicon sizes, and annealing temperatures for the reference and target genes.
| Species | Gene | Annealing temperature | Primers and Probe Sequence (5’-3’) (*probe sequence) |
Amplicon size (bp) |
|---|---|---|---|---|
| D. labrax | six6 | 60°C | GCCTTTCACACCGGCAATTTC | 169 |
| TCCGCACCCTGTATTTGTCCAC | ||||
| TGGAGAACCACAAGTTCACCAAAGAGTCGCAC* | ||||
| rpl13 | 61°C | GACACAAAGTGGTGGTGGTGAG | 130 | |
| AAGTGGTAAGGTCCACGAGAGG | ||||
| AGGCATCAACATCTCCGGCAACTTCTATCGCA* | ||||
| fau | 61°C | TCGGCCCTTAAACAGCCCTTTC | 190 | |
| GCAACAGCACCTGATCCTCAAC | ||||
| CGAGCATCAAGATGCAGCTCTTCTTGCGTGCC* | ||||
| ef1α | 61°C | AGCAGACAACTTCAACGCCC | 156 | |
| TCAAGCTTCTTGCCAGAACGAC | ||||
| CCACACAGCCCACATCGCCTGCAAGTTC* | ||||
| S. aurata | vgll3 | 56°C | TCGATTCAAGCCGGAGATCCAC | 119 |
| GCCAATGTCGCCTTGGAAGTAG | ||||
| TCCGATTCAGAGCTGAAGGACGGCACTCA* | ||||
| six6 | 56°C | CCGCGAACTTTACCACATCCTG | 149 | |
| TCCGCACCCTGTATTTGTCCAC | ||||
| ACCACAAGTTCACCAAAGAGTCGCACACGAAGCTG* | ||||
| rpl13 | 58°C | GTTCAACCAGCCAGCCAGAAAG | 116 | |
| TGGTGGGACATCTGACTTGTGG | ||||
| CGTCAGGCTAAGGCCCGTCGCATTGCTC* | ||||
| fau | 56°C | TGTCCCATGCGGCTAGTTATGC | 108 | |
| AGTGTTCTGGGCACGCAAGAAG | ||||
| AGCTCCCGGCACGTTGCTGTCCTC* | ||||
| ef1α | 56°C | ACTCCACCGAGCCAAACTACAG | 117 | |
| CCGAAATGGGCACAAAGGCAAC | ||||
| AGTGAGCACCTACATCAAGAAGATCGGCTACAATCC* |
Table 3.
Number of individuals genotyped for each SNP of the six6 and vgll3 genes across developmental stages in European seabass and gilthead seabream.
Table 3.
Number of individuals genotyped for each SNP of the six6 and vgll3 genes across developmental stages in European seabass and gilthead seabream.
| Species | Developmental stage | Gene | Number of individuals for each genotype | ||
| D. labrax | Larvae | six6 | AA (10) | AT (31) | TT (9) |
| Juveniles | sixi6 | AA (9) | AT (23) | TT (17) | |
| S. aurata | Juveniles | six6 | CC (8) | CT (17) | TT (25) |
| Juveniles | vgll3 | AA (8) | AG (30) | GG (12) | |
Disclaimer/Publisher’s Note: The statements, opinions and data contained in all publications are solely those of the individual author(s) and contributor(s) and not of MDPI and/or the editor(s). MDPI and/or the editor(s) disclaim responsibility for any injury to people or property resulting from any ideas, methods, instructions or products referred to in the content. |
© 2025 by the authors. Licensee MDPI, Basel, Switzerland. This article is an open access article distributed under the terms and conditions of the Creative Commons Attribution (CC BY) license (http://creativecommons.org/licenses/by/4.0/).
Copyright: This open access article is published under a Creative Commons CC BY 4.0 license, which permit the free download, distribution, and reuse, provided that the author and preprint are cited in any reuse.


