Submitted:
02 May 2025
Posted:
08 May 2025
You are already at the latest version
Abstract
In this work, we investigate the hard X-ray variability of the TeV blazar Mrk 421 over both long-term and intra-day timescales to gain insights into the particle acceleration and cooling mechanisms driving its emission. Using 28 NuSTAR observations spanning 2012 to 2024, we conduct detailed spectral and timing analyses. Our findings reveal pronounced flux variability, with changes by up to a factor of 200 over the decade and a 10-fold increase within a period of 15 days during a flaring episode. The flux distribution exhibits a lognormal profile, and a linear root-mean-square (RMS)–flux relation suggests a multiplicative variability process. Spectral analysis indicates that a log-parabolic model best describes most observations, with a strong linear anti-correlation between the photon index and curvature parameter. We also identify a positive correlation between the synchrotron peak energy and flux, accompanied by a subtle “harder-when-brighter” trend. These results align with standard blazar emission models, supporting particle acceleration via shock fronts or magnetic reconnection in the relativistic jet.
Keywords:
Blazar
; Mrk 421
; X-ray non-thermal emission
; relativistic jets
; active galactic nuclei
1. Introduction
Blazars constitute the most energetic class of radio-loud active galactic nuclei (AGN) in the universe. These remarkable sources are characterized by relativistic jets aligned closely with the observer’s line of sight, producing intense non-thermal emission across the entire electromagnetic spectrum, from radio to high-energy -rays. The relativistic motion within these jets, aligned close to the line of sight, results in Doppler boosting that significantly enhances the observed emission and drives rapid variability across all wavebands [1,2]. Powered by supermassive black holes, AGN are among the universe’s most potent energy reservoirs. The energy extracted from these black holes drives relativistic jets, accelerating particles to near-light speeds. This results in Doppler-boosted emission with rapid variability across all temporal and spectral scales, making blazars ideal laboratories for studying extreme astrophysical processes and high-energy particle acceleration [3].
The broadband spectral energy distribution (SED) of blazars typically exhibits a characteristic double-peaked structure in the frequency-flux plane. The lower-frequency peak, spanning infra-red to X-ray bands, arises from synchrotron emission generated by relativistic particles accelerated within the jet’s magnetic field. The origin of the higher-frequency peak, extending from X-rays to TeV energies, remains a topic of active debate. Leptonic models attribute this emission to inverse-Compton scattering of soft seed photons by high-energy electrons [4,5]. In the synchrotron self-Compton (SSC) scenario, the same electron population responsible for synchrotron emission upscatters these photons to higher energies. Alternatively, the external Compton (EC) scenario proposes that seed photons originate from external AGN components, such as the accretion disk [6], broad-line region [7], or dusty torus [8]. In contrast, hadronic models suggest that high-energy emission results from interactions between relativistic protons and ambient radiation fields [9,10,11].
Blazars are classified into two main categories: flat-spectrum radio quasars (FSRQs) and BL Lacertae (BL Lac) objects. FSRQs are generally more luminous, displaying prominent optical emission lines and synchrotron peaks at lower frequencies. BL Lac objects, by contrast, are less luminous, with weak or absent emission lines and synchrotron peaks at higher frequencies. BL Lacs represent an extreme subclass, with synchrotron emission extending to soft X-rays (up to Hz) and inverse-Compton emission spanning hard X-rays to TeV energies. These sources typically lack strong circumstellar photon fields and are thought to accrete matter at relatively low rates [see [12], and references therein]. BL Lac objects are further subdivided based on their synchrotron peak frequency (): low-synchrotron-peaked (LSP, Hz), intermediate-synchrotron-peaked (ISP, Hz Hz), and high-synchrotron-peaked (HSP, Hz) sources [13].
Blazars exhibit remarkable variability across all frequencies, from radio to TeV wavebands, spanning timescales from minutes to decades. Multi-wavelength (MWL) variability has emerged as one of the defining properties of blazars–and of AGNs in general–with variability studies playing a significant role in advancing our understanding of these sources. This variability can be characterized as a combination of three primary components: a general red noise-like behavior dominating the broadband power spectral density, occasional high-amplitude flares, and, in certain blazars, quasi-periodic oscillations with diverse characteristic timescales [14,15,16,17,18].
Markarian 421 (Mrk 421), a high-synchrotron-peaked BL Lac object at a redshift of , is one of the closest and brightest TeV-emitting blazars, making it an ideal target for studying relativistic jet physics in AGN. Its non-thermal emission spans the entire electromagnetic spectrum, from radio to very-high-energy (VHE) -rays, exhibiting significant flux and spectral variability. Consequently, Mrk 421 has been the focus of extensive multi-wavelength (MWL) observational campaigns, covering radio to TeV energies, which have revealed complex variability patterns throughout its observational history [19,20,21,22]. These broadband efforts have produced invaluable datasets, providing crucial constraints for theoretical models of jet emission mechanisms [23,24,25]. Studies utilizing (quasi-)simultaneous X-ray and -ray observations have frequently reported correlated variability between these bands [26,27,28,29,30,31,32,33]. In the X-ray regime, Mrk 421’s variability has been extensively studied using instruments such as XMM-Newton, Swift, NuSTAR, and AstroSAT. These analyses reveal strong correlations between soft and hard X-ray emission, with spectra often described by power-law or curved models [34,35,36,37,38]. Observations with Chandra have also provided evidence for warm-hot intergalactic medium (WHIM) filaments along the line of sight, confirming their role as reservoirs of baryonic matter in the cosmic web [39,40]. Detailed studies of flaring episodes have revealed interesting spectral and temporal features, including spectral hysteresis loops in the flux–hardness ratio plane and evidence of both hard and soft lags [30,41,42]. More recently, observations with the Imaging X-ray Polarimetry Explorer (IXPE) detected an X-ray linear polarization degree of ∼15% during a moderately active flux state [43].
In this paper, we present a comprehensive analysis of all available NuSTAR observations of Mrk 421, focusing on timing and spectral analyses to explore the variability properties of this blazar in the hard X-ray regime. Our study aims to explore the physical processes driving blazar emission by exploring the relationships among variability, mean flux, and spectral properties, revealing insights into the innermost regions of blazar jets, which remain mostly inaccessible to direct observation.
We organize the paper as follows: In Section 2, we describe the 28 NuSTAR observations and the data processing methods. In Section 3, we present the methods used for timing and spectral analyses based on light curves and spectra, and we discuss the results. In Section 4, we discuss key observational findings, including rapid flux and spectral variability, and a correlation between higher flux and harder spectra interpreting these in the context of current blazar models. Finally, in Section 5, we summarize our conclusions.
2. NuSTAR Observations and Data Processing
The Nuclear Spectroscopic Telescope Array (NuSTAR) is a sensitive hard X-ray (3–79 keV) observatory equipped with two focal plane modules, FPMA and FPMB, designed to provide high-resolution imaging and spectroscopy.
The NuSTAR instrument achieves a spectral resolution of ∼400 eV FWHM at 6 keV, increasing to ∼1 keV at 68 keV across its 3–79 keV bandpass. Each telescope provides a field of view of ∼13’ and a half-power diameter of ∼58" for a point source image[44]. This capability makes NuSTAR an ideal tool for studying the hard X-ray variability and spectral properties of blazars like Mrk 421, which often exhibit complex emission in this energy range.
Data reduction was performed using the NuSTAR Data Analysis Software (NuSTARDAS) package version 1.3.1, integrated with HEASOFT1 version 6.33 and the calibration database CALDB version 20220331. All observations were processed with the standard nupipeline script to produce calibrated and cleaned event files. Source emission was extracted from a circular region of 30" radius centered on the source position, while background emission was sampled from a 60" radius circular region in a source-free area of the detector, ensuring minimal contamination while remaining on the same detector chip. Light curves were generated with a uniform time binning of 300 seconds, balancing temporal resolution with a sufficient signal-to-noise ratio for variability analysis. Spectra were extracted and re-binned using the grppha task to ensure a minimum of 20 counts per energy channel, enabling the application of statistics in spectral fitting. This rigorous data processing approach ensures reliable characterization of the source’s hard X-ray behavior, facilitating detailed comparisons with theoretical emission models.
3. Analysis and Results
To characterize the hard X-ray emission from the blazar Mrk 421, we conducted a comprehensive analysis of both flux variability and spectral properties using 28 NuSTAR observations of the source, selected based on two primary requirements: an exposure time greater than 1000 seconds and an issue flag of zero. The observation date, observation ID, and exposure time for each selected dataset are presented in the 2nd, 3rd, and 4th columns of Table 1, respectively, providing a clear overview of the observational parameters used in this study.
Our investigation can be divided into two main components: timing analysis and spectral analysis, which are presented in the subsequent sections. The timing analysis explores the temporal behavior of the source across multiple timescales, while the spectral analysis examines the underlying emission mechanisms and their evolution. Together, these complementary approaches provide insights into the physical processes driving the hard X-ray emission from this well-studied blazar.
3.1. Timing Analysis
To carry out timing analysis, we processed the data to generate intra-day light curves, as detailed in Section 2, and present them in Figure 1 in chronological order, corresponding to the observations listed in Table 1. The upper panel of Figure 1, displayed on a linear y-scale, reveals a dramatic flux change over the entire period, while the lower panel, using a logarithmic y-scale, emphasizes the intra-day variability, particularly in the low flux states. Building on these light curves, we systematically analyzed the flux variability properties across both intra-day and long-term timescales. The intra-day analysis focused on characterizing rapid fluctuations within individual observing epochs, while the long-term investigation examined variability patterns spanning the entire observational campaign. This dual-timescale approach allows us to probe both the rapid, local processes occurring within the jet and the more sustained evolutionary trends in the emission properties of Mrk 421.
3.1.1. Flux Variability
As the flux state of the source varied across the observation epochs, we computed the mean flux for each of the 28 intra-day hard X-ray light curves, as presented in the fifth column of Table 1. Across the observations, the mean flux exhibits a wide range, from a low of 1.76 counts/s on 2013-01-10 to a high of 133.25 counts/s on 2013-04-14, with an average of 24.28 counts/s over the dataset. This broad span highlights the source’s dynamic behavior in the hard X-ray band, capturing both its baseline and peak activity levels. Notably, the maximum mean flux of 133.25 counts/s on 2013-04-14 indicates a significant flaring event, one of the most intense recorded for this source in this energy regime [45]. The observed flux variations provide valuable insights into the source’s energetic processes over time.
While a light curve’s variance provides an initial measure of variability, it includes both intrinsic source fluctuations and measurement uncertainties. To isolate the source’s true physical variability, we must subtract the variance contribution from measurement uncertainties in the count rates. This corrected metric, known as excess variance, effectively quantifies the intrinsic variability by eliminating statistical noise from the measurement process. For a light curve comprising N measured flux values , each with associated finite uncertainties due to measurement errors, and given as the sample variance of the light curve, the excess variance is computed using the following relation:
where represents square of the mean measurement errors, providing a robust measure of the source’s true variability [46,47]. Fractional variability, which is related to the normalized excess variance, is calculated using the relation,
[see 48,49]. The associated error in the fractional variability is obtained using,
[50,51]. We computed the fractional variability (FV) for all 28 intra-day hard X-ray light curves using the relations described above, with results listed in the 6th column of Table 1. The analysis reveals a remarkable range of variability across observations, spanning from a minimal value of approximately 1% (observed on 2024-04-29) to an extraordinary peak of 60% (recorded on 2013-04-11). On average, the intra-day observations exhibit a fractional variability of approximately 18% across the entire dataset. These values highlight the dramatic variability characteristics of this source in the hard X-ray band, demonstrating both extreme fluctuations during its most active states and the wide dynamic range of variability the source experiences over time. The exceptional FV value of 60% during the 2013-04-11 observation represents one of the most violent variability episodes reported for this class of object in the hard X-ray regime. Blazars, including Mrk 421, are well-known for exhibiting rapid flux variations on intra-day timescales across a broad range of electromagnetic wavebands [e.g., [12,37,52,53,54,55]. These short-timescale fluctuations, often detected in the hard X-ray regime, provide a powerful probe of the physical processes within the compact emission regions of blazar jets. Using light-travel-time arguments, the intra-day variability suggests that the emission originates from highly compact regions, likely located close to the central engine. By analyzing the variability in the hard X-ray emission of Mrk 421, we can constrain some of the important properties of these regions, including their size and relativistic kinematics, offering valuable insights into the dynamics and structure of the jet.
3.2. RMS–Flux Correlation
The root-mean-square (RMS)–flux relation in AGN reveals a linear correlation between the RMS variability amplitude and the mean flux, observed across a wide range of timescales [56,57,58]. Initially identified in the X-ray emission from AGN and X-ray binaries, this relation indicates that short-term flux variations scale multiplicatively with longer-term brightness changes, a characteristic of accretion-driven processes. The remarkable linearity persists across diverse timescales and energy bands, suggesting that variability arises from propagating fluctuations in the accretion flow, where turbulent variations in the mass accretion rate at different radii are coupled [56].
Recently, the rms–flux relation has been investigated in several blazars across different observational wavebands, with the aim of probing the disk–jet connection in jetted AGNs. The relation has been found to hold in the gamma-ray band (e.g., [59,60,61]), X-rays [62], and optical wavelengths [63]. However, in long-term variability studies of the blazars 3C 273 and PKS 2155-304 based on XMM-Newton X-ray observations, the relation was not observed [54,55].
Motivated by these findings, we investigated whether the variability amplitude in the hard X-ray emission from Mrk 421 correlates with its mean flux state, aiming to further understand the nature of its variability and the physical processes driving the source’s behavior. We quantified the variability using the root-mean-square (RMS) amplitude, defined as , and computed the Pearson’s correlation coefficient between the RMS and the mean count rate across all 28 NuSTAR light curves. The analysis yielded a correlation coefficient of 0.86, indicating a strong positive correlation between the two quantities. This suggests that higher flux states are associated with greater variability amplitudes, a trend commonly observed in blazars and often linked to non-linear, multiplicative processes in the jet [56]. The relationship is visually represented in Figure 2, where a plot of the mean count rate against the RMS clearly illustrates the linear trend, reinforcing the statistical correlation. The relation provides evidence for a connection between the source’s brightness and its variability, potentially reflecting dynamic changes in particle acceleration or energy injection within the jet of Mrk 421.
3.2.1. Flux Distribution and PDF
Understanding the statistical distribution of X-ray flux from blazars like Mrk 421 provides critical insights into the physical processes governing their emission. In particular, the distinction between normal (Gaussian) and lognormal probability density functions (PDFs) serves as a key discriminator between theoretical models of particle acceleration and emission mechanisms. Normal distributions typically arise from additive processes, while lognormal distributions are associated with multiplicative processes, such as turbulent or cascading energy injection in the jet [56]. This analysis is particularly valuable for constraining the underlying physics of blazar variability.
The normal distribution is expressed as:
where is the probability density function, x represents the flux value, is the mean, and is the standard deviation, quantifying the distribution’s spread.
The lognormal distribution is given by:
where x is the positive flux value, m is the mean of the natural logarithm of x, and s is the standard deviation of the logarithm. The factor ensures proper normalization on the logarithmic scale. Unlike the symmetric normal distribution, the lognormal distribution is skewed, with a longer tail toward higher values, a feature often observed in blazar flux distributions.
We combined the all 28 intra-day light curves to construct a histogram of count rate distribution, reflecting the source’s variability across multiple observational epochs. Both normal and lognormal PDFs were fitted to the histogram using a least-squares method, with goodness-of-fit evaluated via the reduced statistic.
Figure 3 illustrates the histogram of flux variations, with the normal distribution (magenta line) and lognormal distribution (green line) overlaid. The lognormal PDF provides a significantly better fit, yielding a reduced of , compared to for the normal distribution. An inset text box in the figure reports the values and degrees of freedom for both fits, allowing a direct comparison. This result indicates that the hard X-ray flux distribution of Mrk 421 is more consistent with lognormal behavior, suggesting multiplicative processes dominate the variability.
The preference for a lognormal distribution has been reported in previous studies using Swift/XRT observations of Mrk 421 [64], and similar lognormal behavior has also been observed in XMM-Newton observations of several other blazars [65]. In contrast, a study based on archival XMM-Newton data spanning a decade found no clear evidence of a distinct probability distribution function (PDF) in the flux distributions of the FSRQ 3C 273 and the BL Lac object PKS 2155–304 [54,55]. Complementing the X-ray results, flux distributions of several blazars—including Mrk 421—have also been shown to be consistent with a lognormal PDF in the gamma-ray [59,60,61] and optical bands [63].
In blazars, the presence of a lognormal PDF in their flux distributions is often attributed to non-linear processes, potentially driven by turbulent energy injection or cascading mechanisms within the relativistic jet [66]. This contrasts with additive processes, often associated with shot-noise-like behavior and characterized by a normal distribution [59]. These findings enhance our understanding of the physical mechanisms driving Mrk 421’s variability and contribute to the broader study of blazar jet dynamics.
3.3. Spectral Analysis
In the following section, we present the spectral analysis of NuSTAR observations of the blazar Mrk 421. This analysis employs a model-independent hardness ratio approach to characterize spectral variability and detailed spectral fitting using various models to describe the NuSTAR spectra.
3.3.1. Hardness Ratio
To investigate the relationship between the variability in different energy bands of Mrk 421, we extracted light curves in two distinct energy ranges—low-energy (LE, 3–10 keV) and high-energy (HE, 10–79 keV)—following the standard data reduction procedures outlined in Section 2. Our objective was to examine how the high-energy light curve responds to variations in the low-energy light curve, thereby probing the connection between these emission components across the entire observation period. To quantify this relationship, we computed the Pearson’s correlation coefficient between the LE and HE light curves, yielding a value of 0.94, which indicates a strong positive correlation between the two energy bands. Several studies, utilizing various X-ray telescopes such as XMM-Newton, Swift/XRT, Chandra, and NuSTAR, have reported a similar positive correlation between the emission in the two bands [67,68,69,71,71].
This high degree of correlation suggests that the variability in the LE and HE bands is closely linked, likely driven by common physical processes within the jet. The correlation is visually represented in Figure 4, where we plot the HE light curve against the LE light curve, with each point corresponding to simultaneous flux measurements in the two bands. Additionally, we performed a linear fit to the data, finding that a slope of 0.6 provides the best fit, indicating a proportional but slightly subdued response of the HE emission to changes in the LE emission. For comparison, a dashed red line representing the relation (slope of 1.0) is also included in the figure, highlighting that the HE variability is less sensitive to LE changes. This slope of 0.6 suggests that while the variability in both bands is strongly correlated, the source’s overall variability is dominated by the soft (LE) band, potentially reflecting differences in the electron populations or cooling mechanisms responsible for the emission in these energy ranges [70].
To further evaluate the relative contributions of different spectral components to the total flux, as measured by count rates, and to examine how these contributions vary across diverse flux states, we define the hardness ratio (HR) as a model-independent metric of the blazar’s spectral shape. The HR is calculated as:
where H represents the flux in the hard X-ray energy band (2–10 keV) and S denotes the flux in the soft X-ray energy band (0.3–2 keV). This definition provides a direct measure of the contribution from the hard-band over soft band, facilitating a standardized comparison across observations. The uncertainty in the hardness ratio, , is derived using error propagation, given by:
where and are the uncertainties in the hard and soft band fluxes, respectively.
The hardness ratio provides a straightforward, model-independent representation of the spectral properties of Mrk 421 within the specified energy range, with variations in HR directly reflecting spectral changes during the observations. To investigate potential correlations or anti-correlations between the spectral properties and the flux state of Mrk 421, we examined the relationship between the hardness ratio (HR) and the total flux (measured in counts) in the entire band. The right panel of Figure 4 displays the HR values for the entire dataset plotted against the logarithm of the flux in counts, revealing a weak positive correlation characterized by a small slope of 0.05. This shallow trend indicates a nearly negligible dependence between HR and flux, suggesting that the spectral shape remains largely stable despite variations in the source’s brightness. This absence of a correlation between HR and flux suggests that the hard X-ray emission from Mrk 421 likely originates from multiple emission zones, each potentially governed by distinct emission mechanisms, such as synchrotron and inverse Compton processes, or a combination of leptonic and hadronic contributions [71]. These findings highlight the complexity of the source’s spectral behavior and the need for multi-zone models to fully capture the underlying physical processes driving its variability.
3.4. Spectral Modeling
To model the non-thermal emission from the blazar Mrk 421, we conducted a detailed spectral analysis of 28 NuSTAR observations using the XSPEC software package, following standard X-ray spectral analysis procedures [72]. During data processing, we generated source spectra, response matrix files (RMF), ancillary response files (ARF), and background spectra for each observation, binning the spectra to ensure a minimum of 20 counts per energy bin for reliable statistics. The analysis was performed in the 3–79 keV energy range, simultaneously fitting the spectra from the FPMA and FPMB instruments while incorporating an intercalibration constant to account for minor instrumental differences. The intercalibration constants ranged from 0.97 to 1.04, indicating excellent consistency between the two detectors.
We tested three distinct spectral models to determine the best representation of Mrk 421’s spectral behavior: a power law (PL), a log-parabola (LP), and a broken power law (BPL). The power-law model is defined as:
where N, E, and represent the normalization, photon energy, and photon index, respectively. This model reflects the non-thermal emission from a power-law distribution of high-energy particles in the jet’s magnetic field, with the synchrotron spectral index related to the particle distribution index p by .
The broken power-law model, which allows for a spectral break, is expressed as:
where and are the photon indices below and above the break energy , and is the normalization. A broken power-law spectrum often indicates the presence of high-energy relativistic electrons that cool rapidly through radiative processes, leading to a break in the emission spectrum.
The log-parabola model, characterized by a continuous curvature, is given by:
where and (fixed at 1 keV) are the normalization and reference energy, respectively, while and denote the photon index at and the curvature parameter, respectively [76]. The log-parabola model is often associated with particle acceleration scenarios where the probability of further energy gain decreases with increasing particle energy, resulting in a curved spectrum.
To account for Galactic absorption, we incorporated the tbabs model (Tuebingen-Boulder ISM absorption model; [73]) into each fit, using hydrogen column density values from [74]. For Mrk 421, we fixed the neutral hydrogen column density at , consistent with previous studies [75]. These spectral models and absorption corrections enable a comprehensive analysis of Mrk 421’s emission properties, providing insights into the physical mechanisms driving its non-thermal radiation in the hard X-ray regime. The results of the spectral fitting are presented in Table 2. The table includes the observation ID and the XSPEC model in the first and second columns, respectively, while the best fit parameters for the PL, BPL, and LP models are provided in the third, fourth, and fifth columns. The final column reports the reduced statistic for each fit, enabling a direct comparison of the model performance. The table indicates that the LP model provides the best fit for 20 of the 27 observations of Mrk 421, suggesting that the spectra frequently exhibit curvature. This is consistent with particle acceleration scenarios where the probability of energy gain decreases with increasing energy. The BPL model best fits 2 observations, indicating occasional spectral breaks, possibly due to rapid cooling of high-energy electrons. The PL model is the best fit for 5 observations, showing that a simple power-law spectrum adequately describes Mrk 421’s hard X-ray emission in these cases. For one observation (60002023008), fitting convergence could not be achieved, preventing any model from being successfully applied. The preference for LP and BPL models supports the expectation of complex, non-thermal emission from blazar jets [76].
Spectral modeling results for two distinct observation epochs of Mrk 421 are presented in Figure 5, with the left panel corresponding to the lowest flux state and the right panel representing the highest flux state. For both observations, the log-parabola (LP) model provided the best fit, as evidenced by the reduced values. Notably, the lower panel of the low-state plot reveals a distinct hard excess beginning around 20 keV, indicating a deviation from the LP model at higher energies during this epoch see (also [33]).
To further explore the spectral evolution of Mrk 421 across different flux states, we analyzed the best-fit parameters from Table 2, focusing on their distribution and correlations. The top left panel of Figure 6 presents a plot of the photon index from PL model against the logarithm of the mean count rate for each observation (see Table 1), revealing a clear anti-correlation trend that indicates a slow “harder-when-brighter” behavior; as the flux increases (on a logarithmic scale), the photon index decreases, suggesting a gradual hardening of the spectrum. The top right panel of the same figure displays an anti-correlation between the and parameters of the LP model, implying that as the spectrum steepens (higher ), the curvature parameter decreases, resulting in a flatter spectral shape, with negative values particularly highlighting a hard excess in the two lowest flux states of the source. Similarly, the bottom left panel illustrates a correlation of mean flux level from each observation with the synchrotron peak energy , derived using the relation with . A positive correlation is observed, with a Pearson’s correlation coefficient of 0.86 but with a shallow slope of 0.02. This subtle shift of toward higher energies as the source brightens further supports the observed spectral hardening during higher flux states. In a similar previous study, log-parabolic spectral fit to the X-ray observations during the flaring state of the source revealed a positive correlation between spectral parameters and flux levels [30,77]. Furthermore, a correlation study examining the relationship between the peak luminosity and peak energy (– relation) in a sample of 14 BL Lac objects reveals positive, negative, or no correlations between these parameters [78]. Finally, the bottom right panel of the figure shows no significant correlation between and parameter.
Similarly, to combine the results of timing and spectral analyses, the FV for each observation is plotted against the photon indices derived from PL spectral fitting in Figure 7. The plot reveals a trend of anti-correlation between these variables, suggesting greater variability and a broader spread during the harder spectral states of the source.
4. Discussion
The study of intra-day and long-term hard X-ray variability in the TeV blazar Mrk 421, based on 12 years of NuSTAR observations, reveals flux variations of up to a factor of 22 5. The FV in the X-ray band reaches ∼120%, significantly exceeding the 43% FV in gamma-rays [81] and 30% in the optical band [63] over comparable timescales. The source exhibited its highest flux state on April 14, 2013, and its lowest flux state on January 10, 2013. In addition, we observed a profound flaring event in April 2013, during which the source brightened by a factor of 10 within a period of 15 days. This provides a unique opportunity to probe the physical processes driving blazar variability. By performing comprehensive spectral and timing analyses—including the linear RMS-flux relation, log-normal flux distributions, and the power-law spectral models—we gain deeper insight into the mechanisms responsible for both intra-day and long-term flux and spectral variability, including this remarkable flaring event. These analyses collectively point to multiplicative, non-linear processes within the relativistic jet, likely driven by enhanced particle injection at a shock wavefront, with possible contributions from magnetic reconnection or accretion disk fluctuations.
The hard X-ray emission during the observation period exhibits distinct spectral characteristics. The nearly constant hardness ratio (HR = , with a slope of 0.05 in the vs. HR relation) and a strong linear correlation between high-energy (HE, 10–79 keV) and low-energy (LE, 3–10 keV) fluxes () suggest that the emission is dominated by leptonic synchrotron radiation from a single electron population with a stable power-law index and a minimal spectral evolution, consistent with self-regulated acceleration balancing radiative cooling ().
The log-parabolic spectral model, expressed by Equation 10, reveals a significant anti-correlation between the photon index (2.38–3.64) and curvature parameter (-0.33–0.30), in contrast the positive correlation observed in other X-ray observations of the source [e. g., [68,76]. This discrepancy suggests that during the period of hard X-ray emission, particle acceleration is influenced by additional processes, such as stochastic acceleration or energy-dependent cooling, which alter the electron energy distribution and spectral shape. The synchrotron peak energy, calculated as with [see [79], shifts from (, ) to (, ) as the flux increases, aligning with a "harder-when-brighter" trend (photon index decreases from 3.1 to 2.3 as mean count rate rises from 1.76 to 133.25 counts/s).
This spectral evolution is likely driven by an increase in the maximum electron energy () and a modest change in the magnetic field (B). For to increase by a factor of (ignoring two lowest states), if B remains constant, must increase by . In particular, to explain the 10-fold flux increase (), the electron density would need to adjust by , suggesting stability or a slight decrease in . Alternatively, if B increases by a factor of 2 (e.g., via magnetic reconnection), need only increase by , with , better aligning with the observed flux and shift. The stable HR and linear flux correlation disfavor significant synchrotron self-Compton (SSC) or hadronic contributions, as SSC would predict a non-linear flux relationship (; in Thomson’s region [80]) and hadronic emission would increase HR with flux (e. g., [81,82]).
A change in the Doppler factor () due to jet reorientation is less likely, as (for ) requires to increase by , yielding an increase of only 1.7, far below the observed factor of 13. Thus, enhanced particle injection at a shock wavefront, possibly coupled with a slight increase in B, emerges as the primary driver of the flare, with leptonic synchrotron processes dominating the emission.
The timing properties of Mrk 421’s flare further shed light on the underlying variability mechanisms. The linear trend in RMS-flux relation, where the root-mean-squared (RMS) amplitude of variability generally scales linearly with the mean flux, indicates that higher flux states exhibit greater variability, suggesting a common mechanism linking short- and long-timescale variations. For Mrk 421, this relation in X-ray light curves from AstroSat and XMM-Newton across epochs spanning decades and shorter periods (5 days to ∼10 years), similar to patterns in X-ray binaries and Seyfert galaxies [56,62,83]. A broader study involving a large population of blazars, using 14 years of Fermi-LAT gamma-ray light curves, found that a significant number of sources—particularly BL Lac objects like Mrk 421—exhibited a strong linear RMS-flux relation. This relation was interpreted in terms of internal shock models with variations in shock amplitudes [59]. However, the generality of the relation is debated, as some simulations suggest it appears in only 26–32% of light curves under specific shock scenarios [84].
Complementing the RMS–flux relation, the analysis of NuSTAR light curves reveals a log-normal probability density function (PDF), with a reduced , significantly better than that of a normal distribution (). In the AGN literature, these characteristics are considered indicative of multiplicative, non-linear processes. This log-normality, also reported in AstroSat and XMM-Newton X-ray data for Mrk 421 [62] and in Fermi-LAT gamma-ray data for 46.5% of BL Lacs [59], suggests turbulent or cascading energy injection in the jet [66]. In contrast, flat-spectrum radio quasars (FSRQs) like 3C 273 occasionally show normal distributions, highlighting diverse variability mechanisms [62].
The timing analyses, together with spectral analyses, present a coherent picture of the flare in Mrk 421. The linear RMS-flux relation and log-normal flux distribution point to multiplicative, non-linear processes, likely driven by internal shocks or turbulent energy injection within the jet. These processes align with the spectral findings, where the anti-correlation between and , coupled with the "harder-when-brighter" trend and shift, suggests complex particle acceleration mechanisms, possibly involving stochastic acceleration or energy-dependent cooling. The stable HR and linear flux correlation underscore the dominance of leptonic synchrotron radiation, with internal shocks increasing and , potentially amplified by a modest increase in B.
This variability may originate from accretion rate fluctuations in the disk, which propagate along the jet and carry imprints of disk properties, constraining the disk-jet connection [60,63,85]. The anti-correlation between and , deviating from standard models, further suggests that additional factors, such as magnetic reconnection or spatially varying acceleration regions, modulate the electron energy distribution during the flare. While deviations from log-normality in FSRQs and the non-universal RMS-flux relation indicate complexity, the consistent log-normal PDFs and RMS-flux relation in Mrk 421 reinforce a turbulent jet origin for its variability.
The spectral and timing analyses of the Mrk 421 flare reveal a dynamic interplay of multiplicative, non-linear processes driving its variability. The log-parabolic spectral model, with an anti-correlation between and , points to complex particle acceleration mechanisms, while the "harder-when-brighter" trend and shift suggest enhanced particle injection at a shock wavefront, possibly coupled with magnetic reconnection. The linear RMS-flux relation and log-normal flux distribution support these findings, indicating turbulent energy injection and potential disk-jet coupling. These results highlight the dominance of leptonic synchrotron processes in Mrk 421’s jet and underscore the need for further multiwavelength studies to refine our understanding of blazar jet dynamics and their connections to the central engine.
5. Conclusions
We conducted a comprehensive timing and spectral analysis of the TeV blazar Mrk 421, utilizing 28 observations spanning 12 years from 2012 to 2024, to investigate its hard X-ray variability properties. Our key findings are summarized as follows:
- Mrk 421 exhibited extreme variability, with flux changes of up to a factor of 200 over a 12-year period, including a 15-day flaring event during which the source brightened by more than a factor of 10. This dramatic variability is likely driven by an increase in the maximum Lorentz factor during shock acceleration, highlighting the dynamic nature of the particle acceleration processes in the jet.
- The hard X-ray variability displays a linear RMS-flux relation and a lognormal flux distribution. These characteristics suggest that the variability arises from multiplicative processes, rather than additive ones, pointing to a cascading or interconnected mechanism governing the emission.
- A strong correlation is observed between the count rates in the low-energy (3–10 keV) and high-energy (10–79 keV) bands, indicating that synchrotron emission dominates the X-ray output across these energy ranges.
- Spectral analysis reveals a weak but consistent harder-when-brighter trend, with spectra best described by log-parabolic models exhibiting curvature and occasional breaks. The photon index and curvature parameters of the log-parabola model are anti-correlated, and the spectral peak shifts to higher energies with increasing flux. These features collectively support a scenario of energy-dependent stochastic particle acceleration shaping the emission.
These results provide valuable insights into the physical processes driving Mrk 421’s variability, underscoring the interplay of particle acceleration and synchrotron emission in blazar jets. Our findings pave the way for further studies to refine models of relativistic jet dynamics and their observational signatures.
Author Contributions
G. Bhatta served as the main author, while E. Bhatta primarily contributed to data processing, writing code, and assisting with manuscript editing. Both the authors have read and agreed to the published version of the manuscript.
Funding
This work was partially supported by a program of the Polish Ministry of Science under the title ‘Regional Excellence Initiative’, project no. RID/SP/0050/2024/1.
Data Availability Statement
The data that support the findings of this study are openly available in the NuSTAR Master Catalog (NUMASTER) at https://heasarc.gsfc.nasa.gov/w3browse/all/numaster.html. This catalog contains processed and validated NuSTAR observations, including cleaned science-quality event files and associated data products that were used in our analysis.
Conflicts of Interest
The authors declare no conflicts of interest.
Abbreviations
The following abbreviations are used in this manuscript:
| AGN | Active Galactic Nucleus |
| BL Lacertae | BL Lac |
| BPL | Broken Power Law |
| FV | Fractional Variability |
| MWL | Multi-Wavelength |
| RMS | Root Mean Square |
| LP | Log-Parabola |
| PL | Power Law |
| TeV | Teraelectronvolt |
| VLBI | Very Long Baseline Interferometry |
| VHE | Very High Energy |
References
- Meier, D. L. Black Hole Astrophysics: The Engine Paradigm, Springer, Verlag Berlin Heidelberg, 2012.
- Urry, C.M.; Padovani, P. Unified Schemes for Radio-Loud Active Galactic Nuclei. Publ. Astron. Soc. Pac. 1995, 107, 803. [Google Scholar] [CrossRef]
- Blandford, R.; Meier, D.; Readhead, A. Relativistic Jets from Active Galactic Nuclei. Annu. Rev. Astron. Astrophys. 2019, 57, 467–509. [Google Scholar] [CrossRef]
- Maraschi, L., Ghisellini, G., & Celotti, A. A jet model for the gamma-ray emitting blazar 3C 279. ApJL 1992, 397, L5.
- Bloom, S. D., & Marscher, A. P. An Analysis of the Synchrotron Self-Compton Model for the Multi–Wave Band Spectra of Blazars. ApJ 1996, 461, 657.
- Dermer, C. D., & Schlickeiser, R. Thermal Comptonization Model for the High Energy Emission of Seyfert Active Galactic Nuclei. ApJ 1993, 416, 458.
- Sikora, M. High-energy radiation from active galactic nuclei. ApJS 1994, 90, 923. [Google Scholar] [CrossRef]
- Błażejowski, M., Sikora, M., Moderski, R., & Madejski, G.M. Comptonization of Infrared Radiation from Hot Dust by Relativistic Jets in Quasars. ApJ 2000, 545, 107. [CrossRef]
- Mannheim, K.; Biermann, P.L. Gamma-ray flaring of 3C 279 - A proton-initiated cascade in the jet? A&A 1992, 253, L21. [Google Scholar]
- Aharonian, F. A. TeV gamma rays from BL Lac objects due to synchrotron radiation of extremely high energy protons. New Astron. 2000, 5, 377. [Google Scholar] [CrossRef]
- Mücke, A., Protheroe, R. J., Engel, R., Rachen, J. P., & Stanev, T. BL Lac objects in the synchrotron proton blazar model. Astroparticle Physics 2003, 18, 593.
- Bhatta, G.,Mohorian,M., & Bilinsky,I. Hard X-ray properties of NuSTAR blazars. A&A 2018, 619, A93.
- Abdo, A.A.; Ackermann, M.; Ajello, M.; Antolini, E.; Baldini, L.; Ballet, J.; Barbiellini, G.; Bastieri, D.; Bechtol, K.; Bellazzini, R.; et al. Gamma-ray Light Curves and Variability of Bright Fermi-detected Blazars. Astrophys. J. 2010, 722, 520–542. [Google Scholar] [CrossRef]
- Bhatta, G., Zola, S., Drozdz, M., et al. Catching profound optical flares in blazars. MNRAS 2023, 520, 2633–2643. [CrossRef]
- Bhatta, G. Blazar Mrk 501 shows rhythmic oscillations in its γ-ray emission. MNRAS 2019, 487, 3990–3997. [Google Scholar] [CrossRef]
- Bhatta, G. Radio and γ-Ray Variability in the BL Lac PKS 0219–164: Detection of Quasi-periodic Oscillations in the Radio Light Curve. ApJ 2017, 847, 7. [Google Scholar] [CrossRef]
- Gupta, A. Multi-Wavelength Intra-Day Variability and Quasi-Periodic Oscillation in Blazars. Galaxies 2018, 6, 1. [Google Scholar] [CrossRef]
- Bhatta, G., Zola, S., Stawarz, Ł., et al. Detection of Possible Quasi-periodic Oscillations in the Long-term Optical Light Curve of the BL Lac Object OJ 287. ApJ 2016, 832, 47. [CrossRef]
- MAGIC Collaboration, Abe, K., Abe, S., et al. Insights from the first flaring activity of a high synchrotron peaked blazar with X-ray polarization and VHE gamma rays. A&A 2025, 695, A217.
- Abe, K., Abe, S., Abhir, J., et al. Characterization of Markarian 421 during its most violent year: Multiwavelength variability and correlations. A&A 2025, 694, A195.
- Markowitz, A.G., Nalewajko, K., Bhatta, G., et al. Rapid X-ray variability in Mkn 421 during a multiwavelength campaign. MNRAS 2022, 513, 1662–1679. [CrossRef]
- Baloković, M., Paneque, D., Madejski, G., et al. Multiwavelength Study of Quiescent States of Mrk 421 with Unprecedented Hard X-Ray Coverage Provided by NuSTAR in 2013. ApJ 2016, 819, 156. [CrossRef]
- Abdo, A.A.; Ackermann, M.; Ajello, M.; et al. Fermi Large Area Telescope Observations of Markarian 421: The Missing Piece of its Spectral Energy Distribution. ApJ 2011, 736, 131. [Google Scholar] [CrossRef]
- Błażejowski, M.; Blaylock, G.; Bond, I.H.; et al. A Multiwavelength View of the TeV Blazar Markarian 421: Correlated Variability, Flaring, and Spectral Evolution. ApJ 2005, 630, 130–141. [Google Scholar] [CrossRef]
- Fossati, G.; Buckley, J.H.; Bond, I.H.; et al. Multiwavelength Observations of Markarian 421 in 2001 March: An Unprecedented View on the X-Ray/TeV Correlated Variability. ApJ 2008, 677, 906–925. [Google Scholar] [CrossRef]
- Takahashi, T.; et al. Correlated Variability of the X-Ray and TeV Gamma-Ray Emission from Markarian 421. ApJ 1996, 470, L89–L92. [Google Scholar] [CrossRef]
- Maraschi, L.; Fossati, G.; Tavecchio, F.; et al. Simultaneous X-Ray and TEV Observations of a Rapid Flare from Markarian 421. ApJL 1999, 526, L81–L84. [Google Scholar] [CrossRef] [PubMed]
- Brinkmann, W., Papadakis, I.E., den Herder, J.W.A., & Haberl, F. Temporal variability of Mrk 421 from XMM-Newton observations. A&A 2003, 402, 929–947.
- Brinkmann, W., Papadakis, I.E., Raeth,C., Mimica,P., & Haberl, F. XMM-Newton timing mode observations of MrkLET mode observations of Mrk 421. A&A 2005, 443, 397–411.
- Tramacere, A., Giommi, P., Perri, M., Verrecchia, F., & Tosti, G. Swift observations of the very intense flaring activity of Mrk 421 during 2006. I. Phenomenological picture of electron acceleration and predictions for MeV/GeV emission. A&A 2009, 501, 879–898.
- Isobe, N., Sugimori, K., Kawai, N., et al. Bright X-Ray Flares from the BL Lac Object Markarian 421, Detected with MAXI in 2010 January and February. PASJ 2010, 62, L55. [CrossRef]
- Pian, E., Türler, M., Fiocchi, M., et al. An active state of the BL Lacertae object Markarian 421 detected by INTEGRAL in April 2013. A&A 2014, 570, A77.
- Kataoka, J., & Stawarz, Ł. Inverse Compton X-Ray Emission from TeV Blazar Mrk 421 During a Historical Low-flux State Observed with NuSTAR. ApJ 2016, 827, 55.
- Akbar, S., Shah, Z., Misra, R., Iqbal, N., & Tantry, J. Probing spectral evolution and intrinsic variability of Mkn 421: A multi-epoch AstroSat study of X-ray spectra. JHEAp 2025, 45, 438–455. [CrossRef]
- Kapanadze, B., Dorner, D., Vercellone, S., et al. X-Ray Flaring Activity of MRK 421 in the First Half of 2013. ApJ 2016, 831, 102. [CrossRef]
- Pandey, A., Gupta, A.C., & Wiita, P.J. X-Ray Intraday Variability of Five TeV Blazars with NuSTAR. ApJ 2017, 841, 123. [CrossRef]
- Noel, A. P., Gaur, H., Gupta, A. C., et al. X-Ray Intraday Variability of the TeV Blazar Markarian 421 with XMM-Newton. ApJS 2022, 262, 4. [CrossRef]
- Brinkmann, W., Sembay, S., Griffiths, R.G., et al. XMM-Newton observations of Markarian 421. A&A 2001, 365, L162–L167.
- Nicastro, F., Mathur, S., Elvis, M., et al. Chandra Detection of the First X-Ray Forest along the Line of Sight To Markarian 421. ApJ 2005, 629, 700–718. [CrossRef]
- Kaastra, J. S., Werner, N., Herder, J. W. A. den, et al. The O VII X-Ray Forest toward Markarian 421: Consistency between XMM-Newton and Chandra. ApJ 2006, 652, 189–197. [CrossRef]
- Ravasio, M., Tagliaferri, G., Ghisellini, G., & Tavecchio,F. Observing Mkn 421 with XMM-Newton: The EPIC-PN point of view. A&A 2004, 424, 841–855.
- Khatoon, R., et al. Correlations between X-ray spectral parameters of Mkn 421 using long-term Swift-XRT data. MNRAS 2022, 515, 3749–3759. [CrossRef]
- Di Gesu, L., Donnarumma, I., Tavecchio, F., et al. The X-Ray Polarization View of Mrk 421 in an Average Flux State as Observed by the Imaging X-Ray Polarimetry Explorer. ApJL 2022, 938, L7. [CrossRef]
- Harrison, F. A., Craig, W. W., Christensen, F. E., et al. The Nuclear Spectroscopic Telescope Array (NuSTAR) High-energy X-Ray Mission. ApJ 2013, 770, 103. [CrossRef]
- Paliya, V. S., Böttcher, M., Diltz, C., et al. The Violent Hard X-Ray Variability of Mrk 421 Observed by NuSTAR in 2013 April. ApJ 2015, 811, 143. [CrossRef]
- Edelson, R., Turner, T. J., Pounds, K., et al. X-Ray Spectral Variability and Rapid Variability of the Soft X-Ray Spectrum Seyfert 1 Galaxies Arakelian 564 and Ton S180. ApJ 2002, 568, 610–626. [CrossRef]
- Nandra, K., George, I.M., Mushotzky, R.F., Turner, T.J., & Yaqoob, T. ASCA Observations of Seyfert 1 Galaxies. I. Data Analysis, Imaging, and Timing. ApJ 1997, 476, 70–82. [CrossRef]
- Edelson, R.A., Krolik, J.H., & Pike, G.F. Broad-Band Properties of the CfA Seyfert Galaxies. III. Ultraviolet Variability. ApJ 1990, 359, 86. [CrossRef]
- Vaughan, S., Edelson, R., Warwick, R.S., & Uttley, P. On characterizing the variability properties of X-ray light curves from active galaxies. MNRAS 2003, 345, 1271–1284. [CrossRef]
- Aleksić, J., Ansoldi, S., Antonelli, L.A., et al. The 2009 multiwavelength campaign on Mrk 421: Variability and correlation studies. A&A 2015, 576, A126.
- Bhatta, G.; Webb, J. Microvariability in BL Lacertae: “Zooming” into the Innermost Blazar Regions. Galaxies 2018, 6, 2. [Google Scholar] [CrossRef]
- Miller, H.R., Carini, M.T., & Goodrich, B.D. Rapid variability in the optical polarization of the BL Lacertae object OJ 287. Natur 1989, 337, 627–629. [CrossRef]
- Pininti, V.R., Bhatta,G., Paul,S., et al. Exploring short-term optical variability of blazars using TESS. MNRAS 2023, 518, 1459–1471. [CrossRef]
- Dinesh, A., Bhatta, G., Adhikari, T. P., et al. Constraining X-Ray Variability of the Blazar 3C 273 Using XMM-Newton Observations over Two Decades. ApJ 2023, 955, 121. [CrossRef]
- Bhatta, G., Chaudhary, S.C., Dhital,N., et al. Probing X-Ray Timing and Spectral Variability in the Blazar PKS 2155–304 over a Decade of XMM-Newton Observations. ApJ 2025, 981, 118. [CrossRef]
- Uttley, P., McHardy, I.M., & Vaughan, S. Non-linear X-ray variability in X-ray binaries and active galaxies. MNRAS 2005, 359, 345–362. [CrossRef]
- Gleissner, T., Wilms, J., Pottschmidt, K., et al. Long term variability of Cyg X-1. II. The rms-flux relation. A&A 2004, 414, 1091–1104.
- Heil, L.M., Vaughan, S., & Uttley, P. The ubiquity of the rms-flux relation in black hole X-ray binaries. MNRAS 2012, 422, 2620–2631. [CrossRef]
- Wang, N., Yi, T.-F., Wang, L., et al. Comprehensive Study of the Blazars from Fermi-LAT LCR: The Log-Normal Flux Distribution and Linear rms-Flux Relation. RAA 2023, 23, 115011. [CrossRef]
- Bhatta, G.; Dhital, N. The Nature of γ-Ray Variability in Blazars. Astrophys. J. 2020, 891, 120. [Google Scholar] [CrossRef]
- Kushwaha, P., Sinha, A., Misra, R., Singh, K.P., & de Gouveia Dal Pino, E.M. Gamma-Ray Flux Distribution and Nonlinear Behavior of Four LAT Bright AGNs. ApJ 2017, 849, 138. [CrossRef]
- Bhattacharyya, J., Ghosh, R., Chatterjee, R., & Das, N. Blazar Variability: A Study of Nonstationarity and the Flux-Rms Relation. ApJ 2020, 897, 25. [CrossRef]
- Bhatta, G. Characterizing Long-term Optical Variability Properties of γ-Ray-bright Blazars. ApJ 2021, 910, 110. [Google Scholar] [CrossRef]
- Kapanadze, B., Gurchumelia, A., Dorner, D., et al. Swift Observations of Mrk 421 in Selected Epochs. III. Extreme X-Ray Timing/Spectral Properties and Multiwavelength Lognormality during 2015 December–2018 April. ApJS 2020, 247, 27. [CrossRef]
- Wani, K.; Gaur, H. Study of Intra-Day Flux Distributions of Blazars Using XMM-Newton Satellite. Univ 2022, 8, 578. [Google Scholar] [CrossRef]
- Shah, Z., Mankuzhiyil, N., Sinha, A., et al. Log-normal flux distribution of bright Fermi blazars. RAA 2018, 18, 141. [CrossRef]
- Gokus, A., Wilms, J., Kadler, M., et al. Rapid variability of Markarian 421 during extreme flaring as seen through the eyes of XMM-Newton. MNRAS 2024, 529, 1450–1462. [CrossRef]
- Kapanadze, B., Vercellone, S., Romano, P., et al. Swift Observations of Mrk 421 in Selected Epochs. I. The Spectral and Flux Variability in 2005–2008. ApJ 2018, 854, 66. [CrossRef]
- Aggrawal, V., Pandey, A., Gupta, A.C., et al. X-ray intraday variability of the TeV blazar Mrk 421 with Chandra. MNRAS 2018, 480, 4873–4883. [CrossRef]
- Pandey, A., Gupta, A.C., & Wiita, P.J. Multi-wavelength variability of the blazar PKS 0208–512: synchrotron peak shift and harmonic variability. MNRAS 2018, 481, 3563–3574.
- Gupta, A. C. X-ray Flux and Spectral Variability of the TeV Blazars Mrk 421 and PKS 2155–304. Galax 2020, 8, 64. [Google Scholar] [CrossRef]
- Arnaud, K. A. XSPEC: The First Ten Years. ASP Conf. Ser. 1996, 101, 17. [Google Scholar]
- Wilms, J., Allen, A., & McCray, R. On the Absorption of X-Rays in the Interstellar Medium. ApJ 2000, 542, 914–924. [CrossRef]
- Kalberla, P.M.W., Burton, W.B., Hartmann, D., et al. The Leiden/Argentine/Bonn (LAB) Survey of Galactic HI. A&A 2005, 440, 775–782.
- HI4PI Collaboration, Ben Bekhti, N., Flöer, L., et al. HI4PI: A full-sky H I survey based on EBHIS and GASS. A&A 2016, 594, A116.
- Massaro, E., Perri, M., Giommi,P., & Nesci, R. Log-parabolic spectra and the 3C 273 jet. A&A 2004, 413, 489–495.
- Tanihata, C., Kataoka, J., Takahashi, T., & Madejski, G.M. Evolution of the Synchrotron Spectrum in Markarian 421 during the 1998 Campaign. ApJ 2004, 601, 759–770. [CrossRef]
- Wang, Y., Zhu, S., Xue, Y., et al. X-Ray Spectral Variations of Synchrotron Peak in BL Lacs. ApJ 2019, 885, 8. [CrossRef]
- Massaro, E., Perri, M., Giommi, P., Nesci, R., & Verrecchia, F. Log-parabolic spectra and particle acceleration in blazars. II. The BeppoSAX wide band X-ray spectra of Mkn 501. A&A 2004, 422, 103–111.
- Katarzyński, K., Ghisellini, G., Tavecchio, F., et al. Correlation between the TeV and X-ray emission in high-energy peaked BL Lac objects. A&A 2005, 433, 479–496.
- Cerruti, M., Zech, A., Boisson, C., et al. Leptohadronic single-zone models for the electromagnetic and neutrino emission of TXS 0506+056. MNRAS 2019, 483, L12–L16. [CrossRef]
- Petropoulou, M.; Mastichiadis, A. Bethe-Heitler emission in BL Lacs: filling the gap between X-rays and γ-rays. MNRAS 2015, 447, 36–48. [Google Scholar] [CrossRef]
- Gaskell, C. M. Lognormal X-Ray Flux Variations in an Extreme Narrow-Line Seyfert 1 Galaxy. ApJL 2004, 612, L21–L24. [Google Scholar] [CrossRef]
- Kundu, A., Chatterjee, R., Mitra, K., & Mondal, S. rms-flux relation and disc-jet connection in blazars in the context of the internal shocks model. MNRAS 2022, 510, 3688–3700. [CrossRef]
- Giebels, B.; Degrange, B. Lognormal variability in BL Lacertae. A&A 2009, 503, 797–799. [Google Scholar]
| 1 |
Figure 1.
Upper panel: Long-term light curve of Mrk 421 using NuSTAR hard X-ray (3-79 keV) observations from 2012 to 2024. Time labels on the X-axis correspond to the chronological order provided in Table 1. The shaded region represents the observational period from 2013-04-02 to 2013-04-19, a period of 17 days. Lower panel: To highlight the variability in the lower flux states, the same light curve is presented with Y-axis (count rate) set to logarithmic scale.
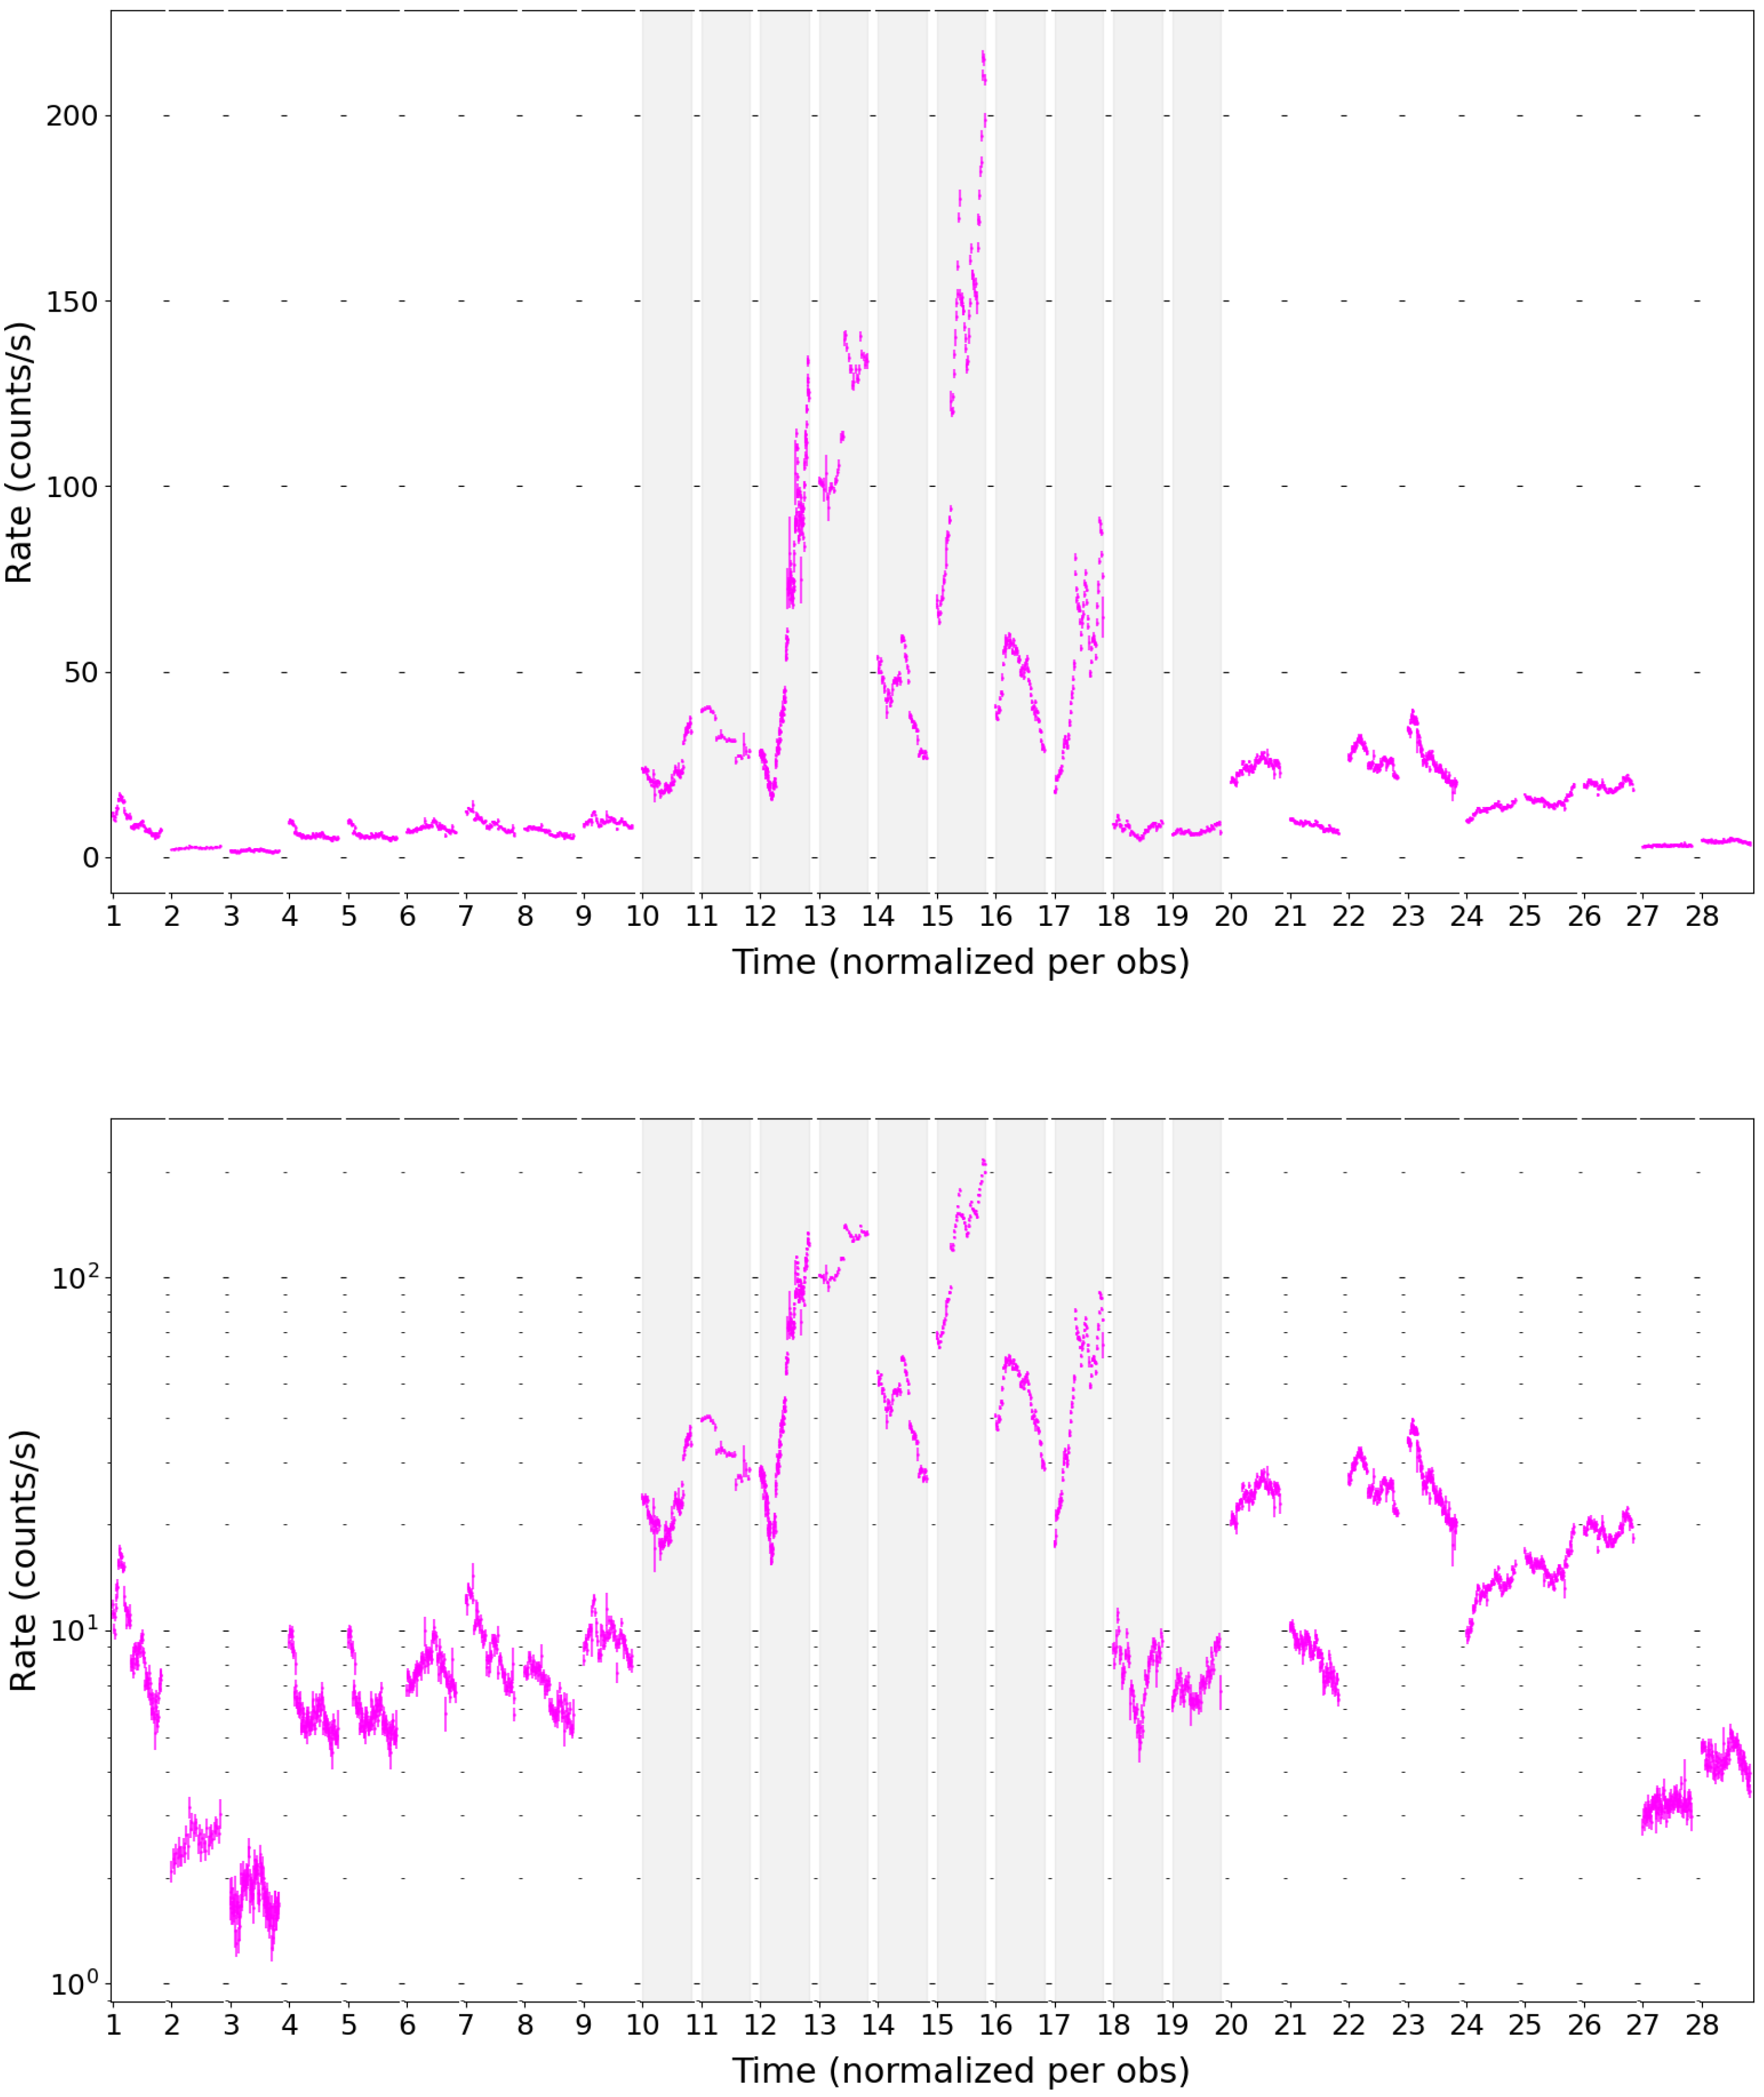
Figure 2.
RMS values are plotted against mean count rates of all 28 NuSTAR observations of blazar Mrk 421. The red dashed line represents the best-fit line.
Figure 2.
RMS values are plotted against mean count rates of all 28 NuSTAR observations of blazar Mrk 421. The red dashed line represents the best-fit line.
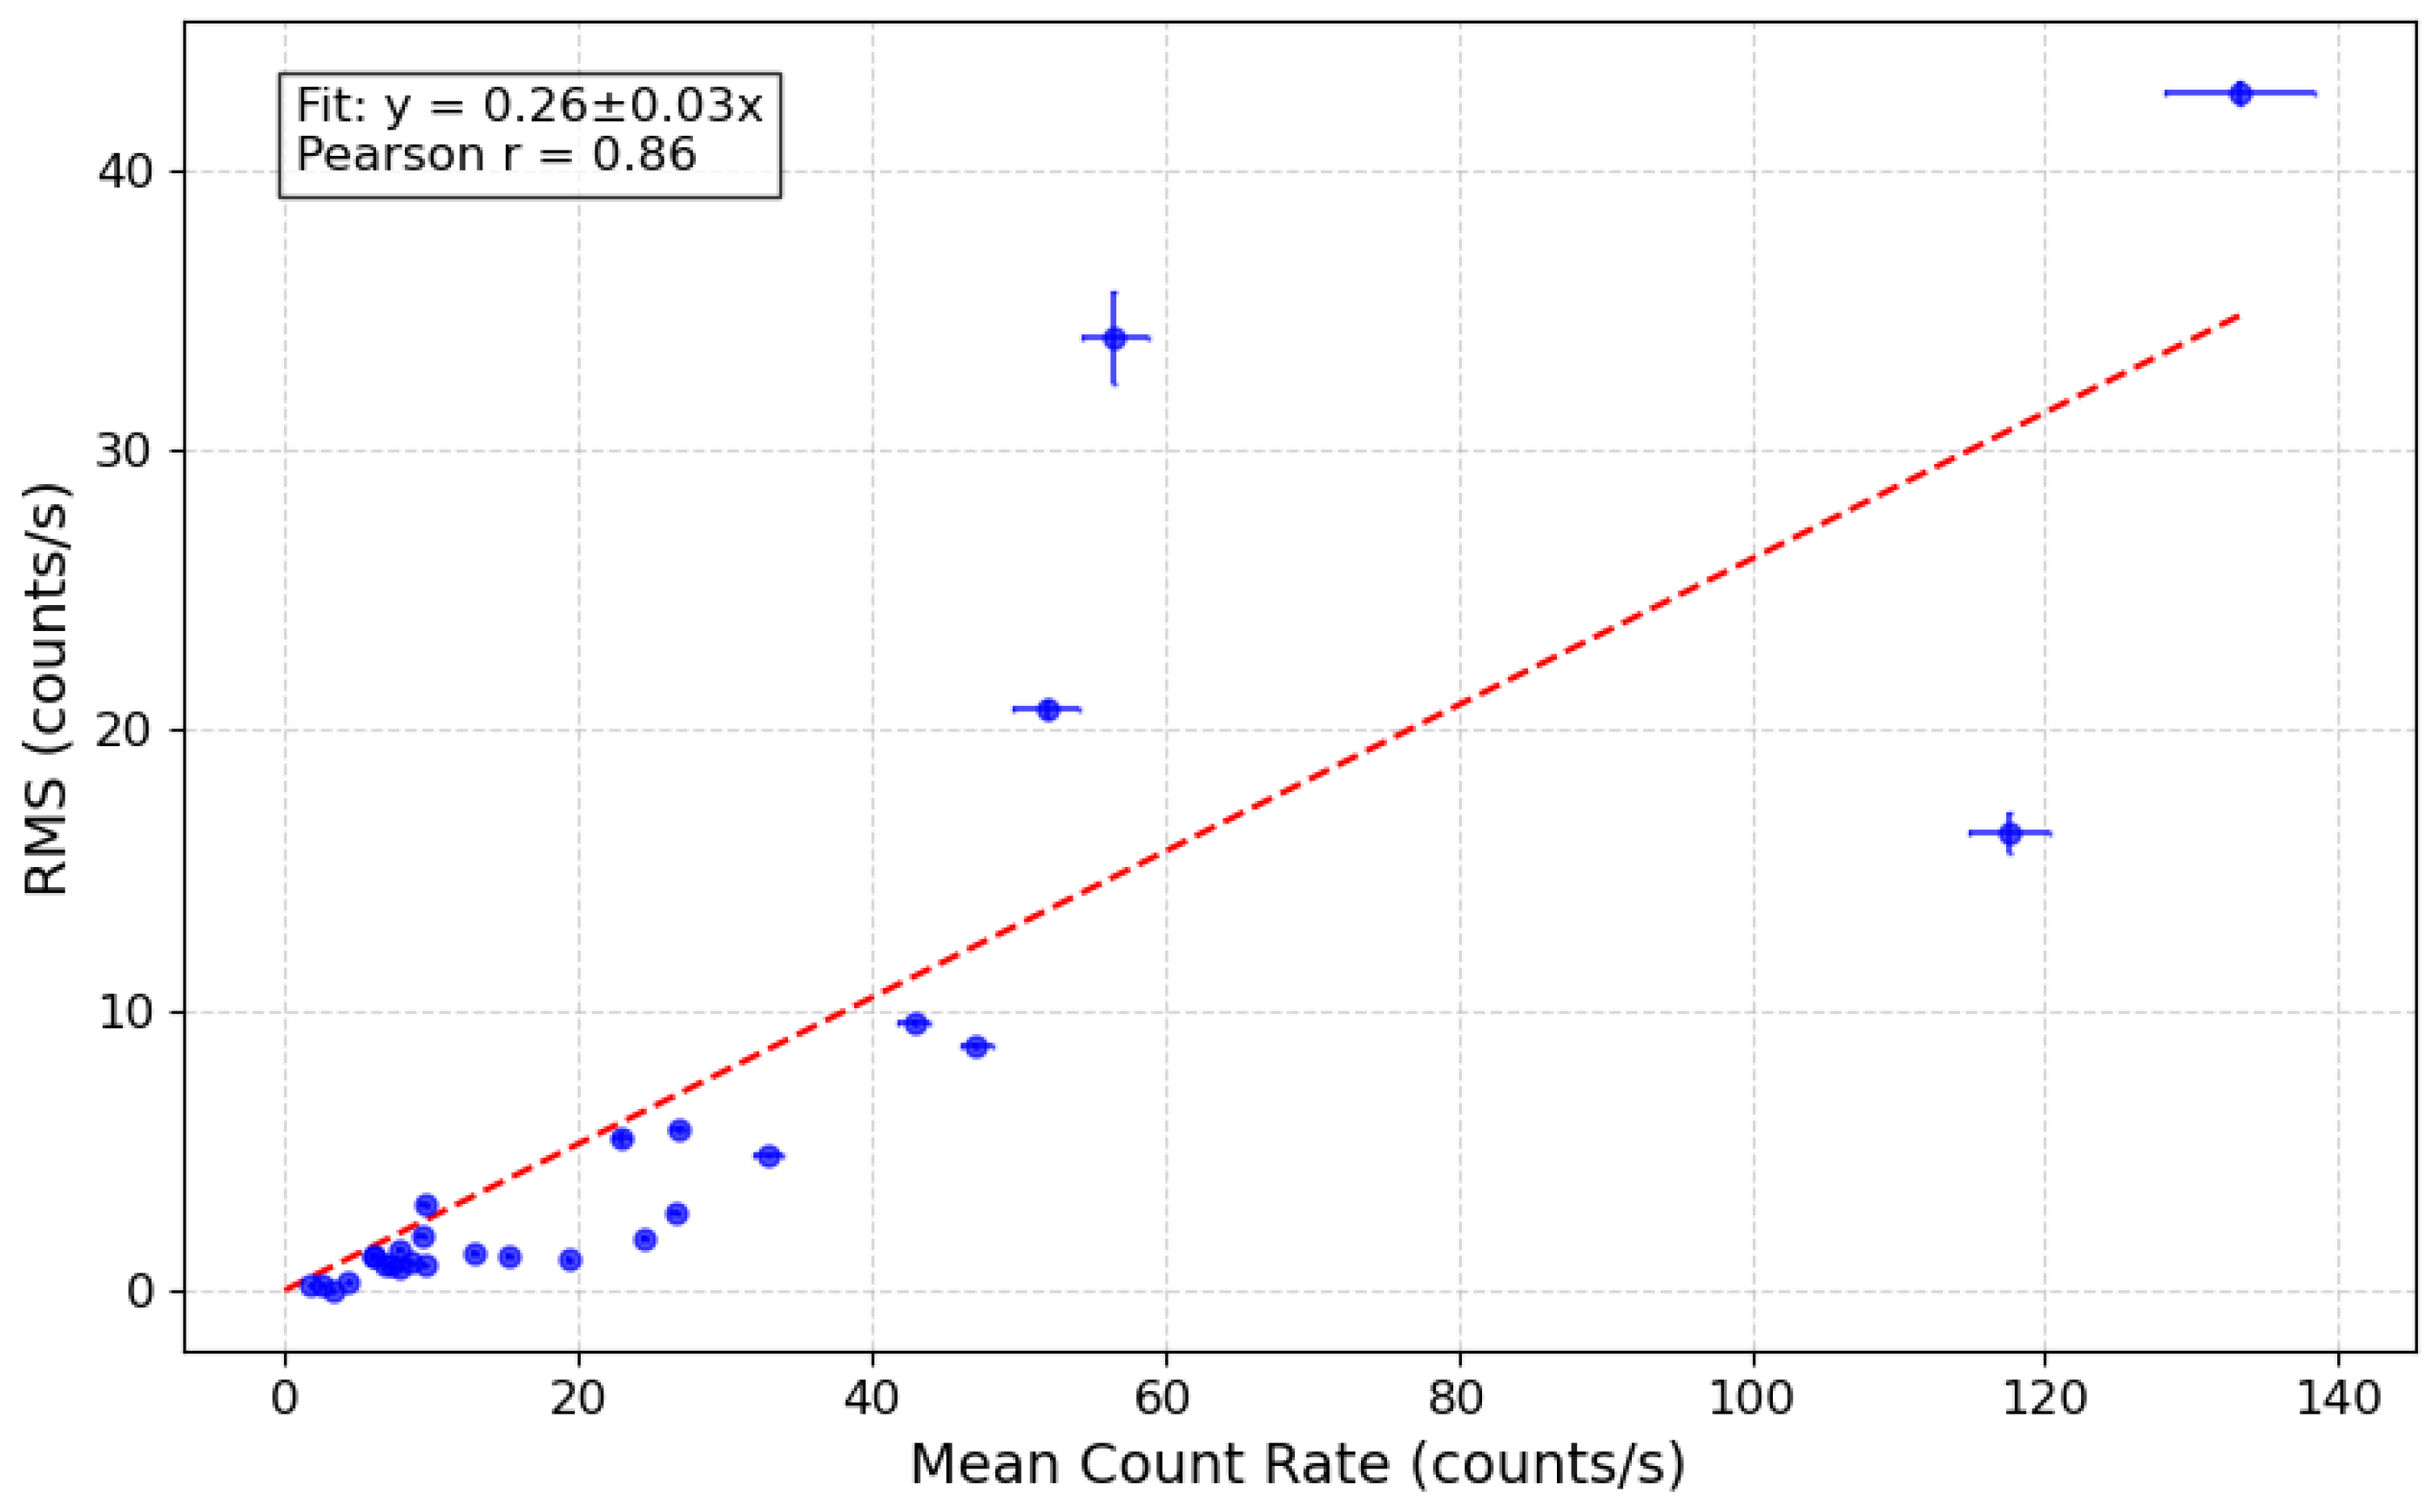
Figure 3.
Histogram of the count rate distribution for all 28 NuSTAR light curves of Mrk 421, fitted with normal (magenta) and lognormal (green) probability density functions (PDFs). The inset text box provides the values and degrees of freedom from the fit statistics for each distribution.
Figure 3.
Histogram of the count rate distribution for all 28 NuSTAR light curves of Mrk 421, fitted with normal (magenta) and lognormal (green) probability density functions (PDFs). The inset text box provides the values and degrees of freedom from the fit statistics for each distribution.
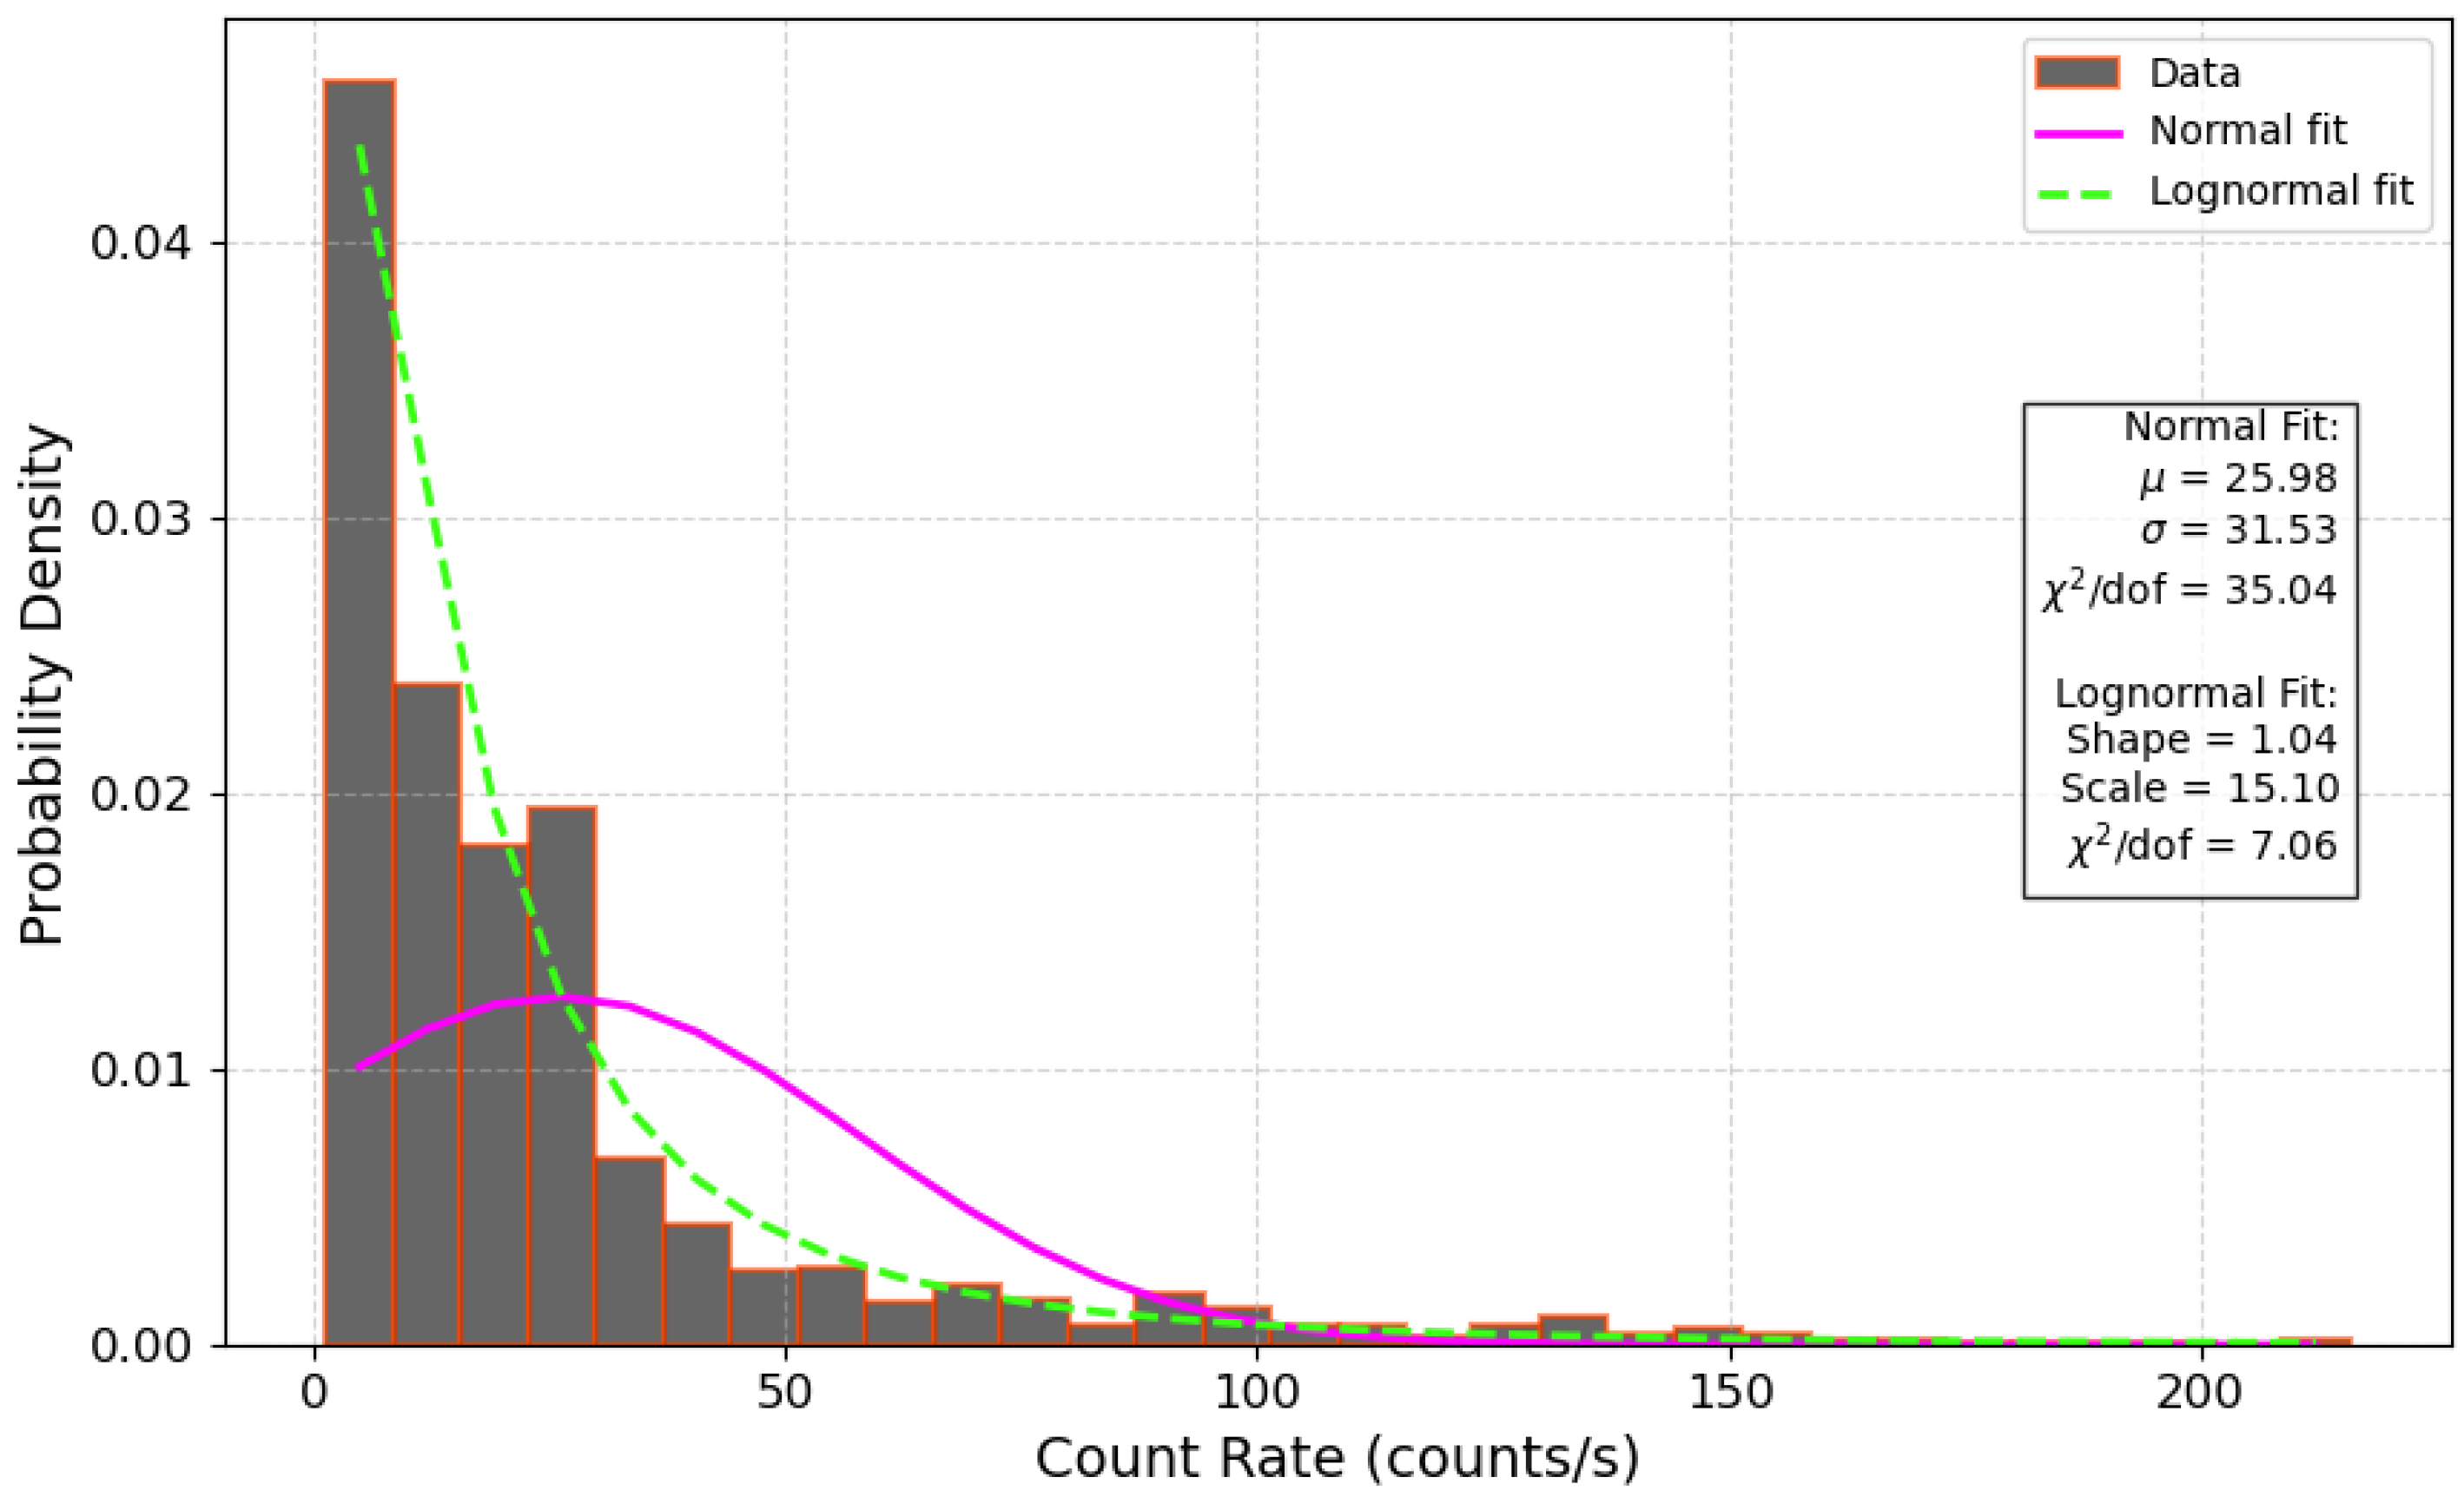
Figure 4.
Left panel: Correlation between the NuSTAR low-energy (3–10 keV) and high-energy (10–79 keV) count rates of Mrk 421, with the dashed red line indicating the relation. Right panel: Distribution of the hardness ratio ( defined by Equation 7) as a function of count rate across the entire observation period, with distinct colors representing different observational epochs.
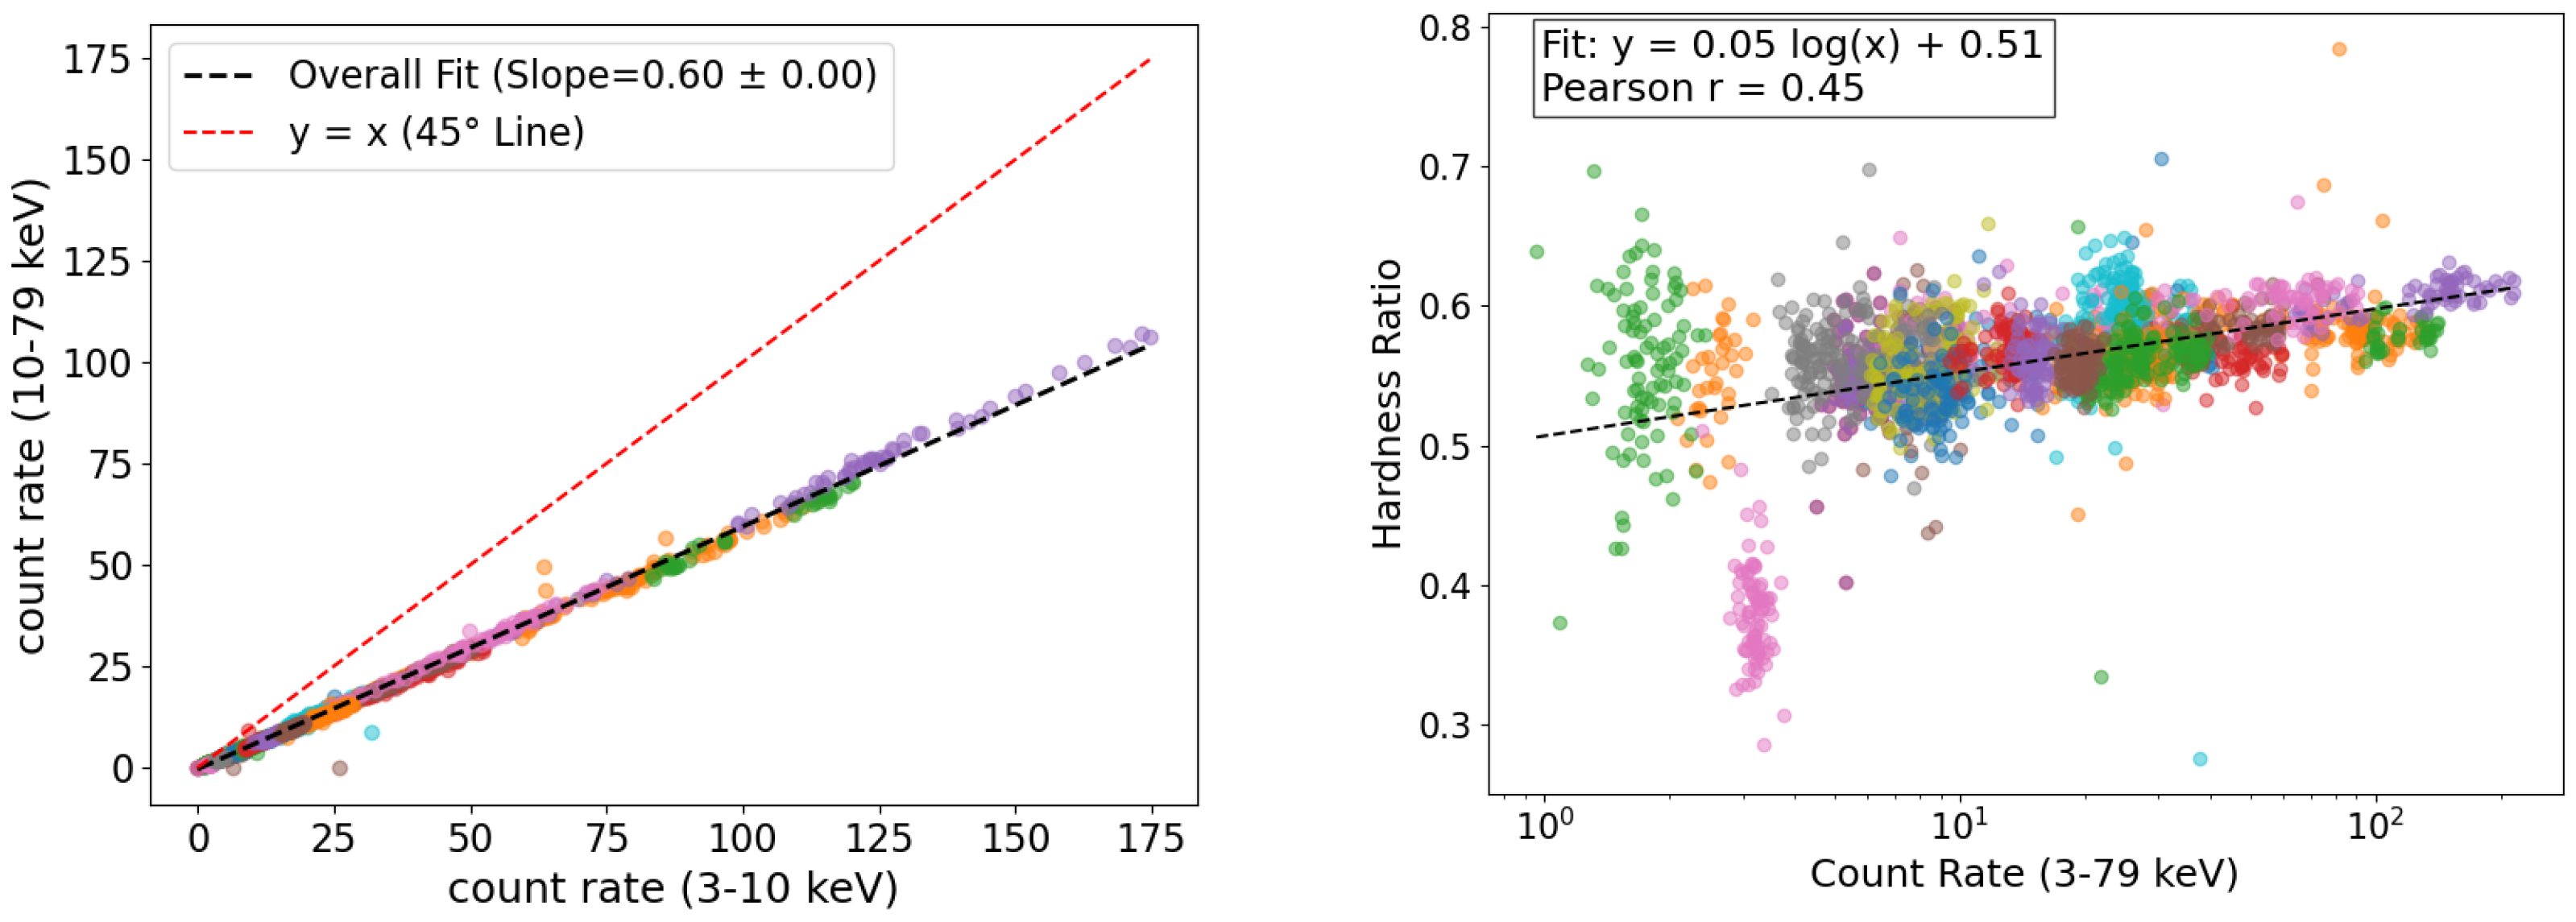
Figure 5.
Spectral fitting of NuSTAR observations for the lowest (left panel) and highest (right panel) flux states. The spectra were fitted using three XSPEC models: power-law (PL), broken power-law (BPL), and log-parabolic (LP). Among these, the log-parabolic model provides the best fit for both flux states. The ratio plot in the bottom section of the left panel reveals a hard excess during the low flux state at ∼ 20 keV.
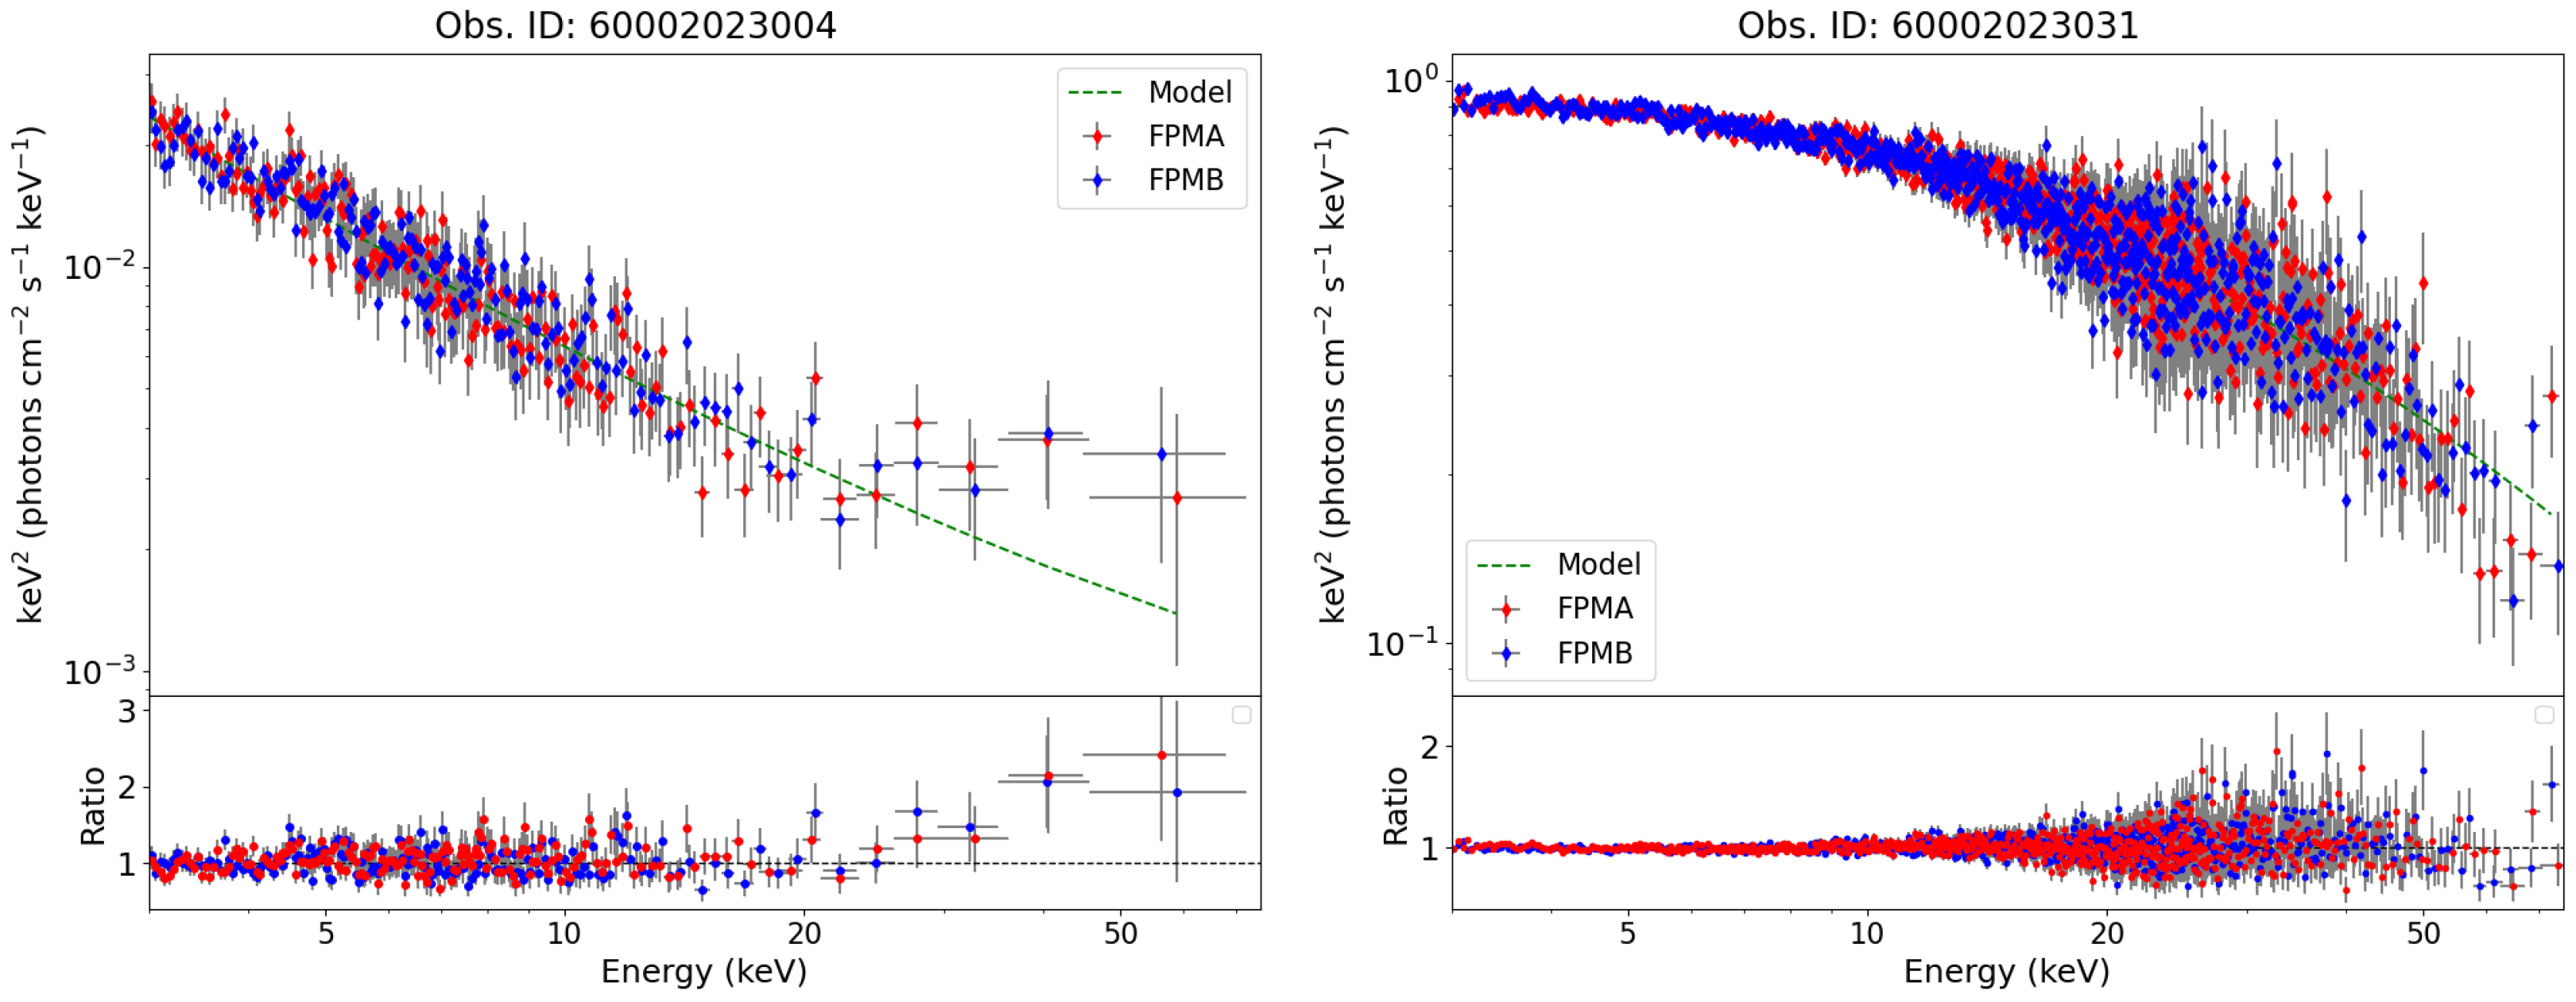
Figure 6.
Correlations between spectral parameters from Table 2 and mean count rates from Table 1, with linear fit parameters and Pearson’s correlation coefficients provided in the inset text. The top left panel shows a strong correlation between the photon index from the power-law (PL) model and the logarithmic mean count rate, indicating a “harder-when-brighter” trend. The top right panel reveals a strong correlation between the photon index and the curvature parameter from the log-parabolic (LP) model, with negative curvature values suggesting a hard excess in the lowest flux states. The bottom left panel displays a strong positive correlation between the peak energy of the LP model and the flux state, indicating that the peak shifts to higher frequencies as the source brightens. The bottom right panel shows no significant correlation between the curvature parameter and the LP peak energy based on the linear fit.
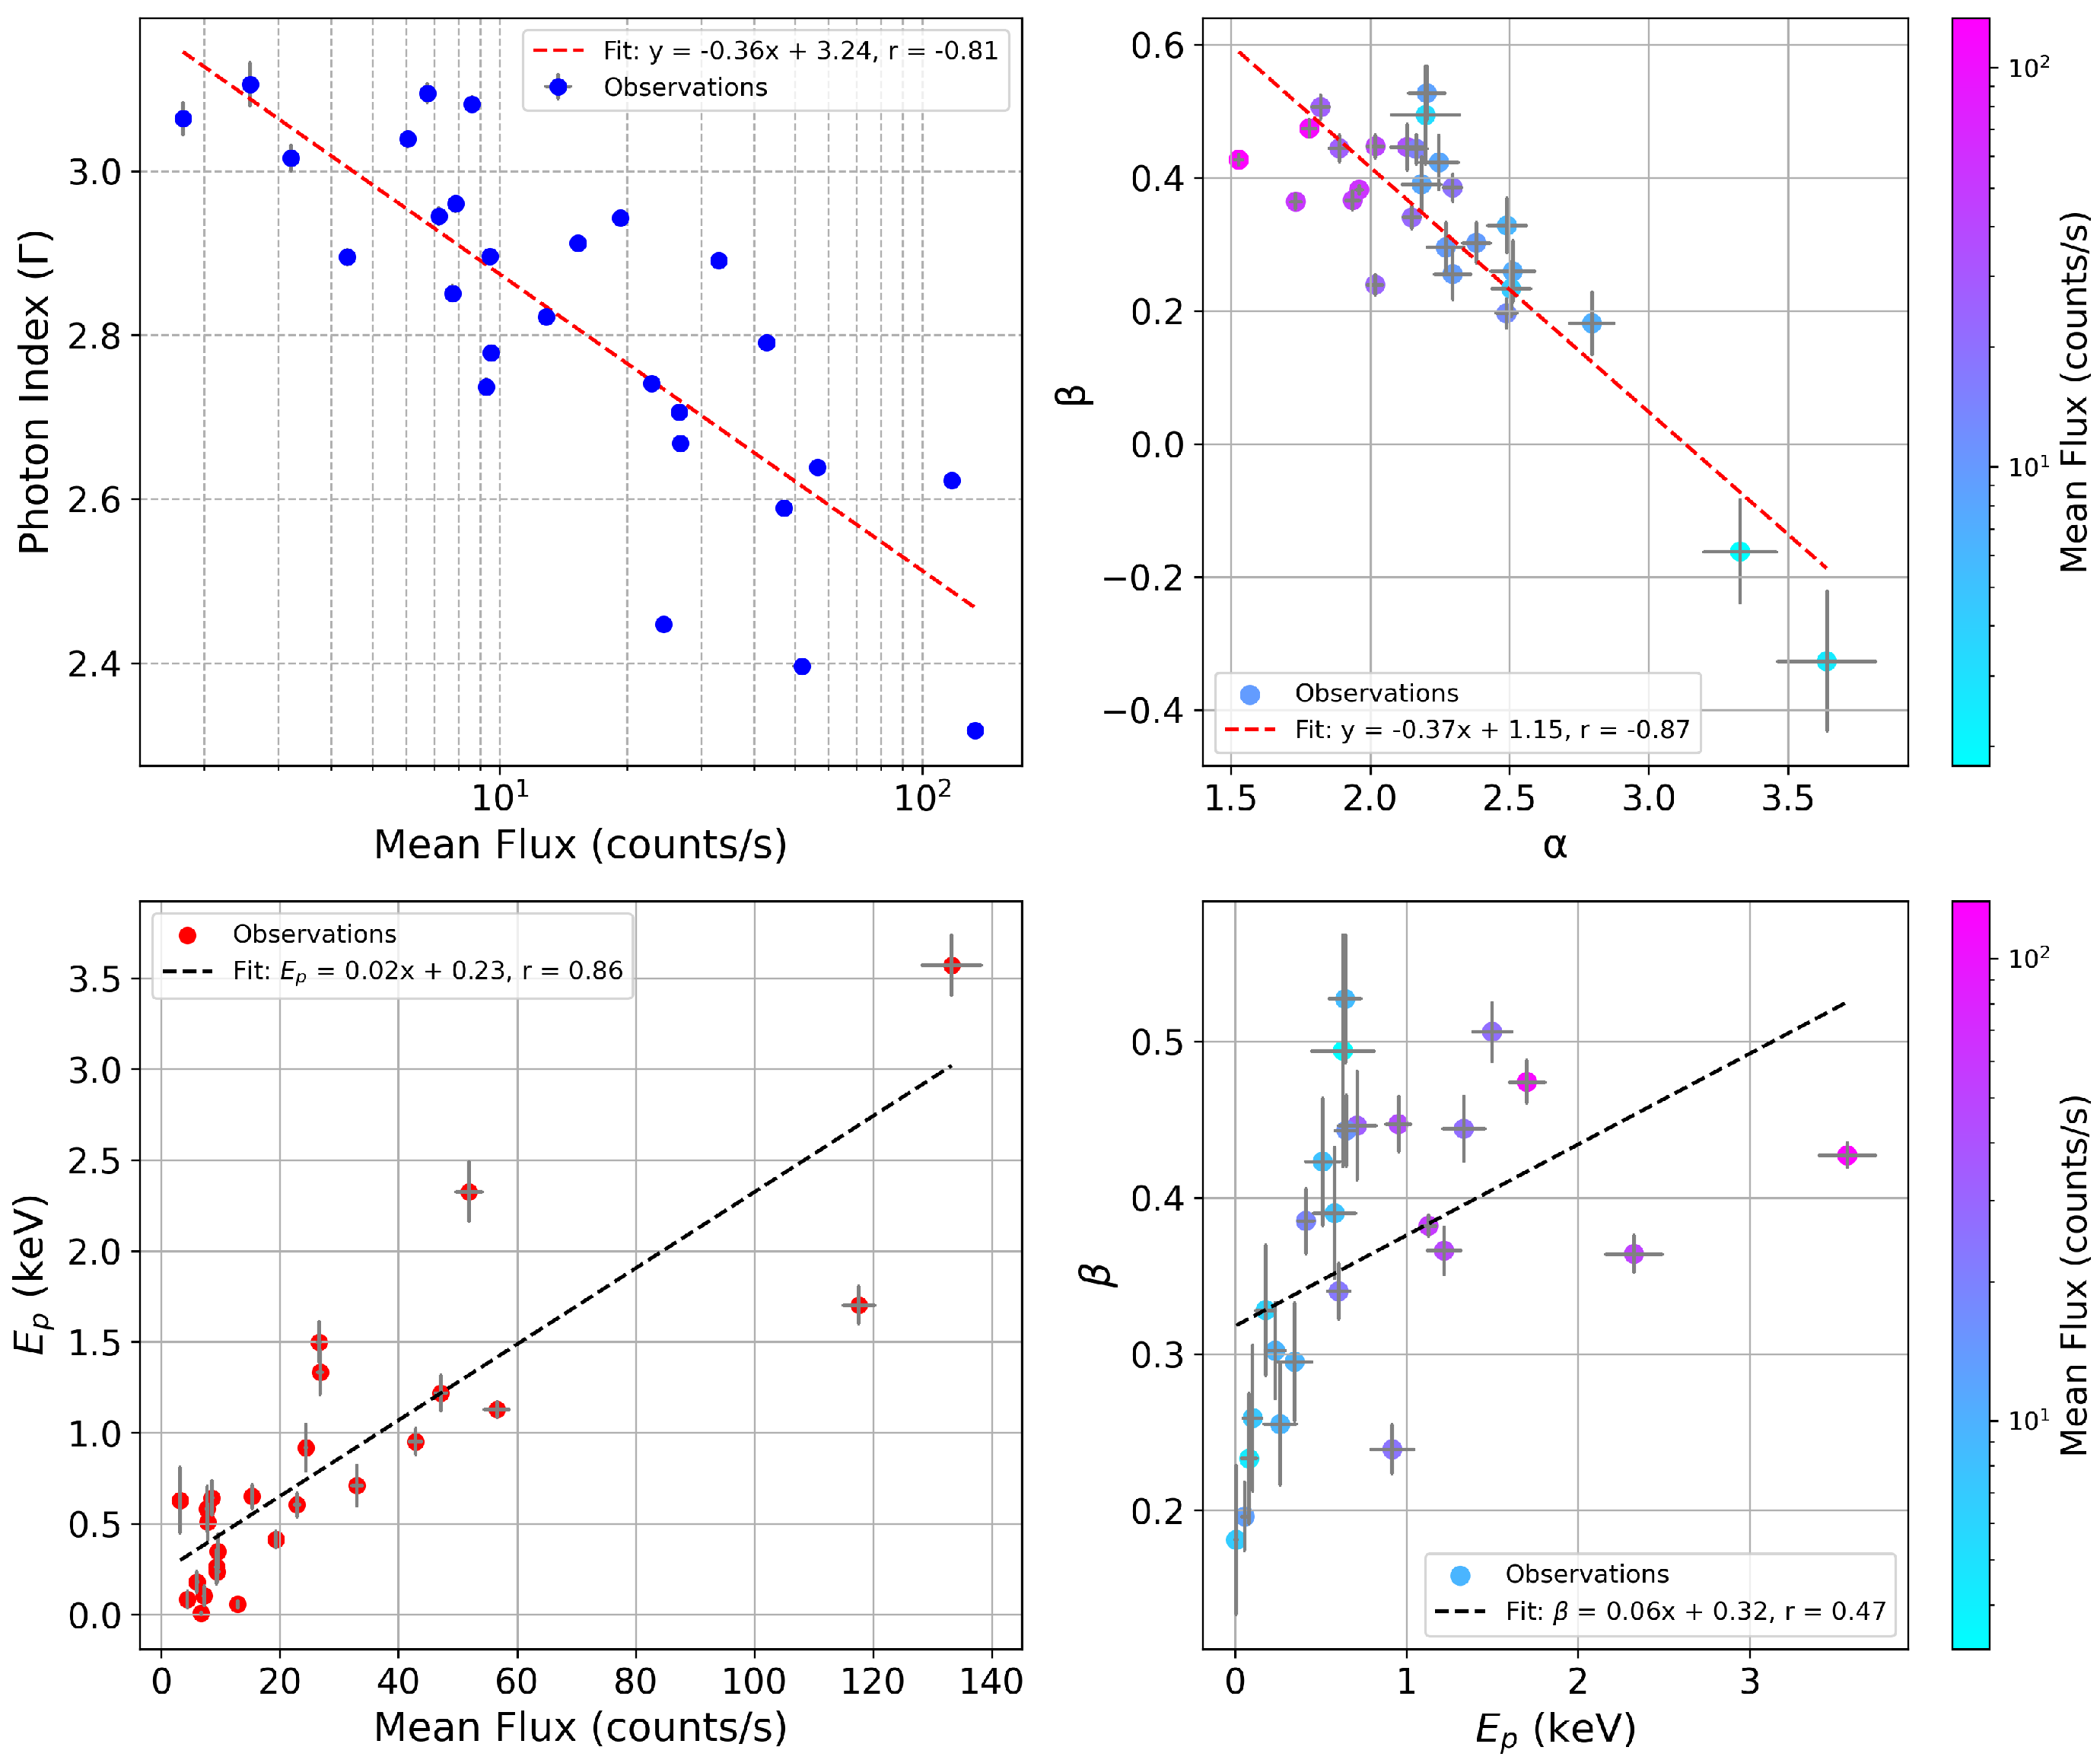
Figure 7.
Distribution of fractional variability as a function of photon indices derived from power-law spectral fitting of NuSTAR observations of Mrk 421. The red dashed line represents the linear fit to the data.
Figure 7.
Distribution of fractional variability as a function of photon indices derived from power-law spectral fitting of NuSTAR observations of Mrk 421. The red dashed line represents the linear fit to the data.
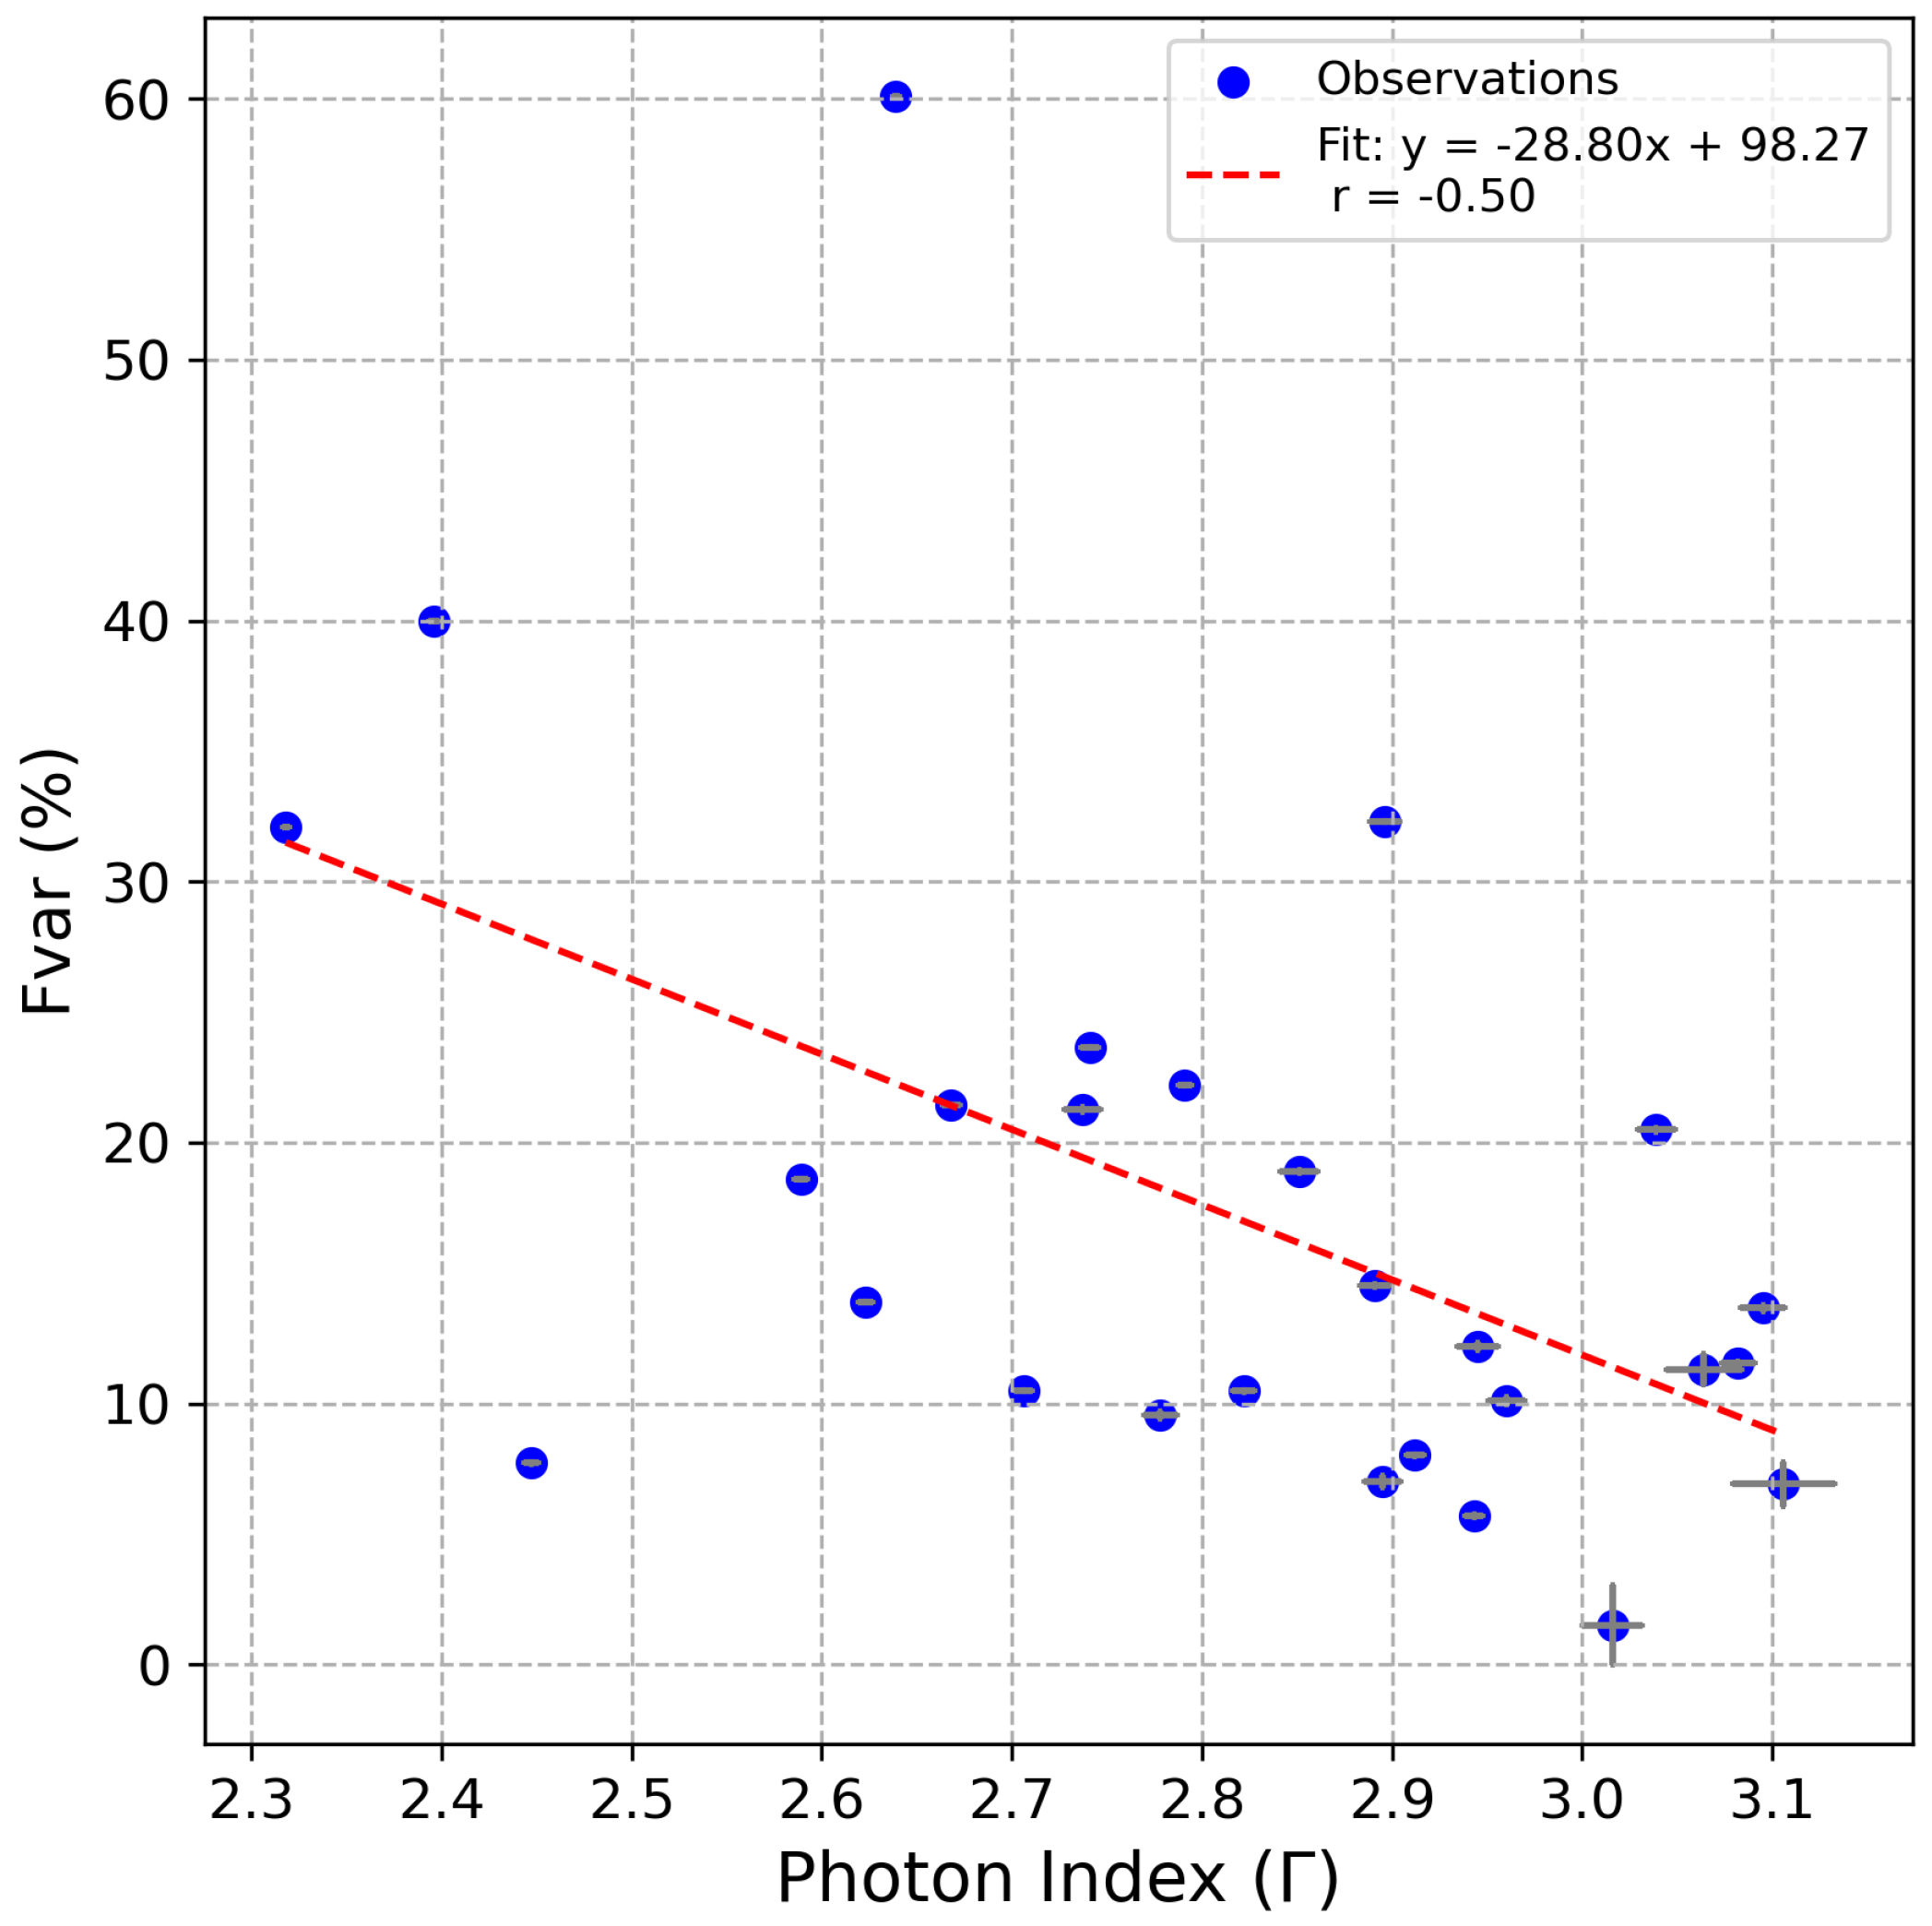

Table 1.
Properties of NuSTAR observations of the blazar Mrk 421. Columns 2, 3, and 4 list the observation date, observation ID, and exposure time (in seconds), respectively, while Columns 5 and 6 provide the mean flux (in counts/s) with its standard deviation and the fractional variability with its uncertainty (in percent), respectively.
| Serial | Date | ID | Exposure(s) | Mean ± Std (counts/s) | (%) |
|---|---|---|---|---|---|
| 1 | 2012-07-08 | 10002016001 | 24884 | 9.49 ± 3.09 | 32.31 ± 0.05 |
| 2 | 2013-01-02 | 60002023002 | 9152 | 2.57 ± 0.24 | 6.92 ± 0.87 |
| 3 | 2013-01-10 | 60002023004 | 22631 | 1.76 ± 0.27 | 11.32 ± 0.63 |
| 4 | 2013-01-15 | 60002023006 | 24181 | 6.07 ± 1.28 | 20.50 ± 0.11 |
| 5 | 2013-01-20 | 60002023008 | 24966 | 6.07 ± 1.28 | 20.50 ± 0.11 |
| 6 | 2013-02-06 | 60002023010 | 19302 | 7.88 ± 0.87 | 10.12 ± 0.18 |
| 7 | 2013-02-12 | 60002023012 | 14775 | 9.30 ± 2.02 | 21.27 ± 0.11 |
| 8 | 2013-03-11 | 60002023018 | 17472 | 6.76 ± 0.97 | 13.66 ± 0.15 |
| 9 | 2013-03-17 | 60002023020 | 16554 | 9.54 ± 1.07 | 9.57 ± 0.17 |
| 10 | 2013-04-02 | 60002023022 | 24767 | 23.07 ± 5.63 | 23.66 ± 0.03 |
| 11 | 2013-04-10 | 60002023024 | 5757 | 33.00 ± 4.89 | 14.52 ± 0.08 |
| 12 | 2013-04-11 | 60002023025 | 57507 | 56.32 ± 34.02 | 60.09 ± 0.01 |
| 13 | 2013-04-12 | 60002023027 | 7629 | 117.60 ± 16.43 | 13.90 ± 0.02 |
| 14 | 2013-04-13 | 60002023029 | 16508 | 42.26 ± 10.76 | 22.19 ± 0.01 |
| 15 | 2013-04-14 | 60002023031 | 15605 | 133.25 ± 42.79 | 32.09 ± 0.00 |
| 16 | 2013-04-15 | 60002023033 | 17276 | 46.86 ± 9.09 | 18.58 ± 0.02 |
| 17 | 2013-04-16 | 60002023035 | 20278 | 51.90 ± 20.79 | 40.00 ± 0.01 |
| 18 | 2013-04-18 | 60002023037 | 17795 | 7.74 ± 1.50 | 18.89 ± 0.10 |
| 19 | 2013-04-19 | 60002023039 | 15958 | 7.19 ± 0.93 | 12.20 ± 0.16 |
| 20 | 2017-01-03 | 60202048002 | 23691 | 24.41 ± 1.99 | 7.72 ± 0.06 |
| 21 | 2022-06-04 | 60702061002 | 21277 | 8.49 ± 1.40 | 11.54 ± 0.11 |
| 22 | 2022-06-07 | 60702061004 | 23280 | 26.65 ± 2.87 | 10.51 ± 0.04 |
| 23 | 2023-05-13 | 80801643002 | 44571 | 26.75 ± 5.78 | 21.45 ± 0.02 |
| 24 | 2023-12-06 | 60902024002 | 21293 | 12.95 ± 1.43 | 10.48 ± 0.05 |
| 25 | 2023-12-11 | 60902024004 | 21235 | 15.23 ± 1.37 | 8.03 ± 0.06 |
| 26 | 2023-12-18 | 60902024006 | 19990 | 19.18 ± 1.83 | 5.70 ± 0.07 |
| 27 | 2024-04-29 | 60902024010 | 20967 | 3.20 ± 0.20 | 1.52 ± 1.56 |
| 28 | 2024-05-03 | 60902024012 | 21025 | 4.38 ± 0.37 | 7.02 ± 0.24 |
Table 2.
Spectral parameters for each observation ID. The best-fitting model, characterized by a reduced , is highlighted in bold.
Table 2.
Spectral parameters for each observation ID. The best-fitting model, characterized by a reduced , is highlighted in bold.
| Observation ID | Model | Fit Statistic | |||
| PL | ... | ... | 1.21 (806.27/665) | ||
| 10002016001 | BPL | 1.19 (790.46/663) | |||
| LP | ... | 1.05 (699.01/664) | |||
| PL | ... | ... | 1.16 (303.86/260) | ||
| 60002023002 | BPL | 1.17 (303.86/258) | |||
| LP | ... | 1.13 (295.19/259) | |||
| PL | ... | ... | 0.92 (333.29/359) | ||
| 60002023004 | BPL | 0.92 (331.32/357) | |||
| LP | ... | 0.93 (329.69/358) | |||
| PL | ... | ... | 1.09 (612.44/558) | ||
| 60002023006 | BPL | (4:BreakE/556)* | |||
| LP | ... | 0.98 (547.05/557) | |||
| PL | ... | ... | (192.12/) | ||
| 60002023008* | BPL | (188.21/) | |||
| LP | ... | (190.91/) | |||
| PL | ... | ... | 1.16 (663.62/569) | ||
| 60002023010 | BPL | 0.95 (542.05/567) | |||
| LP | ... | 0.95 (543.52/568) | |||
| PL | ... | ... | 1.00 (587.58/586) | ||
| 60002023012 | BPL | 0.91 (533.84/584) | |||
| LP | ... | 0.92 (541.22/585) | |||
| PL | ... | ... | 0.91 (463.67/506) | ||
| 60002023018 | BPL | 0.90 (458.56/504) | |||
| LP | ... | 0.88 (448.56/505) | |||
| PL | ... | ... | 1.01 (600.08/591) | ||
| 60002023020 | BPL | 0.90 (534.76/589) | |||
| LP | ... | 0.90 (531.65/590) | |||
| PL | ... | ... | 1.47 (1320.83/895) | ||
| 60002023022 | BPL | 1.07 (958.93/893) | |||
| LP | ... | 1.04 (930.27/894) | |||
| PL | ... | ... | 1.34 (835.71/621) | ||
| 60002023024 | BPL | 1.07 (667.26/619) | |||
| LP | ... | 1.05 (652.12/620) | |||
| PL | ... | ... | 3.30 (4713.86/1426) | ||
| 60002023025 | BPL | 1.18 (1681.61/1424) | |||
| LP | ... | 1.01 (1451.51/1425) | |||
| PL | ... | ... | 2.29 (2352.14/1025) | ||
| 60002023027 | BPL | 1.06 (1088.72/1023) | |||
| LP | ... | 0.98 (1012.73/1024) | |||
| PL | ... | ... | 1.75 (1612.25/917) | ||
| 60002023029 | BPL | 0.97 (891.22/915) | |||
| LP | ... | 0.92 (850.97/916) | |||
| PL | ... | ... | 3.42 (4931.28/1440) | ||
| 60002023031 | BPL | 1.14 (1648.47/1438) | |||
| LP | ... | 1.06 (1531.32/1439) | |||
| PL | ... | ... | 1.71 (1750.38/1020) | ||
| 60002023033 | BPL | 1.02 (1038.80/1018) | |||
| LP | ... | 0.99 (1014.38/1019) | |||
| PL | ... | ... | 1.93 (2309.15/1191) | ||
| 60002023035 | BPL | 1.04 (1242.80/1189) | |||
| LP | ... | 0.98 (1168.20/1190) | |||
| PL | ... | ... | 1.09 (619.21/566) | ||
| 60002023037 | BPL | 0.93 (524.59/564) | |||
| LP | ... | 0.91 (516.76/565) | |||
| PL | ... | ... | 1.02 (535.31/524) | ||
| 60002023039 | BPL | 0.94 (494.59/522) | |||
| LP | ... | 0.96 (503.61/523) | |||
| PL | ... | ... | 1.29 (1298.79/1006) | ||
| 60202048002 | BPL | 1.06 (1067.30/1004) | |||
| LP | ... | 1.04 (1054.17/1005) | |||
| PL | ... | ... | 1.40 (800.31/570) | ||
| 60702061002 | BPL | 1.07 (610.69/568) | |||
| LP | ... | 1.05 (597.93/569) | |||
| PL | ... | ... | 2.08 (1845.52/887) | ||
| 60702061004 | BPL | 1.16 (1030.93/885) | |||
| LP | ... | 1.11 (984.94/886) | |||
| PL | ... | ... | 0.63 (811.57/1282) | ||
| 80801643002 | BPL | 0.24 (312.75/1280) | |||
| LP | ... | 0.20 (265.83/1281) | |||
| PL | ... | ... | 1.07 (880.85/820) | ||
| 60902024002 | BPL | 1.06 (873.67/818) | |||
| LP | ... | 0.97 (799.67/819) | |||
| PL | ... | ... | 1.56 (1254.12/799) | ||
| 60902024004 | BPL | 1.08 (865.23/797) | |||
| LP | ... | 1.03 (829.40/798) | |||
| PL | ... | ... | 1.43 (1219.41/847) | ||
| 60902024006 | BPL | 1.02 (869.68/845) | |||
| LP | ... | 0.98 (829.82/846) | |||
| PL | ... | ... | 4.92 (2554.74/519) | ||
| 60902024010 | BPL | 4.83 (2501.70/517) | |||
| LP | ... | 4.83 (2504.25/518) | |||
| PL | ... | ... | 1.22 (700.40/574) | ||
| 60902024012 | BPL | 1.22 (698.96/572) | |||
| LP | ... | 1.16 (669.90/573) |
Disclaimer/Publisher’s Note: The statements, opinions and data contained in all publications are solely those of the individual author(s) and contributor(s) and not of MDPI and/or the editor(s). MDPI and/or the editor(s) disclaim responsibility for any injury to people or property resulting from any ideas, methods, instructions or products referred to in the content. |
© 2025 by the authors. Licensee MDPI, Basel, Switzerland. This article is an open access article distributed under the terms and conditions of the Creative Commons Attribution (CC BY) license (http://creativecommons.org/licenses/by/4.0/).
Copyright: This open access article is published under a Creative Commons CC BY 4.0 license, which permit the free download, distribution, and reuse, provided that the author and preprint are cited in any reuse.


