
Submitted:
07 May 2025
Posted:
08 May 2025
You are already at the latest version
Abstract
The application of high-pressure grinding rolls (HPGR) is increasing in the ore industries, due to the advanced technology of this type of comminuting. There are important parameters in this device which have more effects on the productivity. One of the main reasons for damage of the rolls and consequently decrease the productivity and efficiency of the machine is wear of the surface. It is important to know carefully this phenomenon and try to control it as much as possible by readjusting and optimizing the effective parameters. In this research, the wear mechanism of HPGR rolls in the iron ore concentrate in a selected production line was investigate, the obtained results indicated that greater wear of the center of the rolls and reducing of the rolls life is due to changes of chemical and physical properties of the incoming iron ore in comparison with the design condition, failure to perform appropriate mechanical adjustment and improper repair and maintenance.
Keywords:
High Pressure Grinding Rolls (HPGR)
; Iron Ore
; Concentrate
; Wear Behavior
; Process Development
1. Introduction
Normally, mineral processing consists important stages during whole concentrating process. Recently, main focus is on the High-Pressure Grinding Rolls (HPGR), which is the most energy efficient methods of hard ore crushing [1,2,3]. Also, when the feed material is treated by HPGR instead of conventional crushing devices, there is greater comminution degree values in addition to higher throughput. More positive effects of using HPGR, could be observed in gravitational separation and flotation process [4]. HPGR consists of two rolls (one fixed and another movable) which rotates on bearings and the feed material comminute between the rolls. The pneumatic hydraulic system generates the adequate grinding pressure for the movable roll which moves on the guide rails and react to the force applied on it by the feed material. The fixed roll is adjusted in the machine frame. The performance of these two rolls are independent through planetary gear units with controlled motor and changeable velocity. It should be added for improving the efficiency and lower damage of the device, the most appropriate condition for the HPGR is using chocked feeding [5]. Also, in case of unknown and very low capacity feed rate, it should be suggested to use ball mill directly and remove the HPGR from the process line [6]. In the HPGR unit, the limited bed crushing occurs and energy is directly conveying to the material and causes breakage of particles under a very high stress volume [2,4]. In addition to some studies, still needs more in-depth investigation to optimize efficiency and increase overall performance of this device. There are many important technological factors for the effectiveness of HPGR performance, in addition feed material properties should be considered [7,8].
Based on previous studies [7,9,10], the main technological factors for effectiveness of the HPGR are, the applied pressure on the rolls, velocity and surface wear constitute. Samarak et al. [1], investigated on the effect of feed moisture on the efficiency of the HPGR and they found moisture has an unfavorable influence on the specific energy consumption by decreasing the throughput. Klymowsky et al. [11] specified that, the wear rate of the rolls, mainly depends on the physical properties of the ore, the machine setting and wear protection materials. Kazerani et al. [6], found a good wear pattern in rolls of HPGR, they observed, wear on the center part was greater than the edges. They proposed, according to the amount of wear, the spacers and guide plates should be adjusted appropriately. Samarak [4], investigated on the effect of HPGR pressing force on the level of product recovery. He found that, extensive pressure value and particle size distribution have low impact on the recovery. Seseman et al. [12] performed a test for wear estimation in HPGR, based on changing grinding pressure, grain size and moisture of the feedstock. Numbi et al. [13] optimize a model for energy of HPGR to reduce energy consumption and control cost of the process. Campus et al. [14] analyzes tests with an iron ore concentrate sample carried out over a range of pressures, roll velocities, feed size distributions and moisture contents in a pilot-scale and a model based on the size distributions was proposed, in addition they performed simulation [15]. Altun et al. [16], compared open and closed circuit HPGR application on dry grinding circuit performance and they observed closed circuit HPGR operation improved the overall efficiency. Ballantyne et al. [17], improved ball mill energy for HPGR products and specified importance of the mills operating conditions on energy efficiency as they can overwhelm the potential benefits of HPGR pre-conditioning. Rashidi et al. [18], performed line scanning developed in a mock-up roll of a laboratory scale HPGR, they developed. They present the method adopted to achieve appropriate accuracy of determining wear in HPGR. Alves et al. [19], proposed sample requirements for HPGR testing. In addition to as mentioned research about the effect of some process parameters on the productivity of the HPGR, still it needs more attention in this issue. Consequently, the aim of this research was to find effective parameters on the wear behavior of the rolls and develop the process to increase the productivity of the HPGR.
2. Materials and Methods
An HPGR630/17 device has been installed in the crushing unit of a selected production line. The nominal capacity of the machine is 1230 t/h. The diameter and length of the rolls are 1760 and 1230, respectively, and its maximum rotational speed is 23,00 rpm (Nominal 19, 43). Each roll unit consists of the shaft, tire and bearing blocks.
The surface of the rolls is made of forged steel and there are many tungsten carbide studs) With a height of 45 mm and a diameter of 16 mm (for protection and causes to form a protective layer of raw materials on the rolls. These studs avoid more wear of roll surface simplifies feed materials into the gap between the rolls. Also, the formation of compressed layer increases particle impact by the rolls and consequently increases the thickness of the layer and the capacity of the HPGR [20].
For assessment of wear behavior of the HPGR rolls (Fixed and movable) which consists studs and tire surface, the straight edge measuring tools was used as shown in Figure 1. The following equipment for the measurement were used: Vernier caliper with one bracket shortened, Depth gauge and straight edge tool, two magnetic brackets, sharp tool for autogenous protection layer removal and permanent market.
To obtain accurate result, the surface of the measurement area of the tire should be cleaned by water and dried to remove all autogenous protection layers.
Before starting the measurement, the HPGR was to be secured against unintended starting. The safety mesh in the roller hosing were to be taken out in order to gain access to the rollers. The meshes was to be put in place again after finishing. The wear measurement started from the NDE, it causes ensure consistent record and enable edge to edge wear comparison of fixed and movable roller tires. Also, the wear measurement selected rows that starts with Ø16 mm stud, to ensure the same number of studs for both fixed and movable roller.
For stud length measurement, the following procedure was performed: the magnetic brackets at both end of the tire at reference edge protection elements were set, then the straight edge in the forks of the magnetic brackets was set and sure it was in the line with selected row of studs. Straight edge bottom surface of studs touched the top surface of studs at both ends of the tire. Once the straight edge was set up, the distances (Xi) was measured from the top of the straight edge to the surface of each stud which is representative for the wear of the roller from NDE tire side. Stud wear was assessed on minimum two rows of studs for each tire. Measurements of the wear rate of the masters were made at 6500, 7500, 8500, and 9500 operating hours. At the same time, sampling of the feed entering the HPGR was carried out to prepare the sample for performing the required laboratory tests.
3. Results and Discussion
3.1. Wear Behavior
Based on the proposed methodology, the wear rate of the roll surfaces was measured. Figure 1 illustrates the wear distribution on the surfaces of the fixed and floating rolls. The wear rate is higher at the center of the rolls compared to the edges, and the wear on the floating roll is significantly greater than that on the fixed roll. The results indicate an increasing trend in the wear rate of the floating roll. After 8,500 hours of operation, the wear rate exhibited an upward trend in both rolls. The fracture and replacement of studs are also evident in both the floating and fixed roll curves.
The conducted analyses indicate that the wear and corrosion of the studs range from 5 to 13.6 mm at the edges of the roll and from 11 to 30 mm at the center of the roll in the measured section. The minimum remaining depth for installing a replacement stud at 9,500 hours of operation is 15 mm at the center of the roll (Figure 2). It is worth noting that each stud has a diameter of 16 mm and a height of 45 mm, of which 5 mm protrudes above the tire surface, while the remaining 40 mm is embedded inside the tire (Figure 3).
Given the surface deterioration of the roll in certain sections of the tire after crushing 4,800,000 tons of iron ore lumps (Figure 5), along with the assessment of roll surface wear over specified time intervals, the monitoring of other measurable parameters affecting roll wear was carried out. These parameters include the physical and chemical properties of the feed material and the machine settings, as detailed below.
3.2. Physical and Chemical characteristics Input Feed (Fresh Feed)
One of the key parameters affecting the wear of HPGR rolls is the characteristics of the feed material. To investigate this factor, sampling of the fresh feed was conducted, and a representative sample was prepared for particle size distribution analysis, abrasion index testing, Bond index measurement, and chemical analysis. The following results were obtained:
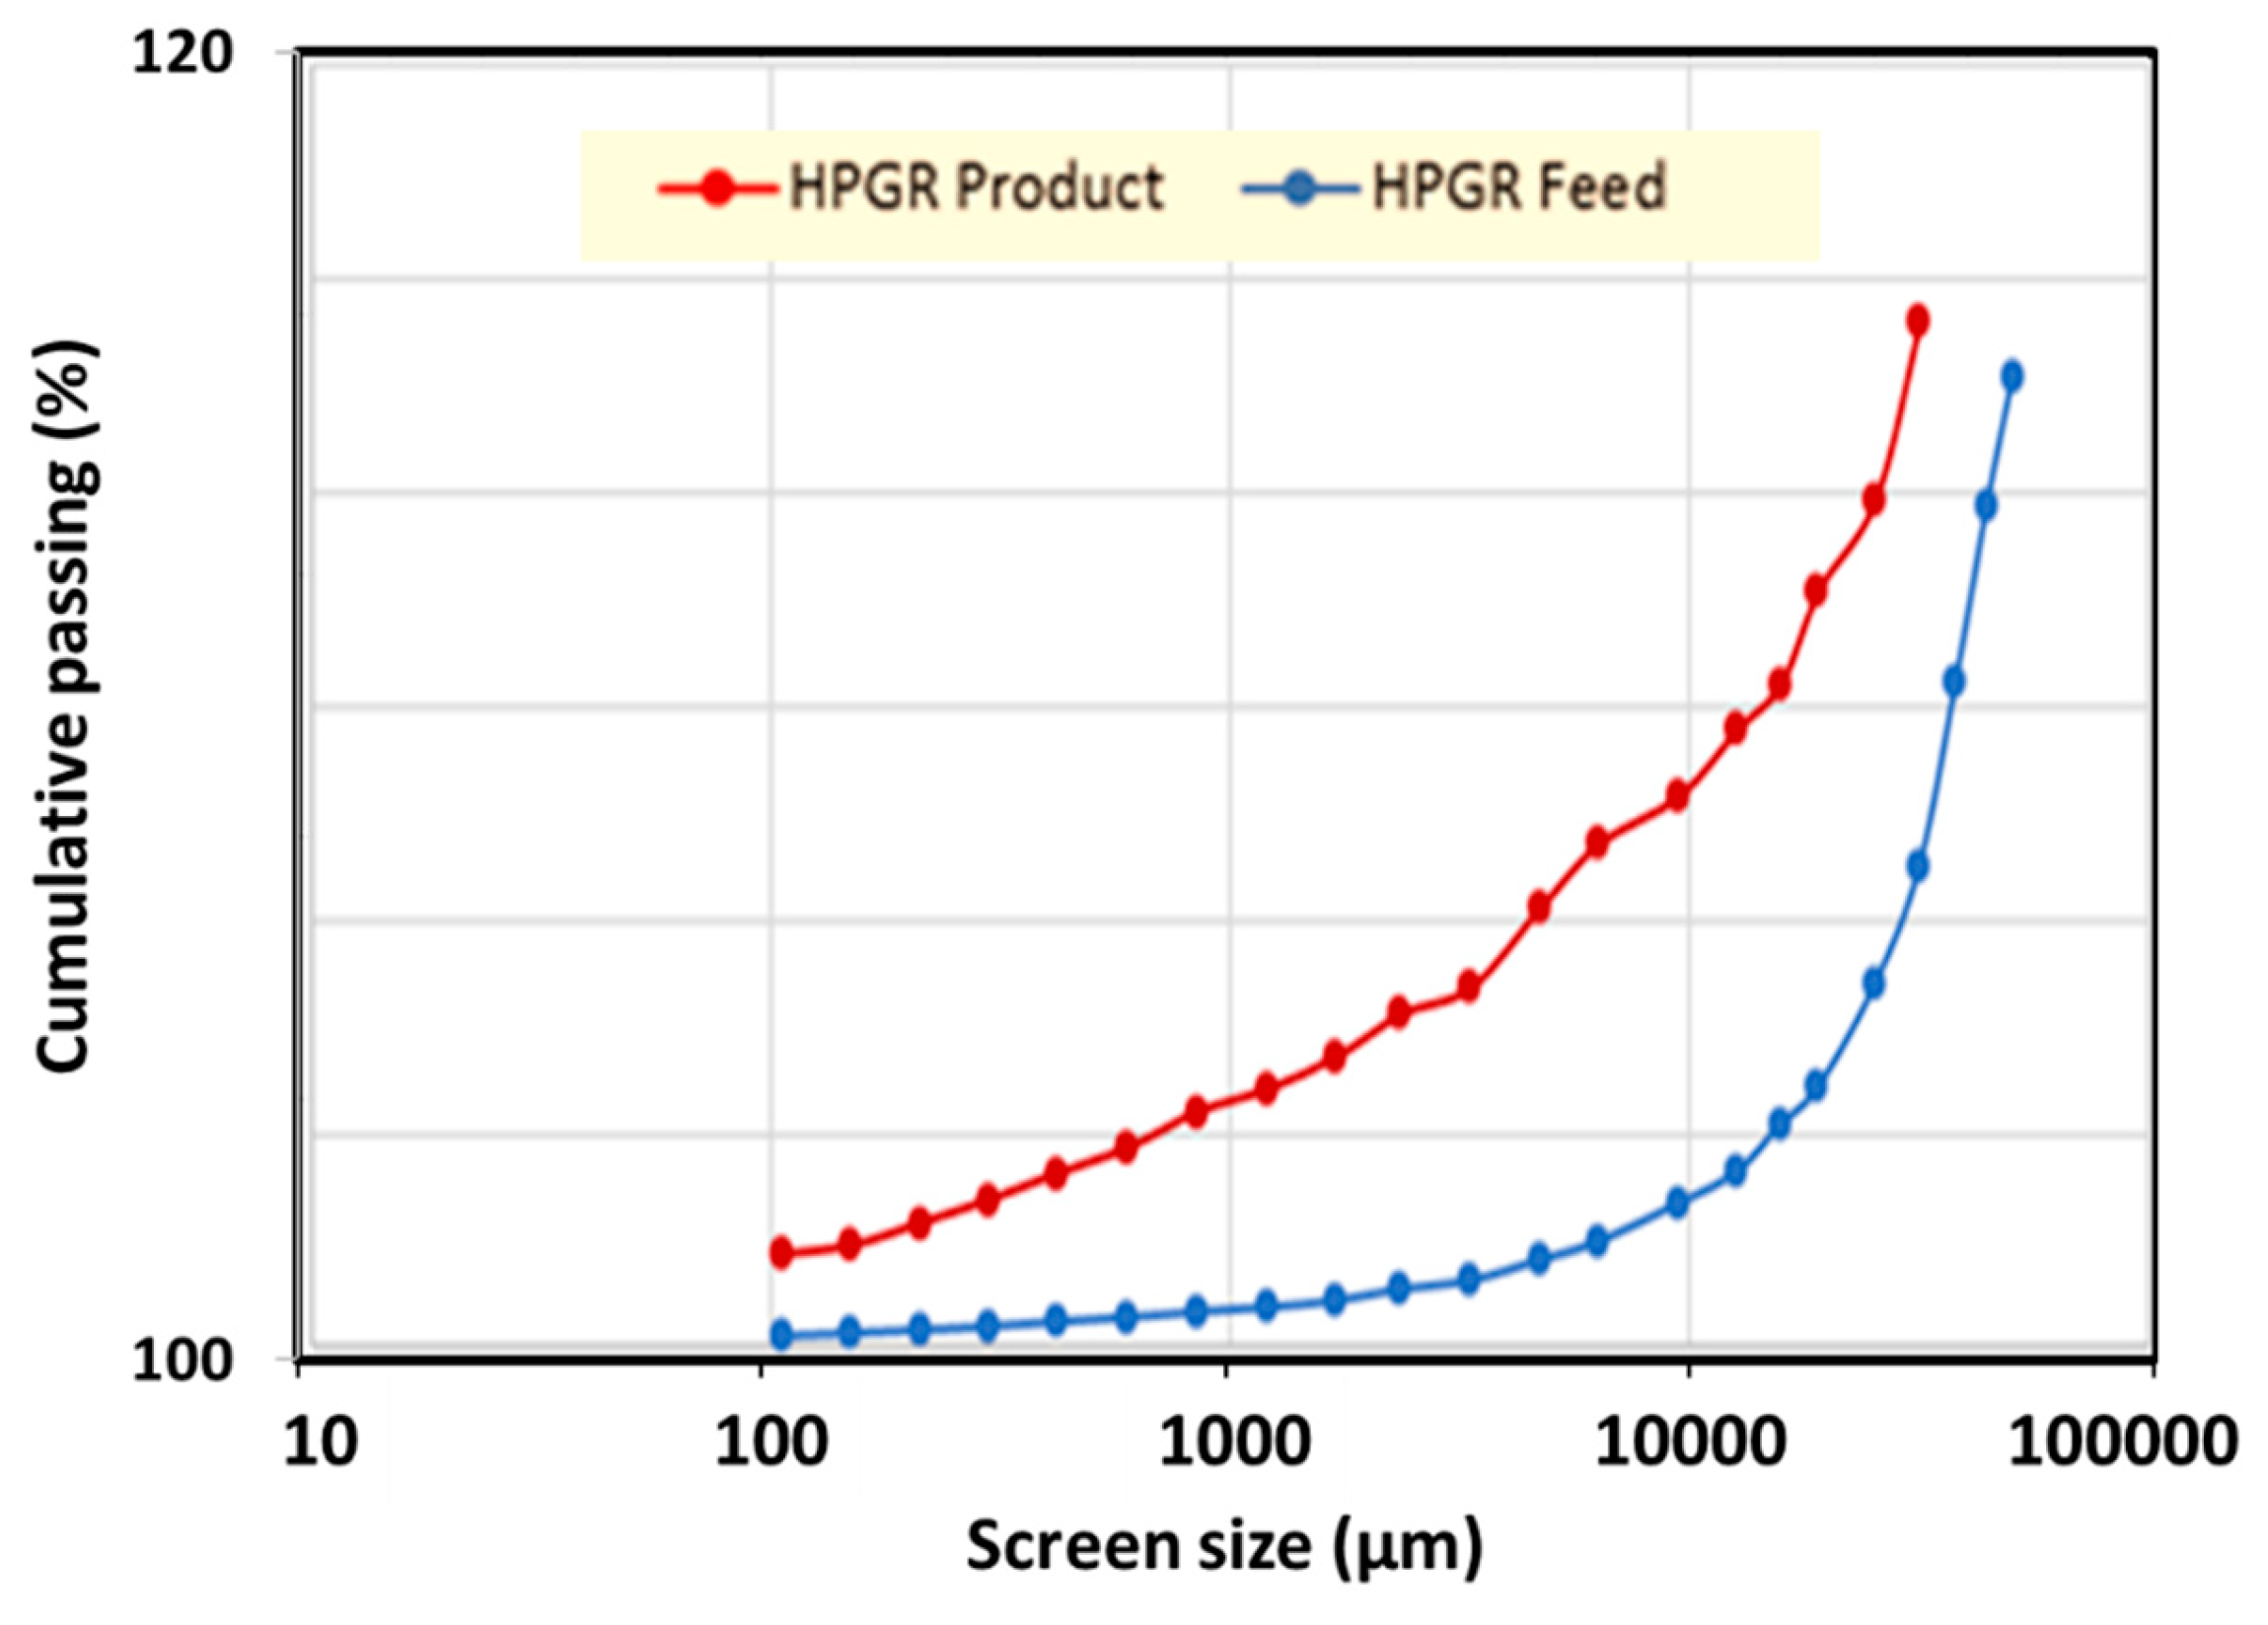
- According to Table 1, the feed material for the HPGR should have a particle size distribution of D80 = 30 mm and D100 = 50 mm. If the feed consists of iron ore lumps with D80 = 30 mm, the expected product size should be D80 = 8 mm.
- As shown in Figure 5, the actual feed material entering the HPGR has a particle size distribution of D80 = 45 mm and D100 = 70 mm.
- 10% of the feed material has a particle size between 50 and 70 mm, while only 45% is below 30 mm.
- 80% of the HPGR product has a particle size of less than 25 mm (D80 = 25 mm), while 20% is larger than 25 mm.
- The results indicate an increase in the feed particle size, leading to a rise in the HPGR product size from 8 mm to 25 mm and an increase in the circulating load from 40% to 50%. The increase in circulating load directly impacts the reduction of fresh feed throughput and alters the particle size distribution of the HPGR feed.
Figure 6.
Feed and Product Particle size distribution.
Due to the rapid wear and corrosion of equipment in the HPGR circuit, Bond index testing was conducted on representative samples to assess the hardness of the incoming iron ore. The results, presented in Table 1, indicate a 50% increase in the Bond index of the feed material compared to the designed value.
This increase signifies higher energy consumption for comminution as well as a greater hardness of the ore, which directly contributes to accelerated equipment wear.
- In the grinding stage, after energy consumption, the highest cost is associated with the wear and corrosion of components in direct contact with the ore (such as studs and tire surfaces). The abrasiveness of a mineral is represented by its Abrasion Index (Ai). For the representative feed sample HPGR120MI01, the measured Abrasion Index was 0.3324, which is nearly three times the initial value of 0.1118.
- The XRF analysis results (Table 2) indicate an increase in silica content in the feed material compared to the initial sample. Additionally, XRD analysis confirms the presence of magnetite as the primary mineral, along with iron-bearing silicates such as amphibole and clinopyroxene, aluminosilicates such as phlogopite, and carbonate minerals including calcite, which are identified as gangue minerals associated with magnetite.
3.3. Feed Rate
The operational capacity of HPGR120MI01 is 1,230 tons per hour. Based on document analysis (Table 3), the total operating time from the initial startup to the roll replacement was 10,256 hours, with a cumulative 9,300,000 tons of iron ore lumps processed. The average feed rate was 905 tons per hour, which is 35% lower than the designed operational capacity. This reduction in feed rate was caused by the increased circulating load due to the coarse product size from the HPGR, which prevented an increase in fresh feed. Given the equipment’s capacity, the total iron ore feed could have been processed in a minimum of 7,542 hours. To compensate for the fresh feed deficit required for the concentrate production unit, adjustments were made by using iron ore lumps with a 60% recovery rate instead of 45% and modifying the wet screen (increasing the mesh size).
3.4. Gap Adjustment
The initial gap between the rolls must be readjusted due to roll surface wear, variations in feed particle size, and required product specifications. The zero gap for HPGR120MI01 was set at 35 mm during initial commissioning.
To adjust the gap, an initial pressurization was applied to bring the floating roll as close as possible to the fixed roll. The gap measurement was then conducted using a paste test, and the Type 2 shim plates were removed to set the zero gap (Figure 7).
According to the operating guidelines, if the static gap is not properly adjusted, the working gap will exceed the required value due to roll wear, preventing the desired product size from being achieved. Additionally, an excessive working gap increases the material bed thickness between the rolls, causing the feed force exerted between the rolls to exceed the hydraulic force applied to them. In this scenario, even with hydraulic pressure, the required product size is not attained, and achieving the desired particle size would demand higher pressure, leading to increased wear and energy consumption.
Investigations revealed that the gap was not adjusted during operation despite roll wear and changes in feed size distribution. As a result, the zero-gap increased from 35 mm to 70 mm (Figure 8) without any adjustment to the shim plates. In other words, the zero gap exceeded the required working gap of 55 mm.
Additionally, when the rolls experienced severe wear, and the required product size was not achieved, the operations team, unaware of the extent of wear (due to uncalibrated distance sensors), reduced the hydraulic pressure behind the rolls to 145 bar in an attempt to achieve the required 55 mm working gap. However, this action resulted in:
- Increased product size
- Higher circulating load
- Reduced displacement of the floating roll
- Shortened lifespan of the floating roll
3.5. Stud Replacement
Stud fractures occur due to the entry of iron pieces and foreign materials larger than the zero gap into the gap between the rolls. Additionally, some studs have completely detached due to excessive tire wear, making the tire more vulnerable to damage. In the event of stud breakage or detachment, a healthy stud must be replaced immediately to prevent the failure of adjacent studs. The height of replacement studs is not always constant (Figure 9). As the tire shell thickness decreases, shorter studs are selected to prevent excessive height differences, which could lead to increased wear or fracture (Figure 10). Investigations indicate that there has been no systematic inspection program for monitoring the tire surface and studs, resulting in significantly extended replacement intervals.
Failure to replace broken studs promptly (every 175 hours) has led to the loss of multiple adjacent studs and, ultimately, the deterioration of the tire surface. Considering the wear rate, 26.5 mm studs—the smallest available size—were used as replacements at the center of the rolls. This resulted in a maximum protrusion of 11.5 mm beyond the tire surface, causing the newly installed studs to fracture once the comminution process resumed (Figure 9). This issue applies to all excessively worn studs.
It is worth noting that the entry of iron pieces is controlled using a metal detector, whose sensitivity is set according to the zero gap (Zero Gap/0.9). Analyzing control room trends and operational tests reveals that the sensitivity of this equipment has decreased over time. Additionally, operators in the control room have deliberately deactivated the detector during production due to its frequent triggering, which led to the rejection of part of the feed through the two-way chute. The reduction in sensitivity and the deactivation of the metal detector have significantly contributed to stud and tire surface damage due to iron piece intrusion. In some cases, the passage of such materials has even triggered the mechanical fuse, causing equipment shutdowns.
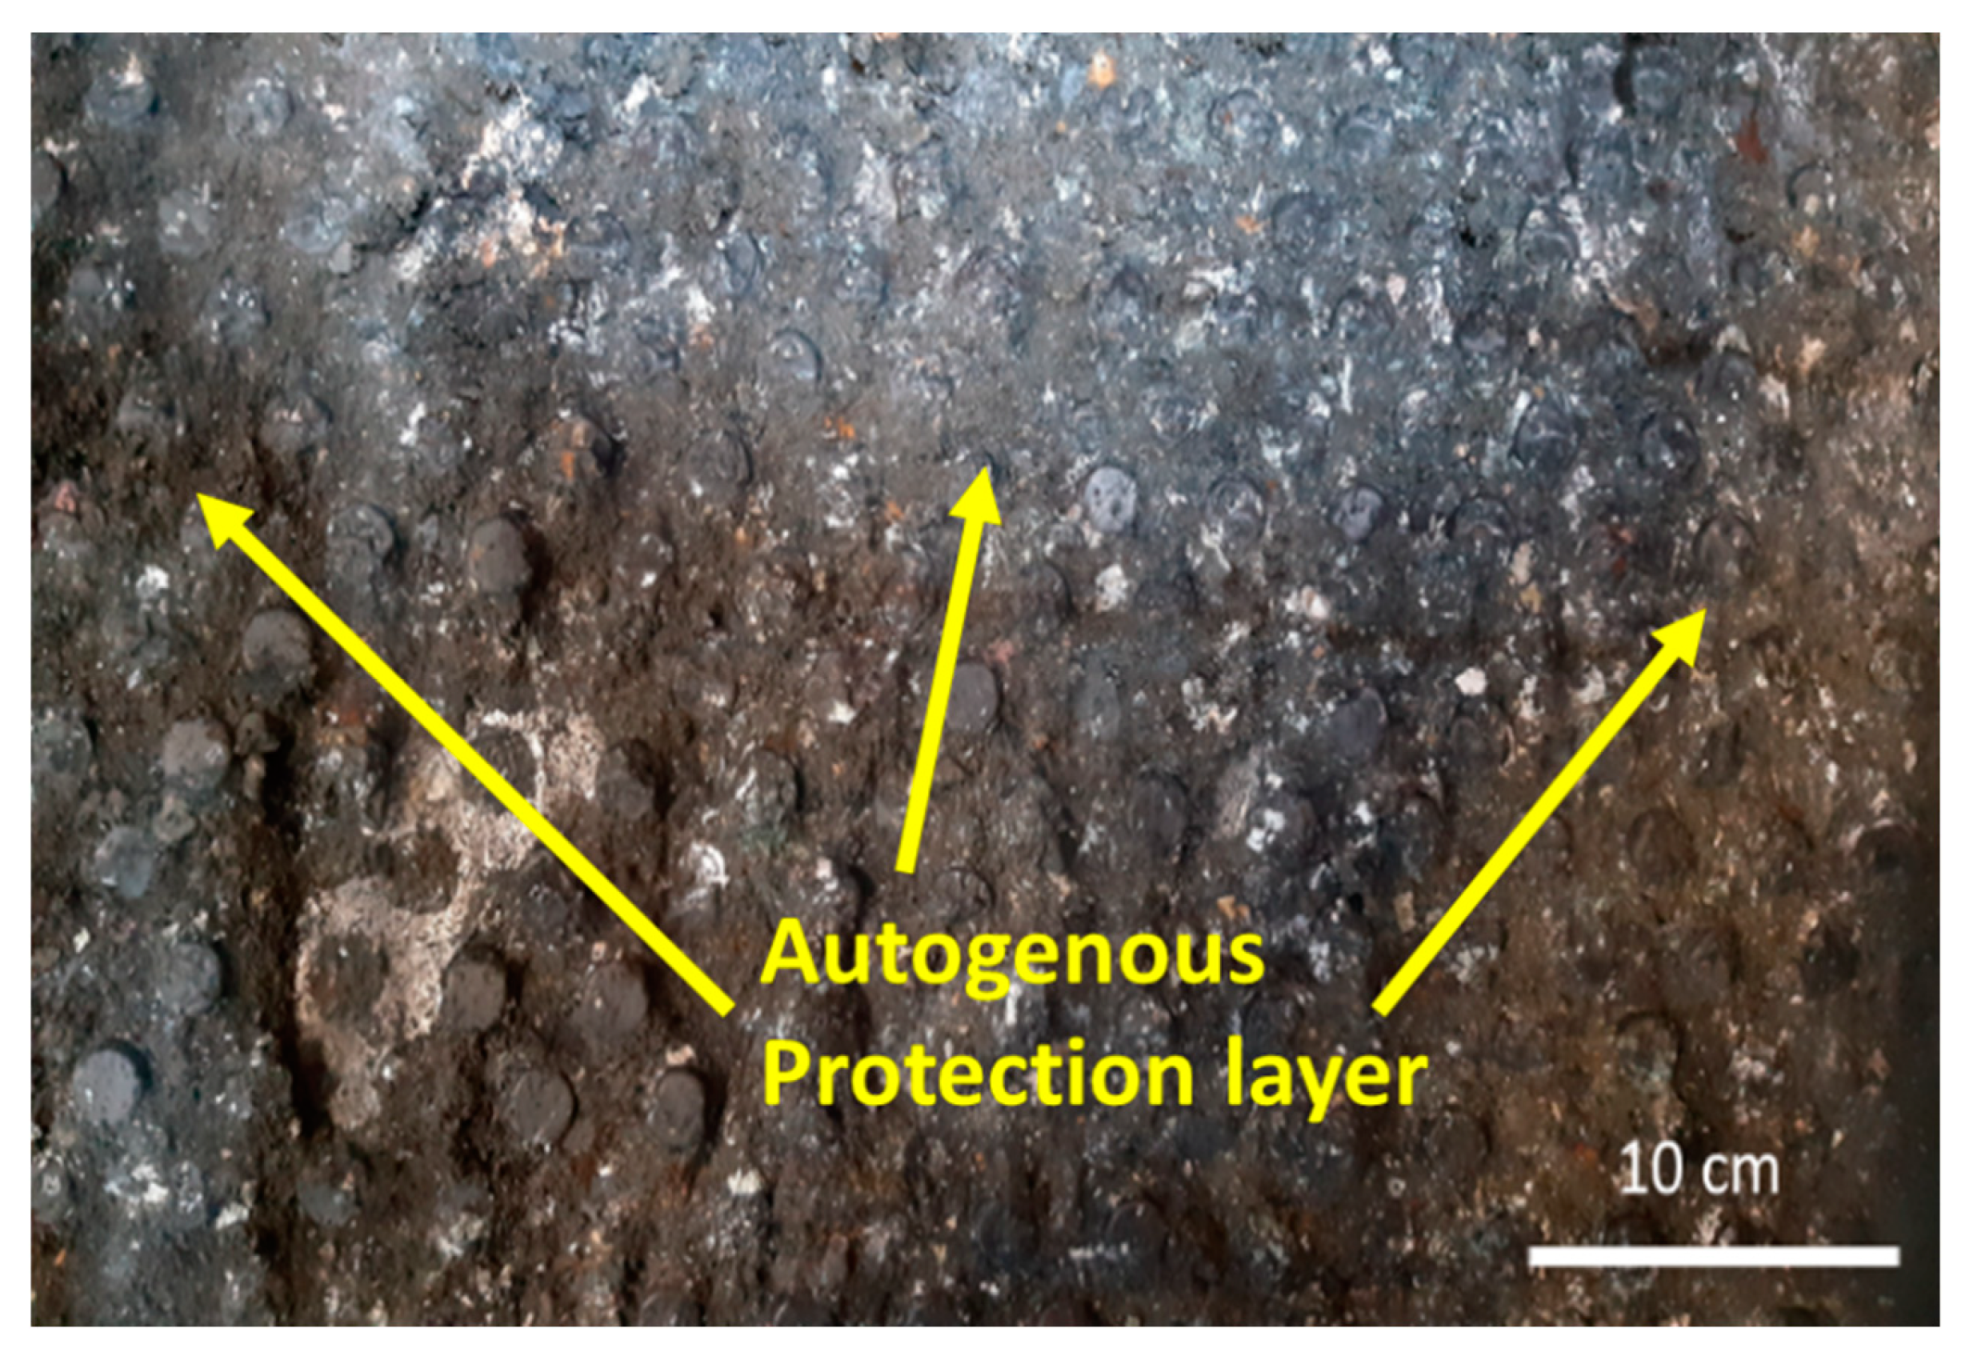
3.6. Autogenous Protection layer (APL)
One of the most important subjects in HPGR grinding is the wear of the roll surface These rolls with surface protection provide a longer wear life due to more wear resistant studs and the embedding of an autogenous wear layer of crushed rock/ore. This autogenous wear layer is formed by the ore packing itself between the studs on the rolls.
This way the roll surface is coated and protected from the direct wear of the mineral rock (Figure12). The autogenous surface generally prevents larger rocks from directly impinging on the roll surface, and provides a shield from the abrasive movement of material parallel to the roll surface. For generating a competent autogenous wear surface, The feed of a High Pressure Grinding Roll should preferably contain some moisture. The amount of moisture in the feed entering HPGR should be less than 5 percent. Under operating conditions, the moisture content of the feed entering the HPGR120MI01 is 3-4%, and a protective layer is formed well on the surface of the roll.
Figure 12.
Formation of APL for tire surface protection.
3.7. Check Plate
The significance of the feeding device in HPGR operations is frequently underrated. The method of material feeding has an important influence on steady and vibration free HPGR operation. Depending on the specific material to be processed, the feeding device can be equipped with a regulating gate and given the most appropriate wear-protection lining.
The cheek plates of a feeding device are mounted on both side Ds and NDS sides. The cheek plates ensure that only a minimum of un-pressed feed is allowed to flow past. The plates are mounted in a manner which enables them to give way upon skewing of the movable HPGR roll. the cheek plate returns to its original position by means of a pre-loaded spring assembly once the parallel position of the movable HPGR roll relative to the fixed HPGR roll is restored. The cheek plate is of split design to be capable of separately changing the bottom part of the cheek plate, which is subjected to maximum wear.
This is a further contribution to lower the cost of wear. Figure 13 shows the check plate not adjusting and causing wear on the roll and breaking the edge block.
3.8. Gravity Feeder
The feed chute is designed to guide material uniformly into the space between the rolls and must be adjusted so that the center of the chute opening aligns with the center of the rolls during machine operation, not in a static state. Improper alignment results in increased wear on one roll compared to the other, excessive crushing force on a single roll, and consequently, higher power consumption. This misalignment also increases the likelihood of a gap variation between the rolls, leading to operational disruptions such as instability in maintaining the set pressure point and a decline in machine performance.
Figure 14 illustrates that in HPGR120MI01, the spacing between the rolls was 100 cm, whereas it should have been adjusted to a maximum of 20 cm. Failure to comply with this requirement by the operator has directly contributed to increased wear on the roll flutes, breakage of the studs, and a reduction in the service life of the tires.
3.9. Hydraulic Pressure
The hydraulic system’s control program includes several pressure parameters:
1. Pre-Stressing Pressure (Pv): The initial pressurization level, which determines when the slide gate opens, allowing material to enter the rolls.
2. Operating Pressure (Pw): The pressure applied during operation, based on the required compressive force on the material.
3. Accumulator Pressure (Paccu): The pressure within the hydraulic accumulator.
4. Relief Valve Pressure (Ps): The pressure at which the relief valve activates.
The pre-stressing pressure (Pv) is set between the accumulator pressure (Paccu) and the operating pressure (Pw). It is always lower than the working pressure (Pw) but higher than the accumulator pressure (Paccu) to prevent damage to the bladder.
If the accumulator pressure is below the normal charge level, its stiffness coefficient decreases, leading to excessive compression of the accumulator bladder. This reduces the system’s overall stiffness and minimizes variations in the roll gap. Conversely, when the accumulator is properly charged (slightly below Pv), its stiffness coefficient increases, resulting in greater roll gap adjustments.
The proportional valve’s setpoint for initial pressurization during pre-startup is configured at 80 bars. When the hydraulic system’s DS and NDS pressure gauges indicate 80 bars, material feeding begins. As the slide gate opens and material enters, the system automatically increases the proportional valve’s setpoint from 80 to 130 bar.
According to operational records, at the beginning of the commissioning phase, the system pressure was set between 180–185 bar to achieve the desired product particle size. Over time, as roll wear increased, operators reduced the pressure. Between 8,000 to 10,000 operating hours, the average working pressure used was around 145 bar (Figure 15).
It is noteworthy that increasing the pressure from 185 to 200 bar did not result in any significant reduction in product particle size, indicating that higher pressures beyond a certain threshold do not necessarily improve product fineness.
3.10. Tire Surface Welding
Due to increased wear on the tire surface, higher vibration levels in the equipment, and frequent stoppages caused by non-compliance with the aforementioned operational parameters, welding and refilling the tire surface was implemented as a temporary corrective measure by the operator. This process continued until the roll replacement at 10-256 operating hours.
However, this action did not improve the performance of the HPGR and ultimately resulted in additional time and cost expenditures. Furthermore, the welded areas experienced severe wear and quickly reverted to their original worn condition within a short operational period, rendering the repair ineffective.
4. Conclusions
Based on the investigations conducted on HPGR120MI0, the following factors have contributed to roll wear and failure to achieve the required product particle size for the plant:
- The iron ore lumps supplied to the stockyard originate from multiple sources, each with distinct mineralogical characteristics. The use of the Cone-shell method for stockpile formation has led to significant quantitative and qualitative fluctuations in the feed to the HPGR, preventing homogeneous material feeding. To achieve optimal results, stockpile formation should be carried out using the Windrow method.
- The HPGR feed must be reclaimed using a reclaimer to ensure consistent and homogeneous material flow with minimal fluctuations. Feeding with machinery such as loaders significantly disrupts feed uniformity.
- An increase in the HPGR feed particle size (D100 = 70 mm, D80 = 45 mm) has been a major cause of oversized product particles, stud breakage, and reduced tire lifespan. The larger feed size to the HPGR results from crusher inefficiencies, including wear and tearing of screen segments, excessive wear and gap increase in the cone crusher, and the oversized control screen segments before the HPGR due to wear. Also, the work index of the input iron ore fluctuates between 13–17 kWh/t, directly affecting energy consumption and tire lifespan. In addition, the ore abrasion index has tripled compared to the original design specifications, indicating an accelerated wear rate of the equipment.
- Chemical analysis of representative feed samples shows a silica content increase up to 16%, making the ore harder and leading to higher wear rates. Throughout the operational period, the HPGR feed rate has remained below its design capacity, having no impact on roll wear. Moreover, the wear pattern indicates that the center of the roll experiences more wear than the edges. A key reason for excessive roll flute wear is the failure to adjust the zero gap in response to wear, limiting roll movement.
- Failure to calibrate the distance sensors on both DE and NDE sides has led to operator errors in hydraulic pressure adjustments, increasing product particle size and recirculating load from the screen. Lowering the sensitivity of the metal detector to reduce two-way chute activations and reject load has allowed more metallic contaminants to enter the rolls, leading to increased stud breakage. Failure to inspect roll surfaces regularly and replace broken studs in a timely manner has led to the loss of adjacent studs, accelerating tire surface degradation.
- Acceptable moisture levels in the recirculating load have helped regulate feed moisture and form an autogenous protection layer on the tire surface. Also, replacement studs of inferior quality (non-original parts) have shown significantly higher breakage rates than OEM studs. Incorrect spacing between check plates and tires has caused edge block fractures and severe check plate wear.
- Misalignment of the gravity feeder has resulted in direct feed impact on the roll flute surface, causing excessive wear on the roll flute compared to the fixed roll, ultimately leading to tire failure.
Author Contributions
For research articles with several authors, a short paragraph specifying their individual contributions must be provided. The following statements should be used “Conceptualization, A.T. and F.G.; methodology, E.F.; validation, A.T. and A.F.; writing—original draft preparation, A.T,; writing—review and editing, F.G. and A.F.; supervision, A.T. All authors have read and agreed to the published version of the manuscript.”
Funding
This research received no external funding
Data Availability Statement
Non declared.
Acknowledgments
Special thanks to SIMIDCO authorities for their kind support for data collection and preparing appropriate condition for research. Special thanks to the production line and laboratory staffs of the SIMIDCO, Sangan, Iran.
Conflicts of Interest
The authors declare no conflicts of interest.
References
- Saramak. D, Kleiv. R.A, The effect of feed moisture on the comminution efficiency of HPGR circuits, Minerals Engineering 43-44 (2013), p.105-111. [CrossRef]
- Saramak. D., The influence of chosen ore properties on efficiency of HPGR based grinding circuits, Mineral Resources Management 24 (4), (2011), p. 33-44.
- Fuerstenau. D.W., Abouzeid. A.Z., Role of feed moisture in high-pressure roll mill comminution, International Journal of Mineral Processing 82, (2007), p.203-210. [CrossRef]
- Saramak, Impact of HPGR pressing force on the level of product recovery, Mineral Science and Engineering 427 (2018).
- Fuerstenau. D.W., Shukla. A., Kapur. P.C., Energy consumption and product size distributions in choke-fed, high-compression roll mills, International Journal of Mineral Processing 32, (1991), p.59-79. [CrossRef]
- Kazerani. R, Sam. A, The wear pattern in high pressure grinding rolls, Mineral Processing and Extractive Metallurgy 126 (2017), p.238-244.
- Lim. W.I., Campbell. J.J., Tondo. L.A., The effect of rolls speed and rolls surface pattern on high pressure grinding rolls performance, Minerals Engineering 10 (4), (1997), p.401-419. [CrossRef]
- Saramak. D., Tumidajski. T., Broek. M., Gawenda. T., Naziemiec. Z., Aspects of comminution flowsheets design in processing of mineral raw materials, Mineral Resources Management 26 (4), (2010), p.59-69.
- Norgate. T.N., Weller. K.R., Selection and operationof high pressure circuits for minimum energy consumption, Mineral Engineering 7 (10), (1994), p.416-421.
- Hasanzadeh. V., Farzanegan. A., Robust HPGR model calibration using genetic algorithms, Mineral Engineering 24 (5), (2011), p.424-432. [CrossRef]
- Klymowsky. R., Patzelt. N., Knecht. J., Burchardt. E., Selection and sizing of high pressure grinding rolls. In: Mular. A., Halbe. D., Barrat, editor. Mineral processing plant design, practice, and control proceeding. 1st ed. Littleton: SME; p.636-668.
- Seseman. Y., Broeckmann. C., Hofter. A., A new laboratory test for the estimation of wear in high pressure grinding rolls, Wear 302 (1-2), (2013), p.1088-1097. [CrossRef]
- Numbi. B.P., Xia. X., Systems optimization model for energy management of a parallel HPGR crushing process, Applied Energy 149, (2015), p.133-147.
- Campos. T.M., Gilvandro. B, Barrios. G.K, Tavares, L.S., Pressing iron ore concentrate in a pilot-scale HPGR. Part 1: Experimental results, Minerals Engineering 140 (2019).
- Campos. T.M., Gilvandro. B, Barrios. G.K, Tavares, L.S., Pressing iron ore concentrate in a pilot-scale HPGR. Part 2: Modeling and simulation, Minerals Engineering 140 (2019).
- Altun. O., Benzer. H., Dundar. H., Aydogan. N., Comparison of open and closed circuit HPGR application on dry grinding circuit performance, Minerals Engineering 24 (3-4), (2011), p.267-275. [CrossRef]
- Ballantyne. G.R., Hilden. M., Petervan der Meer. F., Improved characterization of ball milling energy requirements for HPGR products, Minerals Engineering 116, (2018), p.72-81. [CrossRef]
- Rashidi. S., Rajamani. R.K., HPGR Rolls Surface Wear: In-line scanning of a Laboratory-Scale HPGR, Mining, Metallurgy & Exploration 37, (2020), p239–249. [CrossRef]
- Alves. K. V., Schneider. C., Duque. T.B., Mazzinghy. D.B., Peres. A.E., Sample requirements for HPGR testing procedure, Minerals Engineering 73, (2015), p.31-38. [CrossRef]
- Oberhauser. G., Wear protection of surfaces from high pressure grinding rolls; possibilities and limits, International Journal of Mineral Process 44-45, (1996), p.561-568.
Figure 1.
Position of the straight edge on the tire surface.
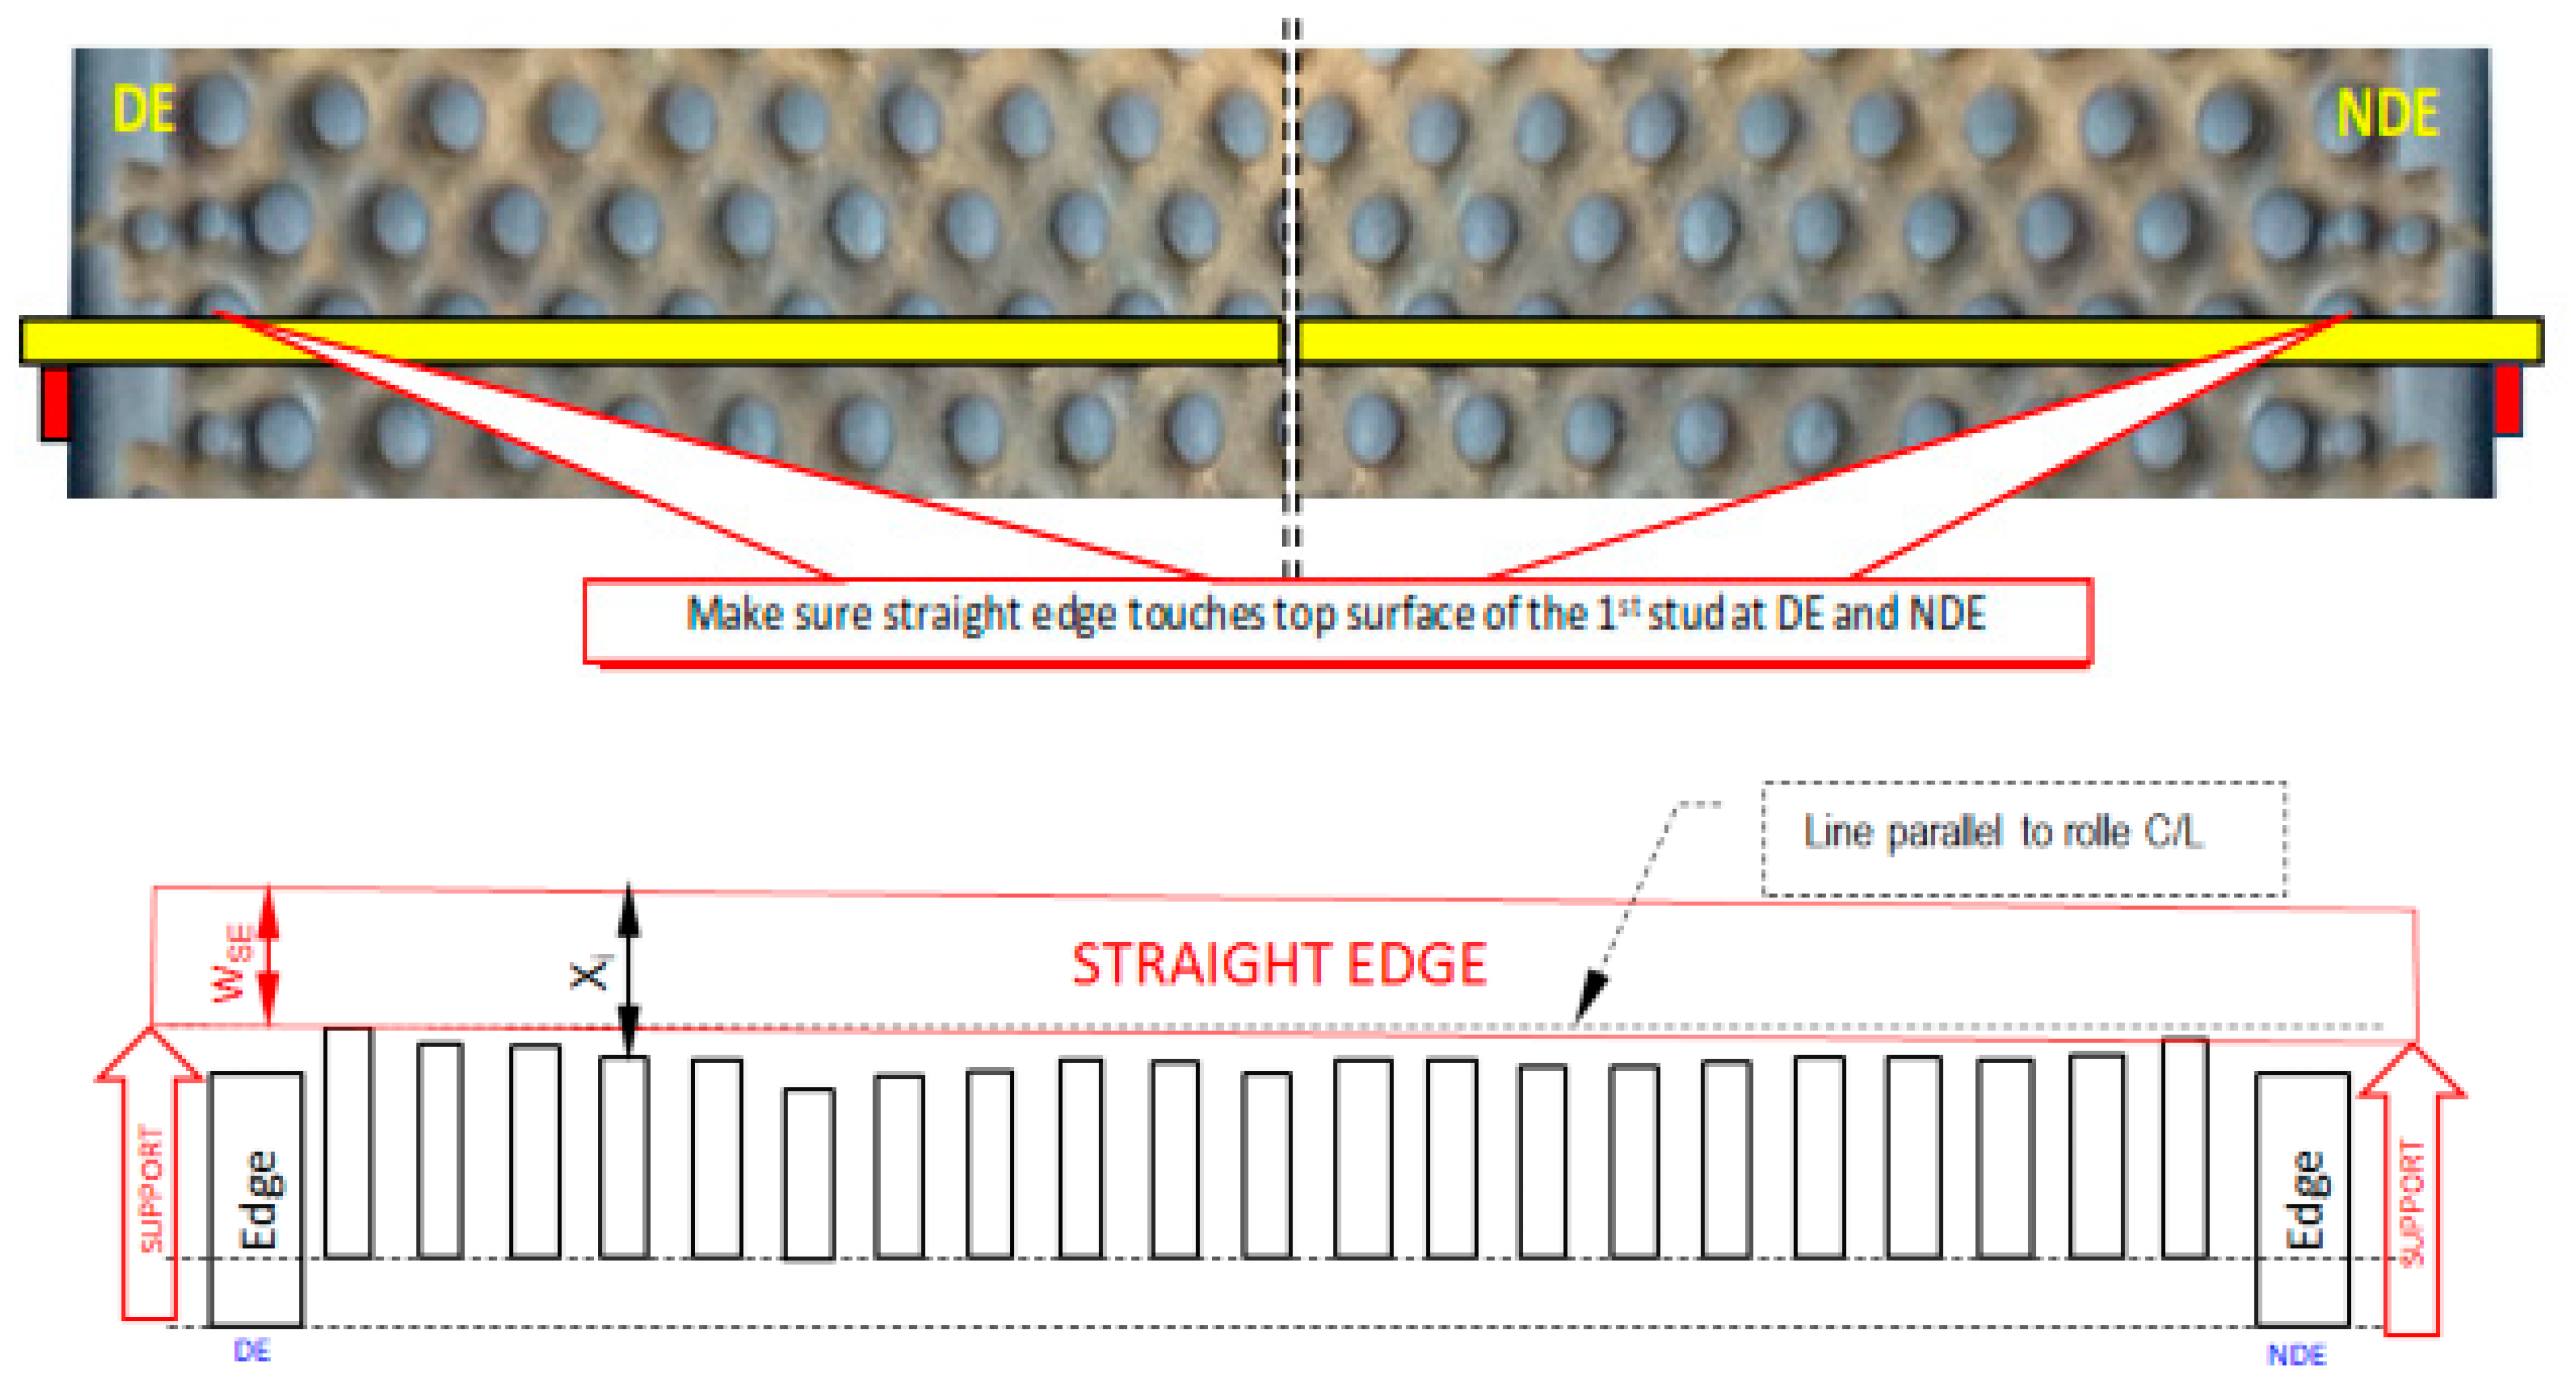
Figure 2.
Wear curve of (a) roll-fix studs and (a) float roll HPGR120MI01 at operating hours 6500, 7500, 8500, 9500.
Figure 2.
Wear curve of (a) roll-fix studs and (a) float roll HPGR120MI01 at operating hours 6500, 7500, 8500, 9500.
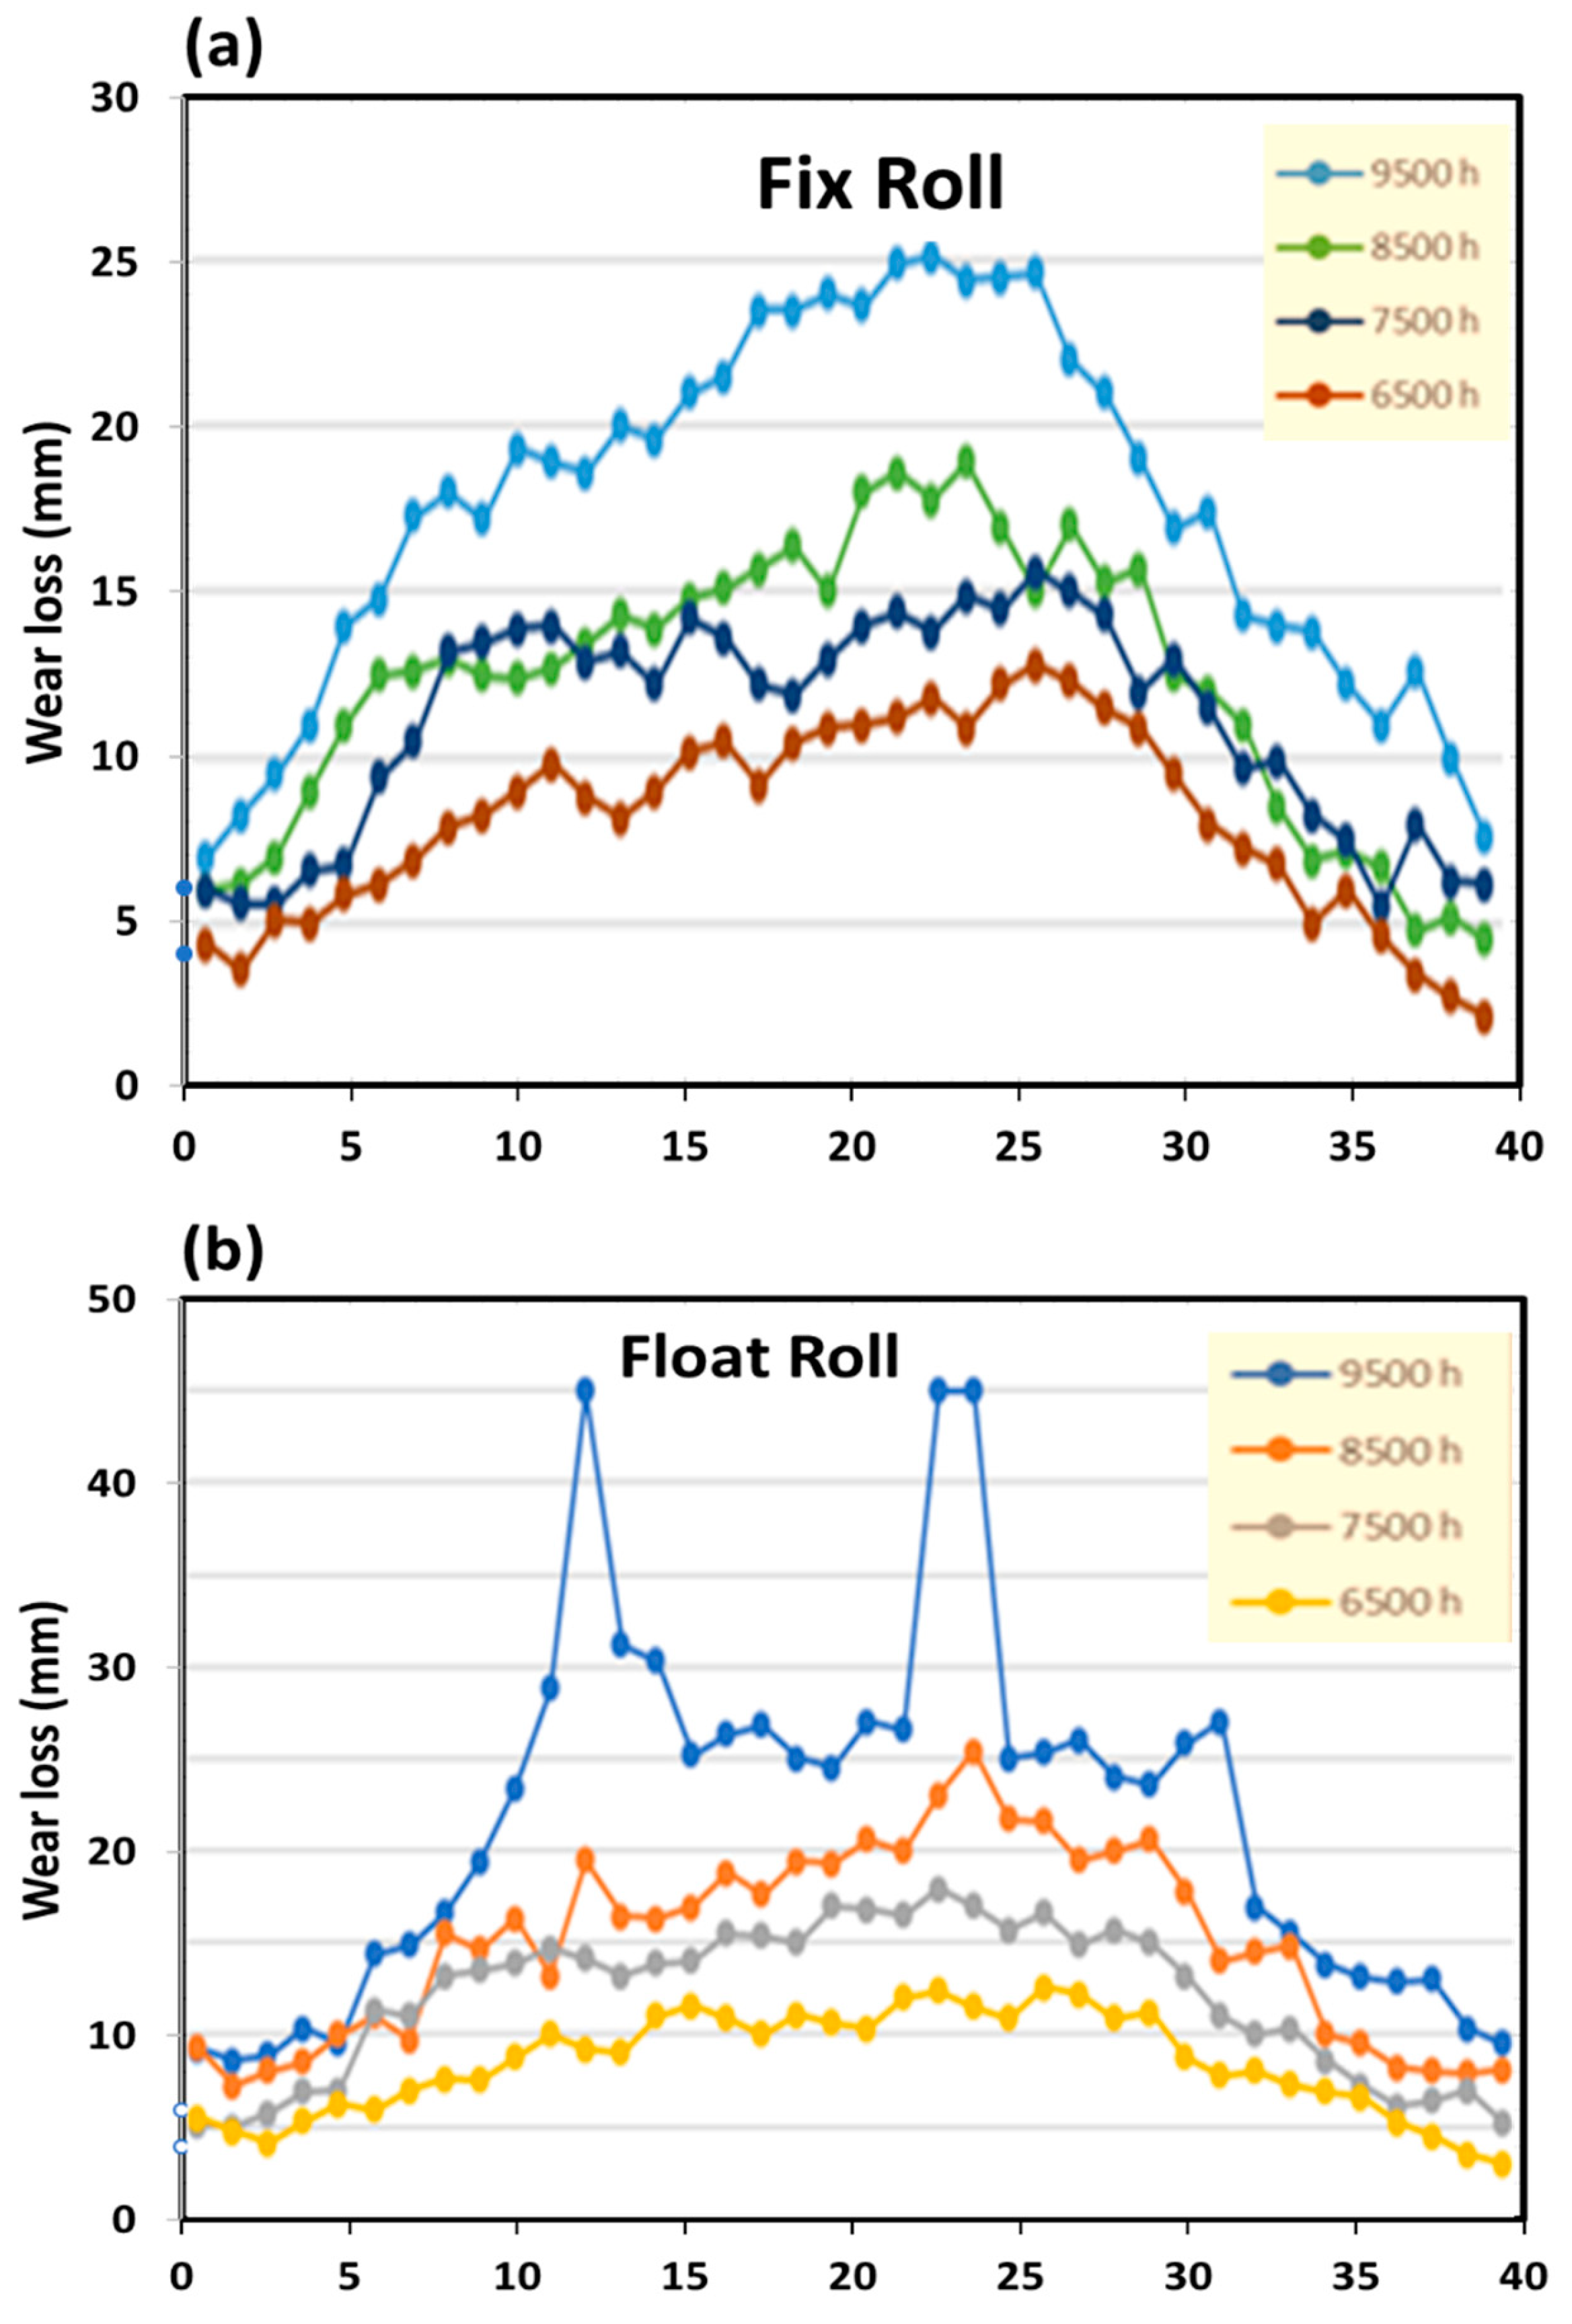
Figure 3.
Tire shell thickness at the center and edge of the roll for stud placement.
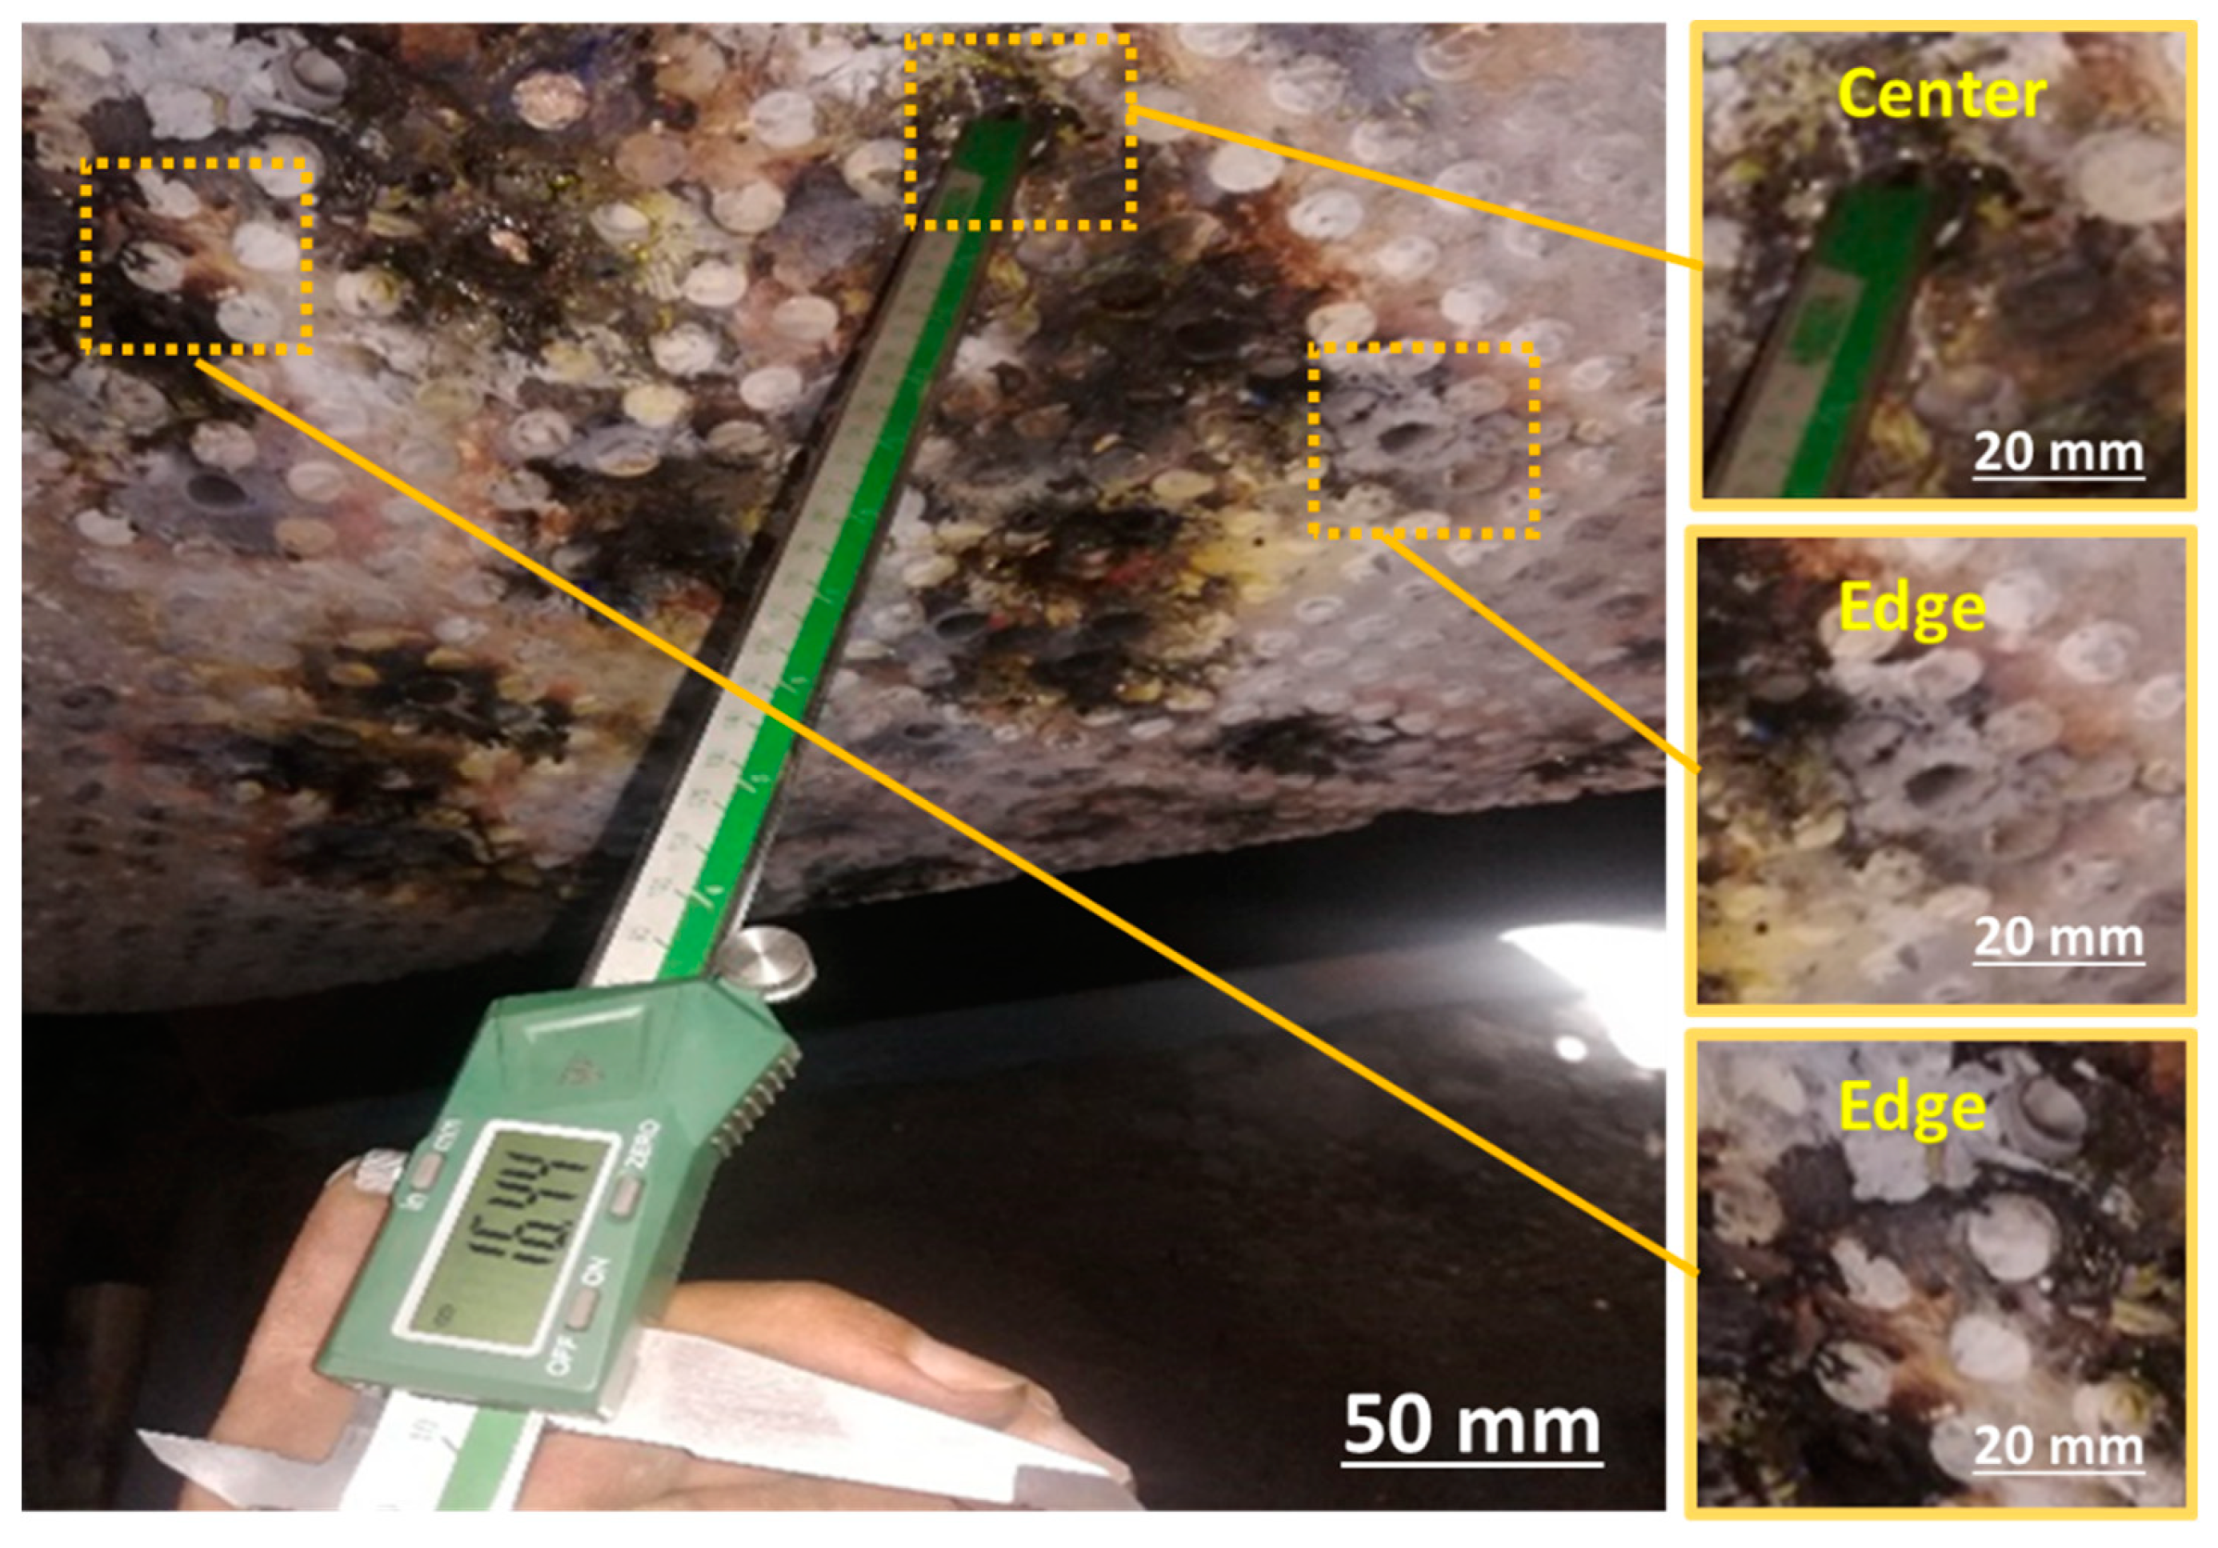
Figure 4.
Arrangement and dimensions of studs and Edge-Blocks inside the tire.
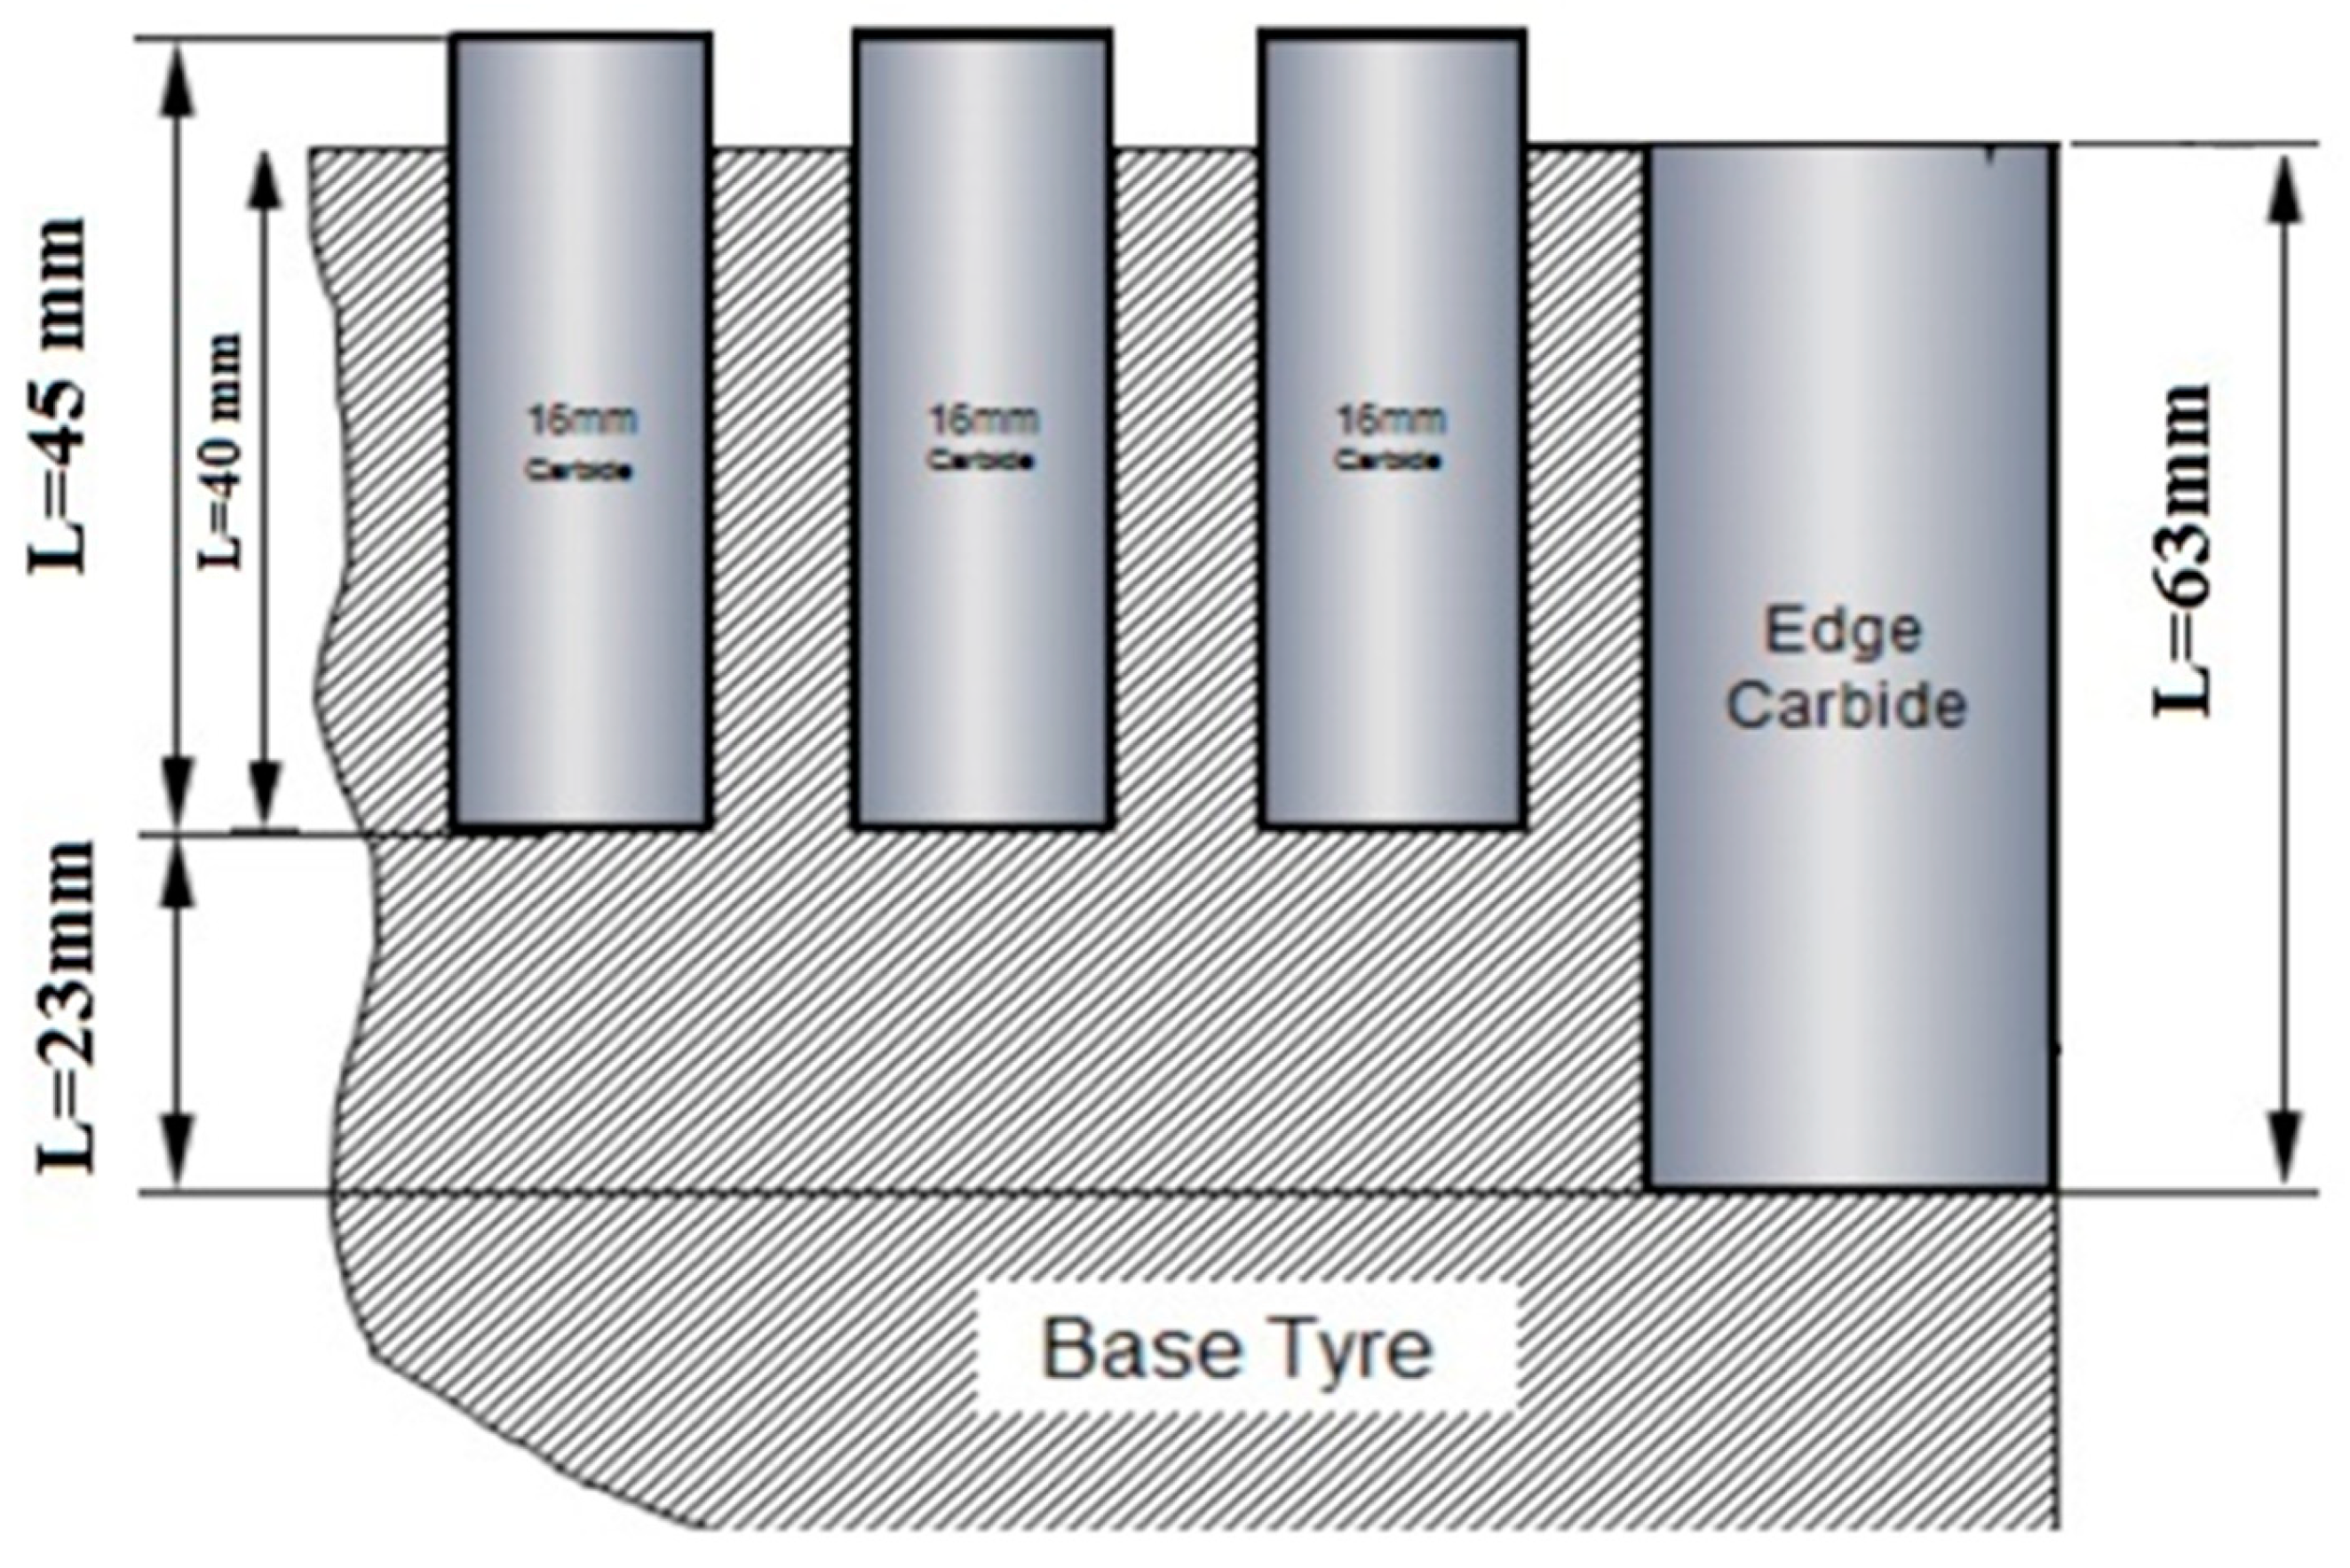
Figure 5.
Initiation of roll surface wear due to stud loss (operating at 6000 hours).
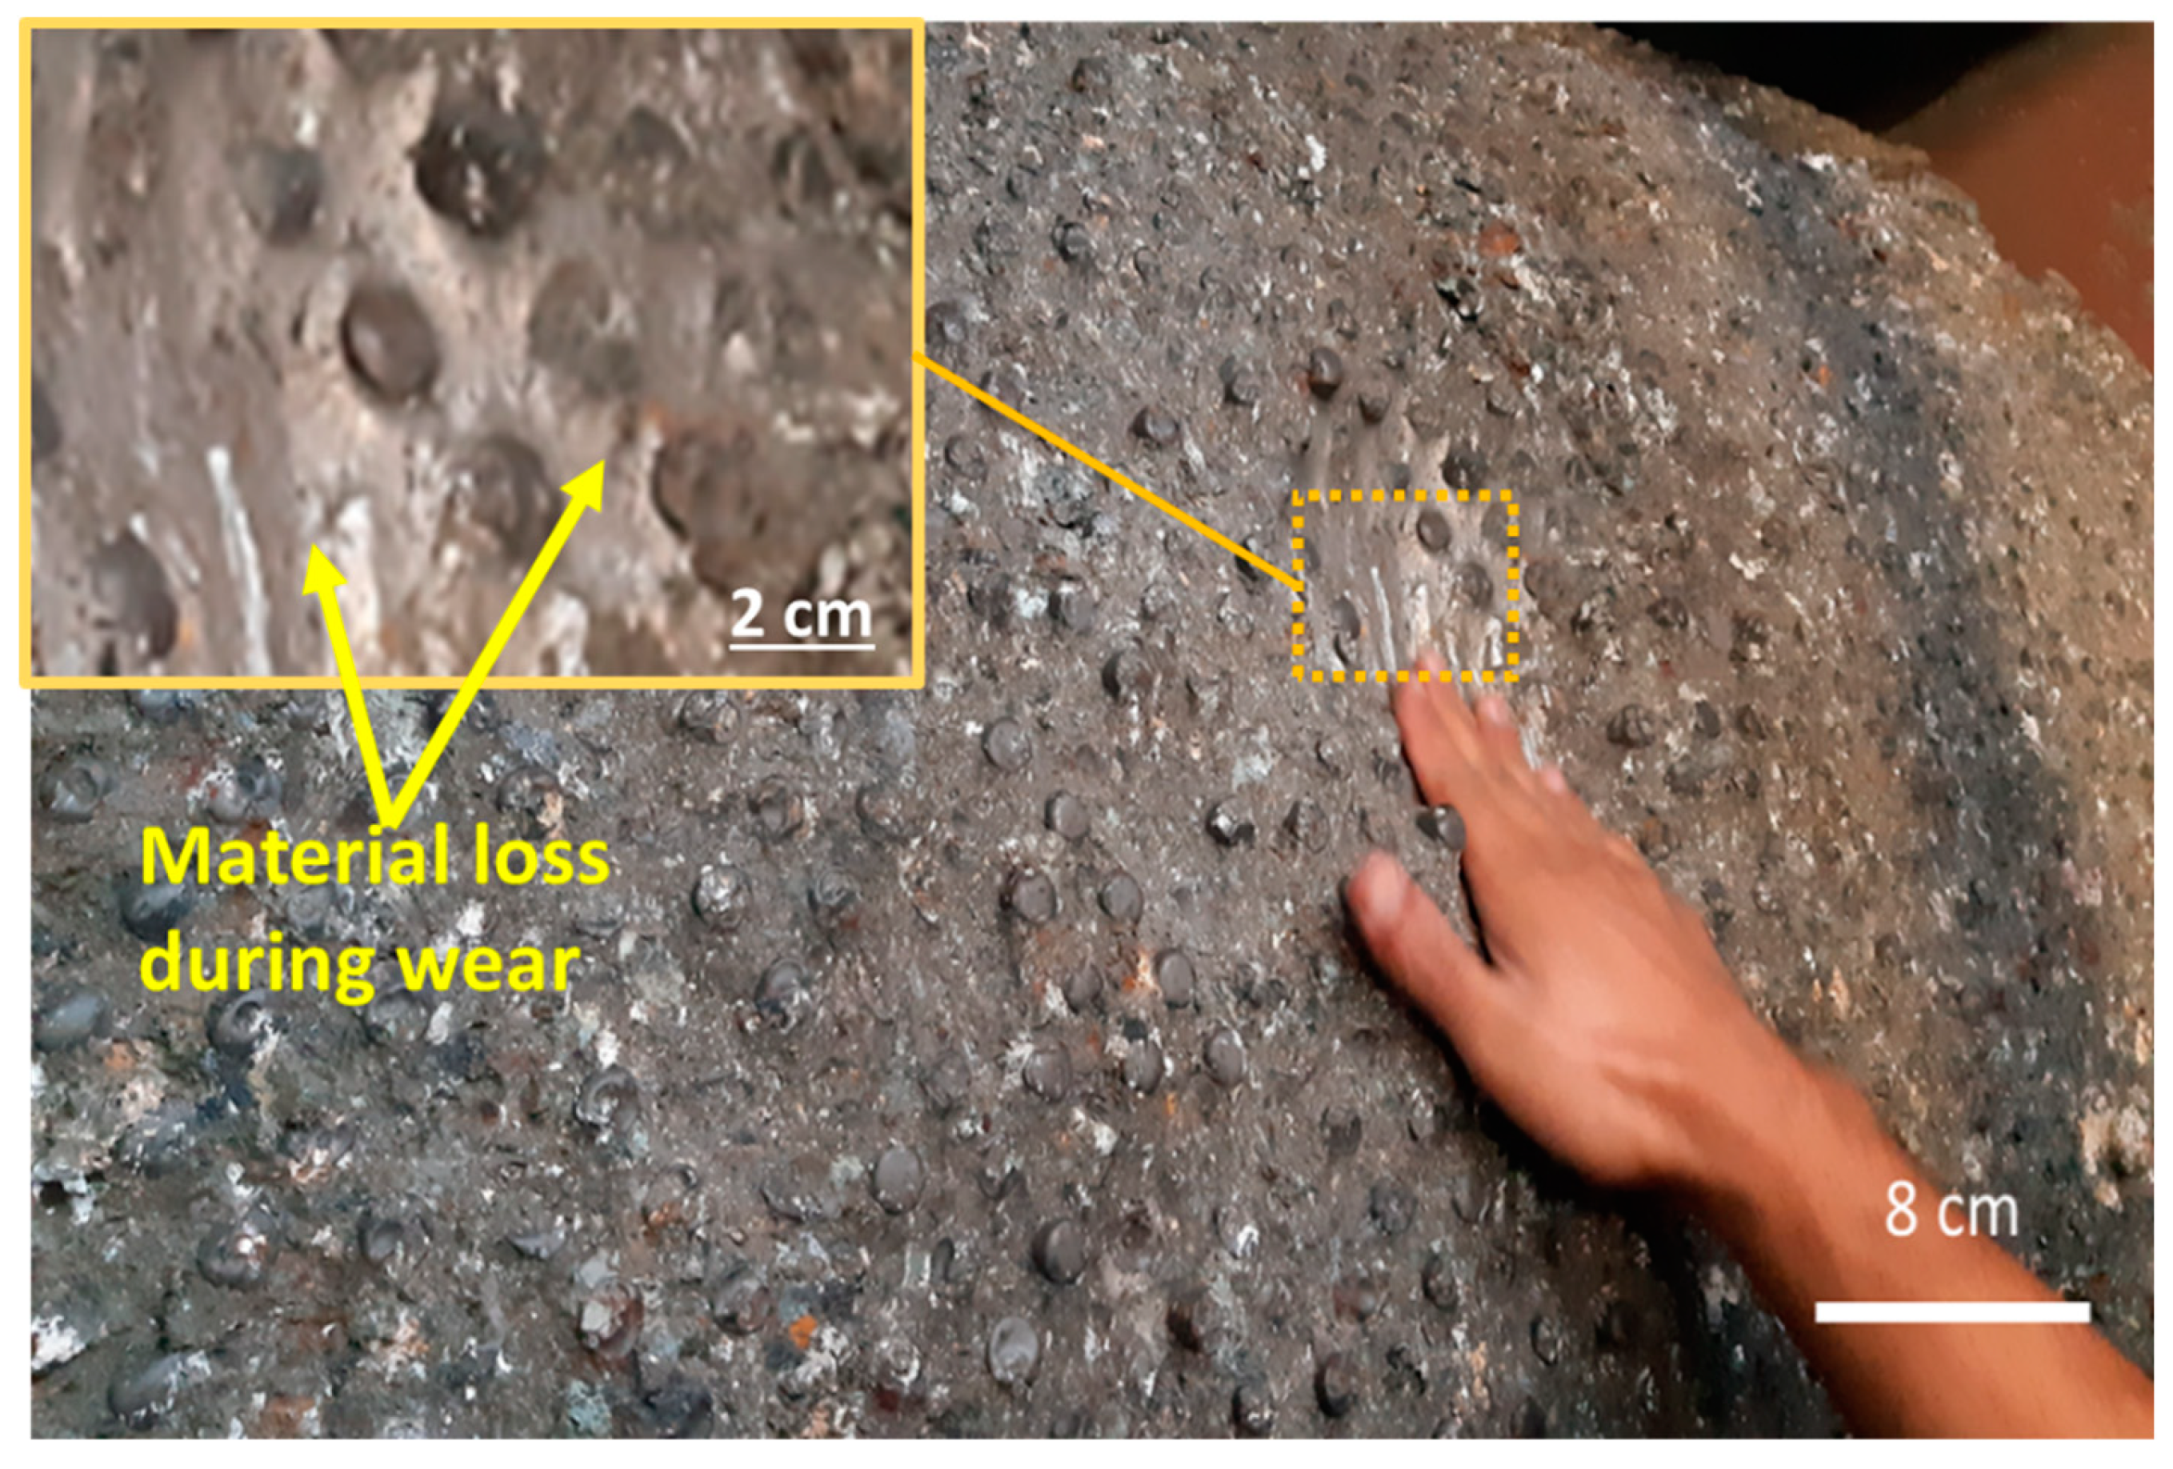
Figure 7.
Placement of gap adjustment shims (Shim A) at the top and bottom sections. Placement of type A shim plates for zero-gap adjustment.
Figure 7.
Placement of gap adjustment shims (Shim A) at the top and bottom sections. Placement of type A shim plates for zero-gap adjustment.
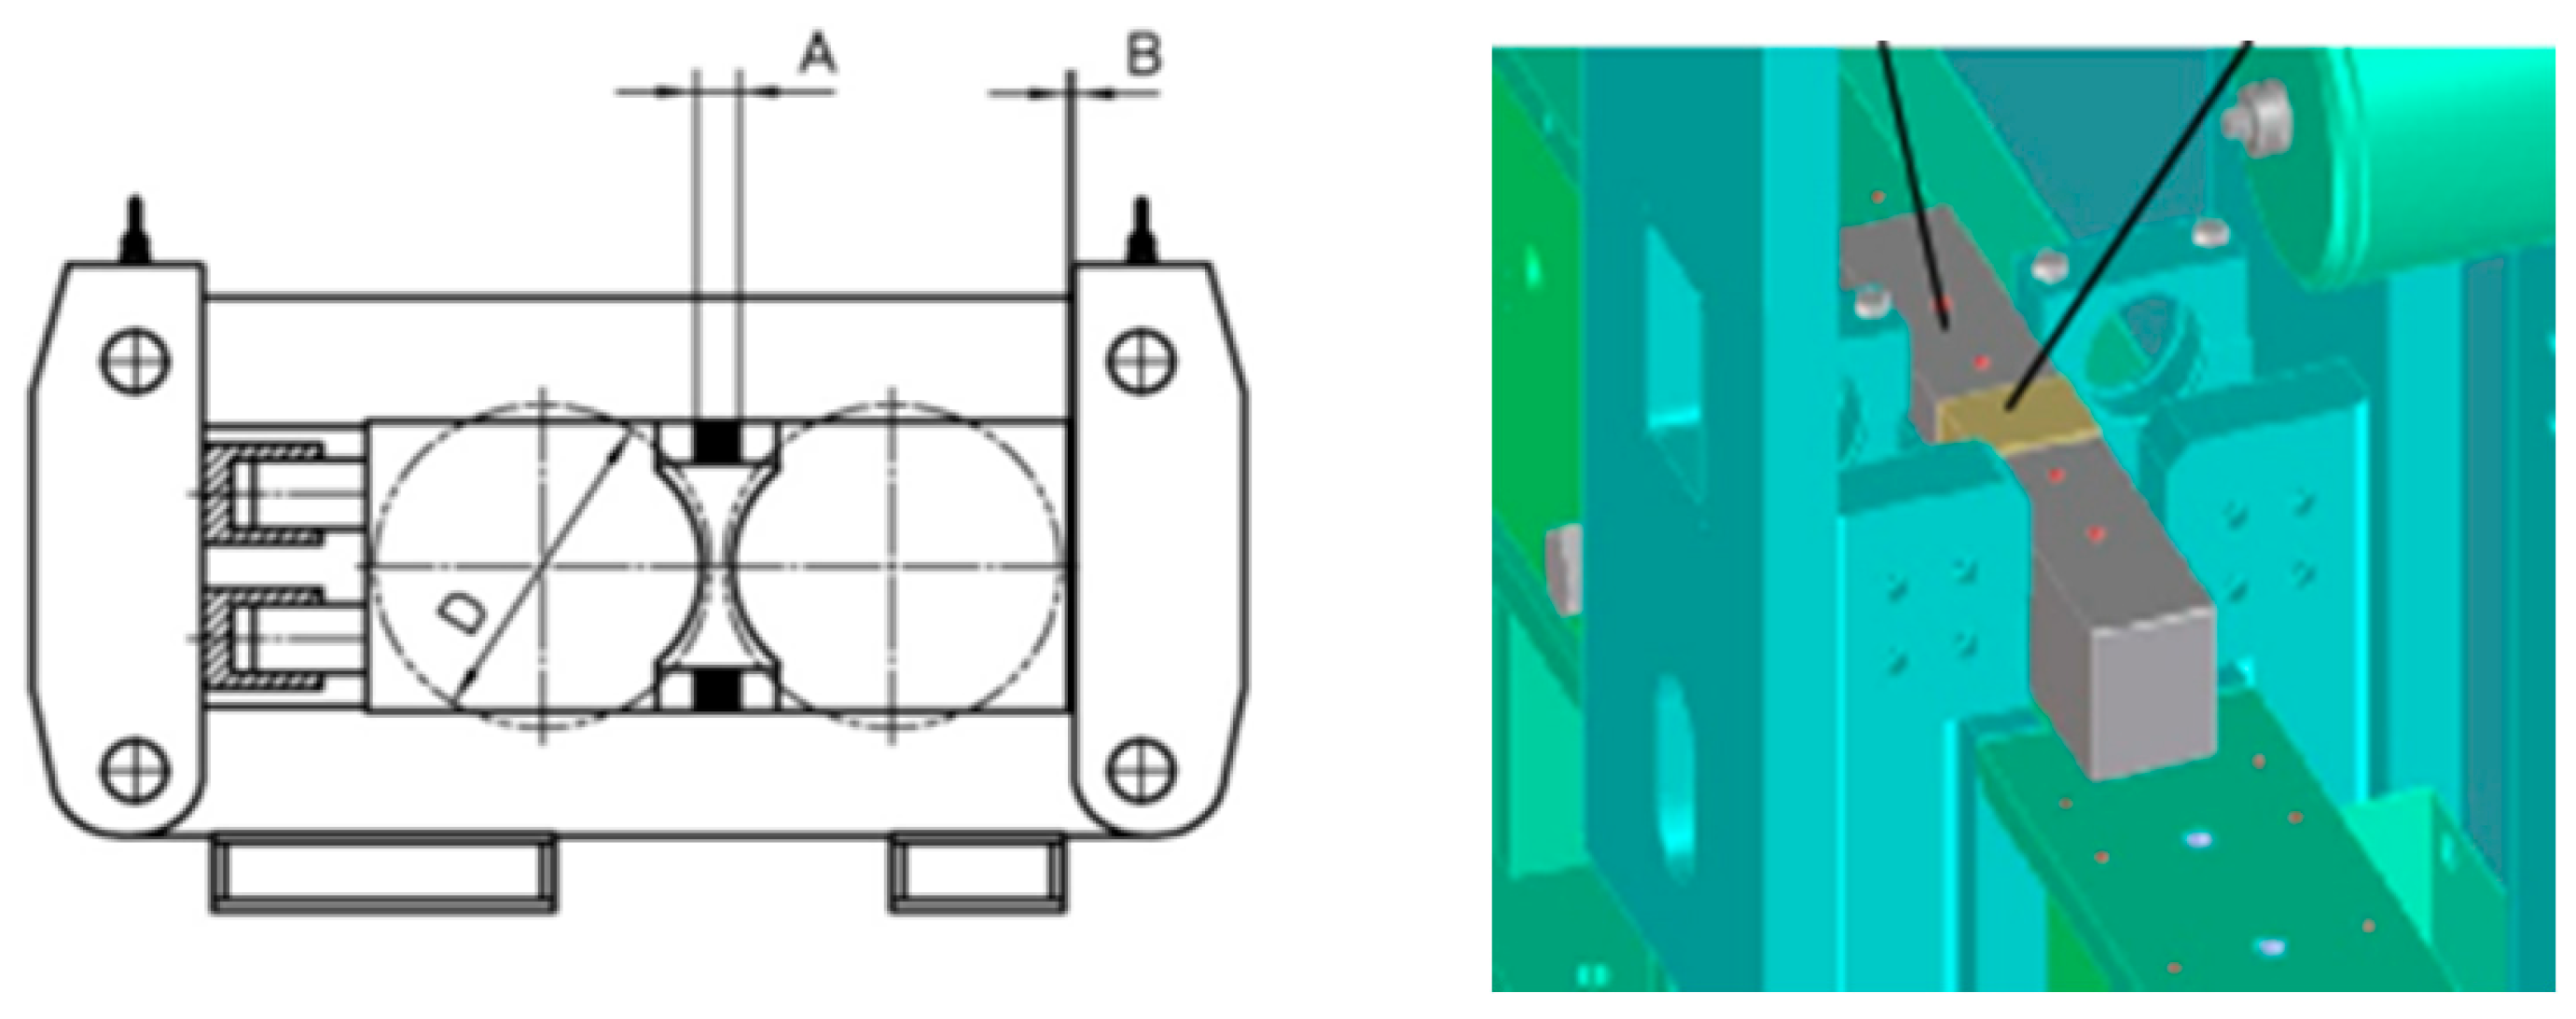
Figure 8.
Zero-gap measurement (equipment operating at 9500 hours).
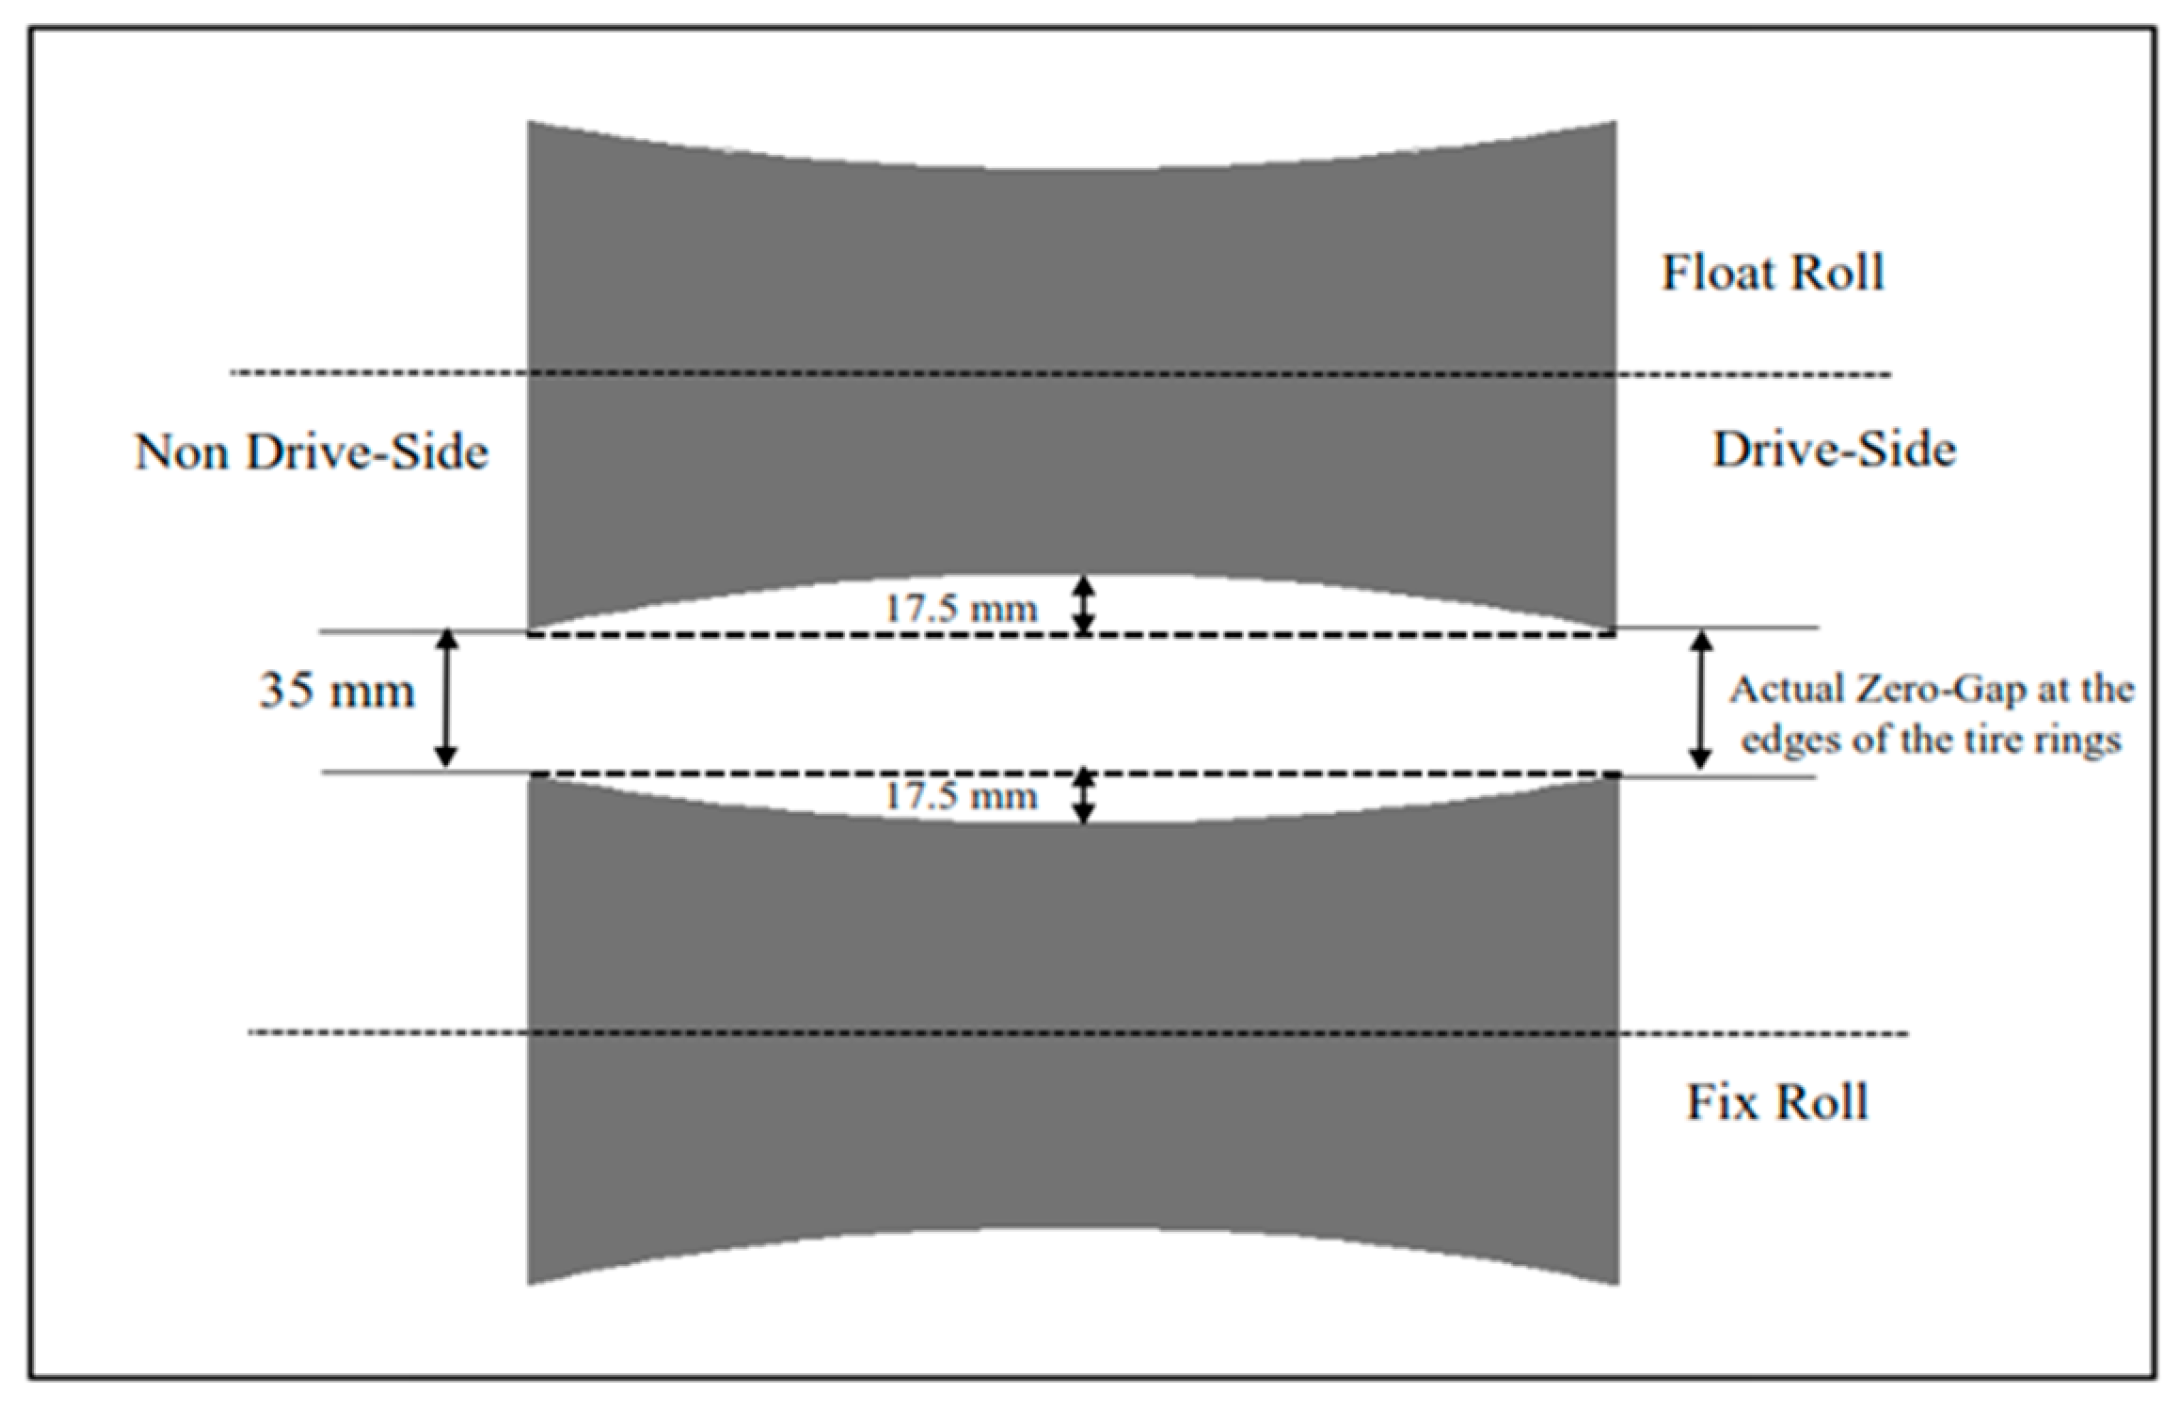
Figure 9.
Sizes of replaceable studs: 26.5, 31.5, 36.5, 41.5.
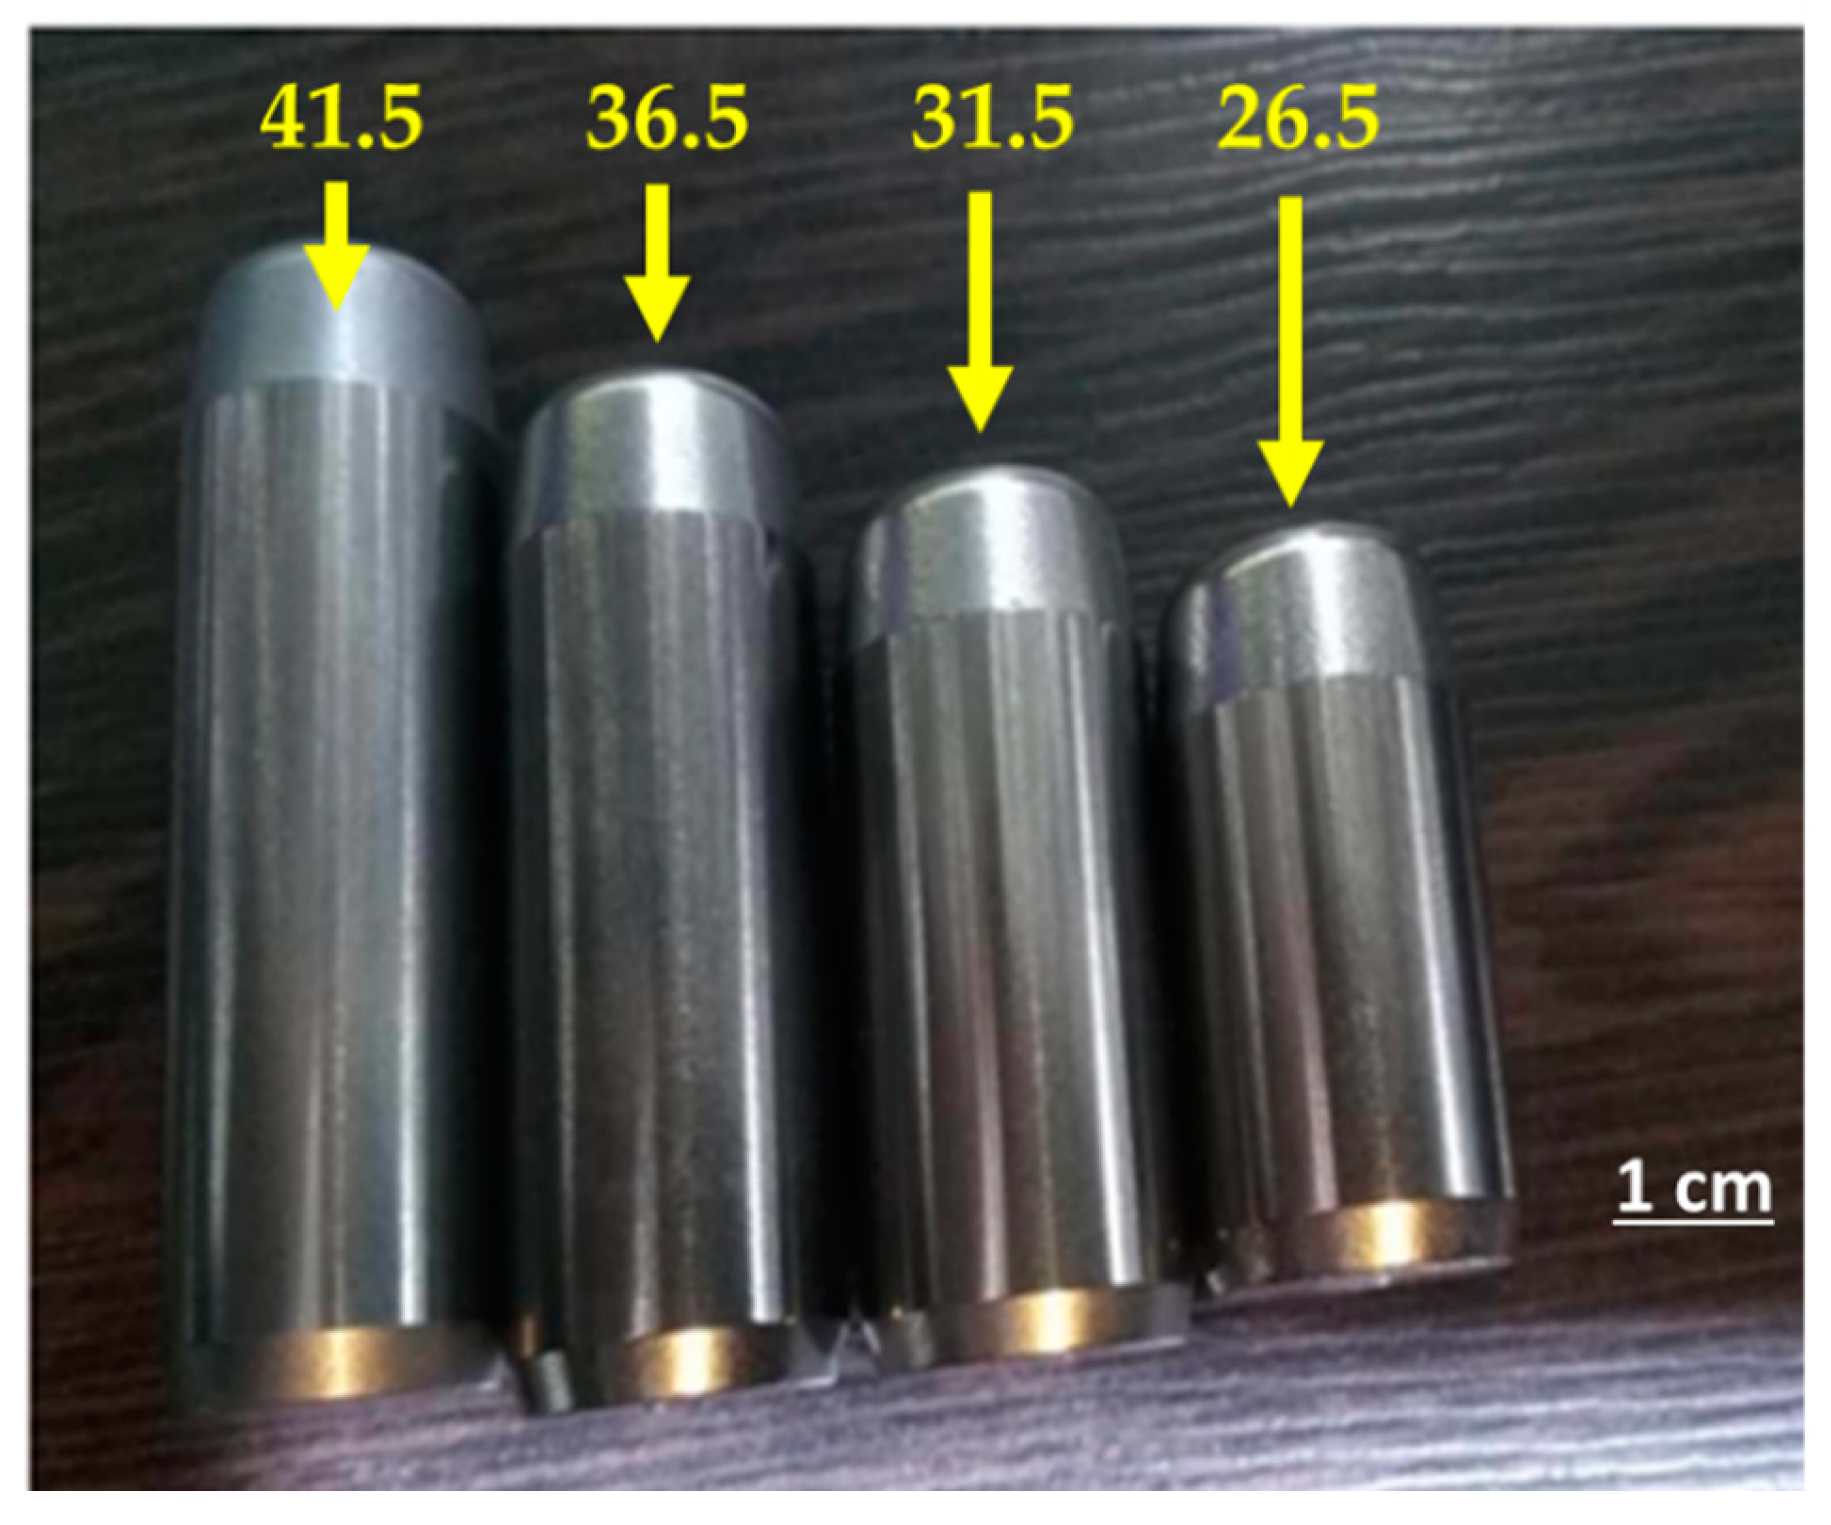
Figure 10.
Failure to replace broken studs and continuation of the crushing operation.
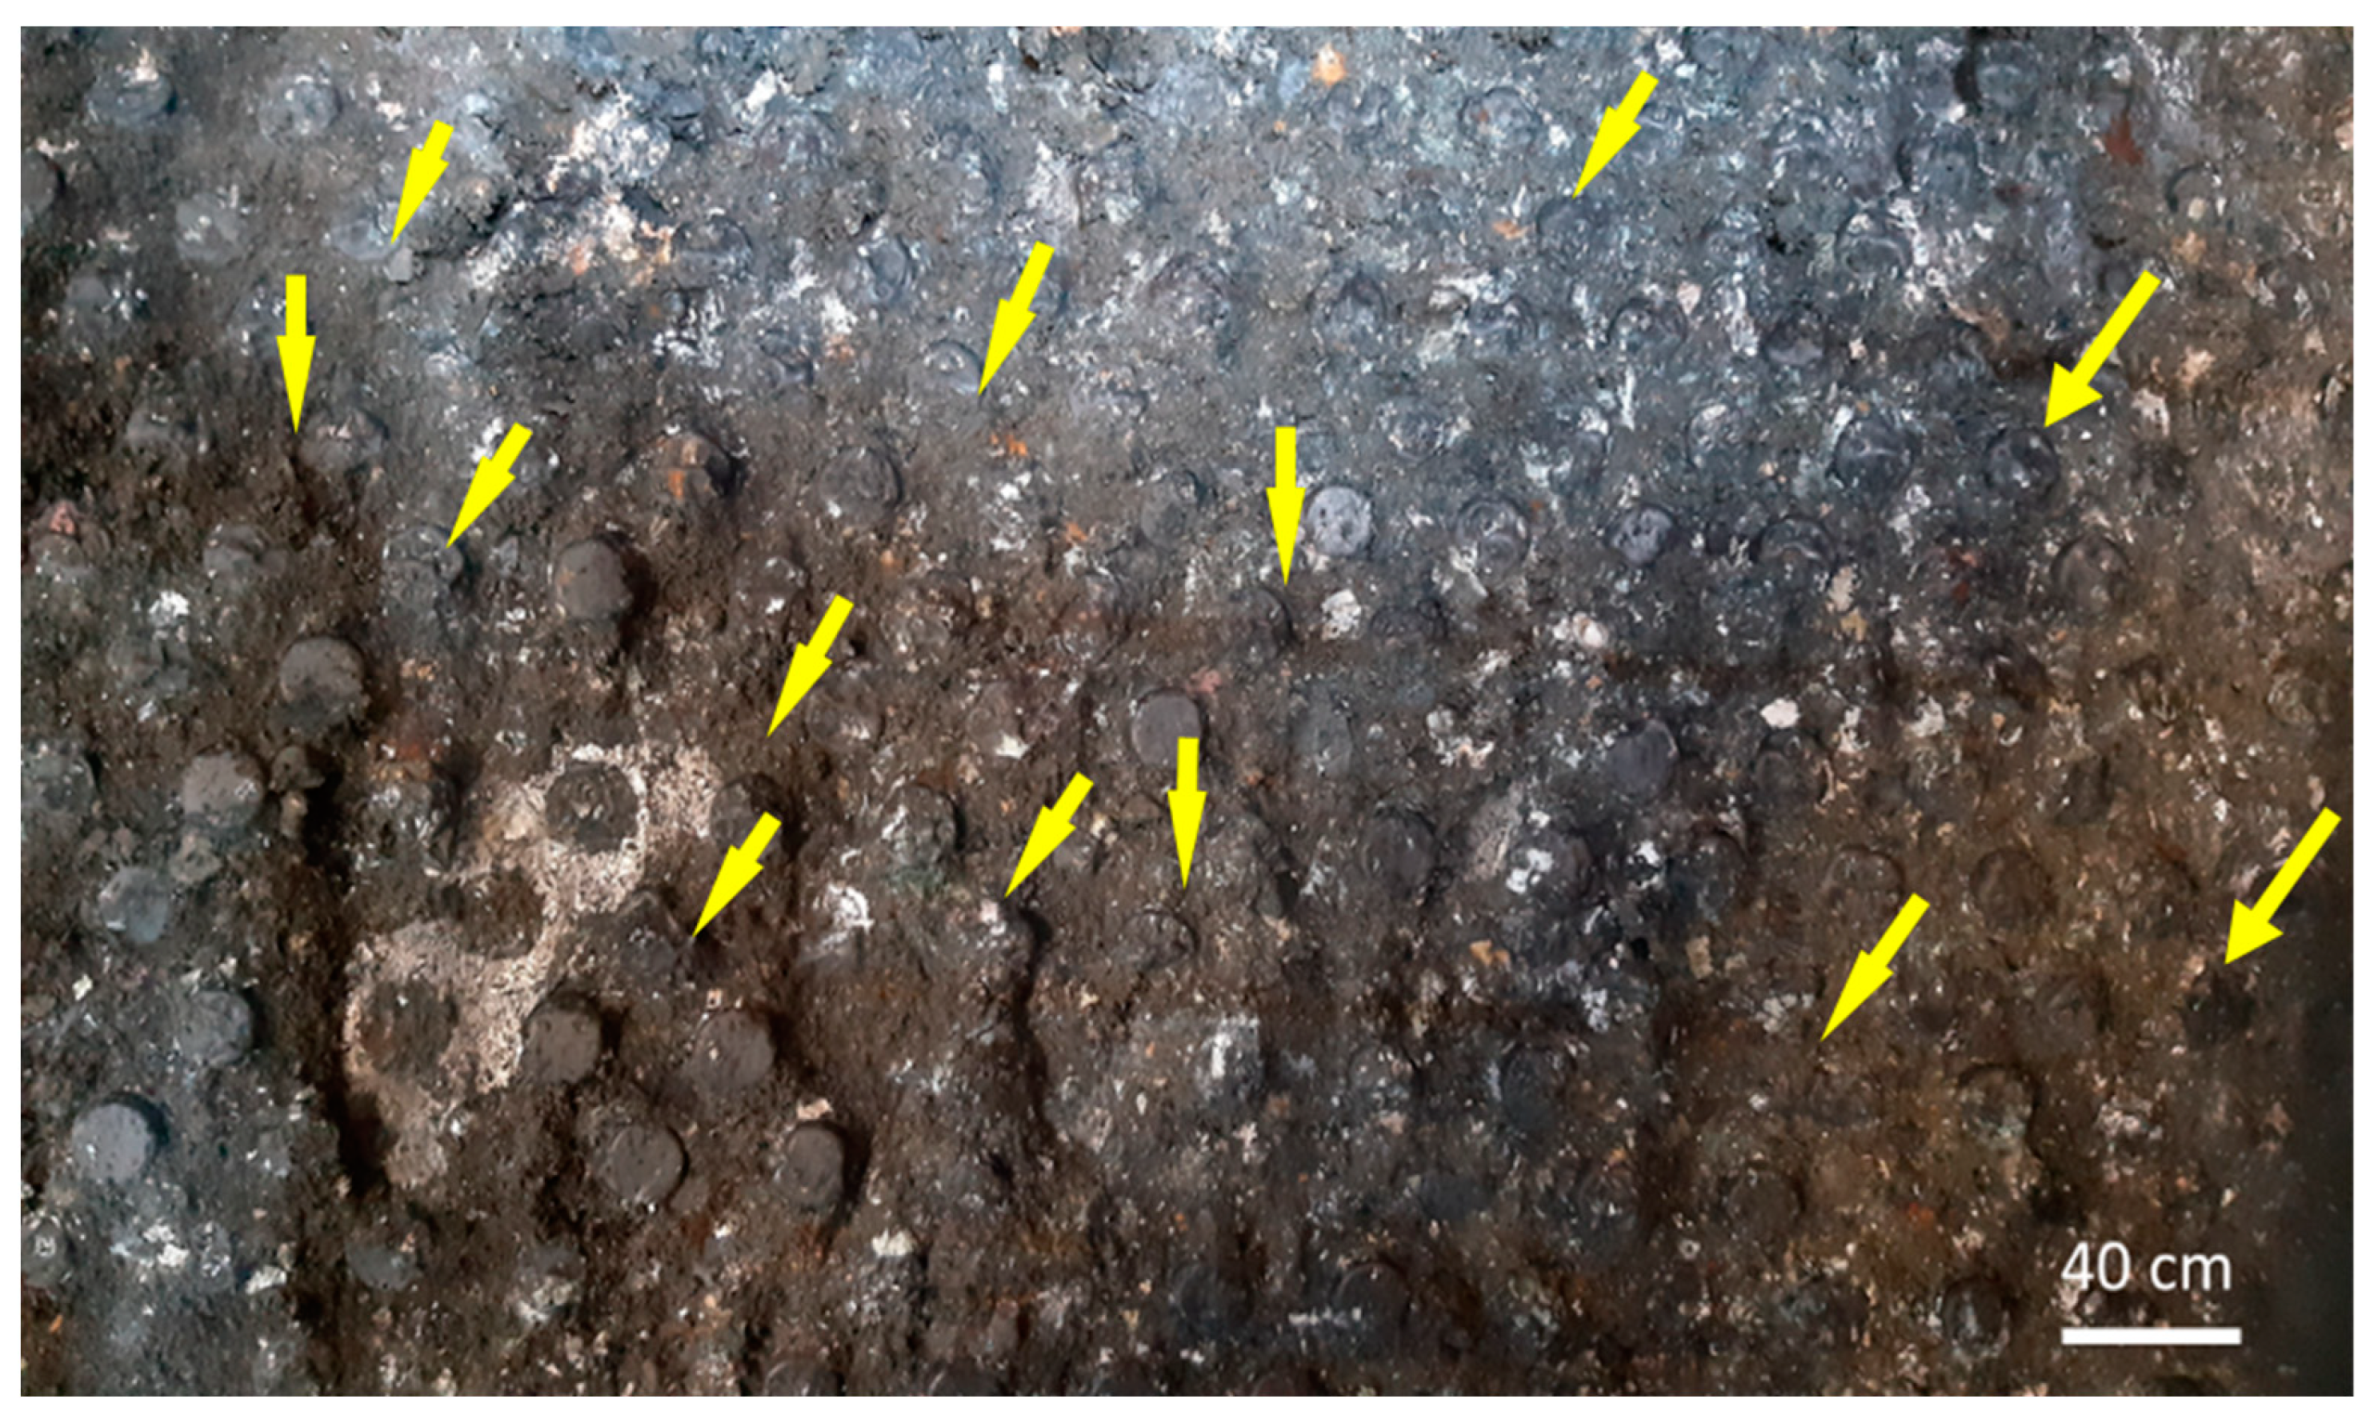
Figure 11.
(a) View of simultaneous replacement of multiple studs (b) Stud protrusion from the tire surface.
Figure 11.
(a) View of simultaneous replacement of multiple studs (b) Stud protrusion from the tire surface.
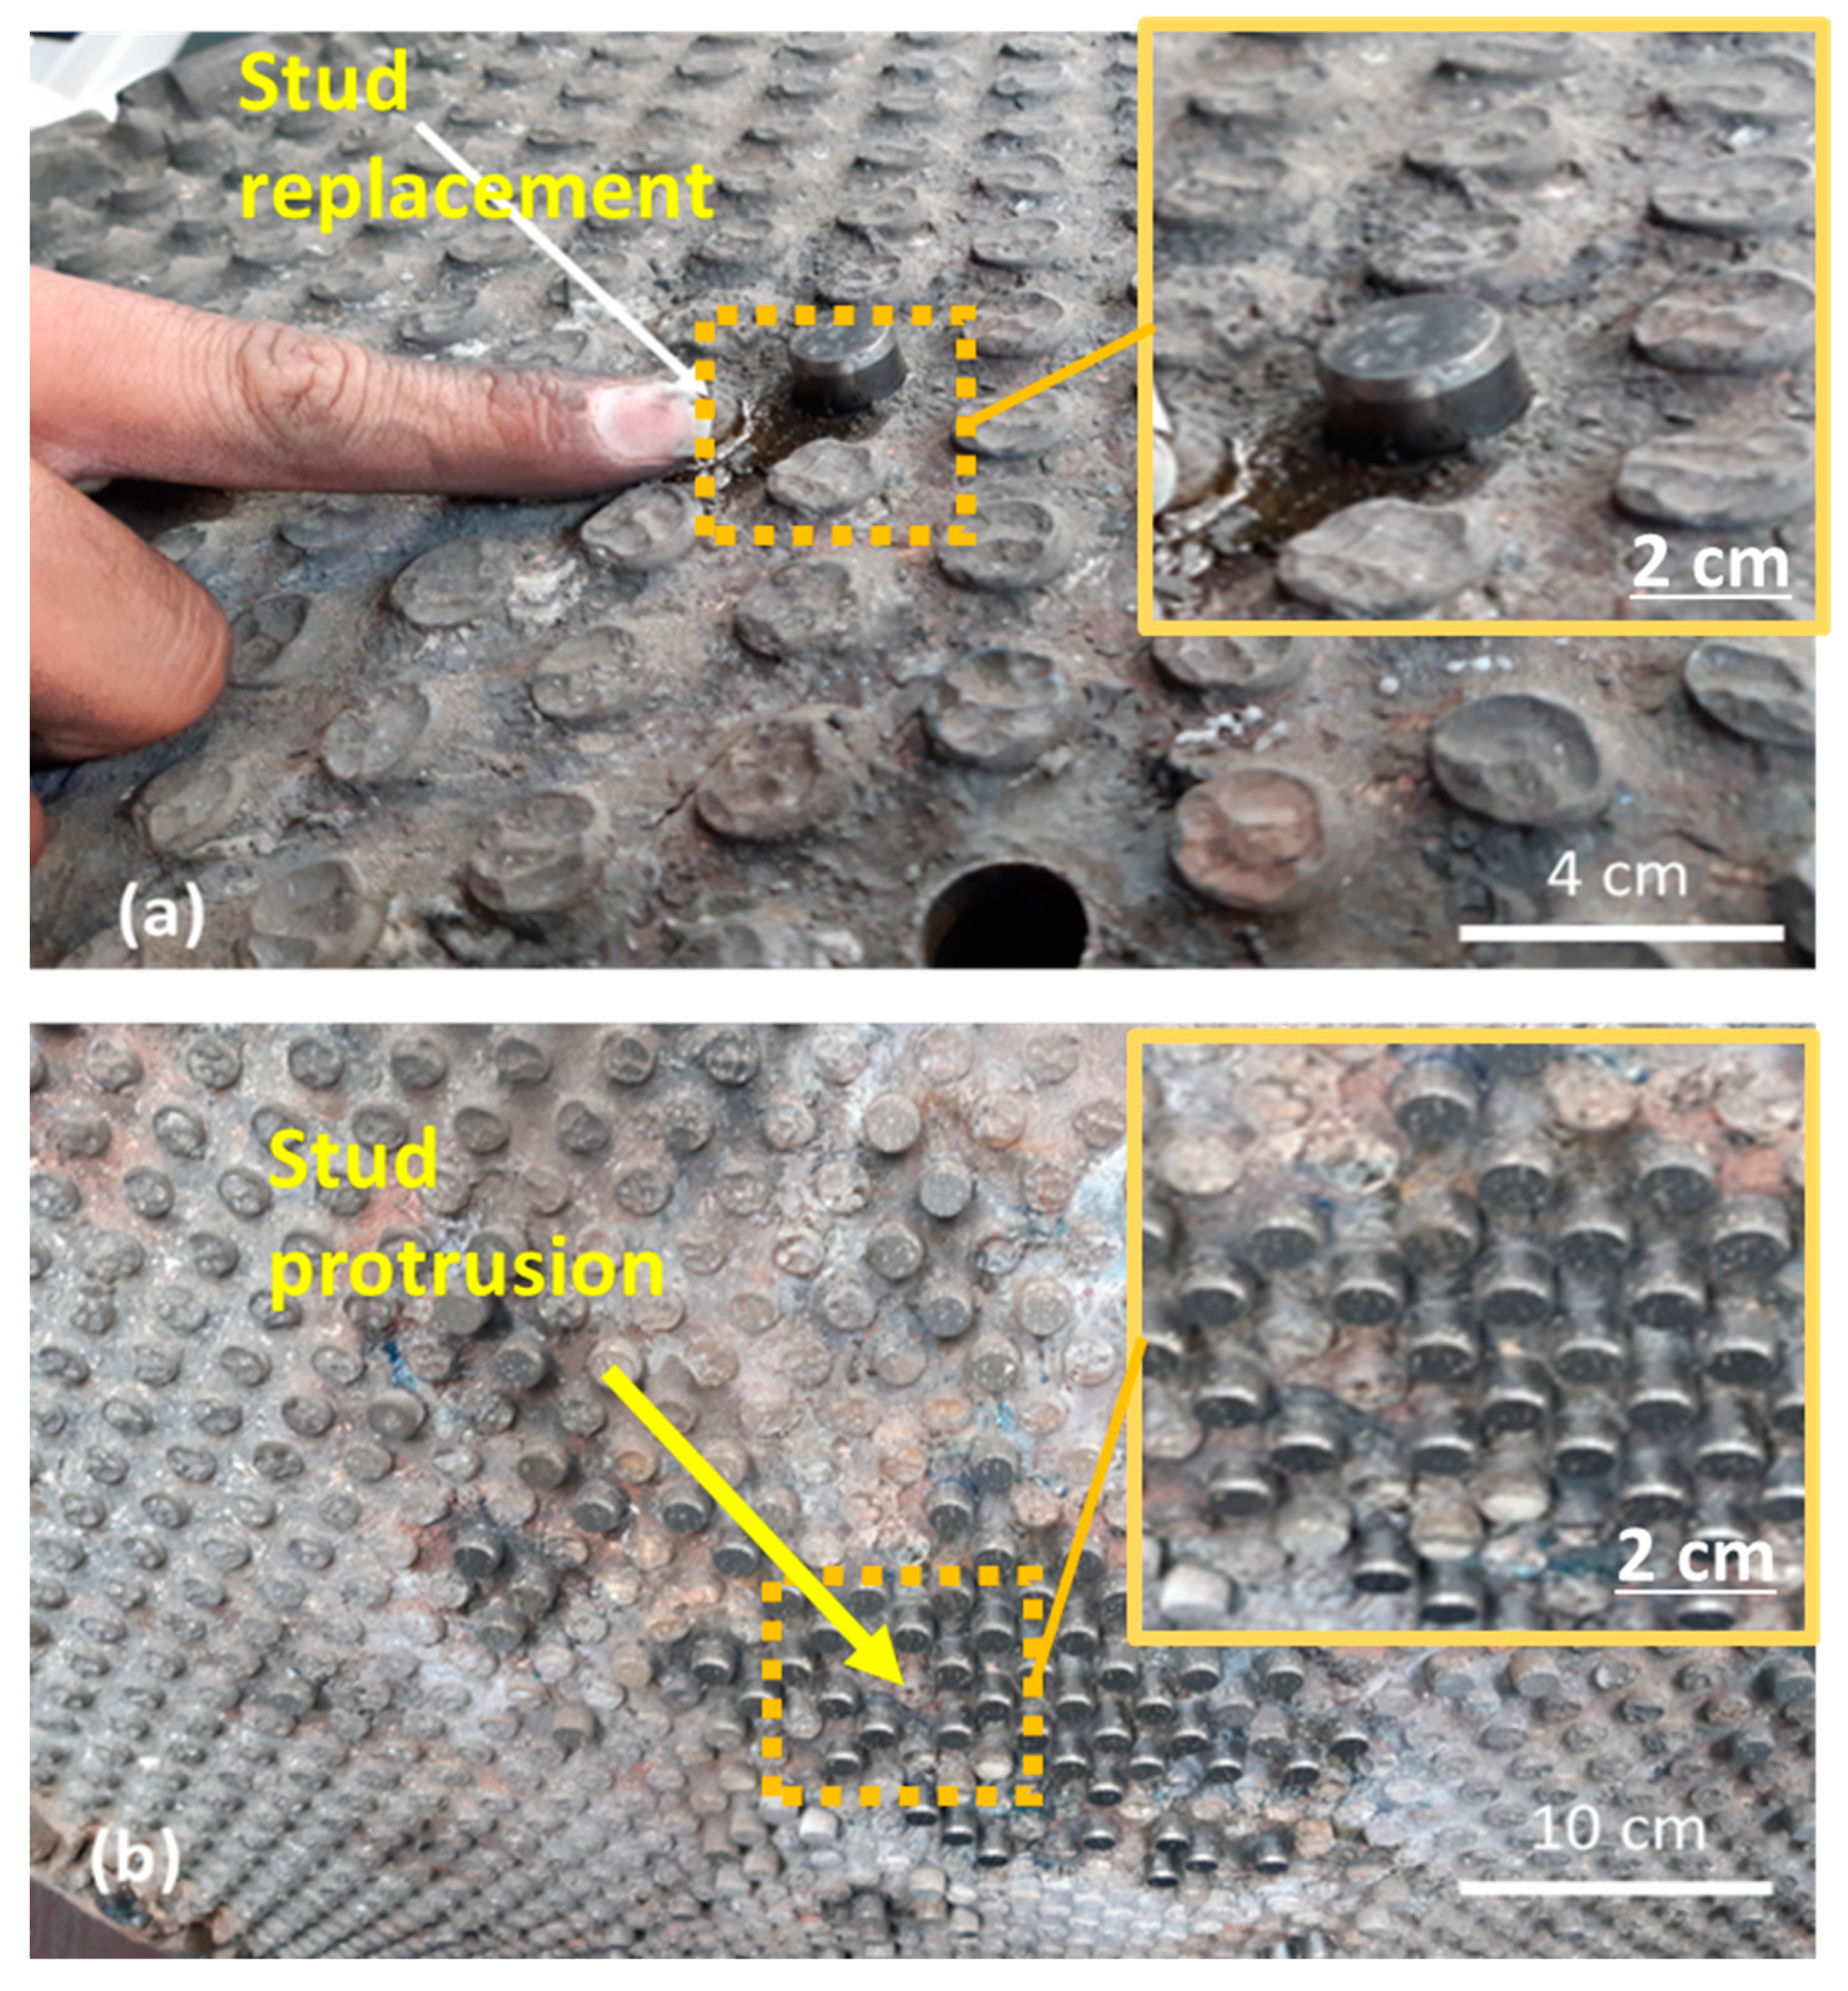
Figure 13.
(a) Improper check plate adjustment leading to edge block breakage and check plate surface damage. (b) Excessive gap between the check plate and the tire.
Figure 13.
(a) Improper check plate adjustment leading to edge block breakage and check plate surface damage. (b) Excessive gap between the check plate and the tire.
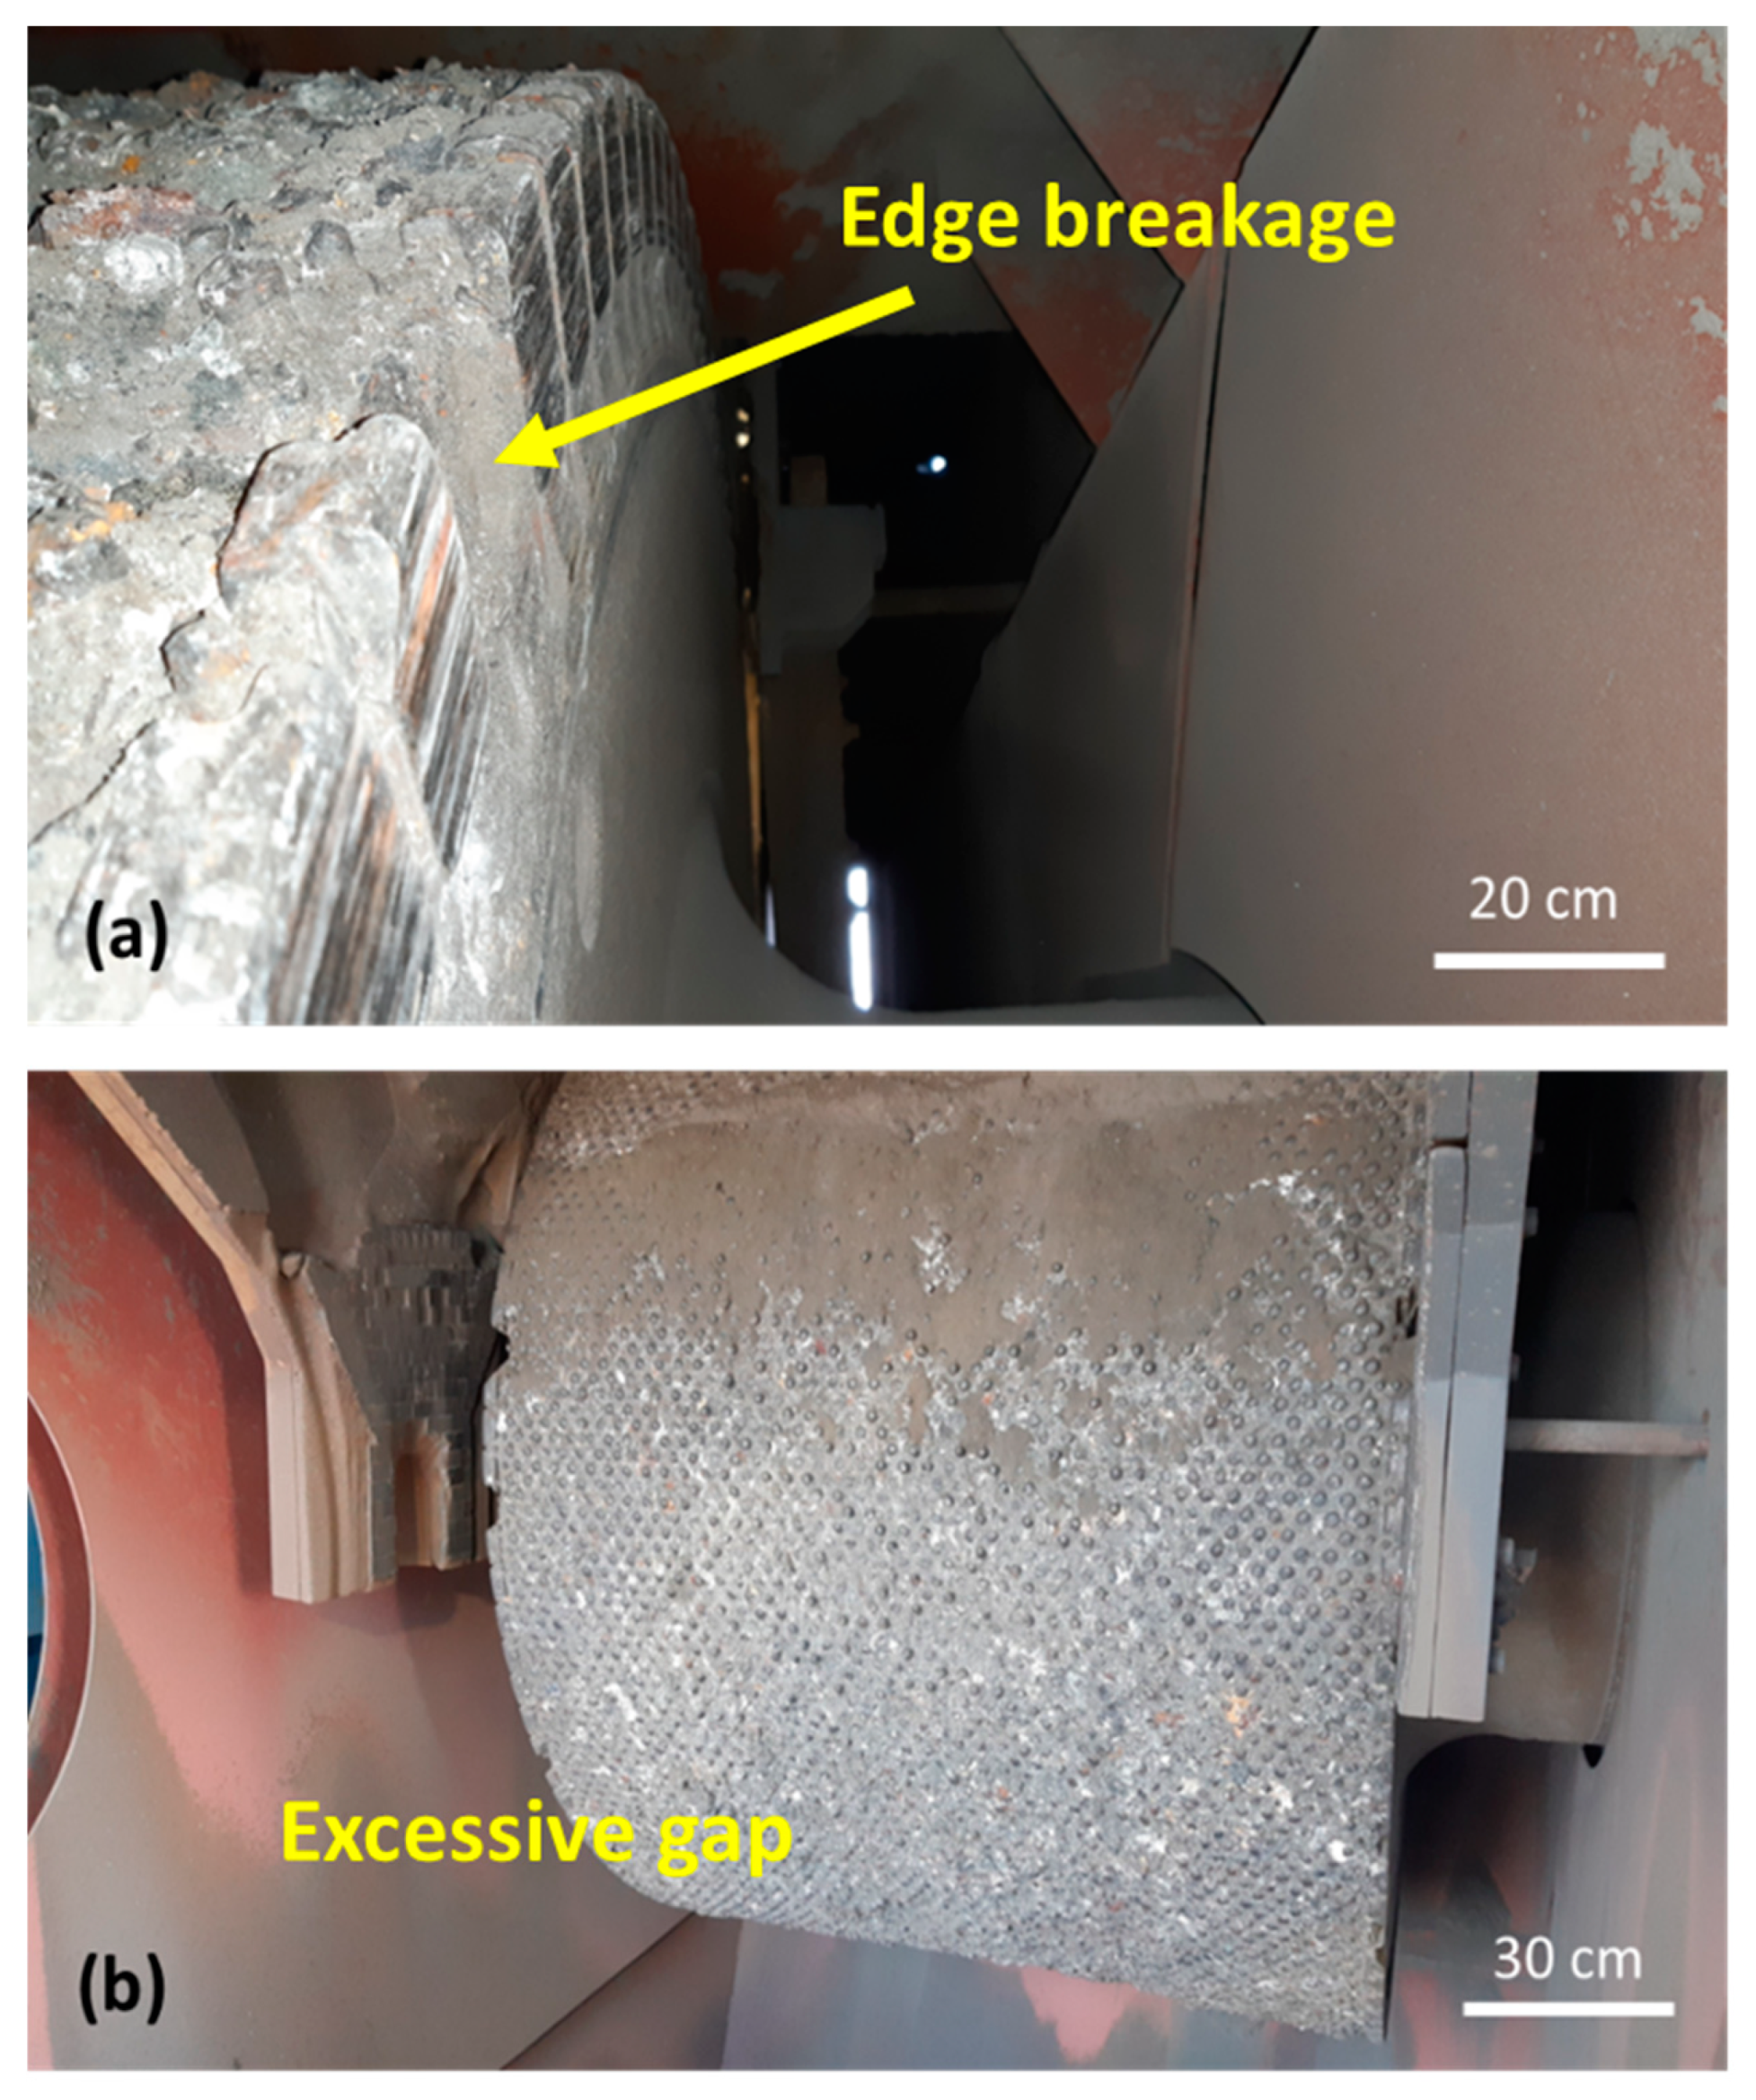
Figure 14.
Misalignment of the gravity feeder, causing material spillage onto the flute roll.
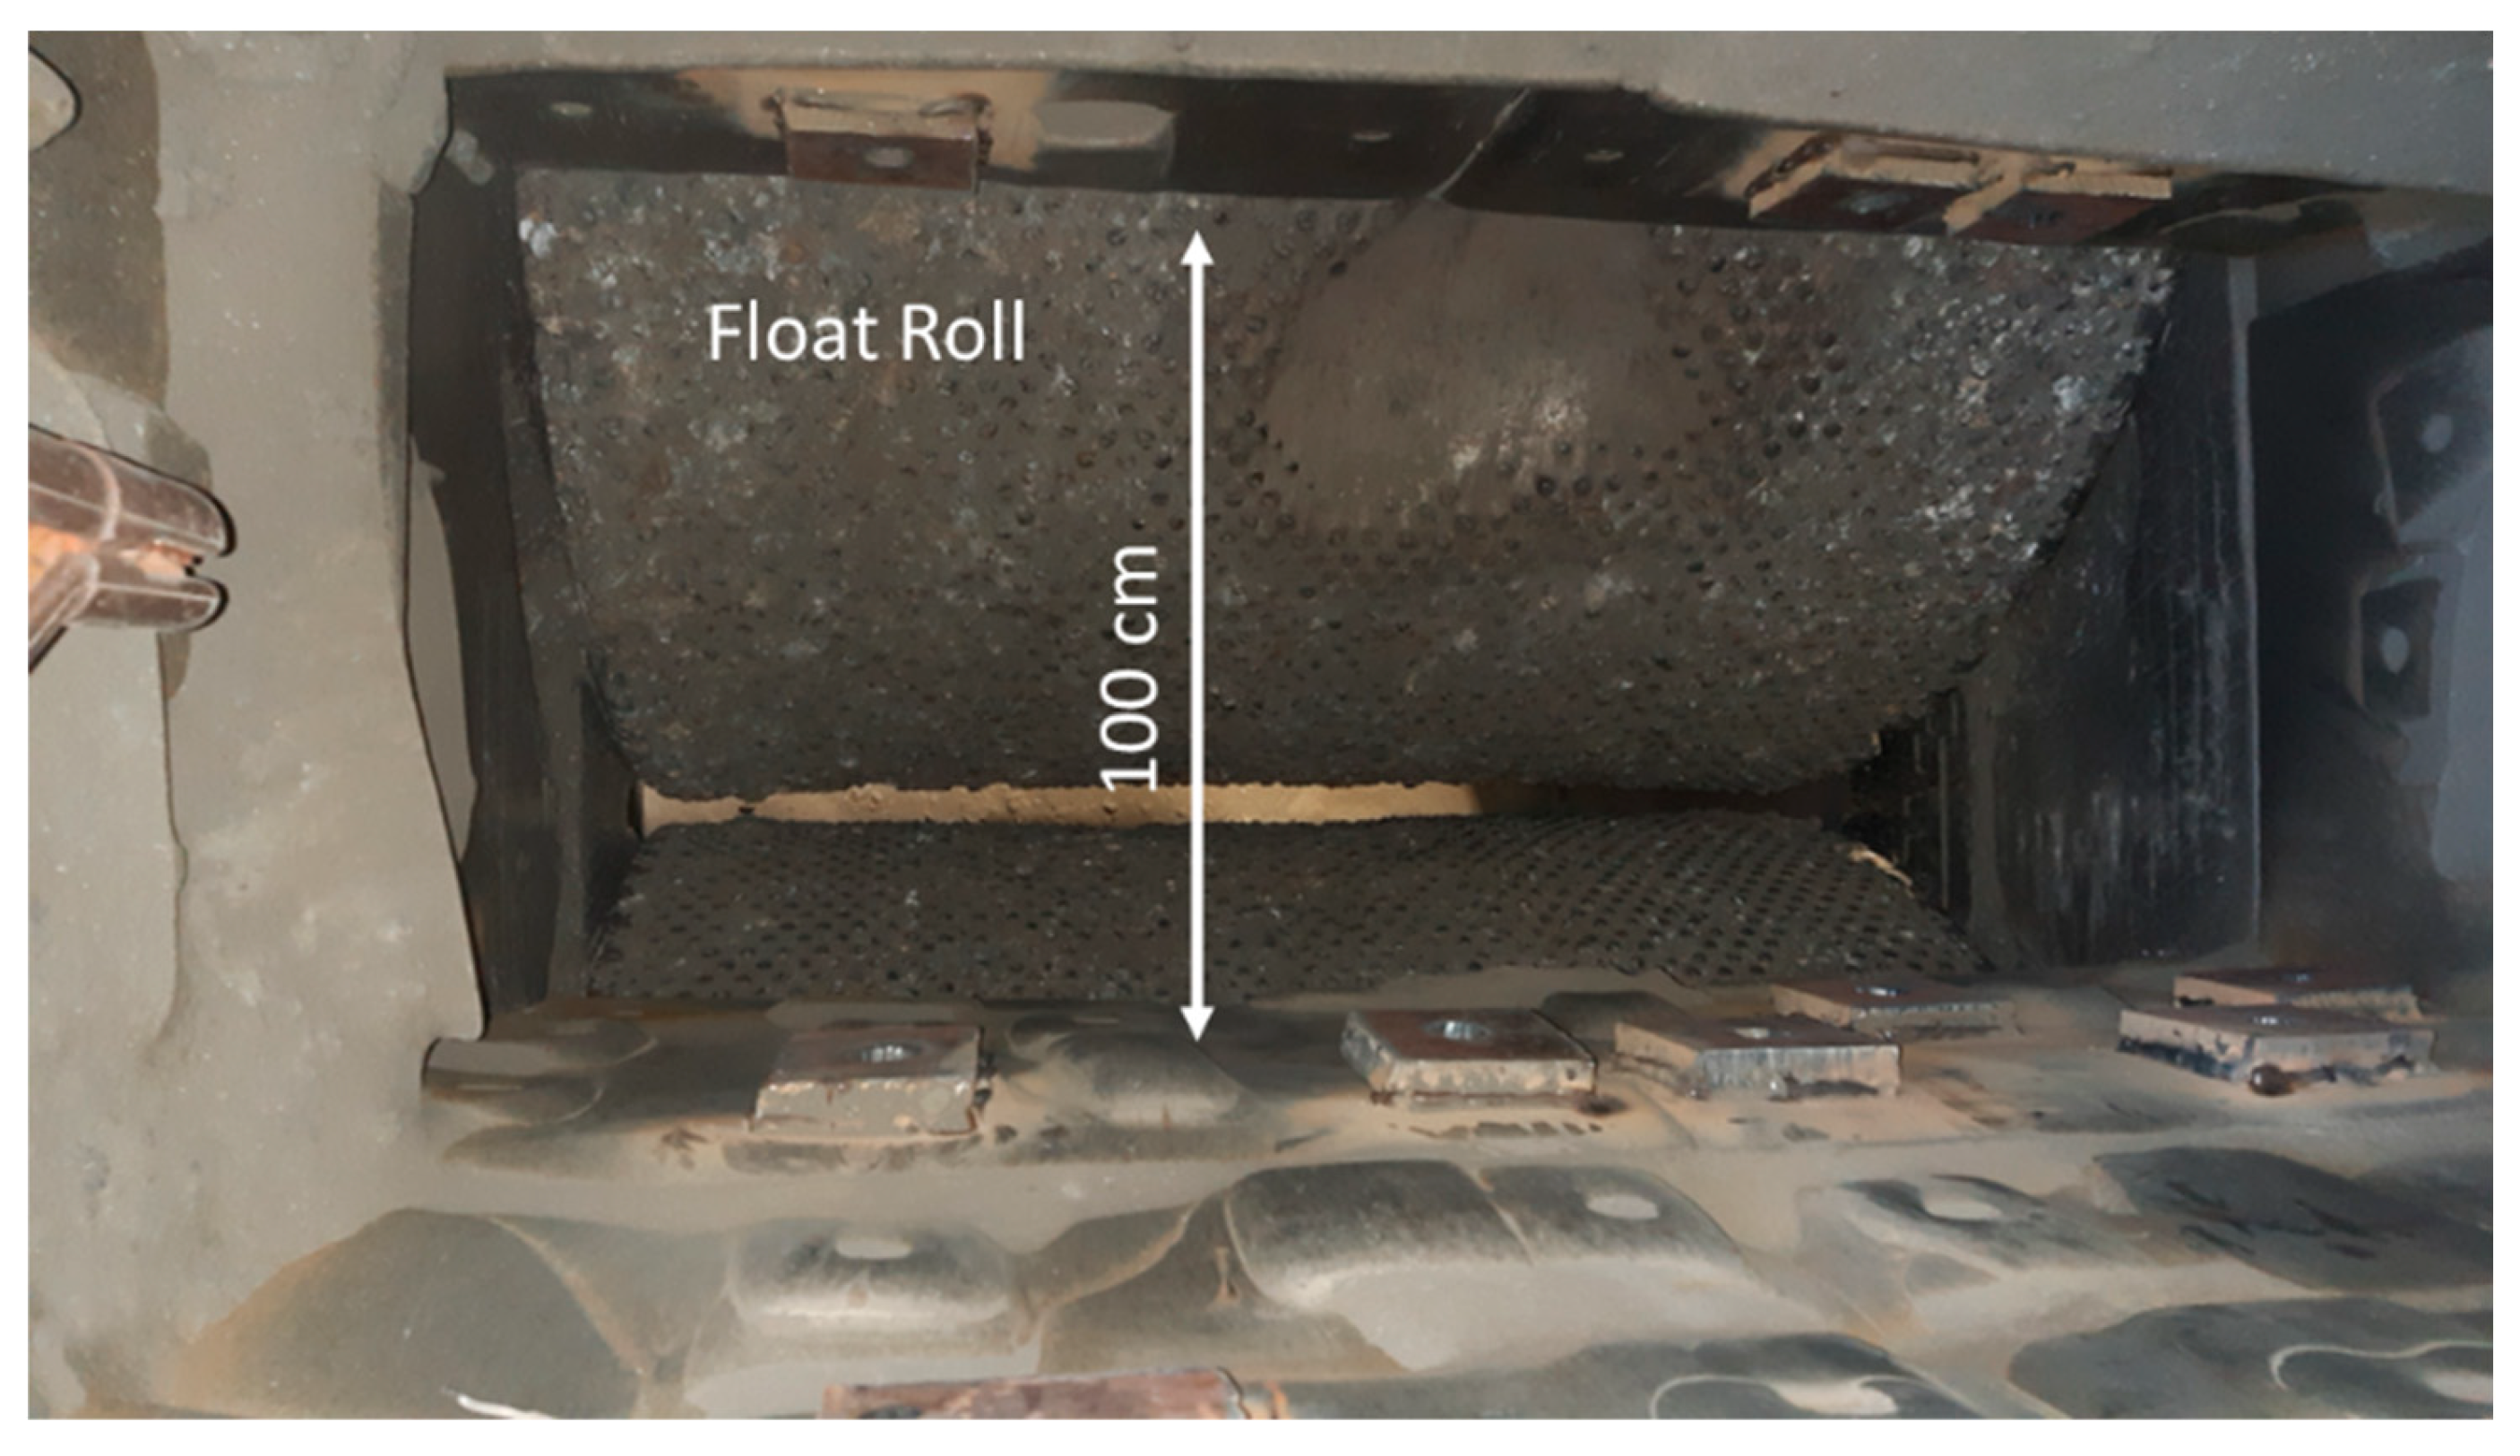
Figure 15.
Trend chart of roll pressure variations during the operational period.
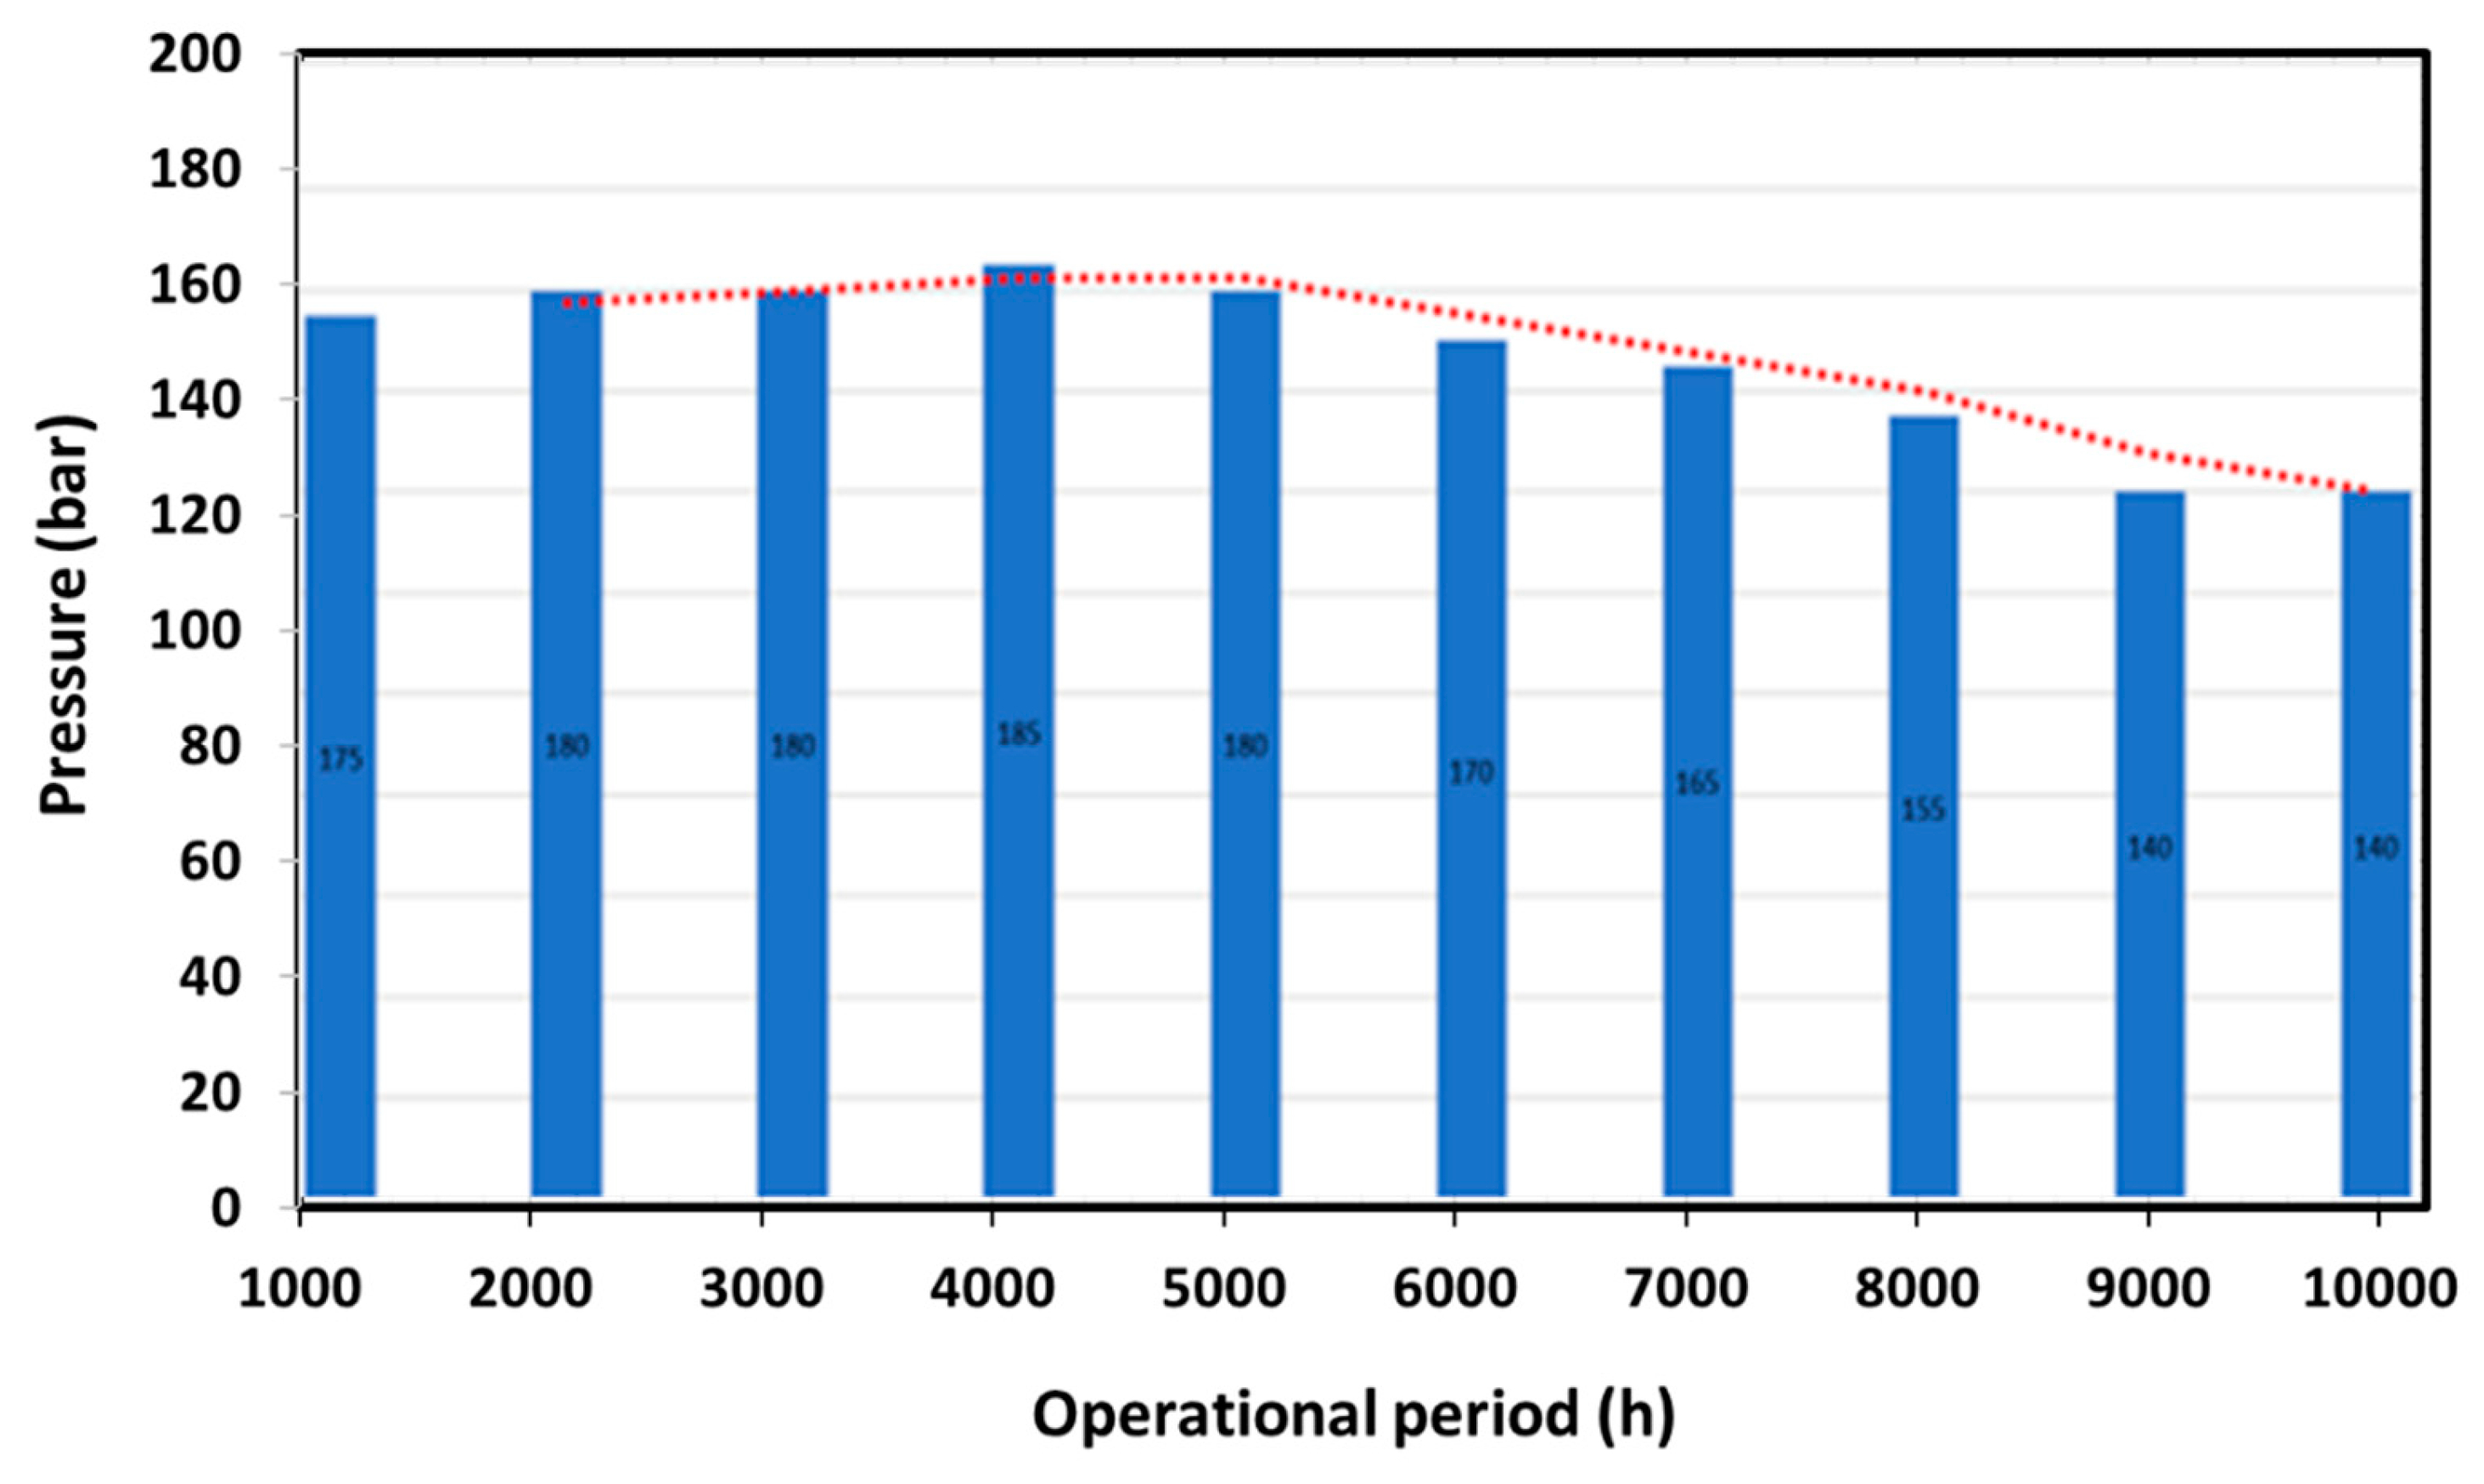
Figure 16.
(a) Filling and welding of the tire surface; (b) Wear and loss of the welded section.
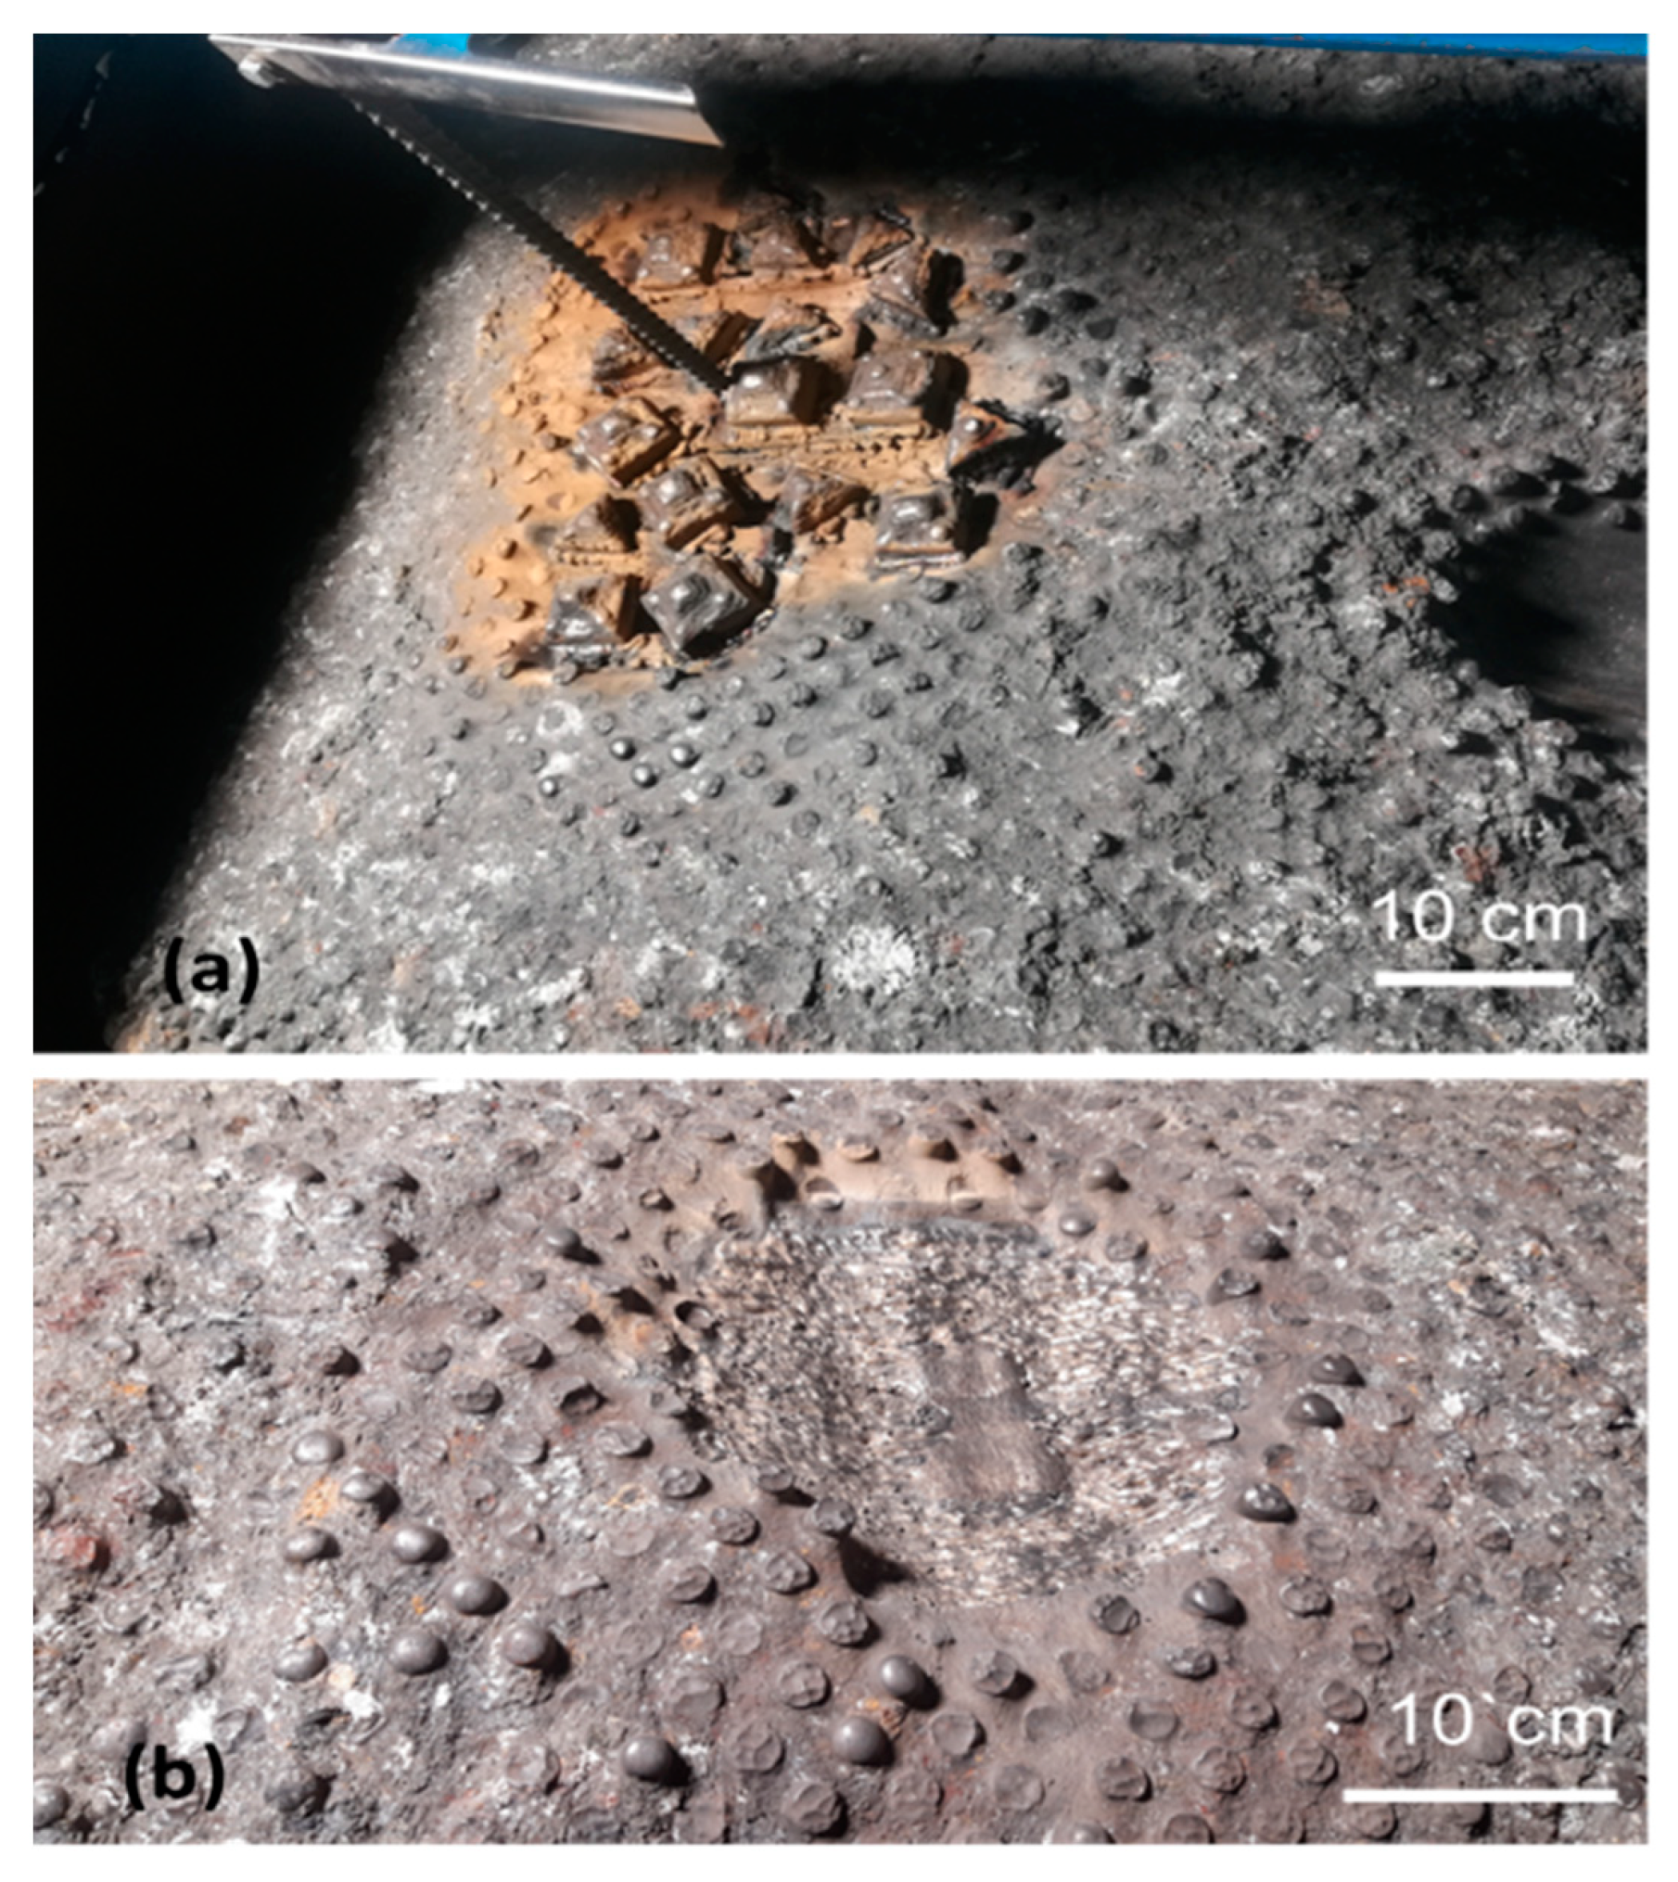

Table 1.
Specifications of feed input and product output to HPGR based on design and operational conditions.
Table 1.
Specifications of feed input and product output to HPGR based on design and operational conditions.
| Feed | D80 (mm) | D80 (mm) | P80 (mm) | Air (gr) | Wi (kWh/t) |
|---|---|---|---|---|---|
| Design | 30 | 50 | 8 | 0.1118 | 9.28 |
| HPGR Input | 45 | 70 | 25 | 0.3324 | 14.52 |
Table 2.
XRF analysis results.
| Analysis | % Fe | % SiO2 | % Al2O3 | % CaO | % Na2O | % K2O |
|---|---|---|---|---|---|---|
| Design sample | 43 | 11.91 | 2.68 | 2.83 | 0.09 | 1.28 |
| Representative sample | 48 | 16.36 | 2.85 | 2.51 | 0.08 | 0.65 |
Table 3.
The comparison between results of design and operation.
| Iron Ore Clod | Feed to Plant (t/h) | Return from Screen (t/h) | Feed to HPGR (t/h) | Available Time | Total Feed to HPGR (ton) |
|---|---|---|---|---|---|
| Design | 700 | 530 | 1230 | 10256 | 12,614,880 |
| Operational | 468 | 438 | 905 | - | 9,281,680 |
Disclaimer/Publisher’s Note: The statements, opinions and data contained in all publications are solely those of the individual author(s) and contributor(s) and not of MDPI and/or the editor(s). MDPI and/or the editor(s) disclaim responsibility for any injury to people or property resulting from any ideas, methods, instructions or products referred to in the content. |
© 2025 by the authors. Licensee MDPI, Basel, Switzerland. This article is an open access article distributed under the terms and conditions of the Creative Commons Attribution (CC BY) license (http://creativecommons.org/licenses/by/4.0/).
Copyright: This open access article is published under a Creative Commons CC BY 4.0 license, which permit the free download, distribution, and reuse, provided that the author and preprint are cited in any reuse.


