
Submitted:
06 May 2025
Posted:
07 May 2025
You are already at the latest version
Abstract
Beef production is an important component of the world's food supply with production being near 59 million tons in 2023 (USDA, 2023). Enhancing our understanding of the factors influencing metabolism will lead to improvements in production efficiency. Using RNA-seq and WGCNA of longissimus muscle samples, gene expression and metabolic pathway analyses were performed to examine relationships with ultrasound and body mass variables. . In this study, body weight (BW), ultrasound back fat (BF), ultrasound muscle depth (MD) and body condition score (BCS) were traits recorded for 18 cull beef cows. As expected, all production related traits monitored (WT, BF, MD and BCS) in this study exhibited a positive correlation with each other. Large-scale transcriptome analyses were performed using RNA extracted from longissimus dorsi muscle. Weighted correlation network analysis (WGCNA) was employed to associate changes in traits with gene expression. In WGCNA, the dark-green module demonstrated a positive correlation with all traits with the highest observed for back fat (cor=0.45, P=0.07) and muscle depth (cor=0.45, P=0.07). Functional analysis of the dark-green module highlighted olfactory transduction (P=0.03) and RNA processing as significantly correlated (P=0.08) with production traits. Additionally, the hematopoietic cell lineage pathway was reported as the most significant negative correlation with muscle depth (cor= -0.71, P=0.001). We identified four hub genes (i.e., SEPTIN9, NONO, CCDC88C and CACNA2D3) showing relationship to the traits measured. These findings provide further understanding of the molecular mechanisms influencing muscle and fat accretion in cull beef cows.
Keywords:
bovine
; cattle
; RNA-seq
; transcriptome
; WGCNA
1. Introduction
Beef is an excellent source of protein, and its demand is increasing globally [1]. Beef production efficiency is directly linked to profitability and sustainability of the beef cattle industry [2]. Beef production is a complex system and influenced by different factors such as age, breed, diet, genetic factors (genes), weather, genotype-by-environment interaction and other factors [3,4]. Most of the genetic or molecular factors involved in beef production are not completely understood. Few genes related to beef production in cows have been reported. For example, ACACA (Acetyl-CoA carboxylase alpha) gene is reported as a major player in intramuscular deposition in ruminants. In beef cows, a positive correlation between ACACA expression level and total lipids and trans-fatty acids were reported [5]. Pleomorphic adenoma gene 1 (PLAG1) and Pleomorphic adenoma gene 2 (PLAG2) were reported to be associated with growth, stature, skeletal muscle growth, fat thickness, and fatty acid composition in cattle [6]. A haplotype analysis found evidence that the mutation in PLAG1 mutation affects body size and weight in modern cattle [7].
Next-generation sequencing allows detailed analysis of complex traits at the level of their genomes (genomics), transcriptomes (transcriptomics), or epigenome (epigenomics) [8]. Among these, transcriptomics is widely utilized to identify regulators of complex traits at gene/transcript level. Ribonucleic acid (RNA) sequencing (RNA-Seq) is a popular approach for transcriptome profiling that uses next-generation sequencing analysis. RNA-Seq gives detailed quantification of transcripts, and their isoforms compared to other techniques [9]. RNA-Seq has been utilized for studying gene expression profiles of different animals, e.g., cow, horse, sheep, buffalo and others [10,11,12,13]. Most of these studies have identified differentially expressed genes and their associated pathways. However, additional identification of genes and their relationship to important traits can shed more light on how genes regulate complex traits. Weighted Gene Co-Expression Network Analysis (WGCNA) is a widely used technique for co-expression network analysis to screen gene expression data and relationships with phenotypic traits [14]. WGCNA has been widely used to study complex traits and their correlation with gene expression data [15]. In cows, WGCNA has been used to investigate feed efficiency. One study identified ATP7B (ATPase Copper Transporting Beta) as a hub gene (central regulator) significantly associated with residual feed intake [16] In Nellore cattle, relationships of between gene expression and carcass traits were revealed using WGCNA [17]. Authors reported that energy and lipid metabolism pathways, highlighting fatty acid metabolism, were the central pathways associated with rib-eye area.
In an effort to further understand the complex relationships of production traits and gene expression in beef cows, we employed RNA-Seq based transcriptome data and WGCNA. In our study, body weight, body condition score, back fat and muscle depth were traits (variables) associated with beef production which were monitored. Total RNA was extracted from the longissimus dorsi with RNA-Seq analyses conducted. Weighted gene co-expression network analysis was applied to associate changes in beef production related traits with gene expression. Relationships between measured traits, metabolic pathways, and hub genes were then identified.
2. Materials and Methods
2.1. Experimental Site
All the procedures were conducted according to a protocol approved by the Institutional Animal Care and Use Committee at the University of Kentucky (protocol #2022-4039). The facility was inspected and approved by the Institutional Animal Care and Use Committee. Animals were individually penned (2.4 m x 14.6 m pens) in a partially covered concrete floored pen. The covered area was bedded with sawdust. Each pen contained an automatic waterer shared between two pens. Feed was delivered in concrete bunks each morning.
2.2. Beef Production Related Trait Analysis
Twenty-two mature cows were sourced from local livestock markets between May 23 and June 6, 2022. Purchased cows were of unknown age and genetic make-up. The majority of cows had black haircoats likely being of Angus influence while some were noted to have Charolais and Hereford influence determined by their coat color and pattern. Arrival body condition scores by three trained individuals and body weights were collected on June 10, 2022. After a few days, three of the purchased cows were removed due to lameness or other pre-existing conditions which were not improving. A replacement open cow, predominately Angus breeding, from the university herd was enrolled in the study to allow for 20 cows to be sampled at the start of the study. Cows were provided hay ad libitum for the first few days after arrival. Cows were then transitioned to a diet consisting primarily of corn silage and a protein supplement. The diet was limit-fed based on arrival weights to 1.5x maintenance energy requirement levels.
2.3. Longissimus Dorsi Muscle Biopsy
Muscle biopsies of the Longissimus dorsi were performed between 12th and 13th ribs on July 29, 2022. Ultrasonography was used to assess subcutaneous fat thickness over the Longissimus dorsi and muscle depth. The ultrasound was used to target the mid-point of the muscle to provide a consistent sample region between animals. Muscle samples were obtained from the right side of the animal. The target region was clipped to remove hair, scrubbed with a betadine solution and then alcohol. A local anesthesia injection of 5-ml of a lidocaine solution (2%) was given before biopsy incision. The incision through the skin was made using a 2.54 cm long 14-gauge needle. Muscle samples were collected using semi-automatic biopsy needles (Argon medical device, catalogue number: 701114090) to collect approximately 200 mg of muscle tissue. Excessive fat was removed from the biopsies. Samples collected for RNA extraction were suspended in RNAlater (RNAlater™ stabilization solution, Invitrogen, AM7020) to prevent RNA degradation during sampling. All the samples were flash frozen in liquid nitrogen and stored at -80oC until RNA extraction.
2.4. RNA Extraction, Library Preparation and Sequencing
Muscle samples were subjected to total RNA extraction using the Zymo Research quick RNA micro prep kit (R01050). The RNA’s purity was assessed through gel electrophoresis and the Agilent 2100 Bioanalyzer. Isolation of pure messenger RNA (mRNA) was achieved using oligo (dT) beads. Following this, cDNA libraries were generated utilizing the Kapa Stranded mRNA Library Preparation Kit (Roche, KR0960) in accordance with the manufacturer’s guidelines. The cDNA library underwent size selection (150 bp) and was subsequently enriched through PCR. The quality assessment of the libraries was performed using a bioanalyzer (Agilent 2100 Bioanalyzer system). The sequencing of cDNA libraries was carried out on the Illumina NovaSeq S4 platform, producing paired-end (2 × 150 bp) data in FASTQ format. The sequencing library preparation and sequencing procedures were conducted by Quick Biology Inc.
2.5. RNA Sequencing Data Analysis
Raw sequencing reads (FASTQ files) were subjected to quality control by FastQC (https://www.bioinformatics.babraham.ac.uk/projects/fastqc/). In brief, FastQC detected contaminants including overrepresented sequences, sequencing adapters, poor quality reads and PCR duplicates. All these contaminants were filtered using Cutadapt 1.4 (Command line : cutadapt -a ADAPTER_FWD -A ADAPTER_REV -o out.1.fastq -p out.2.fastq reads.1.fastq reads.2.fastq) [18,19]. The cow reference transcriptome files (Bos taurus ARS_UCD 1.2) for mapping and quantification were obtained from Ensembl genome browser (https://ftp.ensembl.org/pub/release-108/fasta/bos_taurus/cdna/). The initial step involved indexing the cow reference transcript file using the Salmon index option. (command line: salmon_index -t cow_transcripts.fasta -d decoys.txt -p 12 -i cow_salmon_index). The transcriptome-wide quantification in the form of TPM (transcript per million) on clean reads were performed using salmon v 1.6.0 (command line: salmon quant -i salmon_index -l A -1 Clean_Read_1.fq -2 Clean_Read_2.fq --validateMappings -o salmon_quant -p 12 --seqBias) [19]. The workflow of RNA sequencing and data analyses are shown in Figure 1.
2.6. Weighted Gene Co-Expression Network Analysis (WGCNA)
The R package, Weighted Gene Co-expression Network Analysis (WGCNA) was used to construct co-expression networks and find co-expressed genes [20]. Gene expression data (TPM) of 18 cows with four different traits (WT, BF, MD and BCS) were selected for WGCNA analysis. Two cows were removed due to being outliers. At first, the low count genes and outliers were filtered. To choose modules associated with traits (WT, BF, MD and BCS) of our interest, Pearson correlation analysis between each module’s “eigengene” and the traits were determined. Modules are groups of genes with similar expression profiles and tend to be functionally related and co-regulated. Modules with a module-trait correlation >0.4 or <-0.4 for at least one trait (P ≤ 0.10) were considered significant. Gene significance (GS) was calculated for each gene as the correlation between gene expression counts and traits (WT, BF, MD and BCS). Hub genes were identified by choosing genes with high gene significance and module membership in the modules of interest.
2.7. Functional Enrichment Analysis
Associated modules were selected (R > 0.4 or <-0.4, p≤ 0.10) for functional enrichment analysis. KEGG pathways and gene ontology terms enriched in these modules were identified using gprofiler interface (https://biit.cs.ut.ee/gprofiler/) with threshold of a Benjamini-Hochberg FDR (false discovery rate) of 0.05 [21]. We chose the “g:GOSt – Functional profiling of gene lists” option for conducting the metabolic pathway and gene ontology analysis within the selected Bos taurus reference database. The graphical representation of most significant pathways was done using R package ggplot2 (https://ggplot2.tidyverse.org/index.html). [22]
3. Results
3.1. Trait Relationship Analysis
We recorded four traits in these cows (Table 1). Covariation between these four traits showed that all four traits are positively correlated with each other as expected. Among these traits BCS and WT had correlation of 0.581, whereas MD and BCS also were positively correlated being 0.463. (Figure 2)
3.2. RNA Sequencing
RNA sequencing yielded an average of 33 million raw reads per sample. On average, 98.80% of the raw reads successfully passed the quality check. The average percentage of mappable clean reads per sample were 70.13%, ranging from 64.3 to 74.7% (Supplementary File S1). The transcript per million (TPM) for all 37,926 cow genes were estimated, the average TPM per sample was 26 (Supplementary File S2). Out of 37,926 genes, 7,655 genes were removed from further analysis due to excessive missing samples or zero variance.
3.3. Weighted Gene Co-Expression Network Analysis (WGCNA)
Sample dendrogram produced by hierarchical clustering is shown in Figure 3. Sample dendrogram based on gene expression and heatmap using trait data clearly divided the 18 cows into two groups: group 1- with mostly light weight cows (8 cows) and group 2- mostly cows having heavier live weights (10 cows). The WGCNA analysis constructed 21 modules (i.e., cluster of co-expressed genes) identified by a different color. The WGCNA also yielded correlations between the genes of each module and measured traits (WT, BF, MD and BCS). Figure 4 illustrates the association between modules and traits, which represents Pearson’s correlation coefficients measured between each single module and trait. Given the vast amount of data, we focused on two modules i.e., dark-green and magenta which showed significant positive and negative correlation with all four traits. Data for all genes, their respective modules (21 eigengene modules) and correlation values are given in Supplemental File S3.
3.4. Functional Enrichment Analysis
KEGG pathway analysis of the dark-green module showed ‘olfactory transduction’ as the most significant pathway. Gene ontology molecular function and biology process analysis of dark-green showed RNA binding and spliceosome snRNA activity as significantly enriched GO terms (Figure 5 and Supplementary file S4). Additionally, KEGG pathway analysis of the magenta module showed hematopoietic cell lineage as the most significant pathway. Gene ontology molecular function and biology process analysis of magenta showed protein binding and immune system process as significantly enriched GO terms (Figure 6 and Supplementary File S4).
3.5. Hub Gene Identification
For the dark-green module, CCDC88C (Coiled-coil domain containing 88C) and CACNA2D3 (Calcium voltage-gated channel 3) were identified as hub genes. These genes have gene significance >0.5 with back fat and module membership >0.9 with dark-green module eigengene. In the magenta module, SEPTIN9 and NONO (Non-POU domain containing octamer binding) genes were defined as hub genes based on their gene significance >0.8 with muscle depth and module membership >0.9 with magenta module eigengene. (Figure 7)
4. Discussion
The objective of the study was to identify candidate gene sets and metabolic pathways that could provide a genetic insight into tissue accretion of cull beef cows. Using gene expression data from the longissimus dorsi muscle tissue, gene co-expression modules were built and correlated to traits associated with beef production. WGCNA identified metabolic pathways and candidate genes that are expected to have a biological role in beef production. Out of 21 gene modules, the modules having the greatest significant correlations to the traits measured were further analyzed and discussed. Dark-green module (356 genes) had a significant positive correlation with back fat and muscle depth. The functional analysis highlighted olfactory transduction as a significant pathway and RNA activity (processing, splicing, and binding) as a significant GO term. In the olfactory transduction pathway, odorant or food is detected with signals sent to the brain or other body parts [23]. These signals are in general influenced by calcium, cyclic AMP and G protein molecules. In animals, olfactory transduction is directed linked with appetite, feed preference and weight gain [24,25]. In the pig, olfactory transduction pathway exhibited direct association with residual feed intake [26]. In beef cattle (SimAngus), quantitative trait loci detected for residual feed intake was flanked by eight olfactory receptor genes [27]. Thus, biologically animals with an upregulation of feed intake would be expected to have increased tissue accretion or at least for the traits measured in this study.
Another noteworthy pathway found in the dark green module is the hippo signaling pathway. Previous reports have shown that the hippo signaling pathway regulates the expression of Yes-associated protein (Yap) and transcriptional co-activator with PDZ-binding motif (Taz). Both Yap and Taz genes are critical regulators of skeletal muscle mass. Additionally, these genes are involved in controlling tissue growth in various cell types [28]. The significant gene ontology terms of dark-green modules were RNA binding, snRNA activity, RNA processing and RNA splicing. All these terms come under RNA processing and modifications. According to previous literature, muscle development relies on RNA processing. It is mainly driven by coordination among RNA binding proteins. Additionally, misregulation of RNA processing causes muscle diseases [29,30]. Alternative splicing is a mechanism that enables single genes to produce multiple mature mRNAs. Among various tissues, skeletal muscle cells, along with the brain and heart, display the most prominent levels of tissue-specific and evolutionarily conserved alternative splicing events. These molecular alterations are accompanied by a multitude of transcriptional and posttranscriptional changes, many of which are governed by alternative splicing mechanisms [31,32,33,34]. In mice, RNA splicing of the Fragile-X mental retardation autosomal homologue-1 (FXR1) gene directly contributes to muscle development. The FXR1 gene is hypothesized to play a regulatory role in mRNA translation, localization, and stability within muscle cells [35]. Thus, cull beef cows which are emaciated due to restricted nutrient intakes and then provided an increased plane of nutrition may elicit responses for protein accretion.
The magenta and turquoise modules had negative correlation with back fat, muscle depth and body condition score. The functional analysis of magenta highlighted hematopoietic cell lineage pathway as the most significant pathway. In animals, tissue self-renew, tissue growth and muscle tissue regeneration are mainly controlled by Hematopoietic cell lineage [36]. During muscle growth, Hematopoietic cell lineage pathway is activated. However, in the current study the opposite was observed showing less expression for increasing weight, BCS, MD and BF. Detailed characterization of this pathway is necessary to study the exact role of hematopoietic cell lineage in beef production. It is possible this response observed in this group of cull beef cows is an artifact of previous management in which nutrient intake was less than the animal’s requirements. In regard to the turquoise module, it was noted that the oxidative phosphorylation pathway was the most highly significant pathway. Oxidative phosphorylation provides energy in the form of ATP to support muscle growth and maintenance [37]. In buffalo, the WGCNA analysis identified pathways related to energy metabolism, such as oxidative phosphorylation, that play a role in fat deposition [38]. Thus, if animals were in a negative energy state previously, it would be plausible the expression of genes in this pathway may suppressed.
Hub genes are candidate genes which are important in the regulation of the expression of several other genes in a module and are potential biomarkers for the selection of a trait [39]. Such an approach has already been employed in ruminants to identify genes governing traits [40,41,42,43,44]. The WGCNA analysis in buffalo identified six hub genes [FH (Fumarate Hydratase), MECR (Mitochondrial Trans-2-Enoyl-CoA Reductase), GPI (Glucose-6-Phosphate Isomerase), PANK3 (Pantothenate Kinase 3), ATP6V1A (ATPase H+ Transporting V1 Subunit A), PHYH (phytanoyl-CoA Hydroxylase)]. These hub genes were postulated to have associations with a range of aspects, encompassing growth and development, fat deposition, and the levels of amino acids within muscle tissue in buffalo [38]. In the dark-green module, CCDC (Coiled-coil domain containing 88C) and CACNA2D3 (Calcium voltage-gated channel 3) were reported as central hub genes. Calcium voltage-gated channel is regulated by calcium and responsible for muscle contraction [45]. The calcium channels also supply calcium ions to muscles, and these ions serve as secondary messengers, governing cellular functions within muscle tissue [46].
In magenta module, SEPTIN9 and NONO (Non-POU domain containing octamer binding) were identified as the most significant hub genes. Septin 9 is a cell cycle-related gene and indispensable for coordinating myosin motor proteins during cytokinesis [47,48]. In animals, the NONO gene is a multifunctional gene involved in transcription regulation and alternative splicing. Notably, in mice, the NONO gene plays a direct and critical role in B cell development through the ERK (Extracellular Signal-Regulated Kinase), AKT (PI3K/AKT/mTOR), and NF-κB (Nuclear Factor-κB) pathways [49]. This underscores the importance of NONO in the intricate process of cellular and muscle development in animals[49]. Further experiments are necessary to validate the modules, metabolic pathways, and hub genes uncovered in the present study.
5. Conclusions
Identifying genes and metabolic pathways offers tremendous help for marker-assisted selection and plays a key role toward the goal of increasing beef production efficiency. Genes and metabolic pathways highlighted in this study revealed both positive and negative correlations with the beef production related traits measured. Olfactory transduction, hematogenic cell lineage and oxidative phosphorylation were central pathways associated with beef production. Hub genes, including CCDC88C, CACNA2D3, SEPTIN9 and NONO were considered putative candidates related to beef production. The molecular mechanisms underlying beef production warrants further explorations to enhance production efficiency.
Supplementary Materials
The following supporting information can be downloaded at: Preprints.org, Supplementary file S1: The sequencing statistics of RNA sequencing reads. Supplementary file S2: Transcript per million (TPM) of 18 cow samples. Supplementary file S3: Data of all identified WGCNA modules and their module correlations and membership values. For Muscle depth (MD), back fat (BF), body condition score (BCS) and body weight (WT).
Author Contributions
“Conceptualization, J.W.L. and K.R.M.; methodology, H.S, J.W.L and K.R.M; software, H.S.; validation, J.W.L. and K.R.M.; formal analysis, H.S.; investigation, J.W.L. and K.R.M.; resources, J.W.L. and K.R.M.; data curation, H.S.; writing—original draft preparation, H.S.; writing—review and editing, J.W.L. and K.R.M.; visualization, H.S..; supervision, J.W.L. and K.R.M.; project administration, J.W.L. and K.R.M.; funding acquisition, J.W.L. and K.R.M. All authors have read and agreed to the to the published version of the manuscript.
Funding
This research was funded by project 202005171325 from the USDA Agriculture Research Service National Program 101, Food Animal Production and the University of Kentucky Agricultural and Experiment Station. The information reported in this paper is part of a project of the Kentucky Agricultural Experiment Station and is published with the approval of the Director. Mention of trade names, proprietary products, or specific equipment does not constitute a guarantee or warranty by the University of Kentucky and does not imply endorsement or exclusion of other similar equipment or products that may be available.
Institutional Review Board Statement
The study was approved by the Institutional Animal Care and Use Committee of University of Kentucky (protocol code 2022-4039 on 4/13/22).
Data Availability Statement
Raw sequencing reads generated by RNA sequencing were deposited in the NCBI-SRA database under the bioproject accession number PRJNA933175.
Conflicts of Interest
The authors declare no conflicts of interest.
References
- Pighin D, Pazos A, Chamorro V, Paschetta F, Cunzolo S, Godoy F, et al. A Contribution of Beef to Human Health: A Review of the Role of the Animal Production Systems. Vol. 2016, Scientific World Journal. Hindawi Limited; 2016. [CrossRef]
- Greenwood PL. Review: An overview of beef production from pasture and feedlot globally, as demand for beef and the need for sustainable practices increase. Vol. 15, Animal. Elsevier B.V.; 2021. [CrossRef]
- Mwangi FW, Charmley E, Gardiner CP, Malau-Aduli BS, Kinobe RT, Malau-Aduli AEO. Diet and genetics influence beef cattle performance and meat quality characteristics. Vol. 8, Foods. MDPI Multidisciplinary Digital Publishing Institute; 2019. [CrossRef]
- Sakowski T, Grodkowski G, Gołebiewski M, Slósarz J, Kostusiak P, Solarczyk P, et al. Genetic and Environmental Determinants of Beef Quality—A Review. Vol. 9, Frontiers in Veterinary Science. Frontiers Media S.A.; 2022. [CrossRef]
- da Costa ASH, Pires VMR, Fontes CMGA, Mestre Prates JA. Expression of genes controlling fat deposition in two genetically diverse beef cattle breeds fed high or low silage diets. BMC Vet Res. 2013 Jun 17;9.
- Grigoletto L, Ferraz JBS, Oliveira HR, Eler JP, Bussiman FO, Abreu Silva BC, et al. Genetic Architecture of Carcass and Meat Quality Traits in Montana Tropical® Composite Beef Cattle. Front Genet. 2020 Feb 27;11.
- Utsunomiya YT, Milanesi M, Utsunomiya ATH, Torrecilha RBP, Kim ES, Costa MS, et al. A PLAG1 mutation contributed to stature recovery in modern cattle. Sci Rep. 2017 Dec 1;7(1). [CrossRef]
- Next generation sequencing in livestock species- A Review. Journal of Animal Breeding and Genomics. 2017;1(1).
- Wang Z, Gerstein M, Snyder M. RNA-Seq: A revolutionary tool for transcriptomics. Vol. 10, Nature Reviews Genetics. 2009. p. 57–63.
- Sood TJ, Lagah SV, Mukesh M, Singla SK, Chauhan MS, Manik RS, et al. RNA sequencing and transcriptome analysis of buffalo (Bubalus bubalis) blastocysts produced by somatic cell nuclear transfer and in vitro fertilization. Mol Reprod Dev. 2019 Sep 1;86(9):1149–67. [CrossRef]
- Chopra-Dewasthaly R, Korb M, Brunthaler R, Ertl R. Comprehensive RNA-Seq profiling to evaluate the sheep mammary gland transcriptome in response to experimental mycoplasma agalactiae infection. PLoS One. 2017 Jan 1;12(1). [CrossRef]
- Capomaccio S, Vitulo N, Verini-Supplizi A, Barcaccia G, Albiero A, D’Angelo M, et al. RNA sequencing of the exercise transcriptome in equine athletes. PLoS One. 2013 Dec 31;8(12). [CrossRef]
- Yan Z, Huang H, Freebern E, Santos DJA, Dai D, Si J, et al. Integrating RNA-Seq with GWAS reveals novel insights into the molecular mechanism underpinning ketosis in cattle. BMC Genomics. 2020 Jul 17;21(1). [CrossRef]
- Langfelder P, Horvath S. WGCNA: An R package for weighted correlation network analysis. BMC Bioinformatics. 2008 Dec 29;9.
- Jin Z, Liu S, Zhu P, Tang M, Wang Y, Tian Y, et al. Cross-species gene expression analysis reveals gene modules implicated in human osteosarcoma. Front Genet. 2019;10(JUL):1–14.
- Salleh SM, Mazzoni G, Løvendahl P, Kadarmideen HN. Gene co-expression networks from RNA sequencing of dairy cattle identifies genes and pathways affecting feed efficiency. BMC Bioinformatics. 2018 Dec 17;19(1). [CrossRef]
- Silva-Vignato B, Coutinho LL, Poleti MD, Cesar ASM, Moncau CT, Regitano LCA, et al. Gene co-expression networks associated with carcass traits reveal new pathways for muscle and fat deposition in Nelore cattle 06 Biological Sciences 0604 Genetics. BMC Genomics. 2019 Jan 10;20(1).
- Bolger AM, Lohse M, Usadel B. Trimmomatic: A flexible trimmer for Illumina sequence data. Bioinformatics. 2014 Aug 1;30(15):2114–20. [CrossRef]
- Patro R, Duggal G, Love MI, Irizarry RA, Kingsford C. Salmon provides fast and bias-aware quantification of transcript expression. Nat Methods. 2017;14(4):417–9.
- Langfelder P, Horvath S. WGCNA: An R package for weighted correlation network analysis. BMC Bioinformatics. 2008 Dec 29;9.
- Raudvere U, Kolberg L, Kuzmin I, Arak T, Adler P, Peterson H, et al. G:Profiler: A web server for functional enrichment analysis and conversions of gene lists (2019 update). Nucleic Acids Res. 2019 Jul 1;47(W1):W191–8. [CrossRef]
- Hadley Wickham. ggplot2 Elegant Graphics for Data Analysis. Springer book second edition. 2016;
- Su CY, Menuz K, Carlson JR. Olfactory Perception: Receptors, Cells, and Circuits. Vol. 139, Cell. Elsevier B.V.; 2009. p. 45–59.
- Ramos-Lopez O, Riezu-Boj JI, Milagro FI, Zulet MA, Santos JL, Martinez JA, et al. Associations between olfactory pathway gene methylation marks, obesity features and dietary intakes. Genes Nutr. 2019 Apr 25;14(1). [CrossRef]
- Riera CE, Tsaousidou E, Halloran J, Follett P, Hahn O, Pereira MMA, et al. The Sense of Smell Impacts Metabolic Health and Obesity. Cell Metab. 2017 Jul 5;26(1):198-211.e5.
- Do DN, Strathe AB, Ostersen T, Pant SD, Kadarmideen HN. Genome-wide association and pathway analysis of feed efficiency in pigs reveal candidate genes and pathways for residual feed intake. Front Genet. 2014;5(AUG). [CrossRef]
- Seabury CM, Oldeschulte DL, Saatchi M, Beever JE, Decker JE, Halley YA, et al. Genome-wide association study for feed efficiency and growth traits in U.S. beef cattle. BMC Genomics. 2017 May 18;18(1). [CrossRef]
- Watt KI, Goodman CA, Hornberger TA, Gregorevic P. The Hippo Signaling Pathway in the Regulation of Skeletal Muscle Mass and Function. Exerc Sport Sci Rev. 2018 Apr 1;46(2):92–6. [CrossRef]
- Hinkle ER, Wiedner HJ, Black AJ, Giudice J. RNA processing in skeletal muscle biology and disease. Vol. 10, Transcription. Taylor and Francis Inc.; 2019. p. 1–20. [CrossRef]
- Shi DL, Grifone R. RNA-Binding Proteins in the Post-transcriptional Control of Skeletal Muscle Development, Regeneration and Disease. Vol. 9, Frontiers in Cell and Developmental Biology. Frontiers Media S.A.; 2021.
- Bland CS, Wang ET, Vu A, David MP, Castle JC, Johnson JM, et al. Global regulation of alternative splicing during myogenic differentiation. Nucleic Acids Res. 2010 Nov;38(21):7651–64. [CrossRef]
- Blencowe BJ, Brinegar AE, Xia Z, Loehr JA, Li W, Rodney GG, et al. Extensive alternative splicing transitions during postnatal skeletal muscle development are required for calcium handling functions. 2017. [CrossRef]
- Hinkle ER, Wiedner HJ, Black AJ, Giudice J. RNA processing in skeletal muscle biology and disease. Vol. 10, Transcription. Taylor and Francis Inc.; 2019. p. 1–20.
- Apponi LH, Corbett AH, Pavlath GK. RNA-binding proteins and gene regulation in myogenesis. Vol. 32, Trends in Pharmacological Sciences. 2011. p. 652–8.
- Smith JA, Curry EG, Eric Blue R, Roden C, Dundon SER, Rodríguez-Vargas A, et al. FXR1 splicing is important for muscle development and biomolecular condensates in muscle cells. Journal of Cell Biology. 2020 Apr 6;219(4).
- Lee JY, Hong SH. Hematopoieticstem cells and their roles in tissueregeneration. Int J Stem Cells. 2020 Mar 1;13(1).
- Wilson DF. Oxidative phosphorylation: regulation and role in cellular and tissue metabolism. Vol. 595, Journal of Physiology. Blackwell Publishing Ltd.; 2017. p. 7023–38. [CrossRef]
- Wang S, Yang C, Pan C, Feng X, Lei Z, Huang J, et al. Identification of key genes and functional enrichment pathways involved in fat deposition in Xinyang buffalo by WGCNA. Gene. 2022 Apr 15;818.
- Santri IN, Irham LM, Djalilah GN, Perwitasari DA, Wardani Y, Phiri YVA, et al. Identification of Hub Genes and Potential Biomarkers for Childhood Asthma by Utilizing an Established Bioinformatic Analysis Approach. Biomedicines. 2022 Sep 1;10(9). [CrossRef]
- Keogh K, Kenny DA, Waters SM. Gene co-expression networks contributing to the expression of compensatory growth in metabolically active tissues in cattle. Sci Rep. 2019 Dec 1;9(1).
- Cánovas A, Reverter A, DeAtley KL, Ashley RL, Colgrave ML, Fortes MRS, et al. Multi-tissue omics analyses reveal molecular regulatory networks for puberty in composite beef cattle. PLoS One. 2014 Jul 21;9(7). [CrossRef]
- Miklos AC, Li C, Sorrell CD, Lyon LA, Pielak GJ. An upper limit for macromolecular crowding effects. BMC Biophys. 2011 May 31;4(1). [CrossRef]
- Gu Q, Nagaraj SH, Hudson NJ, Dalrymple BP, Reverter A. Genome-wide patterns of promoter sharing and co-expression in bovine skeletal muscle. BMC Genomics. 2011 Jan 12;12. [CrossRef]
- Hudson NJ, Reverter A, Wang YH, Greenwood PL, Dalrymple BP. Inferring the transcriptional landscape of bovine skeletal muscle by integrating co-expression networks. PLoS One. 2009 Oct 1;4(10). [CrossRef]
- Fernández-Quintero ML, Ghaleb Y El, Tuluc P, Campiglio M, Liedl KR, Flucher BE. Structural determinants of voltage-gating properties in calcium channels. Elife. 2021 Mar 1;10. [CrossRef]
- Flucher BE, Tuluc P. How and why are calcium currents curtailed in the skeletal muscle voltage-gated calcium channels? Journal of Physiology. 2017 Mar 1;595(5):1451–63.
- Gönczi M, Dienes B, Dobrosi N, Fodor J, Balogh N, Oláh T, et al. Septins, a cytoskeletal protein family, with emerging role in striated muscle. J Muscle Res Cell Motil. 2021 Jun 1;42(2):251–65.
- Wang X, Fei F, Qu J, Li C, Li Y, Zhang S. The role of septin 7 in physiology and pathological disease: A systematic review of current status. Vol. 22, Journal of Cellular and Molecular Medicine. Blackwell Publishing Inc.; 2018. p. 3298–307. [CrossRef]
- Yongguang Zhang DCMHYZBZLCQC. NONO regulates B-cell development and B-cell receptor signaling. The FASEB Journal. 2023 Mar 11;37(4).
Figure 1.
The workflow of RNA sequencing and co-expression analysis includes two parts: (A) Sample collection, RNA extraction, library preparation and sequencing. (B) Cleaning the sequencing reads, quantification of gene expression, weighted gene co-expression network analysis (WGCNA) analysis and functional profiling.
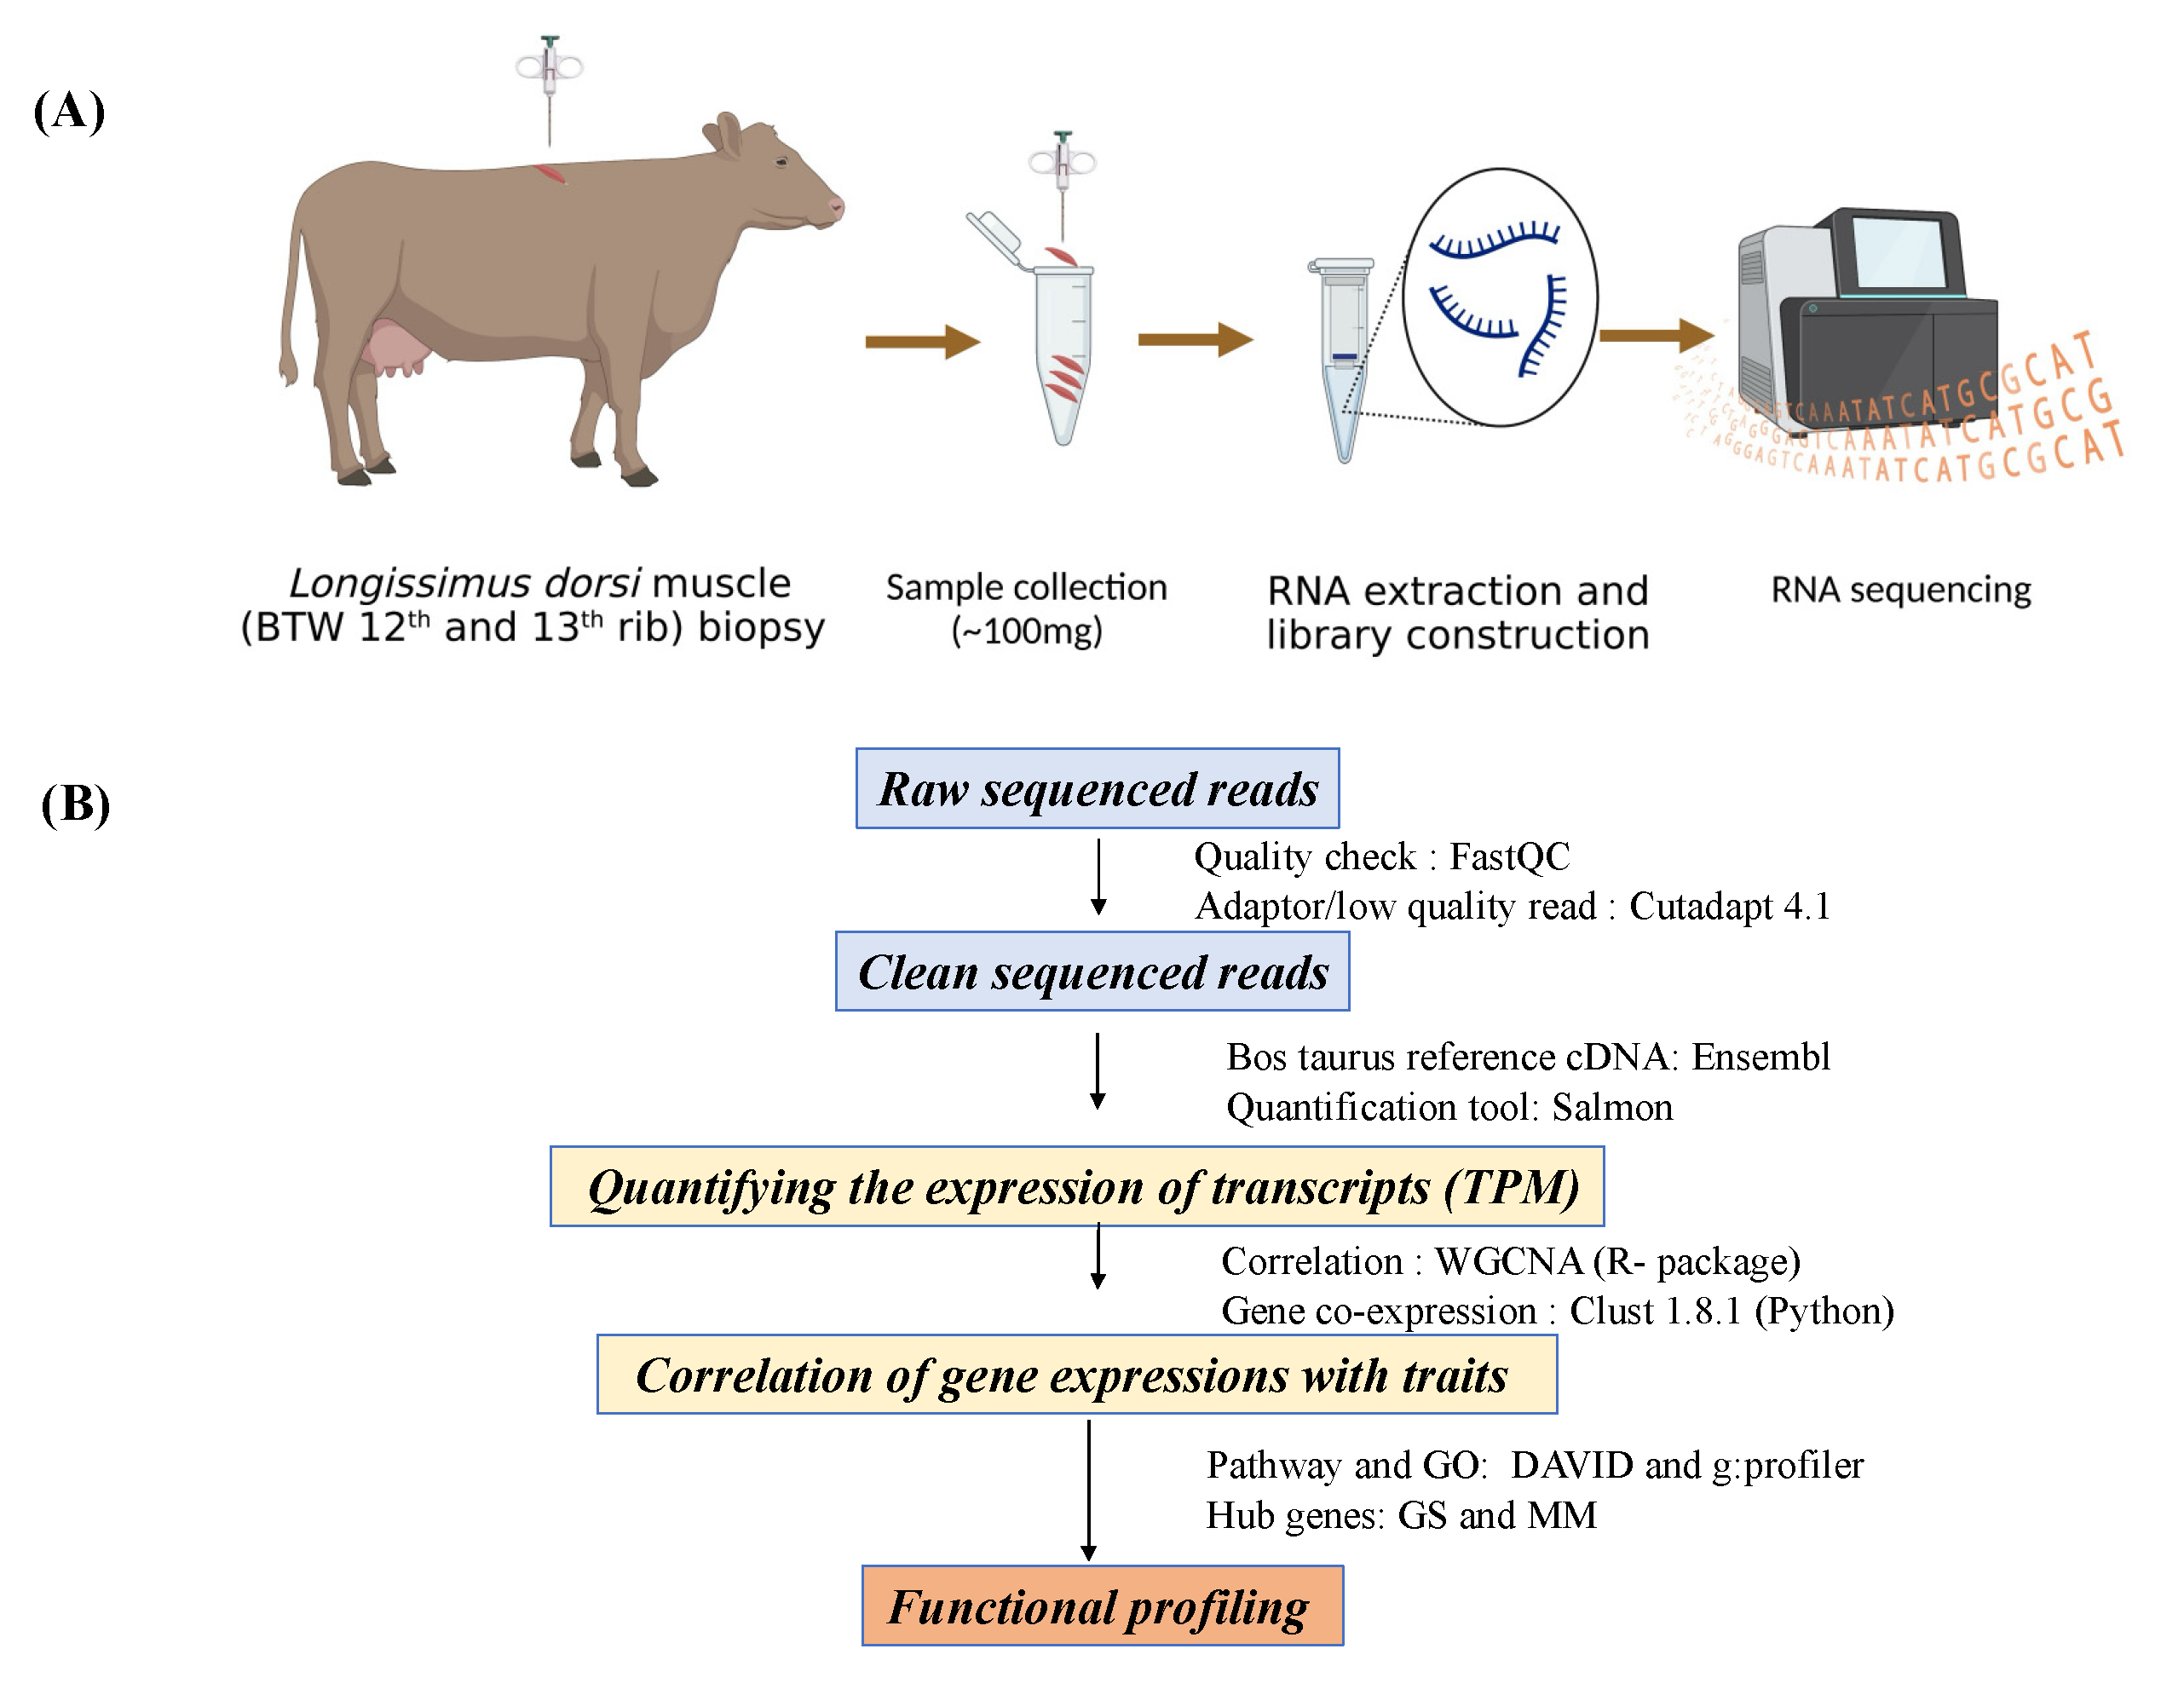
Figure 2.
Pearson correlation analysis between four beef production related traits: body weight (BW), back fat (BF), muscle depth (MD) and body condition score (BCS). The traits mostly exhibited positive correlations with each other.
Figure 2.
Pearson correlation analysis between four beef production related traits: body weight (BW), back fat (BF), muscle depth (MD) and body condition score (BCS). The traits mostly exhibited positive correlations with each other.
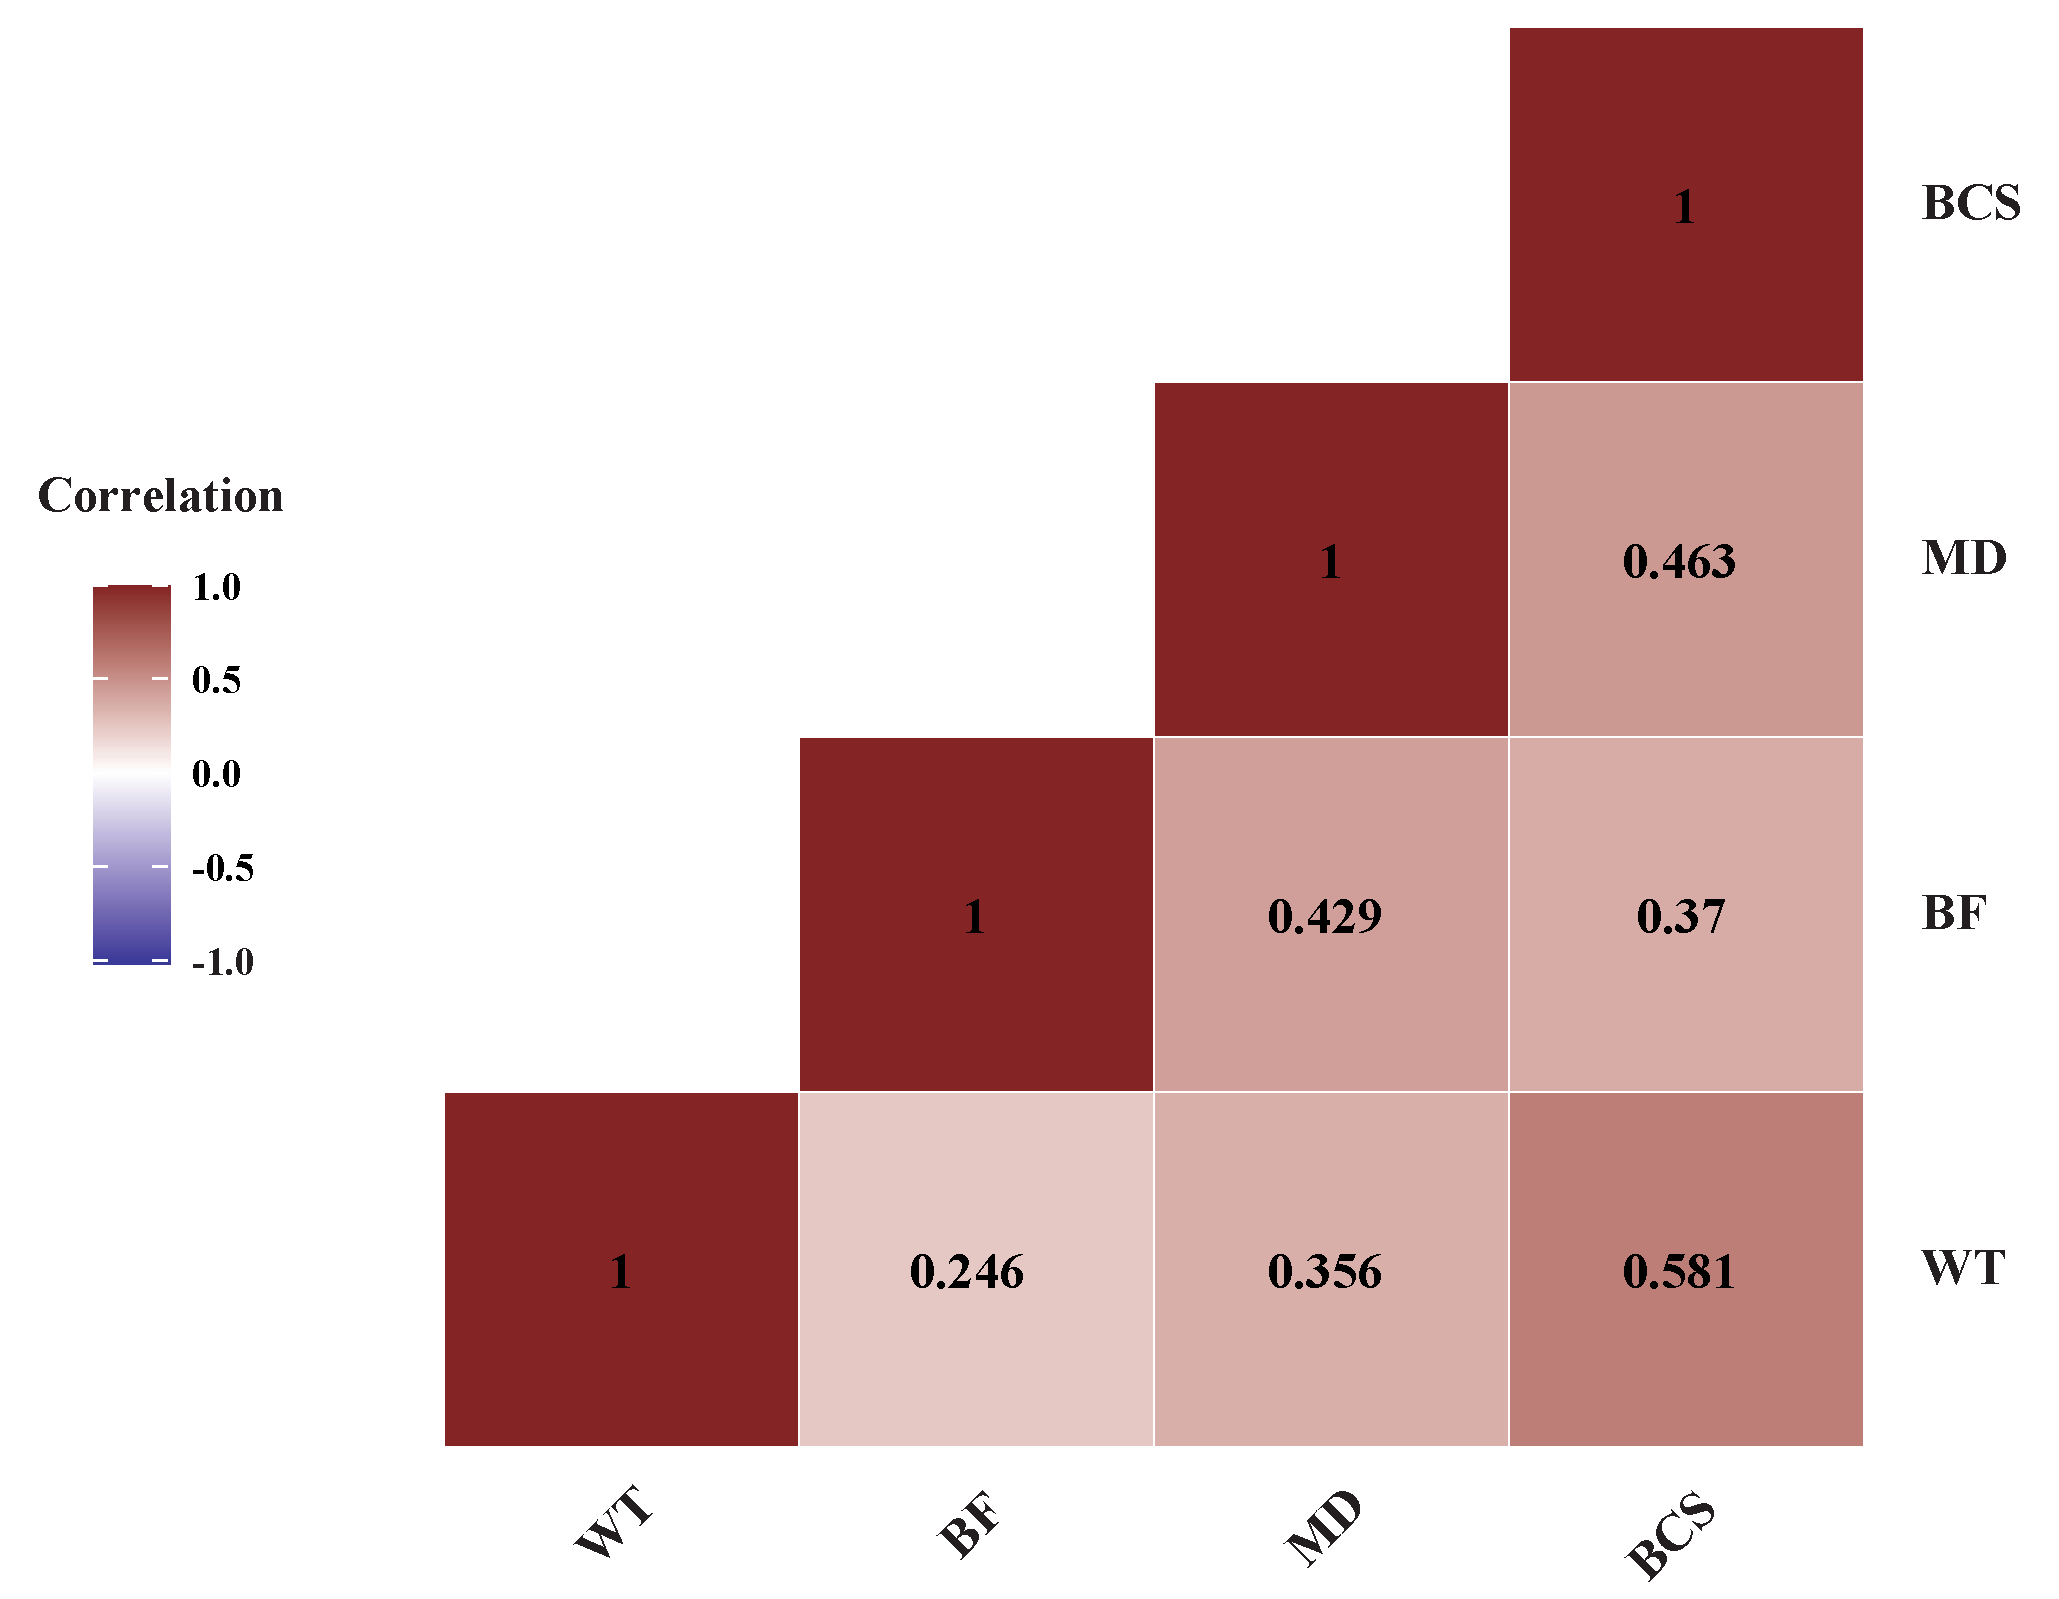
Figure 3.
Sample dendrogram and trait heatmap. The dendrogram plotted by hierarchical clustering using gene expression of 18 cow samples. The heatmap below the dendrogram indicates trait data. The analysis clearly divided the 18 cows into two groups: light-weight cows (8 cows) and heavyweight cows (10 cows).
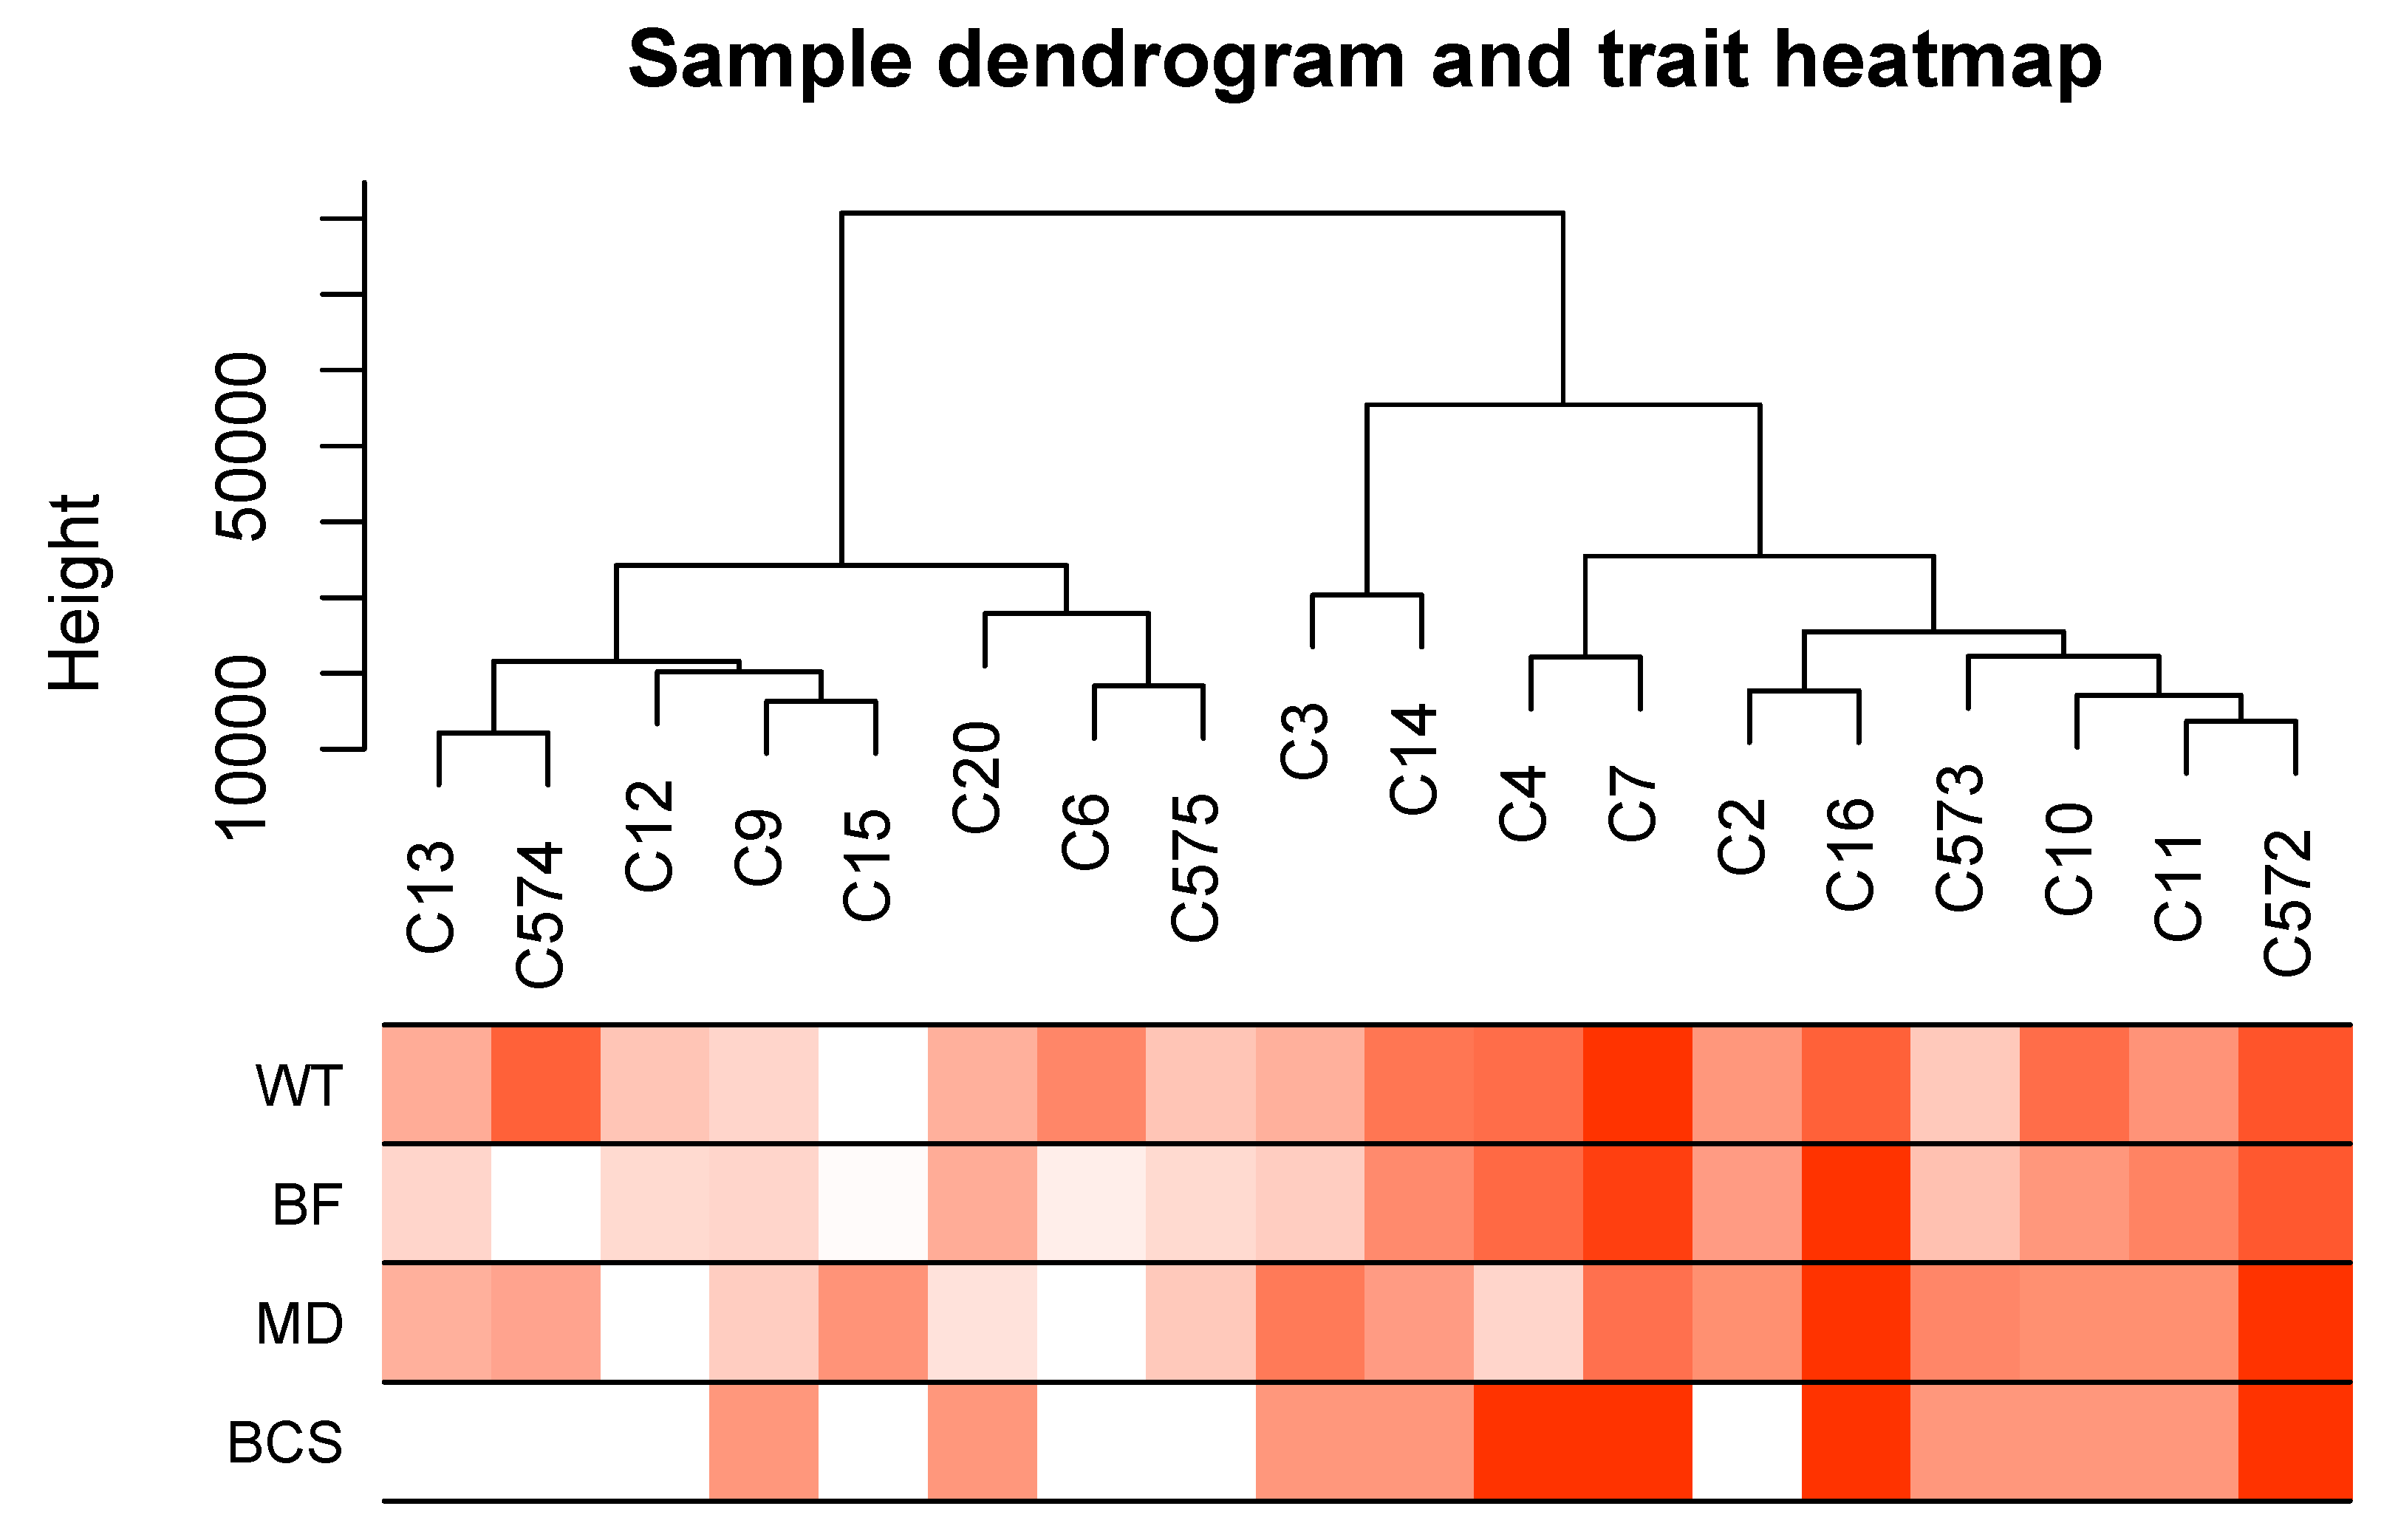
Figure 4.
Correlation between modules (group of genes) and traits [body weight (BW), back fat (BF), muscle depth (MD) and body condition score (BCS)]. Module names are displayed on the left, and the correlation coefficients are shown at the top of each row. The p-values for each module are displayed at the bottom of each row within parentheses. The rows are colored based on the correlation of the module with the trait: Red for positive and green for negative correlation.
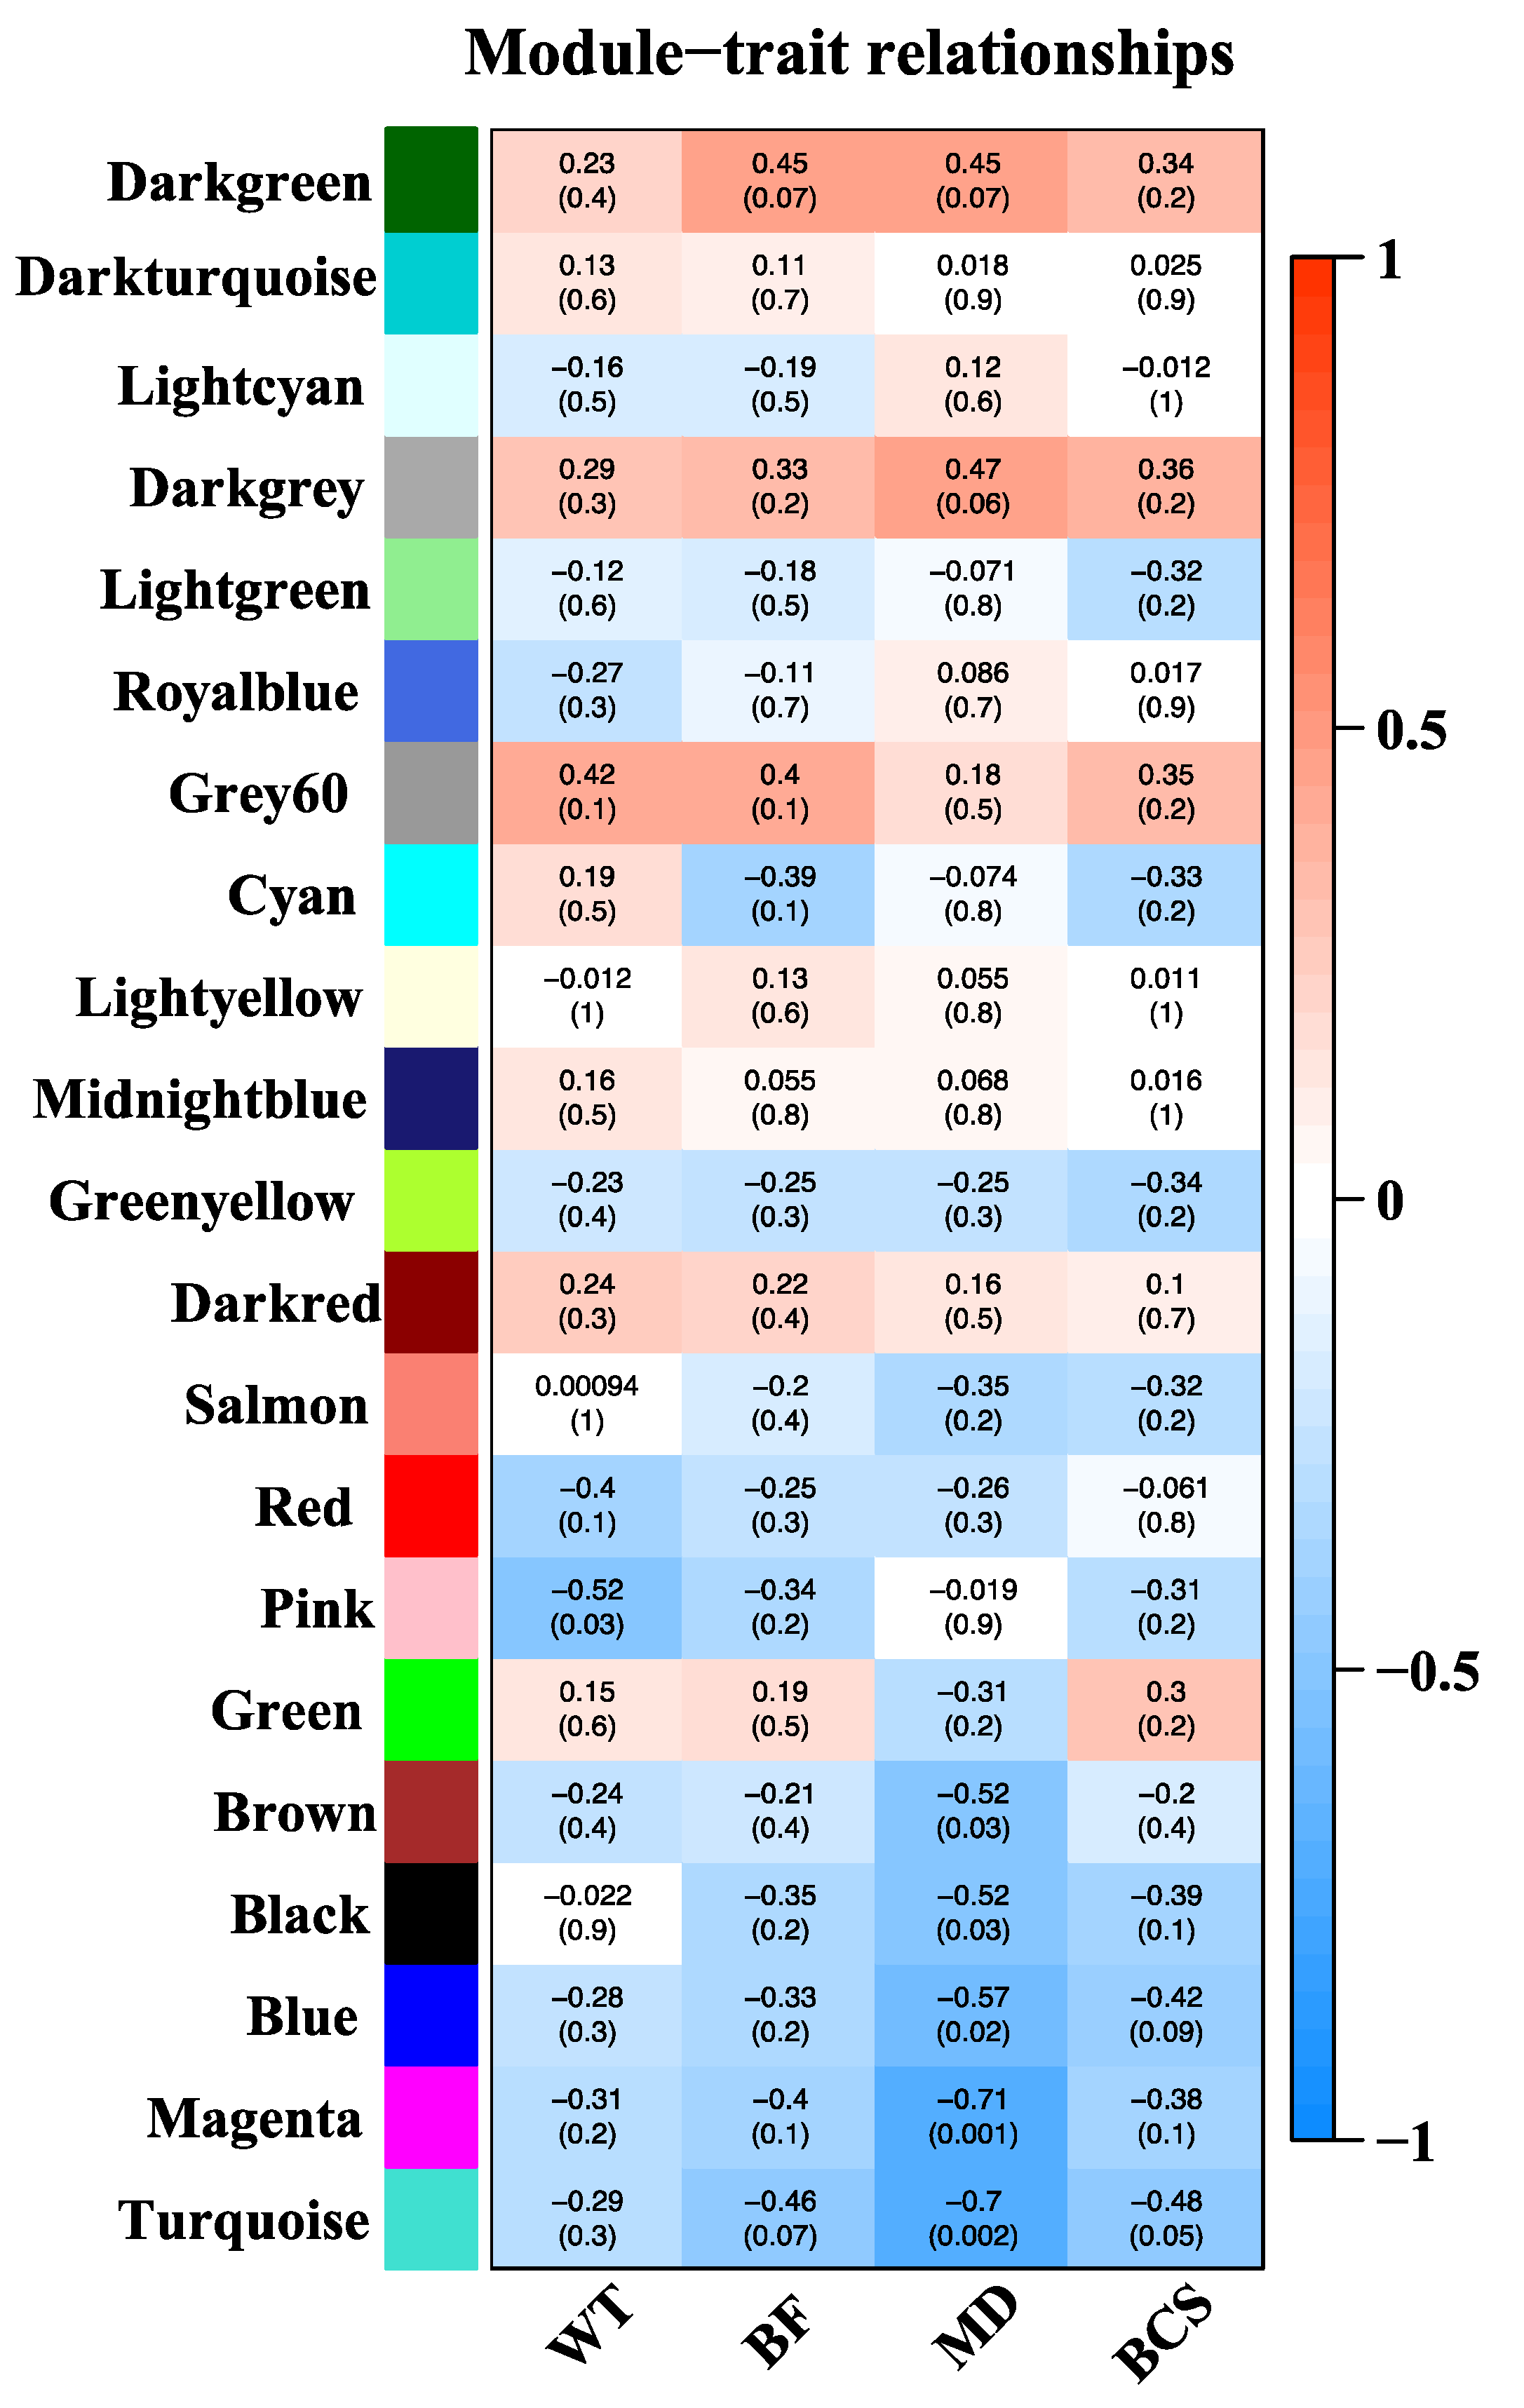
Figure 5.
Functional enrichment analysis of darkgreen module. (Top five pathways or terms shown). A: KEGG: Metabolic Pathways. B: GO: Molecular function C: GO: Biological process.
Figure 5.
Functional enrichment analysis of darkgreen module. (Top five pathways or terms shown). A: KEGG: Metabolic Pathways. B: GO: Molecular function C: GO: Biological process.
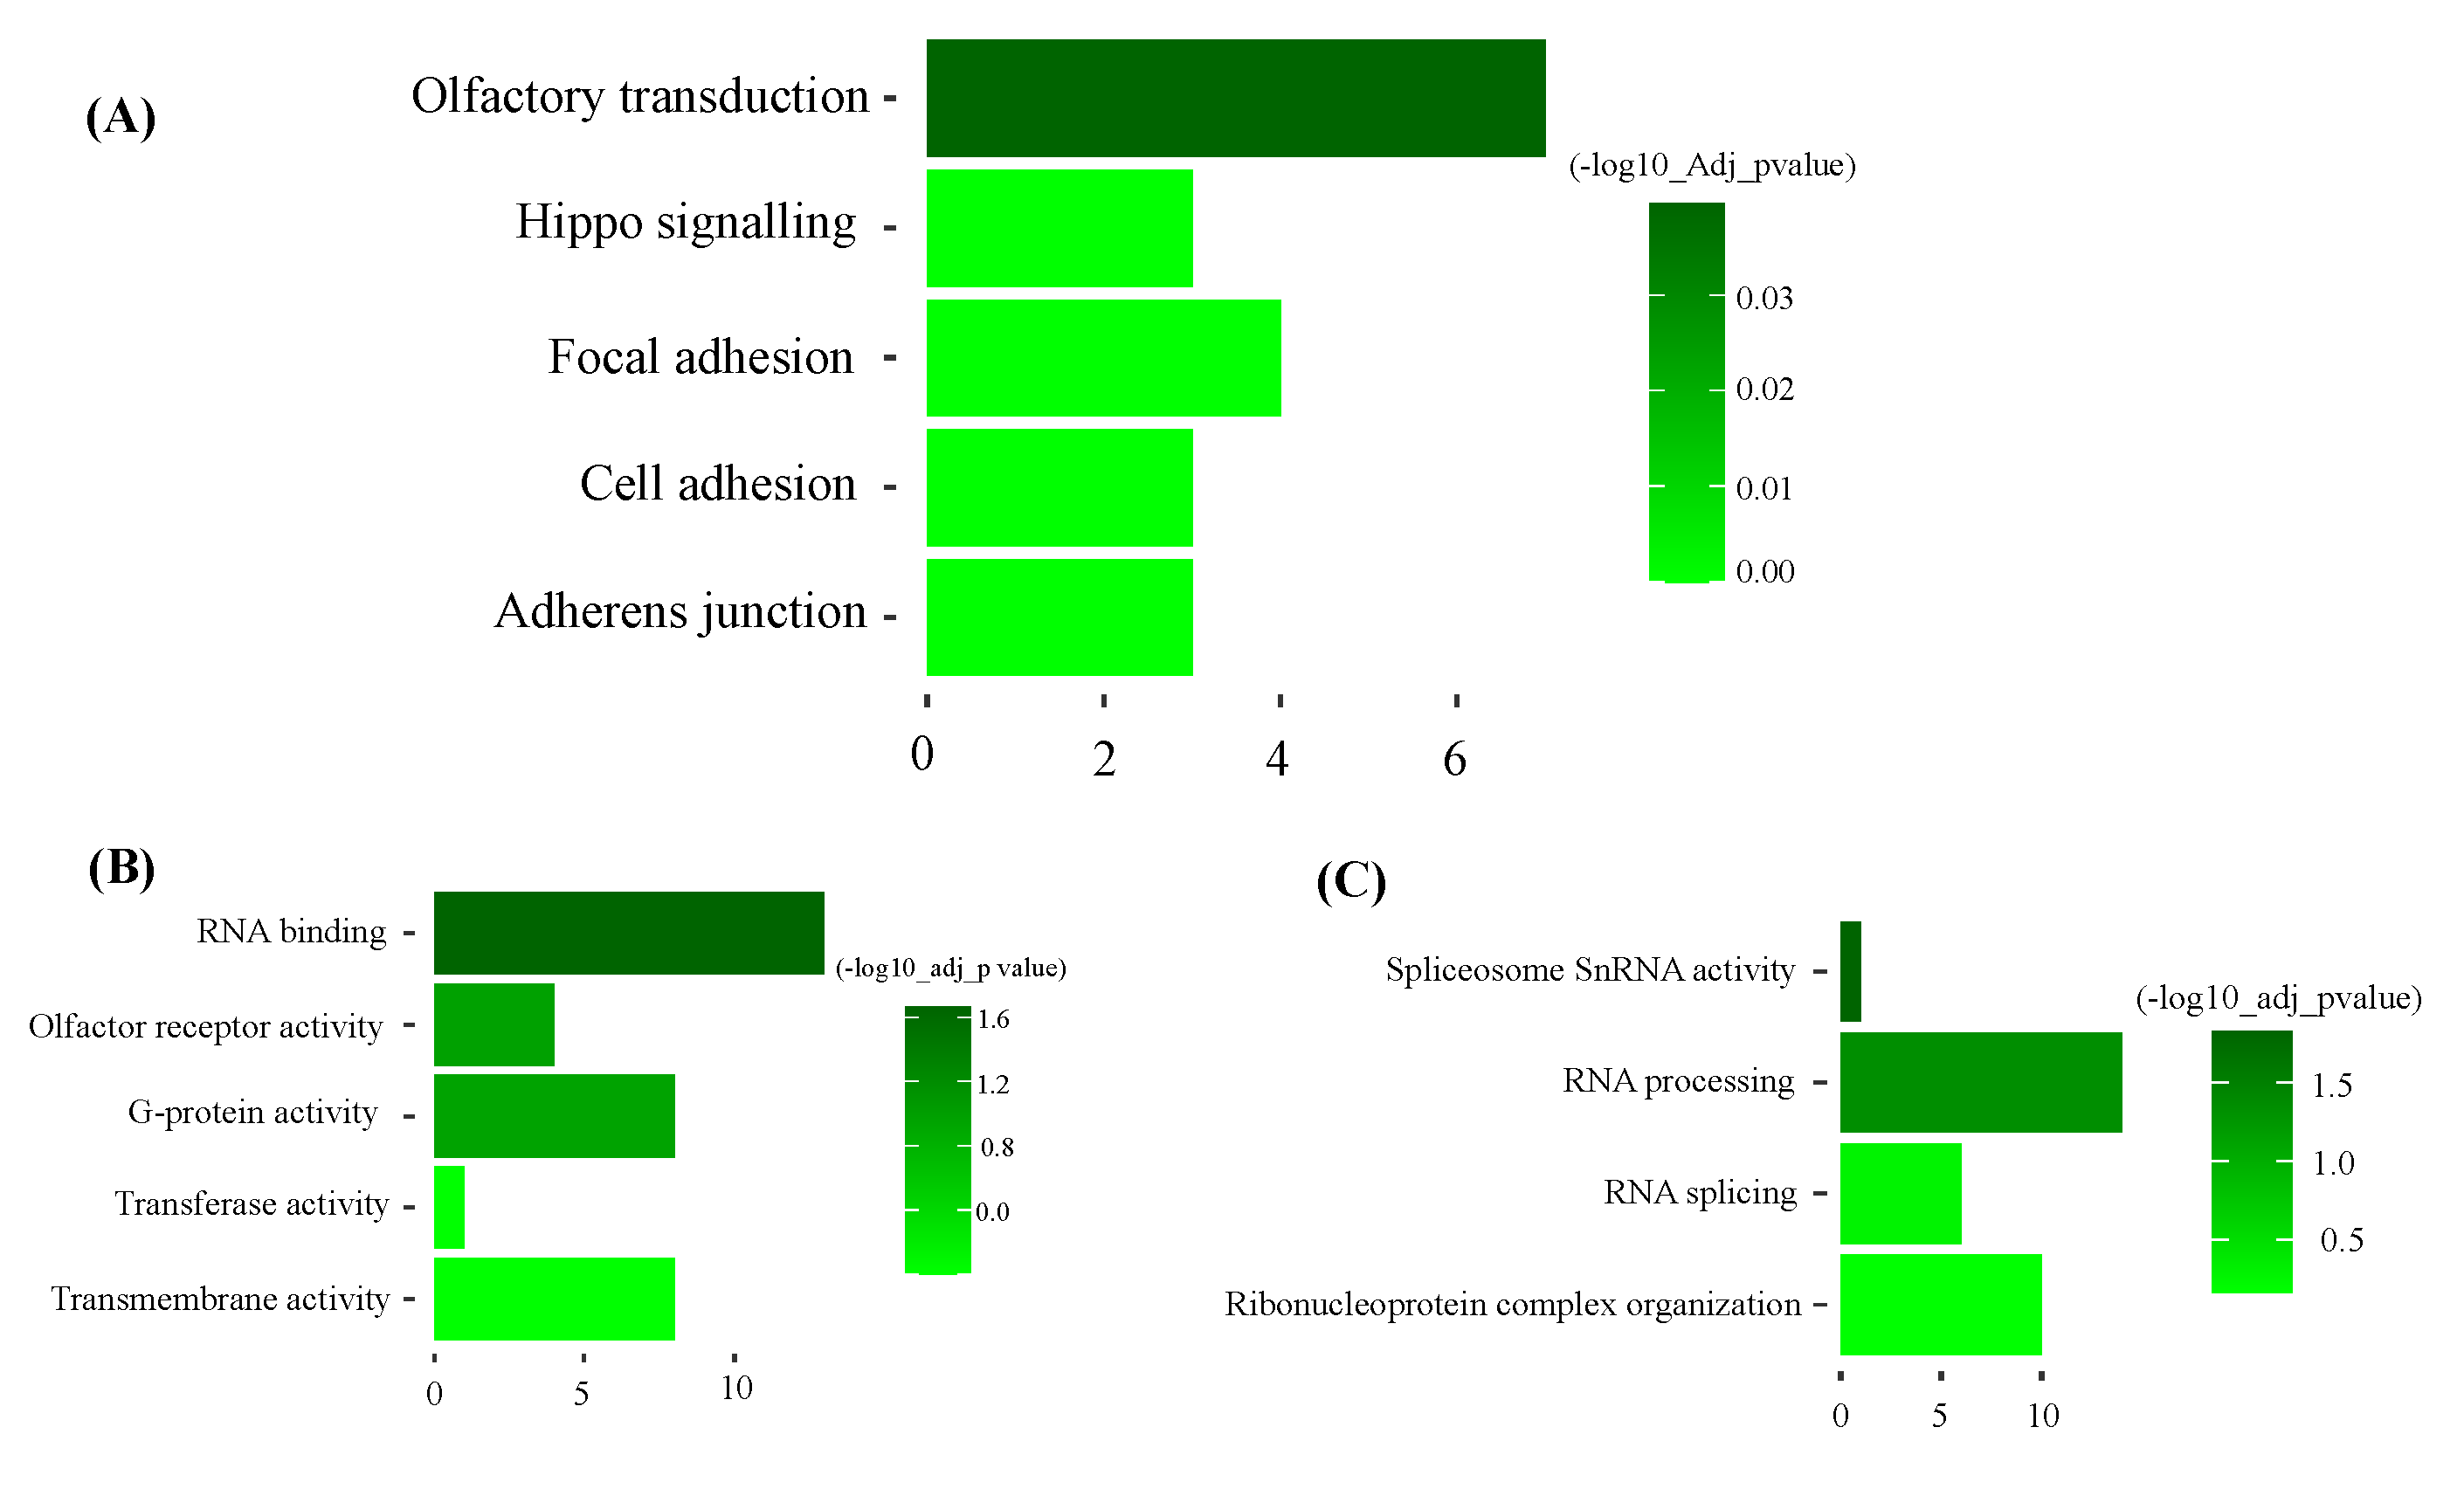
Figure 6.
Functional enrichment analysis of Magenta module. (Top five pathways or terms shown). A: KEGG: Metabolic Pathways. B: GO: Molecular function C: GO: Biological process.
Figure 6.
Functional enrichment analysis of Magenta module. (Top five pathways or terms shown). A: KEGG: Metabolic Pathways. B: GO: Molecular function C: GO: Biological process.
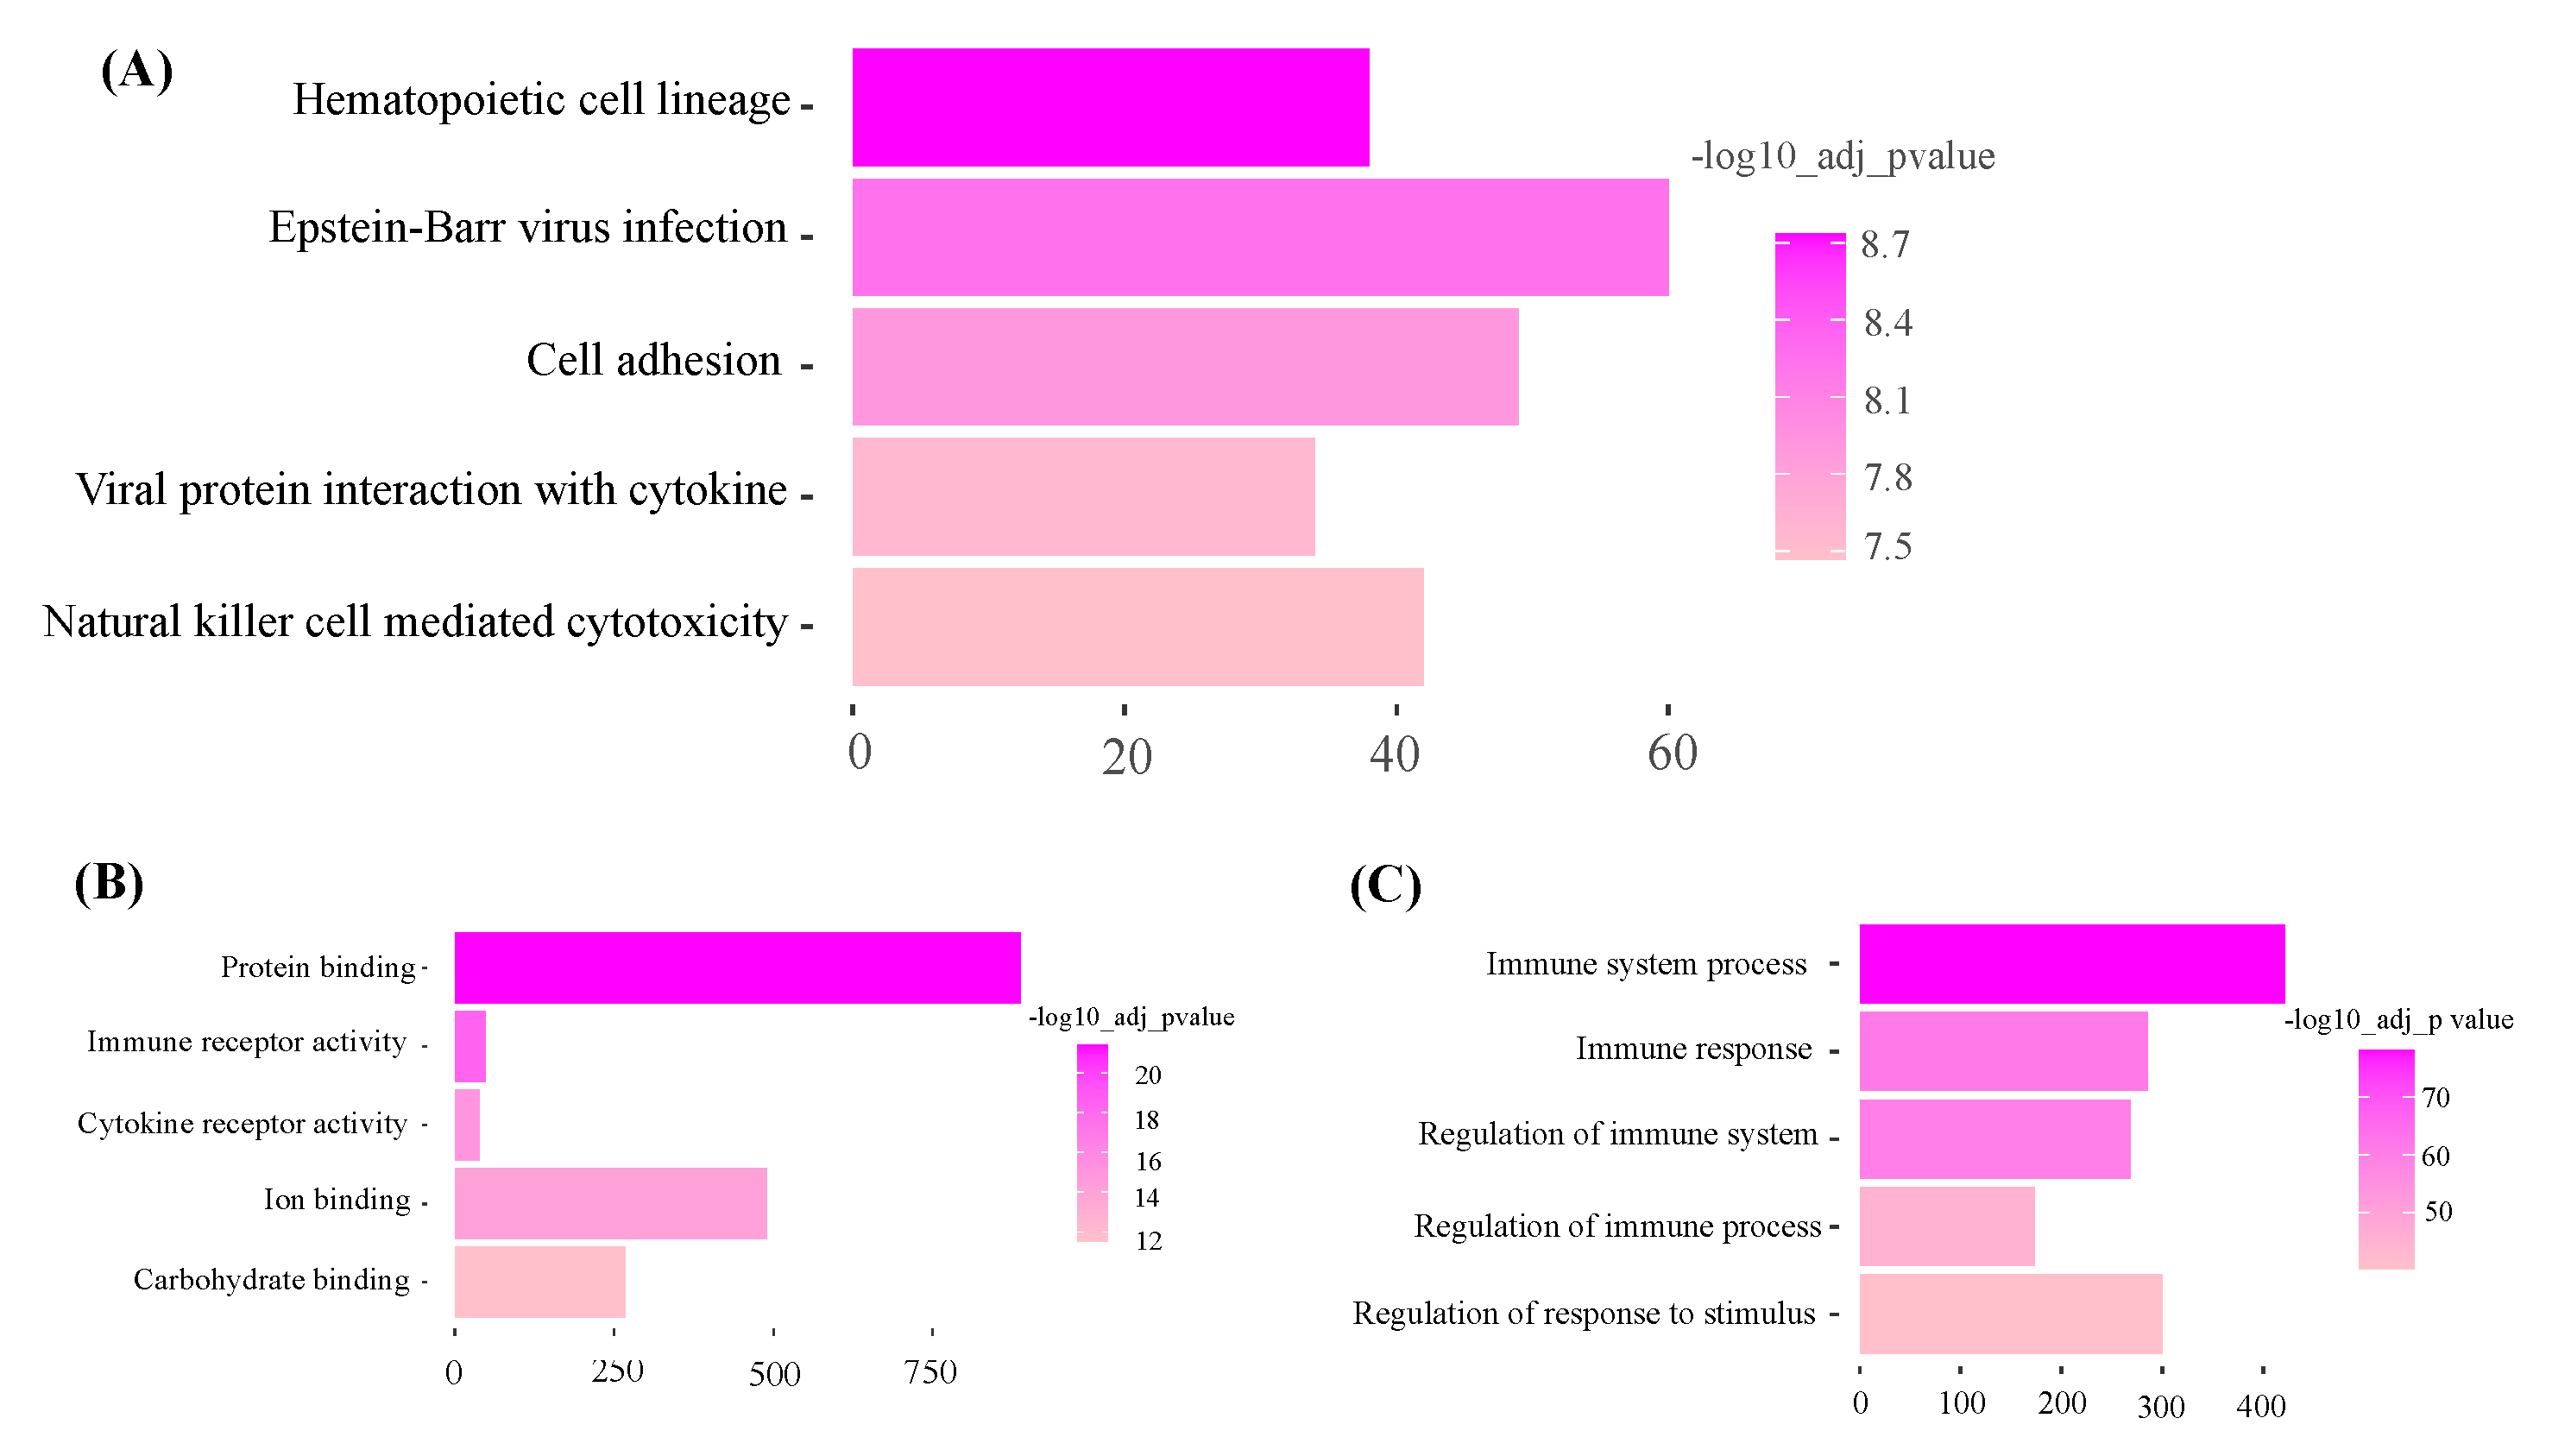
Figure 7.
Hub genes determined by module membership (MM) and gene significance (GS). GS represents the correlation between a gene and a trait. The MM represents the correlation between an individual gene and the module eigengene. MM and GS values were plotted on the x and y-axis. (A) In darkgreen module hub genes were identified according to a GS >0.5 and an MM >0.9. (B) In Magenta hub genes were identified according to a GS >0.8 and an MM >0.9. Table represent the top two hub genes of individual module.
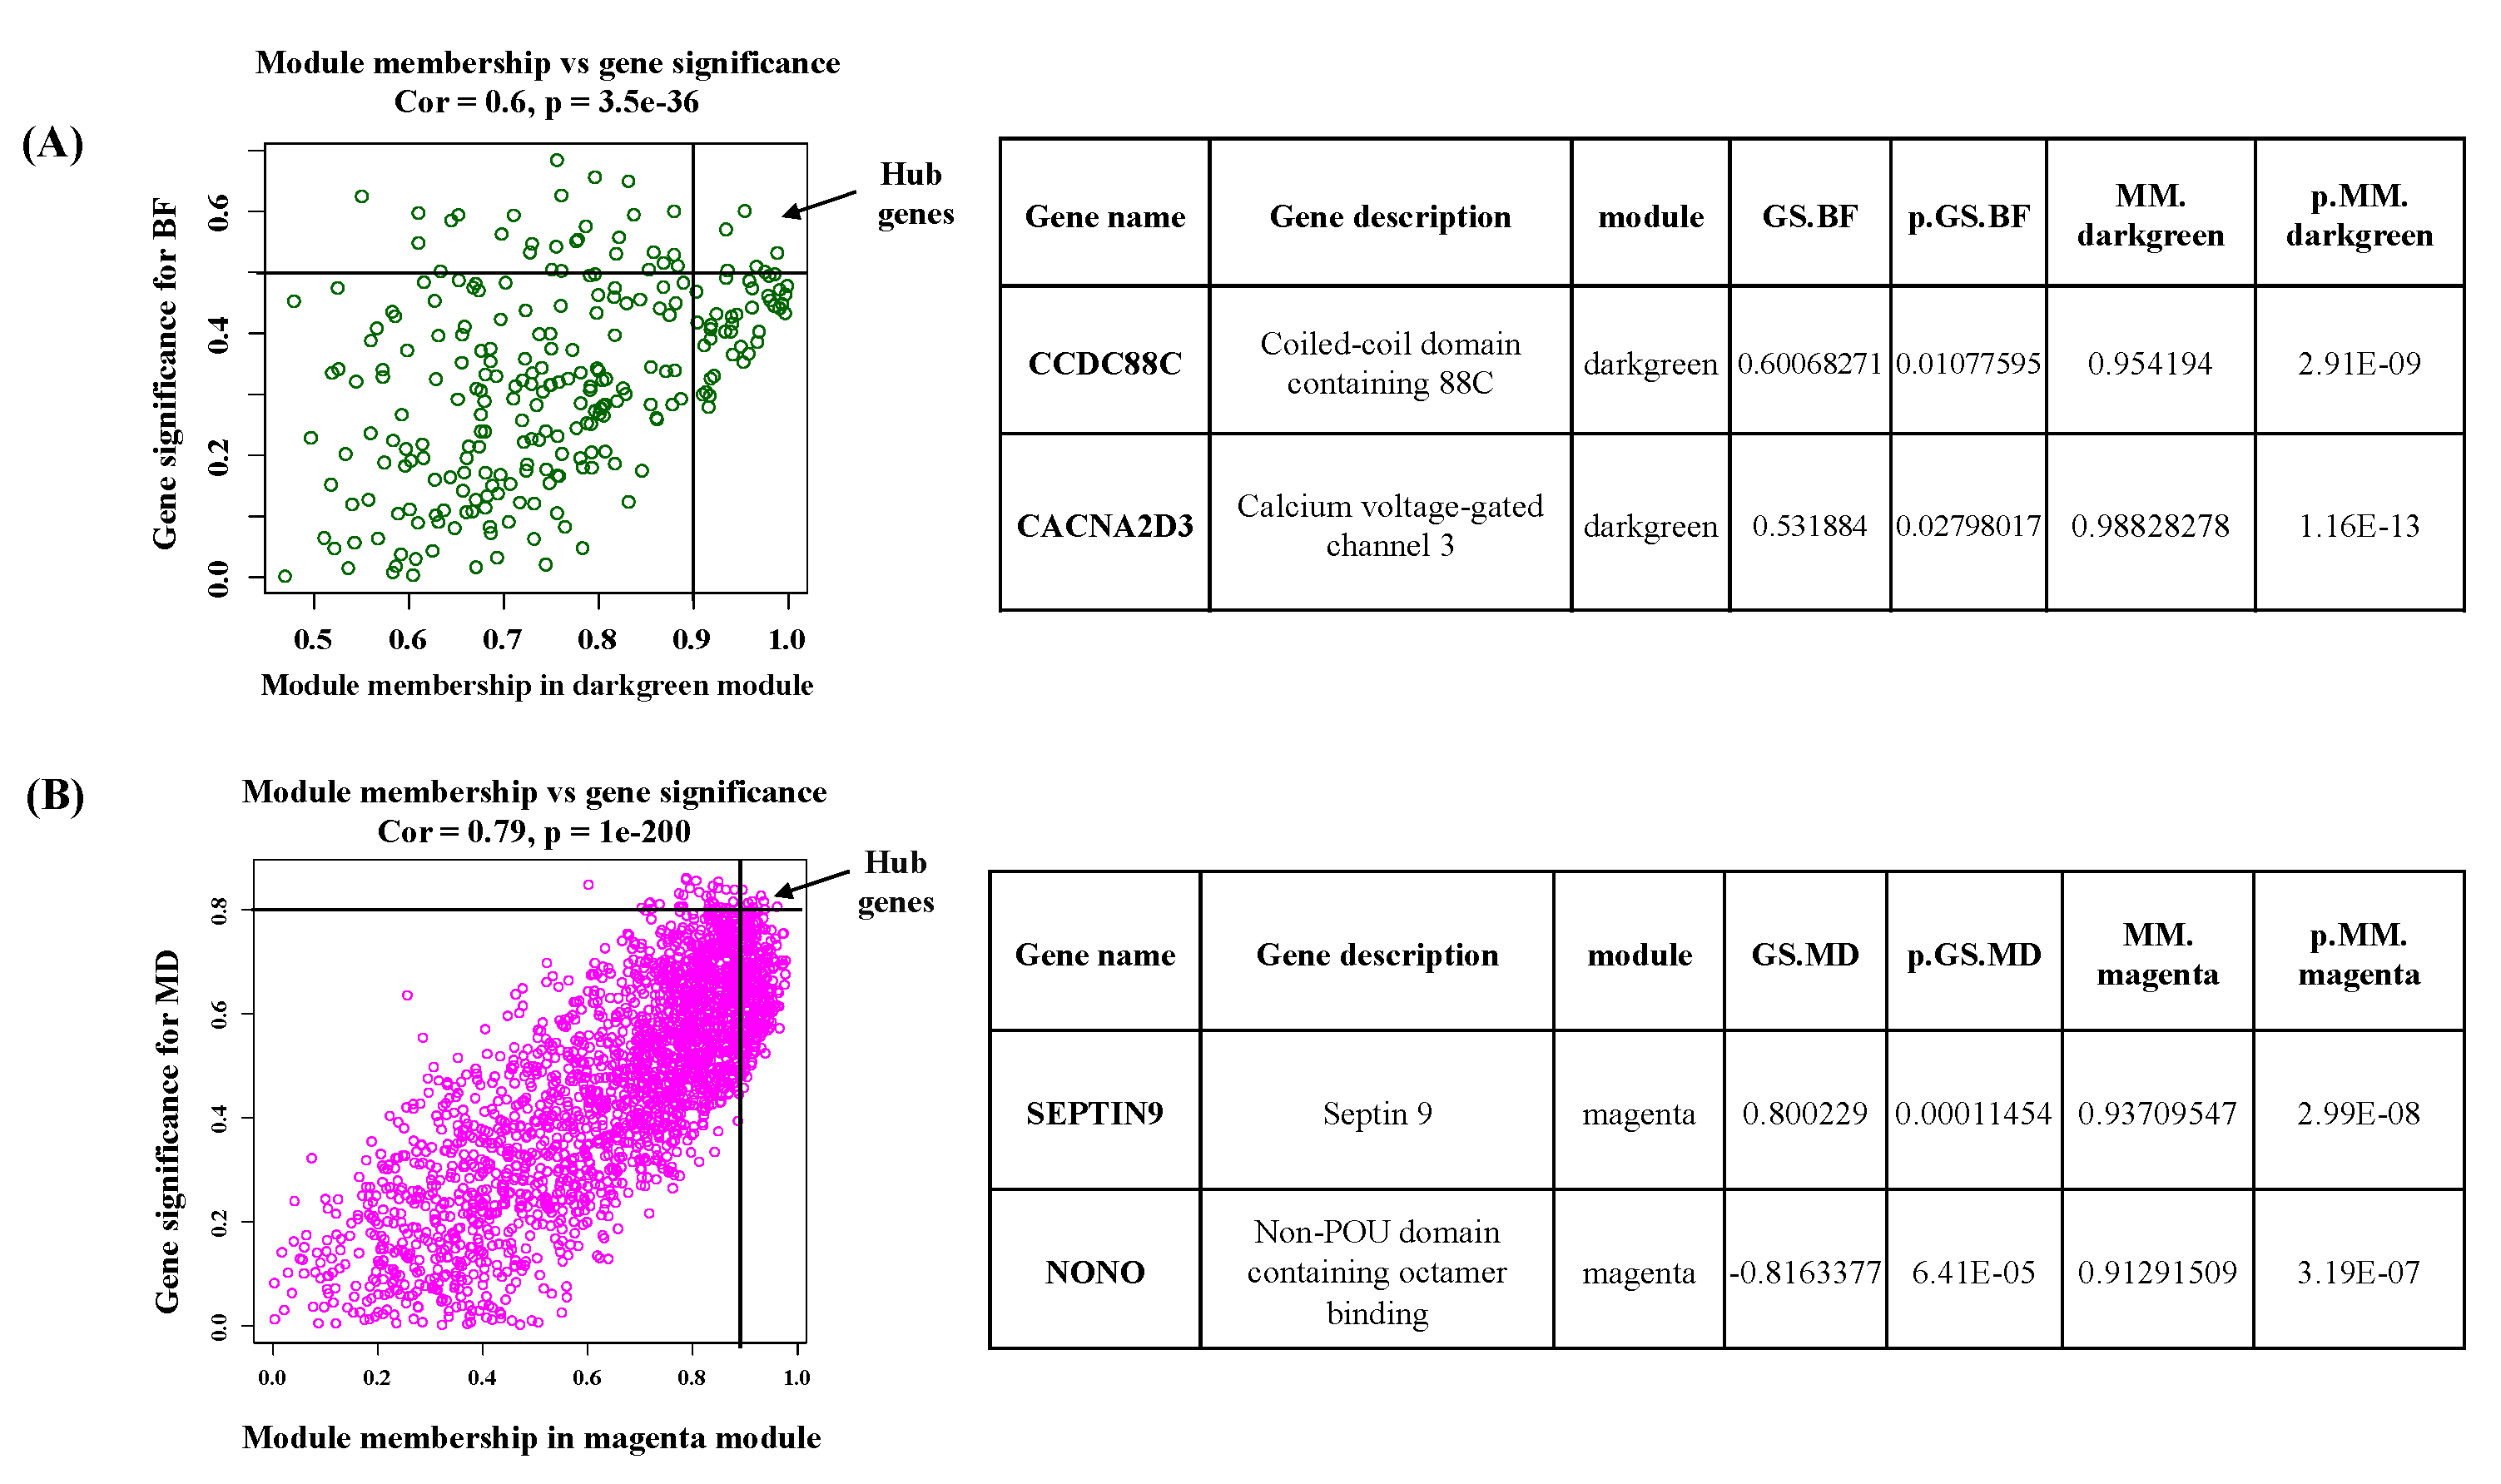

Table 1.
Beef production related traits recorded in this study (18 cows). WT: Body weight, BF: Back fat, MD: Muscle depth and BCS: Body condition score.
Table 1.
Beef production related traits recorded in this study (18 cows). WT: Body weight, BF: Back fat, MD: Muscle depth and BCS: Body condition score.
| Cow_Id | Weight (WT), Kg |
Backfat (BF), cm | Muscle depth (MD), cm | Body condition score (BCS) |
|---|---|---|---|---|
| C2 | 535 | 0.62 | 5.02 | 4 |
| C3 | 509 | 0.42 | 5.32 | 5 |
| C4 | 584 | 0.82 | 3.96 | 6 |
| C6 | 555 | 0.3 | 3.29 | 4 |
| C7 | 652 | 0.99 | 5.45 | 6 |
| C9 | 463 | 0.4 | 4.08 | 5 |
| C10 | 585 | 0.63 | 5.05 | 5 |
| C11 | 540 | 0.72 | 5.05 | 5 |
| C12 | 483 | 0.37 | 3.34 | 4 |
| C13 | 513 | 0.4 | 4.53 | 4 |
| C14 | 575 | 0.69 | 4.83 | 5 |
| C15 | 415 | 0.25 | 4.93 | 4 |
| C16 | 599 | 1.04 | 6.41 | 6 |
| C20 | 508 | 0.55 | 3.74 | 5 |
| C572 | 612 | 0.89 | 6.44 | 6 |
| C573 | 478 | 0.47 | 5.12 | 5 |
| C574 | 599 | 0.22 | 4.68 | 4 |
| C575 | 482 | 0.37 | 4.14 | 4 |
| Average | 538.16 | 0.56 | 4.74 | 4.8 |
Disclaimer/Publisher’s Note: The statements, opinions and data contained in all publications are solely those of the individual author(s) and contributor(s) and not of MDPI and/or the editor(s). MDPI and/or the editor(s) disclaim responsibility for any injury to people or property resulting from any ideas, methods, instructions or products referred to in the content. |
© 2025 by the authors. Licensee MDPI, Basel, Switzerland. This article is an open access article distributed under the terms and conditions of the Creative Commons Attribution (CC BY) license (http://creativecommons.org/licenses/by/4.0/).
Copyright: This open access article is published under a Creative Commons CC BY 4.0 license, which permit the free download, distribution, and reuse, provided that the author and preprint are cited in any reuse.


