

Submitted:
21 February 2023
Posted:
27 February 2023
You are already at the latest version
Abstract
Targets for finished livestock are often determined by expected fat, either subcutaneous or intramuscular. These targets are used frequently to improve the chances of acceptable eating quality. Lower intramuscular fat, lack of product uniformity, and reduced or insufficient tenderness can negatively impact beef acceptability. This study aimed to investigate differences in gene expression that potentially alter subsequent metabolism and intercellular signaling in the muscle and proximate intermuscular and subcutaneous adipose tissue in beef carcasses at different fat endpoints. In this study, Longissimus thoracis muscle samples and associated adipose tissue were collected at harvest. RNA was harvested from both tissues, and individual samples were sequenced using RNAseq. Differential expression was determined using edgeR, and p-values were adjusted using the Benjamini-Hochberg method. A corrected p-value of 0.005 and log₂ (fold change) of 1 was set as the threshold to identify differential expression of genes. Comparison between intermuscular fat and subcutaneous fat showed no differences between the genes activated in the two adipose tissue depots, suggesting that subcutaneous fat could be sampled to evaluate changes in adipose tissue. Carcass data allowed the classification of carcasses by projected USDA quality grades (marbling targets). In the comparison between muscle from Standard and Choice carcasses, 15 genes were downregulated, and 20 were upregulated. The insulin receptor substrate 1 (IRS 1) gene was the only known functionally important gene to be differentially expressed. There were 49 downregulated genes and 113 upregulated genes in the comparison between adipose tissue from Standard and Choice carcasses. These genes are mostly related to the metabolism of fat and energy. This potentially indicates that muscle is not changing at the transcript level as much as the adipose tissue at the sampled endpoints. Also, subcutaneous fat can be used to evaluate transcript changes in both subcutaneous and intermuscular fat. However, it is not clear if these fat tissues can be used as surrogates for intramuscular fat or marbling.
Keywords:
carcass quality
; beef cattle
; adipose tissue
; muscle tissue
; transcriptomics
1. Introduction
Intramuscular fat has been used for quality assurance systems within the US and Australia to improve the consistency of tenderness and improved eating experience [1]. Iida et al. [2] reported that sensory scores for juiciness and tenderness increased as the fat level increased in steaks from Japanese Black steers. Other researchers have reported that increasing levels of marbling results in a higher likelihood of a tender product [3,4]. In general, as subcutaneous fat increases, marbling also increases, and producers have used visual observations of fat and live body weight to determine harvest times. As an animal matures, it exhibits significant shifts in physiological responses. For example, as muscle growth approaches its peak, energy utilization for muscle growth is reduced, resulting in increased energy storage [3,5]. These changes encourage the deposition of fat, including marbling. However, animal-to-animal variation results in differing levels of marbling and subcutaneous fat. Thus, there is a need to identify what changes occur at the molecular level that initiates fat deposition to help predict final fat deposition.
While advances have been made in genetic selection and objective measures of fat, there are still animals not reaching desired body composition endpoints after similar days on feed. Engle et al. [6] reported a significant number of differentially expressed genes in longissimus lumborum muscle from Standard and Choice carcasses (1,258 genes, p < 0.01). Functional analysis of these genes revealed differences in the underlying pathways regulating muscle cell growth and proliferation. Biological processes of upregulated genes were associated with signaling pathways associated with inflammation, growth, and metabolism. Furthermore, the upregulation of processes associated with the extracellular matrix, stem cell differentiation, and focal adhesion was observed. Further investigation into the changes occurring during fat deposition to better predict and select animals that consistently achieve the desired level of marbling and fat in a predictable fashion is important. This would allow for more efficient feeding and management of finishing cattle. We hypothesize that gene expression in adipose tissue changes during fattening and that coordinated changes in expression between muscle and adipose tissues can be detected. This work aimed to provide new insight into the differences in muscle and fat tissues when carcasses have reached marbling associated with different USDA quality grades.
2. Materials and Methods
Data collection protocols were approved by the Montana State University Agriculture Animal Care and Use Committee (Protocol No. 2015-AA17).
Fifteen steers were selected at weaning based on weight and date of birth. Steers were moved to the Montana State University Bozeman Area Research and Teaching Farm and placed in a single pen in the feedlot. At the start of the study, steers weighed an average of 313 ± 14 kg. Each steer received a Synovex One Feedlot implant per standard feedlot protocol. They were fed an ad libitum diet of hay for two weeks to acclimate steers to pens and were then started on a 6-week, step-up program to build up to the full ration (Table 1), which was a diet of 75% shelled corn, 18% hay, and 7% finisher pellet, fed in a bunk daily and had free access to water. Steers were randomly allocated to one of three endpoints based on body weight and visual evaluation, with average endpoint weights of 431 kg, 522 kg, and 612 kg targeting marbling levels for Standard, Select, and Choice quality grades, respectively. These weight-based endpoints achieved the desired marbling endpoints (Table 2). Animals were transported 60 miles to a small commercial processor and harvested following normal industry standards. Carcass data was collected 24 hours postmortem to calculate yield grade and determine quality grade following USDA guidelines [7]. Carcasses were ribbed between the 12th and 13th rib, exposing the longissimus dorsi. Marbling determination was done a minimum of 20 minutes after ribbing to give time for the muscle to oxygenate. Carcass characteristics were measured by an individual with 30 years of experience in carcass data collection. Carcass measurements were collected as outlined by Engle et al. [6].
Striploins were removed at 24 h postmortem and transported to the Montana State University Meat Laboratory. The striploins were cut into 2.54 cm steaks starting at the anterior end. Steaks were individually vacuum packaged. Steaks were randomly assigned to different days of postmortem aging (24 h, 3, 7, 14, or 21 d postmortem). One steak was cut into five equal pieces for myofibrillar fragmentation index (MFI). These pieces were vacuum packaged and aged as described for steaks. After aging, vacuum-packaged meat was placed in a -20 °C freezer until analysis. Steaks were taken from a -20 °C freezer and placed in a 2 °C cooler approximately 24 hours prior to cooking. Steaks were blotted, tagged, weighed, and a single copper constantan thermocouple (OMEGA Engineering, INC, P.O. Box 4047, Stamford, Connecticut) was placed in the center to track endpoint temperature. They were then placed on an aluminum-covered broiler pan and placed under the broiler of a conventional oven 10.16 cm below the heating element. Steaks were then cooked on broil until reaching an internal temperature of 35 °C. At that point, the steaks were turned and cooked on the other side until reaching an internal temperature of 70 °C [8]. Steaks were cooled in a 2 °C cooler. After cooling for a minimum of 45 minutes, steaks were taken from the cooler, blotted with towels, and weighed. A minimum of five samples were taken parallel to the muscle fiber, resulting in square samples of 1.27 x 1.27 cm. The samples were then sheared using a TMS 30 Food Texturometer fitted with a Warner-Bratzler shear attachment. The average of the samples sheared was used for statistical analysis.
The MFI was determined following the procedures reported by Culler et. al. [9], as modified by Hopkins et. al. [10]. Two samples per steer, each duplicated, yielded four measurements per steer. The MFI average for each sample was calculated, and the average was used for statistical analyses. Carcass data was analyzed using the Proc GLM procedure in SAS (v10.2) with quality grade class as an independent variable. MFI and shear force were analyzed using the Proc GLM procedure of SAS with quality grade and day of aging as independent variables, and the interaction was tested but was not significant, so it was dropped from the analysis. The LSMEANS procedure was used to calculate the means and determine significance. Significance was set at a threshold of p < 0.05.
Subcutaneous and intermuscular adipose tissue samples were taken between the 4th and 5th rib at time of harvest and homogenized immediately in Triazol and then transported on dry ice for subsequent RNA extraction. Longissimus thoracis muscle samples from the same area were snap frozen. Frozen muscle samples and homogenized adipose tissue sample RNA was extracted using a Qiagen RNAeasy Plus Universal Midi kit according to manufacturer recommendations (Qiagen LLC, Georgetown MD, USA).
A total of 3 μg of RNA per sample was used to generate sequencing libraries using NEBNext Ultra RNA Library Prep Kit® from Illumina (NE, USA) following manufacturer instructions and index codes were added to each sample. RNA was enriched for mRNA and cDNA libraries were created using AMPure XP system (Beckman Coulter, Beverly, USA). Libraries were sequenced on an Illumina Hiseq platform, and 125 bp/150 bp paired-end reads were generated. Read quality metrics are shown in Table 3.
Reads were aligned to reference genome UMD 3.1. The FPKM, the expected number of fragments per kilobase of transcript sequence per millions of base pairs sequenced of each gene, was then calculated based on the length of the gene and the reads count mapped to said gene.
Prior to differential gene expression analysis, for each sequenced library, the read counts were adjusted by edgeR program package through one scaling normalized factor. Differential expression analysis of two conditions was performed using the DEGSeq R package (1.20.0). The p-values were adjusted using the Benjamini-Hochberg method. A corrected p-value of 0.005 and fold change of 1 were set as the threshold for significantly differential expression.
Gene Ontology (GO) enrichment analysis of differentially expressed genes was implemented by the GOseq R package, in which gene length bias was corrected. GO terms with FDR corrected P-value < 0.05 were considered significantly enriched by differentially expressed genes. KEGG, a database resource for understanding high-level functions and utilities of the biological system, was used, along with KOBAS software, to test the statistical enrichment of differentially expressed genes in KEGG pathways.
3. Results
As expected, carcass weights from animals with Choice quality grade were greater (P = 0.002) than carcass weights from carcasses with less marbling that would result in Select or Standard quality grades (Table 2). This is not unexpected as the steers resulting in Choice carcasses were on feed longer than the steers of the other quality classifications (150 days versus 73 and 94). Furthermore, the fat thickness was significantly greater (P = 0.007) for carcasses grading Choice and Select than carcasses grading Standard. Other researchers have reported increased fat thickness as the carcass grade and carcass weight increase [11]. Conversely, the ribeye area was not different between the carcasses of different grades. This is in contrast to other reported results where the ribeye area was observed to be larger when carcass weights were higher [12,13,14]. Fat thickness was greater (P = 0.007) for Choice and Select carcasses than for Standard carcasses (Table 2). This is expected, as increasing marbling is needed for higher-quality grades and is usually associated with higher fat content in the whole carcass [3,6].
Shear force values for steaks from Choice and Select carcasses were significantly lower than values for steaks from Standard carcasses (Table 2). Mixed results have been reported for differences in tenderness associated with different marbling degrees. Vierck and co-workers [4] reported differences in tenderness between steaks from Choice and Select carcasses, but no differences were observed between the different levels of Choice. However, other researchers have reported that marbling had little effect on tenderness [15,16,17]. Additional studies evaluating very high levels of intramuscular fat have consistently shown improved tenderness as the marbling increased [2,5]. Nishimura and colleagues [5] suggested changes in connective tissue structure (electron microscopy) as the fat level in the longissimus contributed to the increase in tenderness. This suggests that comparisons at higher levels of marbling may confound the information on how marbling affects tenderness.
Myofibrillar fragmentation index (MFI) was significantly lower for steaks from Choice and Standard carcasses when compared to steaks from Select carcasses (Table 2). Higher MFI values are associated with a greater breakdown of fibers and have been related to improved tenderness. Kim and Lee [18], however saw no effect of marbling on MFI when comparing steaks from Hanwoo cattle of varying grades. The differences in reported MFI values do not match the differences in shear force values. Researchers have reported that higher MFI values are correlated to lower Warner-Bratzler shear values. [18,19,20]. The aging of steaks resulted in a decreased shear force for up to 14 days. The greatest change, however, was seen in the first 3 days of aging. Olson et al. [21] also reported the greatest change in shear force in the first 3 days of aging. Ilian and co-workers [20] reported similar results. However, Bratcher and co-workers [22] found improvement in shear force values up to 14 days of aging. MFI values increased up to 7 days of aging but were only significantly different between 1 day of aging and the rest of the aging times. Ilian et al. [20] reported significant increases occurred in MFI gradually during days 2 and 3 postmortem, but non-significant changes occurred after 7 days. These researchers also found strong correlations between the kinetics of tenderization and MFI. This data suggests that the sarcomeric structure’s dissolution rate is the fastest early postmortem and slows as the time postmortem increases.

Table 3.
Effect of quality classification on the shear force and myofibrillar fragmentation index (MFI) of beef strip steaks.
Table 3.
Effect of quality classification on the shear force and myofibrillar fragmentation index (MFI) of beef strip steaks.
| Shear force (N) 3 | MFI |
| 84.34 b | 59.25 b |
| 79.20 b | 64.55 a |
| 105.70 a | 55.24 b |
| 118.42 a | 49.78 b |
| 95.31 b | 59.51 a |
| 86.70 bc | 62.02 a |
| 73.55 c | 64.18 a |
| 74.76 c | 62.94 a |
1 Quality classification is all marbling categories within Choice, Select and Standard categories. 2 Postmortem days of aging of steaks at 4 °C in vacuum package. 3 Newtons can be translated to kg by dividing by 9.80665. a,b,c Different letters within a column are significantly different at P< 0.05.
The RNAseq experiment yielded the expected number of transcripts with, on average, over 50 million mapped reads and high-quality data, as shown in Table 4.
In four cases, the intermuscular fat RNA was of insufficient quality or quantity for sequencing. We replaced these samples with subcutaneous adipose tissue. Figure 1 shows the Pearson correlations between each individual sample and the other samples included in the dataset. There are high correlations (>85% on average) between muscle samples, with one sample that was potentially contaminated by connective or vascular tissue, and a high correlation (>90%) between adipose samples, including those subcutaneous samples that were used to replace intermuscular samples. This shows that at these carcass endpoints, there are no detectable differences in gene expression between intermuscular and subcutaneous adipose tissues.
In the comparison between adipose tissue from Standard and Select carcasses, four genes were upregulated, and 29 were downregulated (Table 5). Notably, two genes associated with WNT signaling were downregulated in adipose tissue from Select carcasses. WNT signaling suppresses adipogenesis by blocking the activation of PPARγ and CEPBα, which are the major regulators of adipogenesis. One upregulated transcript is BOLA-DMB which codes for MHC type 2 and indicates the presence of immune cells such as macrophages [23]. In comparing adipose tissue from Select to Choice carcasses, eight genes were downregulated, and 15 genes were upregulated (Table 5). Leptin and ACC1 (Acetyl CoA Carboxylase 1) are two examples of downregulated genes, and this could lead to insulin resistance and potentially inhibit lipogenesis [24,25]. There were 49 downregulated genes and 113 upregulated genes in the comparison between adipose tissue from Standard and Choice carcasses (Table 5). Downregulated genes included: CAB39L, FGF-1, GRIN1, LEP, HK2, YWHAG, ACC1, SCD1, and ELOVL3. These genes are mostly related to fat and energy metabolism and promote adipogenesis and fat deposition (Table 7, Table 8 and Table 9) [3]. For another example, the downregulation of ACC1, HK2, and the upregulation of EIF43BP1 would inhibit protein synthesis and increase lipogenesis. Furthermore, the down-regulation of leptin can cause insulin resistance [24,26], and the upregulation of gluconeogenesis, which alters fat metabolism. Additionally, a number of immune markers were upregulated in the adipose tissue from Choice animals compared to Standard, which may be due to inflammation and immune activation in the adipose tissue.
In the comparison between muscle from Standard and Choice carcasses, 15 genes were downregulated, and 20 were upregulated (Table 6 and Table 10). The insulin receptor substrate 1 (IRS 1) gene was the only known functionally important gene to be differentially expressed. No transcripts associated with muscular hypertrophy were differentially expressed.
Differentially expressed gene lists were uploaded to Ingenuity Pathway Analysis software (Qiagen Inc.), and network analysis was conducted. In comparing Choice to Standard adipose tissue, a network annotated as Endocrine system disorders, Metabolic Disorders, and Organismal injury was highlighted. This network is centered on insulin and growth hormone, which are not expressed in adipose tissue (Figure 2). Still, most of the molecules associated with these are upregulated in our dataset. This also indicates that inflammatory processes are being activated in the adipose tissue as fat deposition increases.
Table 5.
Select differentially expressed genes in adipose tissue from beef steers with different USDA Carcass Quality Grades.
Table 5.
Select differentially expressed genes in adipose tissue from beef steers with different USDA Carcass Quality Grades.
| Standard to Select Adipose (1 vs 2) | ||||
| Gene Code | Fold Change | Padj | Gene Abbreviation | Gene Name |
| Downregulated: | ||||
| ENSBTAG00000008063 | -1.59 | 2.47E-05 | PPARA | peroxisome proliferator activated receptor alpha |
| ENSBTAG00000014387 | -1.85 | 2.19E-05 | PRKAB2 | protein kinase AMP-activated non-catalytic subunit beta 2 |
| ENSBTAG00000040128 | -1.24 | 5.96E-05 | FZD4 | frizzled class receptor 4 |
| ENSBTAG00000006037 | -1.82 | 3.03E-05 | WISP2 | WNT1 inducible signaling pathway protein 2 |
| Upregulated: | ||||
| ENSBTAG00000021077 | 446 | 3.70E-08 | BOLA-DMB | Major histocompatibility complex, class II, DM beta |
| Select to Choice Adipose (2 vs 3) | ||||
| Gene Code | Fold Change | Padj | Gene Abbreviation | Gene Name |
| Downregulated: | ||||
| ENSBTAG00000014911 | 3.65 | 2.46E-05 | LEP | leptin |
| ENSBTAG00000018777 | 2.64 | 6.08E-07 | ADCY5 | adenylate cyclase type 5 |
| Standard to Choice Adipose | ||||
| Gene Code | Fold Change | Padj | Gene Abbreviation | Gene Name |
| Downregulated: | ||||
| ENSBTAG00000034222 | 1.18 | 4.76E-05 | CAB39L | calcium binding protein 39 like |
| ENSBTAG00000005198 | 1.80 | 2.62E-07 | FGF1 | Fibroblast growth factor 1 |
| ENSBTAG00000047202 | 1.37 | 8.74E-06 | GRIN1 | glutamate ionotropic receptor NMDA type subunit 1 |
| ENSBTAG00000014911 | 1.35 | 0.000297 | LEP | Leptin |
| ENSBTAG00000013108 | 2.19 | 9.91E-05 | HK2 | hexokinase 2 |
| ENSBTAG00000017567 | 1.79 | 1.48E-06 | ACC1 | Acetyl-CoA carboxylase alpha |
| ENSBTAG00000045728 | 1.84 | 0.000115 | SCD1 | Stearoyl-CoA desaturase |
| ENSBTAG00000008102 | 2.34 | 3.52E-06 | CRTAC1 | Cartilage acidic protein 1 isoform 2 precursor |
| ENSBTAG00000008153 | 1.03 | 0.032 | CAMSAP2 | Calmodulin regulated spectric associated protein family member 2 |
| ENSBTAG00000011337 | 1.72 | 0.0037 | ANKRD33B | Ankyrin repeat domain 33B |
| ENSBTAG00000013107 | 2.12 | 4.76E-06 | SHANK1 | SH3 and multiple ankyrin repeat domains 1 |
| ENSBTAG00000018473 | 3.70 | 0.039 | MARCO | Macrophage recptor with collagenous structure |
| ENSBTAG00000026156 | 1.63 | 0.025 | VCL | Vinculin |
| ENSBTAG00000015690 | 1.03 | 1.88E-06 | PLIN4 | Perilipin 4 |
| ENSBTAG00000003359 | 1.44 | 4.39E-06 | ELOVL5 | ELOVL fatty acid elongase 5 |
| Upregulated: | ||||
| ENSBTAG00000027654 | -1.43 | 7.97E-05 | EIF4EBP1 | eukaryotic translation initiation factor 4E binding protein 1 |
| ENSBTAG00000016071 | -1.56 | 0.000195 | HHIP | hedgehog interacting protein |
| ENSBTAG00000003658 | -1.23 | 4.50E-05 | RELN | reelin precursor |
| ENSBTAG00000007446 | -1.49 | 8.45E-05 | NGF | nerve growth factor |
| ENSBTAG00000007446 | -1.55 | 0.004 | SCART1 | Scavenger receptor family member expressed on T-cells |
| ENSBTAG00000007554 | -1.26 | 0.022 | IFI6 | Interferon alpha inducible protein 6 |
| ENSBTAG00000015182 | -1.58 | 0.0002 | STARD10 | StAR related lipid transfer domain containing 10 |
| ENSBTAG00000039520 | -2.29 | 0.042 | SIRPB1 | Signal Regulatory Protein |
| ENSBTAG00000009656 | -1.53 | 5.51E-06 | BOLA-DQA2 | Major histocompatibility complex, class II, DQ alpha 2 |
| ENSBTAG00000021077 | -11.68 | 1.40E-08 | BOLA-DQB | Major histocompatibility complex, class II, DQ beta |
| ENSBTAG00000038128 | -2.36 | 1.36E-06 | BOLA-DQA5 | Major histocompatibility complex, class II, DQ alpha 5 |
Table 6.
Select differentially expressed genes in muscle tissue from beef steers with different USDA Carcass Quality Grades.
Table 6.
Select differentially expressed genes in muscle tissue from beef steers with different USDA Carcass Quality Grades.
| Standard to Choice Muscle | ||||
| Gene Code | Fold Change | padj | Gene Abbreviation | Gene Name |
| Downregulated: | ||||
| ENSBTAG00000017412 | -1.23 | 0.0.19 | SOCS6 | Suppressor of cytokine signaling 6 |
| ENSBTAG00000021308 | -1.12 | 0.032 | IRS1 | insulin receptor substrate 1 |
| Upregulated: | ||||
| ENSBTAG00000002362 | 1.69 | 0.0009 | APOLD1 | Apolipoprotein L domain containing 1 |
| ENSBTAG00000032369 | 1.45 | 0.03 | NMI | N-myc and STAT interactor |
| ENSBTAG00000009656 | 2.67 | 0.002 | BOLA-DQA2 | Major histocompatibility complex, class II, DQ alpha 2 |
| ENSBTAG00000012451 | 1.36 | 0.041 | BOLA-DMB | Major histocompatibility complex, class II, DM beta |
Table 7.
GO Enrichment of Select Compared to Standard Adipose Tissue.
| Select compared to Standard Adipose Tissue | ||||||
| GO Accession | Description | Category | Padj | Count | Up | Down |
| GO:0006629 | lipid metabolic process | Cellular | 0.042 | 956 | 4 | 0 |
| GO:0010887 | negative regulation of cholesterol storage | Cellular | 0.005 | 4 | 1 | 0 |
| GO:0046426 | negative regulation of JAK-STAT cascade | Cellular | 0.057 | 45 | 1 | 0 |
| GO:0010888 | negative regulation of lipid storage | Cellular | 0.017 | 12 | 1 | 0 |
| GO:0010891 | negative regulation of sequestering of triglyceride | Cellular | 0.007 | 5 | 1 | 0 |
Table 8.
GO Enrichment of Select Compared to Choice Adipose Tissue.
| Select compared to Choice Adipose Tissue | ||||||
| GO Accession | Description | Category | Padj | Count | Up | Down |
| GO:0060612 | adipose tissue development | Cellular | 0.031 | 28 | 0 | 1 |
| GO:0046427 | positive regulation of JAK-STAT cascade | Cellular | 0.045 | 48 | 0 | 1 |
| GO:00045723 | positive regulation of fatty acid biosynthetic process | Cellular | 0.013 | 14 | 0 | 1 |
| GO:0045923 | postive regulation of fatty acid metabolic process | Cellular | 0.026 | 26 | 0 | 1 |
| GO:0046889 | positive regulation of lipid biosynthetic process | Cellular | 0.043 | 44 | 0 | 1 |
Table 9.
GO Enrichment of Select Compared to Choice Adipose Tissue.
| Choice compared to Standard Adipose Tissue | ||||||
| GO Accession | Description | Category | Padj | Count | Up | Down |
| GO:0006633 | fatty acid biosynthetic process | Cellular | 0.000 | 104 | 5 | 1 |
| GO:0034625 | fatty acid elongation, monounsaturated fatty acid | Cellular | 0.048 | 7 | 2 | 0 |
| GO:0006631 | fatty acid metabolic process | Cellular | 0.014 | 254 | 5 | 1 |
| GO:0060612 | adipose tissue development | Cellular | 0.024 | 28 | 2 | 0 |
| GO:0045723 | positive regulation of fatty acid biosynthetic process | Cellular | 0.004 | 14 | 2 | 0 |
| GO:0045923 | postive regulation of fatty acid metabolic process | Cellular | 0.016 | 26 | 2 | 0 |
| GO:0004321 | fatty-acyl-CoA synthase activity | Cellular | 0.033 | 4 | 0 | 1 |
Table 10.
GO Enrichment of Standard Compared to Choice Muscle Tissue.
| Standard compared to Choice Muscle Tissue | ||||||
| GO Accession | Description | Category | Padj | Count | Up | Down |
| GO:0001578 | microtubule bundle formation | Cellular | 0.006 | 75 | 1 | 1 |
| GO:0046785 | microtubule polymerization | Cellular | 0.073 | 51 | 0 | 1 |
4. Conclusions
The data clearly suggests that subcutaneous and intermuscular adipose tissue have similar transcript profiles in the fat deposition period that was measured in this study. In addition, the aim of this work was to examine how transcriptome profile changes as animals stop depositing protein and deposit lipids. This data indicates that either nuclear or post-translational regulators potentially regulate muscle tissue upon reaching mature size instead of transcriptional control. The transcriptomic profile of adipose tissue shows increased lipogenic and adipogenic activity as well as inflammatory processes. Additional research is needed to investigate the potential role of inflammatory activity in relation to fat deposition and carcass quality grade metrics.
Author Contributions
Conceptualization, J.A.B. and J.M.T. methodology, J.A.B.; J. G. B.;and J.M.T..; software, J.M.T..; formal analysis, S.A.H.; J.; investigation, X.X.; resources, X.X.; data curation, X.X.; writing—original draft preparation, X.X.; writing—review and editing, X.X.; visualization, X.X.; supervision, X.X.; project administration, X.X.; funding acquisition, Y.Y. All authors have read and agreed to the published version of the manuscript.
Funding
This project was funded by The Bair Ranch Foundation and the Montana State Agricultural Experiment Station Project MONB00196.
Institutional Review Board Statement
Data collection protocols were approved by the Montana State University Agriculture Animal Care and Use Committee (Protocol No. 2015-AA17)
Data Availability Statement
The data presented in this study are available on request from the corresponding author, including the FPKM of all genes, DEG outputs, and fold changes. The data are not publicly available because the raw sequencing data format is unsuitable for GEO submission.
Conflicts of Interest
The funders had no role in the design of the study; in the collection, analyses, or interpretation of data; in the writing of the manuscript; or in the decision to publish the results.
References
- Polkinghorne, R.; Thompson, J. Meat standards and grading: A world view. Meat Sci. 2010, 86, 227–235. [Google Scholar] [CrossRef] [PubMed]
- Iida, F.; Saitou, K.; Kawamura, T.; Yamaguchi, S.; Nishimura, T. Effect of fat content on sensory characteristics of marbled beef from Japanese Black steers. Anim. Sci. J. 2014, 86, 707–715. [Google Scholar] [CrossRef]
- Schumacher, M.; DelCurto-Wyffels, H.; Thomson, J.; Boles, J. Fat Deposition and Fat Effects on Meat Quality—A Review. Animals 2022, 12, 1550. [Google Scholar] [CrossRef]
- Vierck, K.R.; Gonzalez, J.M.; Houser, T.A.; Boyle, E.A.E.; O’quinn, T.G. Marbling Texture’s Effects on Beef Palatability. Meat Muscle Biol. 2018, 2, 142–153. [Google Scholar] [CrossRef]
- Nishimura, T.; Hattori, A.; Takahashi, K. Structural changes in intramuscular connective tissue during the fattening of Japanese black cattle: effect of marbling on beef tenderization. J. Anim. Sci. 1999, 77, 93–104. [Google Scholar] [CrossRef] [PubMed]
- Engle, B.; Masters, M.; Boles, J.A.; Thomson, J. Gene Expression and Carcass Traits Are Different between Different Quality Grade Groups in Red-Faced Hereford Steers. Animals 2021, 11, 1910. [Google Scholar] [CrossRef] [PubMed]
- USDA. United States Standards for Grades of Carcass Beef. 2017. Available online: https://www.ams.usda.gov/sites/default/files/media/CarcassBeefStandard.pdf(accesed on).
- American Meat Science Association. (2016). Research guidelines for cookery, sensory evaluation, and instrumental tenderness measurements of meat. https://meatscience.
- Culler, R.D.; Parrish, F.C., Jr.; Smith, G.C.; Cross, H.R. RELATIONSHIP OF MYOFIBRIL FRAGMENTATION INDEX TO CERTAIN CHEMICAL, PHYSICAL AND SENSORY CHARACTERISTICS OF BOVINE LONGISSIMUS MUSCLE. J. Food Sci. 1978, 43, 1177–1180. [Google Scholar] [CrossRef]
- Hopkins, D. L.; Littlefield, P. J.; & Thompson, J. M. ; & Thompson, J. M. A Res. Note Factors Affect. Determ. Myofibrillar Fragm.. Meat Sci. 2000, 56, 19-22.Nürnberg, K.; Wegner, J.; & Ender, K. Factors influencing fat composition in muscle and adipose tissue of farm animals. Livest. Prod. Sci. 1998, 56, 145–156. [Google Scholar]
- Tatum, J.D.; Smith, G.C.; Carpenter, Z.L. Interrelationships Between Marbling, Subcutaneous Fat Thickness and Cooked Beef Palatability. J. Anim. Sci. 1982, 54, 777–784. [Google Scholar] [CrossRef]
- May, S.G.; Dolezal, H.G.; Gill, D.R.; Ray, F.K.; Buchanan, D.S. Effect of days fed, carcass grade traits, and subcutaneous fat removal on postmortem muscle characteristics and beef palatability. J. Anim. Sci. 1992, 70, 444–453. [Google Scholar] [CrossRef]
- Boles, J.A.; Boss, D.L.; Neary, K.I.; Davis, K.C.; Tess, M.W. Growth implants reduced tenderness of steaks from steers and heifers with different genetic potentials for growth and marbling. J. Anim. Sci. 2009, 87, 269–274. [Google Scholar] [CrossRef] [PubMed]
- Smith, G.C.; Carpenter, Z.L.; Cross, H.R.; Murphey, C.E.; Abraham, H.C.; Savell, J.W.; Davis, G.W.; Berry, B.W.; Parrish, F.C. RELATIONSHIP OF USDA MARBLING GROUPS TO PALATABILITY OF COOKED BEEF. J. Food Qual. 1985, 7, 289–308. [Google Scholar] [CrossRef]
- Jeremiah, L. The influence of subcutaneous fat thickness and marbling on beef: Palatability and consumer acceptability. Food Res. Int. 1996, 29, 513–520. [Google Scholar] [CrossRef]
- Aalhus, J.L.; Janz, J.A.M.; Tong, A.K.W.; Jones, S.D.M.; Robertson, W.M. The influence of chilling rate and fat cover on beef quality. Can. J. Anim. Sci. 2001, 81, 321–330. [Google Scholar] [CrossRef]
- Kim, C.; Lee, E. Effects of quality grade on the chemical, physical and sensory characteristics of Hanwoo (Korean native cattle) beef. Meat Sci. 2002, 63, 397–405. [Google Scholar] [CrossRef]
- Olson, D. G.; & Parrish Jr, F. C. ; & Parrish Jr, F. C. Relatsh. Myofibril Fragm. Index Meas. Beefsteak Tenderness. J. Food Sci. 1977, 42, 506–509. [Google Scholar] [CrossRef]
- Ilian, M.A.; Bekhit, A.E.-D.; Bickerstaffe, R. The relationship between meat tenderization, myofibril fragmentation and autolysis of calpain 3 during post-mortem aging. Meat Sci. 2004, 66, 387–397. [Google Scholar] [CrossRef]
- Olson, D. G.; Parrish, Jr., F. C. & Stromer, M. H. Myofibril fragmentation and shear resistance of three bovine muscles during postmortem storage. J. Food Sci. 1976, 41, 1036–1041. [Google Scholar] [CrossRef]
- Bratcher, C. L.; Johnson, D. D.; Littell, R. C.; & Gwartney, B. L. ; & Gwartney, B. L. The effects of quality grade, aging, and location within muscle on Warner–Bratzler shear force in beef muscles of locomotion. Meat Sci. 2005, 70, 279–284. [Google Scholar] [CrossRef]
- Chen, D.; Xie, R.; Shu, B.; Landay, A.L.; Wei, C.; Reiser, J.; Spagnoli, A.; Torquati, A.; Forsyth, C.B.; Keshavarzian, A.; et al. Wnt signaling in bone, kidney, intestine, and adipose tissue and interorgan interaction in aging. Ann. New York Acad. Sci. 2018, 1442, 48–60. [Google Scholar] [CrossRef]
- Paz-Filho, G.; Mastronardi, C.; Wong, M.-L.; Licinio, J. Leptin therapy, insulin sensitivity, and glucose homeostasis. Indian J. Endocrinol. Metab. 2012, 16, 549–S555. [Google Scholar] [CrossRef] [PubMed]
- Buettner, C.; Muse, E.D.; Cheng, A.; Chen, L.; Scherer, T.; Pocai, A.; Su, K.; Cheng, B.; Li, X.; Harvey-White, J.; et al. Leptin controls adipose tissue lipogenesis via central, STAT3–independent mechanisms. Nat. Med. 2008, 14, 667–675. [Google Scholar] [CrossRef] [PubMed]
- German, J.P.; Wisse, B.E.; Thaler, J.P.; Oh-I, S.; Sarruf, D.A.; Ogimoto, K.; Kaiyala, K.J.; Fischer, J.D.; Matsen, M.E.; Taborsky, G.J.; et al. Leptin Deficiency Causes Insulin Resistance Induced by Uncontrolled Diabetes. Diabetes 2010, 59, 1626–1634. [Google Scholar] [CrossRef] [PubMed]
Figure 1.
Pearson correlations between individual muscle and adipose samples showing high correlations between samples of the same tissue and low correlation between samples of different tissues (muscle samples have a MUS appended to the animal number and Adipose samples have ADP appended to the animal number).
Figure 1.
Pearson correlations between individual muscle and adipose samples showing high correlations between samples of the same tissue and low correlation between samples of different tissues (muscle samples have a MUS appended to the animal number and Adipose samples have ADP appended to the animal number).
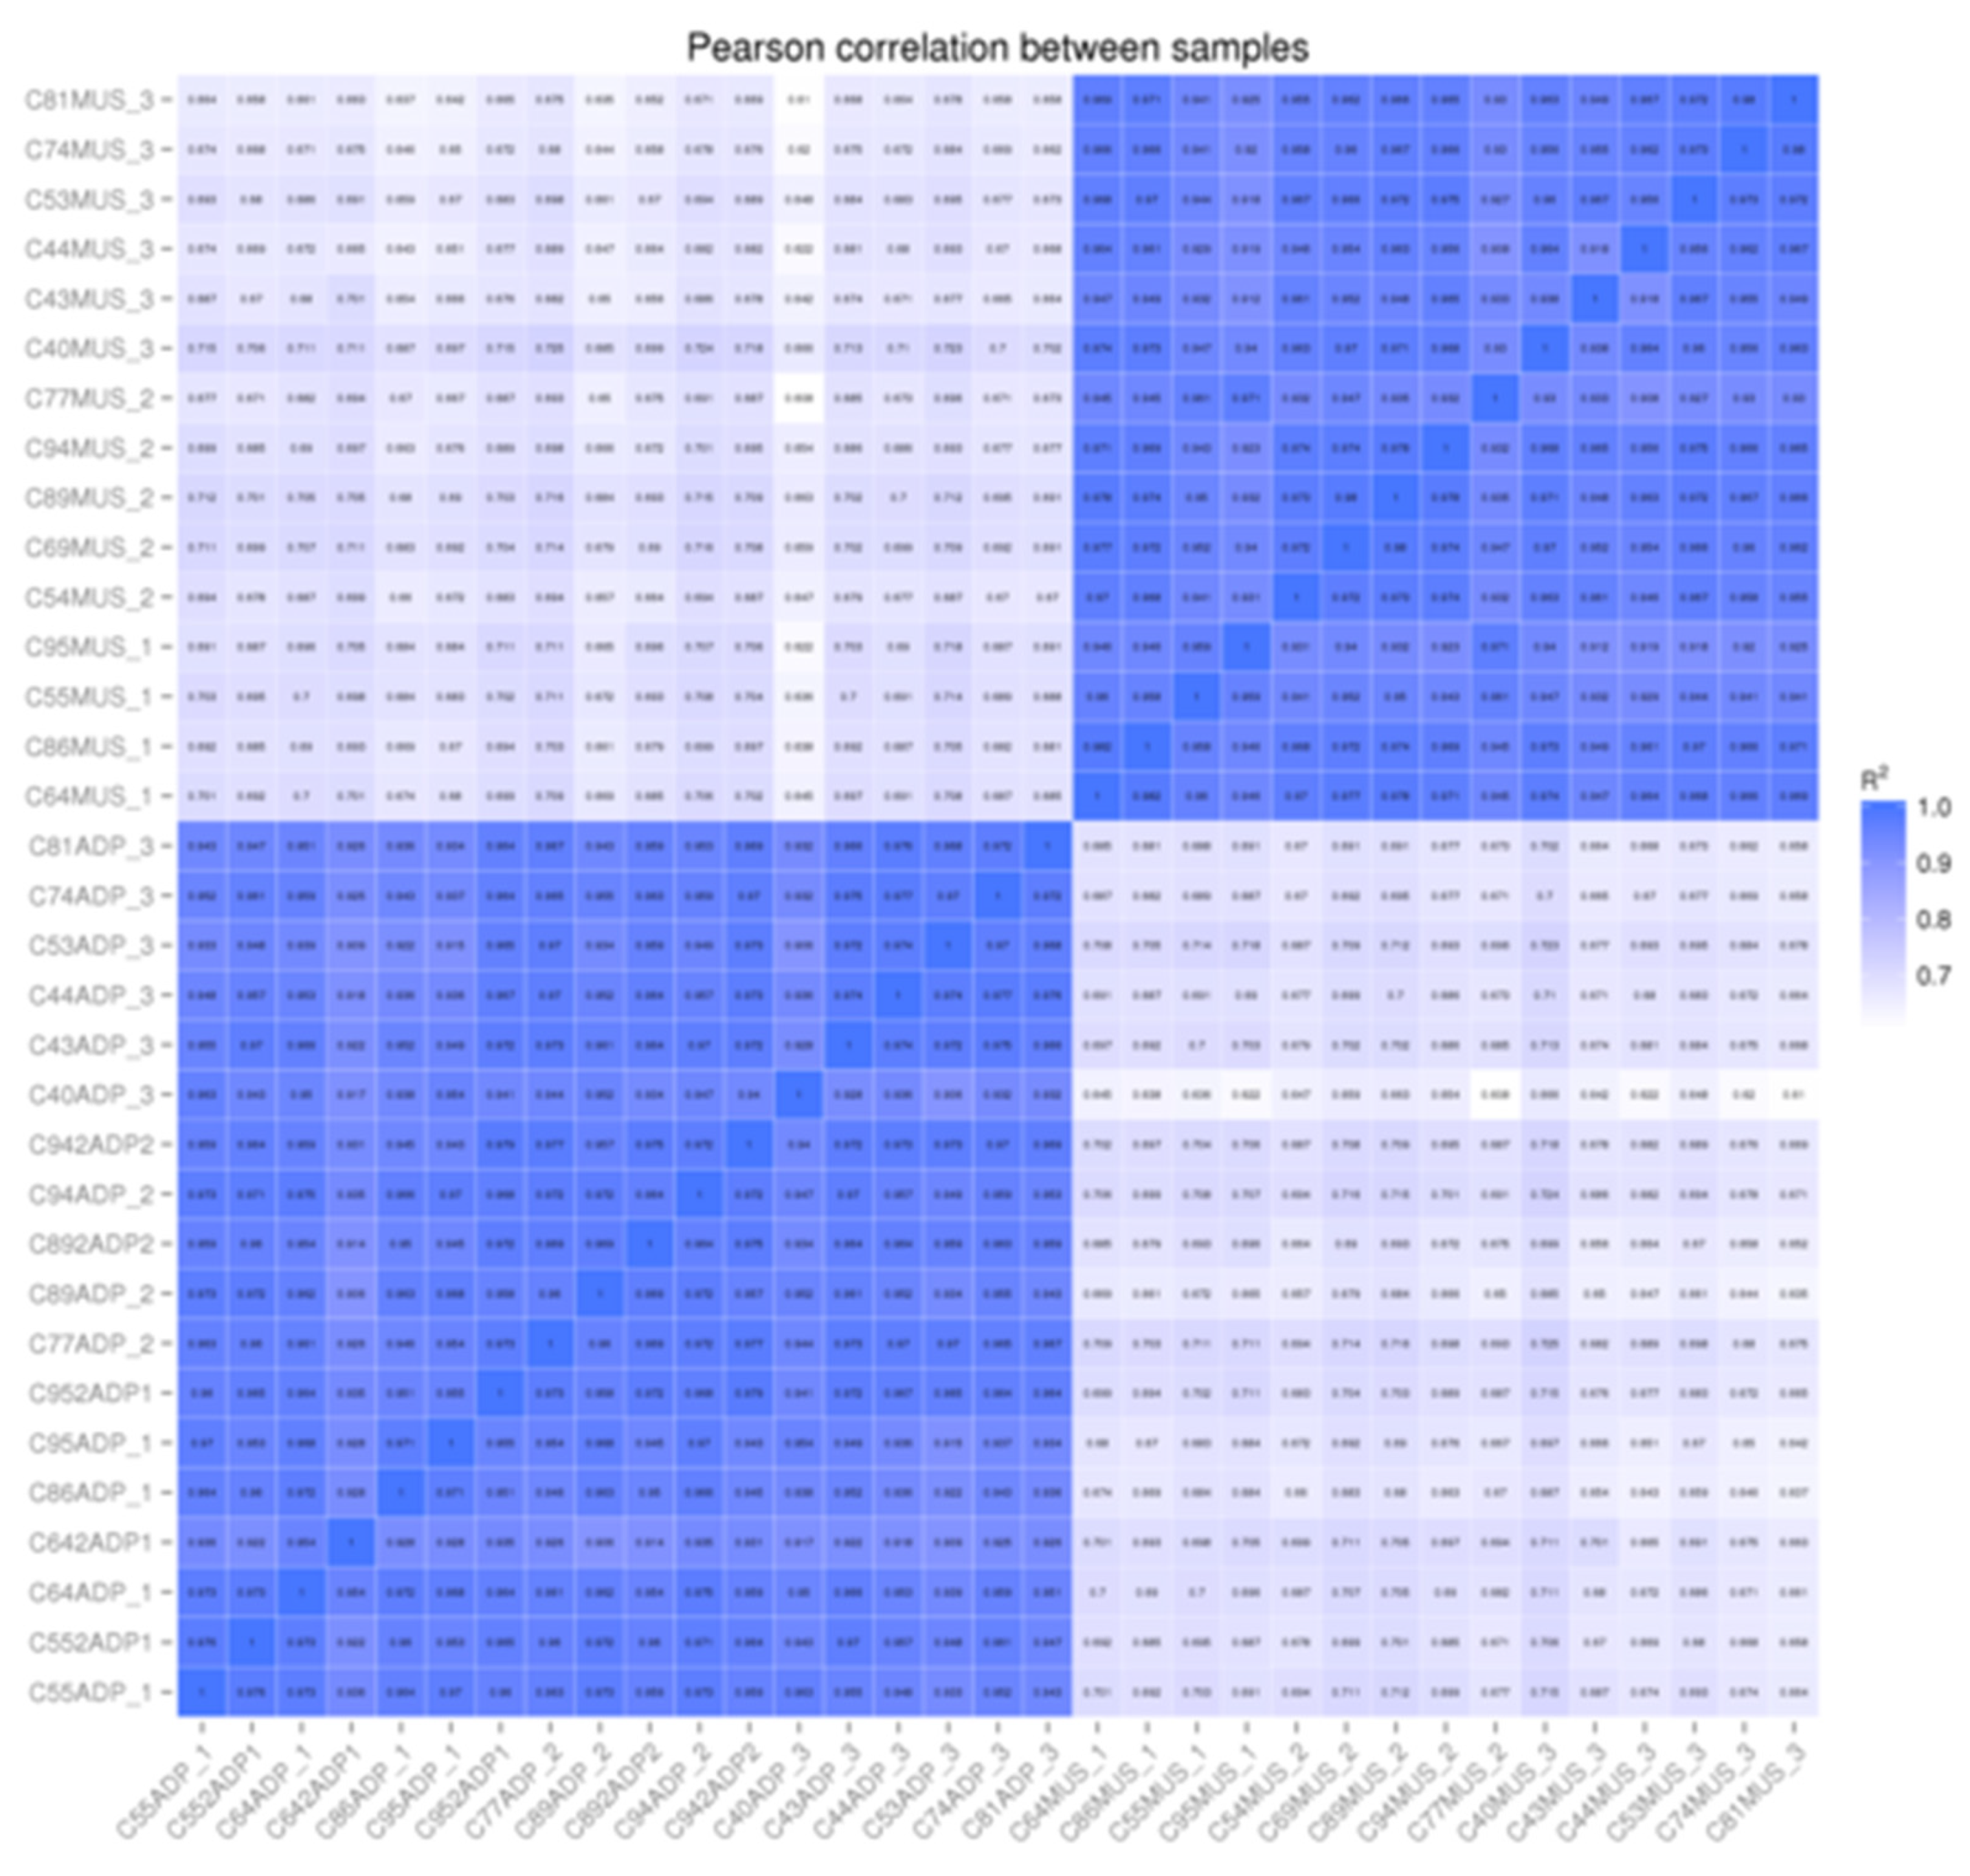
Figure 2.
Network Diagram of differentially expressed genes compared to adipose tissue from Choice to Standard Quality Grade samples. Items highlighted in red show elements higher in Choice than in Standard adipose samples.
Figure 2.
Network Diagram of differentially expressed genes compared to adipose tissue from Choice to Standard Quality Grade samples. Items highlighted in red show elements higher in Choice than in Standard adipose samples.
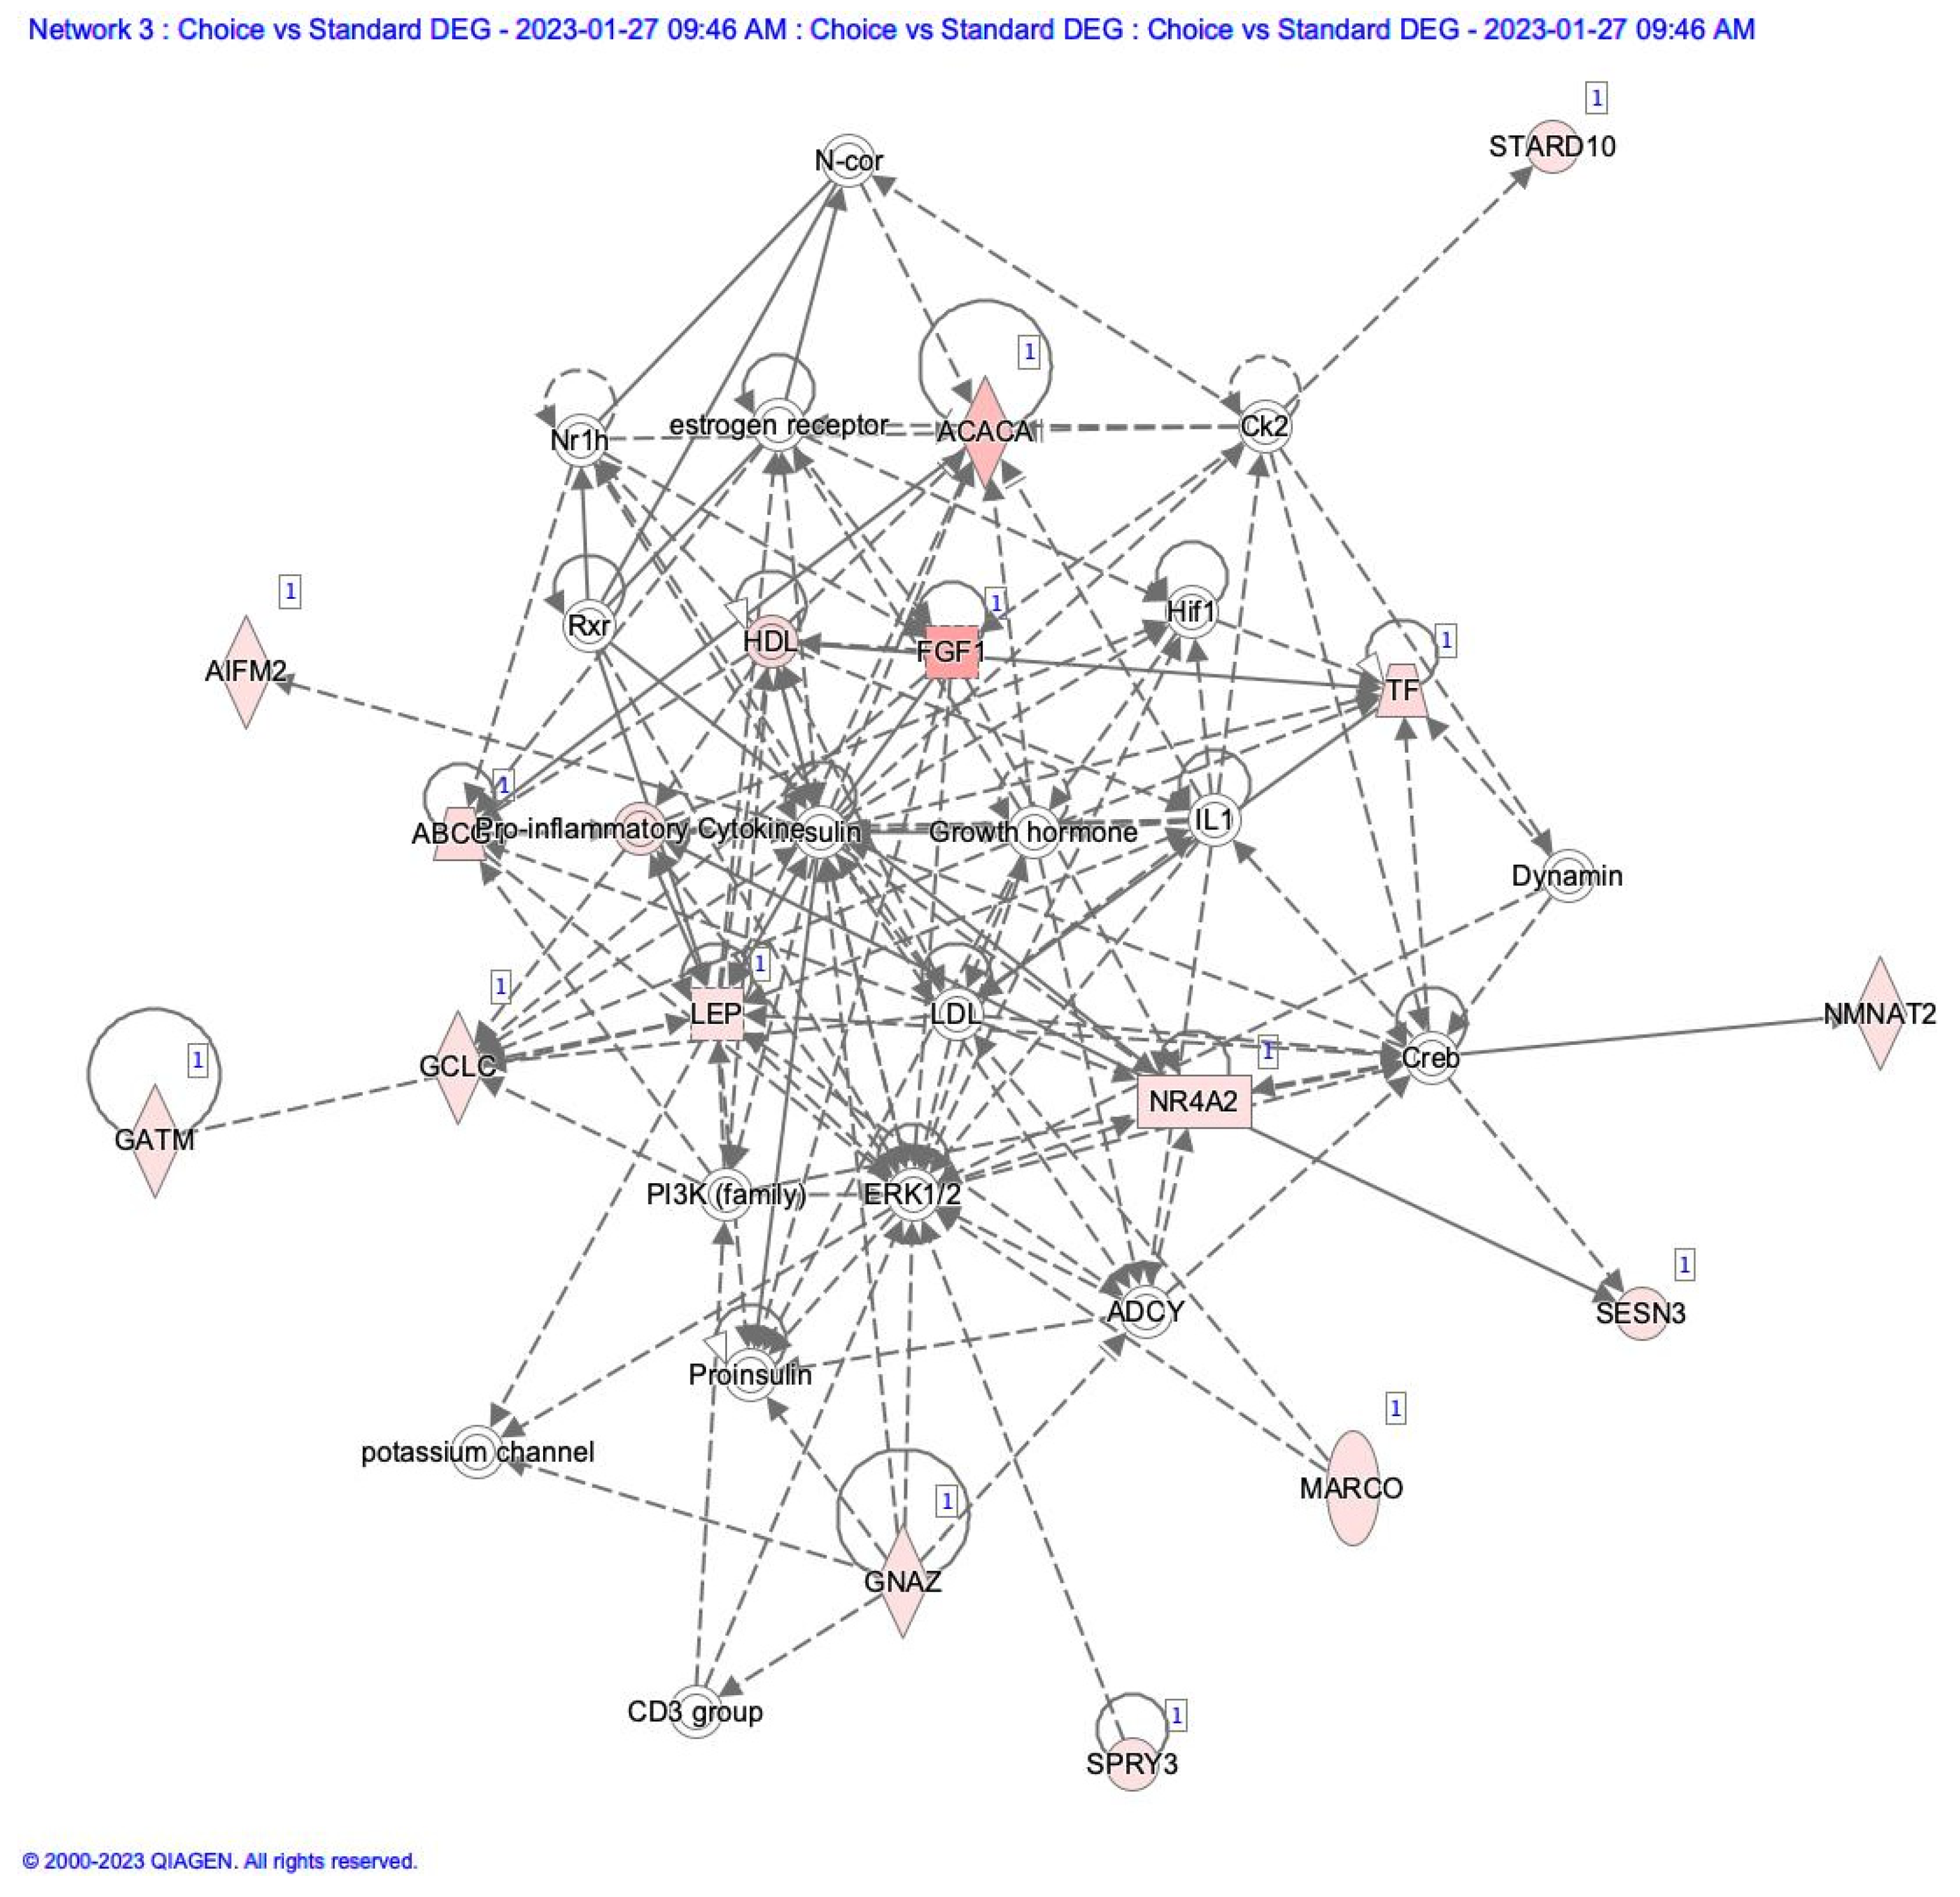
Table 1.
Diet Composition of Feedlot Diet fed to Beef Steers.
| Item, % (DM Basis) | Diet Composition 1 |
| Beef Finishing Pellet | 6.3 |
| Corn Dry Grain | 75.18 |
| Grass Hay | 18.52 |
| Nutrient Composition 2 | |
| DM, % | 86 |
| CP, % | 11.7 |
| TDN, % | 83.72 |
| NDF, % | 19.29 |
| Ca, % | 0.68 |
| P, % | 0.32 |
| S, % | 0.18 |
| K, % | 0.97 |
| NEm, Mcal/kg | 1.75 |
| NEg, Mcal/kg | 1.18 |
1 Diet consists of corn grain, grass hay, and Beef Finisher Pellet 40-20 R400 (CHS Nutrition, Great Falls MT. 2 Values based on proximate analysis of the individual ingredients.
Table 2.
Carcass characteristics of steaks from carcasses classified as Choice, Select, and Standard.
Table 2.
Carcass characteristics of steaks from carcasses classified as Choice, Select, and Standard.
| Choice | Select | Standard | |
| (n = 6) | (n = 5) | (n = 4) | |
| ADG (kg) | 1.85 | 1.81 | 1.52 |
| Carcass Wt. (kg) | 339.3 a | 275.7 b | 243.1 b |
| Fat Thickness (cm) | 1.4 a | 1.0 a | 0.5b |
| Ribeye area (cm2) | 70.9 | 64 | 66.9 |
| Marbling score y | 510a | 382 b | 285 c |
a,b,c Means within a row with differing superscripts are significantly different (P≤ 0.05). y Marbling scores: 200 = traces, 300 = slight, 400 = small, 500 = modest, 600= moderate.
Table 4.
Gene expression reads, quality of reads, G and C content in reads.
| Adipose Tissue | ||||||
| Raw | Clean | Error (%) | Q20(%) | Q30(%) | GC Content (%) | |
| Standard | 52,994,544 | 51,102,307 | 0.036 | 96.59 | 91.53 | 54.05 |
| Select | 52,655,296 | 52,008,329 | 0.012 | 96.61 | 91.50 | 54.26 |
| Choice | 68,918,968 | 66,800,801 | 0.031 | 97.10 | 92.70 | 54.63 |
| Muscle Tissue | ||||||
| Raw | Clean | Error (%) | Q20(%) | Q30(%) | GC Content (%) | |
| Standard | 51,324,601 | 49,558,730 | 0.034 | 96.19 | 90.55 | 52.86 |
| Select | 57,170,688 | 55,292,644 | 0.033 | 96.46 | 91.12 | 54.16 |
| Choice | 48,957,502 | 46,709,699 | 0.046 | 96.62 | 91.41 | 54.79 |
Raw Reads: the original sequencing reads counts. Clean Reads: number of reads after filtering. Clean Bases: clean reads number multiply read length, saved in G unit. Q20: percentages of bases whose correct base recognition rates are greater than 99% in total bases. Q30: percentages of bases whose correct base recognition rates are greater than 99.9% in total bases. GC content: percentages of G and C in total base.
Disclaimer/Publisher’s Note: The statements, opinions and data contained in all publications are solely those of the individual author(s) and contributor(s) and not of MDPI and/or the editor(s). MDPI and/or the editor(s) disclaim responsibility for any injury to people or property resulting from any ideas, methods, instructions or products referred to in the content. |
© 2023 by the authors. Licensee MDPI, Basel, Switzerland. This article is an open access article distributed under the terms and conditions of the Creative Commons Attribution (CC BY) license (http://creativecommons.org/licenses/by/4.0/).
Copyright: This open access article is published under a Creative Commons CC BY 4.0 license, which permit the free download, distribution, and reuse, provided that the author and preprint are cited in any reuse.


