Submitted:
17 August 2024
Posted:
19 August 2024
You are already at the latest version
Abstract
The aim of this study was to investigate the differentially expressed genes associated with intramuscular fat deposition in the longissimus dorsi muscle of Xinjiang Brown Bulls. The longissimus dorsi muscles of 42 Xinjiang Brown Bulls were selected under the same feeding conditions. The intramuscular fat content of muscle samples were determined by Soxhlet extraction method, from which 5 samples with high intramuscular fat content (HIMF group) and 5 samples with low intramuscular fat content (LIMF group) were selected. It was found that the intramuscular fat content of HIMF group was 46.054% higher than that of LIMF group. Muscle samples produced by paraffin section for morphological observation. It was found that the fat richness of the HIMF group was better than that of the LIMF group. Transcriptome sequencing technology was used to analyze the gene expression differences of longissimus dorsi muscle. Through in-depth analysis of the longissimus dorsi muscle by transcriptome sequencing technology, we screened a total of 165 differentially expressed genes. The results of Gene Ontology (GO) enrichment analysis showed that the differentially expressed genes in the two groups were mainly clustered in biological pathways related to carbohydrate metabolic processes, redox processes and oxidoreductase activities. Kyoto Encyclopedia of Genes and Genomes (KEGG) enrichment analysis showed that the differentially expressed genes were significantly clustered in 15 metabolic pathways, which mainly covered fatty acid metabolism (related to lipid metabolism and glucose metabolism), pentose phosphate pathway, Peroxisome Proliferator-Activated Receptors (PPAR) signalling pathway and other important metabolic processes. The three genes that were predominantly enriched in the glycolipid metabolic pathway by analysis were SCD5, CPT1C, and FBP2, all of which directly or indirectly affect intramuscular fat deposition. In summary, the present study investigated the differences in gene expression between high and low intramuscular fat content in the longissimus dorsi muscle of Xinjiang Brown Bulls by transcriptome sequencing technology, and revealed the related signalling pathways. Therefore, we hypothesized that SCD5, CPT1C, and FBP2 were the key genes responsible for the significant differences in intramuscular fat content of the longissimus dorsi muscles in a population of Xinjiang Brown Bulls. We expect that these findings will provide fundamental support for subsequent studies exploring key genes affecting fat deposition characteristics in Xinjiang Brown Bulls.
Keywords:
longissimus dorsi muscle
; intramuscular fat
; differentially expressed gene
; transcriptome sequencing technology
; metabolic pathway
1. Introduction
Xinjiang Brown Cattle, a dairy-beef dual-purpose breed from Xinjiang, China, and which was cultivated bred independently in china. Xinjiang Brown Cattle inherited the strong adaptability of its female Kazakh Cattle (heritability 9.88%) and the better production performance (beef and dairy) of its male Swiss Brown Cattle (heritability 90.12%) [1]. At present, through nutritional regulation and other technical means, the carcass quality grade of Xinjiang Brown Cattle has generally reached the level of R grade above (Which was refer to European Union (EU) beef cattle carcass quality grade standdard) [2,3]. Previous studies have shown that Xinjiang Brown Steers (10-12 month age) the ribeye area was 106.06㎝², fat cover was 3.5%, the marbling score was grade 3 to 4 and the fat color score was grade 2 (which were refer to NY/T 676-2010 Beef Grade Specification) [3]. Therefore, Xinjiang Brown Cattle can be the main target of high-grade beef production.
Intramuscular fat (IMF) is mainly distributed in the outer and inner muscle membranes as well as the fascia of the muscle, which has an important impact on the flavor, tenderness and nutritional value of beef [4]. Yan et al.[2] reported that the IMF content of Xinjiang Brown Steer (6.96 - 7.50%) was higher than Angus Steer (6.2%). IMF deposition is mainly regulated by genes related to lipid metabolism. Lipid metabolism is a complex dynamic equilibrium involving the synthesis and catabolism of adipocytes, which is enabled by the co-regulation of multiple transcription factors [5]. Studies have shown that differences in key lipid-controlling genes in the beef cattle organism are a key factor contributing to individual differences in intramuscular fat deposition capacity between breeds [6]. Therefore, exploring the main effector genes affecting IMF deposition in order to clarify the production and regulation mechanism of IMF deposition in beef cattle is an effective way to improve IMF content in beef.
With RNA-Seq (transcriptome sequencing) technology, it is possible to accurately capture and resolve the expression of all transcription products within a species under specific conditions [7]. The technology is capable of quantifying mRNA expression levels by means of high-throughput sequencing, and further combining it with bioinformatics analysis methods to study in-depth the characteristics of genes at the transcriptional level, including the amount of gene expression as well as the differences in the expression patterns among different samples. RNA-Seq technology is capable of achieving read lengths of 2×150bp, and it has the advantage of high sequencing throughput and high accuracy (>99%) for precise quantification [8].
RNA-Seq technology can be used to study the differentially expressed genes related to the characteristics of muscle fatty acid composition and intramuscular fat content [9,10]. Cesar AS et al. [10] succeeded in revealing molecular mechanisms closely related to lipid metabolism by performing tissue transcriptome (mRNA sequencing) analyses and identified differentially expressed genes present within muscle tissues in Nile beef cattle populations. Zheng et al. [6] sequenced the transcriptome of longissimus dorsi muscle tissue samples from Angus and Chinese Simmental cattle and identified 17 genes that are closely related to muscle and fat metabolism. However, it is still unclear as to which genes regulate intramuscular fat deposition differences among individuals of Xinjiang Brown Cattle. Therefore, we hypothesized that certain genes affect intramuscular fat deposition in Xinjiang Brown Cattle. We used transcriptome sequencing to analyze the differentially expressed genes in the longissimus dorsi muscle of Xinjiang Brown Cattle, and explored the genes and pathways closely related to intramuscular fat deposition in conjunction with existing studies to gain insight into the key genes that regulate intramuscular fat deposition.
2. Materials and Methods
2.1. Animals
In this experiment, 10 healthy 26-month-old Xinjiang Brown Bulls (653.21±67.27) with the same genetic background and kept under the same feeding conditions were randomly selected at the Xinjiang Yili New Brown Breeding Farm. The diets are formulated according to the NRC (National Research Council) Nutrient Requirements for Beef Cattle and include whole plant silage corn, corn stover, alfalfa, wheat straw, corn kernels, cottonseed meal, soybean meal and bran. This study was approved by the Animal Ethics Committee of Xinjiang Agricultural University.
2.2. Sample Collection
All Xinjiang Brown Bulls were humanely slaughtered at the Shengyuan Cattle and Sheep Designated Slaughterhouse in Changji, Xinjiang. Longissimus dorsi muscle samples were collected immediately, and cut into small pieces using surgical scissors carefully, and then quickly placed the samples into freezing tubes and put them into liquid nitrogen for cryopreservation. We determined the intramuscular fat (IMF) content of the longissimus dorsi muscle of 10 Xinjiang Brown Bulls using the Soxhlet extraction method, and subsequently ranked the samples according to the measured content from highest to lowest. On this basis, the top five samples with the highest IMF content were selected as the HIMF group, while the remaining samples were categorized as the LMIF group. At the same time, we divided the muscle samples in both the HIMF and LIMF groups into two parts. One part of sample (20-50 g) was immersed in 4% formalin to make paraffin sections for morphological observation, and the other (2-4 g) was frozen in liquid nitrogen for transcriptome sequencing technology to analyze the gene expression differences of the longissimus dorsi muscle between the two groups.
2.3. Determination of IMF Content
IMF content was determined by Soxhlet extraction. 3 grams sample of the longissimus dorsi muscle was stirred into a dried paper packet and weighed. After continuous drying in an oven at 65 ℃ for 15 hours or more, the paper packs were then placed in a desiccator to cool for 10 minutes and subsequently weighed. Subsequently, the paper packets were transferred to a Soxhlet extractor and soaked in ether overnight. Afterwards, they were refluxed in a water bath heated to 75 ℃ for 10 hours and then placed in a well-ventilated area to allow the ether to evaporate naturally. Finally, the samples were dried in an oven at 105 ℃ until their weight no longer changed, i.e., a constant weight state was reached, and subsequently weighed, from which the IMF content was calculated.
2.4. Histology
Five samples of the longissimus dorsi muscle were selected from the HIMF and LIMF groups, respectively, and subsequently cut along the natural texture of the muscle fibres into muscle tissue blocks, each measuring 1 cm × 1 cm × 0.5 cm. The tissues were immersed in 4% paraformaldehyde fixative (Wuhan Carnoss Technology Co., LTD, Wuhan, China) for a period of 24 hours to complete the tissue fixation process. They were then placed in a series of alcohol (Xinjiang Aidil Biotechnology Co., Ltd, Xinjiang, China) solutions at increasingly concentrated levels to progressively remove water from the tissue samples. Finally, the tissue samples were transferred to xylene (Heng Xing Reagent, Tianjing, China) for hyalinization. The samples were immersed in a paraffin (Shanghai Yi Yang Instrument Co. Shanghai, China) solution for the purpose of embedding, after which they were left to cool and solidify naturally. Subsequently, they were sectioned. The cut paraffin sections were placed on slides and deparaffinised using xylene (Heng Xing Reagent, Tianjing, China). Next, the samples were stained with hematoxylin (Zhuhai Beso Biotech Co., Ltd, Zhuhai, China) and slightly washed with running water. They were then differentiated with 0.1% hydrochloric acid (concentrated hydrochloric acid:anhydrous ethanol=1:1) in ethanol and washed with water. Subsequently, the sections were subjected to staining with eosin (Zhuhai Beso Biotech Co., Ltd, Zhuhai, China), followed by a washing and dehydration step involving alcohol. Ultimately, the slices were treated with xylene transparency and sealed with resin (Shanghai Yi Yang Instrument Co., Shanghai, China), thus completing the preparation process. The tissue sections were then were then examined in morphological detail by FEI Quanta 250 Field Emission Environmental Scanning Electron Microscope.
2.5. Total RNA Extraction, Library Construction and Sequencing
The muscle samples were carefully ground into powder form, from which total RNA was extracted using TRIzol reagent (Beijing Adderall Biotechnology Co., Ltd, Beijing, China). mRNA molecules with polyA tails were specifically enriched using Oligo(dT) magnetic bead technology. The integrity of mRNA was accurately examined using an Agilent 2100 Bioanalyzer.
A library was constructed using 5 μg of RNA, and the first strand of cDNA was synthesized using fragmented mRNA as a template and random oligonucleotides (Guangzhou Reebok Biotechnology Co., Guangzhou, China) as primers in the M-MuLV reverse transcriptase system. The RNA strand is degraded using RNaseH (Shanghai Lianmai Biological Engineering Co., Shanghai,China) and the second strand of cDNA is subsequently synthesized using dNTPs in a DNA polymerase I system. The purified double-stranded cDNA undergoes end repair, addition of an A-tail and ligation of sequencing junctions. Afterwards, PCR amplification is performed and the PCR products are purified again using AMPure XP beads (Beckman Coulter, Brea, CA) to produce the final library.
The libraries were initially quantified using a Qubit 2.0 Fluorometer and subsequently diluted to a concentration of 1.5 ng/ul. Next, the insert size of the libraries was examined using an Agilent 2100 bioanalyzer. After confirming that the insert sizes were as expected, the libraries were pooled according to the effective concentration of each library and the target sequencing data volume for Illumina sequencing. In the flow cell for sequencing, we add four kinds of fluorescent labeled dNTP, DNA polymerase and junction primers for amplification. The sequencer captures these fluorescent signals and converts them into sequencing peaks through the computer software to obtain the sequence information of the DNA fragments to be sequenced.
2.6. Real-Time Quantitative PCR (RT-qPCR)
RNA samples from transcriptome sequencing were taken for RT-qPCR validation with three biological replicates for each sample, and cDNA was obtained by operating according to the instructions of the Reverse Transcription Kit (Nanjing Novozymes Biotechnology Co., Ltd., Nanjing, China). Data on 10 differential genes associated with fat metabolism among individuals of Xinjiang Brown Cattle were identified using an ABI SteponePlus instrument according to the protocol outlined in the Fluorescence Quantification Kit for Genetically Modified Organisms Technology (Nanjing Novozymes Biotechnology Co., Ltd., Nanjing, China). Primer sequences were designed using Primer 5 (Table 1) and the internal reference gene was β-actin . The RT-qPCR amplification program was set to 95 ℃ for 5 min, 95 ℃ for 10 s and 60 ℃ for 30 s (40 cycles), and the results were analyzed by 2-ΔΔCT method.
2.7. Data Processing
2.7.1. Quality Control, Transcript Assembly and Splicing
Sequenced fragments are converted into reads by CASAVA base recognition of the image data measured by the high-throughput sequencer, and the files are in fastq format. Filter from raw read length to net read length. Filtering content: removal of reads with adapters (connectors), removal of reads containing N (N indicates that base information could not be determined), and removal of low-quality reads (reads where the number of bases with Qphred<=5 accounted for more than 50% of the entire read length). Q20, Q30, and GC content were calculated for the net data. The reference genome and gene annotation file (Bos_taurus.ARS-UCD1.2) were downloaded from the ensemb database, and the Clean Reads were quickly and accurately compared with the reference genome using HISAT2 software. Based on the comparison information, StringTie software was applied to assemble the new transcripts.
2.7.2. Sequence Data Mining and Analysis
Expression levels of genes were expressed as transcript fragments per kilobase per million mapped read values. Differentially expressed m RNAs were obtained from the expression level analysis of m RNAs, and transcripts were analyzed for differences using the negative binomial distribution of DESeq2 (1.20.0). P-adjust≤0.05 and |log2(Fold Change)| ≥1 were set to screen for differentially expressed genes.
2.7.3. Gene Ontology (GO) and Kyoto Encyclopedia of Genes and Genomes (KEGG) Enrichment Analysis of Differentially Expressed Genes
The differential gene sets were analyzed for GO functional enrichment and KEGG pathway enrichment using clusterProfiler software, and both GO functional enrichment and KEGG (Kanehisa et al., 2000) pathway enrichment were analyzed with P < 0.05 as the threshold for significant enrichment.
2.7.4. Statistical Analysis
The data were organized using Microsoft Office Excel (version 2016, Microsoft Corporation, USA). The data of IMF content and RT-qPCR were statistically analyzed by independent t test using SPSS (version 20.0, IBM, USA), and results were expressed as mean ± standard deviation. Gene quantification was performed using the default parameters of the feature Counts (1.5.0-p3) software. R (Version 3.5.0) was used to plot heatmaps of correlation between samples (cor function package, method = person; ggplot2), box plots of the distribution of gene expression in the samples (ggplot2 package), plots of the results of the principal component analysis (ggplot2 package), and Venn Diagrams of co-expression (Venn Diagram package). Difference multiplicity plots were plotted using Origin (version 7.5, OriginLab Corporation, USA).
3. Results
3.1. Comparison of IMF Content and Morphological Observation of the Longissimus Dorsi Muscle in Two Groups
The IMF content in the longissimus dorsi muscle of the 10 Xinjiang Brown Bulls in the experiment differed among individuals, with the overall IMF content in the HIMF group being 46.054% higher than that in the LIMF group (P = 0.002) (Table 2). Transverse sections of longissimus dorsi muscle of both groups are shown in Figure 1. Paraffin sections were made of muscle samples from the HIMF and LIMF groups, and it was clearly observed that the texture and abundance of fat in the five sliced samples from the HIMF group was superior to that of the LIMF group.
3.2. Transcriptome Sequencing Data Analysis
For the longissimus dorsi muscle samples of Xinjiang Brown Bulls, an average of 556,876,666,000 raw read lengths were obtained for each sample, and an average of 43,276,318,600 filtered read lengths were obtained after raw data filtering. All of them were below 0.03% (Q20 ≥ 97.81%, Q30 ≥ 93.85%) as checked by the sequencing error rate, indicating that the sequencing data were valid (Table 3). When analyzed against the bovine reference genome (Table 4), Clean reads maintained an overall match rate of more than 93.10% and a unique match rate of more than 90.04%. Only a small number of readers matched to multiple locations in the reference genome (≤3.41%), and the vast majority of reads matched uniquely to the reference genome.
3.3. Quantitative Analysis of Transcriptome Sequencing
According to the Venn diagram, the number of expressed genes in the HIMF group was 12625, while the number of expressed genes in the LIMF group was 11796. There were 11,486 co-expressed gene numbers in both groups (Figure 2A). Component analysis of the 10 samples showed that both groups were clustered with good inter-sample reproducibility (Fig. 2B). In terms of the distribution of gene expression in the samples, the mRNA expression levels were relatively homogeneous in the two groups of samples (Figure 2C). The correlation of gene expression levels between samples is an important indicator to test the reliability of the experiment and whether the sample selection is reasonable. The closer its correlation coefficient is to 1, the higher the similarity of expression patterns between samples. According to the inter-sample correlation heatmap, it can be seen that the R2 of the samples in this test were all greater than 0.94, indicating a high inter-sample correlation coefficient (Figure 2D).
3.4. Transcriptome Sequencing of Differentially Expressed Genes
A total of 165 differential genes were screened in the two groups of longissimus dorsi muscle samples, including 101 up-regulated genes and 64 down-regulated genes (Figure 3A). The distribution of differential genes among samples can be visualized from the volcano plot (Figure 3B). As shown by the heat map of differentially expressed gene clustering, the two groups of differentially expressed genes were well clustered (Figure 3C).
3.5. GO Enrichment Analysis
The 30 most significant terms from the GO enrichment analysis results were selected to be plotted in a scatter plot for presentation (Figure 4). Among them, most of the differentially upregulated genes were enriched in 18 terms, and most of the differentially downregulated genes were enriched in 16 terms. There are four processes that are co-enriched by both: xidation-reduction process、carbohydrate metabolic process、non-membrane-bounded organelle and oxidoreductase activity. According to Figure 4, the term involved in oxidation-reduction reaction in biological processes was the most significant (P = 0.0036), followed by the term involved in carbohydrate metabolic processes (P = 0.0305). In terms of molecular function the main focus is on the term of oxidoreductase activity, which includes the action of oxidoreductase activity on the aldehyde or oxygen group of the donor, the CH-OH group, the CH-OH group as a donor, and the NAD or NADP as an acceptor.
3.6. KEGG Pathway Analysis
The 20 KEGG pathways with the most significant KEGG enrichment results were selected to be plotted in a scatter plot for presentation (Figure 5). Most of the differentially upregulated genes were highly significantly enriched in Glucagon signaling pathway (P = 0.0072), C-type lectin receptor signaling pathway (P = 0.0083), Pyruvate metabolism (P = 0.0047) and PPAR signaling pathway (P = 0.0026), as well as significantly enriched in Tyrosine metabolism (P = 0.0280), Propanoate metabolism (P = 0.0264), and Fatty acid metabolism (P = 0.0118) signaling pathway. Most of the differentially downregulated genes were highly significantly enriched in Glycolysis/Gluconeogenesis (P<0.0001) and HIF-1 signaling pathway (P = 0.0018), as well as significantly enriched in Fatty acid degradation (P = 0.0417), Fructose and mannose metabolism (P = 0.0312), Biosynthesis of amino acids (P = 0.0222), Pentose phosphate pathway (P = 0.0205), and Carbon metabolism signaling pathways (P = 0.0129). According to Table 5, it can be seen that SCD5 among the differentially upregulated genes was enriched in 4 pathways, CPT1C was enriched in 6 pathways, and FBP2 among the differentially downregulated genes was enriched in 6 pathways. Meanwhile the three were co-enriched in the AMPK signaling pathway.
3.7. RT-qPCR Validation of RNA-Seq Results
Ten genes were screened in the transcriptome sequencing results for RT-qPCR validation, and the results showed that the transcriptome sequencing data were consistent with the data expression results of RT-qPCR (Figure 6). It proved the accuracy and reliability of the transcriptome sequencing results.
4. Discussion
Fat deposition represents the balance between fat synthesis and breakdown metabolism in an animal's body, as well as the equilibrium between energy intake and expenditure. IMF is the result of fat deposition within the muscle tissue. Studies have demonstrated that IMF in the perimysial connective tissue enhances meat tenderness by weakening the association between collagen fibers and reducing the force required to disrupt connective tissue [11]. IMF content is one of the main factors affecting the taste of beef, which is influenced by multiple factors such as genetics, nutrition, and environment [12]. In this study, we determined the IMF content of the longissimus dorsi muscle of Xinjiang Brown Bulls, we found variations in IMF content among samples. Therefore, by analyzing and comparing the transcriptome of the longissimus dorsi muscle of Xinjiang Brown Bulls, we discovered that the KEGG pathway (metabolic pathways such as PPAR signaling pathway, pyruvate metabolism, fatty acid metabolism, and fatty acid degradation), which is related to glucose-lipid metabolism, was mainly enriched with the genes SCD5, CPT1C, and FBP2. Our findings suggest that SCD5, CPT1C and FBP2 may play an important role in IMF deposition.
A variety of physiological processes within the cells of an organism involve and depend on the conduct of various redox reactions, including energy production, signaling, enzyme-catalyzed reactions, cell proliferation and differentiation, cell autophagy and apoptosis [13,14]. In this study, GO functional enrichment analysis revealed that the differentially upregulated genes were mainly focused on redox reactions and were involved in the regulation of oxidoreductase activity, suggesting that IMF deposition is dependent on various redox reactions in the organism.
PPAR signaling pathway plays an important role in early adipogenesis by regulating fatty acid production through the regulation of phosphoenolpyruvate.PPAR signaling pathway includes three isoforms, PPARα, PPARβ/δ, and PPARγ, and PPARγ signaling pathway exhibits a high expression in adipose tissue [15]. The fatty acid metabolic pathway involves the processes of fatty acid synthesis (fatty acid synthesis pathway) as well as fatty acid β-oxidation (fatty acid degradation pathway), in which fatty acid synthesis is a dynamic balance between triglyceride catabolism and re-esterification processes [16,17]. It has been shown that triglyceride re-esterification requires the release of cytoplasmic phosphoenolpyruvate carboxylase (PEPCK-C), the major glycolytic enzyme of adipose tissue [18]. In this study, KEGG-enriched pathway analysis showed that most of the differentially upregulated genes were significantly enriched in the PPAR signaling pathway, pyruvate metabolism, fatty acid metabolism, fatty acid degradation, and fructose and mannose metabolism pathways, suggesting that these pathways are involved in the regulation of fat synthesis and metabolism processes.
SCD (including SCD1 and SCD5 isoforms) is the main enzyme regulating the conversion of saturated to unsaturated fatty acids and is involved in adipocyte metabolism and fatty acid metabolism [19,20]. By comparing the functions of SCD1 and SCD5, we found that SCD5 was able to partially or fully compensate for the function of SCD1 and that the difference in this catalytic effect depended on the specific cell type [21,22]. Bovine SCD genes are mainly expressed in the mammary gland and adipose tissue, Gervais R et al. [23] discovered the SCD5 gene in the mammary gland of dairy cows and pointed out that it collaborateswith SCD1 in regulating fatty acid metabolism. In our study, SCD5 gene belongs to the differentially upregulated genes in PPAR signaling pathway and fatty acid metabolism signaling pathway, suggesting that it is one of the key genes affecting IMF content in Xinjiang Brown Bulls. Studies have shown that the SCD5 gene has the function of controlling cellular fat distribution, lipid synthesis, cell signaling, and cell growth and replication [24,25], while less research has been done on the mechanism of regulating fatty acid metabolism and fat deposition. By analyzing the correlation between IMF content and the expression of lipid metabolism-related genes in yaks, Zhang HB et al. [26] found that the external spine could promote intramuscular fat deposition and increase the tenderness of muscle tissues by increasing the expression of the SCD5 gene, thus improving the quality of the meat, but the specific regulatory mechanism was not clear. Fang QH et al. [27] knocked out the SCD5 gene using the gene targeting knockout technology and found that the deletion of SCD5 significantly reduced the relative content of erucic acid. Erucic acid was able to regulate MSC (mesenchymal stem cells) differentiation by inhibiting the transcriptional activity of PPARγ and significantly reduced the expression of genes related to adipocyte differentiation. Therefore, chronic intake of high erucic acid may affect lipid metabolism [28,29]. In summary, we hypothesize that the SCD5 gene may have a role in fat metabolism and can regulate intramuscular fat deposition.
CPT1C belongs to the CPT1 family of transmembrane integrins and is associated with the transmembrane transport of mitochondrial outer membrane peptide chains [30]. CPT1C is involved in the regulation of fatty acid oxidative catabolism (FAO), which is a major source of cellular energy. Hada T et al. [31] overexpressed three CPT1 isoforms in COS7 cells and normalized the activity values according to the expression level of CPT1, and found that CPT1C had low catalytic activity, with only 2% of the CPT1A-specific activity and 5% of the CPT1B-specific activity. However, Sierra AY et al. [32] isolated microsomal cascade FAO metabolizing enzyme activity after transfection of HEK293T and PC-12 cells using pIRES-CPT1c compared with cascade FAO metabolizing enzyme activity of cascade transfected with the empty pIRES vector, and found that there was a significant elevation of residual CPT1A activity in microsomes, while the inhibitory effect of malonyl-coenzyme A on CPT1 was significantly reduced. In ourt study, CPT1C gene belonged to differentially upregulated genes in fatty acid degradation, fatty acid metabolism, glucagon signaling pathway and PPAR signaling pathway. This suggests that CPT1C may indirectly enhance the ability of FAO by binding to malonyl coenzyme A, thus promoting the oxidative catabolism metabolism of fatty acids.
Most of the current studies on CPT1C have focused on tumors, where it is widely involved in cancer cell differentiation as a member of a family of key rate-limiting enzymes for fatty acid oxidative metabolism [33]. It was shown that overexpression of CPT1C in MCF-7 breast cancer cell lines was found to enhance the stress resistance of tumor cells to the hypoxic and glucose-free environment and to increase ATP production in tumor cells. On the contrary, if CPT1C was interfered with, it produced an inhibitory effect on the growth and proliferation of tumor cells [34,35]. In addition, CPT1C has an anti-aging effect in tumors. Chen P et al. [36] in proliferation and senescence of human embryonic lung MRC-5 fibroblasts found that CPT1C was able to reverse the senescence process of MRC-5 fibroblasts. Further lipidomic analysis showed that gain-of-function of CPT1C resulted in reduced lipid accumulation and reversal of aberrant lipid metabolic reprogramming in MRC-5 advanced cells. By oil red O staining and Nile red fluorescence detection, they found that lipid accumulation was significantly reduced when CPT1C function was absent.
As a key enzyme in glucose metabolism, the FBP2 gene is not only involved in regulating the expression of lipid metabolism-related enzyme genes, but also catalyzes the conversion of fructose 1,6-bisphosphate to fructose 6-phosphate (which is essential for the conversion of carbohydrate precursors, such as lactate, to glycogen synthesis). In addition, the FBP2 gene exhibits phosphatase activity and plays a regulatory role in gluconeogenesis [37,38]. Ectopic expression of FBP2 was found to activate the AMPK signaling pathway and inhibit the Akt-mTOR pathway, leading to inhibition of glucose metabolism [39]. Bakshi I et al. [40] suggested that elevated levels of FBP2 activity may promote inefficient cycling and increase metabolic sensitivity thereby elevating energy demand and leading to intensified substrate oxidation.Enhanced FBP2 activity promotes glycolytic fluxes in mouse extensor digitorum longus (EDL muscle). In addition, overexpression of FBP2 leads to an increase in glucose oxidation in red EDL muscle while decreasing glucose oxidation in white EDL muscle, a process that may trigger differences in insulin-stimulated glucose uptake. In this study, the FBP2 gene was among the differentially down-regulated genes. The relatively low expression level of FBP2 in the muscles of the HIMF group compared with the LIMF group may be a potential reason for the more abundant intramuscular fat content in the HIMF group. Meanwhile, FBP2 also reduces unnecessary energy consumption during gluconeogenesis and helps to achieve an optimal state of glycolytic efficiency.
It was indicated that the FBP2 gene can regulate lipid metabolism in the liver and blood by activating glucokinase to maintain hepatic metabolic homeostasis [41]. In a study by Rukkwamsuk T et al. [42], it was found that the decrease in FBP2 activity in cattle with fatty liver during 1-7 days postpartum led to a slowing down of the rate of gluconeogenesis which in turn triggered a delay in lipolysis, resulting in an impaired gluconeogenic capacity of the liver. In our study, FBP2 belonged to the differentially down-regulated genes in the longissimus dorsi muscle of Xinjiang Brown Bulls. It is hypothesized that this gene may play a role in delaying lipolysis in muscle tissue, thus promoting more abundant deposition of intramuscular fat in the LIMF group.
5. Conclusions
Overall, our study indicates that SCD5 and CPT1C genes (related to fatty acid metabolism and PPAR signaling pathway) can indirectly or directly promote intramuscular fat deposition, while the FBP2 gene (involved in glycolysis/glycogenesis and AMPK signaling pathway) can influence adipose lipid metabolism through glucose metabolism, suggesting that SCD5, CPT1C, and FBP2 are differentially expressed genes that participate in regulating lipid metabolism-related processes. Therefore, it is necessary to further investigate the potential mechanisms by which SCD5, CPT1C and FBP2 genes regulate intramuscular lipid content in the longissimus dorsi muscle of Xinjiang Brown Cattle. Despite the limitations of this study, these results provide a reference for exploring the key regulatory genes affecting the fat deposition process in cattle.
Author Contributions
Conceptualization, methodology, validation and writing-original draft preparation, Y.G. and L.Y.; Investigation and resources, L.Y. and K.Y.; Data curation, Y.W. and X.Z.; Visualization, M.Y. and Y. W.; Project administration and funding acquisition, W.S.; Conceptualization, writing—review and editing, and supervision, W.R. All authors have read and agreed to the published versi-on of the manuscript.
Funding
Supported by the earmarked fund for XJARS(XJARS-11), Studies on the metabolic basis and molecular mechanism of the efficient synthesis of mammary casein in dairy cows (2022D01D10) and Tianchi talent program (2223RSTTCYC).
Informed Consent Statement
Not applicable.
Data Availability Statement
We confirm that our experimental data are accurate, which supports the results and conclusions of this study.
Acknowledgments
This study received guidance and assistance from Wanping Ren, Liang Yang, and Wei Shao etc. of Xinjiang Agricultural University in experimental design, and paper writing. We also thank Wen Jiang, Min Yang, Kangyu Yao, and others for their assistance with software and Methodology Writing. We sincerely thank them!
Conflicts of Interest
The authors declare no conflicts of interest. The funders had no role in the design of the study; in the collection, analyses, or interpretation of data; in the writing of the manuscript; or in the decision to publish the results.
References
- Chen, Q.; Xu, L.; Zhang, M.; Zhang, T.; Yan, M.; Zhai, M.; Huang, X. Whole genome resequencing reveals the genetic contribution of Kazakh and Swiss Brown Cattle to a population of Xinjiang Brown Cattle. Gene 2022, 839, 146725. [Google Scholar] [CrossRef] [PubMed]
- Yan, X.M.; Ma, Z.; Yuan, L.X.; Fu, H.Y.; Zhang, J.S.; Zhou, J.Z.; Li, H.B. Efficacy evaluation of population breeding of Xinjiang browncattle (meat breed lines). Animal Husbandry & Veterinary Medicine 2024, 56, 1–6. (in China). [Google Scholar]
- Yan, X.M.; Zhang, J.S.; Li, H.B.; Li, N.; Du, W.; Zhou, Z.Y.; Zhang, Y. Comparative study on carcass traits and meat quality of different month old of Xinjiang Brown Cattle steers. China Animal Husbandry & Veterinary Medicine 2015, 42, 2954–2960. (in China). [Google Scholar] [CrossRef]
- Pickworth, C.L.; Loerch, S.C.; Velleman, S.G.; Pate, J.L.; Poole, D.H.; Fluharty, F.L. Adipogenic differentiation state-specific gene expression as related to bovine carcass adiposity. J Anim Sci. 2011, 89, 355–366. [Google Scholar] [CrossRef] [PubMed]
- Du, M.; Huang, Y.; Das, A.K.; Yang, Q.; Duarte, M.S.; Dodson, M.V.; Zhu, M.J. Meat Science and Muscle Biology Symposium: manipulating mesenchymal progenitor cell differentiation to optimize performance and carcass value of beef cattle. J Anim Sci. 2013, 91, 1419–1427. [Google Scholar] [CrossRef] [PubMed]
- Zheng, Y.; Chen, J.; Wang, X.; Han, L.; Yang, Y.; Wang, Q.; Yu, Q. Metagenomic and transcriptomic analyses reveal the differences and associations between the gut microbiome and muscular genes in ang-us and Chinese Simmental Cattle. Front Microbiol 2022, 13, 815915. [Google Scholar] [CrossRef]
- Liu, S.; Huang, J.; Wang, X.; Ma, Y. Transcription factors regulate adipocyte differentiation in beef cattle. Anim Genet 2020, 51, 351–357. [Google Scholar] [CrossRef] [PubMed]
- Li, Y.M.; Li, S.X.; Li, X.S.; Li, C.Y. Transcriptome studies with the third-generation sequencing technology. Life Science Instruments (in China). 2018, 16, 114–121+113. [Google Scholar]
- Berton, M.P.; Fonseca, L.F.; Gimenez, D.F.; Utembergue, B.L.; Cesar, A.S.; Coutinho, L.L.; de Lemos, M.V.; Aboujaoude, C.; Pereira, A.S.; Silva, R.M.; Stafuzza, N.B.; Feitosa, F.L.; Chiaia, H.L.; Olivieri, B.F.; Peripolli, E.; Tonussi; Stafuzza, N. B.; Feitosa, F.L.; Chiaia, H.L.; Olivieri, B.F.; Peripolli, E.; Tonussi, R.L.; Gordo, D.M.; Espigolan, R.; Ferrinho, A.M.; Mueller, L.F.;......Baldi, F. Gene expression profile of intramuscular muscle in Nellore cattle with extreme values of fatty acid. BMC Genomics 2016, 17, 972. [Google Scholar] [CrossRef]
- Cesar, A.S.; Regitano, L.C.; Koltes, J.E.; Fritz-Waters, E.R.; Lanna, D.P.; Gasparin, G.; Mourão, G.B.; Oliveira, P.S.; Reecy, J.M.; Coutinho, L.L. Putative regulatory factors associated with intramuscular fat content. PLoS One. 2015, 10, e0128350. [Google Scholar] [CrossRef]
- Essén-Gustavsson, B.; Karlsson, A.; Lundström, K.; Enfält, A.C. Intramuscular fat and muscle fibre lipid contents in halothane-gene-free pigs fed high or low protein diets and its relation to meat quality. Meat Sci. 1994, 38, 269–277. [Google Scholar] [CrossRef] [PubMed]
- Nishimura, T.; Hattori, A.; Takahashi, K. Structural changes in intramuscular connective tissue during the fattening of Japanese black cattle: effect of marbling on beef tenderization. Anim Sci. 1999, 77, 93–104. [Google Scholar] [CrossRef]
- DiMauro, S.; Schon, E.A. Mitochondrial disorders in the nervous system. Annu Rev Neurosci. 2008, 31, 91–123. [Google Scholar] [CrossRef] [PubMed]
- Keating, D.J. Mitochondrial dysfunction, oxidative stress, regulation of exocytosis and their relevance to neurodegenerative diseases. J Neurochem 2008, 104, 298–305. [Google Scholar] [CrossRef] [PubMed]
- Taniguchi, M.; Guan, L.L.; Zhang, B.; Dodson, M.V.; Okine, E.; Moore, S.S. Adipogenesis of bovine perimuscular preadipocytes. Biochem Biophys Res Commun. 2008, 366, 54–59. [Google Scholar] [CrossRef]
- Forest, C.; Tordjman, J.; Glorian, M.; Duplus, E.; Chauvet, G.; Quette, J.; Beale, E.G.; Antoine, B. Fatty acid recycling in adipocytes: a role for glyceroneogenesis and phosphoenolpyruvate carboxykinase. Biochem Soc Trans. 2003, 31, 1125–1129. [Google Scholar] [CrossRef] [PubMed]
- Chaves, V.E.; Frasson, D.; Kawashita, N.H. Several agents and pathways regulate lipolysis in adipocytes. Biochimie 2011, 93, 1631–1640. [Google Scholar] [CrossRef] [PubMed]
- Jaubert, A.M.; Penot, G.; Niang, F.; Durant, S.; Forest, C. Rapid nitration of adipocyte phosphoenolpyruvate carboxykinase by leptin reduces glyceroneogenesis and induces fatty acid release. PLoS One. 2012, 7, e40650. [Google Scholar] [CrossRef] [PubMed]
- Zhu, X.; Yan, H.; Xia, M.; Chang, X.; Xu, X.; Wang, L.; Sun, X.; Lu, Y.; Bian, H.; Li, X.; Gao, X. Metformin attenuates triglyceride accumulation in HepG2 cells through decreasing stearyl-coenzyme A desaturase 1 expression. Lipids Health Dis. 2018, 17, 114. [Google Scholar] [CrossRef]
- Salmani Izadi, M.; Naserian, A.A.; Nasiri, M.R.; Majidzadeh Heravi, R.; Valizadeh, R. Evaluation of SCD and FASN gene expression in Baluchi, Iran-Black, and Arman Sheep. Rep Biochem Mol Biol. 2016, 5, 33–39. [Google Scholar]
- Sinner, D.I.; Kim, G.J.; Henderson, G.C.; Igal, R.A. StearoylCoA desaturase-5: a novel regulator of neuronal cell proliferation and differentiation. PLoS One. 2012, 7, e39787. [Google Scholar] [CrossRef] [PubMed]
- Liu, X.; Burhans, M.S.; Flowers, M.T.; Ntambi, J.M. Hepatic oleate regulates liver stress response partially through PGC-1α during high-carbohydrate feeding. J Hepatol 2016, 65, 103–112. [Google Scholar] [CrossRef]
- Gervais, R.; McFadden, J.W.; Lengi, A.J.; Corl, B.A.; Chouinard, P.Y. Effects of intravenous infusion of trans-10, cis-12 18:2 on mammary lipid metabolism in lactating dairy cows. J Dairy Sci. 2009, 92, 5167–5177. [Google Scholar] [CrossRef] [PubMed]
- Igal, R.A.; Sinner, D.I. Stearoyl-CoA desaturase 5 (SCD5), a Δ-9 fatty acyl desaturase in search of a function. Biochim Biophys Acta Mol Cell Biol Lipids. 2021, 1866, 158840. [Google Scholar] [CrossRef]
- Ren, H.; Xiao, W.; Qin, X.; Cai, G.; Chen, H.; Hua, Z.; Cheng, C.; Li, X.; Hua, W.; Xiao, H.; Zhang, L.; Dai, J.; Zheng, X.; Zhu, Z.; Qian, C.; Yao, J.; Bi, Y. Myostatin regulates fatty acid desaturation and fat deposition through MEF2C/miR222/SCD5 cascade in pigs. Commun Biol. 2020, 3, 612. [Google Scholar] [CrossRef] [PubMed]
- Zhang, H.B.; Guan, J.Q.; Zhou, X.J.; Liao, X.P.; Guo, D.S.; Luo, X.L. Correlation Analysis of Intramuscular Fat Content and Fat Metabolism Related Gene Expression in Different Muscle Tissues of Yaks. Chinese Journal of Animal Science. 2020, 56, 73–77. (in China) [Google Scholar] [CrossRef]
- Fang, Q.H.; Bai, W.Z.; Li, Z.M.; Chen, H.B.; Bi, Z.T. Studies on the effect of pig SCD5 gene deletion on fatty acid composition. Chinese Journal of Animal Science. 2023, 59, 224–231. (in China). [Google Scholar] [CrossRef]
- Chen, X.; Shang, L.; Deng, S.; Li, P.; Chen, K.; Gao, T.; Zhang, X.; Chen, Z.; Zeng, J. Peroxisomal oxidation of erucic acid suppresses mitochondrial fatty acid oxidation by stimulating malonyl-CoA formation in the rat liver. J Biol Chem. 2020, 295, 10168–10179. [Google Scholar] [CrossRef] [PubMed]
- Takahashi, A.; Dohi, H.; Egashira, Y.; Hirai, S. Erucic acid derived from rosemary regulates differentiation of mesenchymal stem cells into osteoblasts/adipocytes via suppression of peroxisome proliferator-activated receptor γ transcriptional activity. Phytother Res. 2020, 34, 1358–1366. [Google Scholar] [CrossRef]
- Roa-Mansergas, X.; Fadó, R.; Atari, M.; Mir, J.F.; Muley, H.; Serra, D.; Casals, N. CPT1C promotes human mesenchymal stem cells survival under glucose deprivation through the modulation of autophagy. Sci Rep. 2018, 8, 6997. [Google Scholar] [CrossRef]
- Hada, T.; Yamamoto, T.; Yamamoto, A.; Ohkura, K.; Yamazaki, N.; Takiguchi, Y.; Shinohara, Y. Comparison of the catalytic activities of three isozymes of carnitine palmitoyltransferase 1 expressed in COS7 cells. Appl Biochem Biotechnol. 2014, 172, 1486–96. [Google Scholar] [CrossRef] [PubMed]
- Sierra, A.Y.; Gratacós, E.; Carrasco, P.; Clotet, J.; Ureña, J.; Serra, D.; Asins, G.; Hegardt, F.G.; Casals, N. CPT1c is localized in endoplasmic reticulum of neurons and has carnitine palmitoyltransferase activity. J Biol Chem. 2008, 283, 6878–6885. [Google Scholar] [CrossRef] [PubMed]
- Pucci, S.; Zonetti, M.J.; Fisco, T.; Polidoro, C.; Bocchinfuso, G.; Palleschi, A.; Novelli, G.; Spagnoli, L.G.; Mazzarelli, P. Carnitine palmitoyl transferase-1A (CPT1A): a new tumor specific target in human breast cancer. Oncotarget 2016, 7, 19982–19996. [Google Scholar] [CrossRef] [PubMed]
- Zaugg, K.; Yao, Y.; Reilly, P.T.; Kannan, K.; Kiarash, R.; Mason, J.; Huang, P.; Sawyer, S.K.; Fuerth, B.; Faubert, B.; Kalliomäki, T.; Elia, A.; Luo, X.; Nadeem, V.; Bungard, D.; Yalavarthi, S.; Growney, J.D.; Wakeham, A.; Moolani, Y.; Silvester, J.; Mak, T.W. Carnitine palmitoyltransferase 1C promotes cell survival and tumor growth under conditions of metabolic stress. Genes Dev. 2011, 25, 1041–1051. [Google Scholar] [CrossRef]
- Wang, R.; Cheng, Y.; Su, D.; Gong, B.; He, X.; Zhou, X.; Pang, Z.; Cheng, L.; Chen, Y.; Yao, Z. Cpt1c regulated by AMPK promotes papillary thyroid carcinomas cells survival under metabolic stress conditions. J Cancer. 2017, 8, 3675–3681. [Google Scholar] [CrossRef]
- Chen, P.; Zhang, Q.; Zhang, H.; Gao, Y.; Zhou, Y.; Chen, Y.; Guan, L.; Jiao, T.; Zhao, Y.; Huang, M.; Bi, H. Carnitine palmitoyltransferase 1C reverses cellular senescence of MRC-5 fibroblasts via regulating lipid accumulation and mitochondrial function. J Cell Physiol. 2021, 236, 958–970. [Google Scholar] [CrossRef] [PubMed]
- Wu, C.; Khan, S.A.; Peng, L.J.; Lange, A.J. Roles for fructose-2,6-bisphosphate in the control of fuel metabolism: beyond its allosteric effects on glycolytic and gluconeogenic enzymes. Adv Enzyme Regul. 2006, 46, 72–88. [Google Scholar] [CrossRef]
- Dzugaj, A. Localization and regulation of muscle fructose-1,6-bisphosphatase, the key enzyme of glyconeogenesis. Adv Enzyme Regul. 2006, 46, 51–71. [Google Scholar] [CrossRef]
- Li, H.; Wang, J.; Xu, H.; Xing, R.; Pan, Y.; Li, W.; Cui, J.; Zhang, H.; Lu, Y. Decreased fructose-1,6-bisphosphatase-2 expression promotes glycolysis and growth in gastric cancer cells. Mol Cancer. 2013, 12, 110. [Google Scholar] [CrossRef]
- Bakshi, I.; Suryana, E.; Small, L.; Quek, L.E.; Brandon, A.E.; Turner, N.; Cooney, G.J. Fructose bisphosphatase 2 overexpression increases glucose uptake in skeletal muscle. J Endocrinol. 2018, 237, 101–111. [Google Scholar] [CrossRef]
- Agius, L. Hormonal and Metabolite Regulation of Hepatic Glucokinase. Annu Rev Nutr. 2016, 36, 389–415. [Google Scholar] [CrossRef] [PubMed]
- Rukkwamsuk, T.; Wensing, T.; Geelen, M.J. Effect of fatty liver on hepatic gluconeogenesis in periparturient dairy cows. J Dairy Sci. 1999, 82, 500–505. [Google Scholar] [CrossRef] [PubMed]
Figure 1.
Morphological observation on the longissimus dorsi muscle of Xinjiang Brown Bulls. (A) Paraffin sectioning of 5 samples of intramuscular fat content in the LIMF group; (B) paraffin sections were performed on five samples of intramuscular adiposity in the HIMF group. Hematoxylin eosin staining was used, the nucleus was dyed to blue, muscle fibers were dyed to red, fat tissue was white, the adipose tissue is white. Magnification: 100×.
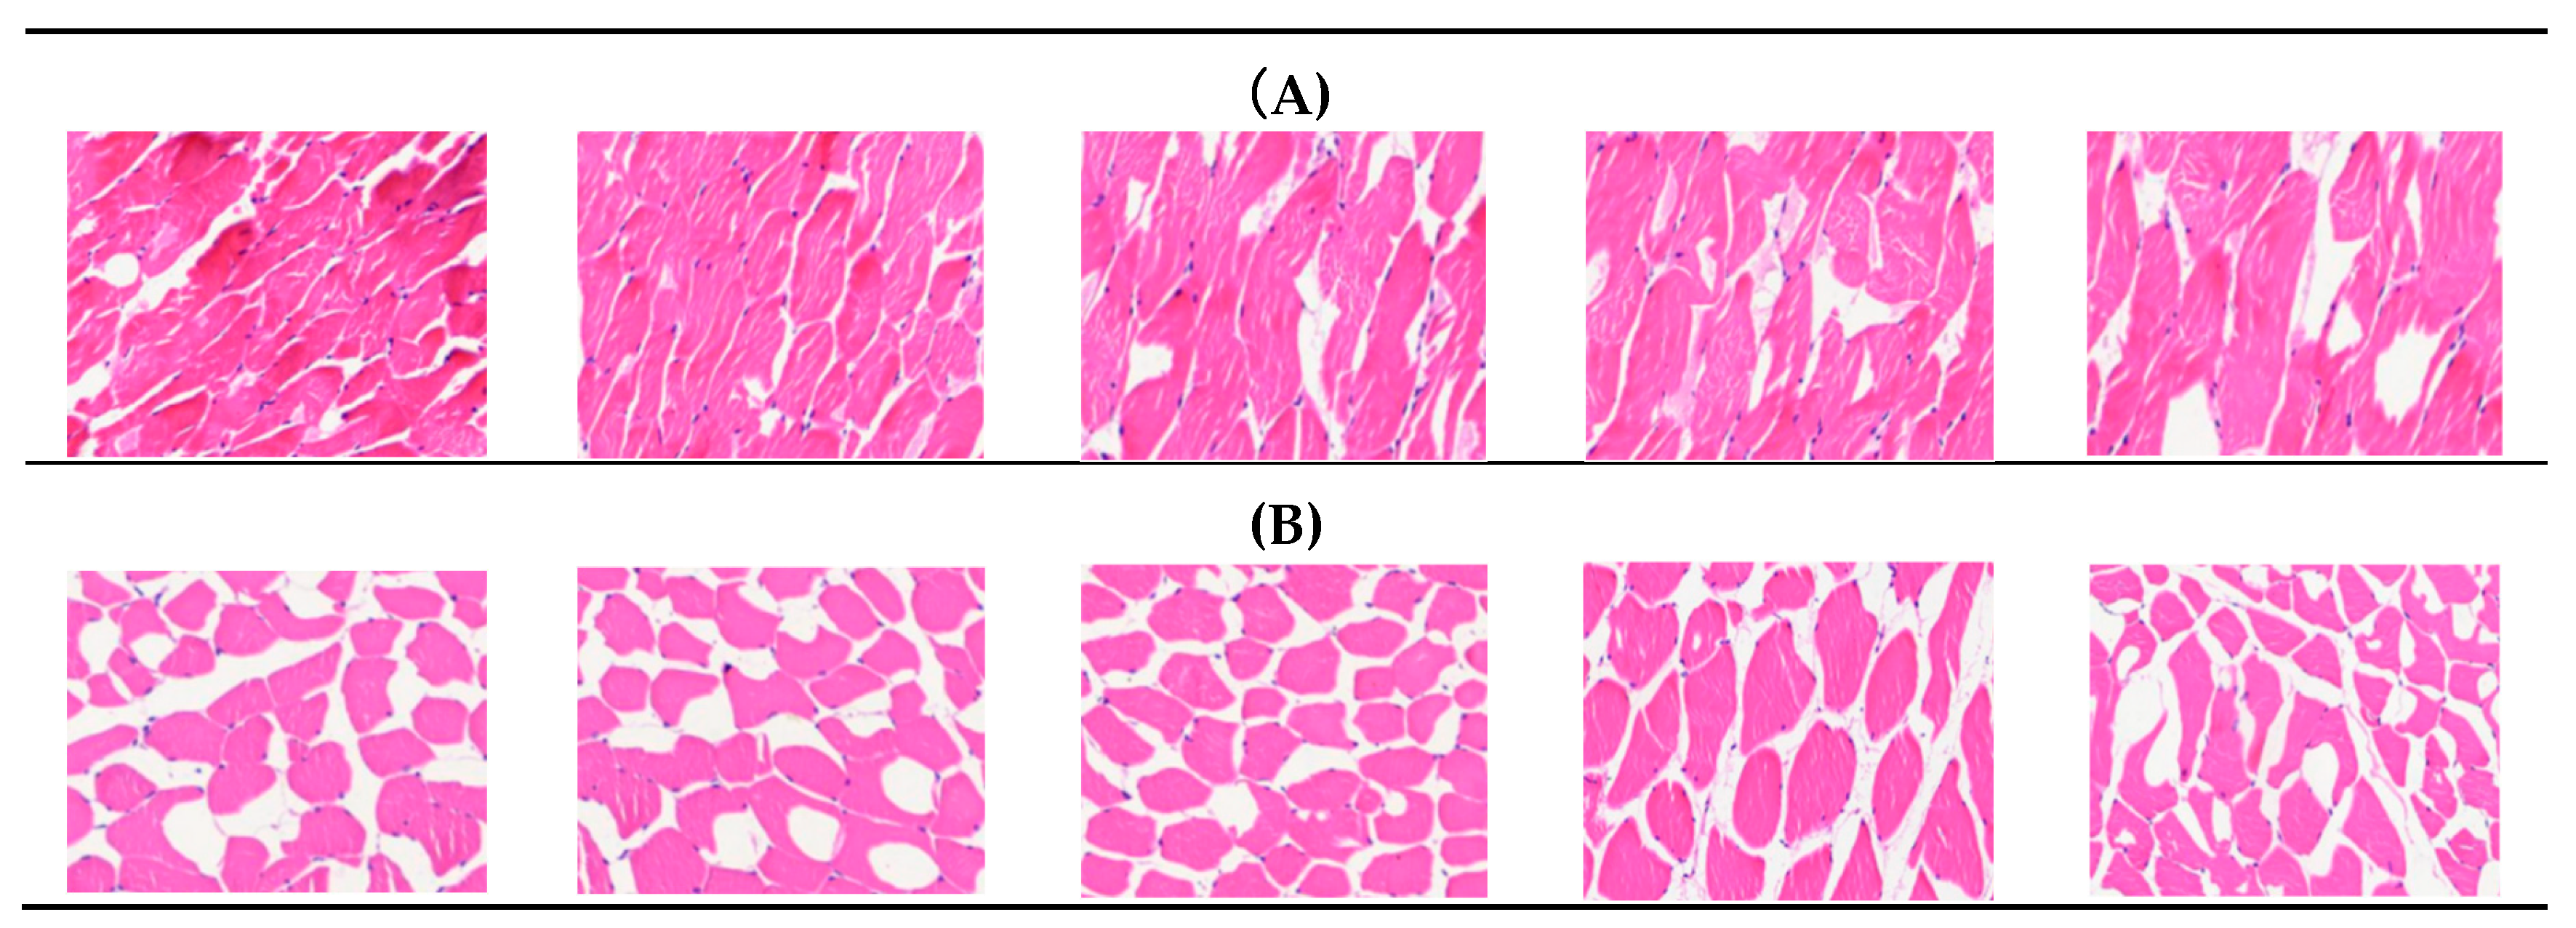
Figure 2.
Quantitative analysis. (A)Sample Co-Expression Venn Plot; (B)Plot of results of principal component analysis (coordinates first principal component, vertical second principal component); (C)Box plot of gene expression distribution of samples (horizontal coordinates were sample names, vertical coordinates were log2(FPKM+1)); (D)Heat map of inter-sample correlations (horizontal and vertical coordinates were squared correlation coefficients for each sample).
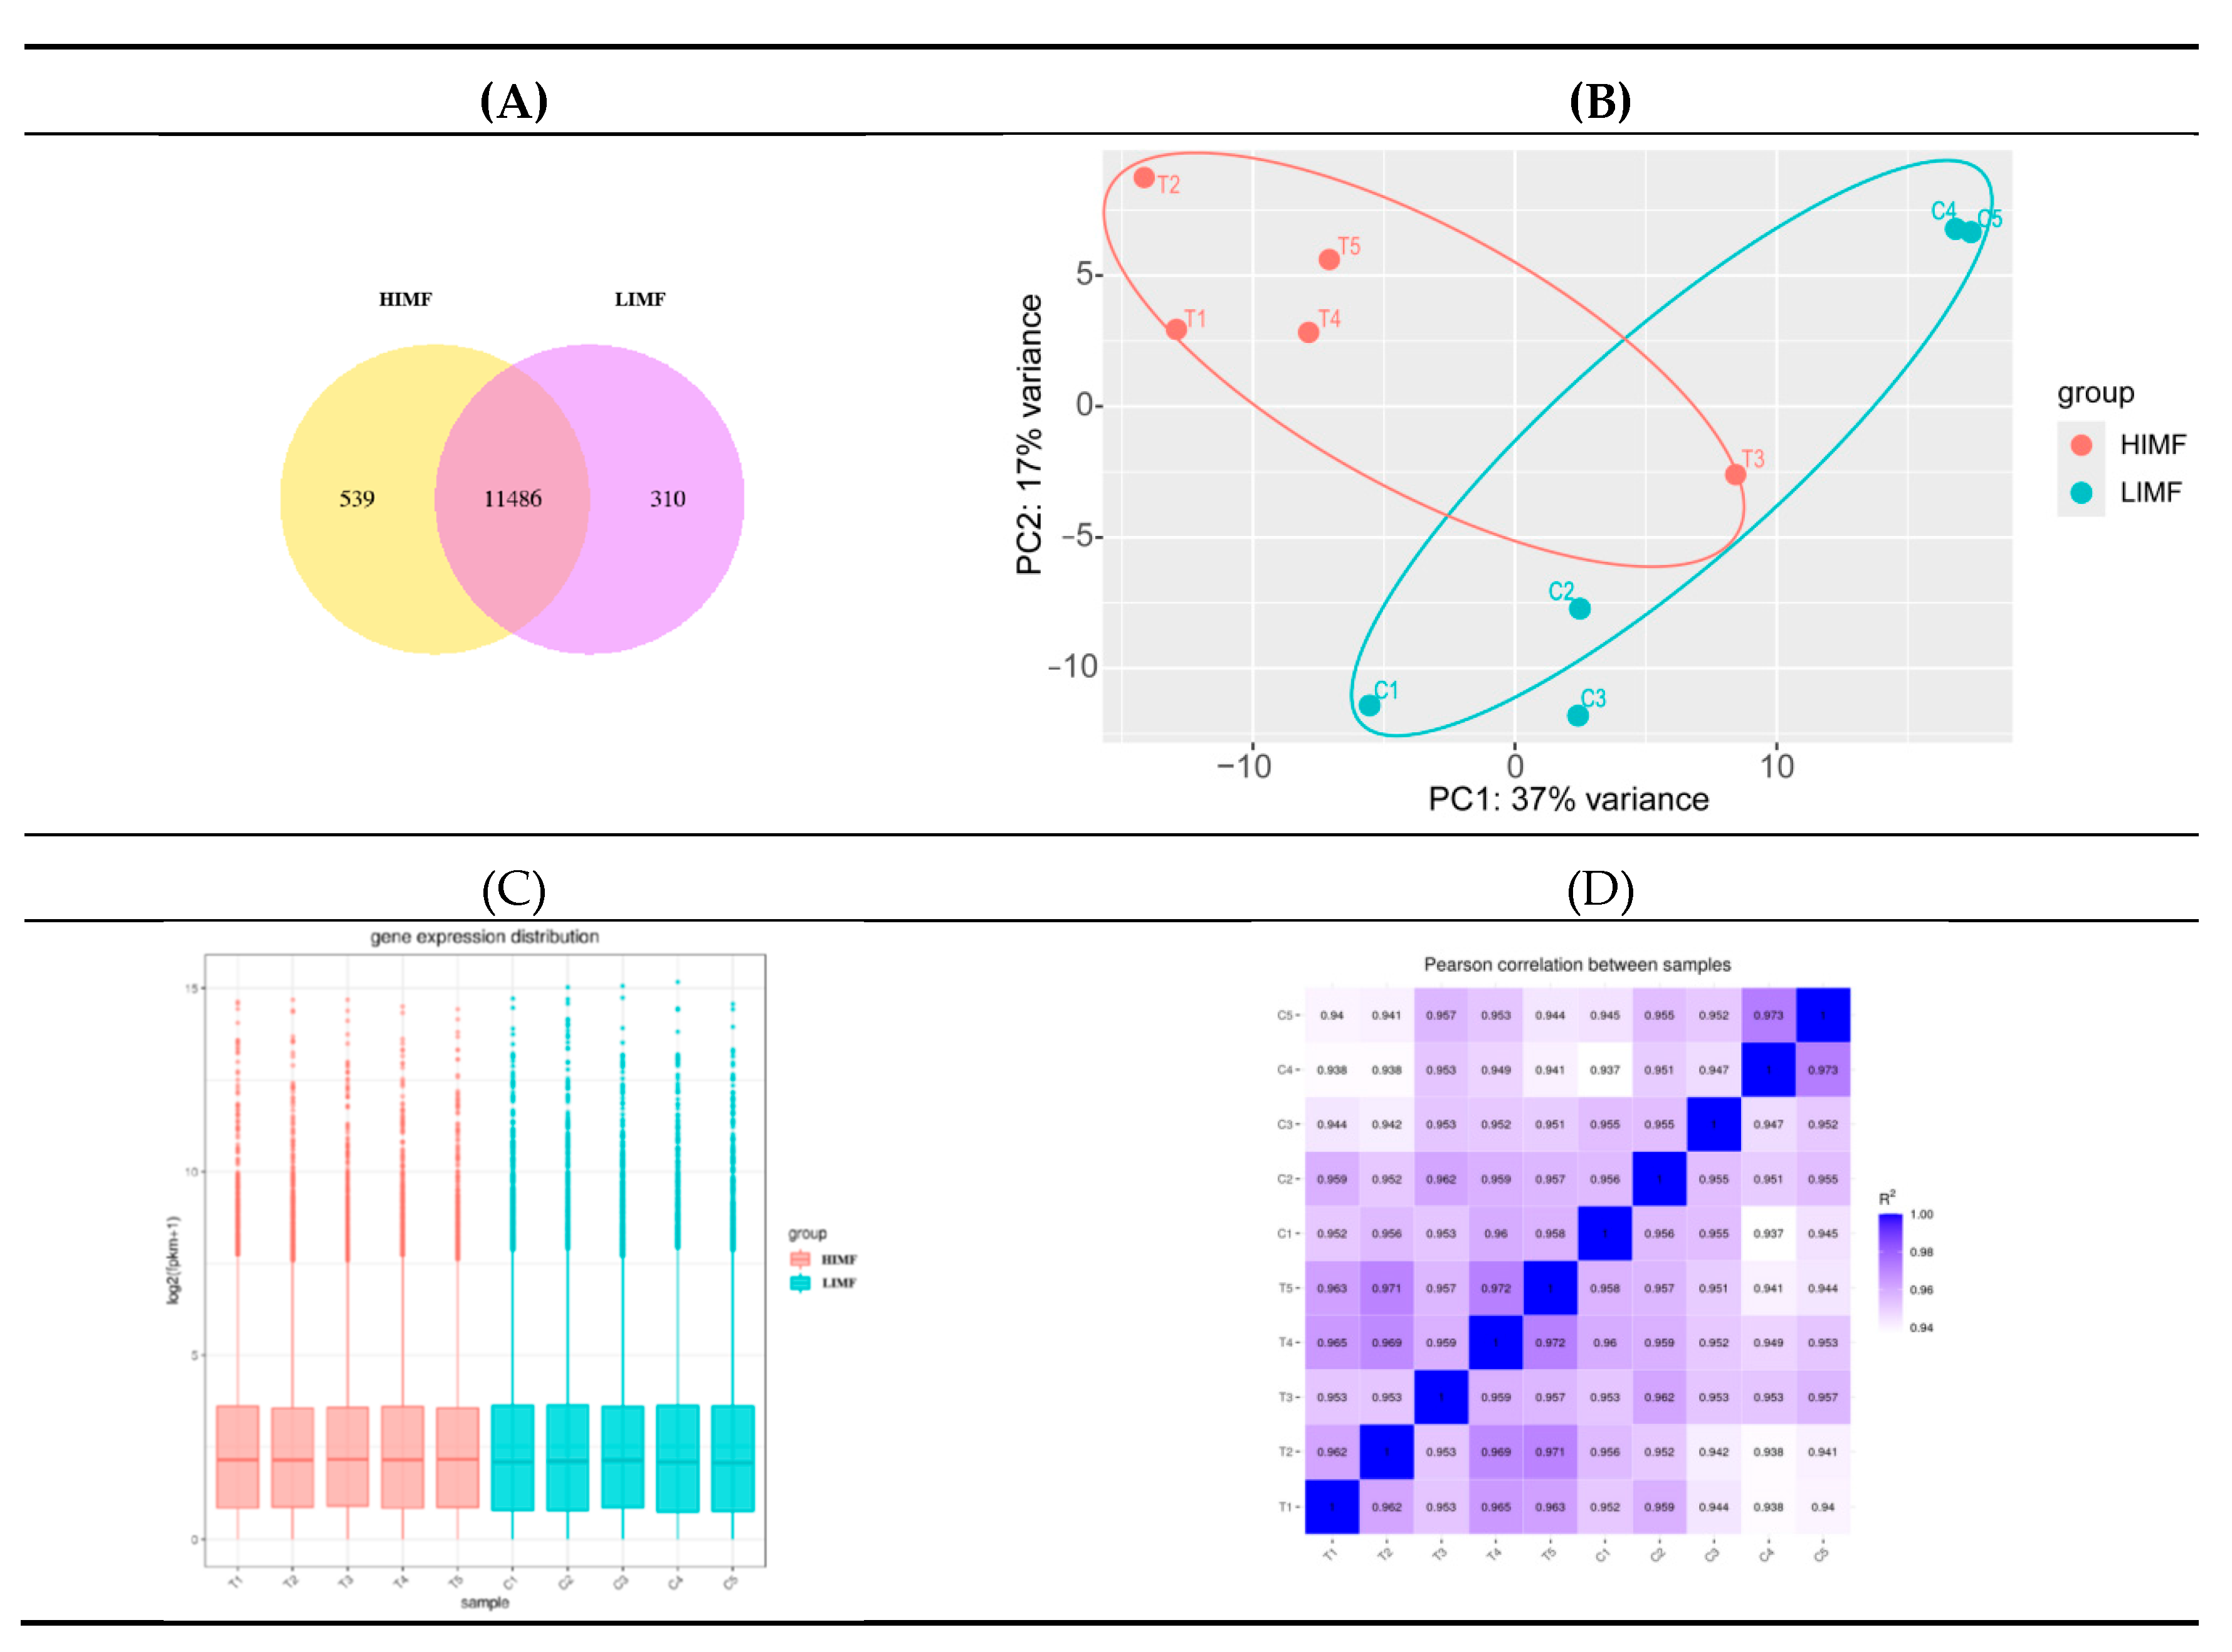
Figure 3.
Map of differentially expressed genes. (A)Histogram of the number of differential genes counted in the differential comparison combinations; (B)Differential gene volcano map (blue dashed lines indicate threshold lines for differential gene screening criteria; (C)Heatmap of clustering of differentially expressed genes (the redder the color the higher the expression, the greener the color the lower the expression).
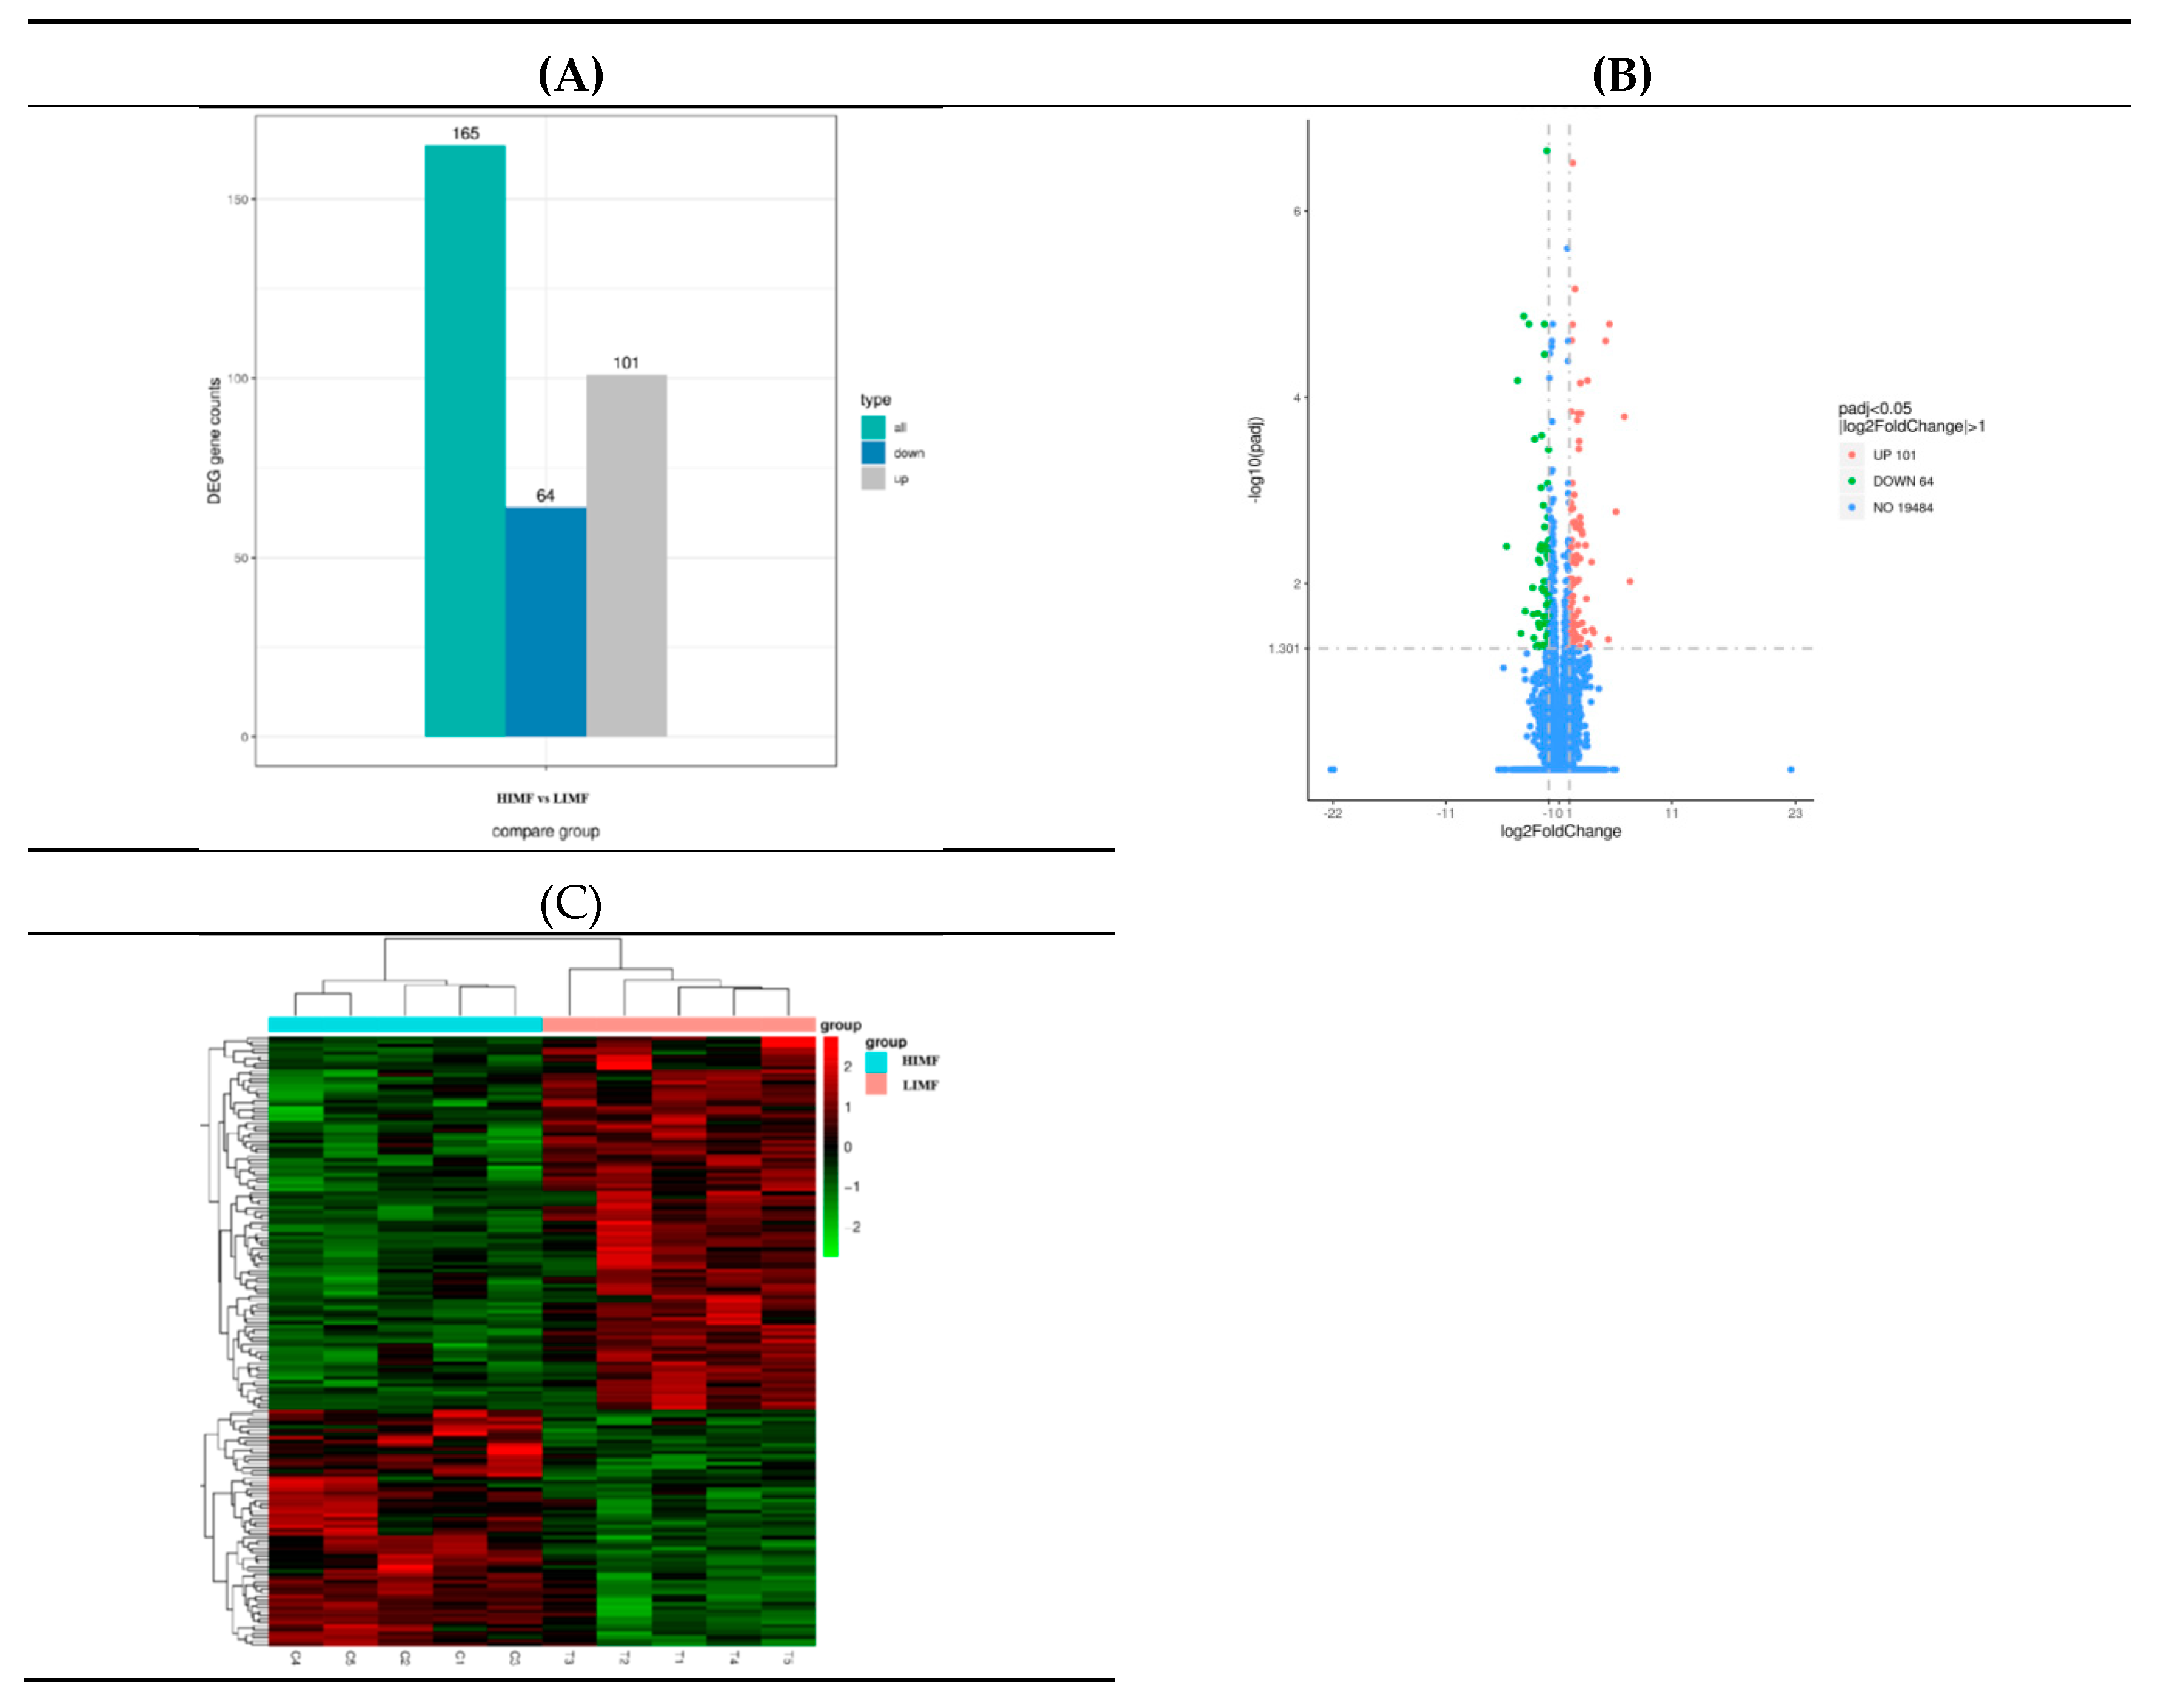
Figure 4.
GO enrichment analysis. The color from red to purple represents the magnitude of the significance of the enrichment, and the size of the dots represents the number of enriched entries.
Figure 4.
GO enrichment analysis. The color from red to purple represents the magnitude of the significance of the enrichment, and the size of the dots represents the number of enriched entries.
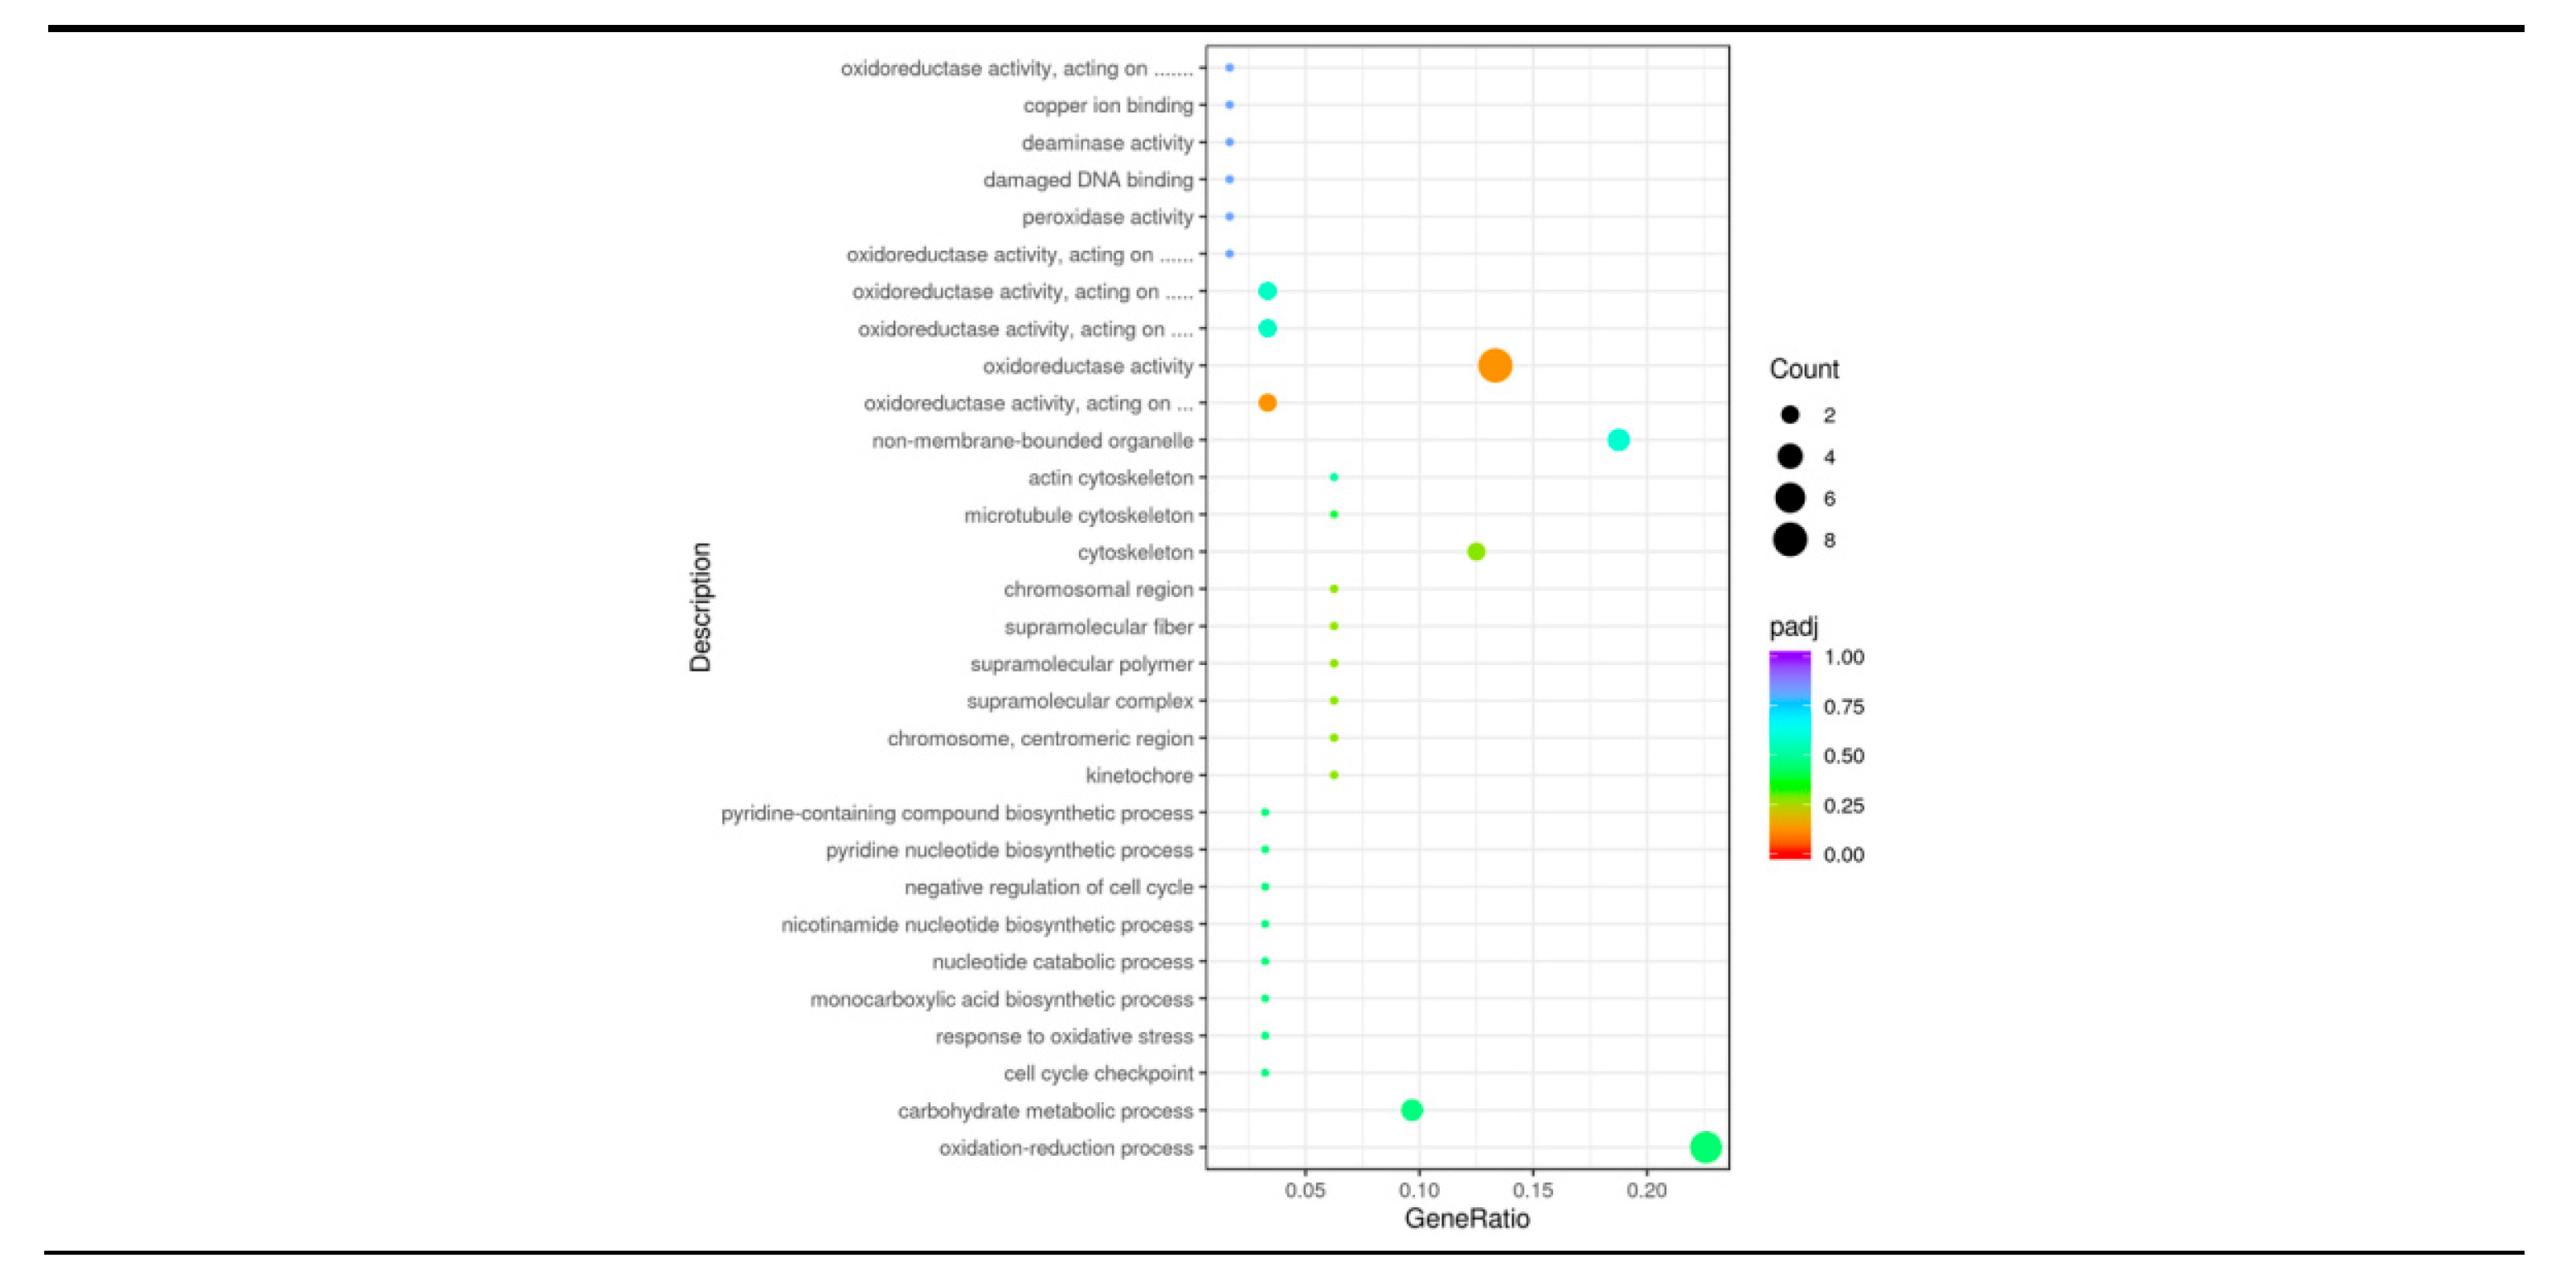
Figure 5.
KEGG enrichment analysis. The KEGG pathway is annotated as the ratio of the number of differential genes to the total number of differential genes on the horizontal coordinate, and the KEGG pathway is annotated on the vertical coordinate.
Figure 5.
KEGG enrichment analysis. The KEGG pathway is annotated as the ratio of the number of differential genes to the total number of differential genes on the horizontal coordinate, and the KEGG pathway is annotated on the vertical coordinate.
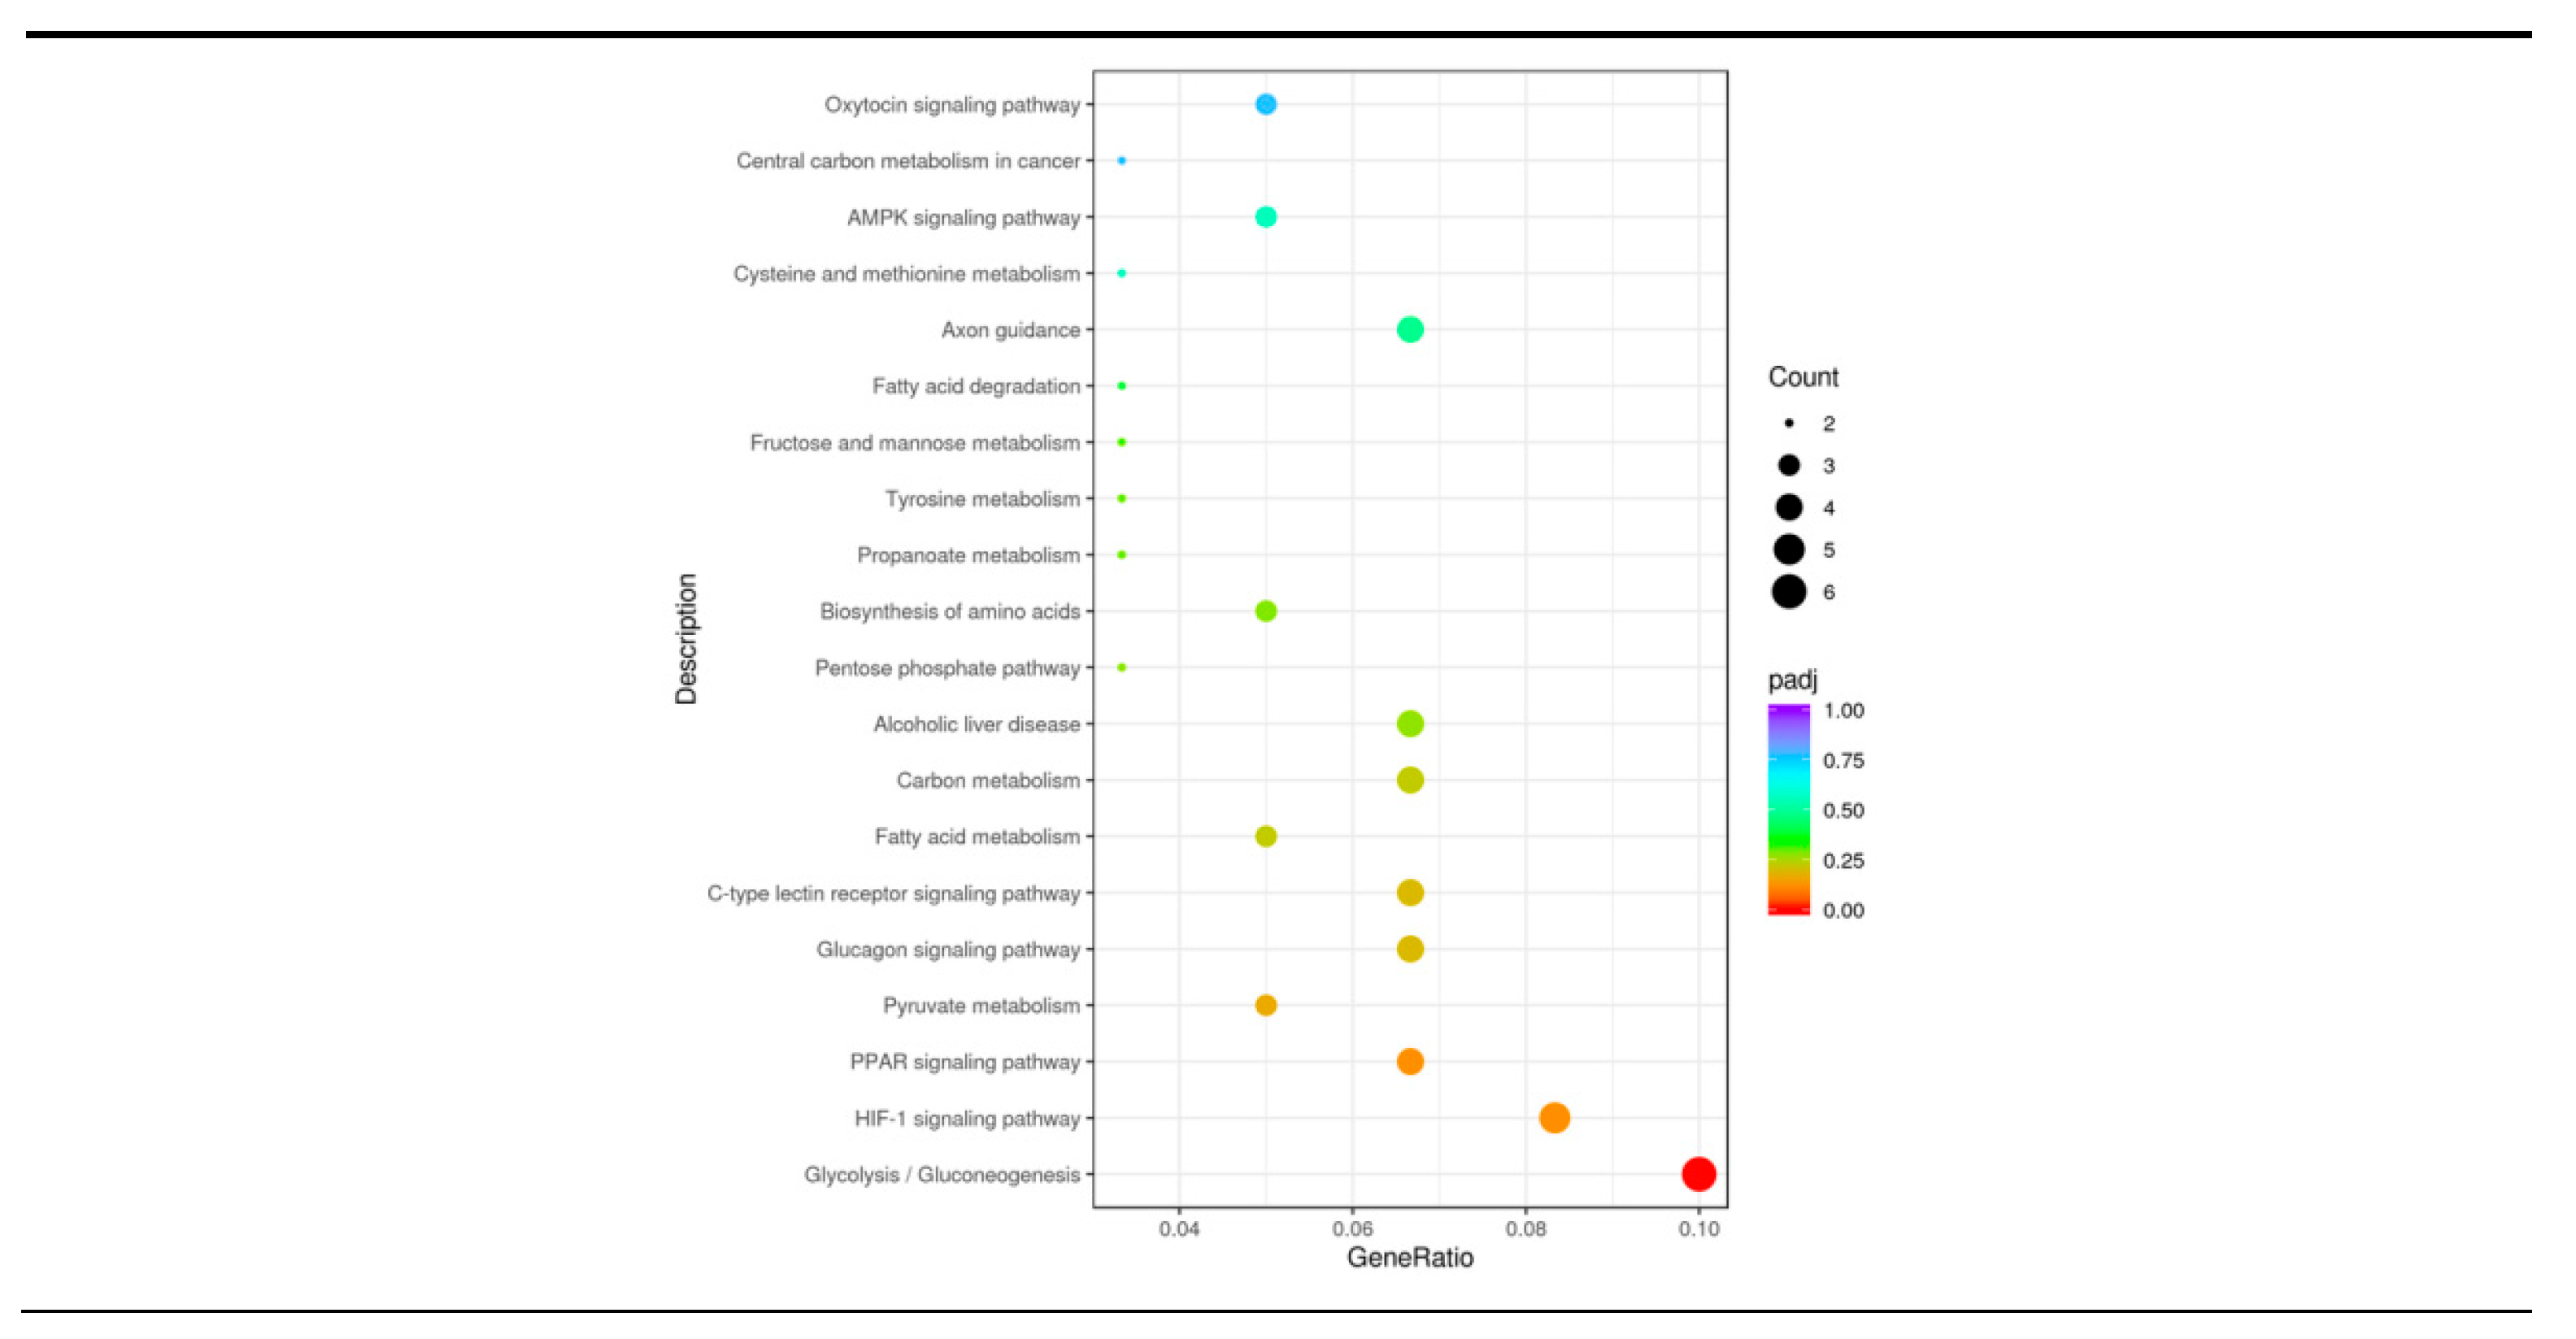
Figure 6.
RT-qPCR verification of RNA-Seq results.
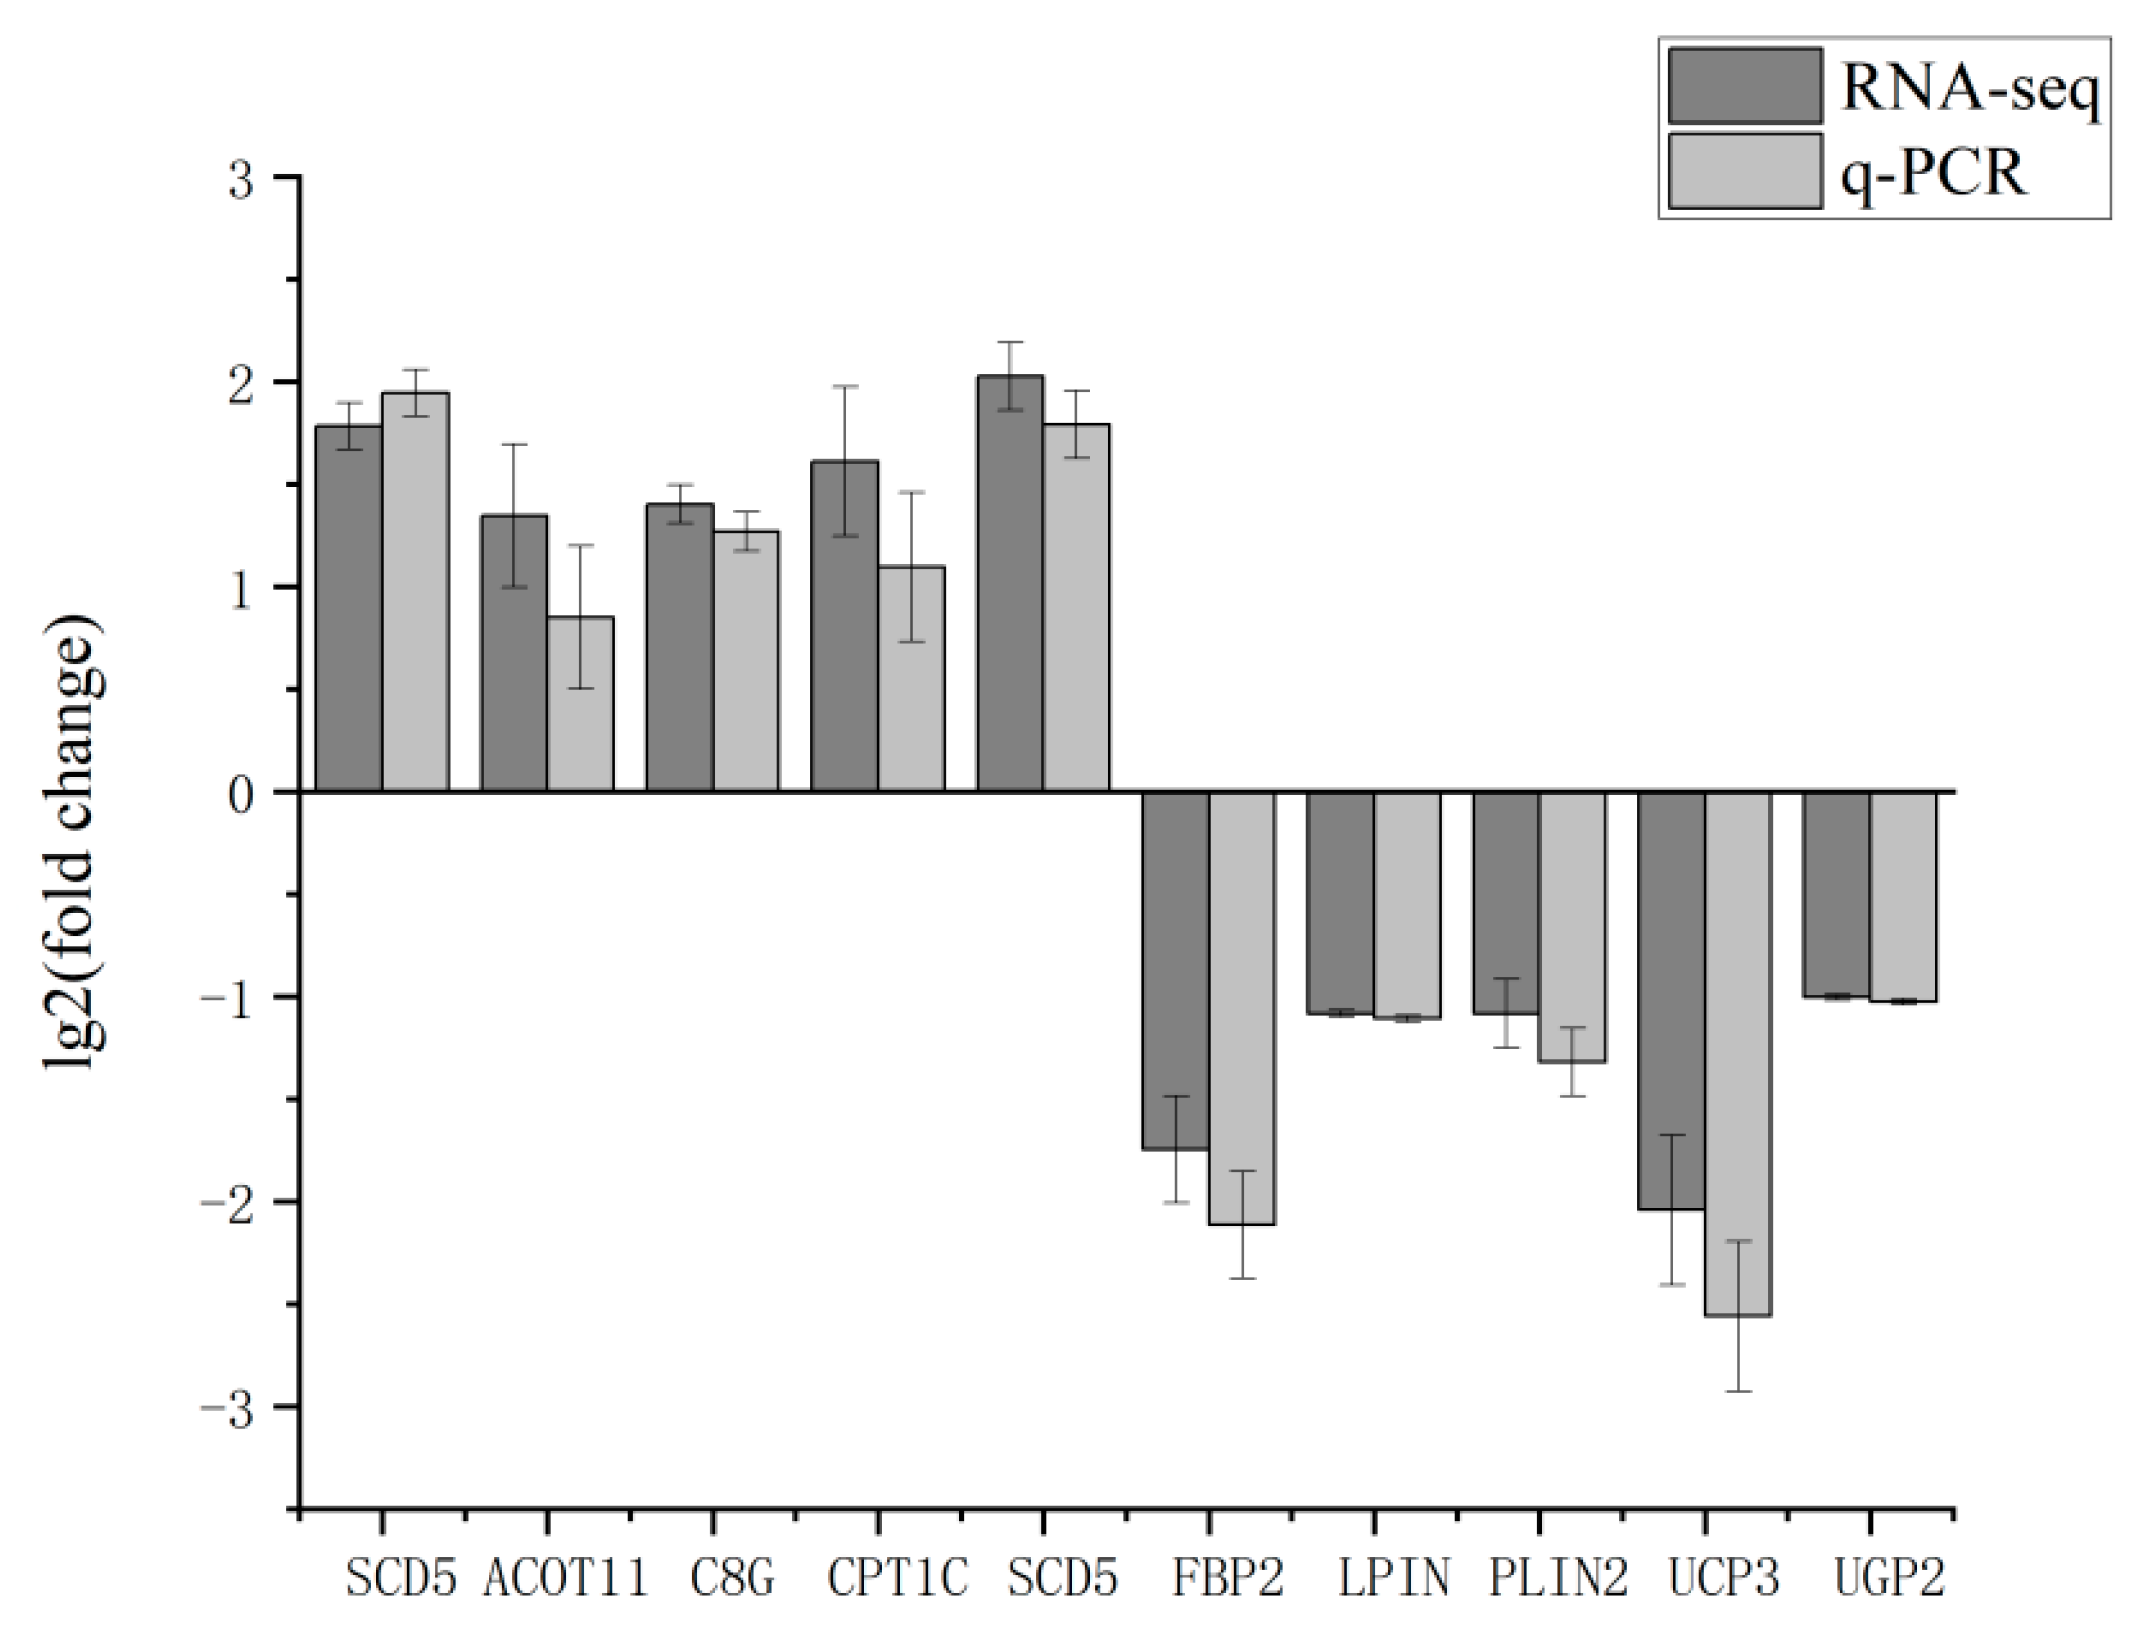

Table 1.
Primer sequences for RT-qPCR.
| Gene | mRNA accession number | Primer sequences(5'~3') | Product size |
|---|---|---|---|
| β-actin | NM_173979.3 | Forward:AAGTACCCCATTGAGCACGG Reverse:TCCTTGATGTCACGGACGATTT |
189 bp |
| SEC14L5 | NM_001191259.3 | Forward:CCACAAAGGCAAGATCCCCA Reverse:AGCTCAAGGACTGACACAGC |
104 bp |
| C8G | NM_001110076.2 | Forward:TCCCCTATCAGCACCATCCA Reverse:GCAGATTCCATCCAGCTTTCG |
198 bp |
| CPT1C | XM_002695120.6 | Forward:GGCTTCCGACCCTCACTGAC; Reverse:CAGAAACGGGAGAGATGCCTT |
116 bp |
| ACOT11 | NM_001103275.2 | Forward:ATCCAGACTGTTGGAAATCACCT Reverse:CTCGCCATCTGCCATGTTGT |
111 bp |
| SCD5 | NM_001076945.1 | Forward:TGGGTGCCATTGGTGAAGGT Reverse:CCCAGCCAACACATGAAGTC |
124 bp |
| FBP2 | NM_001046164.2 | Forward:TTCATGCTTGACCCAGCTCTT Reverse:CCTCCATAGACAAGGGTGCG |
230 bp |
| UCP3 | NM_174210.1 | Forward:CCCAACATCACGAGGAATGC Reverse:CAGGGGAAGTTGTCGGTGAG |
107 bp |
| PLIN2 | NM_173980.2 | Forward:CTCCATTCCGCCTTCAACCT Reverse:ACGTGACTCAATGTGCTCAG |
171 bp |
| UGP2 | NM_174212.2 | Forward:TGCGGATGTAAAGGGTGGGA Reverse:CATGCGCTTTTGGCACTTGA |
83 bp |
| LPIN1 | NM_001206156.2 | Forward:TCTTCCCACTTCCACGCTTC Reverse:ATCCGCAGATTTGCTGACCA |
90 bp |
Table 2.
IMF content of the longissimus dorsi muscle in Xinjiang Brown Bulls.
| Item1 | IMF content (%) | Minimum (%) | Maximum (%) | p-value |
|---|---|---|---|---|
| HIMF | 6.996±0.723A | 5.863 | 7.824 | 0.002 |
| LIMF | 4.790±0.783B | 3.874 | 5.624 |
1HIMF: sample set of top 5 intramuscular fat content, LIMF: the set of samples with the last 5 intramuscular fat content. Results were expressed as mean ± standard deviation, n=21. AB Values in the same column with different superscripts are extremely different (P < 0.01).
Table 3.
Summary of sample sequencing data quality.
| sample | Raw reads | Raw bases | Clean reads | Clean bases | Error rate | Q20 | Q30 | GC pct |
|---|---|---|---|---|---|---|---|---|
| T1 | 43246440 | 6.49G | 42439552 | 6.37G | 0.03 | 97.81 | 93.85 | 51.02 |
| T2 | 43426076 | 6.51G | 42377682 | 6.36G | 0.03 | 97.87 | 94.04 | 52.11 |
| T3 | 41992442 | 6.3G | 41202940 | 6.18G | 0.02 | 98.03 | 94.47 | 52.4 |
| T4 | 41644788 | 6.25G | 40126880 | 6.02G | 0.02 | 98.02 | 94.46 | 52.64 |
| T5 | 48098022 | 7.21G | 46682976 | 7.0G | 0.03 | 97.9 | 94.16 | 51.8 |
| C1 | 42494264 | 6.37G | 41037266 | 6.16G | 0.03 | 97.9 | 94.1 | 54.01 |
| C2 | 43497090 | 6.52G | 42302406 | 6.35G | 0.02 | 98.03 | 94.44 | 51.74 |
| C3 | 46125528 | 6.92G | 43760976 | 6.56G | 0.02 | 97.95 | 94.24 | 52.16 |
| C4 | 48924916 | 7.34G | 47173470 | 7.08G | 0.02 | 98.08 | 94.58 | 50.79 |
| C5 | 47427100 | 7.11G | 45659038 | 6.85G | 0.02 | 98.07 | 94.53 | 51.84 |
T1, T2, T3, T4, and T5 in the table are samples from the HIMF group; C1, C2, C3, C4, and C5 are samples from the LIMF group. The same as below.
Table 4.
Statistics on the comparison of the samples with the reference genome.
| Sample | Total reads | Total map | Map rate | Unique map | Unique map rate | Multi map | Multi map rate |
|---|---|---|---|---|---|---|---|
| T1 | 42439552 | 40217936 | 94.77% | 39141933 | 92.23% | 1076003 | 2.54% |
| T2 | 42377682 | 40157154 | 94.76% | 38944182 | 91.9% | 1212972 | 2.86% |
| T3 | 41202940 | 39045874 | 94.76% | 37817486 | 91.78% | 1228388 | 2.98% |
| T4 | 40126880 | 38521569 | 96.0% | 37350423 | 93.08% | 1171146 | 2.92% |
| T5 | 46682976 | 44779474 | 95.92% | 43397543 | 92.96% | 1381931 | 2.96% |
| C1 | 41037266 | 39309911 | 95.79% | 38015521 | 92.64% | 1294390 | 3.15% |
| C2 | 42302406 | 40332401 | 95.34% | 39075620 | 92.37% | 1256781 | 2.97% |
| C3 | 43760976 | 40739851 | 93.10% | 39403210 | 90.04% | 1336641 | 3.05% |
| C4 | 47173470 | 44649391 | 94.65% | 43182346 | 91.54% | 1467045 | 3.11% |
| C5 | 45659038 | 43293569 | 94.82% | 41735269 | 91.41% | 1558300 | 3.41% |
Table 5.
KEGG enrichment pathway and differentially expressed genes.
| KEGG id | KEGG description | P-value | Upregulated genes | Downregulated genes |
|---|---|---|---|---|
| bta04152 | AMPK signaling pathway | 0.0710 | FBP2; SCD5 | CPT1C |
| bta04921 | Oxytocin signaling pathway | 0.1093 | RGS2; PTGS2 | NFATC3 |
| bta05230 | Central carbon metabolism in cancer | 0.1063 | ENSBTAG00000032217; LDHB | / |
| bta04360 | Axon guidance | 0.0550 | RND1 | SSH2; UNC5A; NFATC3 |
| bta00270 | Cysteine and methionine metabolism | 0.0682 | ENSBTAG00000032217; LDHB | / |
| bta00071 | Fatty acid degradation | 0.0417 | CPT1C | ENSBTAG00000052243 |
| bta00051 | Fructose and mannose metabolism | 0.0312 | / | FBP2; ALDOA |
| bta00350 | Tyrosine metabolism | 0.0280 | ENSBTAG00000046264 | TYRP1 |
| bta00640 | Propanoate metabolism | 0.0264 | ENSBTAG00000032217; LDHB | / |
| bta01230 | Biosynthesis of amino acids | 0.0222 | / | ALDOA; ENSBTAG00000018554 |
| bta00030 | Pentose phosphate pathway | 0.0205 | / | FBP2; ALDOA |
| bta04936 | Alcoholic liver disease | 0.0175 | SCD5; CPT1C | LPIN1; ENSBTAG00000052243 |
| bta01200 | Carbon metabolism | 0.0129 | / | FBP2; ALDOA; ENSBTAG00000018554 |
| bta01212 | Fatty acid metabolism | 0.0118 | SCD5;CPT1C | ENSBTAG00000052243 |
| bta04625 | C-type lectin receptor signaling pathway | 0.0083 | EGR3; PTGS2 | CCL22; NFATC3 |
| bta04922 | Glucagon signaling pathway | 0.0072 | ENSBTAG00000032217;LDHB;CPT1C | FBP2 |
| bta00620 | Pyruvate metabolism | 0.0047 | ACOT11; ENSBTAG00000032217;LDHB | / |
| bta03320 | PPAR signaling pathway | 0.0026 | SCD5; CPT1C | ENSBTAG00000052243; PLIN2 |
| bta04066 | HIF-1 signaling pathway | 0.0018 | ENSBTAG00000032217; LDHB | ALDOA; ENSBTAG00000018554 |
| bta00010 | Glycolysis/Gluconeogenesis | <0.0001 | ENSBTAG00000032217; LDHB | FBP2; ALDOA; ENSBTAG00000018554 |
Disclaimer/Publisher’s Note: The statements, opinions and data contained in all publications are solely those of the individual author(s) and contributor(s) and not of MDPI and/or the editor(s). MDPI and/or the editor(s) disclaim responsibility for any injury to people or property resulting from any ideas, methods, instructions or products referred to in the content. |
© 2024 by the authors. Licensee MDPI, Basel, Switzerland. This article is an open access article distributed under the terms and conditions of the Creative Commons Attribution (CC BY) license (http://creativecommons.org/licenses/by/4.0/).
Copyright: This open access article is published under a Creative Commons CC BY 4.0 license, which permit the free download, distribution, and reuse, provided that the author and preprint are cited in any reuse.


