
Submitted:
06 May 2025
Posted:
06 May 2025
You are already at the latest version
Abstract
Motivated by two of the most unexpected discoveries in recent years - the detection of ArH+ and HeH+ noble gas molecules in the cold, low-pressure regions of the Universe - we investigate [He2H]+ and [Ne2H]+ as potentially detectable species in the interstellar medium, providing new insights into their energetic and spectral properties. These findings are crucial for advancing our understanding of noble gas chemistry in astrophysical environments. To achieve this, we employed a data-driven approach to construct a high-accuracy, machine-learning potential energy surface (ML-PES) using the reproducing kernel Hilbert space (RKHS) method. Training and testing datasets are generated via high-level CCSD(T)/CBS[56] quantum chemistry computations, followed by a rigorous validation protocol to ensure the reliability of the potential. The ML-PES is then used to compute vibrational states within the MCTDH framework, and assign spectral transitions for the most common isotopologues of these species in the interstellar medium. Our results compared with previously recorded values, revealing that both cations exhibit a prominent proton-shuttle motion within the infrred spectral range, making them strong candidates for telescopic observation. This study provides a solid computational foundation, based on rigorous fully quantum treatments, aiming to assist in the identification of these yet unobserved He/Ne hydride cations in astrophysical environments.
Keywords:
Noble gas hydrides cations
; Advanced quantum-mechanical simulations
; Electronic structure calculations
; Machine-learning potential energy surfaces
; vibrational spectral transitions
1. Introduction
Molecular spectroscopy is a fundamental tool for investigating molecular structures, properties, dynamics, and chemical reactivity. However, spectral data do not directly reveal molecular information; instead, it is encoded in complex patterns that require careful analysis. To extract meaningful insights, computational modeling plays an essential role in decoding these spectra. By combining advanced methods and techniques, such as quantum chemistry calculations, molecular dynamics simulations, and machine learning algorithms, computational spectroscopy allows researchers to simulate and interpret spectral features, enabling a deeper understanding of molecular behavior. Recent advancements in computational methods have significantly expanded the applicability of such approaches, facilitating in this way direct comparisons with experimental data [1,2,3,4,5,6,7,8]. A computational model is built upon specific concepts and assumptions, ideally adaptable to any molecular system. Quantum mechanical approaches, in particular, rely on the molecular Hamiltonian operator, incorporating both kinetic and potential energy, to extract vibrational information. Achieving high accuracy in spectral simulations requires both rigorous nuclear quantum simulations and high-level electronic structure calculations to provide an accurate description of interaction energies and an efficient representation of the potential energy surface (PES). The PES is a cornerstone for understanding most molecular processes, and its precise representation is crucial for reliable spectral computations. Commonly, discrepancies between theoretical predictions and experimental observations arise from inaccuracies in the underlying potential representation. As molecular complexity increases, refining PES models becomes progressively more challenging.
This study focuses on computing molecular interactions and characterizing the vibrational transitions of cationic light noble-gas hydrides of astrophysical interest. For a long time, the interstellar medium (ISM) has been considerate inhospitable environment to chemical compounds due to extreme conditions that characterized it and, only a few molecules could be form, but recently over 300 molecules have now been identified [9]. Notably, the discovery of noble gas hydride cations like the in the planetary nebula NGC 7027 [10] and for first time in Crab Nebule [11], and later, in extragalatic sources [12], challenges the notion of noble gases as inert, indicating the need of further research for a much better understanding of the noble gas chemistry.
Among the cationic noble-gas hydrides, the most astrophysically relevant are those of helium and neon. The interest in [ lies in its composition of helium and hydrogen, the two most abundant elements in the universe, increasing the likelihood of its formation in suitable space environments. The fifth most abundant element is the neon, and thus it is also an intriguing candidate. However, no molecular species containing it has been detected so far, the NASA’s LADEE mission recently confirmed [13] the presence of neon in the lunar exosphere, suggesting that neon hydrides or their cations could exist in cold planetary systems under favorable conditions for Ne interactions with H or .
In the laboratory, high-resolution mass spectrometry experiments [14,15,16,17] have provided insights into the stability of specific structures, revealing differences with those observed in heavier noble gas hydrides, [ (m=1,2 and 3). Thus, noble gas matrix experiments has confirmed the existence of centrosymmetric [ configurations [18,19,20,21], highlighting that symmetric insertion of a proton into a weakly bound noble gas dimer significantly enhances the system’s stability compared to other possible arrangements. Just recently, applying different action spectroscopic techniques [8,22] the proton shuttle motion of the has been observed at , together with seven of its rovibrational lines [8], while estimates for the bending and symmetric stretch fundamentals have also been reported [8,22,23] at 874.9 and , respectively.
Several theoretical studies have been also carried out predicting both geometric and energetic characteristics of the linear configurations of these systems, identifying the centrosymmetric structure as the most stable [24,25,26,27,28,29,30,31,32,33,34,35,36,37,38,40]. In particular, for the [ case, Dykstra [27] has first computed potential energy values for a limited set of geometries, which later on, Lee and Secrest [37] have used them to parameterize an analytical PES and calculate rotational-vibrational states up to J=2. They have identified five bound states for J=0 for both [ and [. Subsequently, Baccarelli et al. [28] have explored the potential for both collinear and symmetry geometries using MRCI/pVTZ calculations, while another significant study was carried out by Kim and Lee [29], examining a restricted region of the configuration space with the CCSD(T) method. In 2003, Panda and Sathyamurthy [34] constructed a PES using the many-body expansion form [41] fitted to data from CCSD(T)/AVTZ calculations, and reported seven and fourteen bound vibrational states for the [ and [, respectively. Later, Liang et al. [38] have developed another analytical PES using 15682 MRDCI/AV5Z data points up to energies of . More recently, Stephan and Fortenberry [32] have reported quartic force fields derived from CCSD(T)/AV5Z calculations, while Fortenberry and Wiesenfeld [33] have reported an update PES using CCSD(T)-F12 data. In contrast, for the [ complex the literature is more limited. There are only two PESs available: a quartic force-field PES [31] using CCSD(T)/AV5Z calculations, and an analytical 3D PES [35] constructed from more than 23000 CCSD(T)/AVQZ data points. In this latter study the first 22 vibrational bound levels have been also reported for the [ [35].
Advances in computational quantum chemistry coupled with cutting-edge experimental techniques have opened new avenues to explore the fundamental chemical properties of these species. A common aspect in all previously mentioned computational studies is the use of traditional analytical PES models. While, such models have demonstrated the ability to provide high-quality results [42,43,44,45,46,47,48,49], even today, despite the feasibility of high-level quantum chemistry calculations, their construction still remains a laborious and time-consuming computational task. In this context, machine learning (ML) PESs trained on previously calculated molecular structures and energies [50,51,52], presents a promising alternative [53,54,55,56,57,58] for studying various physical-chemical processes, e.g. the vibrational analysis of molecules. In our recent investigations [59,60,61,62], we have assessed the performance of machine learning PESs methods based on both kernel and neural networks (NN) representations [56,63,64,65,66,67]. Specifically, for small size systems, the reproducing kernel Hilbert space (RKHS) method [68,69,70] has proven effective, as by construction accurately reproduce the training data, while simultaneously capturing potential’s long-range asymptotic interactions using appropriate kernel polynomials [71,72,73,74,75,76].
Therefore, in this work, we aim to develop a full 3-dimensional kernel-based RKHS ML-PES for the [ and [ noble gas hydride cations. These PES models will be trained and validated against high-accuracy CCSD(T)/CBS data, with each step of the PES construction process being thoroughly examined. The resulting ML-PES will be utilized in ro-vibrational quantum computations to provide precise predictions of energetic and spectroscopic properties for common isotopologues, which will then be compared with available literature data. The calculated vibrational transitions could provide valuable insights for supporting the astrochemical identification of these noble gas compounds in unexplored regions of the interstellar medium.
2. Computational Methods, Results and Discussion
2.1. Electronic Structure Calculations: Reference Data on Interaction Energies
All ab initio electronic structure calculations were performed using the MOLPRO 2022 program [77], while the DENEB software package [78] was employed to generate and organize all input and output data files, respectively.
2.1.1. Optimized Structures and Dissociative Energetics
We have first carried out geometry optimizations of these complexes at the CCSD(T)/aug-cc-pV6Z level of theory together with the corresponding harmonic vibrational normal modes frequency analysis. Figure 1 summarizes both energies and configurations of stationary points and dissociation channels. We have found that the optimized equilibrium structure (global minimum) of both triatomic complexes show a linear -Ng configuration, belonging to symmetry, with the Ng–H+ bond lengths of 0.925/1.143 Å and a total energy of -5.9030/-257.8380 a.u. for the He/Ne-systems. We can note that the Ng–H+ bondlengths are larger compared with 0.77/0.90 Å in the isolated [ molecules [79] due to the incorporation of the new Ng atom. We also found that the antilinear optimized structure (local minimum) is at energy of -5.883120/-257.8137 a.u., 4367.16/ above the global one, while the barrier between them is found at energy of -5.883095/-257.81372 a.u, or 4368.64/.
The harmonic vibrational frequencies for the 4He and 20Ne from the CCSD(T)/AV6Z computations are shown in Table S1 (see Supplementary Material), where is the symmetric stretch, the doubly degenerate proton bend vibration, and the asymmetric stretching or shared-proton mode. The calculated harmonic zero-point-energy (ZPE) values is for [ and for the [, with the harmonic vibrational frequencies being in line with the reported values in previous studies [31,32,36]. Regarding the corresponding intensities, that of shared-proton stretching modes have higher values compared to modes, indicating a strong absorption or emission line in the IR-spectra. Furthermore, one can be seen that the proton-shuttle motion is very similar in both species, with a difference of just . We also note that, in the case of [, the trend in frequencies observed in its heavier counterparts is not followed, where < < is the rule, instead, the order is partially inverted ( < < ) and, the value of is twice that in the Ne-complex, and almost six times larger than in the [60].
Next, we also performed CCSD(T)/AV6Z computations to determine the energetics associated with the possible dissociation channels, as shown in Table S2 (see Supplementary Material). Based on our calculations, the most favorable direct dissociation pathway for [ complexes involves the separation into a neutral Ng atom and molecular cation. The relative energy associated with this process is for He-complex and for Ne-complex (see Figure 1). The next lowest dissociation energy corresponds to the loss of the proton, which requires an energy five times greater than predecessor dissociation channel. In this case, a competition is observed between the formation of and the dissociation in 2Ng, with an energy difference of less than in both scenarios. For [, the most favorable channel is the formation of , while in the case of [ the opposite mechanism is favored. A similar behavior is presented in the dissociation mechanism by loss of a hydrogen atom, with an energy twenty-three and fifteen times greater than the most favorable dissociation mechanism for the He-complex and Ne-complex, respectively. However, in this case, the energy difference between both pathways is much smaller, being approximately for [ and for [. These significant energy difference strongly indicates that the predominant formation way for these complexes is through the generation of the and Ng atom. Consequently, our study of their interaction will focus on their dissociation into this lowest-energy channel.
In this context, Table S3 (see Supplementary Material) presents the stepwise formation energies as Ng atoms bind to the proton, revealing that the first Ng atom binds more strongly than the second in all studied systems. The total formation energy at T=0 K for the [ and [ systems is obtained by summing the stepwise formation energies, with the first binding step playing a dominant role in determining the overall behavior. For the , in general terms, an excellent agreement with the data available in the literature is observed. Compared with data in ref. [33], the discrepancies of almost 6 kcal/mol in the total formation energy and 1.5 kcal/mol in the second step are mainly due to the inclusion of zero-point energy corrections, which were not considered here, while the difference of approximately 1 kcal/mol with ref. [28] is due to the use of a different computational method (MRDCI). In the case of the , the observed discrepancies are again due to the differences in the computational methods used [35,39,40]. Comparing with the most recent study [35] a difference of about 1 kcal/mol is observed, suggesting that for noble gas hydrides the accuracy of the calculations becomes increasingly dependent on the size of the basis used as the Ng atom becomes heavier, as already observed in ref. [59,79].
2.1.2. Training and Testing Datasets
We have used the Jacobi’s coordinates to sample the configuration space for both [ and [ cations. The Jacobi (r, R, ) coordinates are defined as, r the vector along the Ng-H bond distance, R the vector along the distance between Ng from the center of mass of the H, and the angle between the (r, R) vectors. On the basis of our previous works [60,79], we have employed the single and double excitation coupled cluster with perturbative triples (CCSD(T)) method using the AV5Z and AV6Z basis sets, followed by extrapolation to the complete basis sets (CBS) to obtain the energies. We have utilized the two-point single inverse power function introduced by Schwartz [80] = + , with n = 5 and 6, in order to compute the correlation energy at the CBS limit, and then used it in the calculation.
The size of the training datasets was up to 8550 and 13680 CCSD(T)/CBS[56] ab initio points for the [ and [ molecular cations, respectively. The [ dataset was distributed in a grid of 10-points in the r coordinate ranging between 0.60 and 1.95 Å, 45-points in the R distance from 1.5 to 7.0 Å, and 19-points in the angular coordinate between 0 and , while for the [ the grid is ranging from 0.75 to 2.25 Å, and 1.9 to 7.0 Å in r and R coordinates, respectively. For both molecules, we employed eight different sets of training data with in total 1000(1900)/1500(2850), 1800(3420)/2700(5130), 2500(4750)/4000(7600) and 4500(8550)/7200(13680) points by choosing 4 or 10/6 or 16, 25 or 45, and 10 or 19 grid points in the r, R and descriptors, respectively, for the [/[, keeping the same coordinate range in all of them. Once the generation of a high-quality dataset is completed, we then proceed with their organization, by splitting the whole dataset into training and test sets, utilized then in the training and evaluation processes, respectively. In Figure 2, we show the distributions of the cumulative number of configurations as a function of energy for the previously mentioned training sets, as well as, 11400 and 1840 additional testing dataset configurations of He- and Ne-complexes. We have also show distribution in energy of 3800 and 6080 randomly chosen data for each [ and [, respectively.
2.2. Potential Energy Surface Representations: Topology and Quality
2.2.1. RKHS ML-PESs Methodology
As mentioned, we choose the RKHS method proposed by Ho and Rabitz [68] to represent the PESs. Briefly, represents the potential energy function, with denoting the known potential energies at specific molecular configurations , then, by applying the representer theorem to a general functional relationship, can be optimally approximated as a linear combination of appropriate functions: , being coefficients and a kernel function. The coefficients are determined by solving the linear equation , where represents the input data, is the vector of coefficients, and is the reproducing kernel matrix. Furthermore, the multidimensional kernel function can be expressed as a direct product: , where D is the dimensionality of the kernel K, and k represents the one-dimensional (1D) kernels. Several 1D kernel functions for different purposes are available in the literature, and in this study, we have employed the , and 1D reproducing kernel functions for the diatom distance-like (r), the Ng-diatom distance-like (R), and angle-like () variables, respectively. In the above equation, the reduced coordinate is , whereas, , and are the number of ab initio calculated points in each coordinate. The reproducing distance-like kernel functions and are represented by , with = r or R, respectively, and are the larger and smaller of the , respectively, while the angle-like kernel function is given as . The n and m superscripts refer to the order of smoothness of the function and its asymptotic behavior at large distances, with , and m=3 accounting the leading dispersion interaction between the Ng atom and molecular ion. B is the beta function, is the Gauss hyper-geometric function, and the Legendre polynomials with =0-18. In turn, the potential form is given by
2.2.2. Validation of the RKHS ML-PES Models
A three-step validation protocol previously developed [60] was employed as follows: First, each PES’s model is validated on the training data to ensure that the results are consistent and reproducible with the information used during training. Then, potential values are generated at points outside the training range, using the test sets, to assess the ability of model to generalize to new and unseen data. Finally, regression diagnostics are monitored, here we will focus on the root-mean-square error (RMSE) and mean-absolute error (MAE), and it is verified that it does not exceed a predefined threshold. If the error exceeds this limit, more training data are incorporated to improve the model’s accuracy.
Figure 3 and Figure 4 illustrates the systematic improvement in the RMSE values of the RKHS ML-PES model as the number of training data increases. To select the best-performing RKHS PES for each complex, we employed a hold-out cross-validation scheme among the eight trained models. The RMSE values were computed considering the total number of testing data for [ cations. In the case of the He-complex, we averaged the RMSE over 3800 randomly selected points from the total 11400 test data, while for the Ne-complex, we used 6080 random points out of 18240. This allows us to assess the quality of the RKHS PES as a function of the training data size, with models trained on 4500/8550, 2500/4750, 1800/3420, and 1000/1900 or 7200/13680, 4000/7600, 2700/5130 and 1500/2850 points for both He or Ne-complexes (shown in the left and right plots of Figure S1 in Supplementary Material, respectively). As expected, RMSE values decrease as the dataset size increases. Additionally, we observed that RMSE values are highly sensitive to the sampling in the coordinate. Specifically, models trained on 4500/7200 (10,45,10/16,45,10), 2500/4000 (10,25,10/16,25,10), 1800/2700 (4,4,10/6,45,10), and 1000/1500 (4,25,10/6,25,10) exhibit significantly higher RMSE values compared to models trained on 8500/13680 (10,45,19/16,45,19), 4750/7600 (10,25,19/16,25,19), 3420/5130 (4,45,19/6,45,19), and 1900/2850 (4,25,19/6,25,19), where the RMSE values are significantly lower. The computed RMSE values for all RKHS ML-PES models, considering the total 11400/18240 test data, the 8866/17015 datasets with energies below the dissociation threshold, and the two corresponding randomly selected testing sets 3800(3713)/6080(5563), follow the same trend.
The correlation plots demonstrated the effectiveness of the selected RKHS ML-PES model by comparing its performance against 8500/13680 training and 11400/18240 testing data points for He/Ne molecular cations, covering both attractive and repulsive regions of the potential. The RMSE values, shown as a function of energy ranges (see upper panels of Figure 3 and Figure 4), indicate that outside the training region, they remain at 22/, even for dissociation energies exceeding 8866/17015 configurations (see lower panels of Figure 3 and Figure 4). Additionally, the total mean absolute error (MAE) remains below 0.004% across 11400/18240 configurations.
When we analyze the overall quality of the RKHS ML-PES developed in this work, one can be seen that the amount of training data required for their construction is significantly lower compared to previous studies available in the literature for both complexes analyzed, such as those reported in [38] and [35]. For the case of [, there are two PESs in which RMSE values with respect to the ab initio data of 87.44 and are reported, references [34] and [38], respectively. The last one of these models used 15682 points with energies below , which contrasts with the non-error of the RKHS ML-PES presented here. In the case of [, the study by Koner et al. [35] reports an RMSE of , based on more than 23000 potential energy values computed ab initio. In contrast with all of this, the RKHS ML-PESs developed in this work require a considerably smaller training set, demonstrating the efficiency of the kernel-based approach in the study cases. This approach significantly reduces the amount of data required to build a high-precision PES compared to traditional analytical methods, as evidenced by recent studies.
Apart from the typical quantitative error analysis of the RKHS ML-PES, we also proceed to analyze the behavior of the hydrides cations under study through their potential curves plots along representative coordinates.
Thus, Figure 5 and Figure 6 present a comparison of the RKHS ML-PES (in solid lines) and the CCSD(T)/CBS[56] energies (in circles symbols) as a function of r (upper panels), R (middle panels) and (lower panels). In the upper panels we show the effect on the interaction of the shared proton motion between the two Ng atoms for linear (upper left panels) and antilinear (upper right panels) configurations of the [ and [ complexes, respectively, keeping fixed the R distances at the range of 1.5 to 2.7 Å. In the middle panels the potential curves are plotted for fixed from for r= 0.90/1.15 Å (left panels) and 1.35/1.55 Å (right panels) as a function of R, while minimum energy path (MEP) plots are shown in the lower panels as a function of optimizing both r and R coordinates. As it is seen the RKHS ML-PES smoothly reproduces the ab initio data for all analyzed cases. Additionally, the full 3D RKHS ML-potential for [ cations are also presented using two-dimensional contour plots in Figure S2 (see Supplementary material) in the (, R) and (r, R) planes, over from - to - for both cases.
In this manner, one can observe that the global minimum corresponds to the linear [ configuration, while the local minimum coincides with the antilinear [ configuration in both cases. For the [ system, the well depth of the global minimum is equal to in the RKHS ML-PES and is located at R=1.69 Å and r=0.95 Å, whereas the second minimum presents an energy of - with R=2.27 Å. Regarding the [ complex, the well depth is equal to in the ML-PES and is located at R=2.23 Å and r=1.15 Å, whereas the local minimum presents an energy of - with R=2.69 Å. Moreover, the potential energy barrier between the global and local potential minima at R=2.27 Å with an energy of - for [ and at R=2.70 Å with an energy of - for [.
2.3. Bound-State Quantum Calculations: Vibrational Spectral Bands Assignment
We employed the MCTDH (multi-configuration time-dependent Hartree) method, as implemented in the MCTDH package of codes [81]. We solve the time-dependent Schrödinger equation [82,83], , where , and the Hamiltonian terms being, and .
The () Jacobi coordinates are chosen with the R being parallel to the Z body-fixed (BF) axis and the r coordinate lying in the XZ-plane. The azimuthal Euler angle specifying the orientation of the BF around R. The total angular momentum is conserved, with L and j being the orbital and diatomic angular momentum operators, respectively, and its projection along the Z, =K, being the same of that of , as =0 by construction. The and are the reduced masses, with the total mass of and , the mass of Ng=He or Ne and H or D atoms (isotopes), respectively. The term is the RKHS ML-PES for each cation, and within the MCTDH method [84,85,86] the POTFIT algorithm [87] was employed to transform these terms as a sum of products of single-particle operators, namely natural potentials (NPs). The contraction is constructed over the angular coordinate , and 25 NPs are used in the POTFIT calculations for each r and R coordinates. In these calculations we considered the relevant region below the dissociation threshold with a root mean square error (RMSE) of the fit in this region smaller than . The wavefunction is also expanded in a sum of products of time-dependent basis, , namely single-particle functions (SPFs), as , with being the time-dependent coefficients and Q the nuclear coordinates. Both the wavefunction and Hamiltonian operator are represented on a grid of the () coordinates ranging in the configuration space of interest, with the variable K taking only integer values. We have run several convergence test, and we have found that convergence achieved using 51 harmonic oscillator (HO) DVR functions in each r and R coordinates in the range of [0.6,1.95]/[0.7,2.25] and [1.35,3.5]/[1.8,4.0] Å, respectively, while for the angular coordinate we used DVR functions in the [0,2] interval.
The improved relaxation () and the block improved relaxation () methods [88,89], as implemented in the MCTDH package [81], were used to calculate the ground and excited rovibrational states. We have used a set of (18,18,18) SPFs in each coordinate in the and MCTDH calculations, and we calculated in total up to 20 and 50/70 rotational-vibrational states considering the H and D isotopes in the and , respectively. All calculated J=0, 1 and 2 states are given in the Supplementary Material, while all vibrational energy levels and their assignment (when possible) are listed in Table 1 and Table 2 and also shown in Figure 5 and Figure 6 for the and , respectively. Comparisons with values reported in previously reported theoretical studies [34,35,37] are included in Table 1 and Table 2.
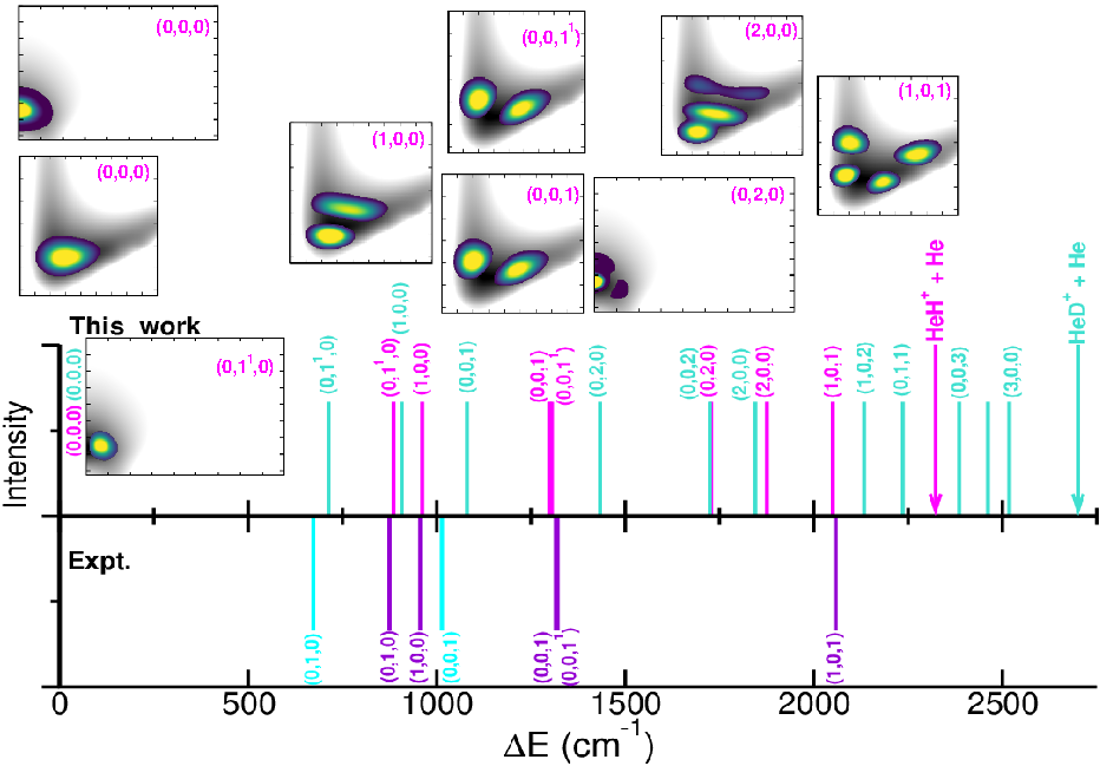
The anharmonic ZPEs are 2310.5/1802.55 and 1933.1/ for the and , respectively, with deuteration reducing the ZPE values by 377.8/. By comparing with the ZPEs previously reported, we found differences of 29 and for the , 85 and for the [34,37], and [35] for the . One can also observe that the present ML-PESs predict 5/10 bound vibrationally excited levels for the , with energies that are significantly different from previous results available for the [34,37]. In turn, 34/70 bound vibrationally excited levels are obtained for the , whose energies being in a better accord with the recently 22 reported ones [35] for the . Figure 7 and Table 2 display 2D probability distributions of various rovibrational states in the (r,R) or (,R) or (,r) planes, where is the anharmonic symmetric Ng–H+ stretch, the anharmonic doubly degenerate proton bend vibration, and the anharmonic asymmetric Ng–H+ stretching or shared-proton mode. The assignment of each energy level has been extracted by analyzing the corresponding nodal structure of the probability density functions (see corresponding plots in Figure 7 and Table 2). As shown, the ground vibrational state (0,0,0) has zero nodes, the (1,0,0) has one node in R, the (0,0,1) shows one node in r, while the (1,0,1) has one node in each r and R coordinate. In turn, the (0,,0) and (0,2,0) density functions exhibit bending excitations with one and two nodes in coordinate, respectively.
Regarding the and bands, our results predict values of 962.1 and for the , with closely matching previously reported theoretical values of 963.6 and [34,37], while the is found at . A comparison with recent experimental data [8,22,23] for specific rovibrational bands of is presented in Figure 7. Notably, the band has been observed at , along with seven of its rovibrational lines [8], including the (0,0,) transition at . Additional estimates reported for the bending mode at or the at or the combination band at [8,22,23], while for reference the and fundamentals have been estimated at 673 and for the [14]. Our predictions underestimate the and the band by 15.4 and , respectively, while overestimating the and by 11.8 and , respectively. In the case of the our calculations predicted the three fundamental bands at 907.6, 717.9 and .
In turn, for the the and vibrational bands are found at 475.5 and , with the band comparing well to the reported value of [40]. Additionally, the , 2 and 3 combination bands are predicted at 1807.3, 2163.8 and , respectively, in close agreement with the 1814, 2182 and values obtained from a coupled anharmonic model [40]. To date no experimental measurements have been reported for the species, and thus the present predictions await experimental verification.
3. Conclusions
The present study focuses on the computational spectroscopic characterization of the proton-bound light noble-gas cations. Our results were obtained from high-level and well-converged ab initio electronic structure calculations, and newly trained RKHS ML-PESs were developed using high-quality CCSD(T)/CSB[56] set of data; followed by nuclear quantum bound state computations within the MCTDH framework employing the ML-PESs. Rovibrational states were calculated and assignments for several vibrational bands were provided. Comparisons of the zero-point energies, fundamental vibrational frequencies, and combination bands with previously reported theoretical estimates and recent experimental measurements on were also presented and discussed. We have found that vibrational fundamentals bands are in close agreement with the experimental values reported for the , while our results for the provide detailed and precise spectroscopic predictions that may serve as benchmarks for future laboratory or astrophysical detections.
Looking ahead, the quantum methodologies and insights developed in this work can be extended to the heavier proton-bound noble gas complexes, broadening the exploration of spectral features of this intriguing class of molecular ions. The success of the ML-PES strategy also opens avenues for modeling larger and more complex weakly bound systems, bridging the gap between computational predictions and experimental efforts - an ongoing challenge for the computational spectroscopy. We anticipate that the present results will stimulate further experimental studies, and will contribute to a deeper understanding of such noble gas cations in the ISM.
Author Contributions
M.J. MOE (data curation, formal analysis, investigation, methodology, validation, writing – original draft preparation), A. V. (data curation, formal analysis, methodolody, investigation, writing – review and editing), R. P. (funding acquisition, project administration, conceptualization, formal analysis, investigation, methodology, validation, writing -original draft preparation – review and editing).
Funding
This work has been supported by the Comunidad de Madrid grant ref: IND2018/TIC-9467, the MCIN grant no. PID2020-114654GB-I00, the CSIC-PEICT Ref: 2024AEP119, the Universidad Nacional de Colombia Hermes code: 63223, and the COST Actions CA21126(NanoSpace) and CA21101(COSY).
Data Availability Statement
The data that support the findings of this study are available within the article as well as from the authors upon reasonable request.
Acknowledgments
The authors thank the "Centro de Cálculo del IFF-CSIC and SGAI-CSIC" and CESGA-Supercomputing centre for the allocation of computer time.
Conflicts of Interest
The authors declare no conflicts of interest.
References
- Tennyson, J. Accurate variational calculations for line lists to model the vibrational-rotation spectra of hot astrophysical atmospheres. WIREs Comput. Mol. Sci. 2011, 2, 698–715. [Google Scholar] [CrossRef]
- Yu, Q.; Bowman, J.M.; Fortenberry, R.C.; Mancini, J.S.; Lee, T.J.; Crawford, T.D.; Klemperer, W.; Francisco, J.S. Structure, Anharmonic Vibrational Frequencies, and Intensities of NNHNN+. J. Phys. Chem. A 2015, 119, 11623–11631. [Google Scholar] [CrossRef] [PubMed]
- Simmons, J.; Carrington, Tucker, J. Computing vibrational spectra using a new collocation method with a pruned basis and more points than basis functions: Avoiding quadrature. J. Chem. Phys. 2023, 158, 144115. [CrossRef]
- Valdés, Á.; Prosmiti, R. First-principles simulations of vibrational states and spectra for and clusters using multiconfiguration time-dependent Hartree approach. Spectrochim. Acta A 2014, 119, 26–33. [Google Scholar] [CrossRef] [PubMed]
- Császár, A.G.; Fábri, C.; Szidarovszky, T.; Mátyus, E.; Furtenbacher, T.; Czakó, G. The fourth age of quantum chemistry: molecules in motion. Phys. Chem. Chem. Phys. 2012, 14, 1085–1106. [Google Scholar] [CrossRef]
- Carrillo-Bohórquez, O.; Valdés, Á.; Prosmiti, R. Computational Energy Spectra of the H2O@C70 Endofullerene. ChemPhysChem 2023, 24, e202300570. [Google Scholar] [CrossRef]
- Valdés, Á.; Cabrera-Ramírez, A.; Prosmiti, R. Confining CO2 inside sI clathrate-hydrates: The impact of the CO2-wate interaction on quantized dynamics. J. Comput. Chem. 2023, 44, 1587–1598. [Google Scholar] [CrossRef]
- Salomon, T.; Baddeliyanage, C.; Schladt, C.; Simkó, I.; Császár, A.G.; Silva, W.G.D.P.; Schlemmer, S.; Asvany, O. High-resolution leak-out spectroscopy of HHe2+. Phys. Chem. Chem. Phys. 2025, 27, 4826–4828. [Google Scholar] [CrossRef]
- Molecules in Space, 2022. Available online: https://cdms.astro.uni-koeln.de/classic/molecules.
- Güsten, R.; Wiesemeyer, H.; Neufeld, D.; Menten, K.; Graf, U.; Jacobs, K.; Klein, B.; Ricken, O.; Risacher, C.; Stutzki, J. Astrophysical detection of the helium hydride ion HeH+. Nature 2019, 568, 357–359. [Google Scholar] [CrossRef]
- Barlow, M.; Swinyard, B.; Owen, P.; Cernicharo, J.; Gomez, H.; Ivison, R.; Krause, O.; Lim, T.; Matsuura, M.; Miller, S.; et al. Detection of a Noble Gas Molecular Ion, 36ArH+, in the Crab Nebula. Science 2013, 342, 1343–1345. [Google Scholar] [CrossRef]
- Müller, H.; Muller, S.; Schilke, P.; Bergin, E.; Black, J.; Gerin, M.; Lis, D.; Neufeld, D.; Suri, S. Detection of extragalactic argonium, ArH+, toward PKS 1830-211. A&A 2015, 582, L4. [Google Scholar]
- NASA’s LADEE Spacecraft Finds Neon in Lunar Atmosphere. https://sservi.nasa.gov/articles/nasas-ladee-spacecraft-finds-neon-in-lunar-atmosphere/, 2015.
- Asvany, O.; Schlemmer, S.; Szidarovszky, T.; Császár, A.G. Infrared Signatures of the and (n = 3–6) Complexes. J. Phys. Chem. Lett. 2019, 10, 5325–5330. [Google Scholar] [CrossRef] [PubMed]
- Kojima, T.M.; Kobayashi, N.; Kaneko, Y. Formation of helium cluster ions HHex+ (x ≤ 14) and H3Hex+ (x ≤ 13) in a very low temperature drift tube. Z Phys D - Atoms, Molecules and Clusters 1992, 23, 181–185. [Google Scholar] [CrossRef]
- Bartl, P.; Leidlmair, C.; Denifl, S.; Scheier, P.; Echt, O. Cationic Complexes of Hydrogen with Helium. Chem. Phys. Chem 2013, 14, 227–232. [Google Scholar] [CrossRef]
- Lundberg, L.; Bartl, P.; Leidlmair, C.; Scheier, P.; Gatchell, M. Protonated and Cationic Helium Clusters. Molecules 2020, 25. [Google Scholar] [CrossRef]
- Apkarian, V.A.; Schwentner, N. Molecular Photodynamics in Rare Gas Solids. Chem. Rev. 1999, 99, 1481–1514. [Google Scholar] [CrossRef] [PubMed]
- Beyer, M.; Lammers, A.; V. Savchenko, E.; Niedner-Schatteburg, G.; E. Bondybey, V. Proton solvated by noble-gas atoms: simplest case of a solvated ion. Phys. Chem. Chem. Phys. 1999, 1, 2213–2221. [CrossRef]
- Fridgen, T.D.; Parnis, J.M. Electron bombardment matrix isolation of Rg/Rg/methanol mixtures (Rg= Ar, Kr, Xe): Fourier-transform infrared characterization of the proton-bound dimers Kr2H+, Xe2H+, (ArHKr)+ and (ArHXe)+ in Ar matrices and (KrHXe)+ and Xe2H+ in Kr matrices. J. Chem. Phys. 1998, 109, 2155–2161. [Google Scholar] [CrossRef]
- Kunttu, H.; Seetula, J.; Räsänen, M.; Apkarian, V.A. Photogeneration of ions via delocalized charge transfer states. I. Xe2H+ and Xe2D+ in solid Xe. J. Chem. Phys. 1992, 96, 5630–5635. [Google Scholar] [CrossRef]
- Tøpfer, M.; Jensen, A.; Nagamori, K.; Kohguchi, H.; Szidarovszky, T.; Császár, A.G.; Schlemmer, S.; Asvany, O. Spectroscopic signatures of and . Phys. Chem. Chem. Phys. 2020. [Google Scholar] [CrossRef]
- Simkó, I.; Schran, C.; Brieuc, F.; Fábri, C.; Asvany, O.; Schlemmer, S.; Marx, D.; Császár, A.G. Quantum Nuclear Delocalization and its Rovibrational Fingerprints. Angew. Chem. Int. Ed. 2023, 62, e202306744. [Google Scholar] [CrossRef] [PubMed]
- Poshusta, R.D.; Haugen, J.A.; Zetik, D.F. Ab Initio Predictions for Very Small Ions. J. Chem. Phys. 1969, 51, 3343–3351. [Google Scholar] [CrossRef]
- Poshusta, R.D.; Siems, W.F. Ab Initio Calculations on He2H+. J. Chem. Phys. 1971, 55, 1995–1996. [Google Scholar] [CrossRef]
- Milleur, M.B.; Matcha, R.L.; Hayes, E.F. Theoretical studies of hydrogen-rare gas complexes: HenH and HenH+ clusters. J. Chem. Phys. 1974, 60, 674–679. [Google Scholar] [CrossRef]
- Dykstra, C.E. The strong hydrogen bond in HeHHe+ and its weak counterpart in He. J. Mol. Struct. THEOCHEM 1983, 103, 131–138. [Google Scholar] [CrossRef]
- Baccarelli, I.; Gianturco, F.A.; Schneider, F. Stability and fragmentation of protonated helium dimers from ab initio calculations of their potential energy surfaces. J. Phys. Chem. A 1997, 101, 6054–6062. [Google Scholar] [CrossRef]
- Kim, S.T.; Lee, J.S. Ab initio study of He2H+ and Ne2H+: accurate structure and energetics. J. Chem. Phys. 1999, 110, 4413–4418. [Google Scholar] [CrossRef]
- Filippone, F.; Gianturco, F.A. Charged chromophoric units in protonated rare-gas clusters: A dynamical simulation. Eur. Phys. Lett. 1998, 44, 585. [Google Scholar] [CrossRef]
- Fortenberry, R.C. Rovibrational Characterization and Interstellar Implications of the Proton-Bound, Noble Gas Complexes: ArHAr+, NeHNe+, and ArHNe+. ACS Earth Space Chem. 2017, 1, 60–69. [Google Scholar] [CrossRef]
- Stephan, C.J.; Fortenberry, R.C. The interstellar formation and spectra of the noble gas, proton-bound HeHHe+, HeHNe+ and HeHAr+ complexes. Mon. Notices Royal Astron. Soc. 2017, 469, 339–346. [Google Scholar] [CrossRef]
- Fortenberry, R.C.; Wiesenfeld, L. A Molecular Candle Where Few Molecules Shine: HeHHe+. Molecules 2020, 25, 2183. [Google Scholar] [CrossRef] [PubMed]
- Panda, A.; Sathyamurthy, N. Bound and Quasibound States of He2H+ and He2D+. J. Phys. Chem. A 2003, 107, 7125–7131. [Google Scholar] [CrossRef]
- Koner, D.; Barrios Herrera, L.; Gonzalez-Lezana, T.; Panda, A. Scattering study of the Ne + NeH+(v0 = 0, j0 = 0) → NeH+ + Ne reaction on an ab initio based analytical potential energy surface. J. Chem. Phys. 2016, 144, 034303. [Google Scholar] [CrossRef] [PubMed]
- Attila, G. Császár, Tamás Szidarovszky, O.A.; Schlemmer, S. Fingerprints of microscopic superfluidity in clusters. Mol. Phys. 2019, 117, 1559–1583. [Google Scholar]
- Lee, J.S.; Secrest, D. A calculation of the rotation–vibration states of He2H+. J. Chem. Phys. 1986, 85, 6565–6575. [Google Scholar] [CrossRef]
- Liang, J.J.; Yang, C.L.; Wang, L.Z.; Zhang, Q.G. A new analytical potential energy surface for the singlet state of He2H+. J. Chem. Phys. 2012, 136, 094307. [Google Scholar] [CrossRef]
- Grabowski, S.J.; Ugalde, J.M.; Andrada, D.M.; Frenking, G. Comparison of Hydrogen and Gold Bonding in [XHX]-, [XAuX]-, and Isoelectronic [NgHNg]+, [NgAuNg]+ (X=Halogen, Ng=Noble Gas). Eur. J. Chem. 2016, 22, 11317–11328. [Google Scholar] [CrossRef]
- Tan, J.A.; Kuo, J.L. A theoretical study on the infrared signatures of proton-bound rare gas dimers (Rg–H+–Rg), Rg=Ne, Ar, Kr, and Xe. J. Chem. Phys. 2019, 150, 124305. [Google Scholar] [CrossRef]
- Murrell, J.N. Molecular potential energy functions; Wiley, 1984.
- Polyansky, O.L.; Prosmiti, R; Klopper, W.; Tennyson, J. An accurate, global, ab initio potential energy surface for the molecule. Mol. Phys. 2000, 98, 261–273.
- Prosmiti, R.; Buchachenko, A.A.; Villarreal, P.; Delgado-Barrio, G. Modeling the potential-energy surface: a first attempt. Theor. Chem. Acc. 2001, 106, 426–433. [Google Scholar] [CrossRef]
- Huang, X.; Braams, B.; Bowman, J.; Kelly, R.; Tennyson, J.; Groenenboom, G.; van der Avoird, A. New ab initio potential energy surface and the vibration-rotation-tunneling levels of (H2O)2 and (D2O)2. J. Chem. Phys. 2008, 128, 034312. [Google Scholar] [CrossRef] [PubMed]
- Braams, B.; Bowman, J. Permutationally invariant potential energy surfaces in high dimensionality. Int. Rev. Phys. Chem. 2009, 28, 577–606. [Google Scholar] [CrossRef]
- Aguado, A.; Barragán, P.; Prosmiti, R.; Villarreal, G.D.B.P.; Roncero, O. A new accurate and full dimensional potential energy surface of based on a triatomics-in-molecules analytic functional form. J. Chem. Phys. 2010, 133, 024306. [Google Scholar] [CrossRef] [PubMed]
- Barragán, P.; Prosmiti, R.; Wang, Y.; Bowman, J. Full-dimensional (15-dimensional) ab initio analytical potential energy surface for the | cluster. J. Chem. Phys. 2012, 136, 224302. [Google Scholar] [CrossRef]
- Arismendi-Arrieta, D.; Riera, M.; Bajaj, P.; Prosmiti, R.; Paesani, F. i-TTM Model for AbInitio-Based Ion-Water Interaction Potentials. 1. Halide-Water Potential Energy Functions. J. Phys. Chem. B 2016, 120, 1822–1832. [Google Scholar] [CrossRef]
- Goncalves, C.; Galvão, B.R.; Mota, V.; Braga, J.; Varandas, A. Accurate Explicit-Correlation-MRCI-Based DMBE Potential-Energy Surface for Ground-State CNO. J. Phys. Chem. A 2018, 122, 4198–4207. [Google Scholar] [CrossRef]
- Behler, J.; Parrinello, M. Generalized Neural-Network Representation of High-Dimensional Potential-Energy Surfaces. Phys. Rev. Lett. 2007, 98, 146401. [Google Scholar] [CrossRef]
- Behler, J. Perspective: Machine learning potentials for atomistic simulations. J. Chem. Phys. 2016, 145, 170901. [Google Scholar] [CrossRef]
- Manzhos, S.; Carrington, T.J. Neural Network Potential Energy Surfaces for Small Molecules and Reactions. Chem. Rev. 2021, 121, 10187–10217. [Google Scholar] [CrossRef]
- Unke, O.T.; Koner, D.; Patra, S.; Käser, S.; Meuwly, M. High-dimensional potential energy surfaces for molecular simulations: from empiricism to machine learning. Mach. Learn. Sci. Technol. 2020, 1, 013001. [Google Scholar] [CrossRef]
- Noe, F.; Tkatchenko, A.; Muller, K.R.; Clementi, C. Machine Learning for Molecular Simulation. Annu. Rev. Phys. Chem. 2020, 71, 361–390. [Google Scholar] [CrossRef]
- Dral, P. Quantum Chemistry in the Age of Machine Learning. J. Phys. Chem. Lett. 2020, 11, 2336–2347. [Google Scholar] [CrossRef] [PubMed]
- Gao, X.; Ramezanghorbani, F.; Isayev, O.; Smith, J.; Roitberg, A. TorchANI: A Free and Open Source PyTorch-Based Deep Learning Implementation of the ANI Neural Network Potentials. J. Chem. Inf. Model. 2020, 60, 3408–3415. [Google Scholar] [CrossRef]
- Unke, O.T.; Chmiela, S.; Sauceda, H.E.; Gastegger, M.; Poltavsky, I.; Schütt, K.T.; Tkatchenko, A.; Müller, K.R. Machine Learning Force Fields. Chem. Rev. 2021, 121, 10142–10186. [Google Scholar] [CrossRef] [PubMed]
- Pinheiro, M.; Ge, F.; Ferré, N.; Dral, P.O.; Barbatti, M. Choosing the right molecular machine learning potential. Chem. Sci. 2021, 12, 14396–14413. [Google Scholar] [CrossRef] [PubMed]
- Montes de Oca-Estévez, M.J.; Prosmiti, R. Quantum computations in heavy noble-gas hydride cations: Reference energies and new spectroscopic data. J. Mol. Graph. Model. 2023, 124, 108562. [Google Scholar] [CrossRef]
- Montes de Oca-Estévez, M.J.; Valdés, Á.; Prosmiti, R. A kernel-based machine learning potential and quantum vibrational state analysis of the cationic Ar hydride (Ar2H+). Phys. Chem. Chem. Phys. 2024, 8, 7060–7071. [Google Scholar] [CrossRef]
- Montes de Oca-Estévez, M.J.; Valdés, Á.; Koner, D.; González-Lezana, T.; Prosmiti, R. Quantum computations on a new neural network potential for the proton-bound noble-gas Ar2H+ complex: Isotopic effects. Chem. Phys. Letts. 2024, 856, 141641. [Google Scholar] [CrossRef]
- Montes de Oca-Estévez, M.J.; Prosmiti, R. Microsolvation of a Proton by Ar Atoms: Structures and Energetics of ArnH+ Clusters. Molecules 2024, 29. [Google Scholar] [CrossRef]
- Dral, P. MLatom: A program package for quantum chemical research assisted by machine learning. J. Comput. Chem. 2019, 40, 2339–2347. [Google Scholar] [CrossRef]
- Abbott, A.; Turney, J.; Zhang, B.; Smith, D.; Altarawy, D.; Schaefer, H. PES-Learn: An Open-Source Software Package for the Automated Generation of Machine Learning Models of Molecular Potential Energy Surfaces. J. Chem. Theory Comput. 2019, 15, 4386–4398. [Google Scholar] [CrossRef] [PubMed]
- Unke, O.; Meuwly, M. PhysNet: A Neural Network for Predicting Energies, Forces, Dipole Moments, and Partial Charges. J. Chem. Theory Comput. 2019, 15, 3678–3693. [Google Scholar] [CrossRef]
- Chmiela, S.; Sauceda, H.; Poltavsky, I.; Müller, K.R.; Tkatchenko, A. sGDML: Constructing accurate and data efficient molecular force fields using machine learning. Comput. Phys. Commun. 2019, 240, 38–45. [Google Scholar] [CrossRef]
- Shao, Y.; Hellström, M.; P.D. Mitev, L.K.; Zhang, C. PiNN: A Python Library for Building Atomic Neural Networks of Molecules and Materials. J. Chem. Inf. Model. 2020, 60, 1184–1193. [CrossRef]
- Ho, T.; Rabitz, H. A general method for constructing multidimensional molecular potential energy surfaces from ab initio calculations. J. Chem. Phys. 1996, 104, 2584–2597. [Google Scholar] [CrossRef]
- T. Hollebeek, T.S.H.; Rabitz, H. A fast algorithm for evaluating multidimensional potential energy surfaces. J. Chem. Phys. 1997, 106, 72223–7227.
- T. Hollebeek, T.S.H.; Rabitz, H. Constructing multidimensional molecular potential energy surfaces from ab initio data. Ann. Rev. Phys. Chem. 1999, 50, 537–570. [CrossRef]
- Ho, T.; Rabitz, H. Proper construction of ab initio global potential surfaces with accurate long-range interactions. J. Chem. Phys. 2000, 113, 3960–3968. [Google Scholar] [CrossRef]
- Ho, T.; Rabitz, H. Reproducing kernel Hilbert space interpolation methods as a paradigm of high dimensional model representations: Application to multidimensional potential energy surface construction. J. Chem. Phys. 2003, 119, 6433–6442. [Google Scholar] [CrossRef]
- Delgado-Tellez, L.; Valdés, A.; Prosmiti, R.; Villarreal, P.; Delgado-Barrio, G. HeI2 interaction potential based on an interpolation scheme. Int. J. Quantum Chem. 2012, 112, 2971–2975. [Google Scholar] [CrossRef]
- Kalemos, A.; Valdés, A.; Prosmiti, R. Theoretical investigation of the HeI2(E3Πg) ion-pair state: Ab initio intermolecular potential and vibrational levels. J. Chem. Phys. 2012, 137, 034303. [Google Scholar] [CrossRef]
- N. Alharzali, H. Berriche, P.V.; Prosmiti, R. Theoretical Study of Cationic Alkali Dimers Interacting with He: L-He and N-He van der Waals Complexes. J. Phys. Chem. A 2019, 123, 7814–7821. [CrossRef]
- N. Alharzali, R.R.S.; Prosmiti, R. Modelling interactions of cationic dimers in He droplets: microsolvation trends in Hen clusters. Phys. Chem. Chem. Phys. 2021, 23, 7849–7859. [CrossRef] [PubMed]
- Werner, H.J.; Knowles, P.J.; Knizia, G.; Manby, F.R.; Schütz, M.; et al. MOLPRO, version 2012.1, a package of ab initio programs. Available online: http://www.molpro.net.
- DENEB 1.30 beta: The Nanotechnology Software by Atelgraphics. http://www.atelgraphics.com, 2020.
- Montes de Oca-Estévez, M.J.; Prosmiti, R. Computational Characterization of Astrophysical Species: The Case of Noble Gas Hydride Cations. Front. Chem. 2021, 9, 187. [Google Scholar] [CrossRef] [PubMed]
- Schwartz, C. Importance of Angular Correlations between Atomic Electrons. Phys. Rev. 1962, 126, 1015–1019. [Google Scholar] [CrossRef]
- Worth, G.A.; Beck, M.H.; Jäckle, A.; Meyer, H.D. The MCTDH Package, Version 8.2, (2000). H.-D. Meyer, Version 8.3 (2002), Version 8.4 (2007). See http://mctdh.uni-hd.de, 2007.
- Zhang, J.Z.H. Theory and Application of Quantum Molecular Dynamics; World Scientific: Singapore, 1999. [Google Scholar]
- Sukiasyan, S.; Meyer, H.D. On the Effect of Initial Rotation on Reactivity. A Multi-Configuration Time-Dependent Hartree (MCTDH) Wave Packet Propagation Study on the H + D2 and D + H2 Reactive Scattering Systems. J. Phys. Chem. A 2001, 105, 2604–2611. [Google Scholar] [CrossRef]
- Meyer, H.D.; Manthe, U.; Cederbaum, L.S. The Multi-Configurational Time-Dependent Hartree Approach. Chem. Phys. Lett. 1990, 165, 73–78. [Google Scholar] [CrossRef]
- Beck, M.H.; Jäckle, A.; Worth, G.A.; Meyer, H.D. The Multiconfiguration Time-Dependent Hartree Method: A Highly Efficient Algorithm for Propagating Wavepackets. Phys. Rep. 2000, 324, 1–105. [Google Scholar] [CrossRef]
- Meyer, H.D. Studying Molecular Quantum Dynamics with the Multiconfiguration Time-Dependent Hartree Method. WIREs Comput. Mol. Sci. 2012, 2, 351–374. [Google Scholar] [CrossRef]
- Jäckle, A.; Meyer, H.D. Product representation of potential energy surfaces. II. J. Chem. Phys. 1998, 109, 3772–3779. [Google Scholar] [CrossRef]
- Meyer, H.D.; Quéré, F.L.; Léonard, C.; Gatti, F. Calculation and Selective Population of Vibrational Levels with the Multiconfiguration Time-Dependent Hartree (MCTDH) Algorithm. Chem. Phys. 2006, 329, 179–192. [Google Scholar] [CrossRef]
- Doriol, L.J.; Gatti, F.; Iung, C.; Meyer, H.D. Computation of Vibrational Energy Levels and Eigenstates of Fluoroform Using the Multiconfiguration Time-Dependent Hartree Method. J. Chem. Phys. 2008, 129, 224109–1–9. [Google Scholar] [CrossRef] [PubMed]
Figure 1.
Optimized energy structures (global and local minima, transition state) together with their partial and total dissociation energies for the [ (left panel) and [ (right panel) from the CCSD(T)/AV6Z computations.
Figure 1.
Optimized energy structures (global and local minima, transition state) together with their partial and total dissociation energies for the [ (left panel) and [ (right panel) from the CCSD(T)/AV6Z computations.
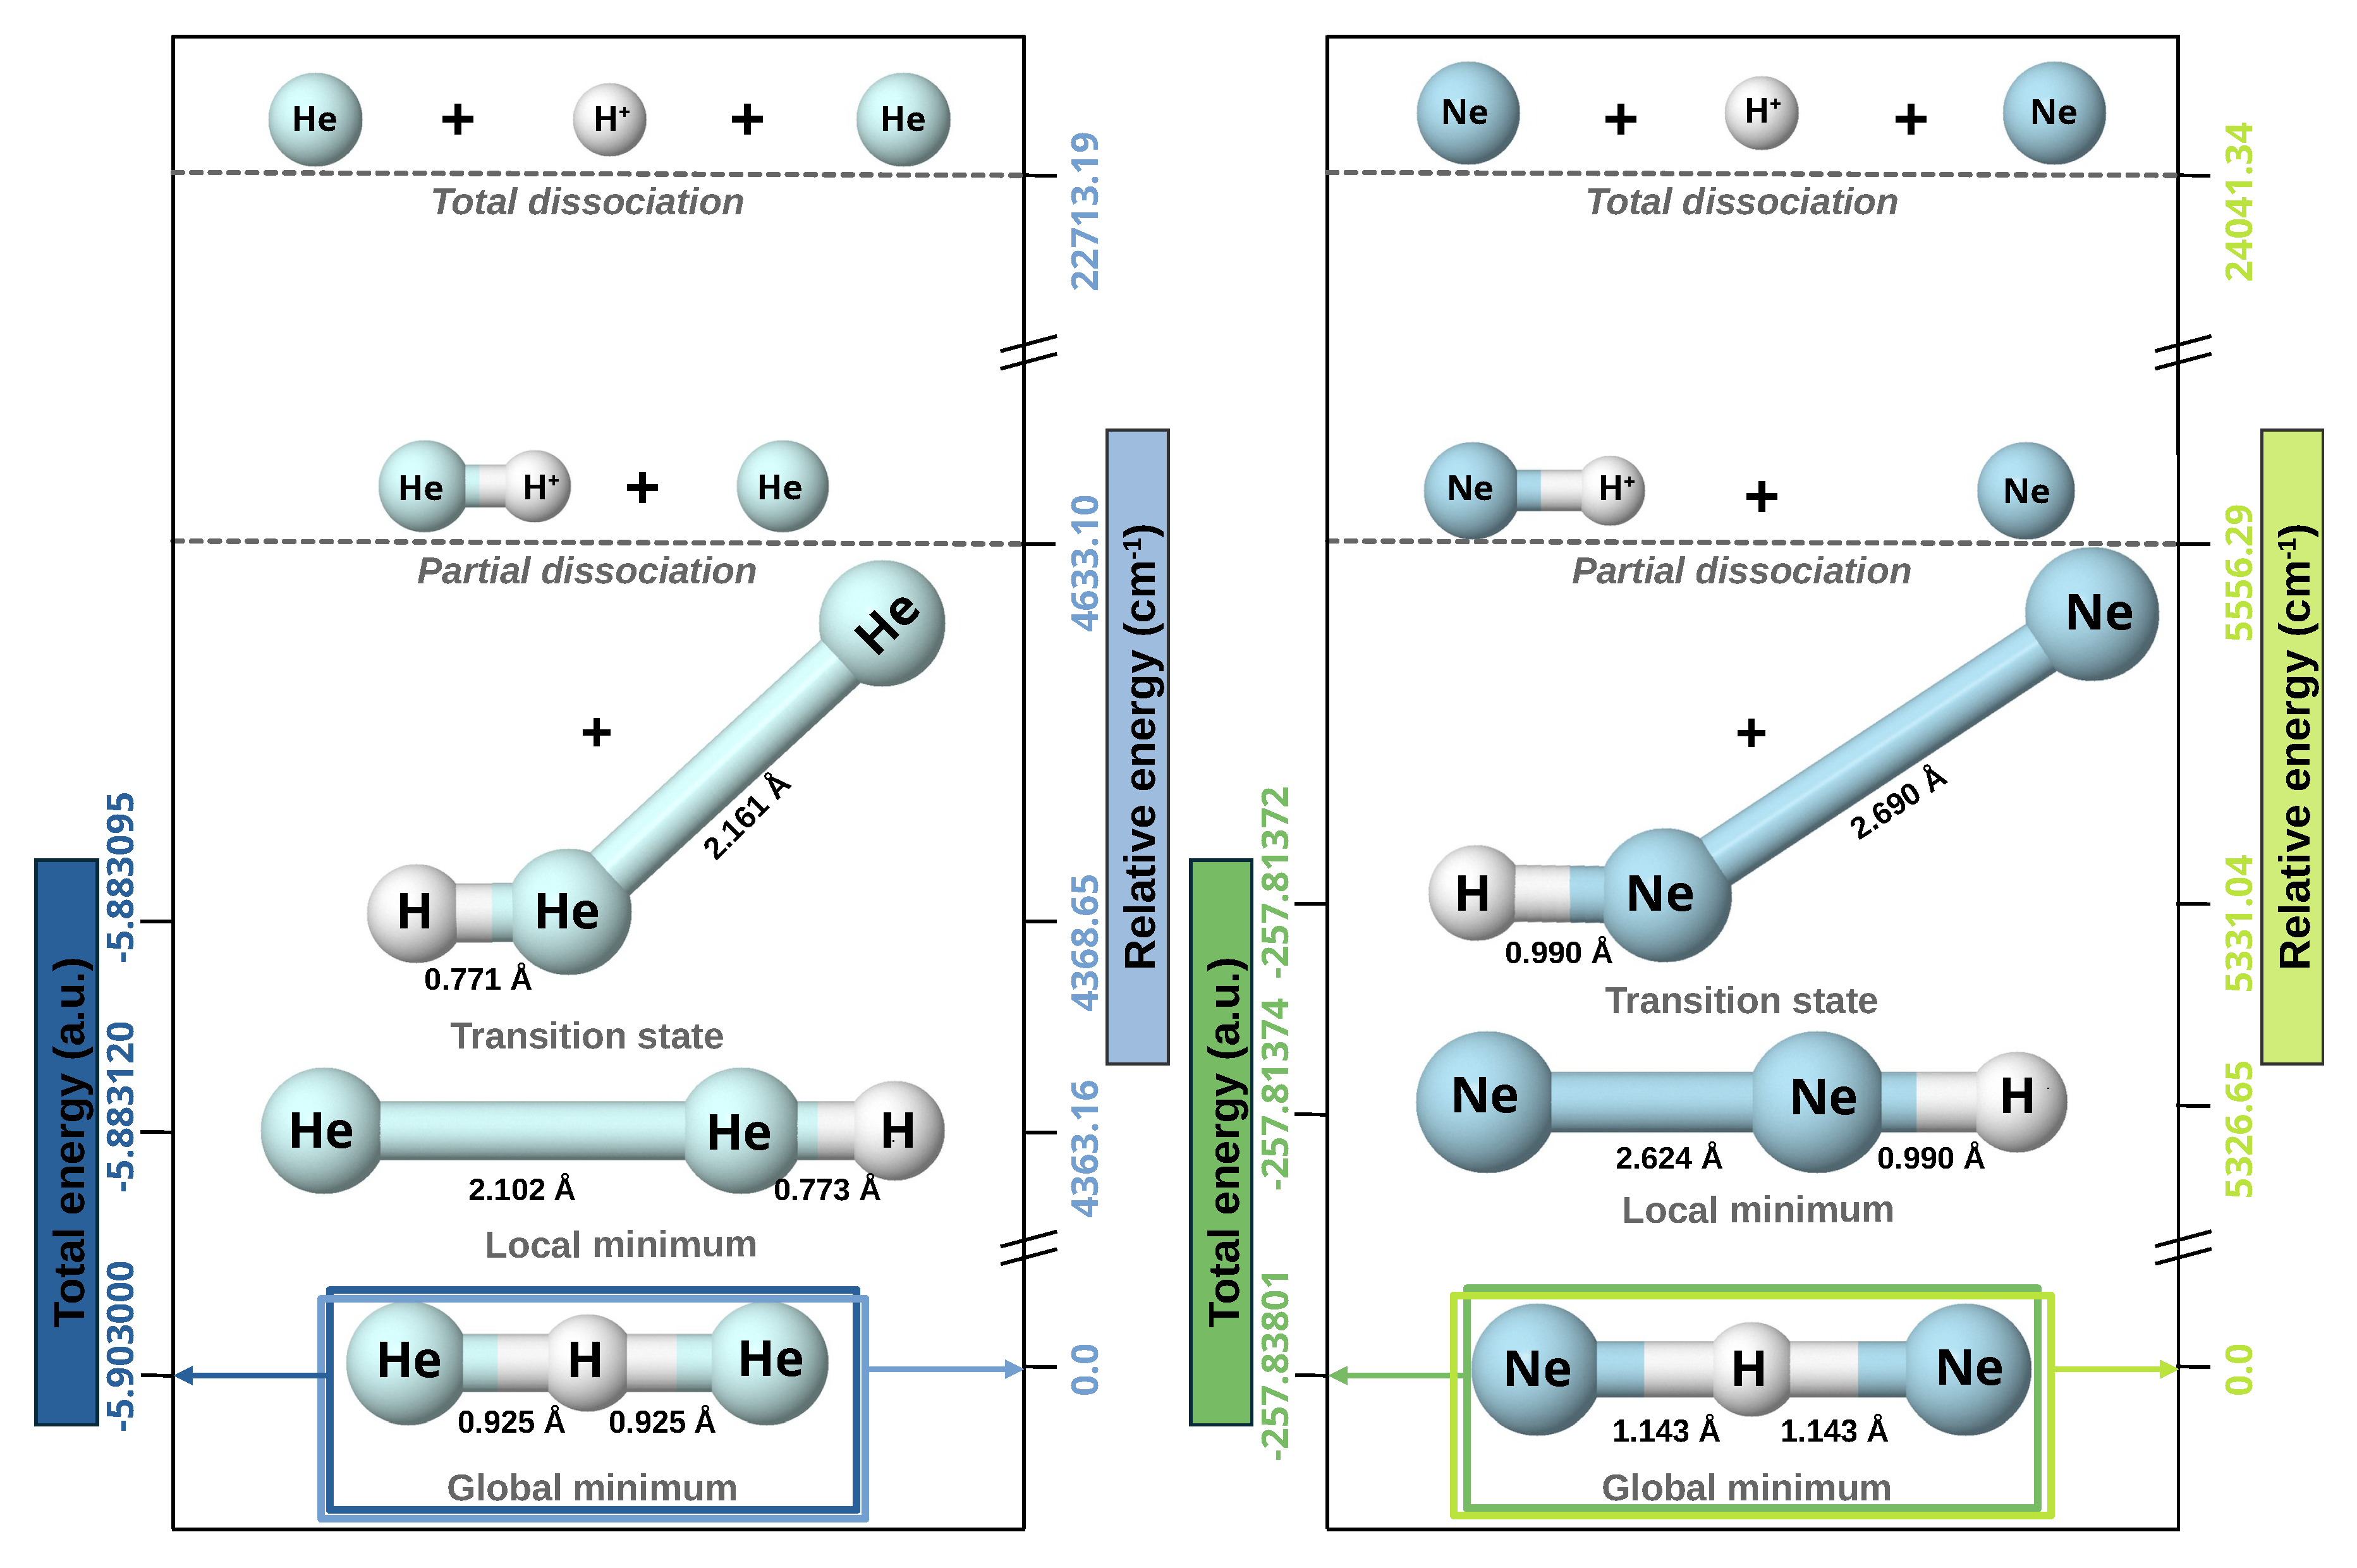
Figure 2.
Cumulative number of configurations vs CCSD(T)/CBS[56] energies for the indicated training and testing set sizes for [ (left panel) and [ (right panel). The dashed lines indicate the + Ng dissociation thresholds.
Figure 2.
Cumulative number of configurations vs CCSD(T)/CBS[56] energies for the indicated training and testing set sizes for [ (left panel) and [ (right panel). The dashed lines indicate the + Ng dissociation thresholds.
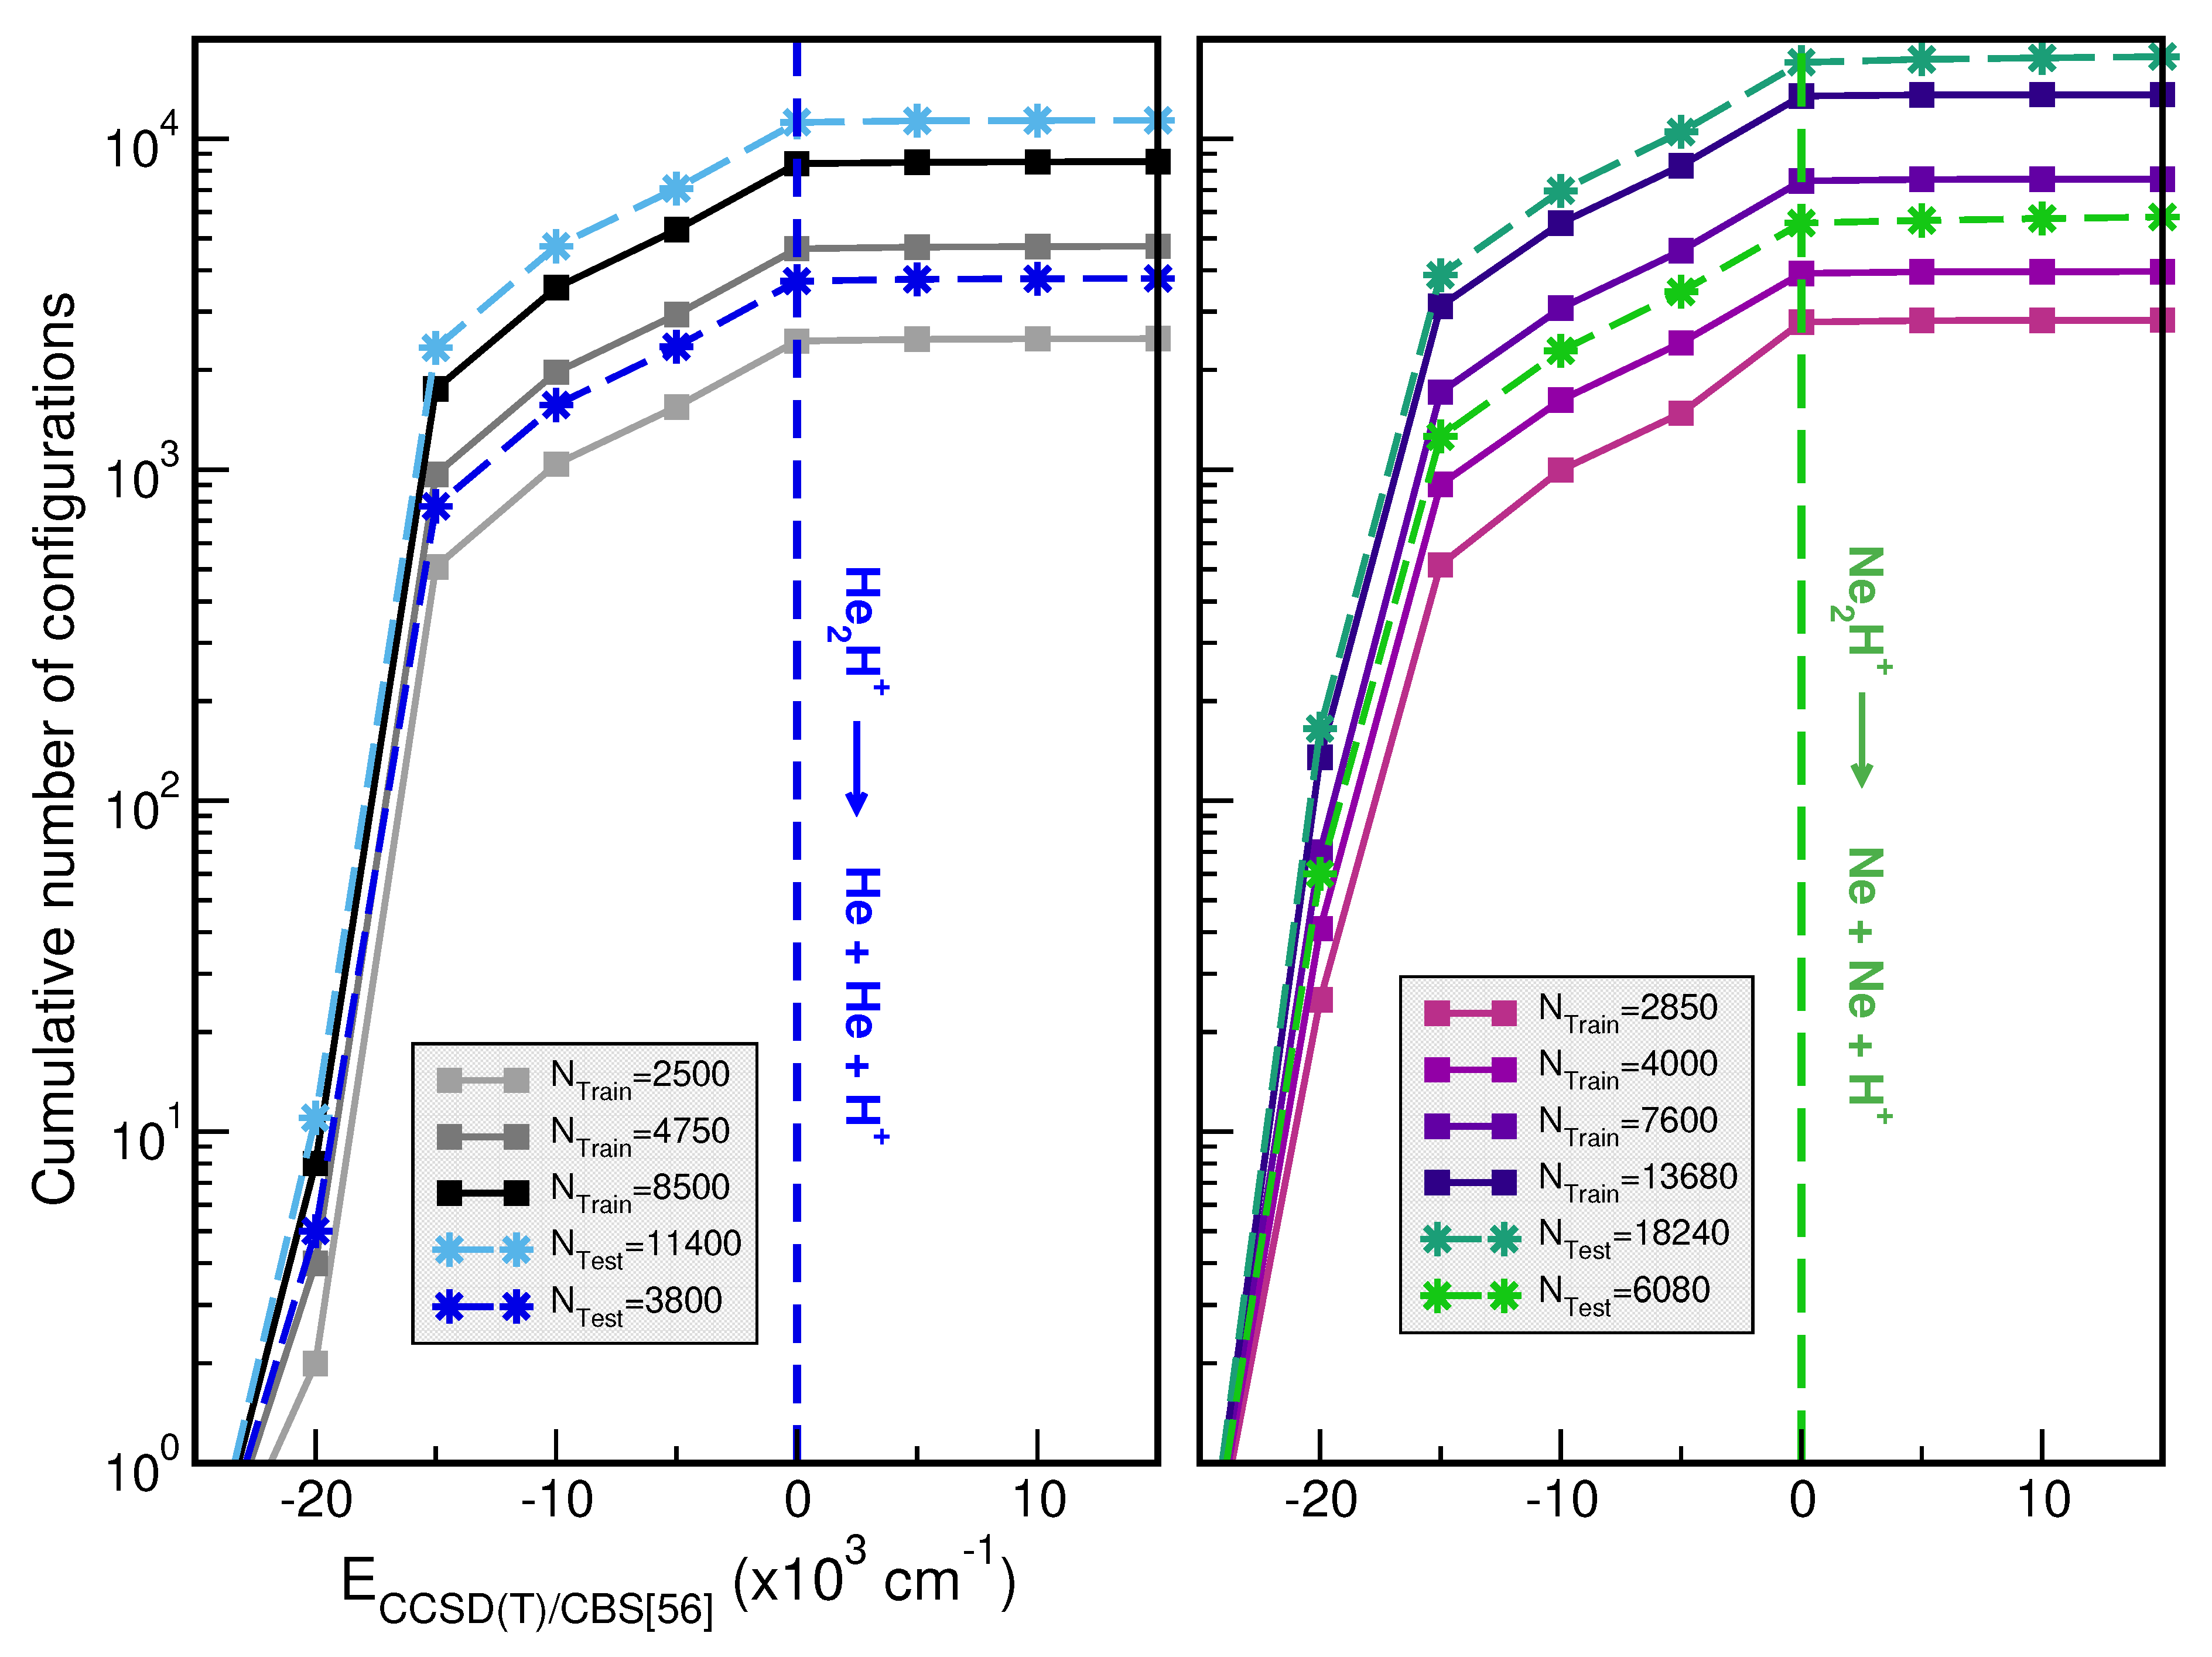
Figure 3.
Correlation plots comparing the performance of the RKHS ML-PES with respect the reference CCSD(T)/CBS[56] testing set energies (upper panel) of [ cation. The averaged RMSE and MAE values are also shown as a function of CCSD(T)/CBS[56] energy ranges (upper panel). The total average RMSE values of the RKHS models vs the number of training and testing datasets are plotted in the lower panel.
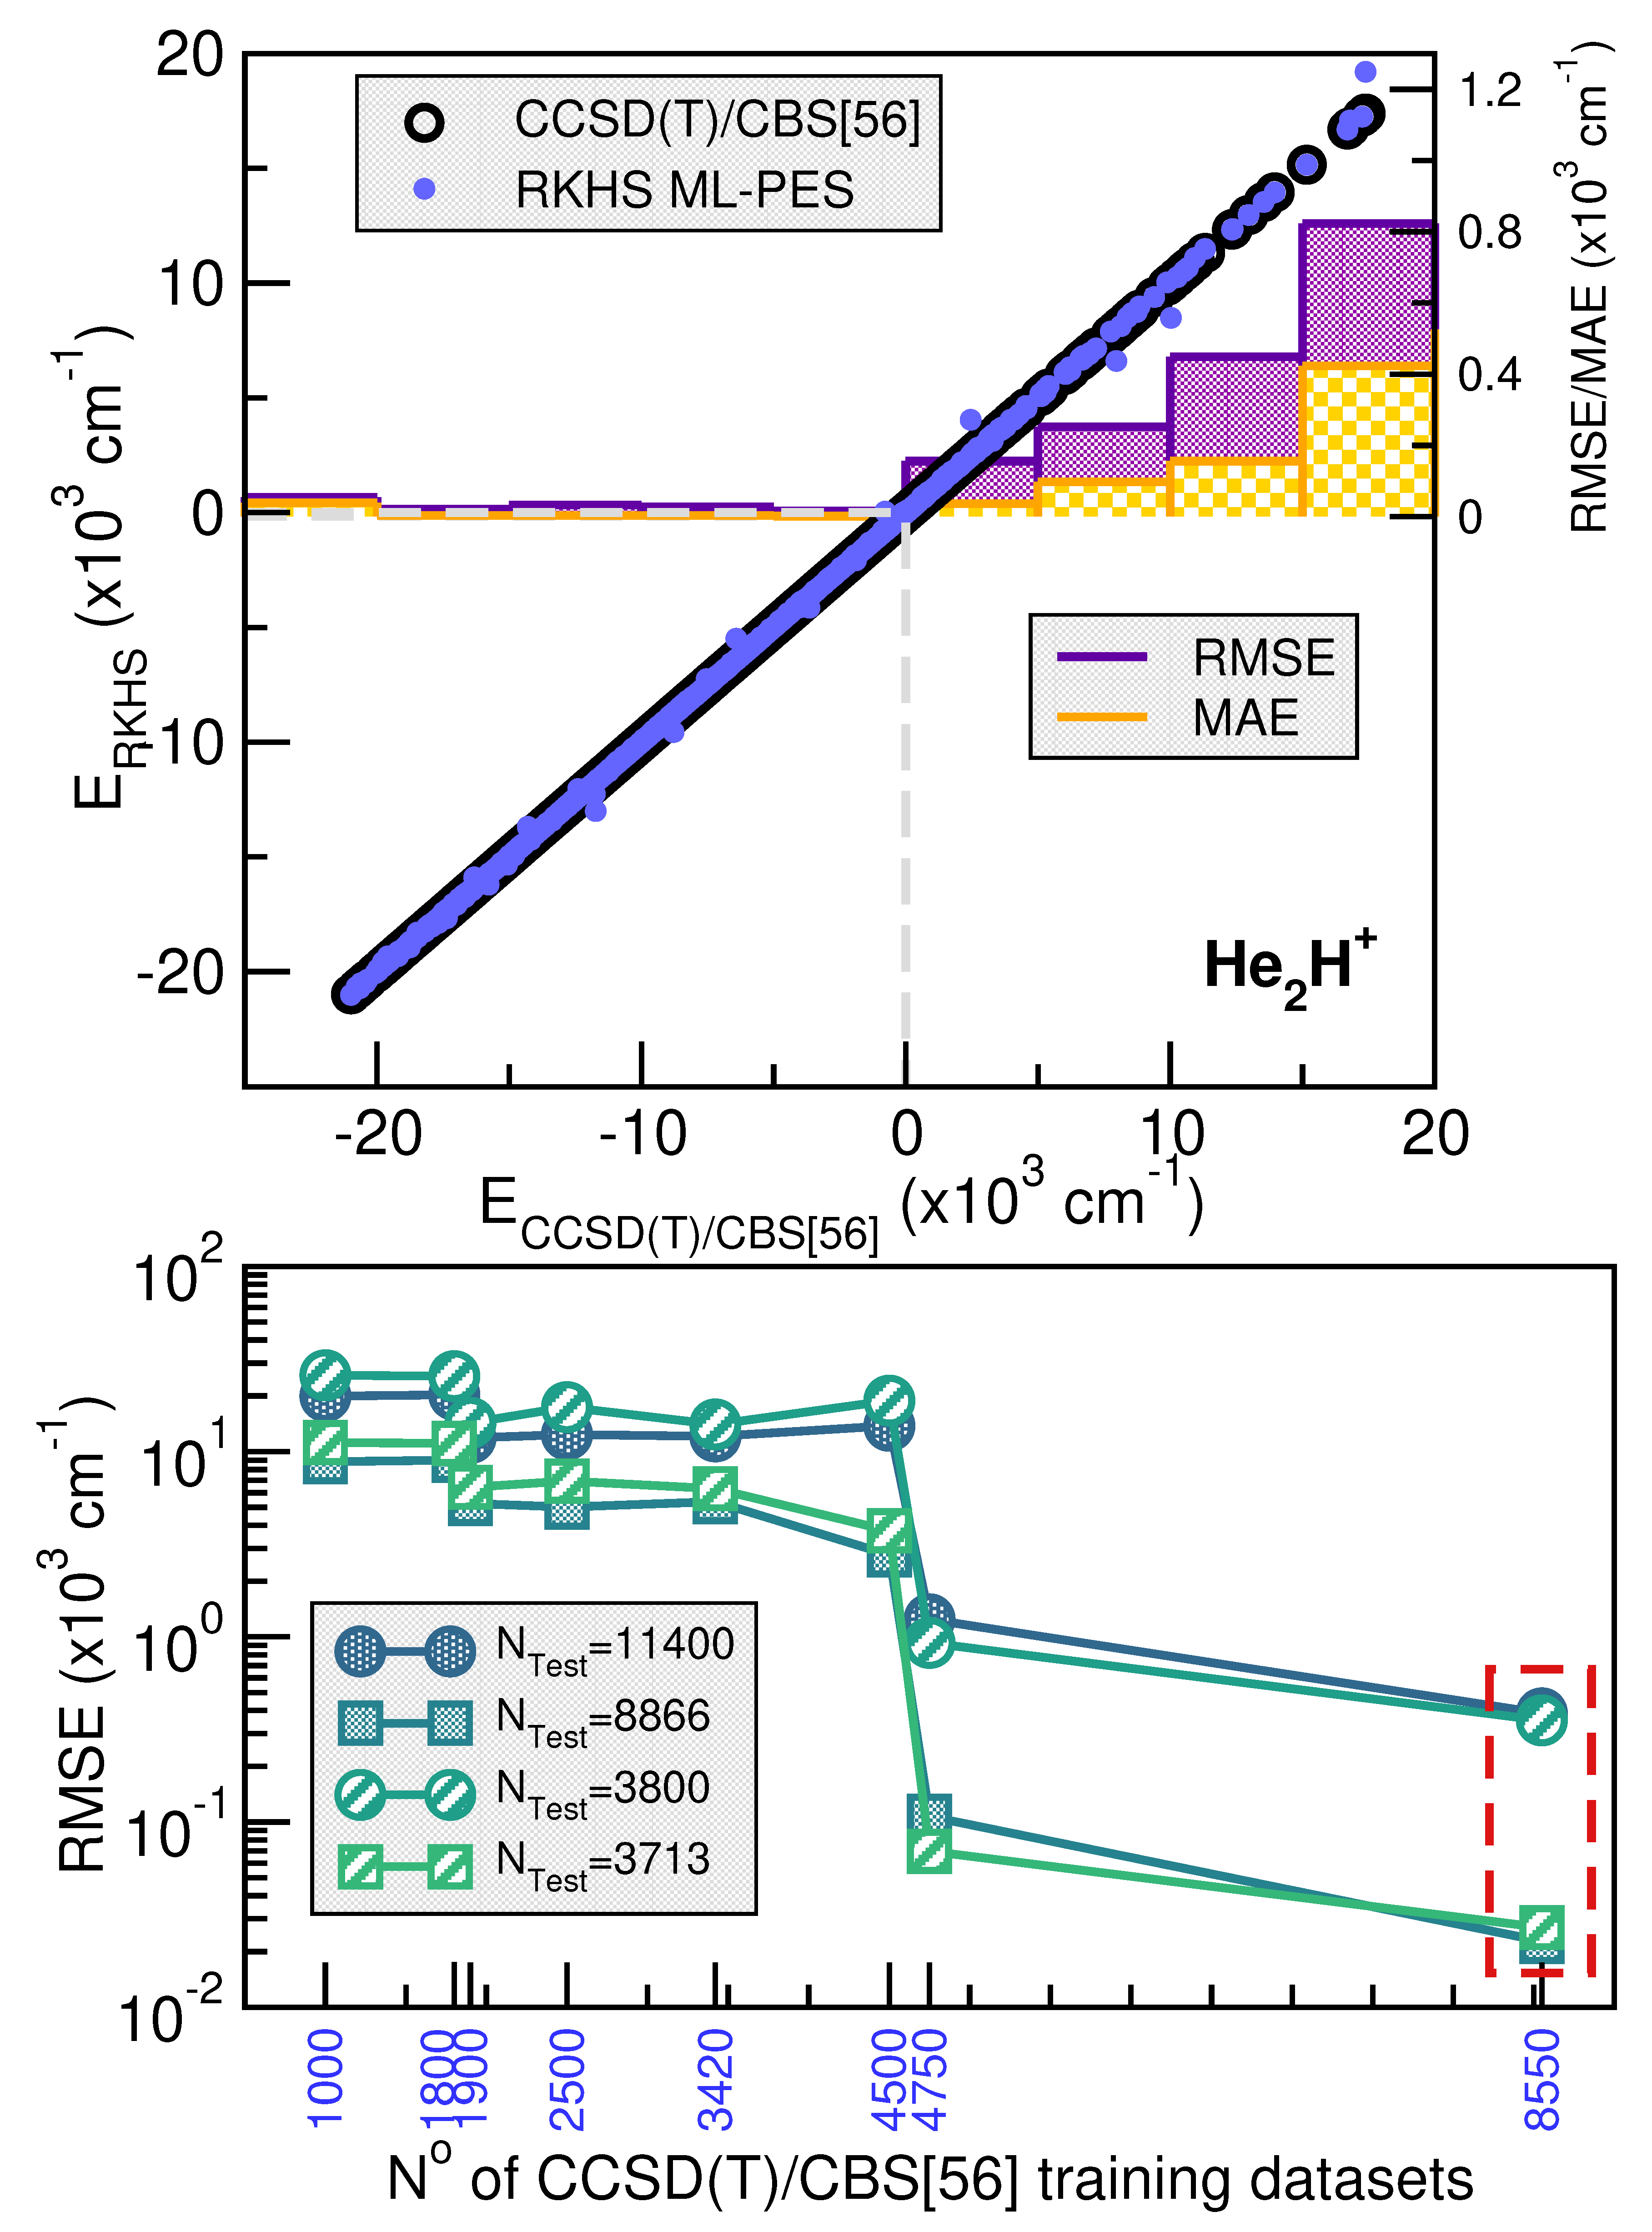
Figure 4.
Same as Figure 3 for the [ cation.
Figure 4.
Same as Figure 3 for the [ cation.
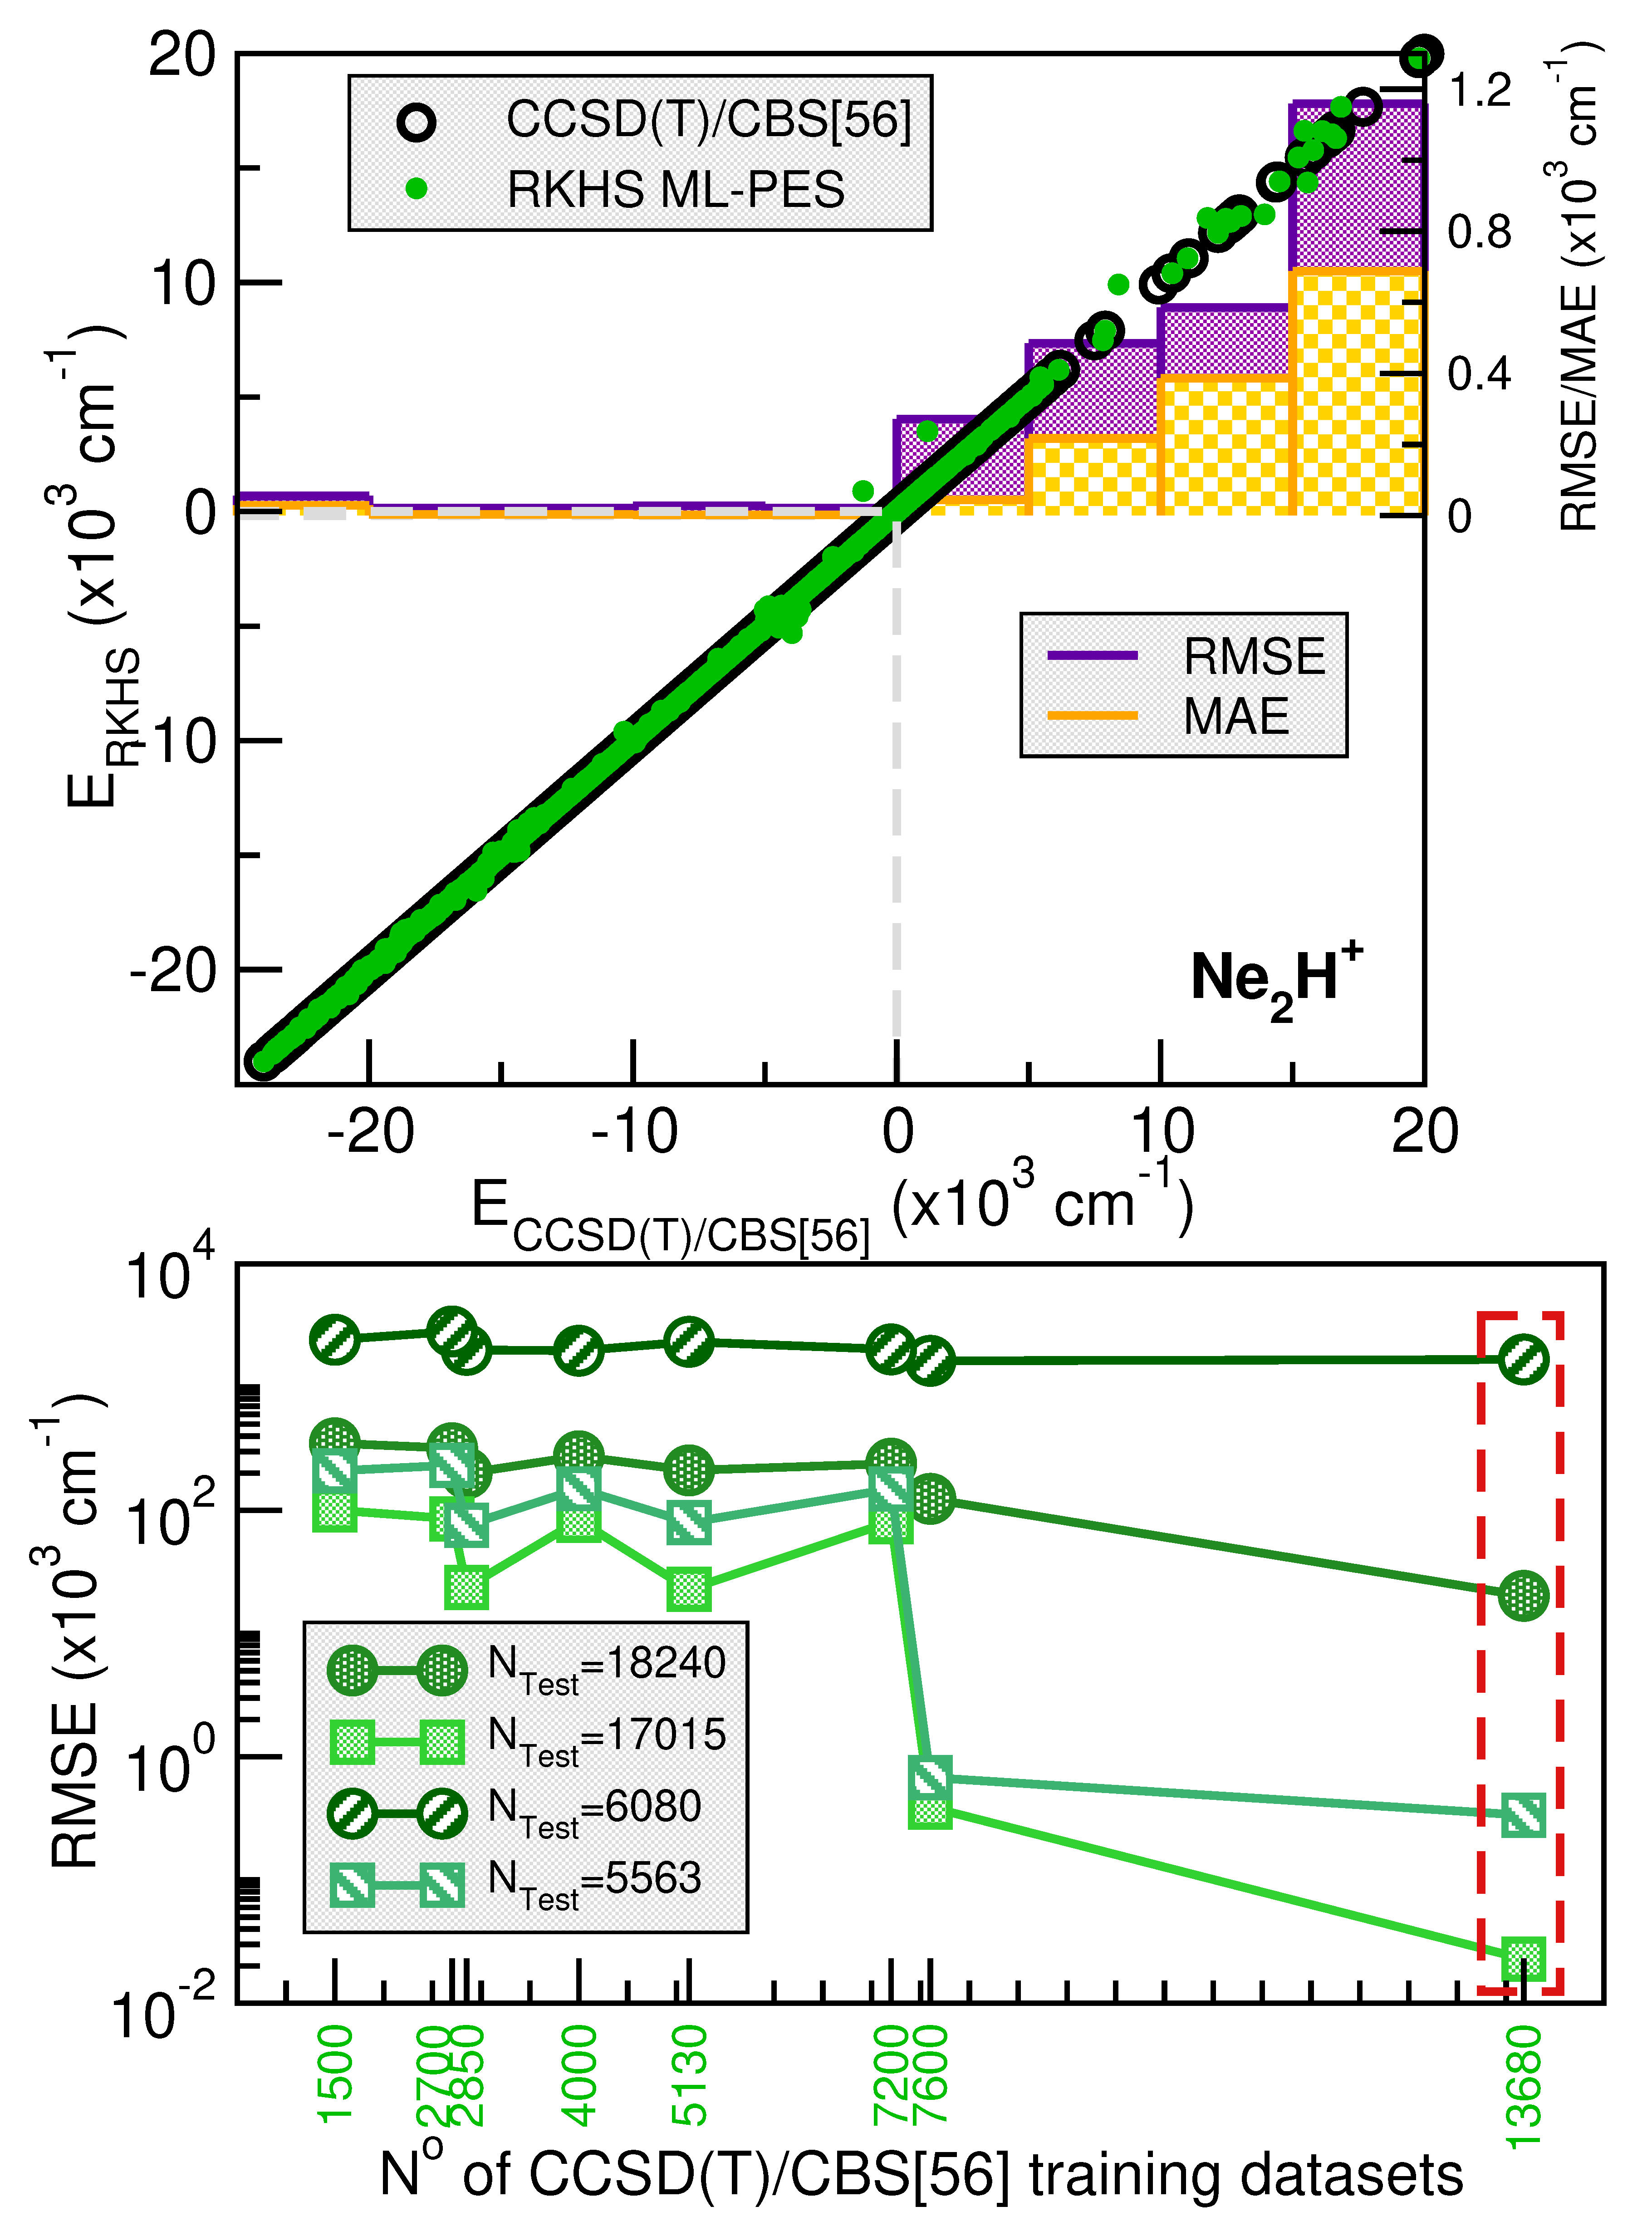
Figure 5.
Potential curves for the [ complex as a function or r (upper panels) in its linear (left panel) and antilinear (right panel) configurations with the R distance fixed at the indicated values, and as a function of R (middle panels) for the indicated values for r=0.9 Å (left panel) and 1.35 Å (right panel). Minimum energy path values as a function of angles (lower panel) are plotted for the [ with the corresponding vibrational energy levels (,,) from the MCTDH calculations superimposed. The CCSD(T)/CBS[56] energies are shown in solid circles, while the RKHS ML-PES values in solid lines. The dashed blue lines indicate the + He dissociation threshold.
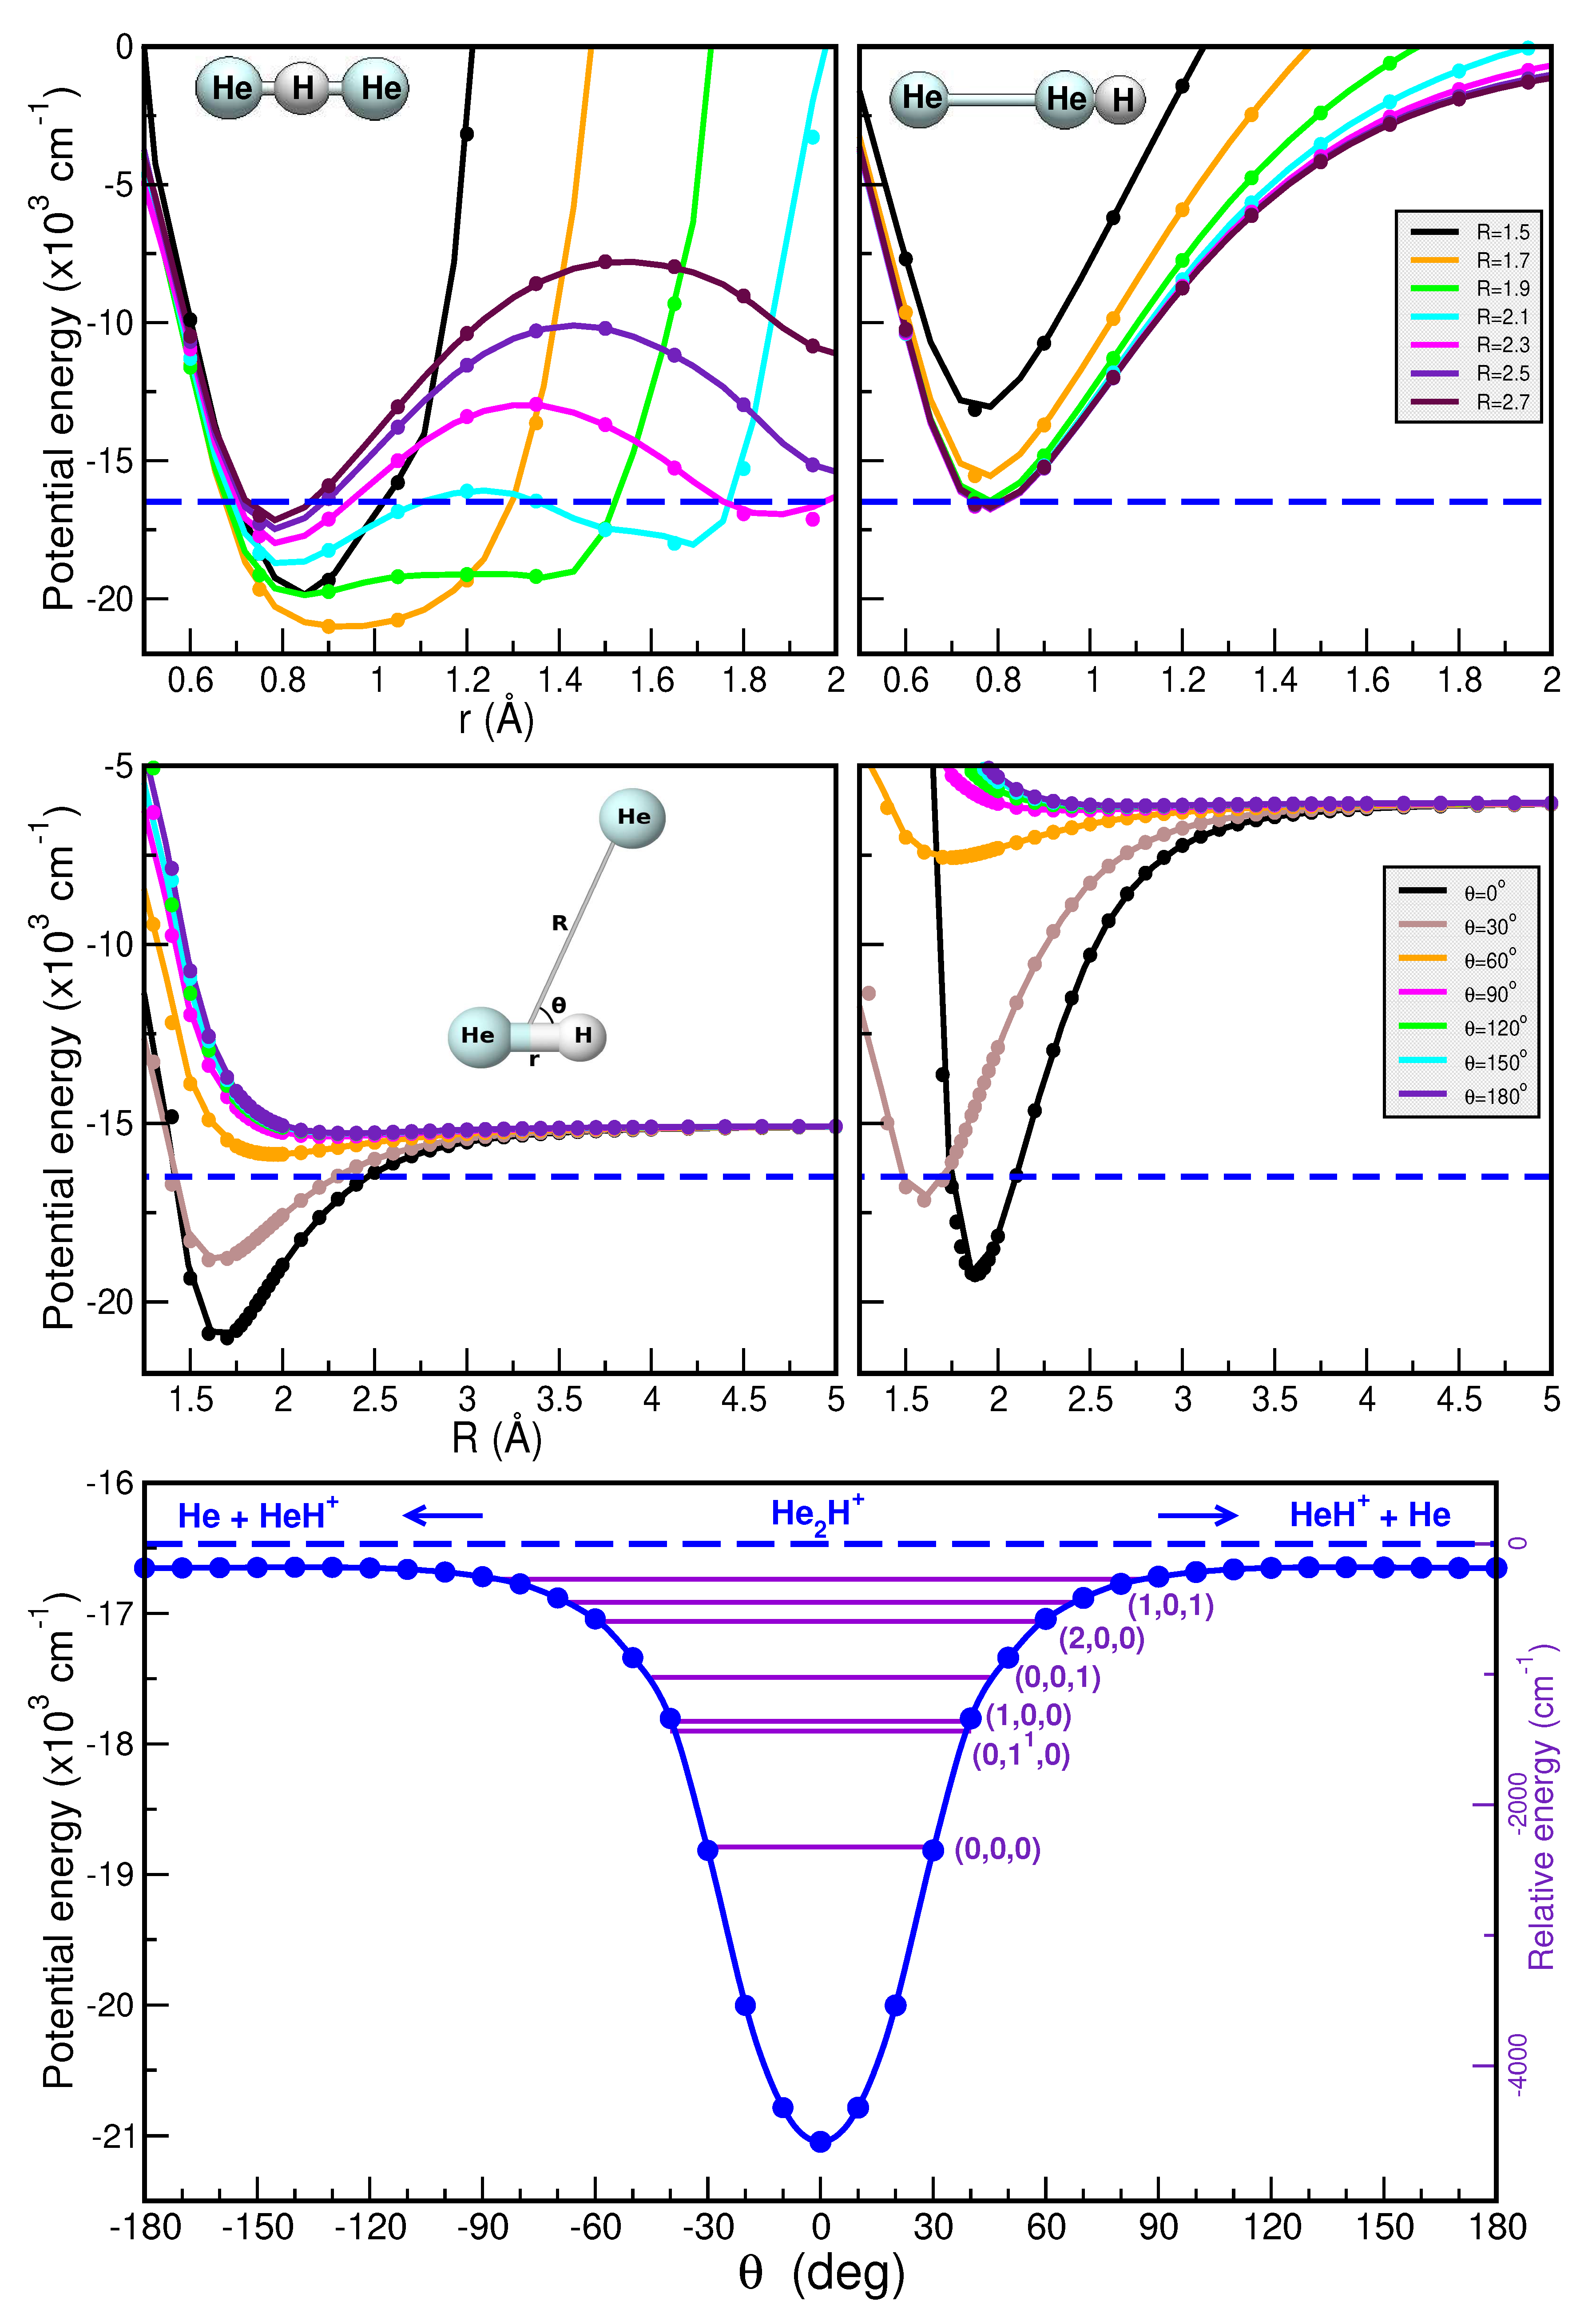
Figure 6.
Same as Figure 5 for the [ molecule, for r=1.15 Å (left middle panel) and 1.55 Å (right middle panel). The dashed green lines indicate the + Ne dissociation threshold.
Figure 6.
Same as Figure 5 for the [ molecule, for r=1.15 Å (left middle panel) and 1.55 Å (right middle panel). The dashed green lines indicate the + Ne dissociation threshold.
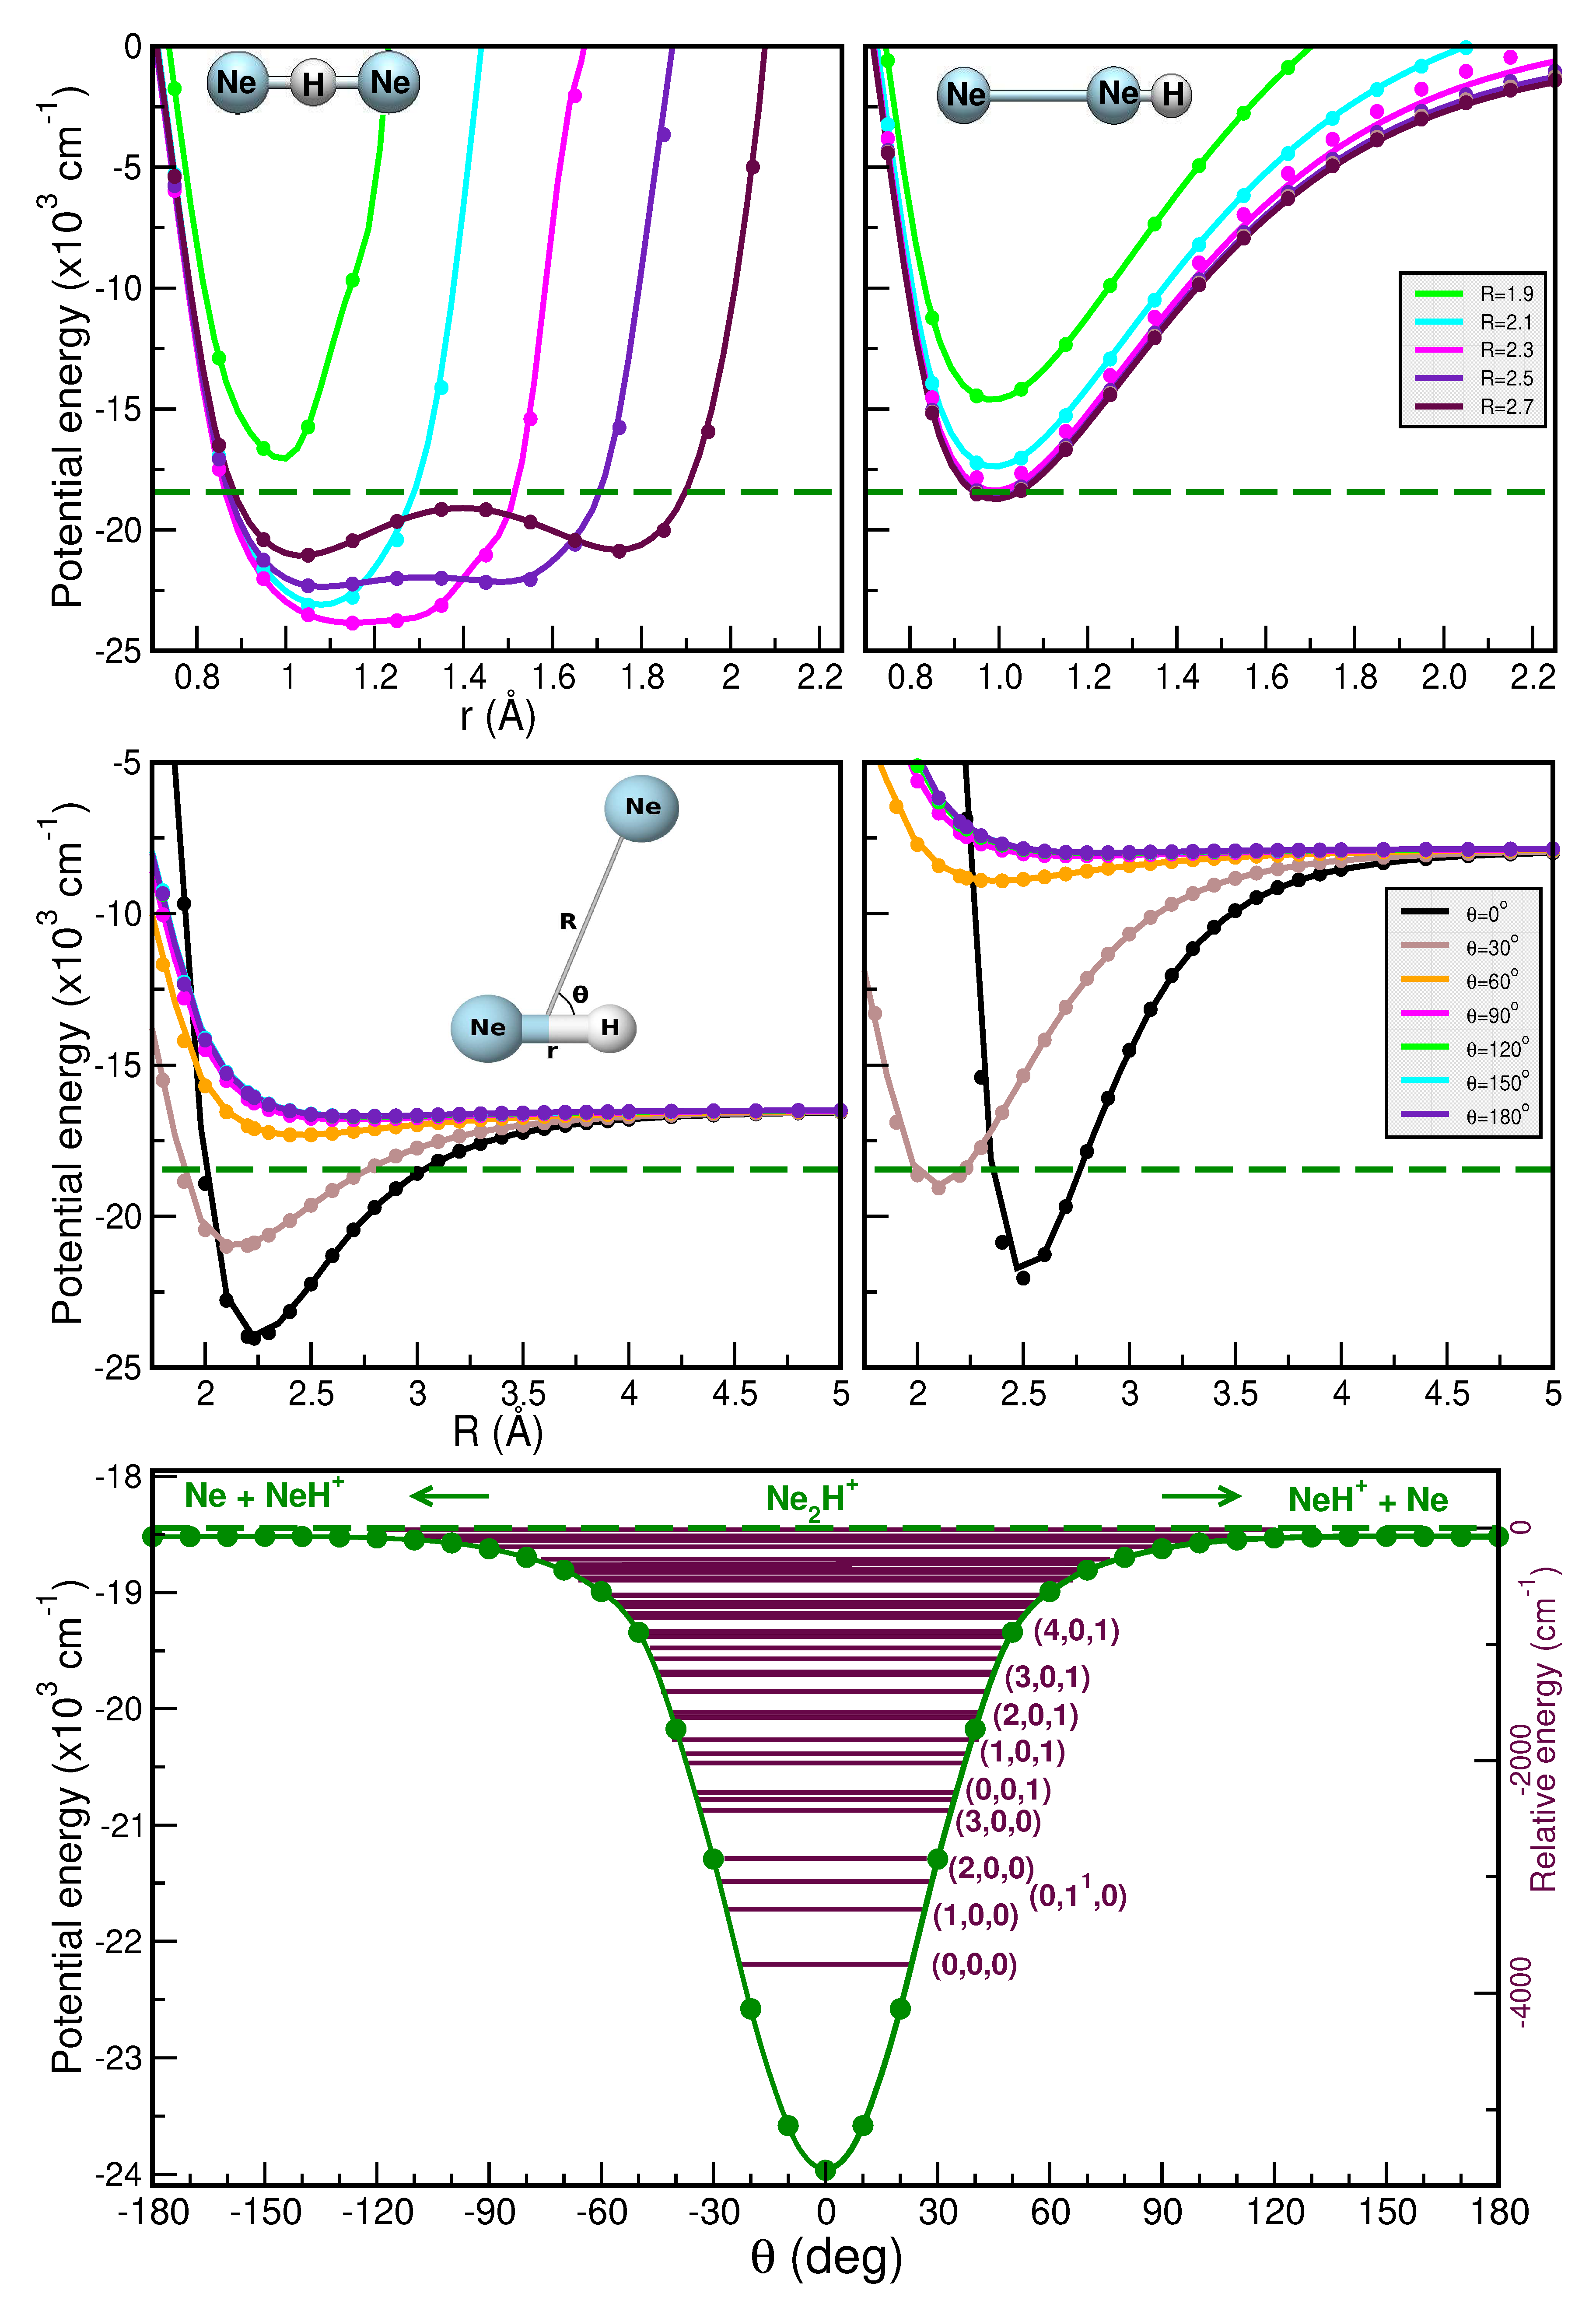
Figure 7.
Comparison of the calculated and experimental [8,22,23] rovibrational transitions for the .
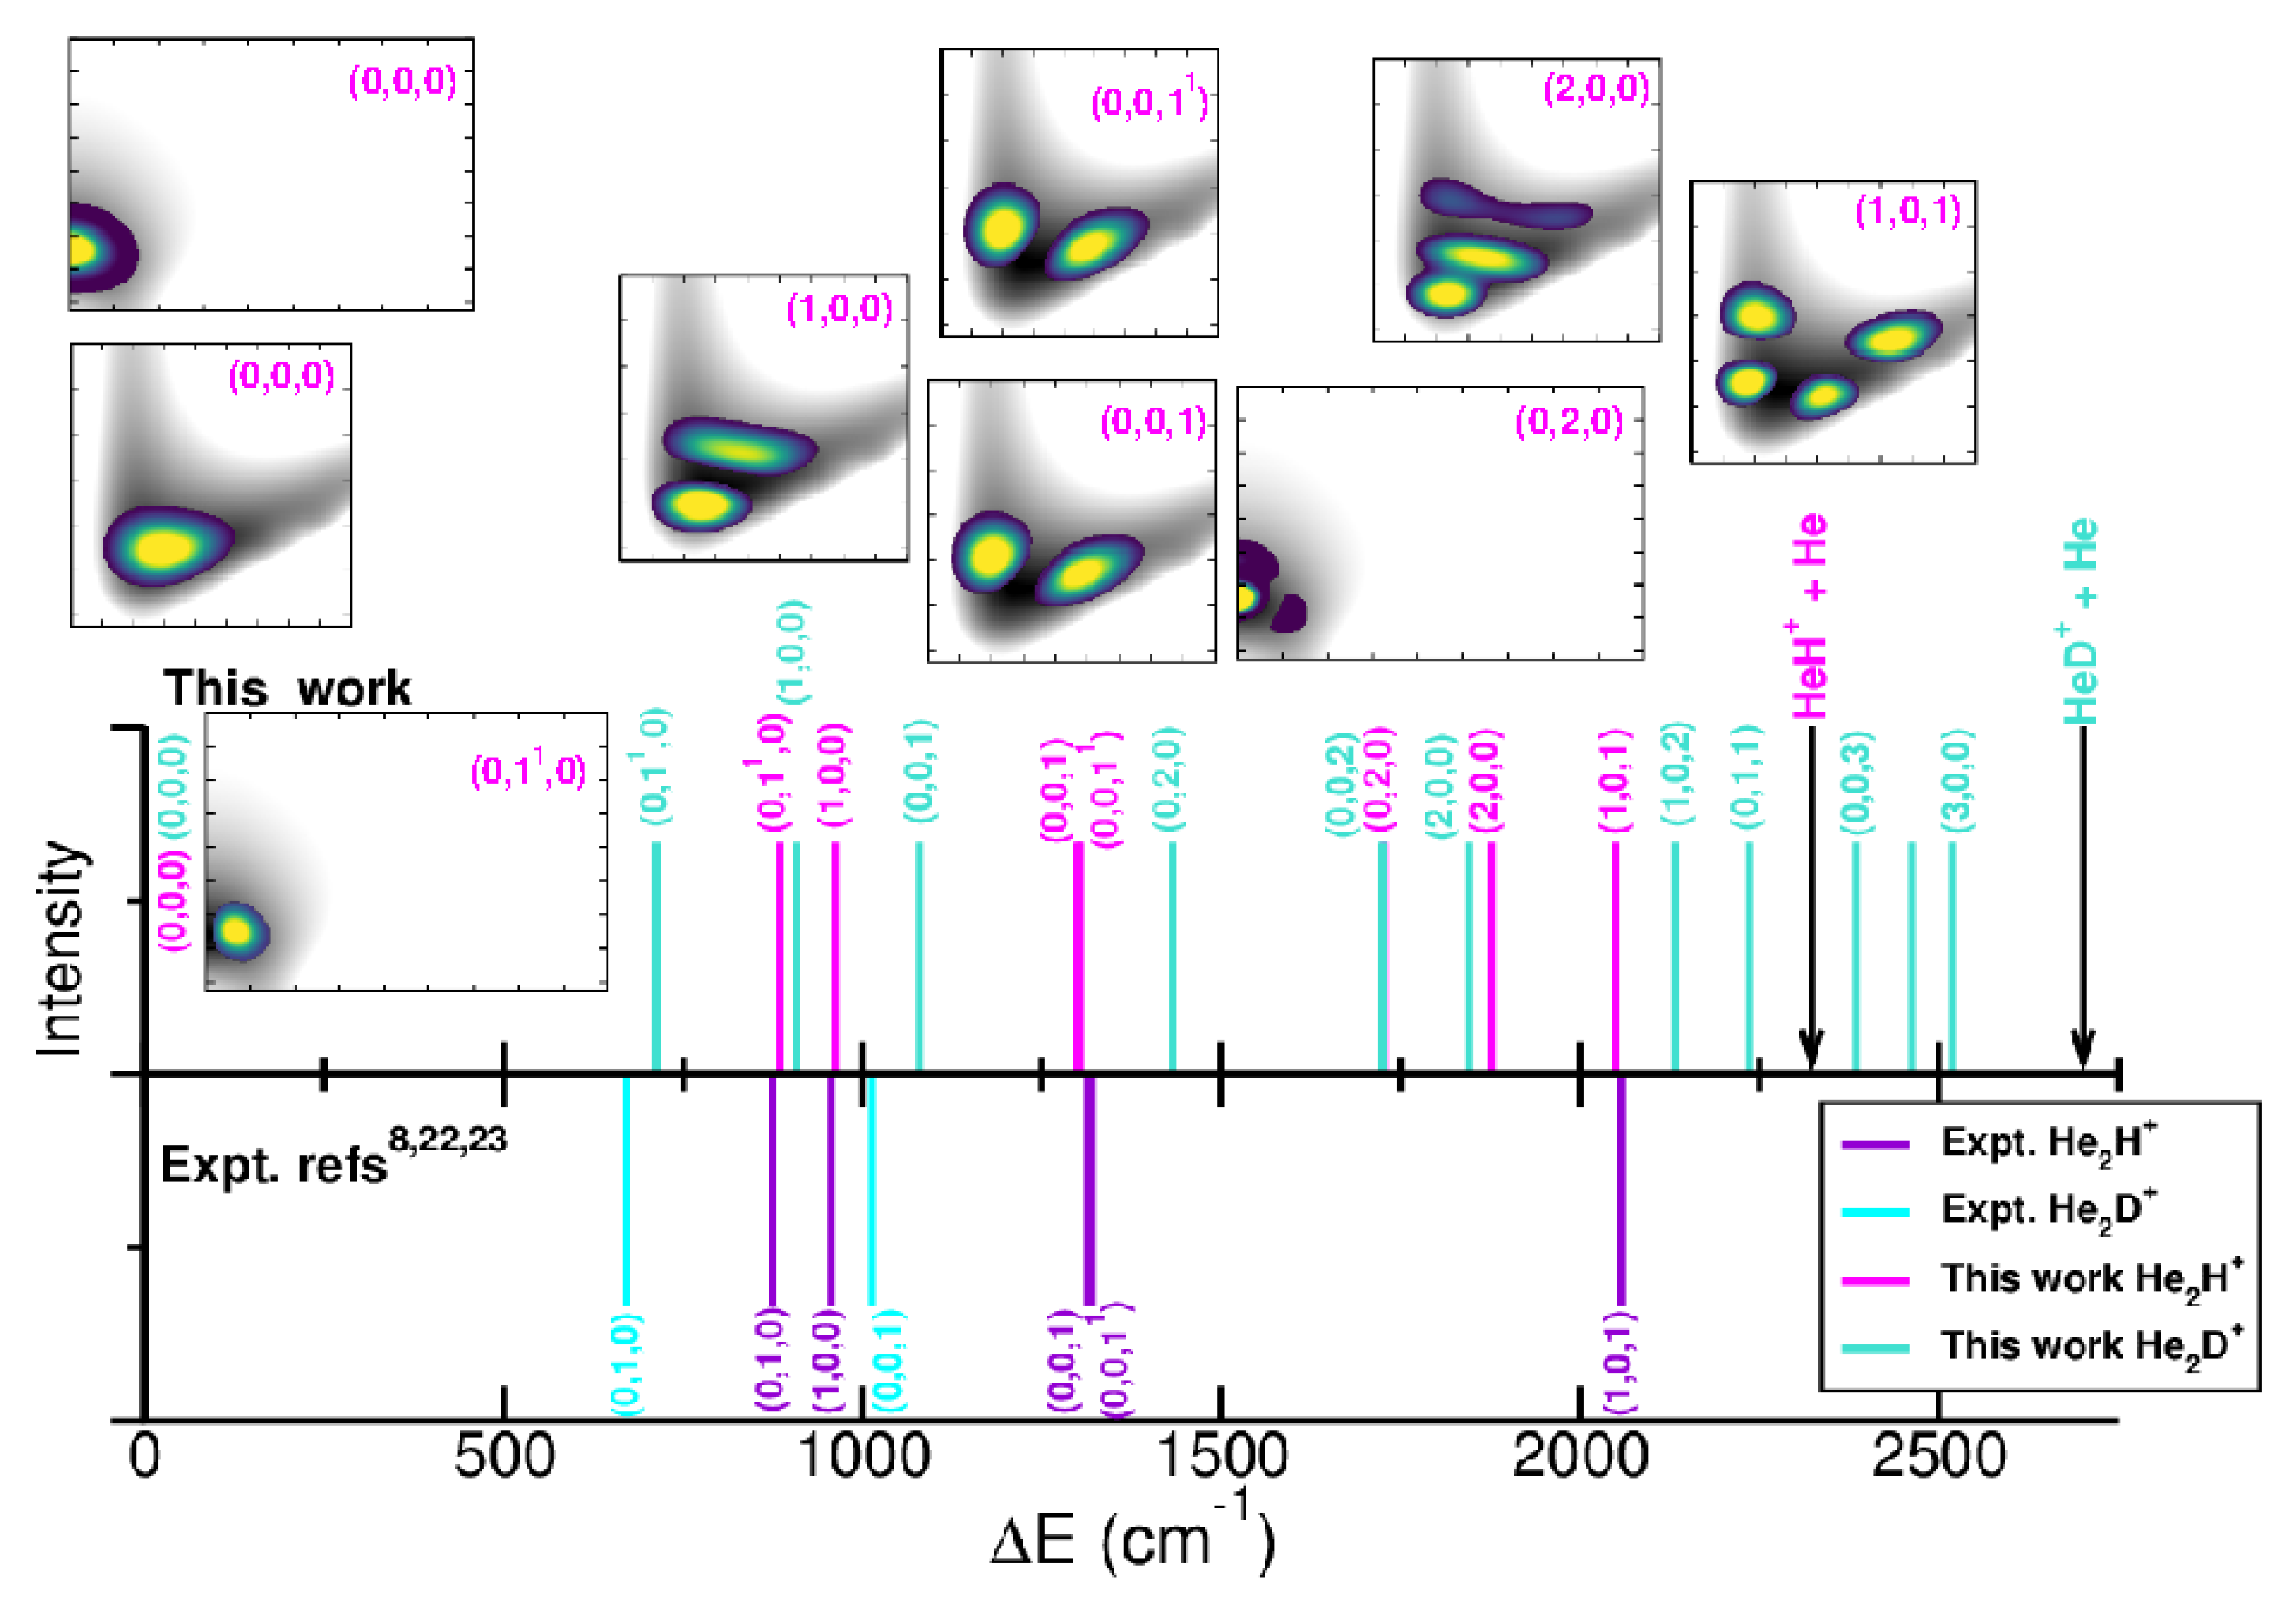

Table 1.
Vibrational energies (in ) and their (,,) assignment for the [4 and [4 bound states from the MCTDH calculations using the CCSD(T)/CBS[56] RKHS PES with the zero in energy at the He + dissociation. Comparison with previous studies [34,37] is also shown.
| [4 | [4 | |||
|---|---|---|---|---|
| This work | From Ref. [37]/Ref. [34] | This work | From Ref. [37]/Ref. [34] | |
| -4633.10 | -4603.92/-4661.88 | – | – | |
| 0 | -2322.6 (0,0,0) | -2321.77 (0,0,0)/-2493.87 | -2700.74 (0,0,0) | -2755.92 (0,0,0)/-2900.37 |
| 1 | -1360.5 (1,0,0) | -1358.16 (1,0,0)/-1539.712 | -1793.2 (1,0,0) | -1775.16 (1,0,0)/-1964.77 |
| 2 | -1022.2 (0,0,1) | -564.18 (2,0,0)/-1133.21 | -1620.4 (0,0,1) | -1384.04 (0,2,0)/-1822.81 |
| 3 | -594.8 (0,2,0) | -462.16 (0,2,0)/-821.88 | -1267.8 (0,2,0) | -916.32 (2,0,0)/-1630.05 |
| 4 | -446.4 (2,0,0) | -422.16 (1,2,0)/-623.47 | -976.8 (0,0,2) | -609.23 (1,2,0)/-1147.73 |
| 5 | -271.8 (1,0,1) | +134.32/-367.79 | -855.9 (2,0,0) | –/-958.19 |
| 6 | +84.6 (2,0,1) | –/-84.69 | -567.5 (1,0,2) | –/-850.11 |
| 7 | +290.2 (1,1,1) | – | -464.8 (0,1,1) | –/-779.13 |
| 8 | +348.3 | – | -315.1 (0,0,3) | –/-537.97 |
| 9 | +426.3 | – | -239.1 | –/-453.28 |
| 10 | – | – | -182.7 (3,0,0) | –/-329.88 |
| 11 | – | – | +45.8 (0,2,1) | –/-278.26 |
| 12 | – | – | +138.0 (1,0,1) | –/-145.99 |
| 13 | – | – | +166.5 | –/-18.55 |
Table 2.
Same as Table 1 for the [20 and [20 isotopologues calculated with the corresponding CSD(T)/CBS[56] RKHS ML-PES, and comparison with previous studies [35], considering the energy of Ne + asymptope as zero.
| [20 | [20 | |||
|---|---|---|---|---|
| This work | From Ref. [35 | This work | ||
| -5556.29 | 2D plots | -5807.96 | – | |
| 0 | -3753.3 (0,0,0) | -3971.47 | -4170.5 (0,0,0) | |
| 1 | -3277.8 (1,0,0) | -3514.96 | -3697.2 (1,0,0) | |
| 2 | -2841.8 (2,0,0) | -3068.13 | -3260.8 (2,0,0) | |
| 3 | -2426.7 (3,0,0) | -2634.21 | -3119.9 (0,0,1) | |
| 4 | -2335.0 (0,0,1) | -2535.81 | -3078.9 (0,2,0) | |
| 5 | -2273.6 (0,2,0) | -2444.67 | -2843.1 (3,0,0) | |
| 6 | -2022.5 (4,0,0) | -2213.99 | -2693.1 (1,0,1) | |
| 7 | -1946.0 (1,0,1) | -2152.69 | -2631.3 (1,1,0) | |
| 8 | -1826.9 (1,1,0) | -2005.90 | -2435.6 (4,0,0) | |
| 9 | -1632.0 (5,0,0) | -1809.10 | -2322.8 (2,0,1) | |
| 10 | -1589.5 (2,0,1) | -1784.91 | -2217.0 (2,1,0) | |
| 11 | -1414.3 (2,1,0) | -1585.69/-1586.49 | -2185.5 (0,1,1) | |
| 12 | -1268.0 (3,0,1) | -1434.86/-1435.67 | -2056.3 (5,0,0) | |
| 13 | -1243.4 (6,0,1) | -1420.34/-1422.76 | -1977.9 | |
| 14 | -1143.5 (1,0,1) | -1292.10/-1294.52 | -1966.8 (4,0,1) | |
| 15 | -1039.7 (3,1,0 ) | -1200.96/-1204.19 | -1940.6 (0,3,0) | |
| 16 | -942.5 (4,0,1) | -1096.91/-1104.98 | -1814.2 | |
| 17 | -898.6 | -1051.75/-1063.04 | -1779.4 (1,1,1) | |
| 18 | -819.9 | -993.68/-995.29 | -1701.8 | |
| 19 | -766.6 | -926.73/-933.99 | -1631.0 (4,0,1) | |
| 20 | -734.7 | -903.34/-905.76 | -1584.5 | |
| 21 | -674.5 | -821.07/-831.56 | -1521.1 | |
| 22 | -639.2 | -1449.2 | ||
| ... | ... | |||
| 34 | -16.0 | -897.2 | ||
| ... | ... | |||
| 70 | -7.0 | |||
Disclaimer/Publisher’s Note: The statements, opinions and data contained in all publications are solely those of the individual author(s) and contributor(s) and not of MDPI and/or the editor(s). MDPI and/or the editor(s) disclaim responsibility for any injury to people or property resulting from any ideas, methods, instructions or products referred to in the content. |
© 2025 by the authors. Licensee MDPI, Basel, Switzerland. This article is an open access article distributed under the terms and conditions of the Creative Commons Attribution (CC BY) license (http://creativecommons.org/licenses/by/4.0/).
Copyright: This open access article is published under a Creative Commons CC BY 4.0 license, which permit the free download, distribution, and reuse, provided that the author and preprint are cited in any reuse.


