
Submitted:
21 August 2025
Posted:
22 August 2025
You are already at the latest version
Abstract
The development of efficient and sustainable hydrogen storage materials is a key challenge for realizing hydrogen as a clean and flexible energy carrier. Among various options, metal hydrides offer high volumetric storage density and operational safety, yet their application is limited by thermodynamic, kinetic, and compositional constraints. In this work, we investigate the potential of machine learning (ML) to predict key thermodynamic properties—equilibrium plateau pressure, enthalpy, and entropy of hydride formation—based solely on alloy composition using Magpie-generated descriptors. We significantly expand an existing experimental dataset from ~400 to 806 entries and assess the impact of dataset size and data augmentation, using the PADRE algorithm, on model performance. Models including Support Vector Machines and Gradient Boosted Random Forests were trained and optimized via grid search and cross-validation. Results show a marked improvement in predictive accuracy with increased dataset size, while data augmentation benefits are limited to smaller datasets and do not improve accuracy in underrepresented pressure regimes. Furthermore, clustering and cross-validation analyses highlight the limited generalizability of models across different material classes, though high accuracy is achieved when training and testing within a single hydride family (e.g., AB2). The study demonstrates the viability and limitations of ML for accelerating hydride discovery, emphasizing the importance of dataset diversity and representation for robust property prediction.
Keywords:
metal hydride
; machine learning
; hydrogen storage
; materials discovery
1. Introduction
The development of sustainable and efficient hydrogen storage solutions is important in harnessing hydrogen’s potential as bidirectional energy carrier. Various renewable energy sources including solar, wind, and hydroelectric are promising, and hydrogen can be used to store excess electricity in times of over-production. In times of high energy demand, or in case of emergencies, hydrogen could react chemically or electrochemically with oxygen to produce only water while releasing substantial energy. For instance, 1 kg of hydrogen has the same energy content as 2.4 kg of methane or 2.8 kg of gasoline [1]. Various techniques, including electrolysis, biogas reforming, and photoelectrochemical processes, can be used to produce hydrogen. This versatile energy carrier can be transformed back into power and heat using fuel cells or turbines. Metal hydrides can play a significant role in storing hydrogen, offering a safer and more compact alternative to conventional gas compression and liquid storage methods [2]. These materials chemically bond with hydrogen, allowing for high volumetric storage densities and the advantage of releasing hydrogen upon demand, making them particularly suitable for applications ranging from transportation fuel to power generation [3]. However, the practical application of metal hydrides is hindered by challenges related to their thermodynamic stability, kinetics, and initial activation. Ideally, these materials would absorb and release hydrogen at pressures below 30 bar close to room temperature, exhibit rapid kinetics, minimal hysteresis, negligible need for activation, and resistance to contaminating gases [4]. Moreover, they should avoid the use of critical raw materials and remain cost-effective. Recently, high entropy alloys have extended the range of candidate materials in the field, showing promise due to the large composition space and potential for high hydrogen storage capacities [5,6]. These materials, characterized by a mixture of multiple principal elements, offer a new avenue for creating metal hydrides with tailored properties as the vast compositional space presents both a challenge and an opportunity [7].
Despite their promise, the search for metallic hydrides combining all necessary properties for applications is a daunting task. In this respect, the integration of machine learning (ML) in materials science represents a transformative shift, enabling the acceleration of new materials development through data-driven insights [8,9,10,11]. The dramatic increase in its usage can be attributed to its remarkable ability to capture complex correlations among large datasets and to efficiently predict materials properties. This capability is crucial for discovering novel metal hydrides with optimized hydrogen storage properties, where co-optimizing various properties is essential, as highlighted in recent studies published on this topic [12,13,14,15,16,17,18,19,20]. The first ones showed the feasibility of a ML approach, but have limited predictive power as they used measured properties of the hydrides as predictors in training the models [12,13]. Shortly afterwards, starting from the HYDPARK database and using the Magpie Software, a model trained on features obtained from the materials composition made the approach fully predictive and easy to apply to estimate the equilibrium plateau pressure, the enthalpy and entropy of hydrogenation of new hydrides [6]. Some later studies focused on predicting other relevant properties (enthalpy of formation, hydrogen capacity, etc.) on AB2 hydrides [14,15,16]. A significant number of recent studies focus on high entropy alloys for hydrogen storage [17,18,19,20] using both experimental and Density Functional Theory (DFT) results to generate the necessary datasets for training ML models, which can then be used to navigate this large compositional space to identify alloys with optimal properties. Using DFT generated data can help overcoming the limited availability of experimental data on metallic hydrides, however some quantities related to the absorption/desorption process are challenging to be obtained from theoretical calculations. Hence, the limited size of available datasets for hydrides, often limited to hundreds of items when using experimental data, remains a critical issue.
In this work, we focus on the effect of augmenting the dataset size on ML prediction quality. To this end, we have collected more experimental data published in the literature and nearly doubled the size of the dataset compared to an earlier publication [21]. In parallel, we tested the benefits and limitations of using a data augmentation technique (Pairwise Difference Regression, PADRE) [22] to increase the size of the dataset without using real new experimental data, but rather recombining the original data. Our ML approach is based on predictors generated using the Magpie platform [23,24], which is structure agnostic and based only on the hydride composition. Several models have been tested using a grid search for an extensive hyperparameters optimization. The models were trained to make predictions of the plateau pressure at 25 °C, as well as the enthalpy and entropy of adsorption/desorption, with the goal of refining our previous results. These quantities provide a comprehensive metric of the thermodynamic stability of metallic hydrides and hence can be used for selecting promising candidates for real applications.
2. Methodology
2.1. Datasets
Initially, we used the same dataset (DS0) as in our earlier publication [21], containing approximately 400 entries for different hydrides compositions. For each entry, experimental data for the plateau pressure at 25 °C () and its logarithm, the enthalpy () and entropy () of hydride formation are available. These entries are the results of a careful selection carried out in our previous work from the more than two thousand entries available in the HYDPARK database (details are reported in Supplementary Materials in [21]). This dataset was used for comparison and to test a few additional models compared to our earlier work. Gathering data from the literature [25], we built an expanded dataset (DS1) containing a total of 806 entries. Most of the added data refer to AB2 compounds, i.e. Laves phases (C14, C15, C36). In both datasets, we discarded a few entries with pertaining to complex hydrides as their number is too small for ML models to satisfactorily capture the complex correlations between predictors and target properties in this pressure range.
Following our previous approach [21,26], we employed the Magpie software [23,24] to generate a machine learning (ML) dataset from the compositions of the alloys collected in the original (DS0) and expanded dataset (DS1). This process resulted in the creation of 145 features for each entry in the datasets. These features involve a variety of thermo-physical variables, including mean, standard deviation, maximum, minimum, mode, and maximum difference of the elements in the composition formula. More details on the features generated by Magpie can be found in supplementary material and in the original documentation of the software package [23,24].
2.2. Machine Learning
Several ML models (or algorithms) are usually employed and tested to find the best one for a specific dataset. For this study, we experimented with various algorithms, including k-nearest neighbors (KNN), Random Forest (RF), Random Forest with Gradient Boosting (RFGB) and Support Vector Machines (SVM) as implemented in the scikit-learn library [27]. These ML models are well known to perform well with medium-size datasets, such as DS0 and DS1. In each model, the features used were those obtained from Magpie, whereas the target quantities to predict were experimental values for , and .
Before training, each dataset was converted into a matrix using the Python library "Pandas" [28] and randomly shuffled to mitigate potential grouping of similar data. For each ML algorithm, the best values of its hyperparameters were determined to minimize the chosen loss function (Mean Absolute Error). This optimization was done using the "GridSearchCV" function from the scikit-learn library on a suitable grid of values. The algorithms were trained for each combination of hyperparameter values on the grid, and the corresponding loss function was calculated. Each training iteration utilized 10-fold cross-validation, evaluating the model 10 times with different configurations of train/test sets to obtain more robust statistics on the error. Cross-validation was also used for evaluating the final generalization error using the best values of the hyperparameters determined in the grid search. As loss functions, we used the Mean Absolute Error (MAE) and the coefficient of determination (R2) both during training and for the final performance evaluation of each model.
For cluster analysis, we employed two well-known algorithms, kmeans++ and DBSCAN, as implemented in the scikit-learn library, to test both a distance-based and a density-based method. For the first method, we determined the best number of clusters (k) by running the algorithm for different values of it (from 2 to 8) and evaluating the results based on the resulting silhouette diagrams. For DBSCAN, the optimal values of the hyperparameters “epsilon” and “min_samples” were also determined according to silhouette diagrams (see Supplementary Materials for details).
2.3. Data Augmentation (PADRE Algorithm)
PADRE [22] is a data augmentation algorithm which constructs all possible pairs (i, j) between single entries of the training set and test set and for each pair considers the differences in the original features as new ones. Each entry of the augmented dataset (xaugmented) will be formed as concatenation of the original features of the pair and the differences, as in the Eq.1 [22]:
[Eq.1]
where xi and xj are the features of two entries of the original dataset. Furthermore, the target variable is also modified in the augmented dataset to represent the difference between the pairs. This procedure results in a significant increase in the size of the original dataset (both the number of features and entries) as detailed in Error! Reference source not found..

Table 1.
Variation of dimensions of DS0 and DS1 before and after PADRE.
| Dataset | Before PADRE | After PADRE |
|---|---|---|
| DS0 | 398 items x 145 features | 158.006 items x 436 features |
| DS1 | 806 items x 145 features | 648.830 items x 436 features |
These augmented datasets, from here on called DSA0 and DSA1, were used to train ML models to evaluate the effectiveness of the data augmentation procedure.
3. Results and Discussion
3.1. Effect of Increasing the Dataset Size with New Real Data
At first, we have trained a few additional models with the logarithm of the equilibrium pressure as target property and using the original dataset DS0 as in [22] to test possible improvements. For each model, the best combination of hyperparameters was first determined and then used with 10-fold cross-validation to obtain the final MAE. The results are reported in Table S2 in Supplementary Material. While the KNN model showed the worst performance (MAE=1.99) and will not be considered any longer in the following, the lowest MAE (1.35) was obtained with the SVM model. This model performed slightly better than the best result in previous work (MAE=1.52) [22], which was obtained with an RFGB model. An attempt at retraining an RFGB model in this work lead to a similar MAE (minor differences can be attributed to minor changes in the optimal hyperparameters and statistical fluctuations in 10-fold cross-validation results). Despite the slight improvement in the model performance obtained with the SVM model, it is difficult to achieve further significant improvements in predictions by simply testing other ML algorithms or refining the grid search of the optimal hyperparameters.
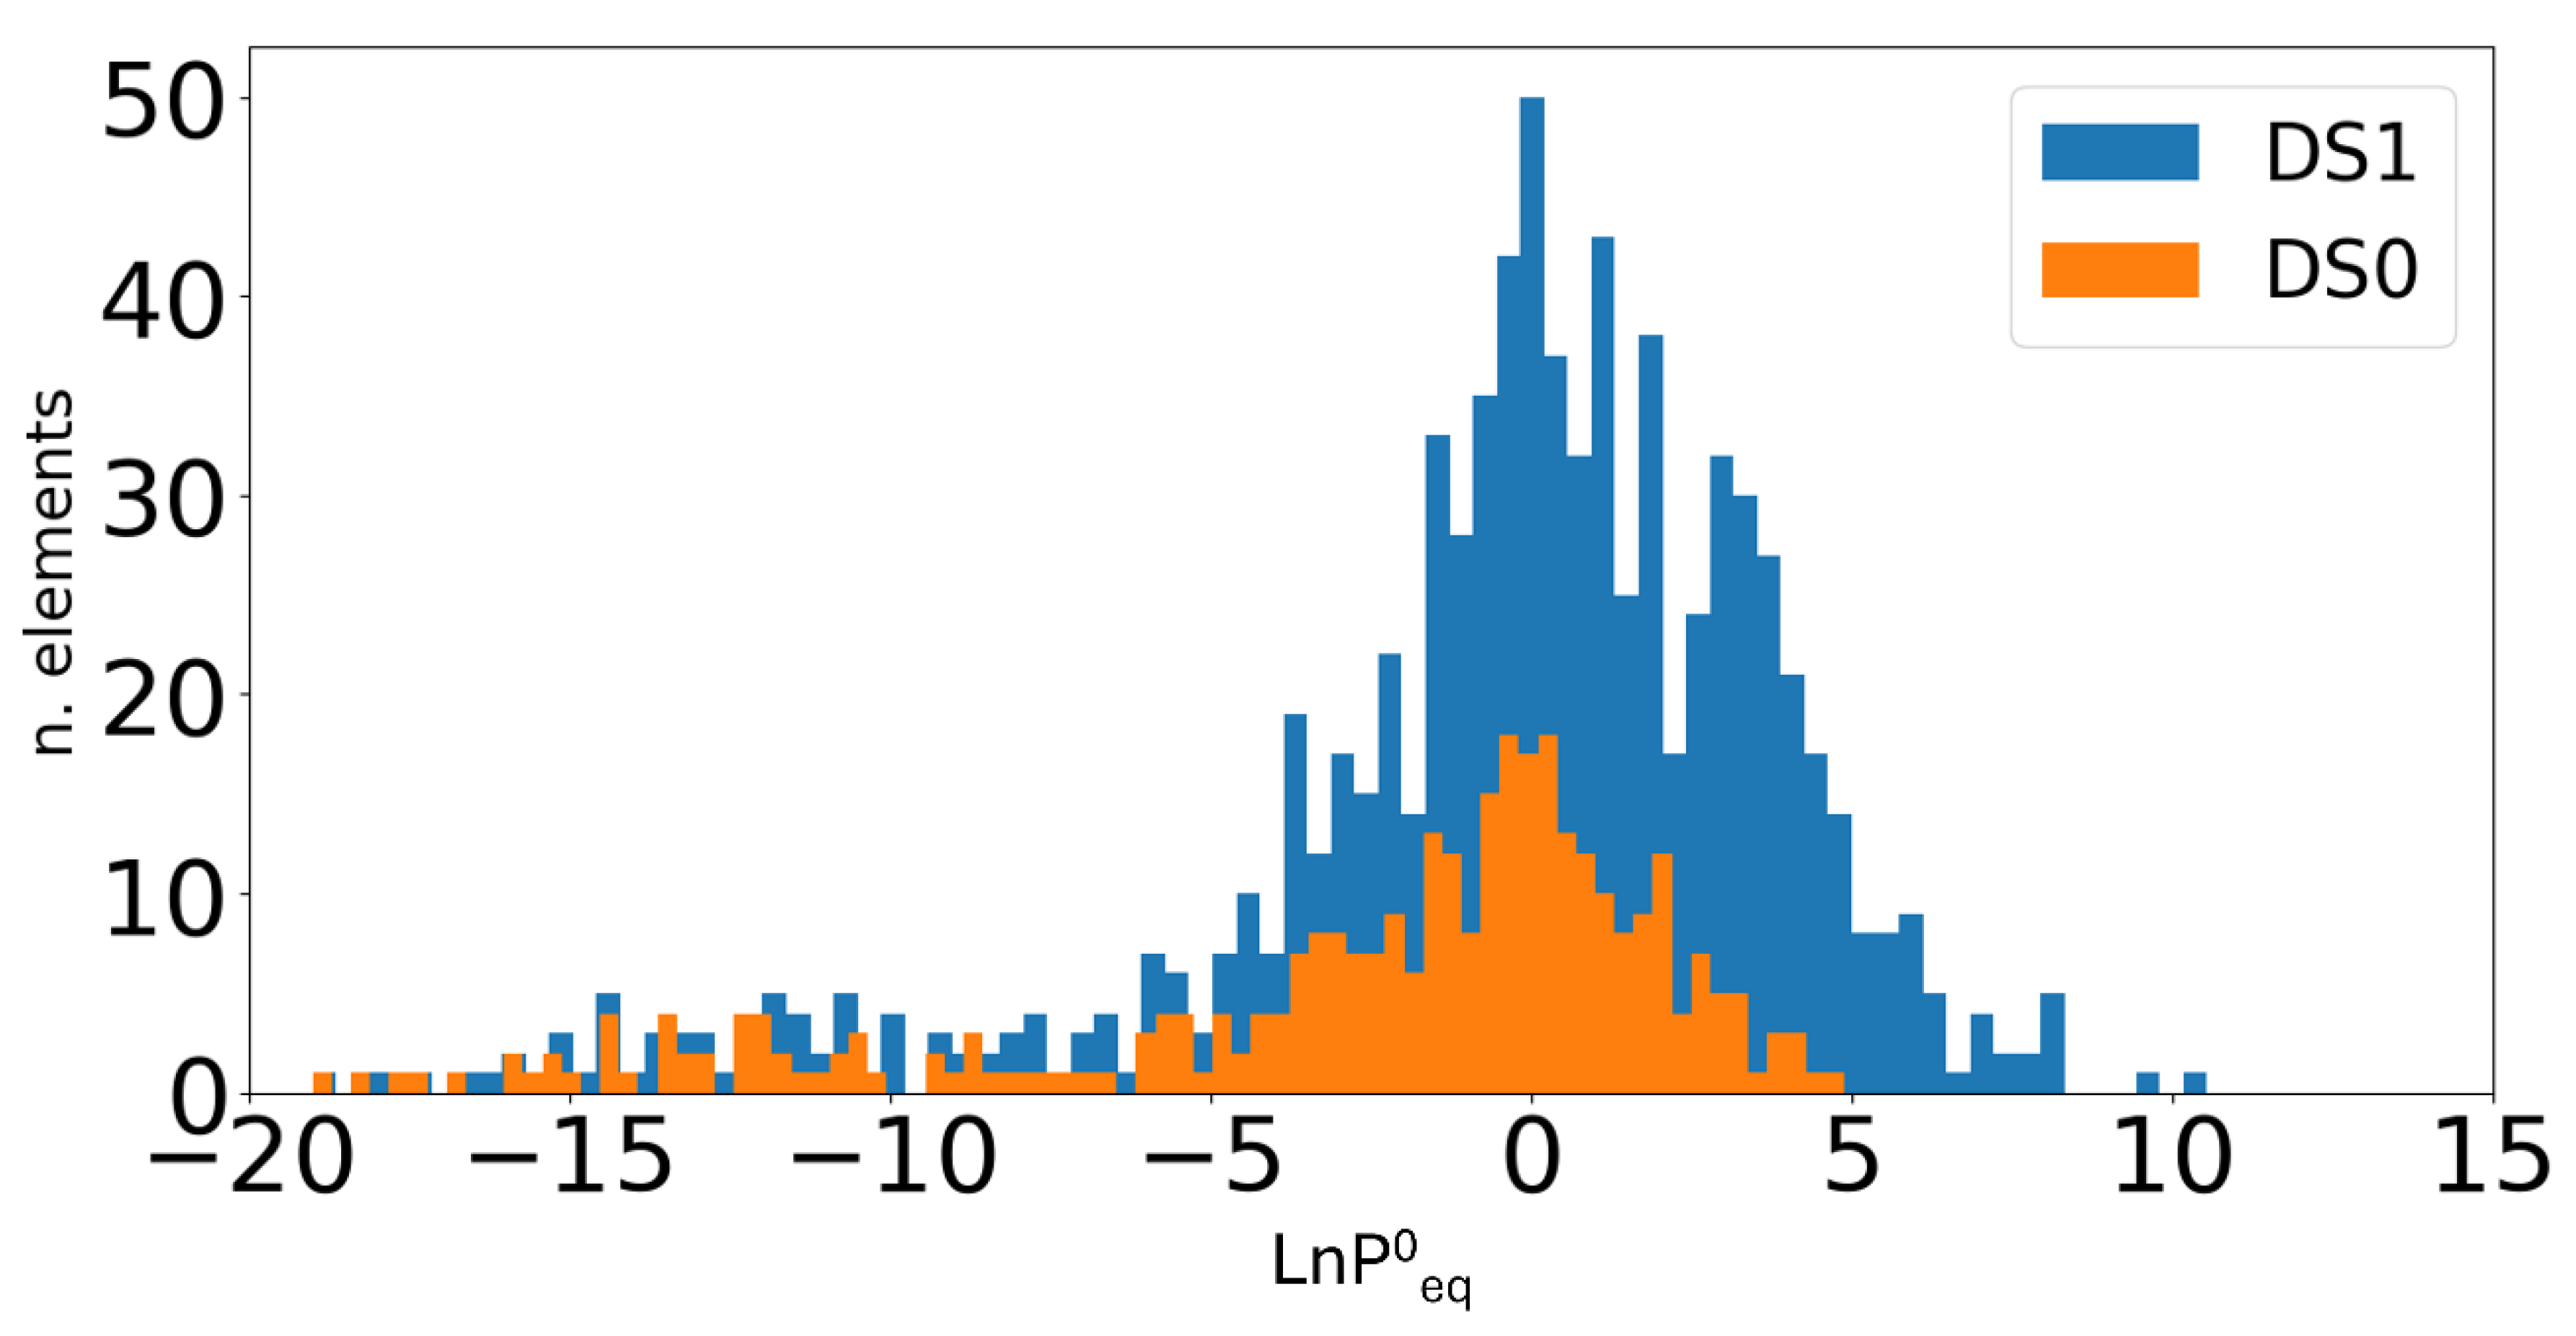
Hence, in the following, we describe the results obtained with the same ML models when the size of the dataset is increased with both new real data and with data augmentation techniques. At first, we compared the distribution of the target pressure considering the old dataset (DS0) and the new dataset (DS1), as illustrated in Error! Reference source not found.. It is evident that there is a substantial increase in the number of entries in DS1, particularly in the region near , between -5 and 5. It is also noteworthy that new data are now available in the region above = 5, whereas only a few new data are added below = -5.
Figure 1.
Distribution of entries in DS0 and DS1 with respect to ln P0eq.
As with DS0, we carried out hyperparameter optimization and trained different models on DS1. As before, RFGB and SVM models show the best performance, leading to a MAE of 1.07 and 1.13, respectively. These values demonstrate a significant improvement with respect to the mean errors obtained with DS0 and in our earlier work, clearly showing the benefit of increasing the dataset size. All results are shown in Error! Reference source not found..
Table 2.
Mean Absolute Error (MAE) and R2 values obtained for ML algorithms with as target using the dataset DS1.
Table 2.
Mean Absolute Error (MAE) and R2 values obtained for ML algorithms with as target using the dataset DS1.
| Model | MAE | R2 |
|---|---|---|
| SVM | 1.13 | 0.82 |
| RFGB | 1.07 | 0.84 |
| RF | 1.47 | 0.74 |
| KNN | 1.82 | 0.64 |
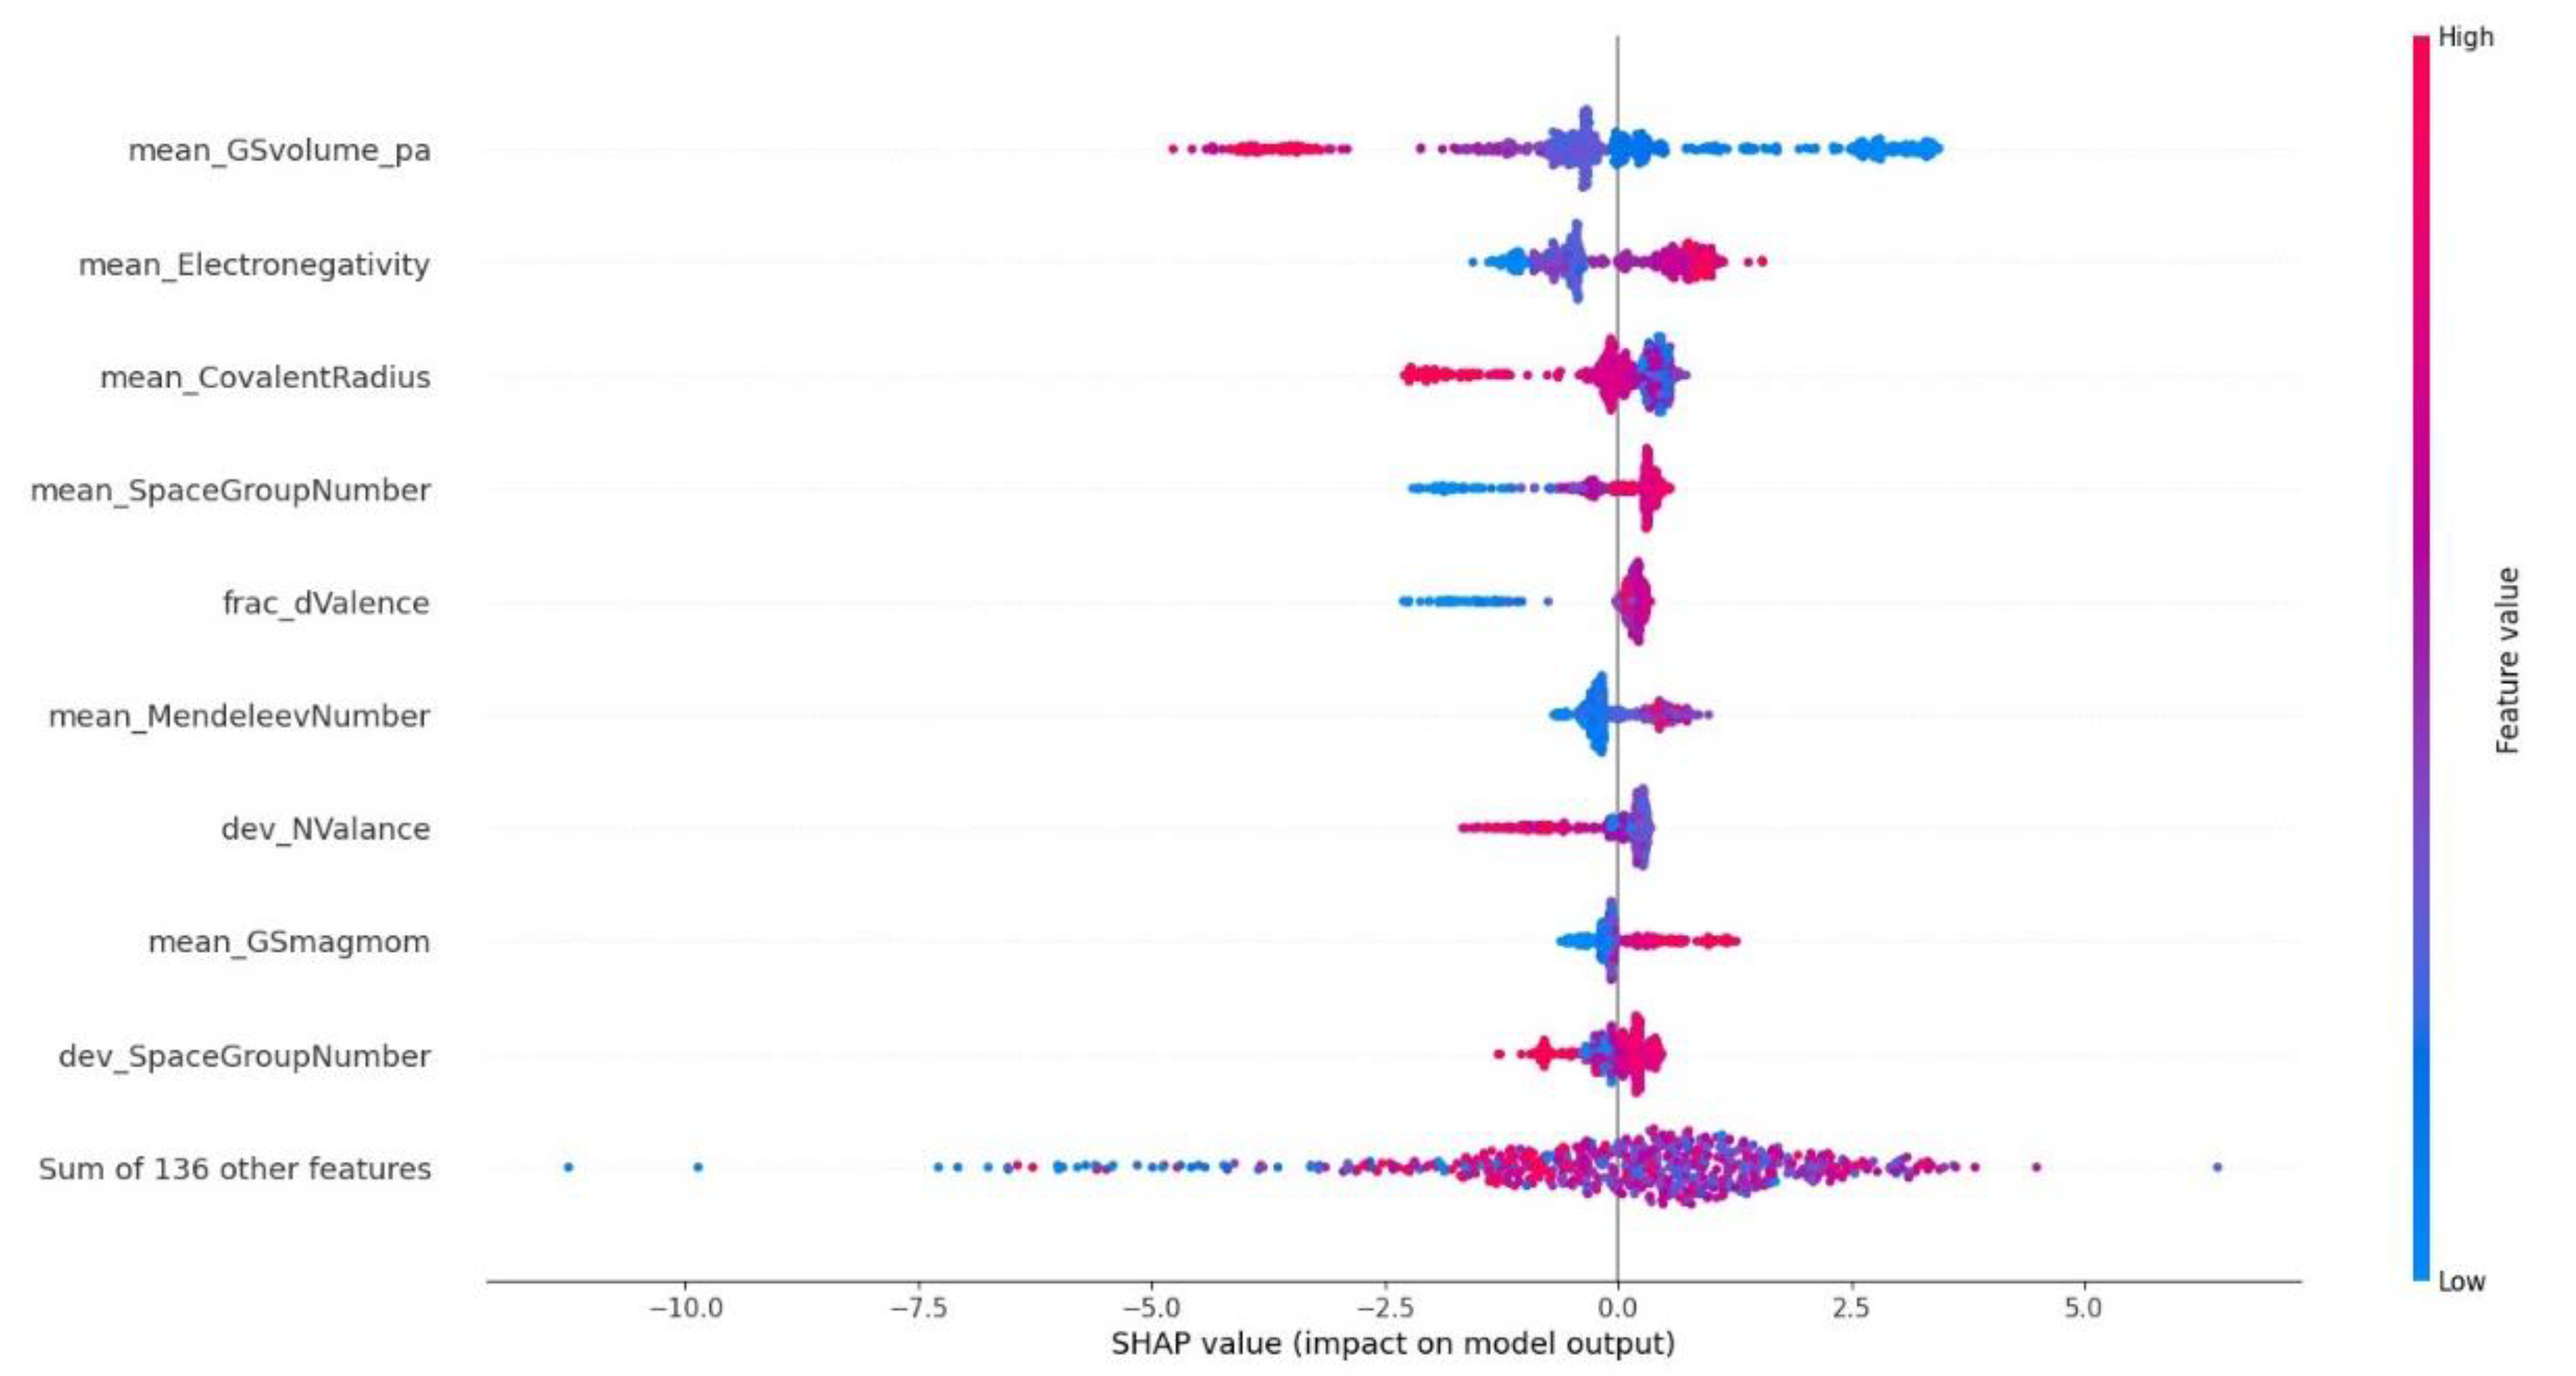
As already pointed out in our earlier work [22], it is important to rationalize the results of ML models with features importance, which provides an “explainable” insight into the inner workings of the models and helps understand correlations between the features and the target properties. The results of feature importance were evaluated for the Random Forest model with the methodology proposed by Shapley [29] (SHAP values in Error! Reference source not found.), which can be applied to all ML models, and with the native method for random forests implemented in the Scikit library (Figure S1). With both methodologies, the most important descriptor turn out to be the mean_GSvolume_pa (), which is the average ground-state volume of the alloy, calculated from ground-state volumes per atom of the elemental solids () as , where are the atomic fractions. This confirms our previous findings (for a detailed analysis the physical interpretation of this predictor the reader is referred to our previous work [21]) and is not affected by the increase in size of the dataset. In addition, the other predictors (among the top-ten most important ones) are also similar, though the exact order is slightly different.
3.2. Effect of Increasing the Dataset Size with Data Augmentation
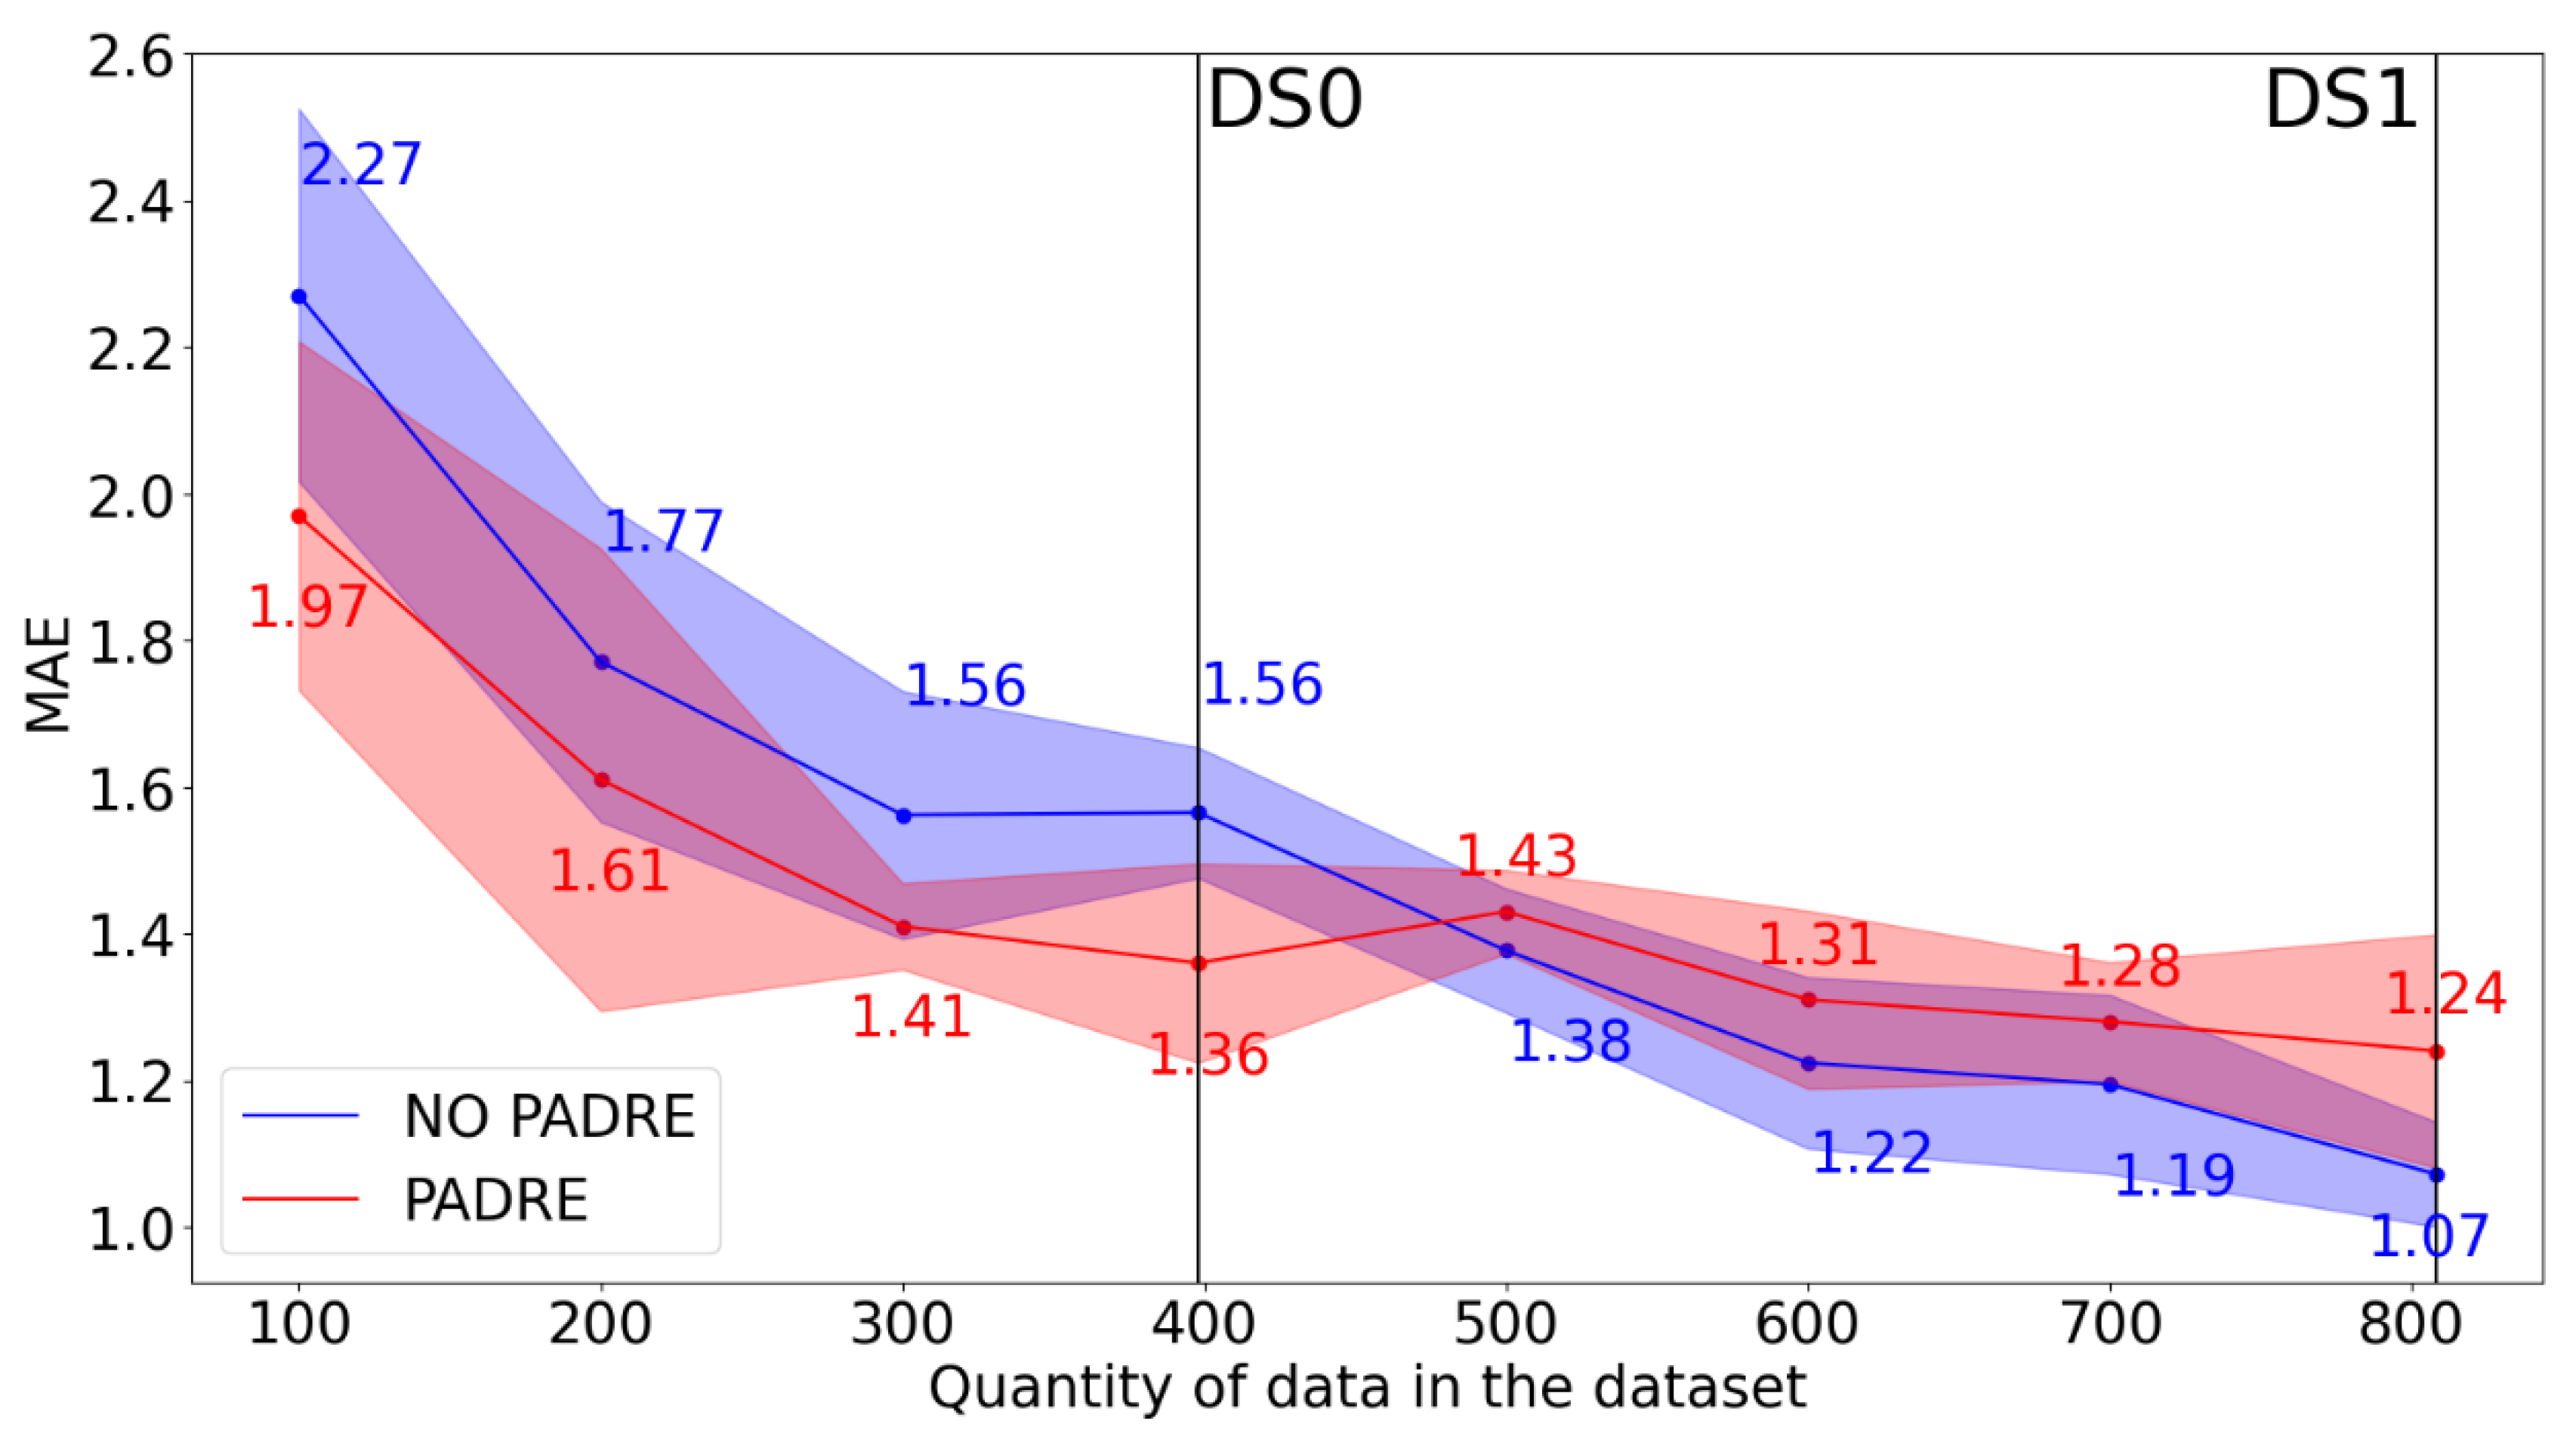
Producing and collecting new data with PCT measurements is time-consuming, hence it is desirable to enhance the model performance in other ways, if possible. As data augmentation could be helpful to this aim, we present here the results of the application of PADRE method to our datasets. The new datasets DSA0 and DSA1 were generated applying the PADRE method and then the RFGB model was retrained on both of them, with the same approach adopted for the original datasets (DS0 and DS1). We did not retrain the SVM model due to its poor scalability with dataset size, and we also excluded the KNN and RF models, because of their modest performance in earlier training. Using 10-fold cross-validation on the test set, the average MAE obtained was 1.36 on DSA0 and 1.24 on DSA1. Comparing these results obtained with data augmentation with the previous ones, we can note that the PADRE method led to an improvement in the prediction quality for DS0, but not for DS1. To better understand this outcome, we systematically applied the PADRE method to datasets of different sizes in the range from 100 to 806, i.e. the size of DS1. These datasets were obtained by random sampling DS1, then the PADRE method was applied to each newly created dataset of size 100, 200, 300, etc. and a RFGB model was trained on each one. The results are shown in Error! Reference source not found.. It is evident that models trained on datasets generated with data augmentation produce better results compared to the original datasets when the size of the latter is less than 500 elements. On the contrary, when the original dataset is sufficiently large, data augmentation is less effective and leads to slightly worse results. Moreover, the effect of data augmentation on the MAE value appears to be limited but not negligible on small datasets. The fact that data augmentation improves the quality of prediction on small datasets more than on large ones agrees with the original findings from ref. [22], though the crossover point (in our case, 500 elements) critically depends on the type of data and features used. The feature importance values evaluated on the augmented datasets show that the most important one is now the difference in ground state volumes (Error! Reference source not found. in Supplementary Material), which is consistent with previous results without data augmentation.
Figure 3.
Effect of dataset size on the results obtained with data augmentation. The red points are MAE values obtained training RFGB models with target without data augmentation on datasets on different sizes from 100 elements to DS1. The blue points are MAE values obtained training RFGB models with target with data augmentation applied on datasets on different sizes from 100 elements to DS1. The red and blue shadowed areas represent the variance on the MAE obtained from 10-fold cross validation.
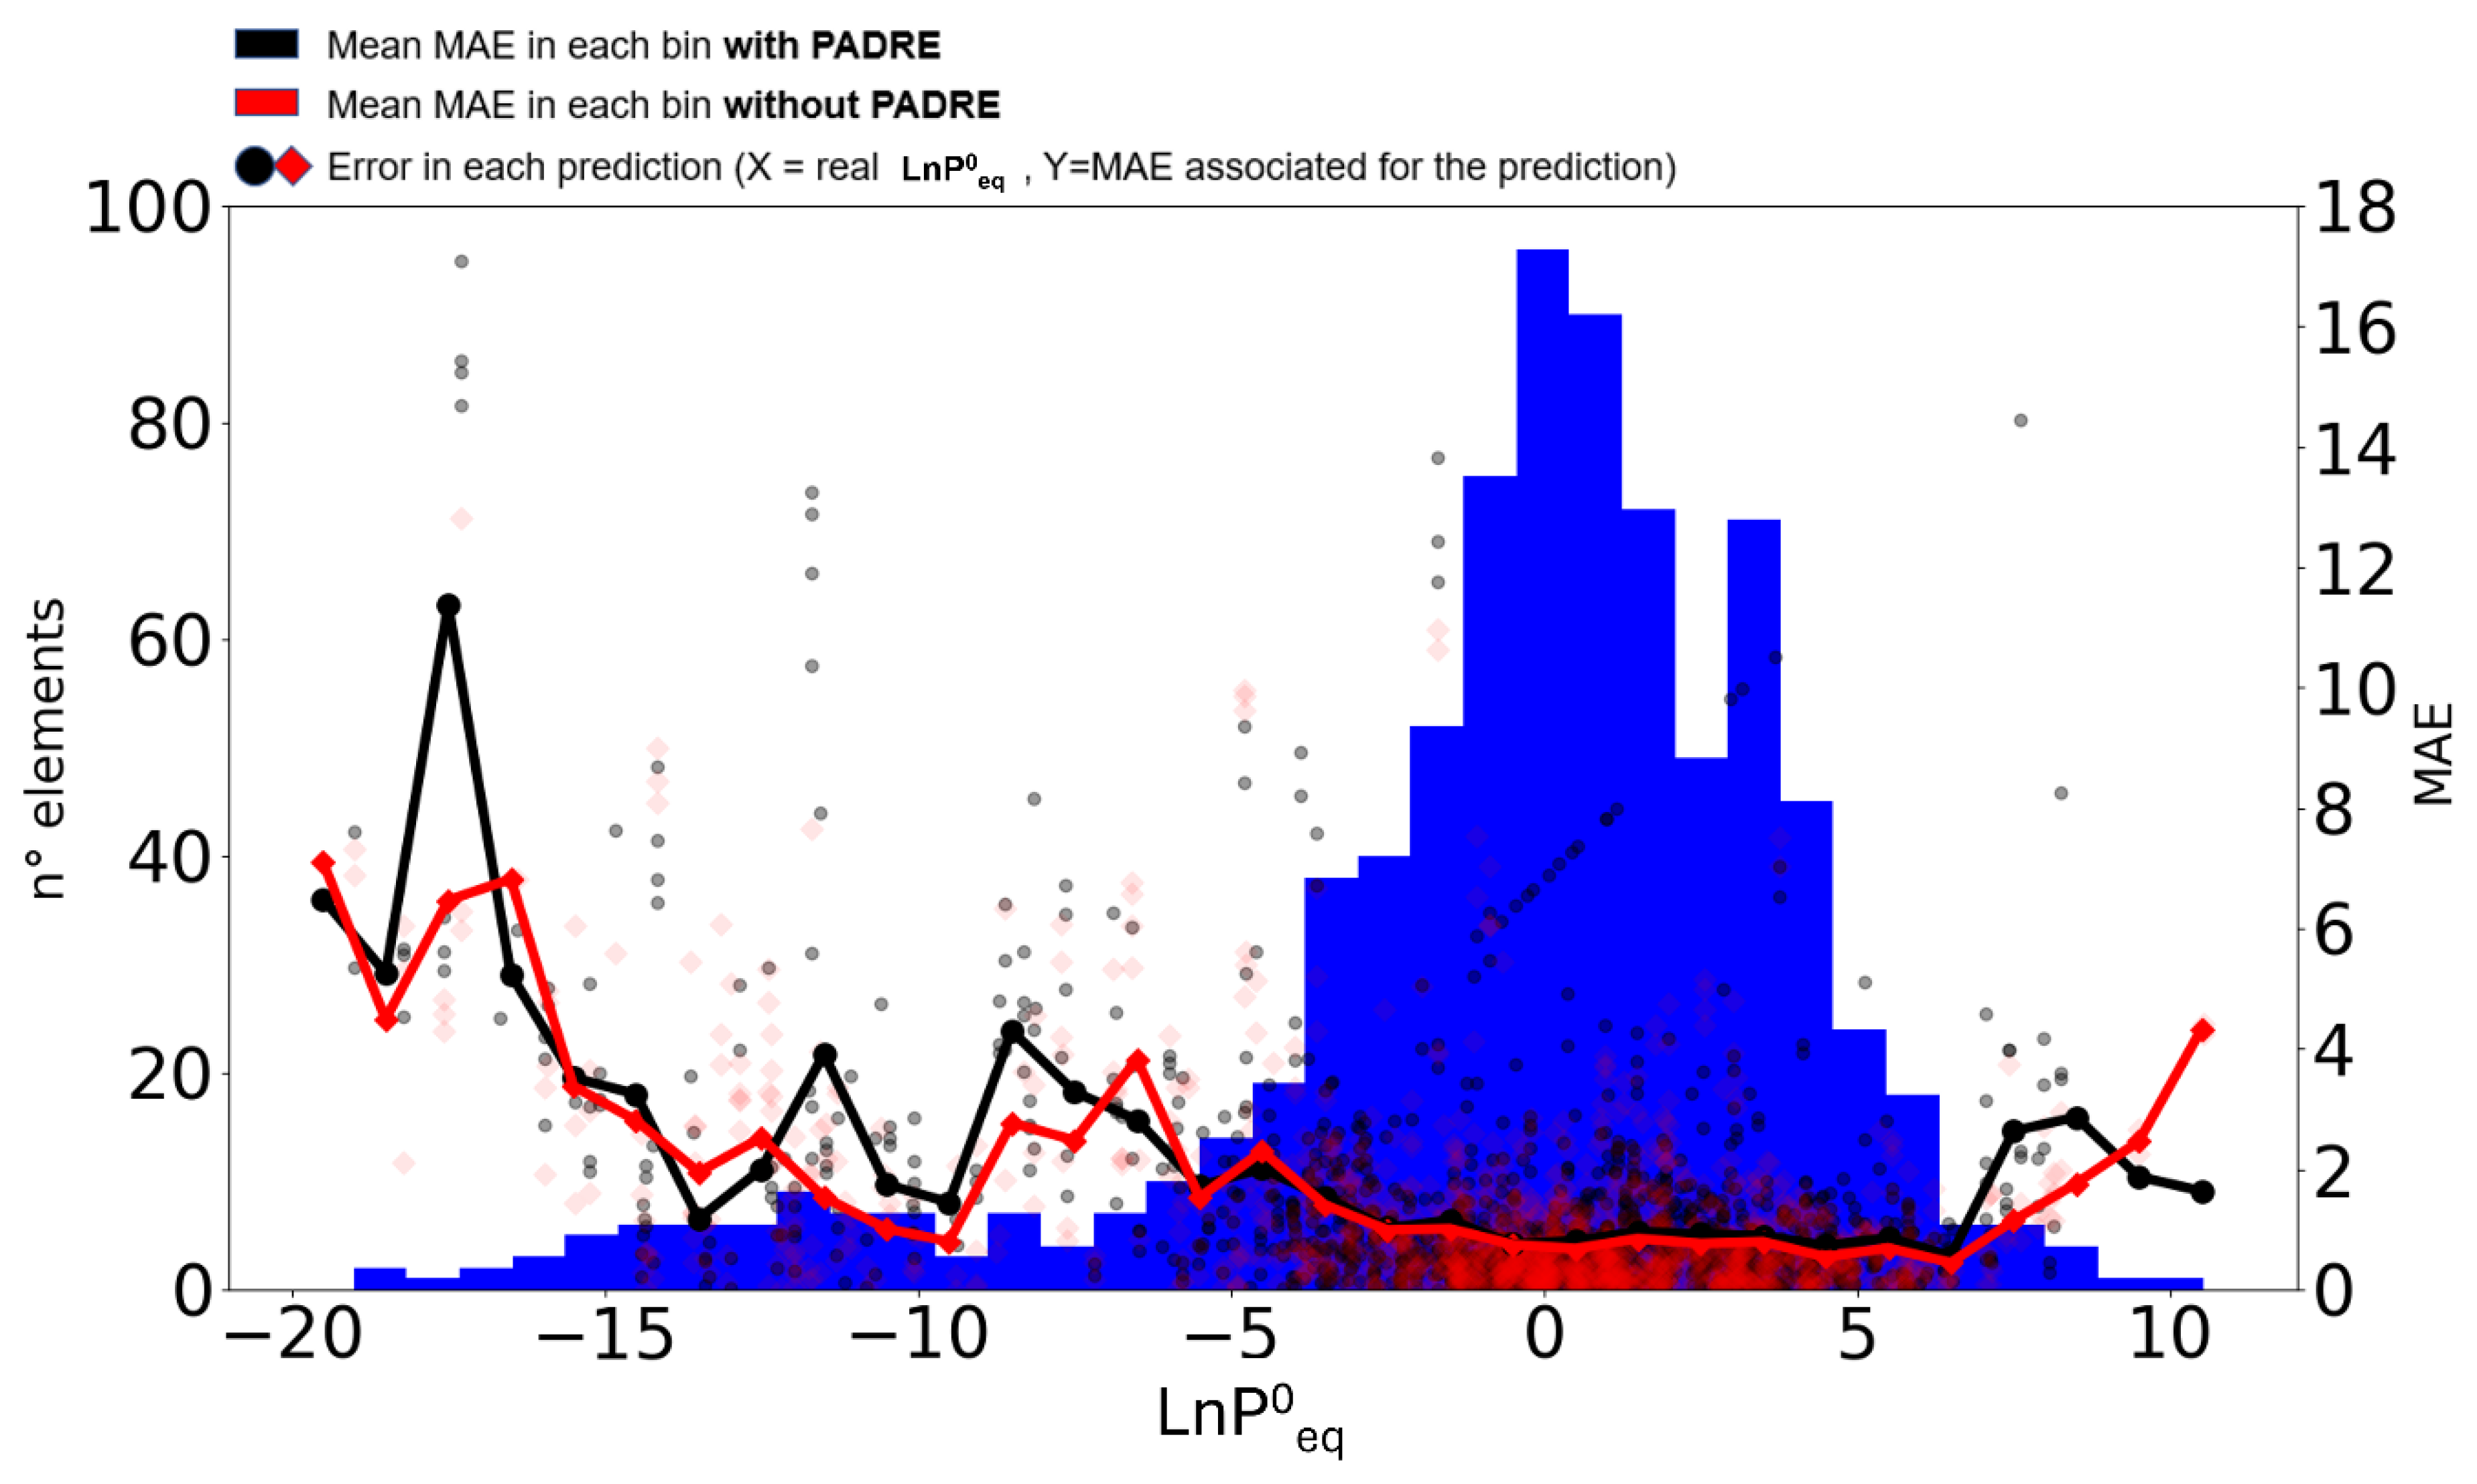
Another interesting point to consider is the quality of the predictions with respect to the range of values of the target equilibrium pressure. We already pointed out in earlier work (ref. [21]) that ML models do not generalize well in the wings of the distribution, i.e. at very low/high values, because of the corresponding low number of samples in the training dataset. To investigate the effect of data augmentation on this issue, we split the data on the dataset DS1 and DSA1 into bins of size 1 in (e.g., -20 to -19, -19 to -18, etc.) and we calculated the MAE of the data in each bin with and without data augmentation using 10-fold cross validation (Error! Reference source not found.). The points in Error! Reference source not found. represent the MAE for each fold in a certain bin (10 folds for each bin, cross validation has been applied to each bin separately) when training was done on the dataset DS1 (without data augmentation), whereas the black line represents the average MAE in each bin without augmentation. With respect to our earlier work (ref. [21]) we can notice a certain overall reduction in MAE values, but still significantly higher values on the wings of the distribution. After applying data augmentation and training on dataset DSA1, MAE values have been evaluated in a similar way for each bin (red squares and red line). It is evident that data augmentation with PADRE does not lead to a decrease of MAE values in any region of the distribution, with a few exceptions in some bins. Even worse, in some bins on the wings of the distribution, the application of PADRE generates significantly worse predictions (i.e. higher MAE values). It is unfortunately evident this approach to data augmentation does not improve the accuracy of predictions at high/low pressure values, where data are sparser than in the middle of the range. Hence, the benefits of data augmentation appear to be limited to small datasets and are only marginal compared to the benefits of introducing new real data in the dataset.
Figure 4.
Distribution of entries in DS1 with respect to (blue histogram) overlapped with error analysis in each bin using 10-fold cross validation. The points/squares in red/gray are the MAE for each cross-validation fold and with dataset DS1, no augmentation/DSA1, with augmentation; the red/gray line shows the average MAE on the 10 cross-validation folds in each bin without augmentation/with augmentation.
3.3. Clustering and Further Analysis
To gain a deeper understanding on dataset DS1, we employed two clustering algorithms, kmeans++ and DBSCAN from the sci-kit learn library. Both were applied on the entire feature vector and we searched for the optimal number of clusters (k) and other hyperparameters according to the silhouette score in addition to inertia values (more details and the silhouette score and diagrams are reported in Supplementary Materials). With kmeans++, the optimal number of clusters was found to be k=4, while with DBSCAN the corresponding number of clusters was found to be k=8. The clusters determined according to kmeans++ are shown in different colors in Figure 5.
The results in Figure 5 show that there is a certain correlation between vs , however different clusters of materials do not appear to be clearly separated on this plot. Similar results were obtained with DBSCAN (see Supplementary Materials for details). These limitations on the clusters obtained with respect to vs are also similar to previous results on the DS0 dataset [21] and were already discussed in detail. In the following, we go beyond the current clustering results to conduct a demanding test designed to assess the generalization capability of the trained ML models for hydrides under the most challenging conditions.
It is well-established that it is difficult for an ML model to generalize on new instances (in the present case on new possible hydrides) that differ significantly from the data on which it was trained. To quantify this difficulty in the worst possible case, we used the kmeans++ clustering results to split the dataset DS1 into training and test sets in the following way: the first of the four clusters obtained from kmeans++ is set aside and used as a test set while the other clusters (2, 3, 4) are used for training a RFGB model; after training, the model results are evaluated by calculating the MAE and R2 values on the test set (cluster 1) [30]; this step is iteratively repeated choosing each time a different cluster for testing and the others for training (cluster 2 for testing and clusters 1, 3, 4 for training, and so for). In this way, assuming the kmeans++ clustering has successfully split the datasets into homogenous clusters, the test set contains each time hydrides which are somewhat different from those used in training. The results are shown in Table 3 and are rather unsatisfactory for most clusters except when cluster 4 is used for testing and clusters 1-2-3 for training.
The above results are however dependent on how successful the applied clustering algorithms are in splitting the original dataset into homogenous subsets. To further confirm these findings, we used a different clustering of the dataset, using the materials classes defined in the HYDPARK database, i.e. according to different types of hydrides (AB, AB2, etc., more details in Supplementary Materials). We then repeated the previous approach using these materials classes as clusters and the obtained results are reported in Table 4.
As observed, the results are generally unsatisfactory across most material classes, although for some classes the limited number of instances may significantly affect the reliability of the results. In fact, this is probably the case for A2B hydrides (only 10 instances in the class) and possibly for Mg and MIC with 32 and 52 instances, respectively. However, it does explain the poor results obtained when testing on AB5 hydrides or even on the largest class AB2. In this latter case, which is the second best one among all possible classes, the results point out that training with data on hydrides belonging to different materials classes but not including AB2 lead to performances which are significantly lower than those obtained in Section 3.1 Although another factor that may affect the present results is the imbalance between the materials classes sizes, it is clear from the results in both Error! Reference source not found.and Error! Reference source not found.that the ML models for hydrides cannot be expected to perform well unless they have been trained on datasets containing a relevant number of data on similar hydrides.
On the contrary, models trained on similar hydrides are expected to perform well when applied to make predictions within the same materials class. To verify this point, we created a new dataset DS2 containing only hydrides of AB2 type (the most numerous) for a total of 454 instances. We then retrained both an RFGB and an SVM model using 10-fold cross-validation to evaluate the results as in Section 3.1. The full results for each fold are shown in Table S5 and they show an average MAE=0.83 and R2=0.89 for RFGB and MAE=1.12 R2=0.72 for SVM, which are significantly lower than the corresponding values obtained on the whole DS1 dataset.
3.4. Validation of Model Predictions
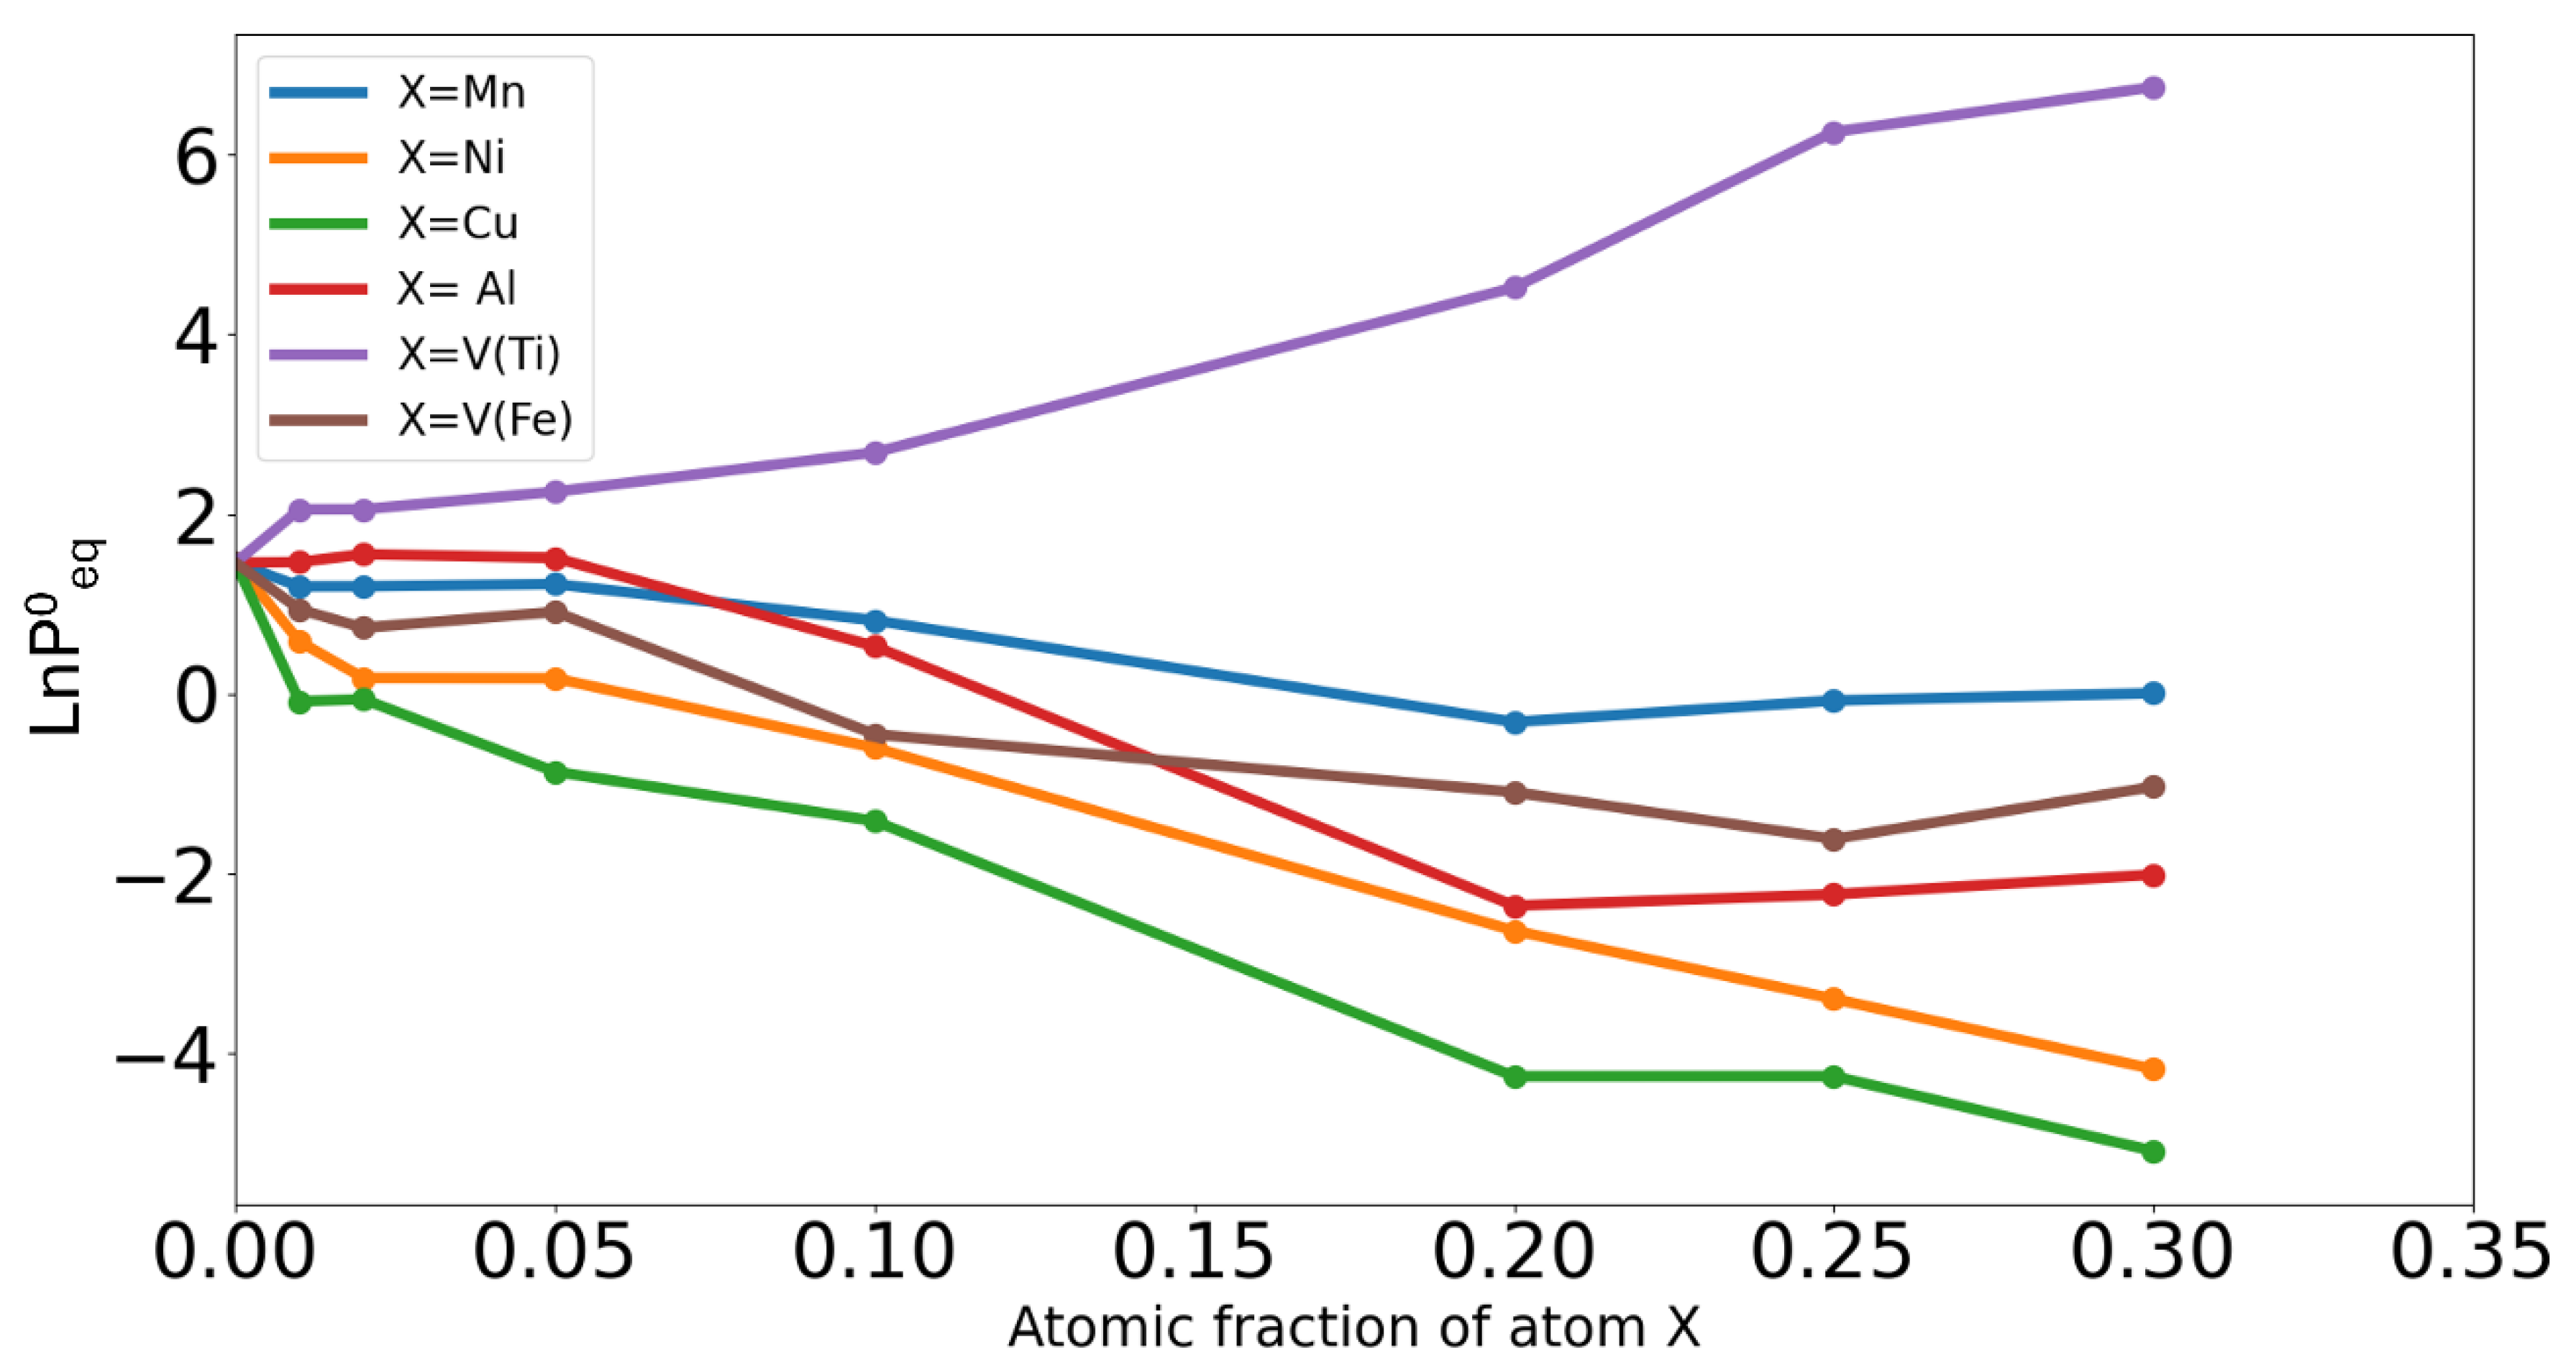
Though the quality of the predictions based on the trained ML is still limited at extreme low/high pressure, they can capture some trends in the equilibrium plateau pressures in the composition space and can help the exploration of new alloy compositions. For example, Error! Reference source not found.6 shows the variation in the predicted plateau equilibrium pressures at room temperature starting from the FeTi binary equimolar phase and partially substituting iron or titanium with other elements (Ni, Mn, Cu, Al, V). In almost all cases, the predicted decreases in agreement with experimental findings [25] with one notable exception when V substitutes Ti, which is also in agreement with experiments.
Figure 6.
Predicted variation of at 25°C for different amounts and types of substituting elements (Mn, Ni, Cu, Al, V). Predictions for Vanadium have been done when it substitutes Titanium (purple line) and when it substitutes Iron (brown line), in all other cases Iron atoms are substituted by X atoms.
4. Conclusions
This work focuses on investigating the effectiveness and versatility, as well as the limitations, of ML approaches in the design of metal hydrides and in predicting their equilibrium plateau pressure. Building on our previous research, we first checked for possible improvements using different models on the same dataset (DS0) and we found that limited enhancements are possible. This was the case with a SVM model not tested before. However, we found a higher effectiveness of new experimental data in enhancing the performance of the trained models. Specifically, when doubling the size of the dataset (DS1) the improvement in the MAE and R2 values of the trained models was significant. Feature importance results on this larger dataset essentially confirm previous findings.
In contrast, the tested data augmentation technique (PADRE) did not enhance model performance, with enhancements being evident only for small original datasets (before data augmentation is applied) and diminishing as the dataset size increased. This possibly points to the fact that, when the quantity of real data is large enough, the improvement that can be obtained by these techniques is limited or null as the model is already capable of capturing the complex correlations present in the data. Furthermore, the application of these techniques does not lead to any improvement of the quality of the predictions at pressure values which are not well represented in the dataset (at high/low pressure regimes), which could represent a significant gain for certain applications.
We also verified that the generalization ability of these trained ML models is somewhat limited to the same type of hydrides which are well represented in the training set. Attempts at predicting properties for hydrides of different classes leads to poor results. On the contrary, models trained on well represented materials classes such as AB2 can perform very well on similar new materials.
The framework facilitates the interpretation of ML models and enables rapid screening of new materials with the desired capacity and thermodynamic properties for specific hydrogen storage use cases [3].
Supplementary Materials
The following supporting information can be downloaded at the website of this paper posted on Preprints.org.
Acknowledgments
The authors want to acknowledge the EX-MACHINA project leading to this publication, which it has received funding under the MUR program “PNNR M4C2 Initiative 1.2: Young Researcher - Seal of Excellence" (CUP: D18H22002040007), Spoke 7 “Materials and Molecular Sciences” of ICSC—Centro Nazionale di Ricerca in High-Performance Computing, Big Data and Quantum Computing, funded by the European Union—NextGenerationEU. We would like to thank the “Centro di Competenza sul Calcolo Scientifico” for the computing time on the OCCAM supercomputer and support from the Project CH4.0 under the MUR program “Dipartimenti di Eccellenza 2023-2027” (CUP: D13C22003520001).
Conflicts of Interest
Sandia National Laboratories is a multi-mission laboratory managed and operated by National Technology & Engineering Solutions of Sandia, LLC (NTESS), a wholly owned subsidiary of Honeywell International Inc., for the U.S. Department of Energy’s National Nuclear Security Administration (DOE/NNSA) under contract DE-NA0003525. This written work is authored by an employee of NTESS. The employee, not NTESS, owns the right, title, and interest in and to the written work and is responsible for its contents. Any subjective views or opinions that might be expressed in the written work do not necessarily represent the views of the U.S. Government. The publisher acknowledges that the U.S. Government retains a non-exclusive, paid-up, irrevocable, world-wide license to publish or reproduce the published form of this written work or allow others to do so, for U.S. Government purposes.
References
- Ball, M.; Wietschel, M. The Future of Hydrogen – Opportunities and Challenges. Int J Hydrogen Energy 2009, 34, 615–627. [Google Scholar] [CrossRef]
- Züttel, A. Materials for Hydrogen Storage. Materials Today 2003, 6, 24–33. [Google Scholar] [CrossRef]
- Allendorf, M.D.; Stavila, V.; Snider, J.L.; Witman, M.; Bowden, M.E.; Brooks, K.; Tran, B.L.; Autrey, T. Challenges to Developing Materials for the Transport and Storage of Hydrogen. Nat. Chem. 2022, 14, 1214–1223. [Google Scholar] [CrossRef]
- Hirscher, M.; Yartys, V.A.; Baricco, M.; Bellosta von Colbe, J.; Blanchard, D.; Bowman, R.C.; Broom, D.P.; Buckley, C.E.; Chang, F.; Chen, P.; et al. Materials for Hydrogen-Based Energy Storage – Past, Recent Progress and Future Outlook. J. Alloys Compd. 2020, 827, 153548. [Google Scholar] [CrossRef]
- Witman, M.; Ling, S.; Wadge, M.; Bouzidi, A.; Pineda-Romero, N.; Clulow, R.; Ek, G.; Chames, J.; Allendorf, E.; Agarwal, S.; et al. Towards Pareto Optimal High Entropy Hydrides via Data-Driven Materials Discovery. [CrossRef]
- Witman, M.; Ek, G.; Ling, S.; Chames, J.; Agarwal, S.; Wong, J.; Allendorf, M.D.; Sahlberg, M.; Stavila, V. Data-Driven Discovery and Synthesis of High Entropy Alloy Hydrides with Targeted Thermodynamic Stability. Chemistry of Materials 2021, 33, 4067–4076. [Google Scholar] [CrossRef]
- Marques, F.; Balcerzak, M.; Winkelmann, F.; Zepon, G.; Felderhoff, M. Review and Outlook on High-Entropy Alloys for Hydrogen Storage. Energy Environ Sci 2021, 14, 5191–5227. [Google Scholar] [CrossRef]
- Liu, X.; Zhang, J.; Pei, Z. Machine Learning for High-Entropy Alloys: Progress, Challenges and Opportunities. Prog Mater Sci 2023, 131, 101018. [Google Scholar] [CrossRef]
- Han, G.; Sun, Y.; Feng, Y.; Lin, G.; Lu, N. Artificial Intelligence Guided Thermoelectric Materials Design and Discovery. Adv Electron Mater 2023, 9. [Google Scholar] [CrossRef]
- Chen, C.; Zuo, Y.; Ye, W.; Li, X.; Deng, Z.; Ong, S.P. A Critical Review of Machine Learning of Energy Materials. Adv Energy Mater 2020, 10. [Google Scholar] [CrossRef]
- Butler, K.T.; Davies, D.W.; Cartwright, H.; Isayev, O.; Walsh, A. Machine Learning for Molecular and Materials Science. Nature 2018, 559, 547–555. [Google Scholar] [CrossRef]
- Rahnama, A.; Zepon, G.; Sridhar, S. Machine Learning Based Prediction of Metal Hydrides for Hydrogen Storage, Part I: Prediction of Hydrogen Weight Percent. Int J Hydrogen Energy 2019, 44, 7337–7344. [Google Scholar] [CrossRef]
- Rahnama, A.; Zepon, G.; Sridhar, S. Machine Learning Based Prediction of Metal Hydrides for Hydrogen Storage, Part II: Prediction of Material Class. Int J Hydrogen Energy 2019, 44, 7345–7353. [Google Scholar] [CrossRef]
- Suwarno, S.; Dicky, G.; Suyuthi, A.; Effendi, M.; Witantyo, W.; Noerochim, L.; Ismail, M. Machine Learning Analysis of Alloying Element Effects on Hydrogen Storage Properties of AB2 Metal Hydrides. Int J Hydrogen Energy 2022, 47, 11938–11947. [Google Scholar] [CrossRef]
- Kim, J.M.; Ha, T.; Lee, J.; Lee, Y.-S.; Shim, J.-H. Prediction of Pressure-Composition-Temperature Curves of AB2-Type Hydrogen Storage Alloys by Machine Learning. Metals and Materials International 2023, 29, 861–869. [Google Scholar] [CrossRef]
- Maghsoudy, S.; Zakerabbasi, P.; Baghban, A.; Esmaeili, A.; Habibzadeh, S. Connectionist Technique Estimates of Hydrogen Storage Capacity on Metal Hydrides Using Hybrid GAPSO-LSSVM Approach. Sci Rep 2024, 14, 1503. [Google Scholar] [CrossRef] [PubMed]
- Wen, C.; Zhang, Y.; Wang, C.; Xue, D.; Bai, Y.; Antonov, S.; Dai, L.; Lookman, T.; Su, Y. Machine Learning Assisted Design of High Entropy Alloys with Desired Property. Acta Mater 2019, 170, 109–117. [Google Scholar] [CrossRef]
- Halpren, E.; Yao, X.; Chen, Z.W.; Singh, C.V. Machine Learning Assisted Design of BCC High Entropy Alloys for Room Temperature Hydrogen Storage. Acta Mater 2024, 270, 119841. [Google Scholar] [CrossRef]
- Witman, M.D.; Ling, S.; Wadge, M.; Bouzidi, A.; Pineda-Romero, N.; Clulow, R.; Ek, G.; Chames, J.M.; Allendorf, E.J.; Agarwal, S.; et al. Towards Pareto Optimal High Entropy Hydrides via Data-Driven Materials Discovery. J Mater Chem A 2023, 11, 15878–15888. [Google Scholar] [CrossRef]
- Huang, W.; Martin, P.; Zhuang, H.L. Machine-Learning Phase Prediction of High-Entropy Alloys. Acta Mater 2019, 169, 225–236. [Google Scholar] [CrossRef]
- Witman, M.; Ling, S.; Grant, D.M.; Walker, G.S.; Agarwal, S.; Stavila, V.; Allendorf, M.D. Extracting an Empirical Intermetallic Hydride Design Principle from Limited Data via Interpretable Machine Learning. J Phys Chem Lett 2020, 11, 40–47. [Google Scholar] [CrossRef]
- Tynes, M.; Gao, W.; Burrill, D.J.; Batista, E.R.; Perez, D.; Yang, P.; Lubbers, N. Pairwise Difference Regression: A Machine Learning Meta-Algorithm for Improved Prediction and Uncertainty Quantification in Chemical Search. J Chem Inf Model 2021, 61, 3846–3857. [Google Scholar] [CrossRef] [PubMed]
- https://wolverton.bitbucket.io/.
- Ward, L.; Agrawal, A.; Choudhary, A.; Wolverton, C. A General-Purpose Machine Learning Framework for Predicting Properties of Inorganic Materials. NPJ Comput Mater 2016, 2, 16028. [Google Scholar] [CrossRef]
- Dematteis, E.M.; Berti, N.; Cuevas, F.; Latroche, M.; Baricco, M. Substitutional Effects in TiFe for Hydrogen Storage: A Comprehensive Review. Mater Adv 2021, 2, 2524–2560. [Google Scholar] [CrossRef]
- Zhou, P.; Xiao, X.; Zhu, X.; Chen, Y.; Lu, W.; Piao, M.; Cao, Z.; Lu, M.; Fang, F.; Li, Z.; et al. Machine Learning Enabled Customization of Performance-Oriented Hydrogen Storage Materials for Fuel Cell Systems. Energy Storage Mater 2023, 63, 102964. [Google Scholar] [CrossRef]
- https://scikit-learn.org/stable/.
- https://pandas.pydata.org/.
- Lundberg, S.; Lee, S.-I. A Unified Approach to Interpreting Model Predictions. 31st Conference on Neural Information Processing Systems (NIPS 2017), Long Beach, CA, USA. 2017. [CrossRef]
- Meredig, B.; Antono, E.; Church, C.; Hutchinson, M.; Ling, J.; Paradiso, S.; Blaiszik, B.; Foster, I.; Gibbons, B.; Hattrick-Simpers, J.; et al. Can Machine Learning Identify the next High-Temperature Superconductor? Examining Extrapolation Performance for Materials Discovery. Mol Syst Des Eng 2018, 3, 819–825. [Google Scholar] [CrossRef]
Figure 5.
The kmeans++ clustering on dataset DS1 reported on a vs
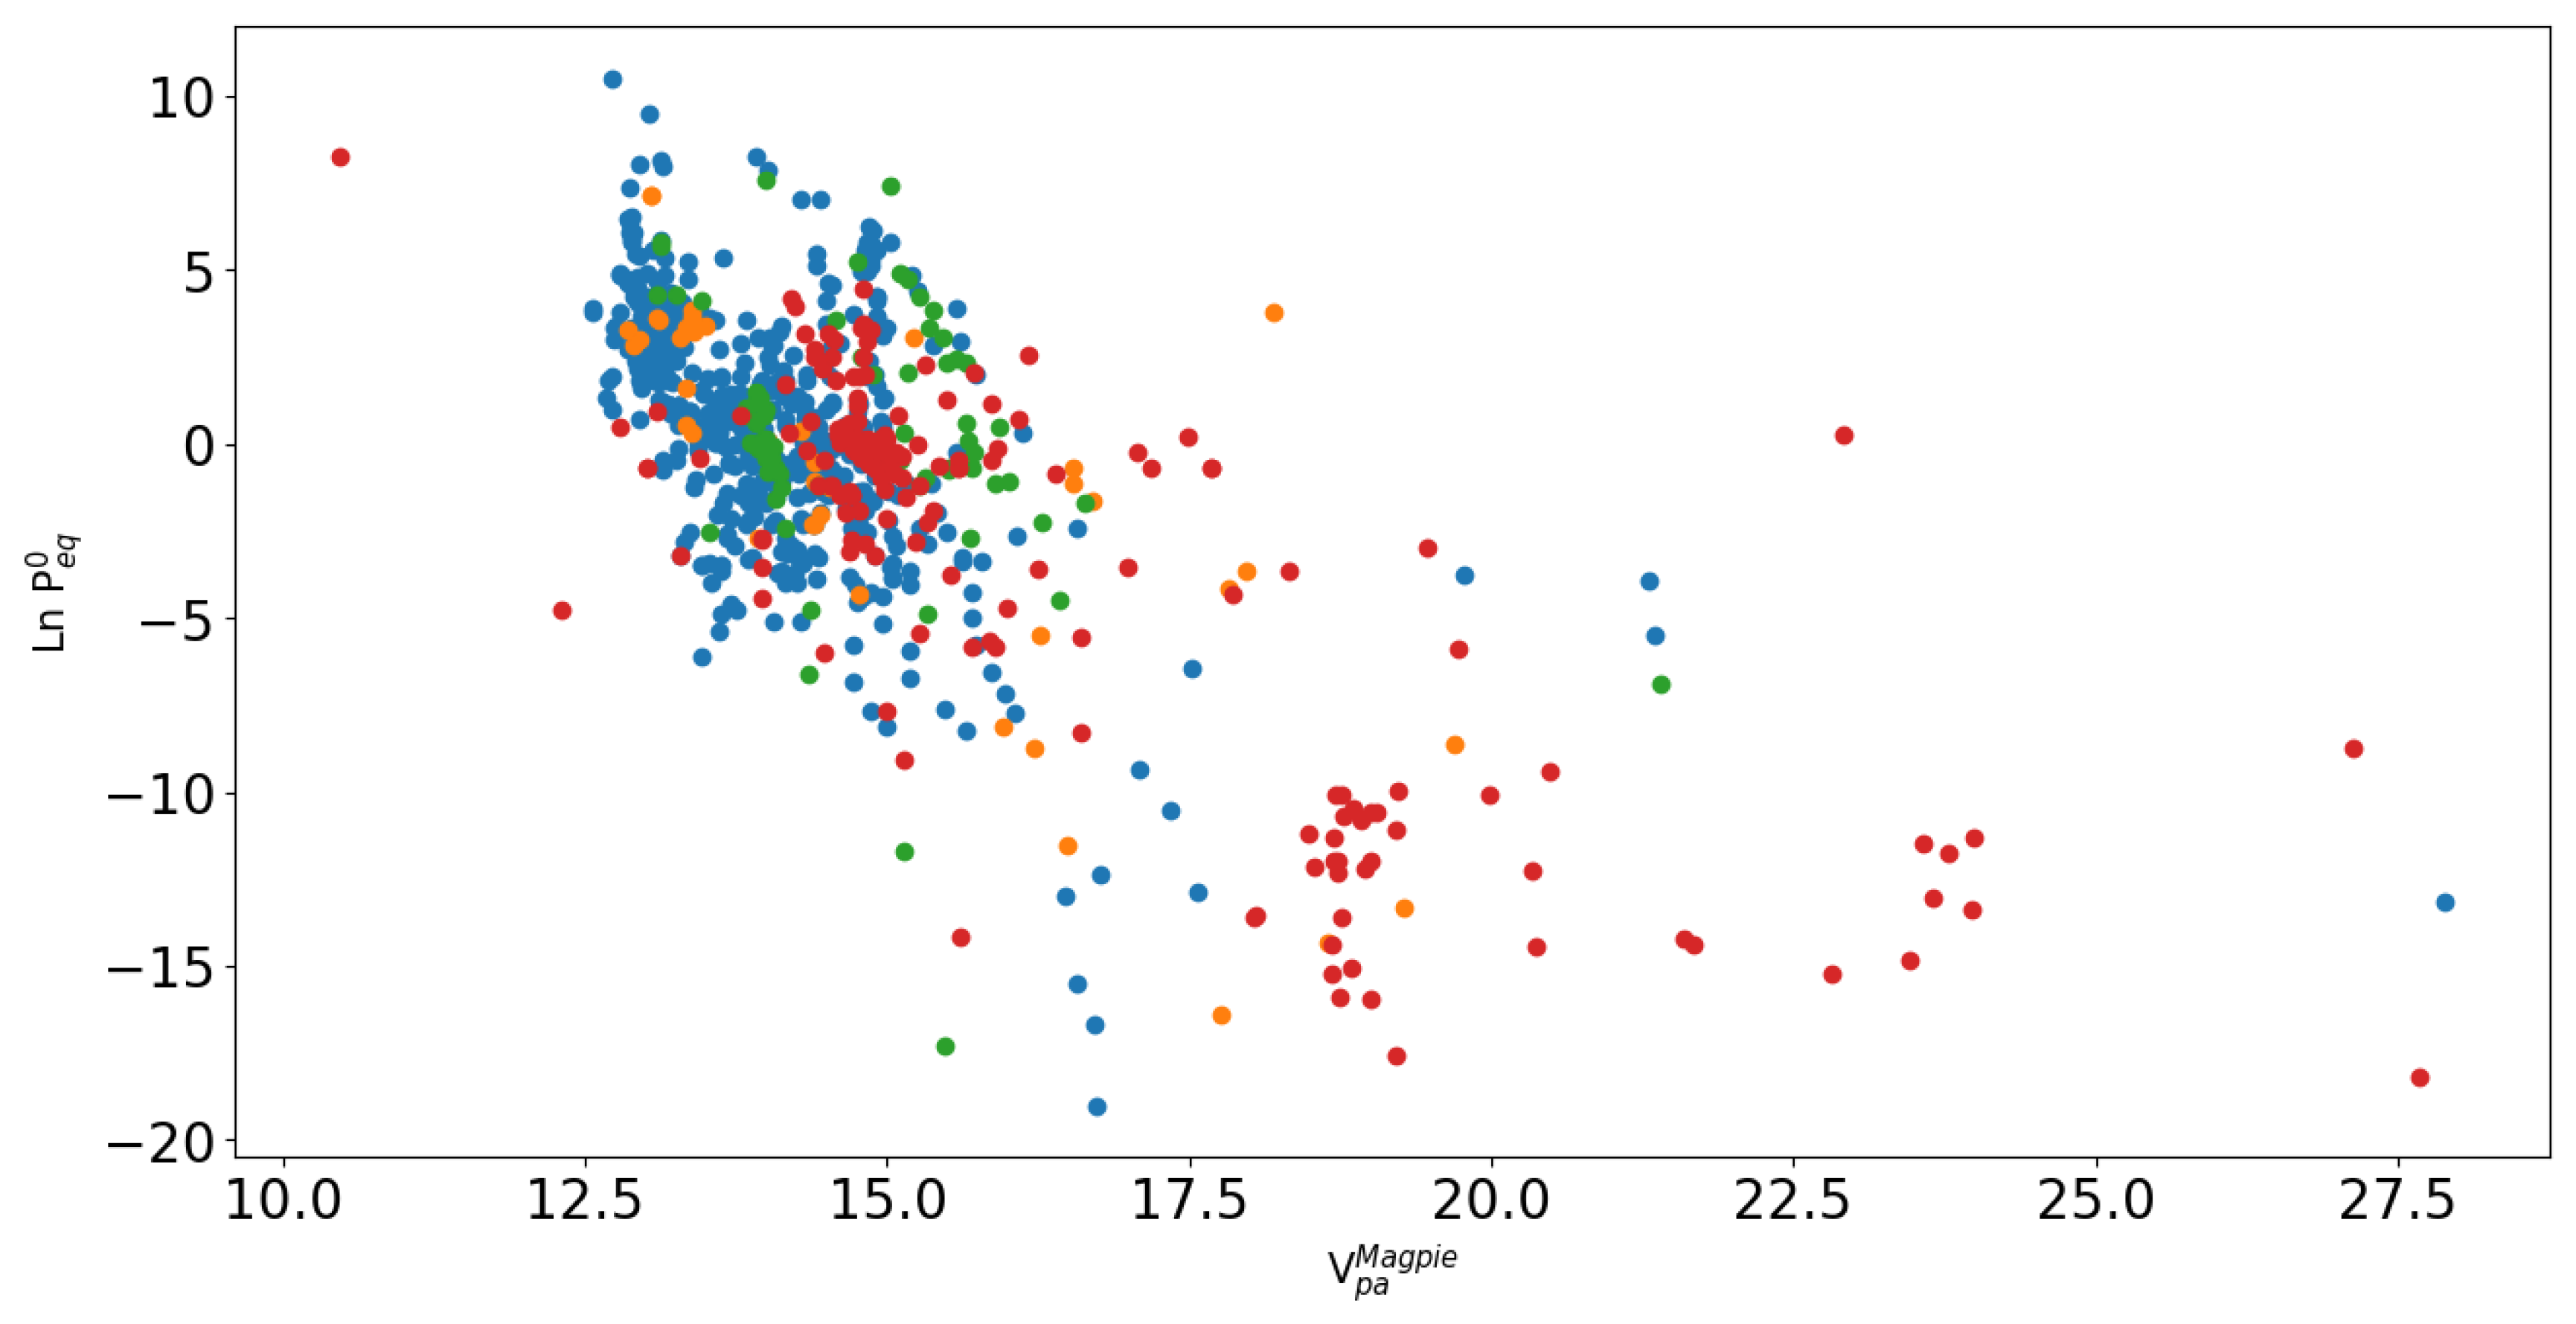
Table 3.
MAE and R2 values obtained from the cluster reported in column 1 (set aside as test set) when training a RFGB model on all the other clusters obtained from kmeans++.
Table 3.
MAE and R2 values obtained from the cluster reported in column 1 (set aside as test set) when training a RFGB model on all the other clusters obtained from kmeans++.
| Kmean++ cluster used as test set | Number of instances | MAE | R2 |
|---|---|---|---|
| 1 | 531 | 5.97 | -2.68 |
| 2 | 43 | 2.92 | 0.1 |
| 3 | 69 | 3.26 | 0.01 |
| 4 | 176 | 1.25 | 0.82 |
Table 4.
Mean Absolute Error (MAE) and R2 values obtained from the cluster (materials class) reported in column 1 (set aside as test set) when training a RFGB model on all the other clusters (materials classes) as defined in the HYDPARK database. Mg referees to Mg-based hydrides, SS refers to solid solutions and MIC refers to intermetallic compounds not included in previous clusters (other classes are self-explaining).
| Material Class | Quantity of data | MAE | R2 |
|---|---|---|---|
| A2B | 10 | 1.65 | -4.06 |
| AB | 78 | 3.9 | 0.10 |
| AB2 | 454 | 2.10 | 0.37 |
| AB5 | 106 | 1.80 | -0.5 |
| Mg | 32 | 2.68 | -0.26 |
| MIC | 52 | 3.74 | -0.41 |
| SS | 85 | 2.25 | 0.54 |
Disclaimer/Publisher’s Note: The statements, opinions and data contained in all publications are solely those of the individual author(s) and contributor(s) and not of MDPI and/or the editor(s). MDPI and/or the editor(s) disclaim responsibility for any injury to people or property resulting from any ideas, methods, instructions or products referred to in the content. |
© 2025 by the authors. Licensee MDPI, Basel, Switzerland. This article is an open access article distributed under the terms and conditions of the Creative Commons Attribution (CC BY) license (http://creativecommons.org/licenses/by/4.0/).
Copyright: This open access article is published under a Creative Commons CC BY 4.0 license, which permit the free download, distribution, and reuse, provided that the author and preprint are cited in any reuse.


