
Submitted:
01 May 2025
Posted:
06 May 2025
You are already at the latest version
Abstract
This study examined genetic diversity in the endangered medicinal plant Celastrus paniculatus across northern and northeastern Thailand to inform conservation strategies. Analysis of nuclear internal transcribed spacer (ITS) and ribulose-1,5-bisphosphate carboxylase/oxygenase large subunit (rbcL) markers in seven populations revealed 17 haplotypes (CpI1–CpI17), with 15 being population-specific. Genetic diversity varied significantly among populations: CMI showed the highest diversity (Hd = 0.944±0.070) while LEI and LPN displayed complete homogeneity. The haplotype network identified a central shared haplotype (CpI4), suggesting common ancestry, with the PLK population showing distinct genetic divergence through unique haplotypes separated by multiple mutation steps. Genetic distance calculations revealed close relationships between LEI and NPM populations (distance = 0.0004), with greater differentiation between PLK and other populations (distances > 0.005). Phylogenetic analyses confirmed species integrity while highlighting population clusters, especially PLK in ITS analyses and LPN in rbcL analyses. This genetic structure information provides a foundation for targeted conservation planning. Results suggest that conservation efforts should prioritize both genetically diverse populations (like CMI and MKM) and genetically distinct ones (like PLK) to preserve maximum evolutionary potential. This study delivers crucial molecular data for developing evidence-based conservation strategies to protect this valuable medicinal species from further decline.
Keywords:
Genetic divergence
; population structure
; plant conservation
; molecular phylogenetic
; nuclear and plastid markers
1. Introduction
Celastrus paniculatus Willd. (Celastraceae), commonly known as Jyotishmati, Malkangani or the “intellect tree,” is an evergreen woody climber with significant ethnomedicinal importance throughout its native range in Asia and Southeast Asia [1,2]. In Thailand, particularly in the northern and northeastern regions, this species has been traditionally utilized for its cognitive-enhancing properties, anti-inflammatory effects, and treatment of various ailments, including neurological disorders, rheumatism, and digestive complaints. The seeds contain various valuable bioactive compounds, including glycosides, alkaloids, coumarins, tannins, flavonoids, saponins, steroids, celastrine, celapanine, celapanigine, triterpenoids, polyalcohols, and sesquiterpenes that have demonstrated neuroprotective, antioxidant, and anti-inflammatory properties in pharmacological studies [2,3,4,5,6].
Despite its considerable medicinal value, C. paniculatus faces significant threats to its survival in Thailand. Habitat fragmentation due to agricultural expansion, over-harvesting for traditional medicine, and climate change have collectively contributed to its endangered status. The species now exists primarily in fragmented populations across northern and northeastern Thailand, raising concerns about genetic erosion and reduced adaptive potential. This situation necessitates the development of effective conservation strategies based on comprehensive genetic information to ensure the long-term survival of this valuable medicinal resource. Understanding the genetic diversity and population structure of endangered plant species is fundamental to designing appropriate conservation strategies. Genetic diversity represents the evolutionary potential of a species, enabling adaptation to environmental changes and resilience against diseases and pests. Loss of genetic variation can lead to inbreeding depression, reduced fitness, and increased extinction risk. For medicinal plants like C. paniculatus, genetic diversity may also correlate with variations in phytochemical profiles and therapeutic properties, making its conservation particularly important from both ecological and pharmacological perspectives.
Molecular markers have become invaluable tools for assessing genetic diversity and elucidating population structure in plant conservation genetics. Over the past decades, numerous molecular marker systems have been developed that offer advantages over traditional morphological and biochemical approaches [7,8]. These include restriction fragment length polymorphism (RFLP), amplified fragment length polymorphism (AFLP), random amplified polymorphic DNA (RAPD), simple sequence repeat (SSR), sequence characterized amplified region (SCAR), and inter-simple sequence repeat (ISSR), among others. For phylogenetic studies and population genetics of medicinal plants, DNA sequence-based markers have proven particularly informative. Among these, the nuclear internal transcribed spacer (ITS) region and the chloroplast ribulose-1,5-bisphosphate carboxylase/oxygenase large subunit (rbcL) gene complement each other effectively in revealing evolutionary patterns. The ITS region evolves relatively rapidly, providing insights into recent evolutionary events and fine-scale population structure, while the more conserved rbcL marker illuminates deeper evolutionary relationships and maternal lineage patterns in plants [8,9,10,11].
To date, comprehensive genetic studies of C. paniculatus in Thailand have been limited, creating a significant knowledge gap for conservation planning. Previous studies have primarily focused on the species’ phytochemical properties or have examined genetic diversity in other parts of its range, such as India. The lack of detailed genetic information specific to Thai populations hampers effective conservation efforts and sustainable utilization strategies for this valuable medicinal resource. This study aims to address this knowledge gap by investigating the genetic diversity and population structure of C. paniculatus across its distribution in northern and northeastern Thailand using both nuclear (ITS) and chloroplast (rbcL) DNA markers. By identifying patterns of genetic variation, unique haplotypes, and evolutionary relationships among populations, this research provides crucial information for developing targeted conservation strategies. The findings will contribute to preserving both overall genetic diversity and evolutionarily distinct populations, thereby maintaining the species’ adaptive potential and ensuring the continued availability of this important medicinal plant for future generations.
2. Materials and Methods
2.1. Chemicals
The experimental materials were sourced from reputable suppliers to ensure reliability. The RBC genomic DNA kit was acquired from Life Biomedical Limited (Cambridge, United Kingdom), while Takara Ex Taq polymerase was sourced from Takara Bio Inc. (Shiga, Japan). For nucleic acid visualization, GelRed™ Nucleic acid gel stain from Biotium Inc. (Hayward, California, USA) was utilized. The DNA purification kit (E.Z.N.A.® gel extraction kit) was purchased from Omega Bio-Tek, Inc., Georgia, USA. All solutions were prepared with nuclease-free water obtained from ITS (Thailand) Co., Ltd. (Bangkok, Thailand) to prevent contamination and maintain experimental integrity.
2.2. Sample Collection
Young leaves and fruit capsules of C. paniculatus were collected from mother trees across seven natural habitat locations in Thailand, with the altitude, latitude, and longitude of each collection site carefully documented (Table 1 and Figure 1). After collection, leaves were preserved in silica gel before being transported to the laboratory at Walai Rukhavej Botanical Research Institute (WRBRI), Mahasarakham University, where voucher specimens were subsequently deposited. All collected capsules underwent formal identification and authentication by taxonomists at both the Queen Sirikit Botanic Garden in Chiang Mai and at WRBRI, following the established species identification key for the Celastraceae family [12].
2.3. Molecular Analysis
Genomic DNA was extracted from collected leaf samples using the RBC genomic DNA kit in accordance with the manufacturer’s protocol. All extracted DNA samples were maintained at −20 °C for preservation until subsequent analysis could be performed. For molecular characterization, both nuclear and plastid DNA regions were targeted. The nuclear internal transcribed spacer (ITS) region was amplified using the primer pair ITS-F (5’-AGAAGTCGTAACAAGGTTTCCG-3’) and ITS-R (5’-TCCGCTTATTGATATGCTTAAA-3’) as previously described by Wonnapinij and Sriboonlert [13]. For the plastid DNA, the ribulose-1,5-bisphosphate carboxylase/oxygenase large subunit (rbcL) gene was amplified using primers RbcL-F (5’-ATGTCACCACAAACAGAGACTAAAGC-3’) and RbcL-R (5’-GCAGCAGCTAGTTCCGGGCTCCA-3’) following protocols established by Hasebe et al. [14] and Asahina et al. [15].
Polymerase chain reaction (PCR) amplifications were conducted in 25 μL reaction volumes containing 16.375 μL of deionized H₂O, 0.125 μL of Takara Ex Taq polymerase (5 units/μL), 2 μL of 2.5 mM dNTP mixture, 1 μL of each primer (forward and reverse), 2.5 μL of 10× DNA buffer, and 2 μL of template DNA. The thermal cycling profile consisted of an initial denaturation at 94 °C for 5 min, followed by 30 cycles of denaturation at 94 °C for 30 sec, primer annealing at 50 °C for 40 sec, and extension at 72 °C for 1 min, with a final extension step at 72 °C for 7 min. After amplification, PCR products were evaluated by electrophoresis on 1% agarose gels and visualized using GelRed™ Nucleic Acid Gel Stain. Amplicons of the expected size were excised and purified using the E.Z.N.A.® Gel Extract kit to remove any potential contaminants or non-specific products. The purified PCR products were then submitted to ATGC Co., Ltd., Thailand, for DNA sequencing using the Sanger sequencing technique, which provides high-quality sequence data suitable for subsequent phylogenetic and genetic diversity analyses.
2.4. Data Analysis
The complete ITS region (comprising partial 18S rRNA, ITS1, 5.8S rRNA, ITS2, and partial 28S rRNA) and rbcL sequences obtained in this study were systematically aligned using the ClustalW program [16] followed by manual inspection and refinement in the BioEdit sequence alignment editor [17]. This two-step alignment process ensured optimal sequence comparison by combining algorithmic alignment with expert visual verification.
For population genetic analysis, molecular diversity indices and haplotype data were generated using DnaSP v5 software [18], providing critical metrics on genetic variation within and between populations. Genetic differentiation between populations was quantified using both uncorrected p-distance and Kimura 2-parameter (K2P) distance metrics [19] as implemented in MEGA XI [20]. The K2P model was particularly valuable as it accounts for transitional and transversional substitution rate biases commonly observed in DNA sequence evolution. To visualize the relationships among haplotypes, a minimum-spanning network was constructed using the Network program (version 10.2) based on the median-joining network algorithm [21]. This network representation offered an intuitive visualization of genetic relationships and potential evolutionary pathways among the identified haplotypes of C. paniculatus populations.
Phylogenetic relationships were investigated through tree-based analyses of the unique haplotypes identified in both ITS and rbcL sequences across all sampled C. paniculatus populations. The analysis was strengthened by incorporating additional Celastrus species sequences retrieved from GenBank, providing a broader taxonomic context. Glyptopetalum feddei (H.Lév.) Ding Hou, represented by both matK and ITS sequences, was selected as an appropriate outgroup to root the phylogenetic trees based on its established taxonomic relationship within Celastraceae. For tree construction, two complementary phylogenetic methods were employed: Maximum Likelihood (ML) using the General Time Reversible model with gamma-distributed rate variation and invariant sites (GTR+G+I) [22], and the distance-based Neighbor-Joining method [23]. Both analyses were conducted using MEGA XI [24], with statistical confidence in the resulting tree topologies assessed through 1,000 bootstrap replicates. This dual-method approach provided a robust framework for evaluating phylogenetic hypotheses and identifying consistent patterns of evolutionary relationships among the studied taxa.
3. Results and Discussion
3.1. Genetic Variation and Molecular Diversity Indices
Molecular techniques have revolutionized plant genetic diversity and population structure analyses, offering significant advantages over conventional methods. These modern approaches provide researchers with enhanced efficiency through higher processing speeds and reduced costs, while requiring minimal plant material for analysis. Most importantly, they generate more accurate and reliable genetic diversity information, effectively overcoming the inherent limitations of traditional approaches [8,25,26].
Over the past several decades, researchers have developed and deployed a diverse array of molecular markers for investigating genetic diversity and population structure in plants. These include RFLP, AFLP, RAPD, SSR, SCAR, ISSR, and microsatellites. Additionally, specific genetic regions have proven particularly valuable as markers, including chloroplast maturase K (matK), ITS, and rbcL regions. This progressive development of marker technology has expanded the toolkit available to plant geneticists and taxonomists [7,9,10,11,27,28,29,30]. Among the various molecular markers, the ITS and rbcL regions have emerged as valuable genetic analysis tools. These markers form integral components of standardized plant DNA barcode systems, enabling rapid and accurate species identification by analyzing short, standardized genetic sequences. The adoption of these barcoding systems has facilitated more systematic approaches to understanding plant genetic diversity, evolutionary relationships, and population dynamics across diverse ecosystems [8,9,10,11].
In this study, both ITS and rbcL markers were employed to conduct a comprehensive genetic analysis of C. paniculatus samples collected from the northern and northeastern regions of Thailand, where this plant species is abundantly distributed. All sequences generated in the current investigation were deposited in GenBank under the accession numbers PV290460 through PV290476 for ITS sequences and PV295556 through PV295557 for rbcL sequences. Analysis of the 653 bp ITS sequences revealed nucleotide variation at 17 positions (2.60%), resulting in 17 distinct haplotypes (Table 2). The observed mutations comprised five pyrimidine transitions (positions 16, 34, 194, 420, and 594), two purine transitions (positions 186 and 196), and ten transversions (positions 1, 61, 70, 122, 124, 128, 172, 263, 503, and 520). This diversity in mutation types suggests multiple evolutionary events have shaped the genetic structure within the studied populations.
In contrast to the ITS region, the 1003 bp rbcL sequences showed minimal variation, with only one transversion mutation (0.09%) at position 636 (data not shown). This significantly lower variability indicates that the rbcL gene is more conserved than the ITS region in these populations. Our findings align with Mu et al. [9], who also reported high genetic variation in Chinese Celastrus based on the ITS region and low genetic variation based on rbcL sequences.
The molecular diversity analysis revealed significant variations in genetic diversity across the studied populations of C. paniculatus (Table 3), which were similar to previous studies by Mu et al. [9,28] using nuclear (ETS, ITS) and plastid regions (psbA-trnH, rbcL, rpl16, and trnL-F) markers. This research examined 62 individuals distributed among multiple populations, identifying 17 segregating sites that corresponded to 17 distinct haplotypes (designated CpI1−CpI17), with 15 being unique to specific populations. The CMI population demonstrated the highest level of genetic diversity with seven distinct haplotypes, exhibiting a high haplotype diversity index (Hd = 0.944±0.070) and the highest nucleotide diversity (Nd = 0.0039±0.0007). This suggests that CMI has maintained a robust genetic structure with minimal inbreeding or population bottlenecks.
Similarly, the MKM population showed substantial genetic variation with seven haplotypes and a high haplotype diversity (Hd = 0.911±0.077), indicating another genetically healthy population with considerable variation. The PLK population exhibited moderate genetic diversity (Hd = 0.556±0.090), while NPM and UBN populations showed relatively lower levels of genetic variation with haplotype diversities of 0.436±0.133 and 0.250±0.180, respectively. These intermediate values suggest that these populations may have experienced some degree of genetic drift or restricted gene flow.
In marked contrast to the diverse populations, the LEI and LPN populations displayed a complete absence of genetic variation (Hd = 0.000±0.000, Nd = 0.0000±0.0000), with each population containing only a single haplotype. This lack of diversity strongly suggests that these populations have experienced severe genetic bottlenecks, founder effects, or prolonged isolation. These findings have significant implications for conservation strategies. The genetically depauperate LEI and LPN populations should be prioritized for genetic rescue interventions to prevent further loss of adaptive potential. Meanwhile, the genetically diverse CMI and MKM populations could serve as potential sources of genetic material if translocation or breeding programs become necessary. The variation in genetic diversity across these populations underscores the importance of population-specific conservation approaches rather than implementing a single management strategy across all populations.
3.2. Haplotype Network Analysis
The haplotype network constructed from ITS sequences revealed a single genetic group with diverse haplotypes distributed across the sampled populations (Figure 2). This network structure suggests ongoing gene flow between populations while maintaining localized genetic variations. The central haplotype (CpI4) was the most frequent, shared by 23 samples from four populations (MKM, LEI, NPM, and PLK), indicating its potential role as an ancestral or founder haplotype in the region. Similarly, haplotype CpI9 appeared in seven samples across three populations (CMI, MKM, and NPM), further demonstrating connectivity between these locations.
Population-specific patterns of genetic diversity were evident throughout the network. The CMI population exhibited exceptionally high genetic variation, harboring multiple distinct haplotypes (CpI2, CpI3, CpI10, CpI12, and CpI13). This observation aligns with the molecular diversity indices, which identified CMI as having the highest haplotype diversity, possibly indicating this area as a center of genetic diversity or an ecological transition zone. In contrast, the LEI population was primarily associated with the central haplotype (CpI11) and lacked unique haplotypes, confirming its low genetic variation and suggesting a potential founder effect or recent population establishment. Similarly, LPN demonstrated limited genetic variation with only a single unique haplotype (CpI14), which may reflect either genetic bottlenecks or limited sampling in this region.
The MKM population displayed a well-distributed range of haplotypes (CpI4, CpI6, CpI7, and CpI8), suggesting significant genetic diversity and potentially indicating long-term population stability in this area. The UBN population contained multiple unique haplotypes (CpI16 and CpI17), indicating genetic differentiation that may result from geographic barriers or adaptation to local environmental conditions. While NPM was predominantly linked to the central haplotype (CpI11) with some variation, the PLK population featured a distinct haplotype (CpI1) separated by several mutation steps from other haplotypes. This genetic distance suggests possible geographic isolation, limited gene flow, or divergent selection pressures acting on the PLK population over time. The mutational steps separating CpI1 from the central haplotypes could represent an early stage of allopatric differentiation, warranting further investigation into the ecological and geographical factors influencing this population.
3.3. Genetic Differences
Genetic differentiation among the seven populations of C. paniculatus was quantified using two complementary distance measures: the Kimura-2-Parameter (K2P) model, which accounts for higher rates of transitions versus transversions, and the simpler p-distance model, which directly calculates the proportion of nucleotide differences between sequences [19,20]. The analysis revealed a spectrum of genetic relationships among populations. Pairwise genetic distances calculated using the p-distance model ranged from 0.0004 to 0.0065 (0.04% to 0.65% sequence divergence), while the K2P distances showed similar but slightly different values, ranging from 0.0004 to 0.0059 (0.04% to 0.59%). The congruence between these two distance metrics reinforces the reliability of the genetic differentiation patterns observed.
The populations of LEI and NPM exhibited the lowest genetic distance (0.0004 for both p-distance and K2P models), indicating remarkably high genetic similarity. This close relationship suggests recent connectivity, possible migration events, or shared ancestry between these geographically distinct populations. The near-identical genetic composition might indicate that these populations have experienced similar selective pressures or have maintained gene flow despite geographical separation. In contrast, several population pairs displayed substantially higher genetic divergence (p-distance and K2P values exceeding 0.005). Most notably, the PLK population showed significant differentiation when compared to CMI, LPN, MKM, and UBN populations. Similarly, the CMI population exhibited considerable genetic distance from both MKM and UBN populations. These elevated divergence values suggest either long-term isolation, adaptation to different environmental conditions, or historical separation events that have limited gene flow. The observed patterns of genetic diversity parallel those found in other plant species such as Liriodendron chinense [31].
The pattern of genetic distances across the study area suggests a complex evolutionary history for C. paniculatus in Thailand, potentially reflecting the influence of geographical barriers, habitat fragmentation, or climatic fluctuations on population connectivity and genetic exchange. These findings provide important baseline information for conservation strategies, particularly for identifying evolutionarily significant units within the species [8].
3.4. Phylogenetic Tree Analysis
The phylogenetic analyses using two different genetic markers provided complementary insights into the evolutionary relationships among the studied C. paniculatus populations in Thailand. The phylogenetic tree constructed using the nuclear ribosomal DNA region (partial 18S rRNA, ITS1, 5.8S rRNA, ITS2, and partial 28S rRNA sequences) revealed well-defined hierarchical relationships among the populations (Figure 3). This nuclear marker, known for its faster evolutionary rate, captured recent divergence patterns effectively [7,11,32].
Most individuals from PLK, LPN, MKM, NPM, and CMI formed a strongly supported monophyletic clade, indicating close genetic relationships and suggesting a shared evolutionary history. This clustering pattern suggests either recent population divergence or the maintenance of genetic connectivity through ongoing gene flow across most of the sampled range. The strong monophyly of this primary clade supports the taxonomic integrity of C. paniculatus in Thailand as a cohesive evolutionary unit. Within this main clade, several distinct subclades emerged with varying levels of support. Notably, individuals from the PLK population formed a distinct group, confirming the genetic divergence suggested by the haplotype network analysis. This genetic differentiation could be attributed to geographical isolation, ecological specialization, or historical vicariance events that limited gene flow between PLK and other populations.
Interestingly, the LPN population, together with a reference sequence from China, formed a moderately supported subclade nested within the primary Thai clade. This positioning suggests historical connectivity between Thai and Chinese populations, potentially indicating past migration corridors or a broader historical distribution range for the species. The intermediate phylogenetic position of the LPN population might represent an evolutionary transition zone between Thai and Chinese lineages [9].
In contrast to the Thai populations, reference sequences from India and several GenBank accessions formed distinct lineages separated by longer branch lengths, indicating substantial genetic divergence. This pattern suggests long-term geographical isolation or adaptive divergence between the Indian and Thai populations, potentially approaching species-level differentiation. The estimated divergence time between these lineages, based on molecular clock analyses of ITS regions, likely corresponds to Pleistocene climate fluctuations that altered forest distributions across Southeast Asia [27].
The phylogenetic reconstruction based on the chloroplast rbcL gene (Figure 4) largely corroborated the ITS-based findings while revealing additional evolutionary patterns. The rbcL gene, evolving more slowly than ITS regions, typically reflects deeper evolutionary relationships and maternal lineage history [33,34]. The majority of individuals from PLK, CMI, MKM, NPM, and LEI formed a well-supported monophyletic clade, confirming their close genetic relationship inferred from ITS data. The strong clustering of these populations in both nuclear and chloroplast markers suggests concordant evolutionary histories with limited impact from hybridization or introgression events.
Notably, the rbcL phylogeny revealed that individuals from LPN formed a separate, well-supported cluster, demonstrating greater genetic divergence than observed in the ITS phylogeny. This discordance between nuclear and chloroplast markers could indicate historical chloroplast capture through hybridization, lineage sorting effects, or different selective pressures acting on these genomic regions. The observed patterns of phylogenetic analysis parallel those reported in Chinese Celastrus [9,28]. Notably, the distinct positioning of LPN in the rbcL phylogeny further supports the hypothesis that this population represents a genetically distinct lineage, warranting conservation attention.
Reference sequences from other Celastrus species formed phylogenetically distinct clades in both analyses, confirming the taxonomic integrity of C. paniculatus as a valid species. The systematic relationships revealed by both markers also demonstrated the close affinity of certain Thai populations with reference sequences from China and more distant relationships with Indian lineages, suggesting an east-to-west pattern of historical dispersal and differentiation across the species’ range in Asia. The congruent yet complementary patterns revealed by these two independent genetic markers provide robust evidence for the evolutionary history and population structure of C. paniculatus in Thailand, offering valuable insights for taxonomy, biogeography, and conservation planning.
The genetic variation and haplotype network analysis provide robust support for the molecular diversity findings, revealing a complex genetic landscape among the studied C. paniculatus populations in Thailand. Populations such as CMI and MKM exhibited remarkably high genetic diversity, characterized by numerous distinct haplotypes and high haplotype diversity indices. This genetic richness suggests these areas may represent long-established populations or potential refugia that maintained diversity through historical climate fluctuations. In contrast, LEI and LPN populations demonstrated limited genetic variation, possibly indicating recent founder events, genetic bottlenecks, or edge-of-range effects that have constrained their genetic diversity. The observed genetic structure reflects a dynamic evolutionary history, balancing shared ancestry with localized differentiation. The central position and high frequency of haplotype CpI4 across multiple populations suggest it likely represents an ancestral lineage from which other haplotypes have diverged. This pattern of star-like radiation from a common ancestor is characteristic of recent population expansion following historical bottlenecks, possibly associated with post-glacial forest recolonization events in Southeast Asia.
Notably, UBN and PLK populations harbored multiple private haplotypes (haplotypes exclusive to a single population), indicating significant genetic uniqueness. This pattern strongly suggests a degree of reproductive isolation and limited gene flow with other populations, potentially due to geographical barriers, phenological differences, or local adaptation to specific ecological niches. These populations may represent distinct evolutionary units worthy of special conservation attention as they contain unique genetic variations not found elsewhere within the range of the species. The widespread distribution of haplotype CpI11 across geographically distant populations provides compelling evidence for historical connectivity or ancient dispersal events that established a common genetic foundation throughout the region. This shared genetic lineage might reflect historical migration corridors that facilitated gene flow during periods of forest continuity before fragmentation created the current population structure.
Future research should integrate these genetic findings with ecological and environmental data to explore potential adaptive divergence among populations. Expanding the sampling to include populations from neighboring countries would help establish a comprehensive phylogeographic framework for understanding the species’ evolutionary history across its entire range. Genome-wide approaches, such as restriction site-associated DNA sequencing (RAD-seq) or whole-genome resequencing, would provide higher resolution for detecting fine-scale population structure and signatures of selection [10,33,34,35]. Additionally, studies incorporating paleoclimatic modeling could help reconstruct historical distribution patterns and identify potential refugia that shaped current genetic diversity [31,36]. Conservation efforts should prioritize populations with high genetic diversity (CMI, MKM) as reservoirs of adaptive potential, while also protecting genetically distinct populations (UBN, PLK) to preserve unique evolutionary lineages. Finally, reciprocal transplant experiments could test for local adaptation among genetically divergent populations, providing insights into the ecological drivers of genetic differentiation and informing conservation management strategies in the face of ongoing climate change.
4. Conclusions
The genetic analysis of C. paniculatus populations across northern and northeastern Thailand revealed complex evolutionary patterns and meaningful insights into the species’ population structure. Using nuclear ITS and chloroplast rbcL markers, the study identified significant variation in genetic diversity among the seven studied populations. The CMI and MKM populations exhibited remarkably high genetic diversity with numerous distinct haplotypes, suggesting these areas may represent historical refugia or long-established populations. In contrast, LEI and LPN demonstrated limited genetic variation, potentially indicating genetic bottlenecks or recent founder events. The haplotype network analysis revealed a star-like pattern radiating from central haplotype CpI4, indicating a common ancestral lineage characteristic of recent population expansion. UBN and PLK populations harbored multiple private haplotypes, suggesting limited gene flow due to geographical isolation or local adaptation. The widespread distribution of haplotype CpI11 provided evidence for historical connectivity throughout the region. Phylogenetic analyses confirmed the taxonomic integrity of C. paniculatus while revealing population-specific clustering patterns. Genetic distance analyses showed LEI and NPM with the closest relationship (0.0004 for both p-distance and K2P), while PLK displayed significant differentiation from other populations. These findings establish a foundation for effective conservation strategies for this valuable medicinal plant, highlighting the importance of preserving both genetically diverse and distinct populations to maintain the species’ overall genetic heritage and evolutionary capacity.
Author Contributions
Conceptualization, W.S. and S.T.; methodology, K.K., W.P., W.S. and S.T.; software, W.S. and S.T.; validation, K.K., W.P., W.S. and S.T.; formal analysis, W.S. and S.T.; investigation, K.K., W.P. and S.T.; resources, S.T.; data curation, W.S. and S.T.; writing—original draft preparation, K.K., W.P., W.S. and S.T.; writing—review and editing, W.S. and S.T.; visualization, W.P. and W.S.; supervision, S.T.; project administration, S.T.; funding acquisition, S.T. All authors have read and agreed to the published version of the manuscript.
Funding
This research was funded by Mahasarakham University, Thailand.
Data Availability Statement
The original contributions presented in this study are included in the article. Further inquiries can be directed to the corresponding author.
Acknowledgments
The authors thank Walai Rukhavej Botanical Research Institute, Mahasarakham University, for all the research facilities.
Conflicts of Interest
The authors declare no conflicts of interest.
References
- Francis, J.W.; Dandu, M.M.; Sardesai, M.M.; Dhabe, A.S. Note on Celastrus paniculatus Willd. ssp. Aggregatus K.M. Matthew ex K.T. Matthew (Celastraceae). JoTT Note. 2012, 4, 3450–3453. [Google Scholar] [CrossRef]
- Mohanty, A.; Mohanty, M.; Panda, P.C.; Nayak, S.; Mohanty, S. Phytochemistry, ethnopharmacology and conservation through biotechnological approaches: A critical review on the endangered medicinal plant Celastrus paniculatus. Proc. Natl. Acad. Sci. India. Sect. B Biol. Sci. 2025. [Google Scholar] [CrossRef]
- Mohan, G.K.; Sachin, Y.S.; Manohar, V.P.; Dipak, L.R.; Sanjay, J.S. Pharmacognostical investigation and physicochemical analysis of Celastrus paniculatus Willd. leaves. Asian Pac. J. Trop. Biomed. 2012, 2, 1232–1236. [Google Scholar] [CrossRef]
- Kulkarni, Y.A.; Agarwal, S.; Garud, M.S. Effect of Jyotishmati (Celastrus paniculatus) seeds in animal models of pain and inflammation. J. Ayurveda Integr. Med. 2015, 6, 82–88. [Google Scholar] [CrossRef]
- Sharma, G.N.; Kaur, H.; Shrivastava, B.; Arora, S.C. A review from historical to current-Celastrus paniculatus. Int. J. Pharm. Pharmaceut. Sci. 2020, 12, 15–20. [Google Scholar] [CrossRef]
- Faldu, K.G.; Patel, S.S.; Shah, J.S. Celastrus paniculatus oil ameliorates NF-KB mediated neuroinflammation and synaptic plasticity in the scopolamine-induced cognitive impairment rat model. Metab. Brain Dis. 2023, 38, 1405–1419. [Google Scholar] [CrossRef]
- Chen, W.; Hou, L.; Zhang, Z.; Pang, X.; Li, Y. Genetic diversity, population structure, and linkage disequilibrium of a core collection of Ziziphusjujuba assessed with genome-wide SNPs developed by genotyping-by-sequencing and SSR markers. Front. Plant Sci. 2017, 8, 575. [Google Scholar]
- Bidyananda, N.; Jamir, I.; Nowakowska, K.; Varte, V.; Vendrame, W.A.; Devi, R.S.; Nongdam, P. Plant genetic diversity studies: Insights from DNA marker analyses. Int. J. Plant Biol. 2024, 15, 607–640. [Google Scholar] [CrossRef]
- Mu, X.Y.; Zhao, L.C.; Zhang, Z.X. Molecular analysis of Chinese Celastrus and Tripterygium and implications in medicinal and pharmacological studies. PLoS ONE, 2017, 12, e0169973. [Google Scholar] [CrossRef]
- Xia, M.Z.; Li, Y.; Zhang, F.Q.; Yu, J.Y.; Khan, G.; Chi, X.F.; Xu, H.; Chen, S.L. Reassessment of the phylogeny and systematics of Chinese Parnassia (Celastraceae): A thorough investigation using whole plastomes and nuclear ribosomal DNA. Front. Plant Sci. 2022, 13, 855944. [Google Scholar] [CrossRef]
- Prompen, B.; Saijuntha, W.; Pilap, W.; Thanonkeo, S. Genetic diversity and population structure of Siamese rosewood (Dalbergia cochinchinensis Pierre) in Thailand using matK and internal transcribed spacer markers. Forests. 2025, 16, 332. [Google Scholar] [CrossRef]
- Hou, D.; Sivanov, I.A.; Welzen, P.C.V.; Duyfjes, B.E.E.; Harwood, B.; Chayamarit, K.; Wilde, W.J.; Atkins, S. Flora of Thailand. The Forest Herbarium, Royal Forest Department, Bangkok, Thailand, 2010; 10.
- Wonnapinij, P.; Sriboonlert, A. Molecular phylogenetics of species of Bulbophyllum sect. Trias (Orchidaceae; Epidendroideae; Malaxidae) based on nrITS and plastid rbcL and matK. Phytotaxa. 2015, 226, 1–7. [Google Scholar] [CrossRef]
- Hasebe, M.; Omori, T.; Nakazawa, M.; Sano, T.; Kato, M.; Iwatsuki, K. rbcL gene sequences provide evidence for the evolutionary lineages of leptosporangiate ferns. Proc. Nat. Acad. Sci. 1994, 91, 5730–5734. [Google Scholar] [CrossRef] [PubMed]
- Asahina, H.; Shinozaki, J.; Masuda, K.; Morimitsu, Y.; Satake, M. Identification of medicinal Dendrobium species by phylogenetic analyses using matK and rbcL sequences. J. Nat. Med. 2010, 64, 133–138. [Google Scholar] [CrossRef]
- Larkin, M. A.; Blackshields, G.; Brown, N.P.; Chenna, R.; McGettigan, P.A.; McWilliam, H.; Valentin, F.; Wallace, I.M.; Wilm, A.; Lopez, R.; et al. Clustal W and Clustal X version 2.0. Bioinformatics. 2007, 23, 2947–2948. [Google Scholar] [CrossRef]
- Hall, T.A. BioEdit: a user-friendly biological sequence alignment editor and analysis program for Windows 95/98/ NT. Nucleic Acids Symp. Ser. 1999, 41, 95–98. [Google Scholar]
- Librado, P.; Rozas, J. DnaSP v5: a software for comprehensive analysis of DNA polymorphism data. Bioinformatics. 2009, 25, 1451–1452. [Google Scholar] [CrossRef]
- Kimura, M. A simple method for estimating evolutionary rate of base substitutions through comparative studies of nucleotide sequences. J. Mol. Evol. 1980, 16, 111–120. [Google Scholar] [CrossRef]
- Tamura, K.; Stecher, G.; Kumar, S. MEGA 11: Molecular evolutionary genetics analysis version 11. Mol. Biol. Evol. 2021, 18, 3022–3027. [Google Scholar] [CrossRef]
- Bandelt, H.J.; Forster, P.; Röhl, A. Median-joining networks for inferring intraspecific phylogenies. Mol. Biol. Evol. 1999, 16, 37–48. [Google Scholar] [CrossRef]
- Nei, M.; Kumar, S. Molecular Evolution and Phylogenetics; Oxford University Press: New York, USA, 2000. [Google Scholar]
- Saitou, N.; Nei, M. The neighbor-joining method: a new method for reconstructing phylogenetic trees. Mol. Biol. Evol. 1987, 4, 406–425. [Google Scholar] [PubMed]
- Kumar, S.; Stecher, G.; Li, M.; Knyaz, C.; Tamura, K. MEGA X: Molecular evolutionary genetics analysis across computing platforms. Mol. Biol. Evol. 2018, 35, 1547–1549. [Google Scholar] [CrossRef]
- Amom, T.; Nongdam, P. The use of molecular marker methods in plants: A review. Int. J. Curr. Res. Rev. 2017, 9, 1–7. [Google Scholar]
- Ramesh, P.; Mallikarjuna, G.; Sameena, S.; Kumar, A.; Gurulakshmi, K.; Reddy, B.V.; Reddy, P.C.O.; Sekhar, A.C. Advancements in molecular marker technologies and their applications in diversity studies. J. Biosci. 2020, 45, 1–15. [Google Scholar] [CrossRef]
- Raju, N.L.; Prasad, M.N.V. Genetic diversity analysis of Celastrus paniculatus Willd.-a nearly threatened, cognitive and intelligence enhancer by RAPD markers. Func. Plant Sci. Biotechnol. 2007, 1, 195–199. [Google Scholar]
- Mu, X.Y.; Zhao, L.C.; Zhang, Z.X. Phylogeny of Celastrus L. (Celastraceae) inferred from two nuclear and three plastid markers. J. Plant Res. 2012, 125, 619–630. [Google Scholar] [CrossRef]
- Bal, P.; Panda, P.C. Molecular characterization and phylogenetic relationships of Dalbergia species of eastern India based on RAPD and ISSR analysis. Int. J. Innov. Science Res. Technol. 2018, 3, 417–422. [Google Scholar]
- Hartvig, I.; So, T.; Changtragoon, S.; Tran, H.T.; Bouamanivong, S.; Theilade, I.; Kjaer, E.D.; Nielsen, L.R. Population genetic structure of the endemic rosewoods Dalbergia cochinchinensis and D. oliveri at a regional scale reflects the Indochinese landscape and life-history traits. Ecol. Evol. 2018, 8, 530–545. [Google Scholar] [CrossRef]
- Shen, Y.; Cheng, Y.; Li, K.; Li, H. Integrating phylogeographic analysis and geospatial methods to infer historical dispersal routes and glacial refugia of Liriodendron chinense. Forests. 2019, 10, 565. [Google Scholar] [CrossRef]
- Hartvig, I.; Czako, M.; Kjaer, E.D.; Nielsen, L.R.; Theilade, I. The use of DNA barcoding in identification and conservation of rosewood (Dalbergia spp.). PLoS ONE. 2015, 10, e0138231. [Google Scholar] [CrossRef]
- Yan, K.; Lu, X.; Li, W.; Sun, C.; Zhou, X.; Wang, Y. Chloroplast genome diversity and molecular evolution in hypericaceae: New insights from three Hypericum species. Int. J. Mol. Sci. 2025, 26, 323. [Google Scholar] [CrossRef] [PubMed]
- Xiao, X.; Chen, J.; Ran, Z.; Huang, L.; Li, Z. Comparative analysis of complete chloroplast genomes and phylogenetic relationships of 21 sect. Camellia (Camellia L.) plants. Genes. 2025, 16, 49. [Google Scholar] [PubMed]
- Hussain, H.; Nisar, M. Assessment of plant genetic variations using molecular markers: A review. J. Appl. Biol. Biotechnol. 2020, 8, 99–109. [Google Scholar]
- Svenning, J.C.; Eiserhardt, W.L.; Normand, S.; Ordonez, A.; Sandel, B. The influence of paleoclimate on present-day patterns in biodiversity and ecosystems. Annu. Rev. Ecol. Syst. 2015, 46, 551–572. [Google Scholar] [CrossRef]
Figure 1.
Map showing the geographic distribution of Celastrus paniculatus sampling locations in this study. Locality codes are provided in Table 1.
Figure 1.
Map showing the geographic distribution of Celastrus paniculatus sampling locations in this study. Locality codes are provided in Table 1.
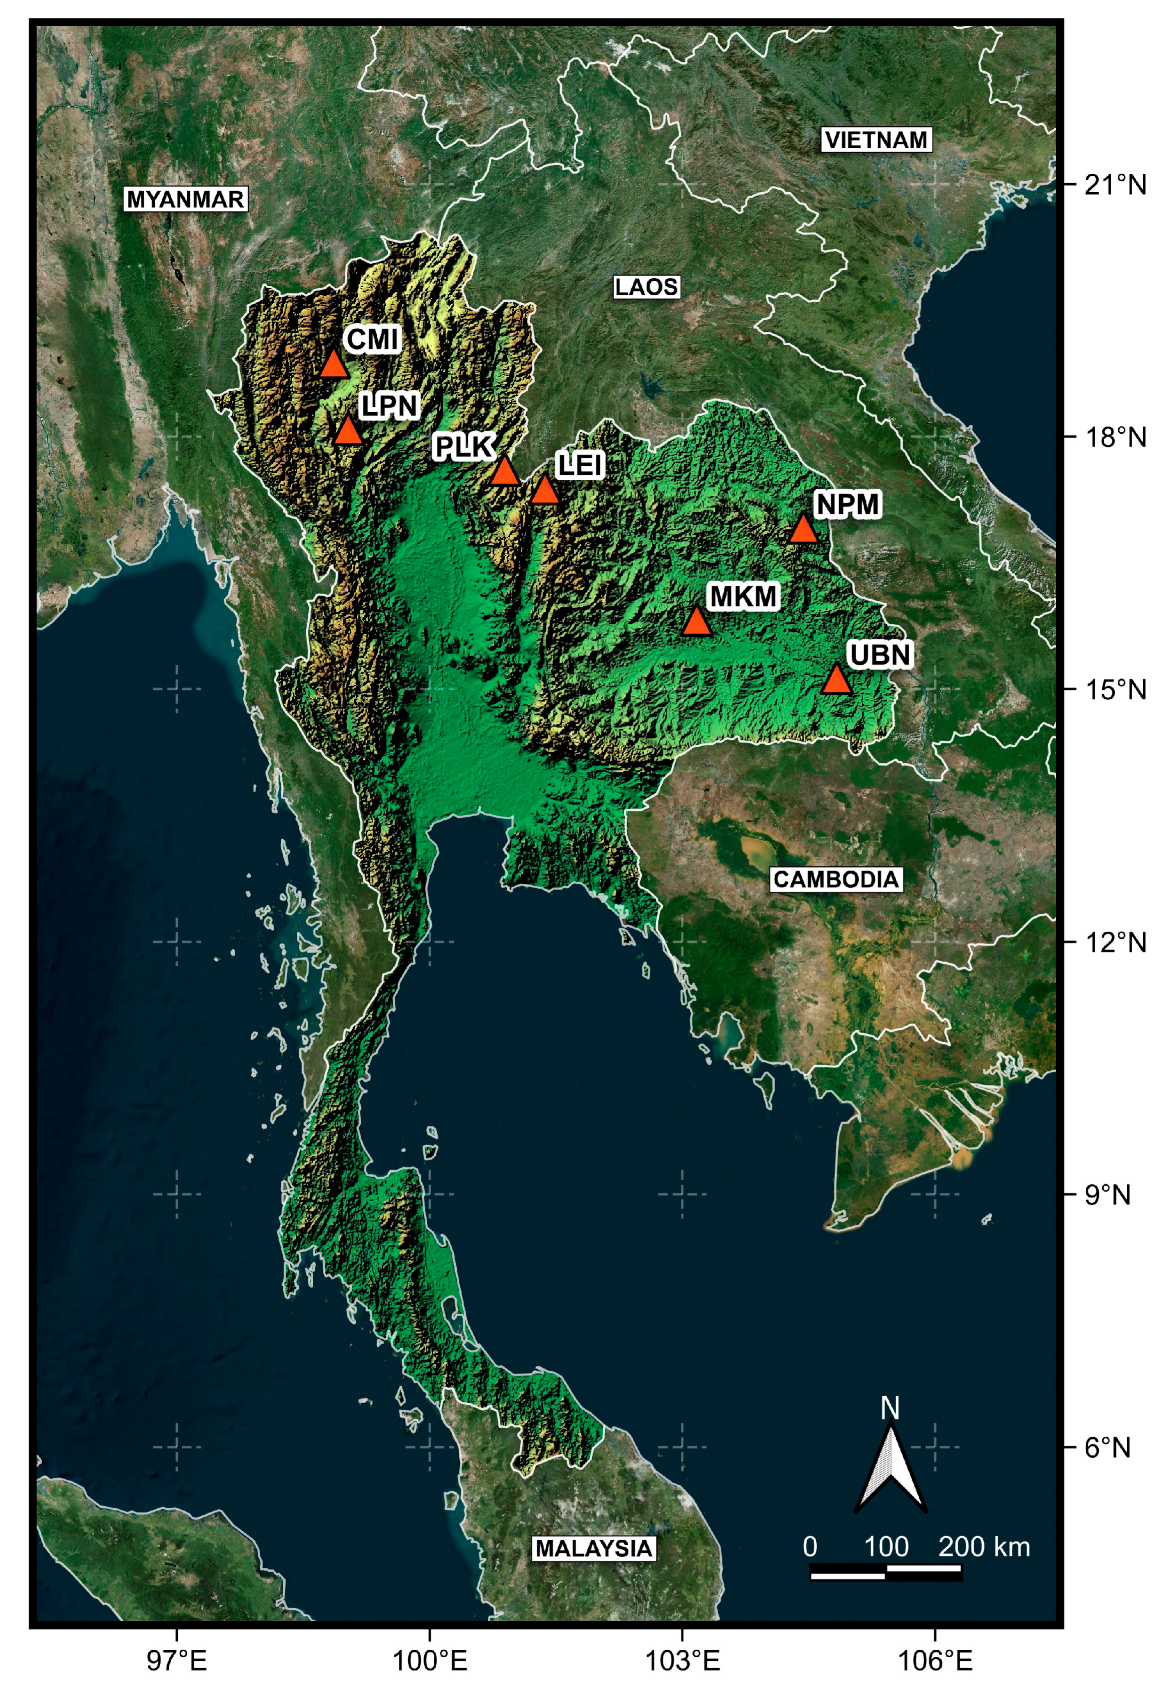
Figure 2.
The minimum spanning haplotype network constructed from the ITS haplotypes of Celastrus paniculatus from Thailand. Different colors in the haplotype networks represent the various localities examined in this study. The size of each circle reflects the proportion of specimens associated with each haplotype. The length of each branch represents the number of mutational steps (ms), with values greater than one displayed. Locality codes are provided in Table 1.
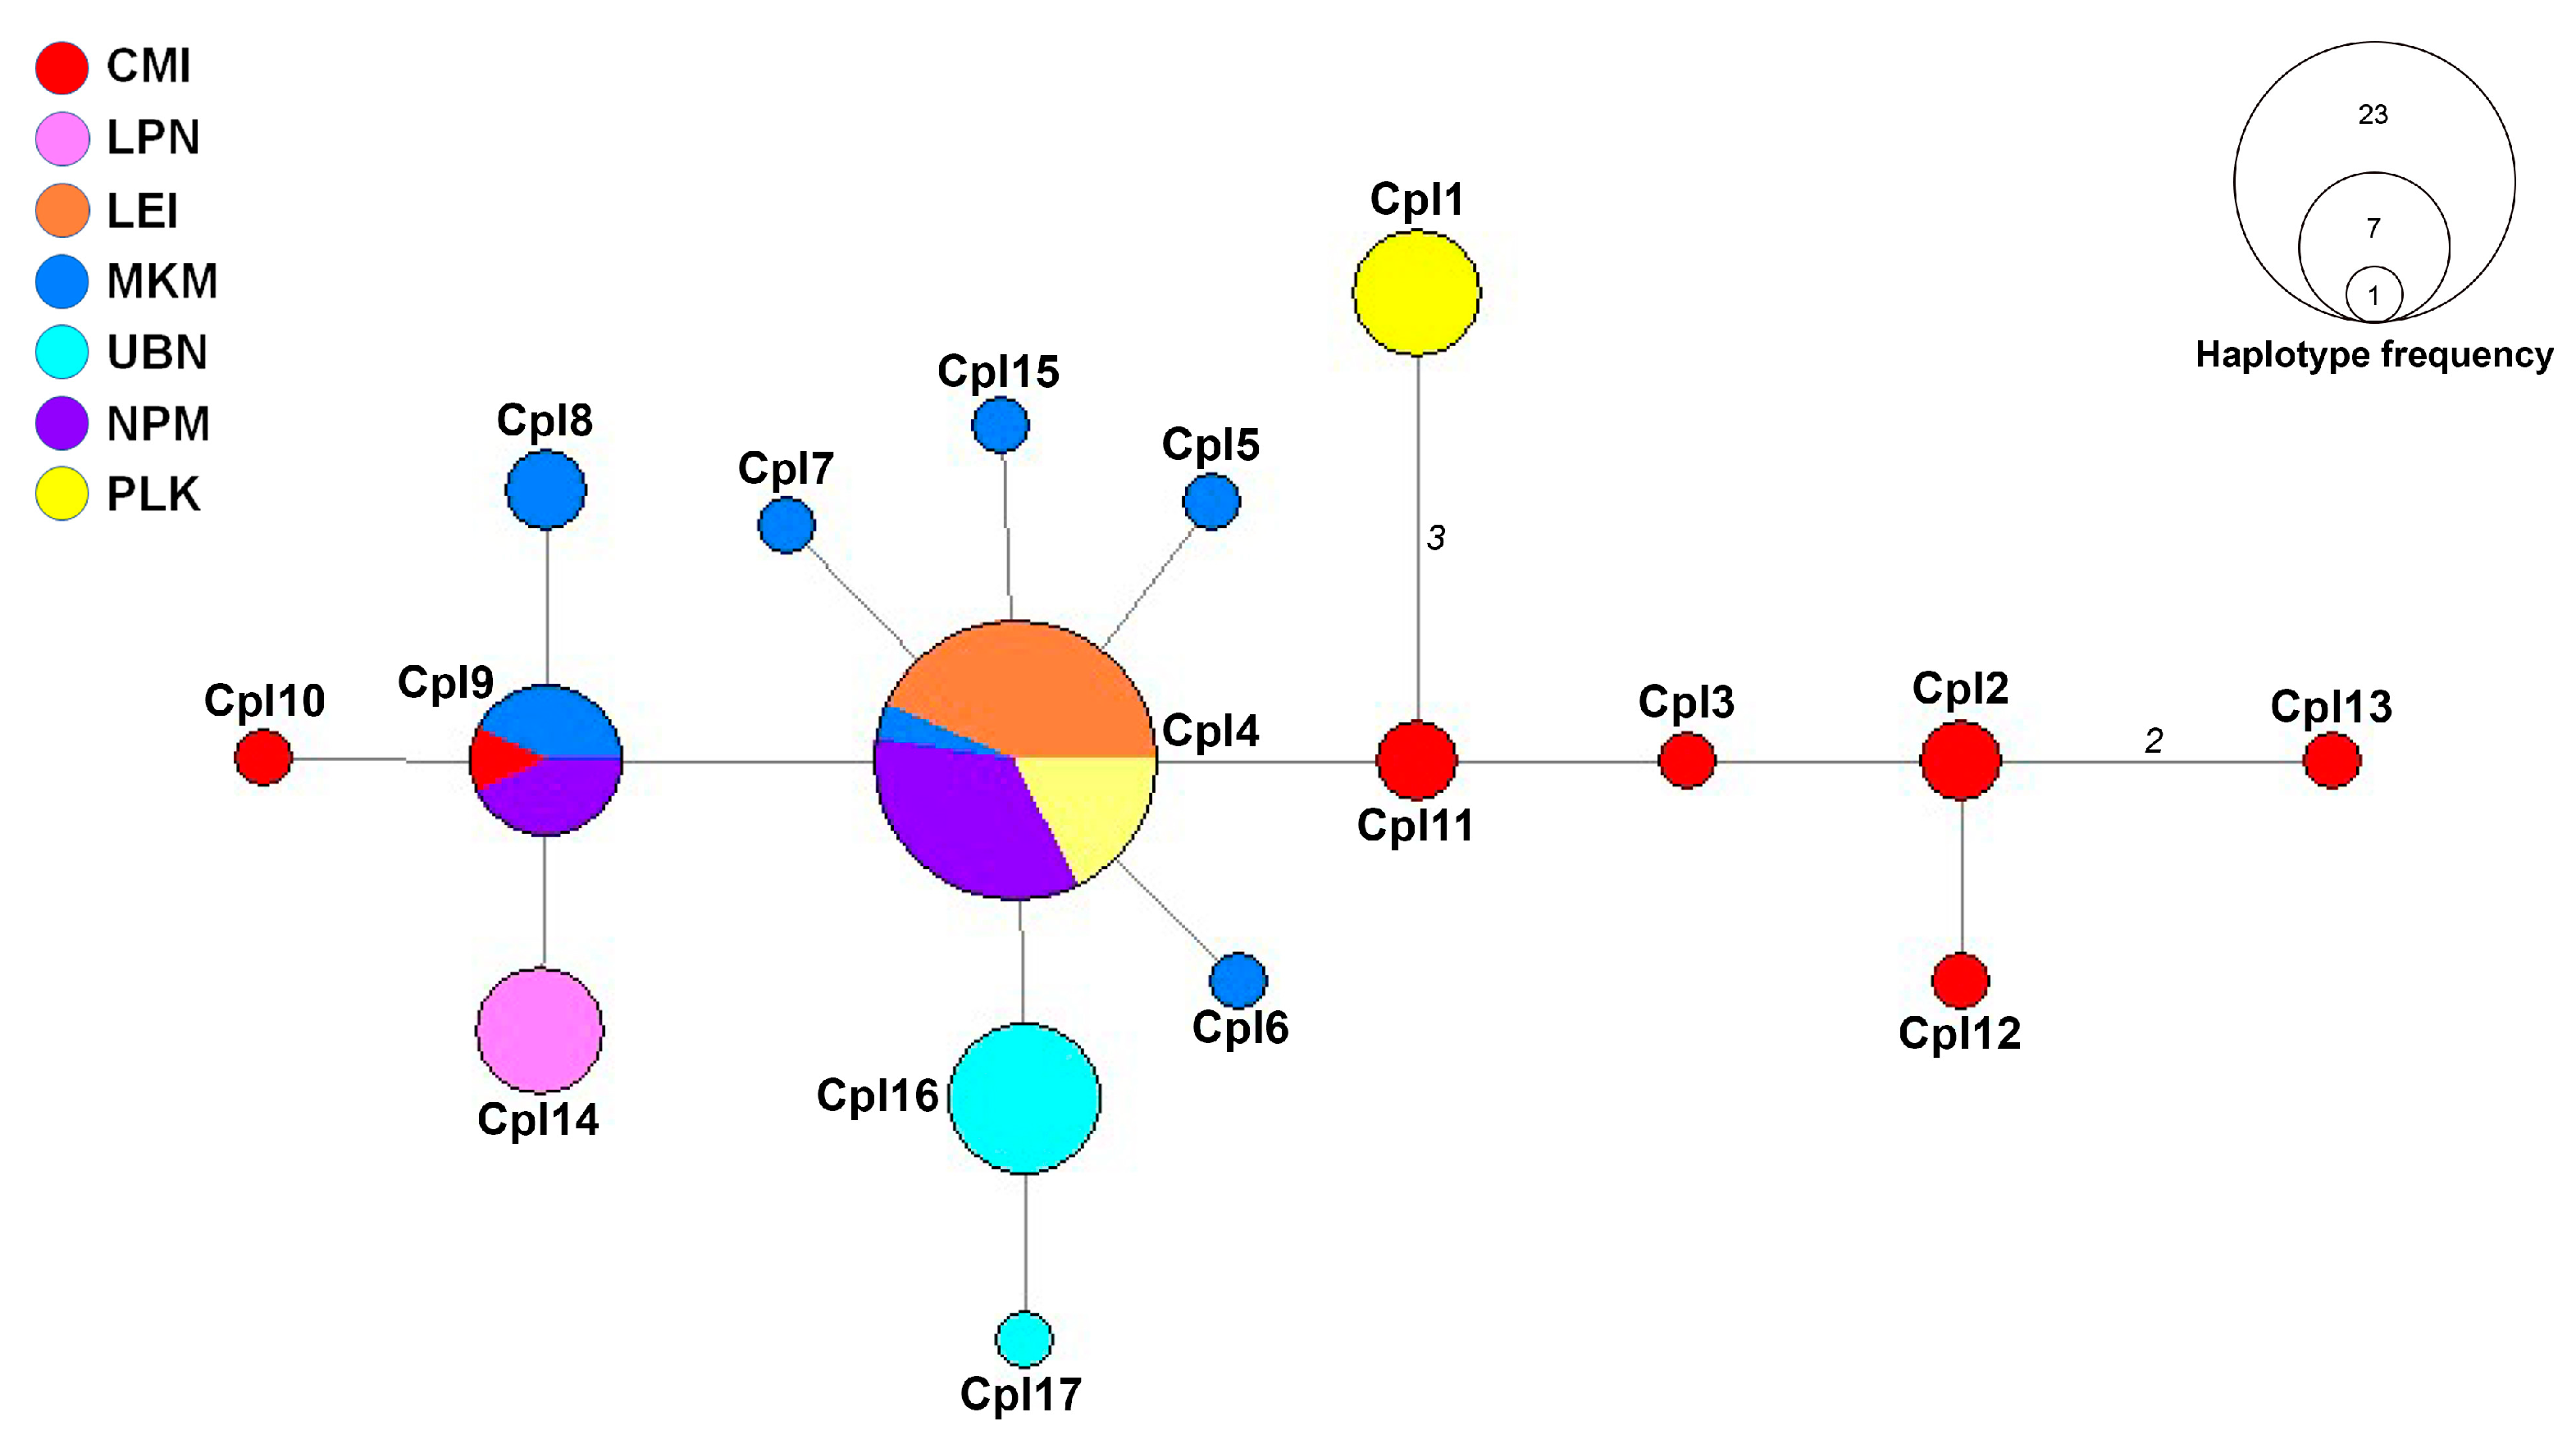
Figure 3.
Phylogenetic tree based on ITS sequences showing relationships among Celastrus paniculatus samples from this study and previously published sequences of C. paniculatus and other Celastrus species from GenBank. Numbers at nodes indicate bootstrap support values from maximum likelihood/maximum parsimony analyses. Glyptopetalum feddei was used as an outgroup.

Figure 4.
Phylogenetic tree based on rbcL sequences showing relationships among Celastrus paniculatus samples from this study and previously published sequences of C. paniculatus and other Celastrus species from GenBank. Numbers at nodes indicate bootstrap support values from maximum likelihood/maximum parsimony analyses. Glyptopetalum feddei was used as an outgroup.
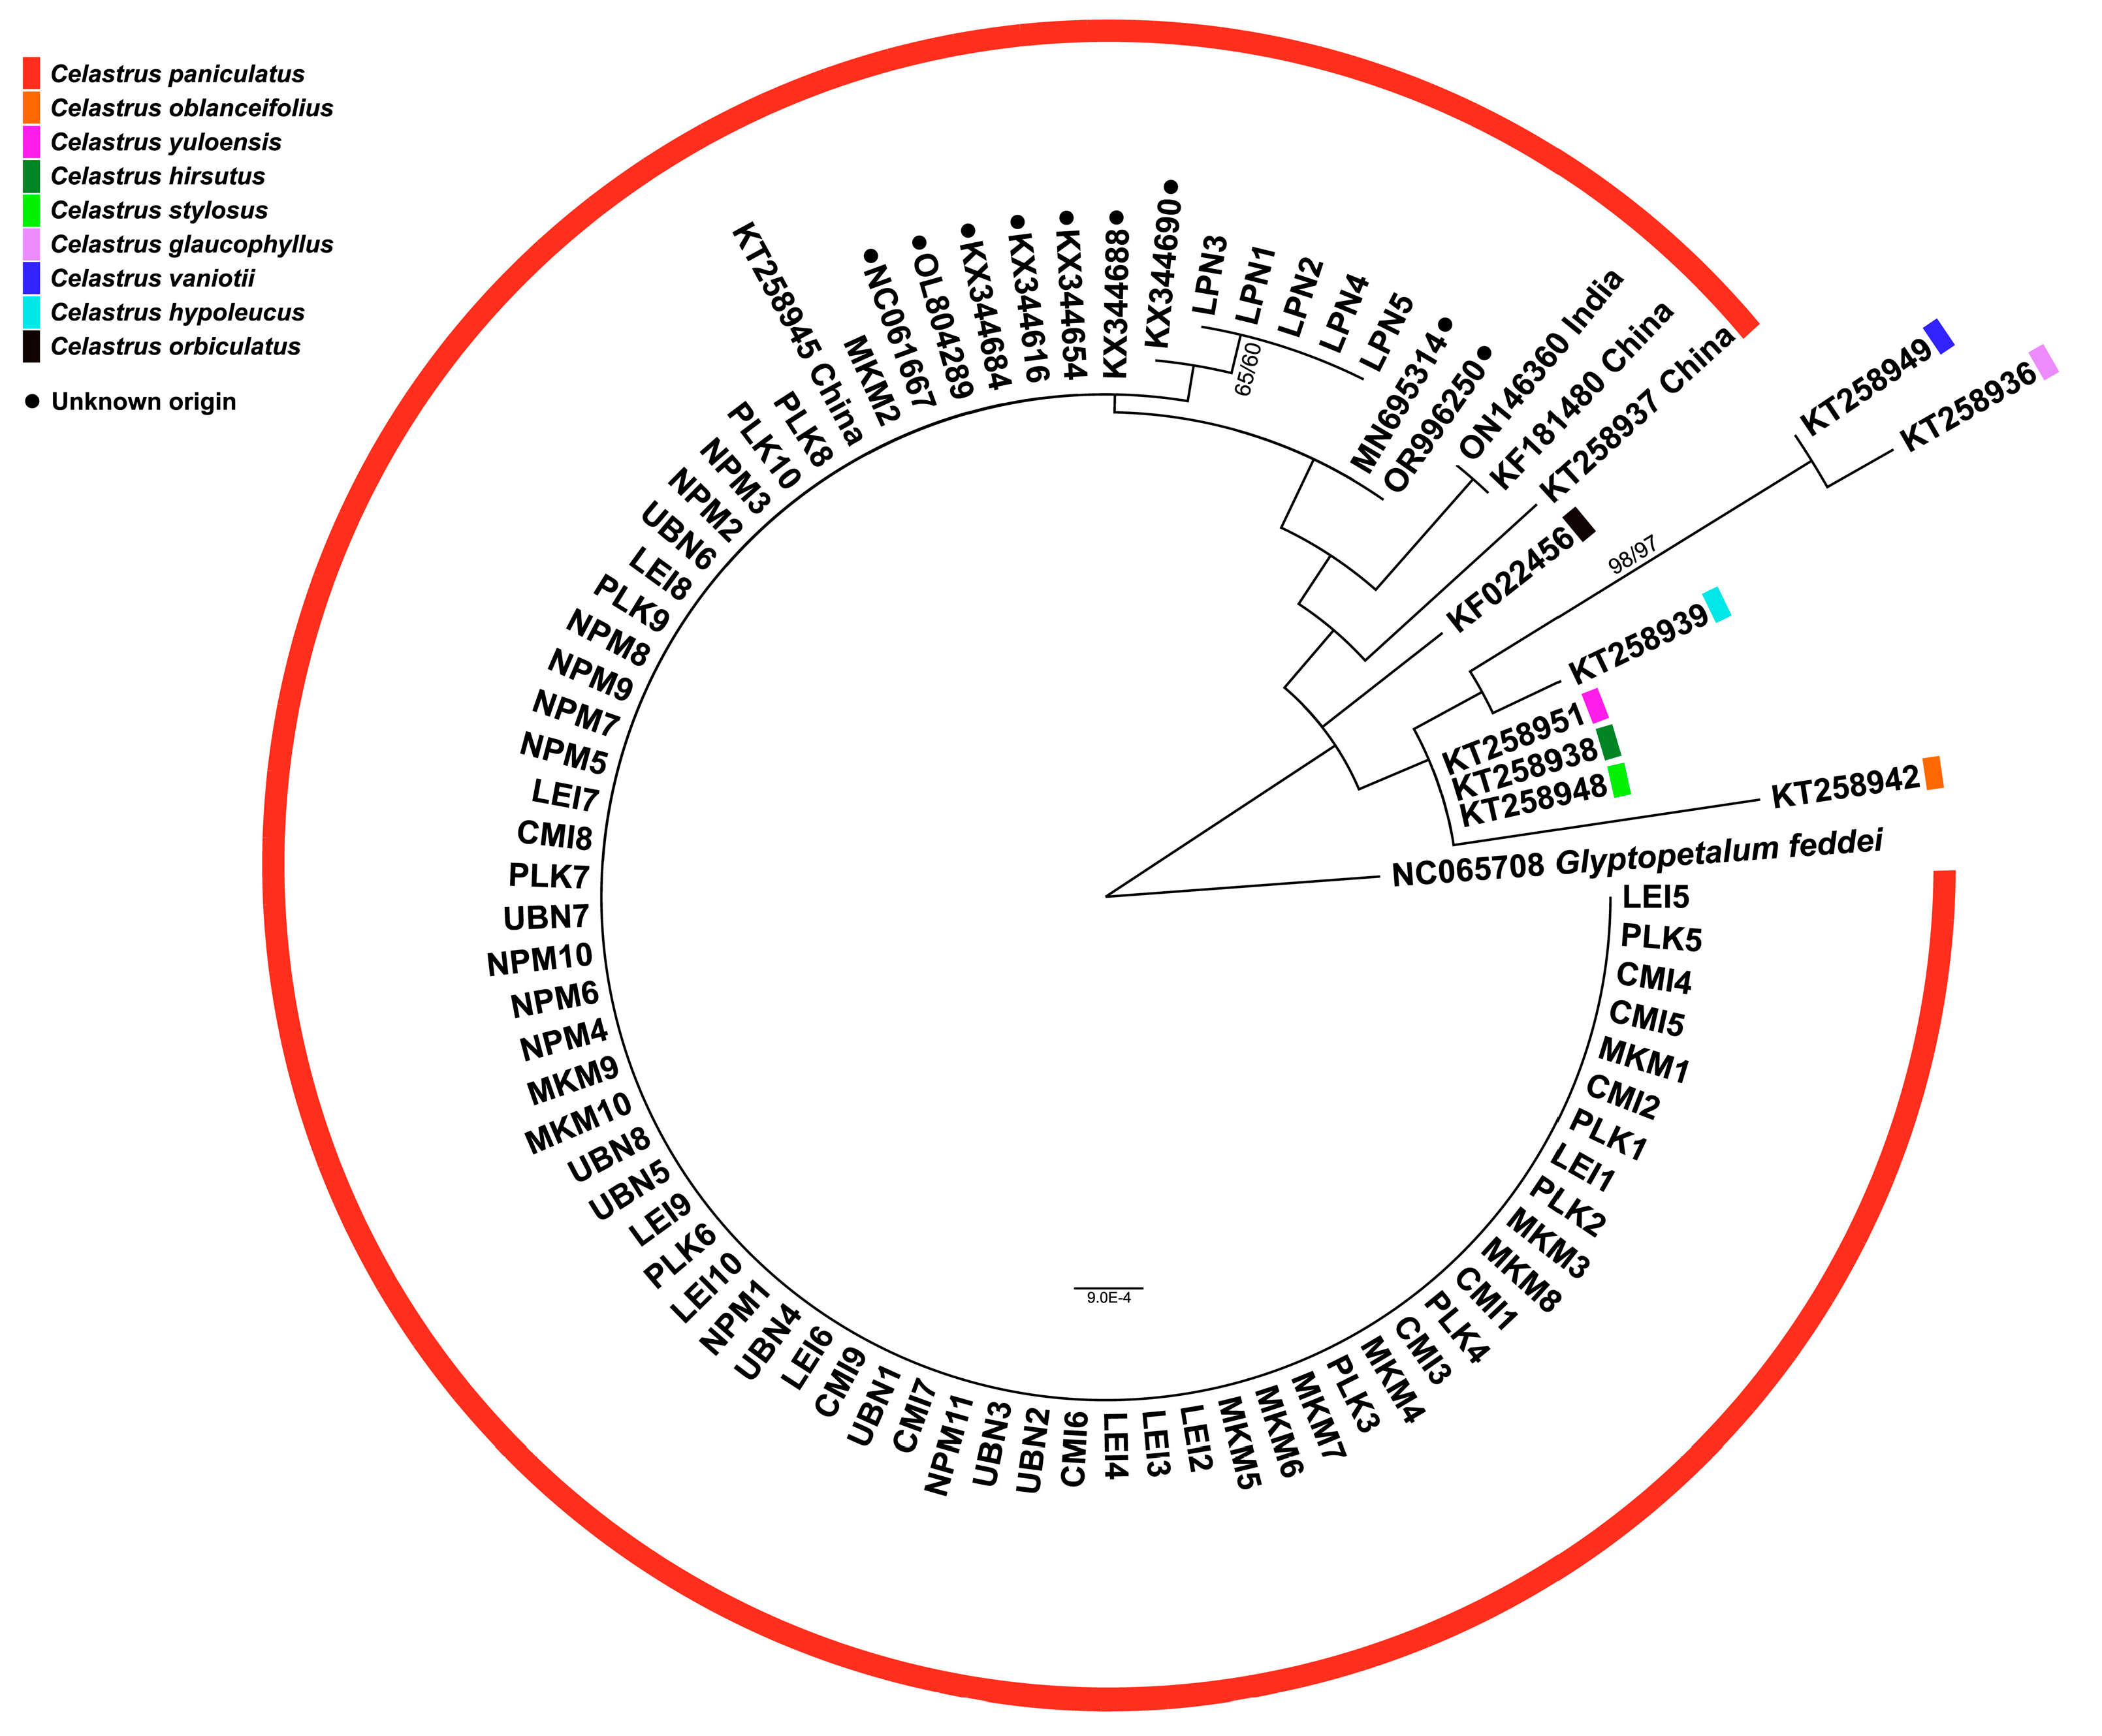

Table 1.
Sampling localities and details of Celastrus paniculatus collected in this study.
| Code | N | District | Province | Region | Altitude (m) | Latitude | Longitude |
|---|---|---|---|---|---|---|---|
| CMI | 9 | Mae Rim | Chiang Mai | North | 776 | 18.889889 | 98.860825 |
| PLK | 9 | Chat Trakan | Phitsanulok | North | 1066 | 17.608864 | 100.902396 |
| LPN | 5 | Thung Hua Chang | Lamphun | North | 840 | 18.097083 | 99.033806 |
| LEI | 10 | Phu Ruea | Loei | Northeast | 653 | 17.391944 | 101.370556 |
| MKM | 10 | Na Chuek | Maha Sarakham | Northeast | 167 | 15.836415 | 103.159919 |
| NPM | 11 | Na Kae | Nakhon Phanom | Northeast | 140 | 16.926970 | 104.438570 |
| UBN | 8 | Warinchamrab | Ubon Ratchathani | Northeast | 120 | 15.139028 | 104.832361 |
N, sample size.
Table 2.
Variable nucleotide positions compared between different ITS haplotypes of Celastrus paniculatus in Thailand.
Table 2.
Variable nucleotide positions compared between different ITS haplotypes of Celastrus paniculatus in Thailand.
| Haplotypes | Nucleotide variable positions of ITS region | ||||||||||||||||
| 1 | 1 | 1 | 1 | 1 | 1 | 1 | 2 | 4 | 5 | 5 | 5 | ||||||
| 1 | 3 | 6 | 7 | 2 | 2 | 2 | 7 | 8 | 9 | 9 | 6 | 2 | 0 | 2 | 9 | ||
| 1 | 6 | 4 | 1 | 0 | 2 | 4 | 8 | 2 | 6 | 4 | 6 | 3 | 0 | 3 | 0 | 4 | |
| CpI1 | A | C | C | C | C | C | A | A | C | A | C | G | G | T | T | G | C |
| CpI2 | . | . | T | . | . | . | . | . | . | G | T | . | . | C | G | . | . |
| CpI3 | . | . | T | . | . | . | . | . | . | G | T | . | . | . | G | . | . |
| CpI4 | . | T | . | . | . | . | . | . | . | G | T | . | . | . | G | . | . |
| CpI5 | . | T | . | G | . | . | . | . | . | G | T | . | . | . | G | . | . |
| CpI6 | . | T | . | . | G | . | . | . | . | G | T | . | . | . | G | . | . |
| CpI7 | C | T | . | . | . | . | . | . | . | G | T | . | . | . | G | . | . |
| CpI8 | . | T | . | . | . | A | T | . | . | G | T | . | . | . | G | . | . |
| CpI9 | . | T | . | . | . | A | . | . | . | G | T | . | . | . | G | . | . |
| CpI10 | . | T | . | . | . | A | . | . | . | G | T | . | . | C | G | . | . |
| CpI11 | . | . | . | . | . | . | . | . | . | G | T | . | . | . | G | . | . |
| CpI12 | . | . | T | . | . | . | . | . | . | G | T | A | . | C | G | . | . |
| CpI13 | . | . | T | . | . | . | . | . | . | G | T | . | C | C | G | C | . |
| CpI14 | . | T | T | . | . | A | . | . | . | G | T | . | . | . | G | . | . |
| CpI15 | . | T | . | . | . | . | . | C | . | G | T | . | . | . | G | . | . |
| CpI16 | . | T | . | . | . | . | . | . | A | G | T | . | . | . | G | . | . |
| CpI17 | . | T | . | . | . | . | . | . | A | G | T | . | . | . | G | . | T |
Table 3.
Molecular diversity indices of Celastrus paniculatus from different geographical localities in Thailand based on ITS sequences analysis.
Table 3.
Molecular diversity indices of Celastrus paniculatus from different geographical localities in Thailand based on ITS sequences analysis.
| Populations | Molecular diversity indices | |||||
|---|---|---|---|---|---|---|
| n | S | H | Uh | Hd±SD | Nd±SD | |
| PLK | 9 | 4 | 2 | 1 | 0.556±0.090 | 0.0034±0.0006 |
| CMI | 9 | 7 | 7 | 6 | 0.944±0.070 | 0.0039±0.0007 |
| LEI | 10 | 0 | 1 | 0 | 0.000±0.000 | 0.0000±0.0000 |
| MKM | 10 | 6 | 7 | 5 | 0.911±0.077 | 0.0026±0.0004 |
| LPN | 5 | 0 | 1 | 1 | 0.000±0.000 | 0.0000±0.0000 |
| NPM | 11 | 1 | 2 | 0 | 0.436±0.133 | 0.0007±0.0002 |
| UBN | 8 | 1 | 2 | 2 | 0.250±0.180 | 0.0004±0.0003 |
| Total | 62 | 17 | 17 | 15 | 0.832±0.039 | 0.0032±0.0004 |
n, sample size; S, segregation site; H, number of haplotypes; Uh, unique haplotype; Hd, haplotype diversity; Nd, nucleotide diversity; SD, standard deviation. Locality codes are provided in Table 1.
Table 4.
Genetic differences K2P (lower triangle) and p-distance (upper triangle) calculated based on ITS (lower triangle) and compared among different populations of Celastrus paniculatus.
Table 4.
Genetic differences K2P (lower triangle) and p-distance (upper triangle) calculated based on ITS (lower triangle) and compared among different populations of Celastrus paniculatus.
| Codes* | CMI | LPN | LEI | MKM | UBN | NPM | PLK |
|---|---|---|---|---|---|---|---|
| CMI | – | 0.0044 | 0.0037 | 0.0051 | 0.0055 | 0.0040 | 0.0058 |
| LPN | 0.0044 | – | 0.0031 | 0.0032 | 0.0048 | 0.0026 | 0.0065 |
| LEI | 0.0038 | 0.0031 | – | 0.0017 | 0.0017 | 0.0004 | 0.0034 |
| MKM | 0.0051 | 0.0032 | 0.0017 | – | 0.0034 | 0.0017 | 0.0051 |
| UBN | 0.0055 | 0.0048 | 0.0017 | 0.0034 | – | 0.0021 | 0.0051 |
| NPM | 0.0040 | 0.0027 | 0.0004 | 0.0017 | 0.0021 | – | 0.0038 |
| PLK | 0.0059 | 0.0065 | 0.0034 | 0.0051 | 0.0052 | 0.0038 | – |
* Code of populations is provided in more detail in Table 1.
Disclaimer/Publisher’s Note: The statements, opinions and data contained in all publications are solely those of the individual author(s) and contributor(s) and not of MDPI and/or the editor(s). MDPI and/or the editor(s) disclaim responsibility for any injury to people or property resulting from any ideas, methods, instructions or products referred to in the content. |
© 2025 by the authors. Licensee MDPI, Basel, Switzerland. This article is an open access article distributed under the terms and conditions of the Creative Commons Attribution (CC BY) license (http://creativecommons.org/licenses/by/4.0/).
Copyright: This open access article is published under a Creative Commons CC BY 4.0 license, which permit the free download, distribution, and reuse, provided that the author and preprint are cited in any reuse.


