
Submitted:
06 January 2025
Posted:
08 January 2025
You are already at the latest version
Abstract
Siamese rosewood (Dalbergia cochinchinensis Pierre) is a highly valuable economic tree species in Thailand. This study investigated genetic diversity across 72 tree samples from 17 Thai locations using two genetic markers: the chloroplast maturase K (matK) gene and the nuclear internal transcribed spacer (ITS) region, which includes ITS1, 5.8S ribosomal RNA gene, and ITS2. Analysis of 48 matK and 65 ITS sequences revealed 34 (DcM1–DcM34) and 31 (DcI1–DcI31) haplotypes, respectively. The Saraburi province haplotype DcM10 exhibited the highest genetic divergence, differing by 25 mutational steps from other haplotypes. Phylogenetic analysis incorporating GenBank sequences from other Dalbergia species showed that matK sequences separated D. cochinchinensis into two distinct clades: Clade A comprising most Thai samples, and Clade B containing Saraburi samples grouped with sequences from Laos and Cambodia. In contrast, ITS analysis revealed a single monophyletic group. These findings have important applications for conservation strategies, particularly in prioritizing the genetically distinct Saraburi population for protection, and can inform breeding programs to maintain genetic diversity. Additionally, the identified genetic markers could be developed into tools for timber authentication to combat illegal logging, while the revealed population structure can guide reforestation efforts and international conservation collaboration with Laos and Cambodia.
Keywords:
conservation
; genetic variation
; haplotype network
; phylogenetic tree
; Siamese rosewood
1. Introduction
Siamese rosewood (Dalbergia cochinchinensis Pierre) is one of approximately 250 species in the genus Dalbergia (family Fabaceae) found across pan-tropical regions [1]. While its genus has a broad distribution, D. cochinchinensis is endemic to Southeast Asia, specifically Thailand, Myanmar, Cambodia, Lao PDR, and Vietnam. In Thailand, where 26 Dalbergia species have been documented [2], Siamese rosewood populations primarily occur in the northeastern, eastern, and central regions. The species' highly prized heartwood makes it one of Thailand's most economically valuable plants, with strong demand in both domestic and international markets. However, this commercial value has led to extensive exploitation, threatening its survival and natural distribution patterns across Thailand.
The threat to Siamese rosewood has intensified significantly in recent years. In 2018 alone, Thai authorities recorded 576 cases of illegal harvesting in natural forests, predominantly in the eastern and northeastern regions, with damages valued at 103 million baht [3]. The species' critical status has prompted multiple protective measures: it was classified as restricted timber under the Royal Decree BE 2530 and the Forest Act BE 2484, and in 2013, Thailand successfully advocated for its inclusion in CITES List 2 for controlled international trade [4]. Further protection came through National Announcement No. 106/2014 [5], and the species is currently listed as critically endangered on the IUCN Red List.
Conservation of genetic resources is crucial for preserving endangered species with economic significance and maintaining genetic diversity for future breeding programs. Two main conservation approaches are employed: in situ conservation (preservation in natural forest conditions) and ex situ conservation (establishment of plantations). Genetic studies using DNA analysis have revealed that Siamese rosewood is an outcrossing species with high genetic diversity both within and between populations. Research has shown genetic differences between populations of approximately 0.127 [6,7]. Population structure studies have employed various genetic markers, including RAPD and ISSR [8,9], microsatellite [10], chloroplast maturase K (matK), and nuclear internal transcribed spacer (ITS) regions [11]. Among these markers, the matK and ITS regions have emerged as particularly valuable tools for genetic analysis, despite some limitations in discrimination power. These markers are part of the plant DNA barcode system and offer complementary insights: matK is maternally inherited and helps track seed dispersal patterns, while ITS provides information about both parental lineages and can reveal recent evolutionary events [11].
While both government agencies and farmers have begun establishing economic forest plantations for Siamese rosewood, a significant challenge remains: the shortage of high-quality seedlings from superior mother plants. To address this issue, molecular approaches using chloroplast and nuclear genome markers are essential for studying genetic diversity. The present research aims to assess the genetic diversity of D. cochinchinensis using matK and ITS regions as genetic markers. This genetic database will support future propagation efforts, breeding development, and conservation programs for sustainable utilization.
2. Materials and Methods
2.1. Sample Collection
The Siamese rosewood specimens in this study were initially identified based on their distinctive morphological characteristics (Figure 1) using the guideline described by Niyomdham [2]. Voucher specimens from this study were deposited in the Forest Herbarium-BKF under the following codes: "Prompen, B. No. 1 BKF NO. 224371" and "Prompen, B. No. 2 BKF NO. 224372". To preserve and propagate the genetic material, grafting branches from the original trees were collected from natural forests [12] and established at the Royal Forest Department's collection within the Northeastern Forest Tree Seed Center, Khon Kaen Province, Thailand.
For molecular analysis, this study examined 72 D. cochinchinensis samples collected from 17 distinct geographical locations (Table 1 and Figure 2). Young leaves were harvested using sterile scissors, preserved in silica gel, and transported to the Walai Rukhavej Botanical Research Institute laboratory for further analysis.
2.2. Molecular Analysis
Genomic DNA was extracted from young leaves using the DNeasy® Plant Mini Kit (Qiagen, Germany) following the manufacturer's protocol, with samples stored at –20 °C until analysis. Two genomic regions were targeted for amplification: the chloroplast maturase K (matK) and the nuclear internal transcribed spacer (ITS). For matK amplification, the forward primer matK-3F_IH (5'-CGT ATA GTA CTC TTG TGT TTA CGA G-3') and reverse primer matK-3R (5'-ATC CTA TTC ATC TGG AAA TCT TGG TTC-3') were used [13], while ITS amplification employed forward primer ITS-F (5'-GGA AGG AGA AGT CGT AAC AAG G-3') and reverse primer ITS5-R (5'-TCC TCC GCT TAT TGA TAT GC-3') [14]. PCR amplification was performed using the HotStarTaq Master Mix Kit (Qiagen, Germany) in 25 μl reaction volumes. Both genomic regions were amplified using a thermal cycler (Applied Biosystems, USA) under identical conditions consisting of initial denaturation at 95 °C for 5 min, followed by 35 cycles of denaturation at 95 °C for 30 sec, annealing at 55 °C for 1 min, and extension at 72 °C for 1 min, with a final extension at 72 °C for 5 min. The amplified products were visualized on 1% agarose gels in 0.5x TBE buffer using GelRed™ Nucleic Acid Gel Stain (Biotium, Inc., Hayward, CA), after which PCR products were excised, purified using the E.Z.N.A.® Gel Extraction Kit (Omega Biotek, USA), and sequenced using Sanger sequencing (ATGC Co., Ltd., Thailand).
2.3. Data Analysis
Sequence alignment and analysis were performed using the ClustalW program [15], with manual editing conducted in BioEdit [16]. Molecular diversity indices and haplotype data were generated using DnaSp v5 [17]. Genetic differentiation between populations was assessed using both p-distance and Kimura 2-parameters (K2P) [18] in MEGA XI [19]. To visualize haplotype relationships, a minimum-spanning network was constructed using Network version 10.2, employing the median-joining algorithm [20].
Phylogenetic analyses were conducted separately for matK and ITS sequences using haplotypes identified from all D. cochinchinensis populations in this study. Additional Dalbergia species sequences were retrieved from GenBank for comparative analysis. Tectona grandis and Pterocarpus indicus were selected as outgroups for matK and ITS trees, respectively. Phylogenetic trees were constructed using two methods in MEGA XI [21]: Maximum likelihood (ML) with the general time reversible model incorporating gamma distribution and invariant sites (GTR+G+I) [22], and neighbor-joining [23]. Node support was assessed using 1,000 bootstrap replicates.
3. Results
3.1. Genetic Diversity of D. cochinchinensis
We analyzed genetic variation in D. cochinchinensis populations using two genetic markers: matK and ITS sequences. For the matK gene, we successfully amplified and sequenced an 821 bp fragment from 48 samples collected across 12 localities. These sequences were deposited in GenBank (accession numbers PQ317478 – PQ317748). Analysis revealed 66 variable nucleotide sites (8% of total sites), comprising 5 singletons and 61 parsimony informative sites. We identified 34 distinct haplotypes (DcM1 – DcM34), each exclusively found in a specific geographical area (Figure 3). The matK sequences showed high genetic diversity, with haplotype diversity of 0.986±0.007 and nucleotide diversity of 0.0161±0.0022 (Table 2).
For the ITS region, we obtained sequences from 65 samples representing 17 localities (GenBank accession numbers PQ317478 – PQ317748). The analysis identified 19 variable sites, including 1 singleton and 18 parsimony informative sites. These variations defined 31 haplotypes (DcI1 – DcI34), with 18 haplotypes being location-specific and 13 shared across multiple localities (Figure 3). The ITS sequences also showed substantial genetic diversity, with haplotype diversity of 0.968±0.008 and nucleotide diversity of 0.0069±0.0003 (Table 2).
Genetic differentiation among populations was assessed using both p-distance and K2P methods. For matK, p-distance values ranged from 0.0061 to 0.0572, while K2P distances ranged from 0.0061 to 0.0597 (Table 3). The ITS sequences showed lower genetic differentiation, with p-distance ranging from 0.0010 to 0.0127 and K2P from 0.0010 to 0.0129 (Table 4). Notably, populations from SRI showed remarkably high genetic differentiation based on matK analysis, with p-distance (0.0398-0.0572) and K2P values (0.0411-0.0597) consistently higher than other populations.
3.2. Haplotype Network
Haplotype networks were constructed separately for 34 matK (DcM1 – DcM34) and 31 ITS (DcI1 – DcI34) sequences. The matK analysis revealed distinct geographical patterns with no shared haplotypes between localities. Three haplotypes showed notable genetic distances from the others: DcM10 from Muak Lek District, Saraburi Province (25 mutational steps), DcM32 from Wiang Kao District, Khon Kaen Province (17 mutational steps), and DcM7 from Kantaralak District, Sisaket Province (11 mutational steps) (Figure 3).
In contrast, the ITS sequence analysis showed minimal genetic differentiation, with a maximum of two mutational steps between haplotypes. Unlike matK, the ITS analysis identified 14 shared haplotypes across different localities: DcI1, DcI5, DcI11, DcI12, DcI13, DcI14, DcI15, DcI16, DcI17, DcI18, DcI19, DcI21, DcI22, and DcI24 (Figure 3).
3.3. Phylogenetic Tree
Phylogenetic analyses were conducted separately for matK and ITS sequences, incorporating both our sequences and previously published sequences of D. cochinchinensis and other Dalbergia species from GenBank. The ITS-based phylogenetic tree demonstrated that all D. cochinchinensis samples formed a well-supported monophyletic group, distinct from other Dalbergia species. Within the genus, D. cochinchinensis showed the closest phylogenetic affinity to D. sericea from Bhutan (Figure 4).
The matK-based phylogenetic analysis revealed two distinct clades within D. cochinchinensis (Figure 5). Clade A comprised all matK haplotypes generated in this study except DcM10, while Clade B contained haplotype DcM10 from Saraburi Province together with previously published D. cochinchinensis sequences from Thailand, Laos, and Cambodia. Notably, both clades showed close phylogenetic relationships with D. ovata sequences from Thailand and Myanmar, suggesting potential evolutionary connections between these species within the region.
4. Discussion
Our analysis revealed significant genetic diversity patterns in D. cochinchinensis populations across Thailand. The matK sequences showed high overall genetic diversity (haplotype diversity = 0.986±0.007 and nucleotide diversity = 0.0161±0.0022), with 34 distinct haplotypes exhibiting strong geographical structuring. Population-level diversity varied considerably, with the highest haplotype diversity (1.000) observed in populations from Khon Kaen (DC-KKN-WK), Nakhon Ratchasima (DC-NMA-KB), Sa Kaeo (DC-SKW-WY), and Sakon Nakhon provinces (DC-SNK-M), while the lowest diversity (0.000) was found in Saraburi (DC-SRI). Similarly, ITS sequences revealed 31 haplotypes with substantial overall diversity (haplotype diversity = 0.968±0.008 and nucleotide diversity = 0.0069±0.0003), though with less pronounced geographical structuring.
The relatively low nucleotide diversity observed in both markers aligns with previous findings. Yooyuen [7] reported low genetic diversity (haplotype diversity = 0.608 and nucleotide diversity = 0.00033) in northeastern and central Thai populations, identifying only 11 haplotypes across populations. This consistently low genetic diversity may reflect the species' historically narrow distribution and specific ecological requirements, as D. cochinchinensis occupies a more restricted ecological niche compared to related species like D. oliveri [2,24,25].
Our phylogenetic analyses revealed distinct patterns between markers. The ITS-based phylogeny showed D. cochinchinensis as a well-supported monophyletic group, while matK analysis identified two distinct clades with differential geographic distribution. These patterns suggest that landscape features have played a crucial role in shaping the species' genetic structure, consistent with recent findings by Hartvig et al. [10] and Huang et al. [26], who demonstrated that drainage systems significantly influence phylogeographic patterns of Dalbergia species in Indochina.
The genetic patterns observed in this study have important implications for conservation and breeding strategies. The selected specimens exhibited desirable traits for breeding programs, including high growth rates, straight trunks, quality wood characteristics, and disease resistance. The distinct genetic lineages identified through both markers suggest the importance of maintaining population-level diversity in conservation efforts. Moreover, the strong geographic structuring observed particularly in matK sequences indicates that conservation strategies should consider preserving populations across different regions to maintain the full range of genetic diversity.
Several limitations should be considered when interpreting our results. Our study focused primarily on Thai populations, potentially missing important genetic variations in neighboring countries. The use of only chloroplast and nuclear markers may not fully capture the genetic complexity of the species, and the lack of temporal genetic data limits our understanding of how diversity patterns have changed over time in response to anthropogenic pressures.
Future research directions should focus on expanding the geographical scope to include populations from neighboring countries, which would provide a more comprehensive understanding of regional genetic patterns. The incorporation of additional genetic markers, particularly those related to adaptive traits, would offer deeper insights into the species' evolutionary potential. Studies investigating the impact of recent habitat fragmentation on genetic diversity, the relationship between genetic diversity and phenotypic variation in important timber quality traits, and the effects of current conservation practices on genetic diversity maintenance would be valuable. Furthermore, the examination of potential hybridization patterns with closely related Dalbergia species and the development of more comprehensive landscape genetic models incorporating contemporary environmental changes would enhance our understanding of this economically important species and inform more effective conservation strategies.
5. Conclusions
This study reveals significant insights into the genetic diversity of D. cochinchinensis through analysis of matK and ITS markers. Our findings demonstrate high genetic diversity within the species, evidenced by numerous haplotypes (34 matK and 31 ITS) and high haplotype diversity indices (matK: 0.986±0.007; ITS: 0.968±0.008). The markers showed contrasting patterns: matK sequences exhibited strong geographical structuring with location-specific haplotypes, while ITS sequences showed more limited differentiation with shared haplotypes across localities. Notably, phylogenetic analyses identified two distinct evolutionary lineages, with the Saraburi Province population showing remarkable genetic divergence. This population, along with samples from neighboring countries, forms a separate clade that may represent a unique evolutionary line requiring special conservation attention.
These findings suggest that despite recent population declines, D. cochinchinensis maintains substantial genetic diversity. For conservation, this implies the need to protect multiple populations across its range, with a particular focus on preserving distinct evolutionary lineages and maintaining connectivity between populations to ensure the species' long-term survival.
Author Contributions
Conceptualization, W.S. and S.T.; methodology, B.P., W.S. and S.T.; software, W.S. and S.T.; validation, B.P., W.P., W.S. and S.T.; formal analysis, W.S. and S.T.; investigation, B.P., W.P. and S.T.; resources, S.T.; data curation, W.S. and S.T.; writing—original draft preparation, B.P. W.S. and S.T.; writing—review and editing, S.T.; visualization, B.P., W.P. and W.S.; supervision, S.T.; project administration, S.T.; funding acquisition, B.P. and S.T. All authors have read and agreed to the published version of the manuscript.
Funding
This research was kindly supported by Mahasarakham University, Thailand.
Data Availability Statement
The raw data supporting the conclusions of this article will be made available by the authors upon request.
Acknowledgments
A part of this research work was supported by the Royal Forest Department, Thailand. The authors also thank all staff of the Royal Forest Department and Walai Rukhavej Botanical Research Institute, Mahasarakham University for their technical support.
Conflicts of Interest
The authors declare no conflicts of interest.
References
- Vatanparast, M.; Klitgård, B.B.; Adema, F.A.; Pennington, R.T.; Yahara, T.; Kajita, T. First molecular phylogeny of the pantropical genus Dalbergia: implications for infrageneric circumscription and biogeography. South Afr. J. Bot. 2013, 89, 143–149. [Google Scholar] [CrossRef]
- Niyomdham, C. An accont of Dalbergia (Leguminosae-Papilionoideae) in Thailand. Thai For. Bull (Bot.). 2002, 30, 124–166. [Google Scholar]
- Department of National Parks, Wildlife and Plant Conservation. Report summarizing statistics of illegal cases related to forestry. 2018. Available online: https://portal.dnp.go.th/Content?contentId=2134 (accessed on 20 December 2023).
- CITES. Appendices I, II and III: valid from 4 October 2017. Convention on International Trade in Endangered Species of Wild Fauna and Flora. 2018.
- National Council for Peace and Order. Announcement of the National Council for Peace and Order No. 106/2014 regarding amendments to the forest law. 2014.
- Soonhuae, P.; Piewluang, C.; Boyle, T. Population genetics of Dalbergia cochinchinensis Pierre and implications for genetic conservation. Technical Publication No. 18, ASEAN Forest Tree Seed Centre Project, Muak-Lek, Saraburi, Thailand. (1994).
- Yooyuen, R.; Duangjai, S.; Changtragoon, S. Chloroplast DNA variation of Dalbergia cochinchinensis Pierre in Thailand and Laos. In IUFRO World Series Volume 30: Asia and the Pacific Workshop Multinational and Transboundary Conservation of Valuable and Endangered Forest Tree Species, Guangzhou, China, 5–7 December 2011.
- Hien, V.T.T.; Phong, D.T. Genetic diversity among endangered rare Dalbergia cochinchinensis (Fabaceae) genotypes in Vietnam revealed by random amplified polymorphic DNA (RAPD) and inter simple sequence repeats (ISSR) markers. Afr. J. Biotechnol. 2012, 11, 8632–8644. [Google Scholar]
- Bal, P.; Panda, P.C. Molecular characterization and phylogenetic relationships of Dalbergia species of eastern India based on RAPD and ISSR analysis. Int. J. Innov. Science Res. Technol. 2018, 3, 417–422. [Google Scholar]
- Hartvig, I.; So, T.; Changtragoon, S.; Tran, H.T.; Bouamanivong, S.; Theilade, I.; Kjaer, E.D.; Nielsen, L.R. Population genetic structure of the endemic rosewoods Dalbergia cochinchinensis and D. oliveri at a regional scale reflects the Indochinese landscape and life-history traits. Ecol. Evol. 2018, 8, 530–545. [Google Scholar] [CrossRef] [PubMed]
- Hartvig, I.; Czako, M.; Kjaer, E.D.; Nielsen, L.R.; Theilade, I. The use of DNA barcoding in identification and conservation of rosewood (Dalbergia spp.). PLoS ONE. 2015, 10, e0138231. [Google Scholar] [CrossRef]
- Pérez-Luna, A.; Hernández-Díaz, J.C.; Wehenkel, C.; Simental-Rodríguez, S.L.; Hernández-Velasco, J.; Prieto-Ruíz, J.A. Graft survival of Pinus engelmannii Carr. in relation to two grafting techniques with dormant and sprouting buds. PeerJ. 2021, 9, e12182. [Google Scholar] [CrossRef]
- Dunning, L.T.; Savolainen, V. Broad-scale amplification of matK for DNA barcoding plants a technical note. Bot. J. Linn. Soc. 2010, 164, 1–9. [Google Scholar] [CrossRef]
- Sotuyo, S.; Pedraza-Ortega, E.; Martinez-Salas, E.; Linares, J.; Cabrera, L. Insights into phylogenetic divergence of Dalbergia (Leguminosae: Dalbergiae) from Mexico and Central America. Front. Ecol. Evol. 2022, 10, 910250. [Google Scholar] [CrossRef]
- Larkin, M.A.; Blackshields, G.; Brown, N.P.; Chenna, R.; McGettigan, P.A.; McWilliam, H.; et al. Clustal W and clustal X version 2.0. Bioinform. 2007, 23, 2947–2948. [Google Scholar] [CrossRef] [PubMed]
- Hall, T.A. BioEdit: a user-friendly biological sequence alignment editor and analysis program for Windows 95/98/NT. Nucl. Acid S. 1999, 41, 95–98. [Google Scholar]
- Librado, P.; Rozas, J. DnaSP v5: a software for comprehensive analysis of DNA polymorphism data. Bioinform. 2009, 25, 1451–1452. [Google Scholar] [CrossRef] [PubMed]
- Kimura, M. A simple method for estimating evolutionary rates of base substitutions through comparative studies of nucleotide sequences. J. Mol. Evol. 1980, 16, 111–120. [Google Scholar] [CrossRef] [PubMed]
- Tamura, K.; Stecher, G.; Kumar, S. MEGA 11: Molecular Evolutionary Genetics Analysis Version 11. Mol. Biol. Evol. 2021, 18, 3022–3027. [Google Scholar] [CrossRef] [PubMed]
- Bandelt, H.J.; Forster, P.; Röhl, A. Median-joining networks for inferring intraspecific phylogenies. Mol. Biol. Evol. 1999, 16, 37–48. [Google Scholar] [CrossRef] [PubMed]
- Kumar, S.; Stecher, G.; Li, M.; Knyaz, C.; Tamura, K. MEGA X: molecular evolutionary genetics analysis across computing platforms. Mol Biol Evol. 2018, 35, 1547–1549. [Google Scholar] [CrossRef] [PubMed]
- Nei, M.; Kumar, S. Molecular evolution and phylogenetics. Oxford University Press, New York, 2000.
- Saitou, N.; Nei, M. The neighbor-joining method: a new method for reconstructing phylogenetic trees. Mol. Biol. Evol. 1987, 4, 406–425. [Google Scholar] [PubMed]
- Niyomdham, C.; Hô, P.H.; Dy Phon, P.; Vidal, .E. Leguminoseae-Papilionoideae Dalbergieae. In: Morat, P. (ed), Flore du Cambodge du Laos et du Viêtnam. Muséum National d’Histoire Naturelle, Paris. 1997.
- CTSP. Cambodian tree species. Monographs. Cambodia tree seed project, FA, Cambodia and DANIDA, Denmark. 2004.
- Huang, J.F.; Li, S.Q.; Xu, R.; Peng, Y.Q. East‒West genetic differentiation across the Indo-Burma hotspot: evidence from two closely related dioecious figs. BMC Plant Biol. 2023, 23, 321. [Google Scholar] [CrossRef] [PubMed]
Figure 1.
Morphological characteristics of D. cochinchinensis used for species identification: (a) Siamese rosewood tree, (b) inflorescences, (c) young leaves, (d) pods, (e) seeds, and (f) stem.
Figure 1.
Morphological characteristics of D. cochinchinensis used for species identification: (a) Siamese rosewood tree, (b) inflorescences, (c) young leaves, (d) pods, (e) seeds, and (f) stem.
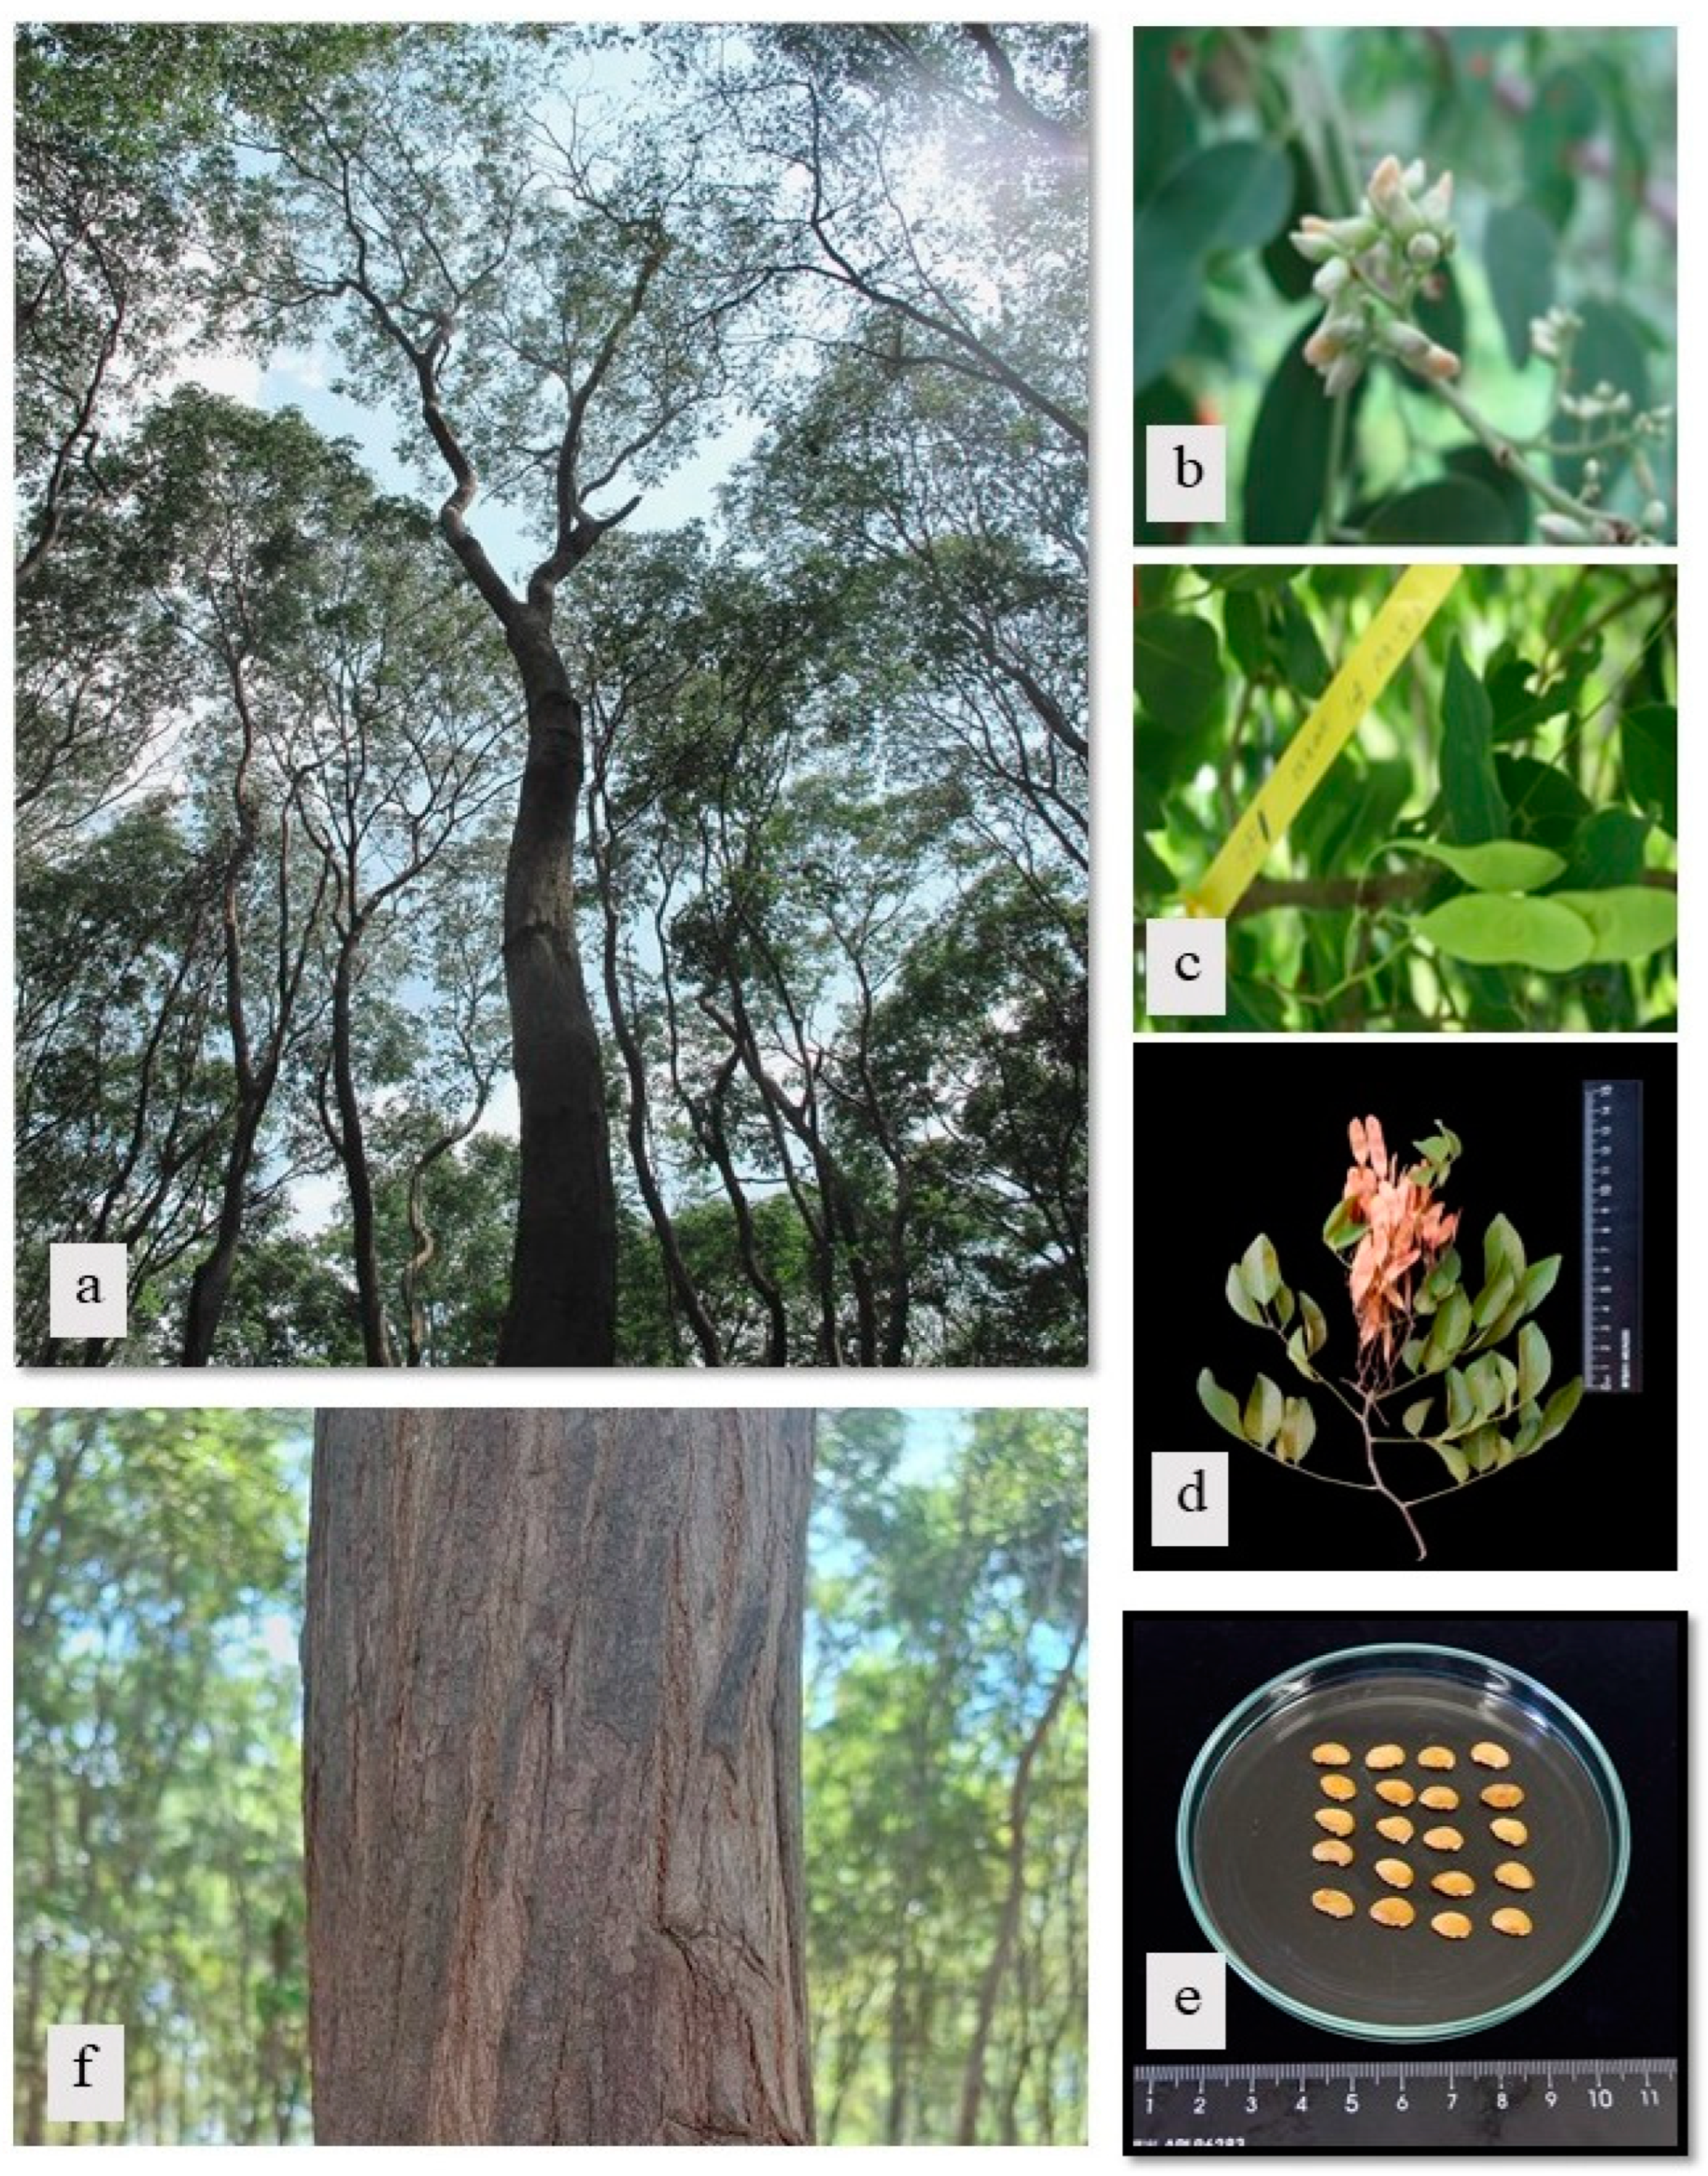
Figure 2.
Geographic distribution of D. cochinchinensis sampling locations in this study.
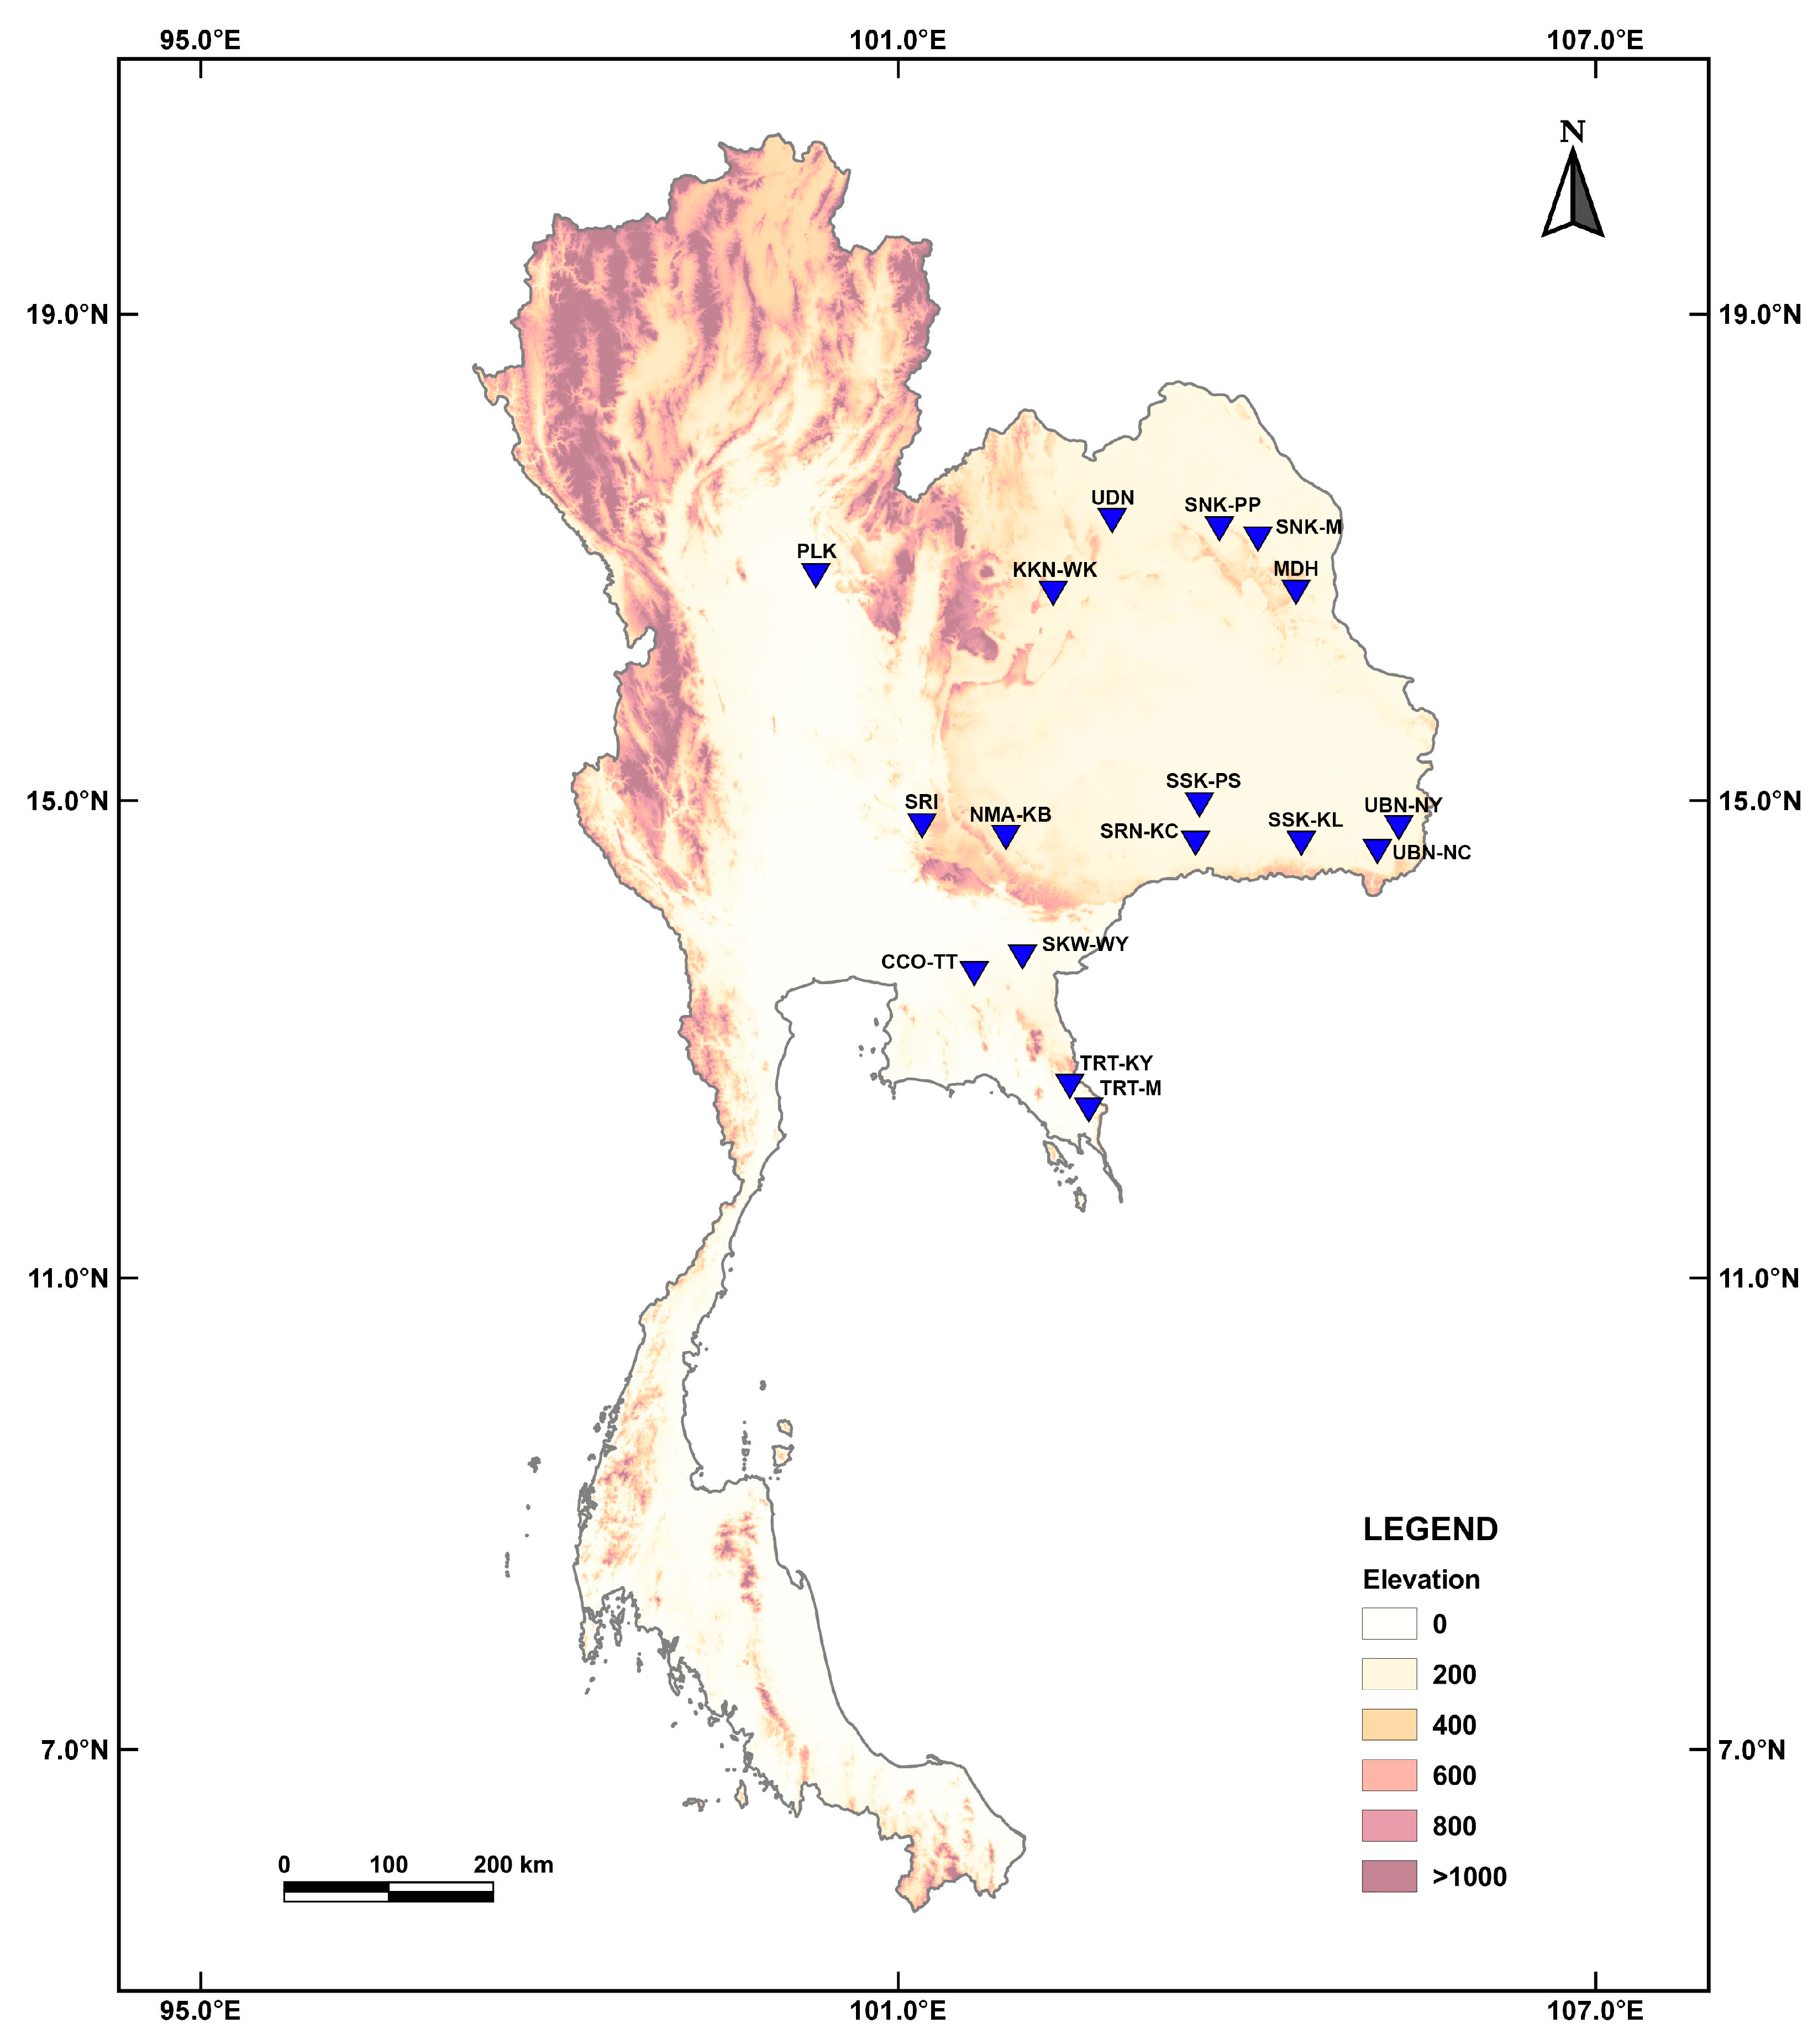
Figure 3.
Median-joining haplotype network of the matK and ITS depicts the relationships among haplotypes from examined populations of D. cochinchinensis. The area of the circles represents the proportion of specimen numbers found in each haplotype. The length of each branch demonstrates the number of mutational steps (ms).
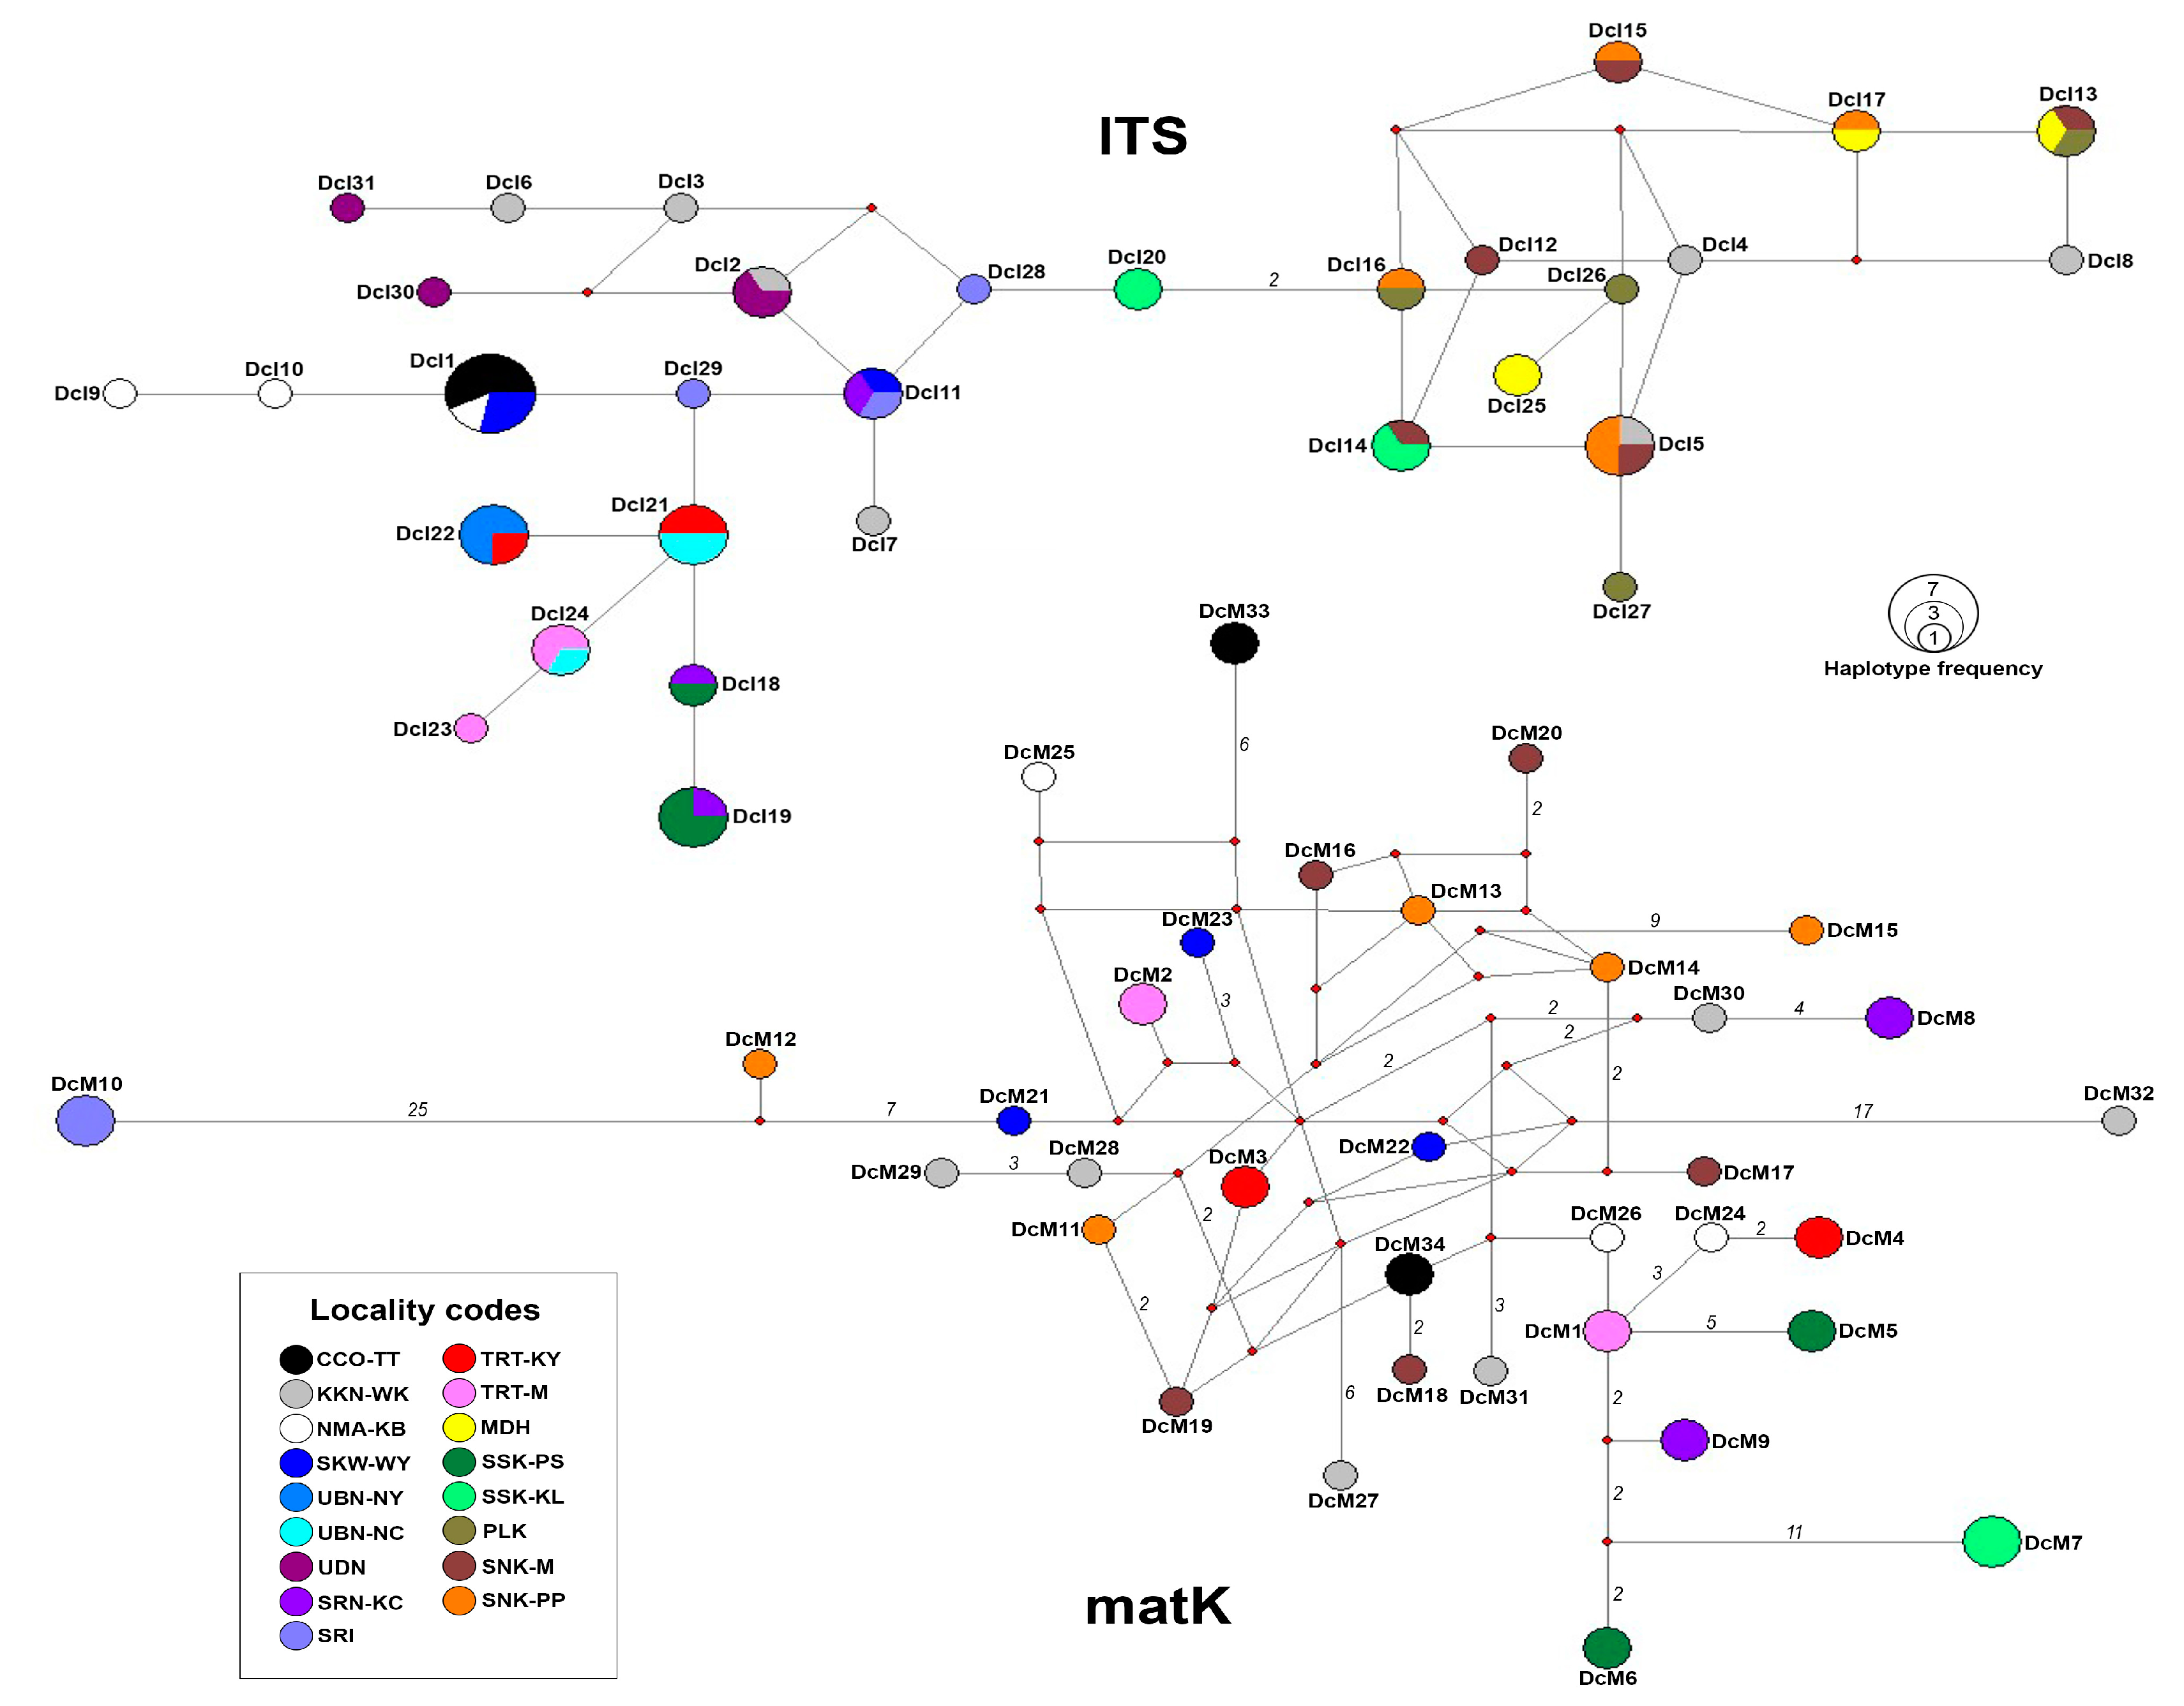
Figure 4.
Phylogenetic tree based on ITS sequences showing relationships among D. cochinchinensis samples from this study and previously published sequences of D. cochinchinensis and other Dalbergia species from GenBank. Numbers at nodes indicate bootstrap support values from maximum likelihood/maximum parsimony analyses. Pterocarpus indicus was used as an outgroup.
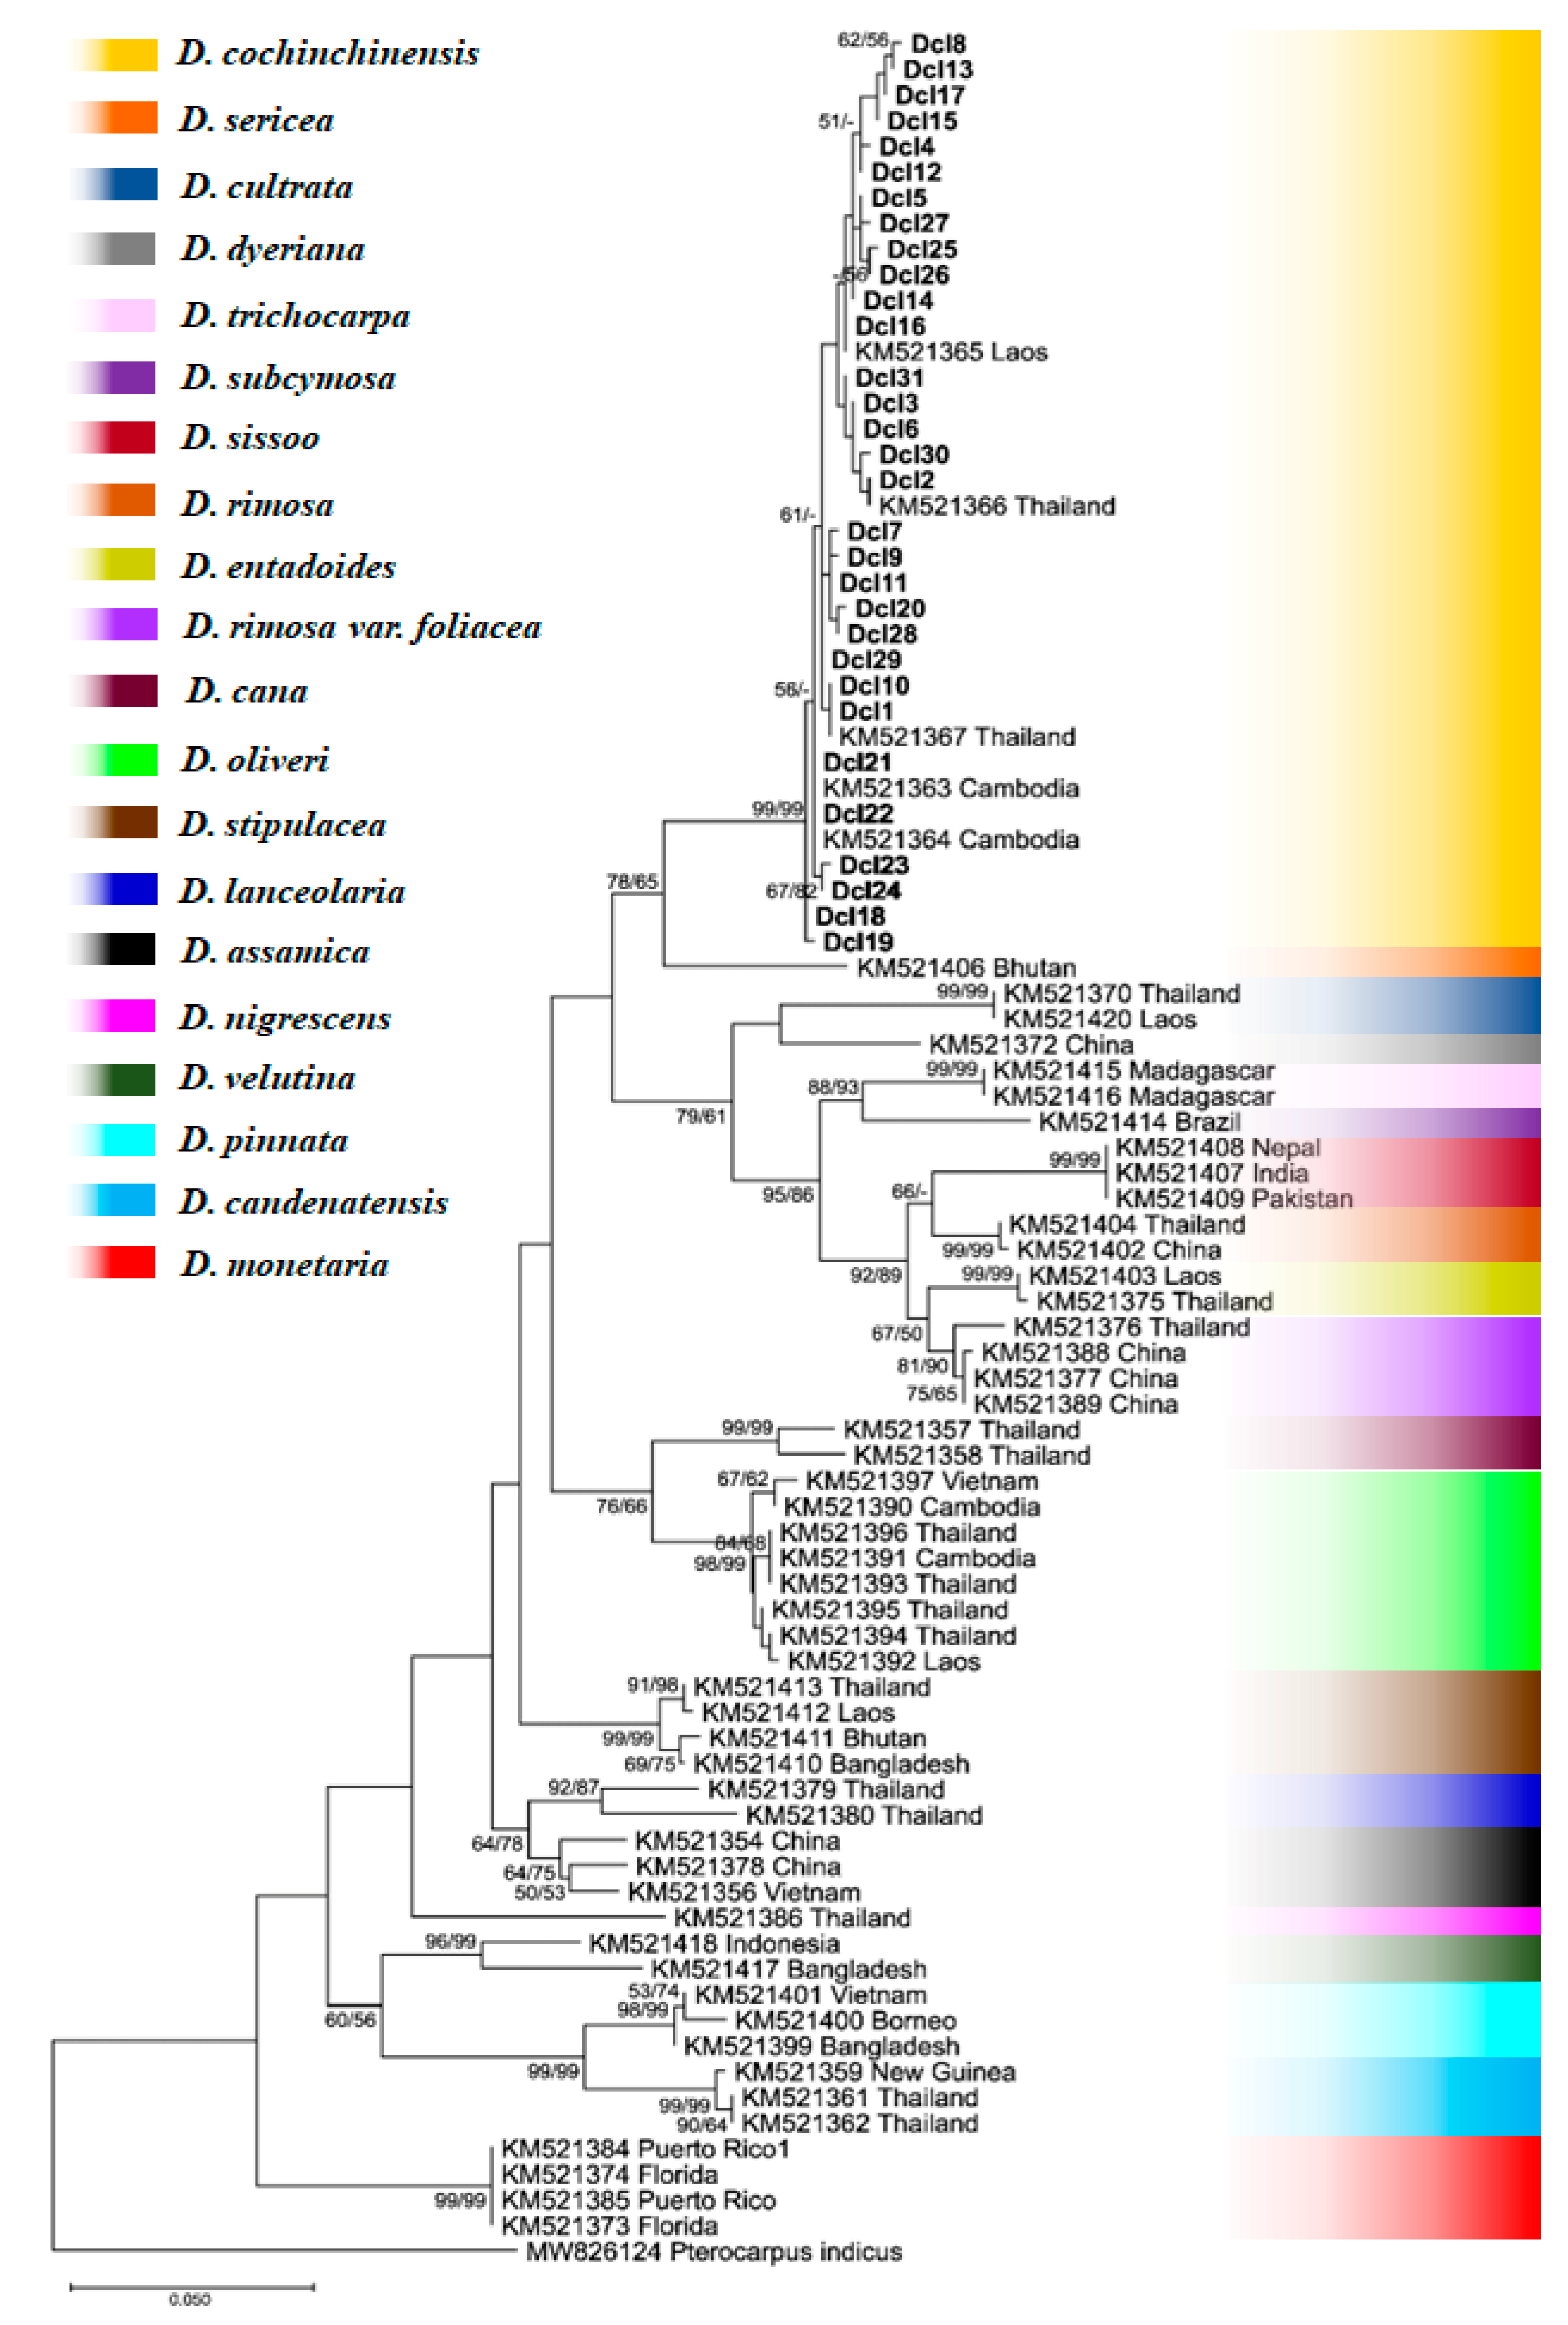
Figure 5.
Phylogenetic tree based on matK sequences showing relationships among D. cochinchinensis samples from this study and previously published sequences of D. cochinchinensis and other Dalbergia species from GenBank. Two distinct clades (A and B) were identified within D. cochinchinensis. Numbers at nodes indicate bootstrap support values from maximum likelihood/maximum parsimony analyses. Pterocarpus indicus was used as an outgroup.
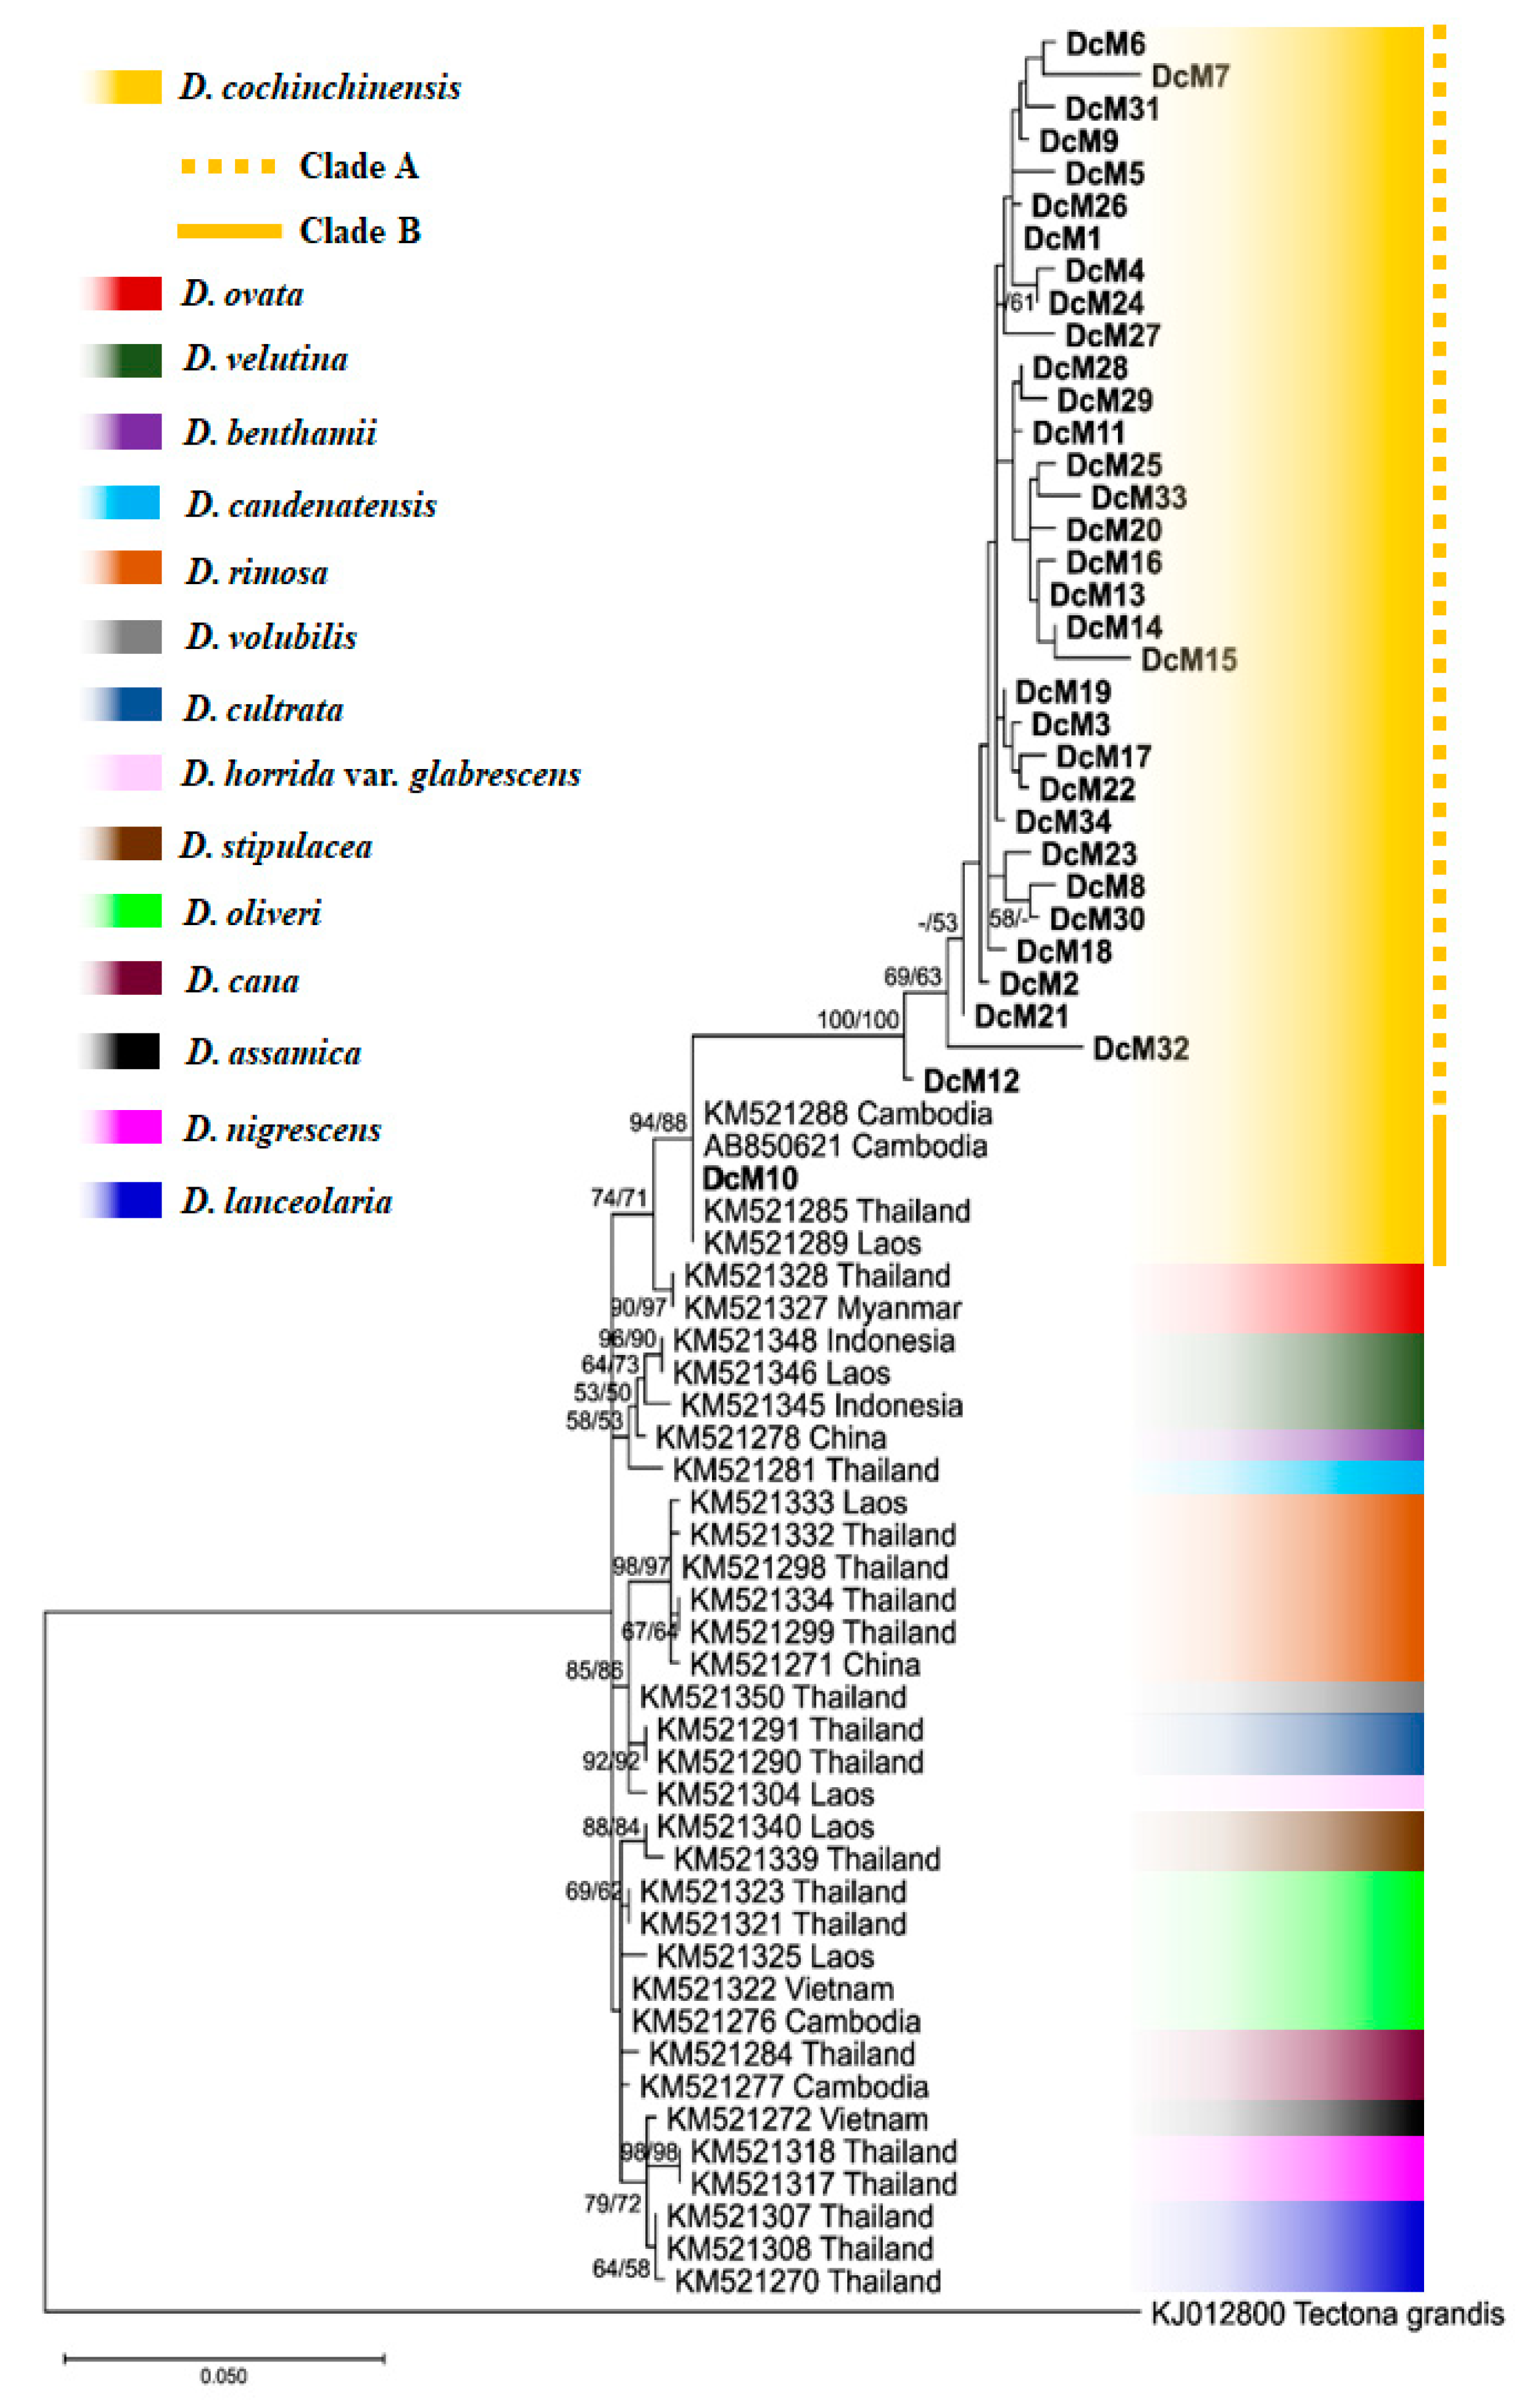

Table 1.
List of samples and molecular markers examined in this study.
| Sample no. | Sample code | Molecular marker | Sample collection site | |
|---|---|---|---|---|
| matK* | ITS** | |||
| 1 | TRT-M1 | DcM1 | DcI23 | Mueang District, Trat Province |
| 2 | TRT-M2 | DcM2 | DcI24 | |
| 3 | TRT-M3 | DcM2 | DcI24 | |
| 4 | TRT-M4 | DcM1 | n/a | |
| 5 | TRT-KY1 | DcM4 | DcI21 | Khlong Yai District, Trat Province |
| 6 | TRT-KY2 | DcM3 | DcI21 | |
| 7 | TRT-KY3 | DcM4 | DcI22 | |
| 8 | TRT-KY4 | DcM3 | n/a | |
| 9 | SSK-PS1 | DcM6 | n/a | Phu Sing District, Sisaket Province |
| 10 | SSK-PS2 | DcM6 | DcI19 | |
| 11 | SSK-PS3 | DcM5 | DcI19 | |
| 12 | SSK-PS4 | n/a | DcI19 | |
| 13 | SSK-PS5 | DcM5 | DcI18 | |
| 14 | SSK-KL1 | DcM7 | DcI20 | Kantaralak District, Sisaket Province |
| 15 | SSK-KL2 | DcM7 | DcI14 | |
| 16 | SSK-KL3 | DcM7 | DcI20 | |
| 17 | SSK-KL4 | n/a | DcI14 | |
| 18 | SRN-KC1 | DcM9 | DcI18 | Kap Choeng District, Surin Province |
| 19 | SRN-KC2 | DcM8 | DcI19 | |
| 20 | SRN-KC3 | DcM9 | DcI11 | |
| 21 | SRN-KC4 | DcM8 | n/a | |
| 22 | SRI76 | DcM10 | n/a | Muak Lek District, Saraburi Province |
| 23 | SRI80 | DcM10 | n/a | |
| 24 | SRI | DcM10 | n/a | |
| 25 | SRI6 | n/a | DcI28 | |
| 26 | SRI27 | n/a | DcI29 | |
| 27 | SRI34 | n/a | DcI11 | |
| 28 | SNK-PP1 | DcM15 | DcI15 | Phu Phan District, Sakon Nakhon Province |
| 29 | SNK-PP2 | DcM14 | DcI16 | |
| 30 | SNK-PP3 | DcM13 | DcI5 | |
| 31 | SNK-PP4 | DcM12 | DcI17 | |
| 32 | SNK-PP5 | DcM11 | DcI5 | |
| 33 | SNK-M1 | DcM20 | DcI12 | Mueang District, Sakon Nakhon Province |
| 34 | SNK-M2 | DcM19 | DcI13 | |
| 35 | SNK-M3 | DcM18 | DcI5 | |
| 36 | SNK-M4 | DcM17 | DcI14 | |
| 37 | SNK-M5 | DcM16 | DcI15 | |
| 38 | SKW-WY1 | DcM23 | DcI1 | Wang Nam Yen District, Sa Kaeo Province |
| 29 | SKW-WY2 | DcM22 | DcI1 | |
| 40 | SKW-WY3 | DcM21 | DcI11 | |
| 41 | NMA-KB1 | DcM26 | DcI1 | Khonburi District, Nakhon Ratchasima Province |
| 42 | NMA-KB2 | DcM25 | DcI9 | |
| 43 | NMA-KB3 | DcM24 | DcI10 | |
| 44 | KKN-WK1 | DcM32 | DcI2 | Wiang Kao District, Khon Kaen Province |
| 45 | KKN-WK2 | DcM31 | DcI3 | |
| 46 | KKN-WK3 | DcM30 | DcI4 | |
| 47 | KKN-WK4 | DcM29 | DcI5 | |
| 48 | KKN-WK5 | DcM28 | DcI6 | |
| 49 | KKN-WK6 | DcM27 | DcI7 | |
| 50 | KKN-WK7 | n/a | DcI8 | |
| 51 | CCO-TT1 | DcM34 | DcI1 | Tha Takiap District, Chachoengsao Province |
| 52 | CCO-TT2 | DcM33 | DcI1 | |
| 53 | CCO-TT3 | DcM34 | DcI1 | |
| 54 | CCO-TT4 | DcM33 | DcI1 | |
| 55 | UBN-NC1 | n/a | DcI24 | Na Chaluai District, Ubon Ratchathani Province |
| 56 | UBN-NC2 | n/a | DcI21 | |
| 57 | UBN-NC4 | n/a | DcI21 | |
| 58 | UBN-NY1 | n/a | DcI22 | Nam Yuen District, Ubon Ratchathani Province |
| 59 | UBN-NY2 | n/a | DcI22 | |
| 60 | UBN-NY3 | n/a | DcI22 | |
| 61 | MDH8 | n/a | DcI25 | Kham Chai District, Mukdahan Province |
| 62 | MDH12 | n/a | DcI13 | |
| 63 | MDH41 | n/a | DcI25 | |
| 64 | MDH67 | n/a | DcI17 | |
| 65 | UDN36 | n/a | DcI30 | Nong Wua So District, Udon Thani Province |
| 66 | UDN37 | n/a | DcI2 | |
| 67 | UDN43 | n/a | DcI2 | |
| 68 | UDN45 | n/a | DcI31 | |
| 69 | PLK5 | n/a | DcI16 | Nakhon Thai District, Phisanulok Province |
| 70 | PLK9 | n/a | DcI26 | |
| 71 | PLK21 | n/a | DcI27 | |
| 72 | PLK32 | n/a | DcI13 | |
* matK haplotype delection, ** ITS haplotype detection.
Table 2.
Molecular diversity indices of the 17 populations of D. cochinchinensis based on ITS and matK sequences analyses.
Table 2.
Molecular diversity indices of the 17 populations of D. cochinchinensis based on ITS and matK sequences analyses.
| Populations | ITS | matK | ||||||||||
|---|---|---|---|---|---|---|---|---|---|---|---|---|
| n | S | H | Uh | Hd±SD | Nd±SD | n | S | H | Uh | Hd±SD | Nd±SD | |
| TRT-M | 3 | 1 | 2 | 1 | 0.667±0.314 | 0.0010±0.0005 | 4 | 5 | 2 | 2 | 0.667±0.204 | 0.0041±0.0012 |
| TRT-KY | 3 | 1 | 2 | 0 | 0.667±0.314 | 0.0010±0.0005 | 4 | 4 | 2 | 2 | 0.667±0.204 | 0.0033±0.0001 |
| SSK-KL | 4 | 3 | 2 | 1 | 0.667±0.204 | 0.0030±0.0009 | 3 | 0 | 1 | 1 | 0.000±0.000 | 0.0000±0.0000 |
| SSK-PS | 4 | 1 | 2 | 0 | 0.500±0.265 | 0.0008±0.0004 | 4 | 11 | 2 | 2 | 0.667±0.204 | 0.0089±0.0027 |
| SRN-KC | 3 | 3 | 3 | 0 | 1.000±0.272 | 0.0035±0.0012 | 4 | 10 | 2 | 2 | 0.667±0.204 | 0.0081±0.0025 |
| SRI | 3 | 2 | 3 | 2 | 1.000±0.272 | 0.0020±0.0007 | 3 | 0 | 1 | 1 | 0.000±0.000 | 0.0000±0.0000 |
| SNK-M | 5 | 5 | 5 | 1 | 1.000±0.126 | 0.0042±0.0009 | 5 | 12 | 5 | 5 | 1.000±0.126 | 0.0073±0.0011 |
| SNK-PP | 5 | 4 | 4 | 0 | 0.900±0.161 | 0.0036±0.0007 | 5 | 22 | 5 | 5 | 1.000±0.126 | 0.0122±0.0032 |
| SKW-WY | 3 | 2 | 2 | 0 | 0.667±0.314 | 0.0020±0.0009 | 3 | 10 | 3 | 3 | 1.000±0.272 | 0.0081±0.0023 |
| NMA-KB | 3 | 2 | 3 | 2 | 1.000±0.272 | 0.0020±0.0007 | 3 | 10 | 3 | 3 | 1.000±0.272 | 0.0081±0.0025 |
| KKN-WK | 7 | 11 | 7 | 5 | 1.000±0.076 | 0.0078±0.0012 | 6 | 28 | 6 | 6 | 1.000±0.096 | 0.0138±0.0034 |
| CCO-TT | 4 | 1 | 1 | 0 | 0.000±0.000 | 0.0000±0.0000 | 4 | 12 | 2 | 2 | 0.667±0.204 | 0.0097±0.0030 |
| UBN-NY | 3 | 1 | 1 | 0 | 0.000±0.000 | 0.0000±0.0000 | n/a | n/a | n/a | n/a | n/a | n/a |
| UBN-NC | 3 | 1 | 2 | 0 | 0.667±0.314 | 0.0010±0.0005 | n/a | n/a | n/a | n/a | n/a | n/a |
| UDN | 4 | 5 | 3 | 2 | 0.833±0.222 | 0.0040±0.0013 | n/a | n/a | n/a | n/a | n/a | n/a |
| MDH | 4 | 4 | 3 | 1 | 0.833±0.222 | 0.0038±0.0011 | n/a | n/a | n/a | n/a | n/a | n/a |
| PLK | 4 | 6 | 4 | 2 | 1.000±0.177 | 0.0045±0.0013 | n/a | n/a | n/a | n/a | n/a | n/a |
| Total | 65 | 17 | 31 | 17 | 0.968±0.008 | 0.0069±0.0003 | 48 | 66 | 34 | 25 | 0.986±0.007 | 0.0161±0.0022 |
* n/a, not available.
Table 3.
Pairwise genetic distances between D. cochinchinensis populations based on matK sequences, showing p-distance (lower triangle) and Kimura 2-parameter (K2P) distance (upper triangle).
Table 3.
Pairwise genetic distances between D. cochinchinensis populations based on matK sequences, showing p-distance (lower triangle) and Kimura 2-parameter (K2P) distance (upper triangle).
| Populations | TRT-M | TRT-KY | SSK-KL | SSK-PS | SRN-KC | SNK-M | SNK-PP | SKW-WY | NMA-KB | KKN-WK | CCO-TT | SRI |
|---|---|---|---|---|---|---|---|---|---|---|---|---|
| TRT-M | − | 0.0061 | 0.0204 | 0.0086 | 0.0086 | 0.0072 | 0.0114 | 0.0071 | 0.0063 | 0.0111 | 0.0092 | 0.0448 |
| TRT-KY | 0.0061 | − | 0.0223 | 0.0117 | 0.0098 | 0.0074 | 0.0113 | 0.0065 | 0.0065 | 0.0123 | 0.0098 | 0.0429 |
| SSK-KL | 0.0201 | 0.0219 | − | 0.0179 | 0.0210 | 0.0225 | 0.0260 | 0.0227 | 0.0223 | 0.0235 | 0.0235 | 0.0597 |
| SSK-PS | 0.0085 | 0.0116 | 0.0177 | − | 0.0117 | 0.0132 | 0.0169 | 0.0137 | 0.0104 | 0.0146 | 0.0135 | 0.0513 |
| SRN-KC | 0.0085 | 0.0097 | 0.0207 | 0.0116 | − | 0.0108 | 0.0140 | 0.0094 | 0.0094 | 0.0127 | 0.0117 | 0.0467 |
| SNK-M | 0.0072 | 0.0073 | 0.0222 | 0.0130 | 0.0107 | − | 0.0095 | 0.0080 | 0.0091 | 0.0119 | 0.0093 | 0.0444 |
| SNK-PP | 0.0113 | 0.0112 | 0.0256 | 0.0167 | 0.0139 | 0.0095 | − | 0.0116 | 0.0122 | 0.0151 | 0.0126 | 0.0429 |
| SKW-WY | 0.0071 | 0.0065 | 0.0223 | 0.0136 | 0.0093 | 0.0080 | 0.0115 | − | 0.0094 | 0.0124 | 0.0111 | 0.0411 |
| NMA-KB | 0.0063 | 0.0065 | 0.0219 | 0.0104 | 0.0093 | 0.0090 | 0.0121 | 0.0093 | − | 0.0118 | 0.0102 | 0.0476 |
| KKN-WK | 0.0110 | 0.0122 | 0.0231 | 0.0144 | 0.0126 | 0.0118 | 0.0149 | 0.0123 | 0.0116 | − | 0.0129 | 0.0493 |
| CCO-TT | 0.0091 | 0.0097 | 0.0231 | 0.0134 | 0.0116 | 0.0093 | 0.0124 | 0.0110 | 0.0102 | 0.0128 | − | 0.0467 |
| SRI | 0.0432 | 0.0414 | 0.0572 | 0.0493 | 0.0451 | 0.0429 | 0.0414 | 0.0398 | 0.0459 | 0.0475 | 0.0451 | − |
Table 4.
Pairwise genetic distances between D. cochinchinensis populations based on ITS sequences, showing p-distance (lower triangle) and Kimura 2-parameter (K2P) distance (upper triangle).
Table 4.
Pairwise genetic distances between D. cochinchinensis populations based on ITS sequences, showing p-distance (lower triangle) and Kimura 2-parameter (K2P) distance (upper triangle).
| Populations | TRT-M | TRT-KY | SSK-KL | SSK-PS | SRN-KC | SNK-M | SNK-PP | SKW-WY | NMA-KB | KKN-WK | CCO-TT | UBN-NY | UBN-NC | MDH | UDN | PLK | SRI |
|---|---|---|---|---|---|---|---|---|---|---|---|---|---|---|---|---|---|
| TRT-M | − | 0.0025 | 0.0088 | 0.0046 | 0.0045 | 0.0114 | 0.0108 | 0.0050 | 0.0065 | 0.0104 | 0.0050 | 0.0035 | 0.0015 | 0.0122 | 0.0080 | 0.0103 | 0.0050 |
| TRT-KY | 0.0025 | − | 0.0073 | 0.0031 | 0.0030 | 0.0099 | 0.0093 | 0.0035 | 0.0043 | 0.0088 | 0.0035 | 0.0010 | 0.0010 | 0.0107 | 0.0063 | 0.0088 | 0.0035 |
| SSK-KL | 0.0087 | 0.0072 | − | 0.0089 | 0.0075 | 0.0047 | 0.0044 | 0.0063 | 0.0078 | 0.0060 | 0.0068 | 0.0083 | 0.0073 | 0.0064 | 0.0072 | 0.0049 | 0.0048 |
| SSK-PS | 0.0046 | 0.0031 | 0.0088 | − | 0.0020 | 0.0120 | 0.0114 | 0.0053 | 0.0068 | 0.0104 | 0.0056 | 0.0041 | 0.0031 | 0.0129 | 0.0078 | 0.0110 | 0.0049 |
| SRN-KC | 0.0045 | 0.0030 | 0.0075 | 0.0020 | − | 0.0109 | 0.0103 | 0.0040 | 0.0055 | 0.0091 | 0.0045 | 0.0040 | 0.0030 | 0.0117 | 0.0064 | 0.0098 | 0.0035 |
| SNK-M | 0.0113 | 0.0098 | 0.0046 | 0.0119 | 0.0108 | − | 0.0034 | 0.0094 | 0.0109 | 0.0069 | 0.0094 | 0.0109 | 0.0099 | 0.0046 | 0.0098 | 0.0041 | 0.0083 |
| SNK-PP | 0.0107 | 0.0092 | 0.0043 | 0.0113 | 0.0102 | 0.0034 | − | 0.0088 | 0.0103 | 0.0065 | 0.0088 | 0.0103 | 0.0093 | 0.0038 | 0.0091 | 0.0035 | 0.0077 |
| SKW-WY | 0.0050 | 0.0035 | 0.0062 | 0.0052 | 0.0040 | 0.0093 | 0.0087 | − | 0.0022 | 0.0078 | 0.0010 | 0.0045 | 0.0035 | 0.0102 | 0.0053 | 0.0083 | 0.0023 |
| NMA-KB | 0.0065 | 0.0043 | 0.0077 | 0.0067 | 0.0055 | 0.0108 | 0.0102 | 0.0022 | − | 0.0091 | 0.0015 | 0.0040 | 0.0050 | 0.0117 | 0.0063 | 0.0098 | 0.0038 |
| KKN-WK | 0.0104 | 0.0087 | 0.0060 | 0.0103 | 0.0090 | 0.0068 | 0.0065 | 0.0078 | 0.0090 | − | 0.0084 | 0.0095 | 0.0089 | 0.0077 | 0.0067 | 0.0065 | 0.0065 |
| CCO-TT | 0.0050 | 0.0035 | 0.0067 | 0.0056 | 0.0045 | 0.0093 | 0.0087 | 0.0010 | 0.0015 | 0.0084 | − | 0.0045 | 0.0035 | 0.0102 | 0.0060 | 0.0083 | 0.0030 |
| UBN-NY | 0.0035 | 0.0010 | 0.0082 | 0.0041 | 0.0040 | 0.0108 | 0.0102 | 0.0045 | 0.0040 | 0.0094 | 0.0045 | − | 0.0020 | 0.0117 | 0.0068 | 0.0098 | 0.0045 |
| UBN-NC | 0.0015 | 0.0010 | 0.0072 | 0.0031 | 0.0030 | 0.0098 | 0.0092 | 0.0035 | 0.0050 | 0.0089 | 0.0035 | 0.0020 | − | 0.0107 | 0.0065 | 0.0088 | 0.0035 |
| MDH | 0.0121 | 0.0106 | 0.0064 | 0.0127 | 0.0116 | 0.0046 | 0.0038 | 0.0101 | 0.0116 | 0.0077 | 0.0101 | 0.0116 | 0.0106 | − | 0.0102 | 0.0039 | 0.0092 |
| UDN | 0.0080 | 0.0062 | 0.0071 | 0.0078 | 0.0064 | 0.0097 | 0.0090 | 0.0052 | 0.0062 | 0.0066 | 0.0060 | 0.0067 | 0.0065 | 0.0101 | − | 0.0085 | 0.0043 |
| PLK | 0.0102 | 0.0087 | 0.0049 | 0.0109 | 0.0097 | 0.0040 | 0.0034 | 0.0082 | 0.0097 | 0.0064 | 0.0082 | 0.0097 | 0.0087 | 0.0039 | 0.0084 | − | 0.0073 |
| SRI | 0.0050 | 0.0035 | 0.0047 | 0.0049 | 0.0035 | 0.0083 | 0.0077 | 0.0023 | 0.0038 | 0.0065 | 0.0030 | 0.0045 | 0.0035 | 0.0091 | 0.0042 | 0.0072 | − |
Disclaimer/Publisher’s Note: The statements, opinions and data contained in all publications are solely those of the individual author(s) and contributor(s) and not of MDPI and/or the editor(s). MDPI and/or the editor(s) disclaim responsibility for any injury to people or property resulting from any ideas, methods, instructions or products referred to in the content. |
© 2025 by the authors. Licensee MDPI, Basel, Switzerland. This article is an open access article distributed under the terms and conditions of the Creative Commons Attribution (CC BY) license (http://creativecommons.org/licenses/by/4.0/).
Copyright: This open access article is published under a Creative Commons CC BY 4.0 license, which permit the free download, distribution, and reuse, provided that the author and preprint are cited in any reuse.


