
Submitted:
30 April 2025
Posted:
02 May 2025
You are already at the latest version
Abstract
The paraventricular nucleus of the hypothalamus (PVN) regulates, among others, the stress response, sexual behavior, and energy metabolism, through its magnocellular and parvocellular neurosecretory cells. Within the PVN, ensemble coordination occurs through the many long-range synaptic afferents, whose activity in time relies on retrograde neuromodulator by, e.g., endocannabinoids. However, the nanoarchitecture of endocannabinoid signaling in the PVN, especially during neuronal development, remains undescribed. By using single-cell RNA sequencing, in situ hybridization, and immunohistochemistry during fetal and postnatal development in mice, we present a spatiotemporal map of both the 2-arachydonoylglycerol and anandamide signaling cassettes, with a focus on receptors and metabolic enzymes, in both molecularly-defined neurons and astrocytes. We find type 1 cannabinoid receptors (Cnr1), but neither Cnr2 nor Gpr55, expressed only in neurons of the PVN. A developmental switch from Daglb to Dagla is observed, with minimal Mgll mRNA in all neuronal subtypes of the PVN. Notably, astrocytes also expressed both Dagl isoforms. Napepld, and Faah were sparsely present. Immunohistochemistry validated mRNA expression, and suggested that endocannabinoid signaling is configured to modulate the activity of afferent inputs, rather than local neurocircuits, in the PVN.
Keywords:
cannabinoid receptor
; endocannabinoid
; hypothalamus
; postnatal development
; monoacylglycerol lipase
; sn-1-diacylglycerol lipase
1. Introduction
The hypothalamus is an archetypical, evolutionary conserved vertebrate brain structure that controls essential physiological processes, including food and fluid intake, energy homeostasis, stress responses, sleep/wake cycles, as well as sexual behavior and reproduction, to ensure the subject’s survival[1]. Consequently, the hypothalamus contains a collection of topographically segregated neuronal loci, each possessing their own molecular signature and synaptic connectivity. For instance, the paraventricular nucleus (PVN), flanking the third ventricle bilaterally, and mainly consisting of excitatory vesicular glutamate transporter 2 (Slc17a6/VGLUT2)+ neurons (Figure 1a), integrates neuroendocrine and autonomic functions through its dorsolateral magnocellular and medioventral parvocellular subdivisions. Its neurosecretory magnocellular cells are large-bodied neurons expressing either vasopressin (mAVP) or oxytocin (mOXT), with both subpopulations projecting directly to the posterior pituitary, where they release their hormones directly into the systemic circulation to regulate blood pressure, water-balance, and maternal, social and feeding behaviors, respectively[2]. In contrast, parvocellular (small-bodied) neurosecretory neurons contain corticotrophin-releasing hormone (CRH; pCRH), thyrotropin-releasing hormone (TRH; pTRH), or somatostatin (SST; pSST) and extend their axons to the median eminence, a gateway structure for hypothalamic hormones to reach the anterior pituitary through the hypophyseal portal system. Once released into the portal blood, CRH orchestrates the hypothalamus-pituitary-adrenal (HPA) axis upon stress, with sequential release events for adrenocorticotropic hormone (ACTH) from the pituitary, and cortisol from the adrenal cortex. TRH stimulates the release of thyroid-stimulating hormone (TSH) from the anterior pituitary, thus controlling metabolic and cardiovascular function through the hypothalamus-pituitary-thyroid (HPT) axis. Antagonistically, SST inhibits the release of TSH from the anterior pituitary[3]. Thus, the PVN is essential for bodily metabolism with its dysfunction implicated in obesity, hypertension, diabetes insipidus2, as well as anxiety and depression[4,5].
To control the many physiological processes, the PVN is innervated by long-distance afferents, both excitatory and inhibitory in nature, originating from multiple brain regions: e.g., from excitatory proopiomelanocortin (POMC)+/Slc17a6+ glutamatergic[6], and inhibitory agouti-related protein (AgRP)/neuropeptide Y neurons[7] of the arcuate nucleus to control energy expenditure[8,9]; glutamatergic neurons of the amygdalo-piriform transition area, and inhibitory neurons of the central amygdala to modulate CRH secretion upon fear induction[10]; as well as inhibitory neurons of the bed nucleus of the stria terminals upon reward seeking and stress[11]. As a general principle, the temporal precision of both its innate neurocircuits and neuroendocrine output of the PVN is controlled by inhibitory neurotransmission originating in nearby brain areas, rather than intrinsically, through GABAA receptor-dependent inhibition[12,13,14]. However, synaptic integration is unlikely to be exclusively reliant on distant-positioned neurons[12,13], particularly in the absence of a major interneuron (GABA) contingent locally (Figure 1a1,b)[15]. Thus, we hypothesized that synaptic synchronization and local neurotransmitter availability, from both local collaterals and afferents, could additionally rely on fast-acting retrograde signaling. Indeed, compared to other hypothalamic areas, the PVN is known for its expression of type 1 cannabinoid receptor mRNA (Cnr1/CB1R)[16], a Gi/o protein-coupled receptor negatively affecting neurotransmitter release (Figure 1a3,b-b2). The activation of presynaptic CB1Rs occurs through 2-arachidonoylglycerol (2-AG)[17] and anandamide (AEA)[18], endocannabinoids produced in subsynaptic dendrites[19]. Indeed, engagement of CB1Rs in the PVN was shown to influence energy metabolism[20,21], food intake[20,22], and the stress response[23,24]. However, the cellular architecture of the endocannabinoid system on identified neuronal and astrocyte populations in the PVN remains unresolved, whether during development or in adulthood.
Here, we produced a comprehensive expression map of cannabinoid receptors (Cnr1/Cnr2/Gpr55), as well as the putative enzymes involved in 2-AG (Dagla/Daglb, Mgll) and AEA metabolism (Napepld/Gde1, Faah) at successive developmental stages. Particularly, we found that mOXT and mAVP, which appear at embryonic day (E) 15.5, expressed Cnr1, but neither Cnr2 nor Gpr55, towards postnatal day (P)21, that is pre-adolescence. Once the PVN became enriched in pTRH/pCRH neurons, these neuronal subtypes also expressed Cnr1. Spatiotemporal Dagla/Daglb and Mgll expression tightly followed that of Cnr1, also recapitulating a robust Daglb-to-Dagla switch at neonatal life, in line with the predominance of DAGLα in retrograde neurotransmission at mature synapses[25]. For pSST neurons, which segregate lastly in the PVN, molecular arrangements were indistinguishable from other neuronal subtypes, yet expressional patterns were delayed as much as the emergence of pSST neurons themselves. Napepld mRNA content was minimal in all neurons, while Faah expression increased towards P21. Single-cell RNA-seq data showed a near complete lack of cannabinoid receptors in astrocytes of the adult PVN, but revealed Dagla expression. We found reliable amounts of neither Napepld nor Faah mRNA in astrocytes, reflecting previous data suggesting that astrocytes are more reliant on 2-AG signaling when interacting with nearby neurons[26,27]. In sum, we described the molecular constituents of the endocannabinoid system in identified magnocellular and parvocellular neurons, as well as astrocytes, at single-cell-precision during fetal and postnatal development of the PVN.
2. Results
Neuronal diversity in the PVN during brain development. We defined neuronal subtypes in the PVN by combining neurotransmitter and neuropeptide-related gene signatures at embryonic (E15.5-E17.5), neonatal (P0), juvenile (P2, P10), and pre-adolescent (P23) hypothalamus datasets (Supporting Figure 1a)[15]. At E15.5, magnocellular neurosecretory cells expressing Oxt (mOXT) and Avp (mAVP) mRNA appeared first, with mRNA levels gradually rising to P21 (Figure 2a-a1). We caution that the sequence similarity between Oxt and Avp could have limited the precise assessment of Avp mRNA present, for which Avp itself was excluded for subsequent analysis[28]. Next, we distinguished parvocellular cells at E17.5, particularly pCRH and pTRH neurons, as well as a late-emerging pSST group after birth (Figure 2a2-a4). For parvocellular cells, mRNA levels increased as a factor of developmental stage and peaked at P10-to-P21. The temporal pattern described here was validated by an RNA-sequencing dataset published earlier[29], which also show mOXT/mAVP > pCRH/pTRH > pSST neurons, even if at shallower resolution (Supporting Figure 1a vs. a1; Supporting Figure 2a-a4). This sequence of events is compatible with the concept that long-range projection neurons of the hypothalamus mature earlier than locally-targeting neurons and/or interneurons[15].
Assembly of the endocannabinoid system. To map genes broadly associated with the ‘endocannabinoid system’, we first examined gene expression for Cnr1, Cnr2[16,30], and Gpr55[31]. We found Cnr1 expression at molecule numbers exceeding 3,000 per cell at E15.5 and E17.5 in subsets of mOXT, pTRH, and pCRH neurons, with its levels maintained until P21 (>1,000 mRNA copies per cell; Figure 3a,b). In pSST neurons, Cnr1 was detected in 15-20% of cells only postnatally, correlating the temporal expression pattern of Sst itself (Figure 2a4), even if in a small sample size that was not processed further. Even though Cnr2 mRNA was previously found in the hypothalamus[32], we could not reliably detect Cnr2 mRNA transcripts by single-cell RNA-seq in neurons, suggesting limited, if any, Cnr2 contributions to neuronal development, at least in the PVN (Figure 3a1). In contrast, we detected a few Gpr55-containing neurons, mainly mOXT and pTRH cells, with low mRNA copy numbers (<100 mRNA copies per cell) at neonatal and juvenile ages (Figure 3a2,b) [33]. In sum, Cnr1 is the main cannabinoid receptor in neurons of the PVN to respond to (endo-)cannabinoid signals, whether during axonal growth and guidance, synaptogenesis, or retrograde signaling at maturity[34].
Next, we assessed Dagla, Daglb[35], and Mgll[36] mRNA expression. Both Dagla and Daglb were found in mOXT, pTRH, and pCRH neurons at both E15.5 and E17.5, with mRNA levels, but not cell abundance, diminishing into pre-adolescence (Figure 4a,a1,b). Expression of Dagla/Daglb in pSST cells was delayed to postnatal life, as much as seen for Cnr1 and Sst mRNAs (Figure 2a4 and Figure 4a). During embryonic stages, we found a ~2.5-fold higher number of neurons expressing Daglb, as compared to Dagla (84 vs. 35 cells, over mOXT and pTRH neurons), which reversed between E17.5 and P10 (52 vs. 86 cells; Figure 4b), corroborating a developmental isoform switch model proposed earlier[25,35,37]. In parallel, Mgll expression gradually decreased towards P21. Of note, Mgll mRNA was found in the same neuronal clusters, but not cells, as Dagla/Daglb (Figure 4a2,b). These data suggest that molecular and rate-limiting constituents of 2-AG signaling are present throughout neuronal diversification in the PVN, and could contribute to cell-state-specific intercellular communication, e.g., neuritogenesis[38,39].
Subsequently, we determined the cellular foci for Napepld mRNA expression, implicated in AEA synthesis[40,41]. Napepld mRNA was sparse in both magnocellular and parvocellular PVN neurons at any time point (Figure 5a,b). In contrast, Gde1 expression[42] was promiscuous and significant in all neuronal clusters (Figure 5a1,b). The expression of Faah, the enzyme chiefly degrading AEA[43], was pronounced (>500 mRNA molecules/cell) throughout brain development in both magnocellular and parvocellular neurons (Figure 5a2,b). These data suggest 2-AG signaling in the PVN could affect many more neurons, corroborating its proposed role as the primary endocannabinoid involved with both neuritogenesis and retrograde signaling[44].
Nanoscale anatomy of 2-AG signaling revealed by in situ hybridization. We have performed multiplexed fluorescence in situ hybridization to reconstruct 2-AG signaling, which appeared superior relative to AEA in the PVN (Figure 6). At E15.5, the prospective territory of the PVN was outlined by Cnr1 mRNA expression, which reminisced the shape of the adult structure (Figure 6a,a1 vs. Figure 1b): Cnr1 mRNA localized to the majority of pCRH neurons (Figure 6a1,2), alike to subpopulations of mOXT and pTRH neurons (Figure 6a3,4). While Daglb mRNA transcripts were found in most pCRH, mOXT and pTRH cells (Figure 6a1-4), Dagla was not detected reliably by in situ hybridization at E15.5, even if we excluded technical frailties by visualizing Dagla in the hippocampus en masse during embryogenesis (Figure S3a,b). Thus, we continued with the analysis of Daglb for developmental stages and found Daglb mRNA abundantly at E15.5 (Figure 6a2). At P10, both Cnr1 and Daglb remained expressed in both pTRH and mOXT cells (Figure 6b-c1). Mgll was present in mOXT neurons, and co-existed with Cnr1 (Figure 6c1,c1). At P21, Daglb and Mgll were rarely expressed. In contrast, Dagla co-localized with Cnr1 primarily in pTRH neurons (Figure 6d-d2). Similarly, we continued to detect Cnr1 mRNA in pCRH cells (Figure 6e,e1).
Subsequently, we performed immunohistochemistry for DAGLα and CB1Rs at E15.5 and P21. In accord with our results using in situ hybridization, CB1R protein accumulated in the fetal PVN, and decorated punctae and processes, which we have interpreted as labeling of growth cones and nascent synapses on afferent input. In contrast, DAGLα immunoreactivity was minimal (Figure 6f-f1). At P21, CB1Rs continued to decorate terminal-like punctae, encircling perikarya and processes of, e.g., mOXT-containing neurons (Figure 6g,g1), with DAGLα confined mostly along the dendrites of neurons and in apposition to CB1Rs (Figure 6g,g2). In sum, cell-resolved neuroanatomy confirmed cell identities, transcript switches for Dagla and Daglb, the developmental dynamics for Cnr1 mRNA, and classical configuration of DAGLα and CB1R for retrograde signaling at the protein level.
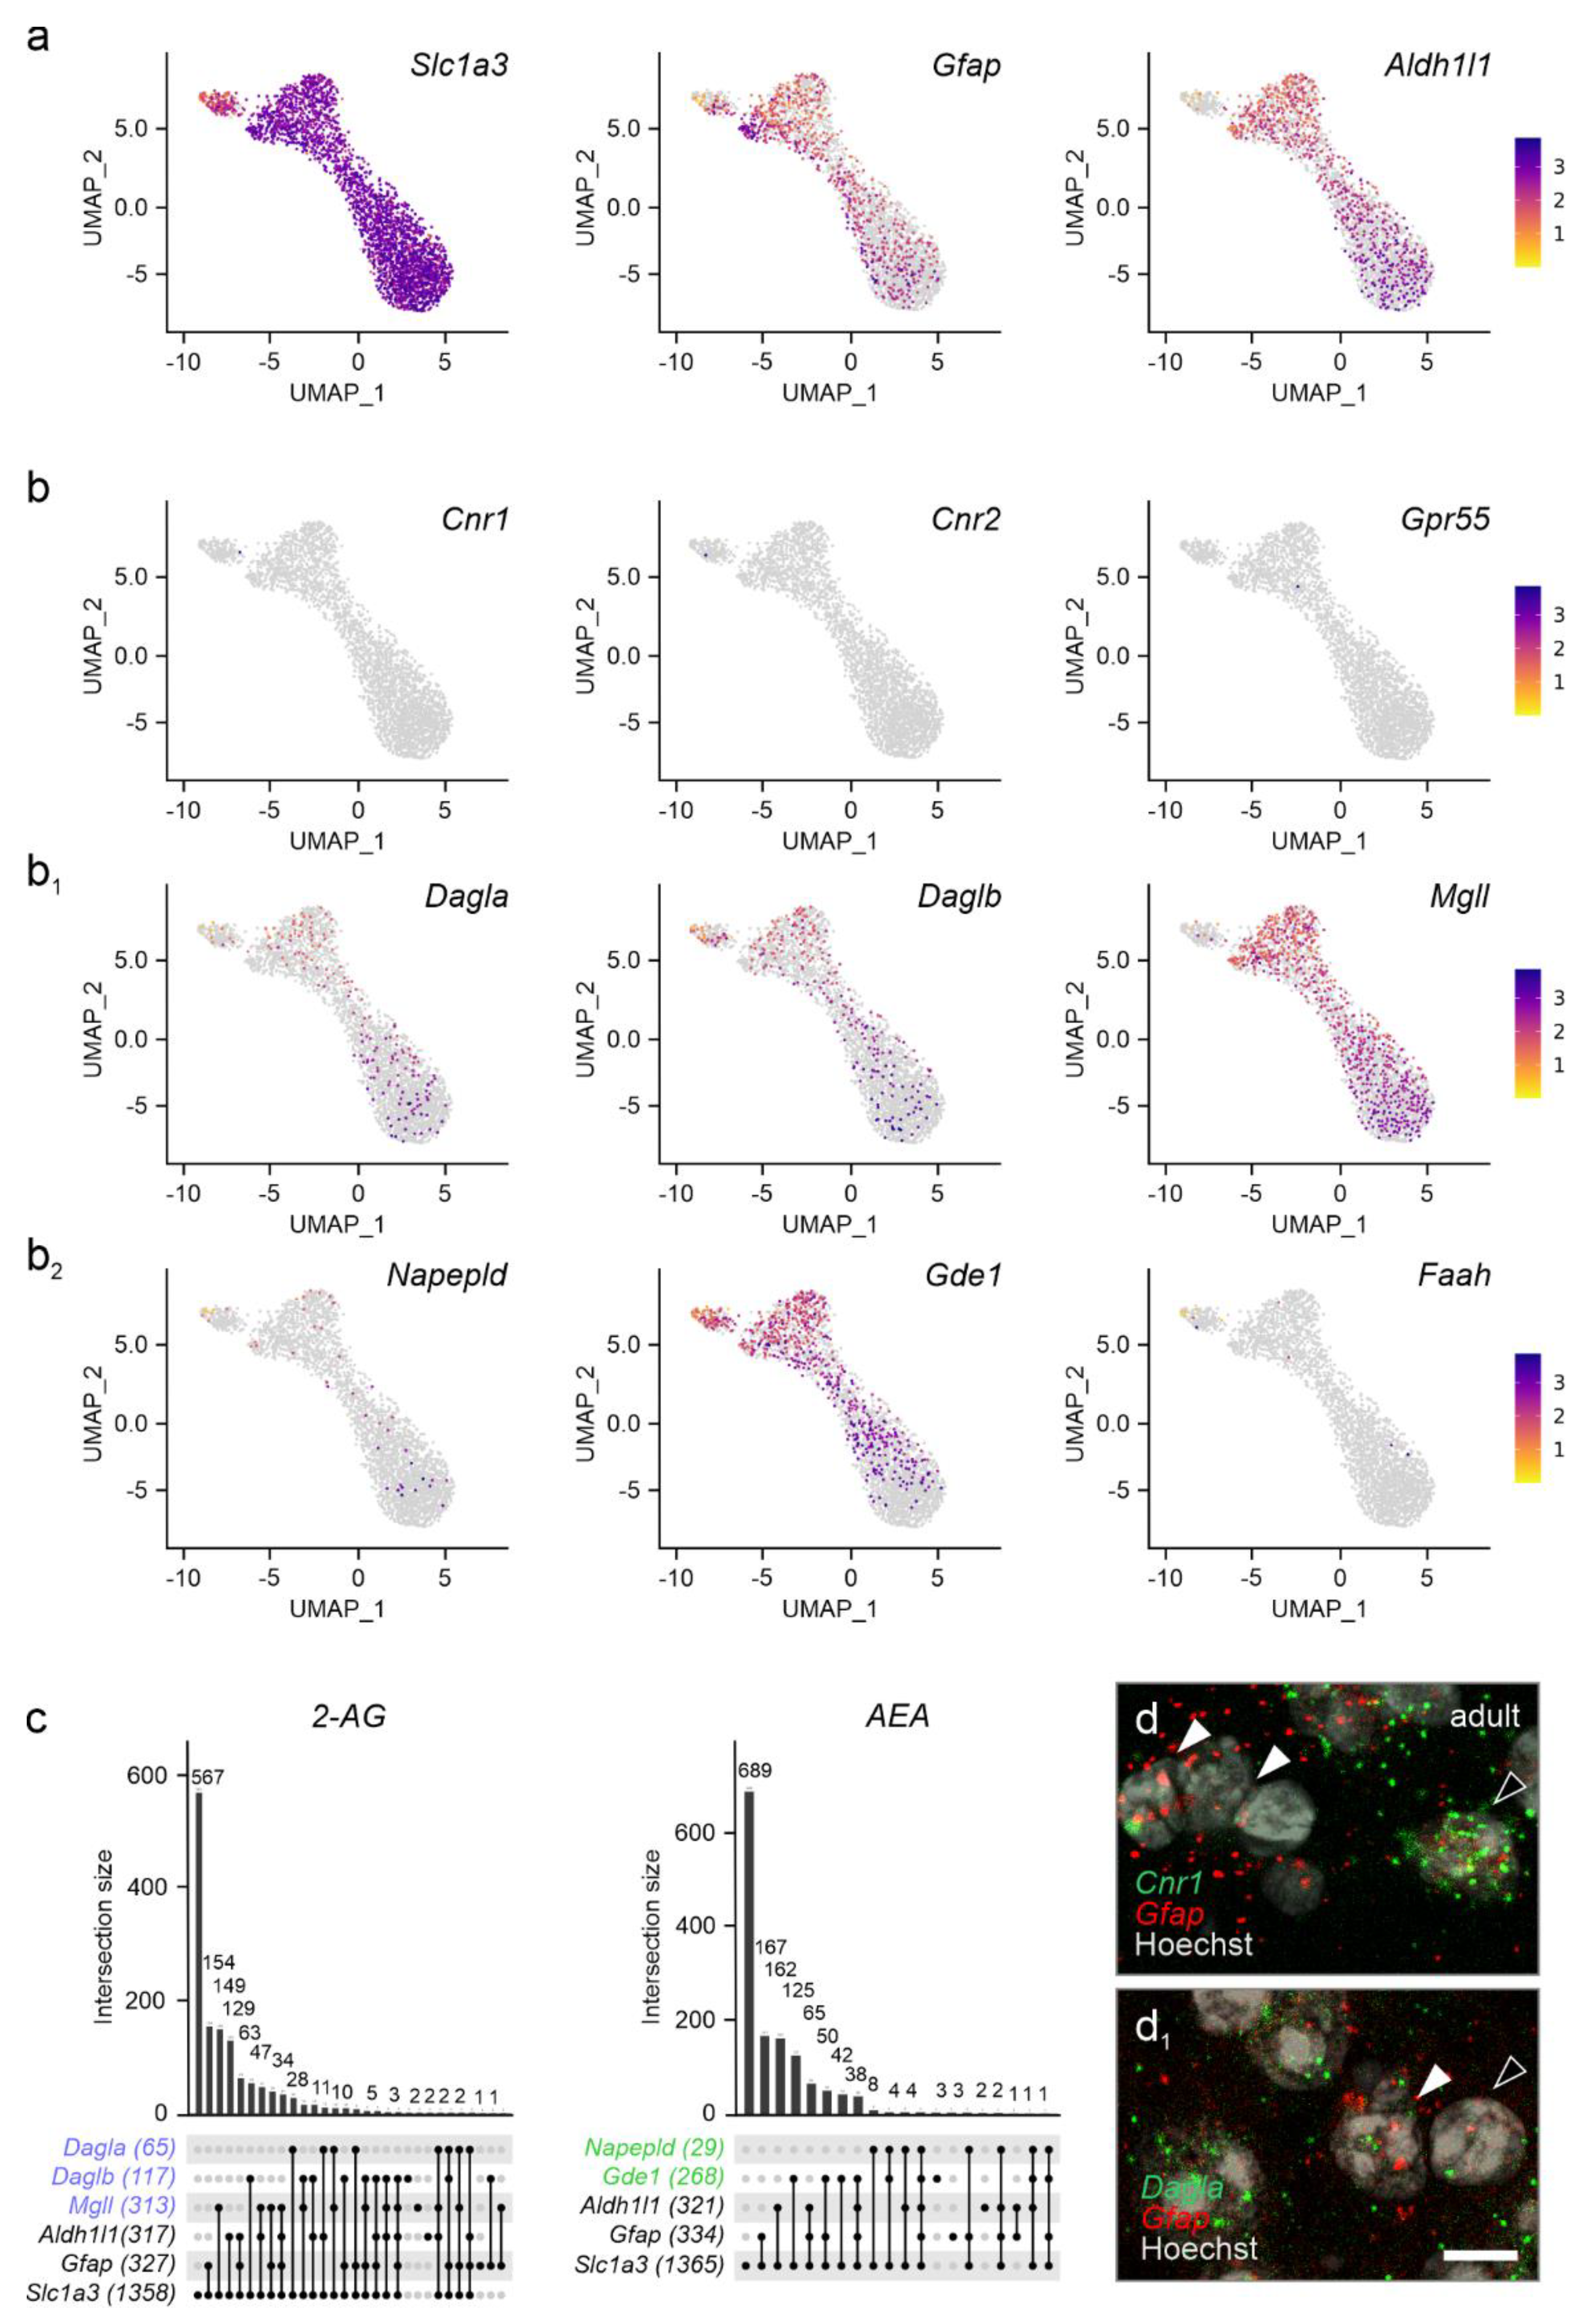
The endocannabinoid system in astrocytes. As endocannabinoid signaling is essential for neuron-to-astrocyte communication in multiple physiological processes[45,46,47], we addressed if cannabinoid receptors and enzymes related to endocannabinoid metabolism were expressed in astrocytes in the pre-adolescent PVN. We justify the choice of P21 by the postnatal window of astrocytogenesis and maturation that sequentially occur between P2-P14[48]. Thus, terminally-differentiated astrocytes that could reflect bona fide PVN-related signaling could be resolved starting at P21[48]. We subdivided astrocytes based on their prototypical markers: excitatory amino acid transporter 1 (Slc1a3)[49], glial fibrillary acidic protein (Gfap)[50], and aldehyde dehydrogenase 1 family member L1 (Aldh1l1)[51], which jointly defined a cellular cluster (Figure 7a). When plotting cannabinoid receptors, we found a near complete lack of Cnr1, Cnr2 and Gpr55 mRNA (Figure 7b,c), which was unexpected as functional CB1Rs have previously been localized to hypothalamic nuclei other than the PVN[52], as well as also to extrahypothalamic regions[26,46,53,54]. Both Dagla and Daglb mRNA were found in subsets of astrocytes, while Mgll mRNA was present in a larger subset (Figure 7b1,c). Despite Gde1 being present in astrocytes, neither Napepld nor Faah could be detected reliably (Figure 7b2,c). We validated the above data by in situ hybridization, which showed the lack of Cnr1 mRNAs but the presence of Dagla (Figure 7d,d1). Thus, astrocytes in the PVN could contribute to endocannabinoid metabolism and assist in shaping synaptic neurotransmission[55].
3. Discussion
This study describes the developmental dynamics of cannabinoid receptor and endocannabinoid metabolism-related enzyme expression in the PVN of mice. Major findings include that all neurons go through a CB1R+ phase during embryonic and postnatal development, which is compatible with previous proposals on CB1R being ubiquitously expressed upon neurogenic commitment in vertebrates[38,56], and is associated with axonal growth and guidance. For 2-AG synthesis, our data recapitulates a developmentally regulated Daglb-to-Dagla switch, that has been shown for the cerebral cortex[57] but not the hypothalamus earlier. Moreover, the finding that Daglb and Dagla, but lower amounts of Mgll, are expressed in neurons of the PVN is compatible with known anatomical arrangements with the PVN being reliant on monosynaptic afferents from external sources (BNST, amygdala, arcuate nucleus, suprachiasmatic nucleus) rather than local interneurons to synchronize its endocrine output. Accordingly, MAGL, together with CB1Rs, are expected to be expressed outside the PVN to time the presynaptic action of endocannabinoids produced by PVN neurons. Thus, the spatial configuration of endocannabinoid signaling during neuronal diversification in the PVN and in adulthood is adequate to control the avalanche of synaptic inputs arriving from intra- and extrahypothalamic areas. In addition, the importance of retrograde neurotransmission in the PVN is highlighted by the use of gaseous neuromodulators, particularly nitric oxide (NO). Neuronal NO synthase (Nos1) is particularly abundant in the PVN, as compared to other hypothalamic nuclei, and its effects on food intake[58,59], renal sympathetic nerve activity[60,61], and sympatho-adrenomedullary outflow[62] are well described.
Besides cannabinoid receptors, we mapped the cellular distribution of Dagla, Daglb, Napepld, Gde1, and Faah, enzymes that are fundamental to the turnover of endocannabinoids. Even though these enzymes are the most abundant to modulate endocannabinoid levels in the brain and at the periphery, we acknowledge the contributions of others that have not been studied: e.g., MGL degrades ~85% of 2-AG in the brain[63]. In contrast, α/β-hydrolase domain containing 6 (Abhd6)[64] and 12 (Abhd12)[65] account for ~4% and ~9% of 2-AG degradation, respectively[63]. Similarly, the metabolic pathway for AEA is complex, and includes Abhd4, Gde4/7, Ptpn22, as well as Lox and Cox2, for synthesis and degradation respectively (for extensive reviews see Refs.[66,67]). As the biological significance of these enzymes is less well understood, we did not pursue them in this report. We also note that Gde1 has been found important to AEA synthesis, at least in vitro. Yet, AEA levels in the brain of Gde1-/- mice do not differ, questioning its role in AEA synthesis in vivo[68]. Therefore, and given the low abundance of Napepld mRNA expression, we hypothesize that 2-AG signaling might be more prevalent than AEA in the PVN. While we are confident that our study still provides substantial insights into the architecture of endocannabinoid signaling in the PVN, our datasets will certainly be amenable for further focused analysis if and when those aims are justified.
2-AG is considered to be the main circuit-breaker driving retrograde signaling in a fast, but phasic, manner[69,70], since 2-AG is a more potent agonist at the CB1R[71], is available at up to a 1,000-fold higher concentrations in the brain[18,69], and its absence curtails retrograde signaling in the DAGLα knockout mice[25]. Conversely, AEA is regarded as tonically inhibiting neuronal activity[44,70]. In accord with this hypothesis, previous reports suggest that tonic regulation of the HPA axis by AEA occurs either directly at neurons of the PVN[72] or indirectly through extrahypothalamic sites, such as the basolateral amygdala[44]. Nevertheless, mRNA levels predict neither protein abundance, nor enzymatic activity[73]. Therefore, cell-resolved electrophysiology will be best placed to define the contribution of these endocannabinoids to regulating specific behaviors.
While endocannabinoids limit neurotransmitter release through neuronal CB1Rs, recent studies have proposed that CB1Rs on astrocytes could instead promote neuronal activity by controlling metabolite availability[27]. Accordingly, activation of mitochondrial CB1Rs in astrocytes could regulate glucose metabolism to ensure neuronal bioenergetics[53]. Furthermore, CB1Rs localized to astrocyte leaflets ensheathing blood vessels in the nucleus accumbens were implicated in regulating anxiety and depression-like behaviors[54]. In the hypothalamus, engagement of CB1Rs on or in astrocytes might regulate processes involved with energy metabolism, including leptin signaling and glycogen storage[52]. Therefore, we expected astrocytes in the PVN to express CB1Rs (and probably also others). Nevertheless, we could not detect any with the tools available this time. We did however find substantial expression of both DAGL isoforms, implicating astrocytes in 2-AG metabolism. As 2-AG can be released by astrocytes in response to other non-endocannabinoid-mediated signals, such as ATP[74], we propose that astrocytes could tune neuronal activity through CB1R-independent 2-AG release. Thus, our findings suggest novel, metabolism-driven endocannabinoid availability as a potential rate-limiting step for the processing of synaptic inputs and translating those into hormonal output at the level of PVN neurons.
4. Materials and Methods
Ethical considerations. Mice were housed under standard husbandry conditions in a temperature and humidity-controlled room (12h/12h light cycle, 55% humidity, 22-24 oC ambient temperature). Animals had ad libitum access to food and water throughout. The maintenance and welfare of the animals conformed to the 2010/63/European Communities Council directive. Experimental protocols for tissue collection were approved by the Austrian Ministry of Science and Research (66.009/0145-WF/II/3b/2014 and 66.009/0277-WF/V3b/2017). Pregnant (embryonic day (E) 15.5), and postnatal day (P) 4, P10, and P21 C57BL/6JRj mice were obtained from Janvier Labs and kept on site as adequate.
Single-Cell RNA-seq data acquisition, and harmonization. This study utilized two publicly available single-cell RNA-seq datasets to examine the expressional dynamics of genes related to endocannabinoid signaling during mouse hypothalamus development. The principal dataset comprised 51,199 cells, 24,340 features, and encompassed all developmental stages[15]. A second dataset was obtained as a pre-processed AnnData object, and contained 128,006 cells profiled for 27,998 genes along complementary developmental time points[29,75]. All subsequent analyses were performed in R (version 4.3 or higher) within a reproducible workflow framework documented using Quarto notebooks[76]. Gene expression matrices were appropriately transposed, and cell/gene metadata were standardized. Uniform Manifold Approximation and Projection (UMAP) coordinates within the dataset were integrated as distinct dimensionality reduction objects within Seurat[77,78,79]. Metadata pertaining to developmental stages and original cluster annotations were preserved. The Romanov et al.15 dataset, available as a Seurat RDS file, was loaded and updated to the latest Seurat object specifications. Cluster identities and associated colour palettes were harmonized across both datasets to facilitate comparative analyses.
Cellular quality control and filtering. Stringent quality control was performed on both datasets to exclude potentially compromised cells and technical artefacts. Cells were retained if they had more than 500 unique genes and fewer than 25,000 unique molecular identifiers (UMIs). Additional filtering excluded cells based on high percentages of mitochondrial, ribosomal, or hemoglobin genes, elevated doublet prediction scores, and low transcriptomic complexity (log10 genes per UMI). These thresholds were enforced to enrich high-quality cellular profiles while acknowledging the potential exclusion of certain biological states, as per any filtering strategy[15,80].
Gene set curation and expression analysis. Gene sets representing canonical endocannabinoid receptors (Cnr1, Cnr2, Gpr55), metabolic enzymes (Dagla, Daglb, Gde1, Mgll, Napepld, Faah), and neuropeptides pertinent to hypothalamic classification (Oxt, Avp, Crh, Sst, Trh) were defined based on established literature[19,81,82,83,84]. To focus analyses on more robustly expressed genes and to mitigate noise from sparse detection, expression matrices were filtered to include only genes ranking above the 40th percentile of mean expression across all cells. For qualitative assessment of co-expression, gene expression was binarized based on detection status (expression > 0.5th percentile for each gene separately) within individual cells. Therefore, intersectional co-expression patterns among key gene sets could be visualized using UpSet plots generated with the UpSetR package[80,85]. UMAP was used to visualize high-dimensional cellular states in two dimensions, primarily using coordinates provided in the original datasets or recomputed as necessary[15,29,78,79,80]. The expression patterns of specific genes and the aggregate expression of curated gene sets were visualized across developmental stages and cell clusters using Seurat’s FeaturePlot function, optimizing parameters such as point size and transparency for clarity[77].
Descriptive statistics and exploratory analysis. Quantitative summaries of gene expression, including mean, standard deviation, and quartiles, were calculated for the specified target genes at the developmental periods indicated. The skimr package was used for descriptive statistics for numerical metadata and expression features, ensuring transparency regarding data distributions and completeness[80].
In situ hybridization: Embryonic heads (E15.5) and extracted brains (P10, P21) were rapidly frozen on dry-ice in plastic moulds filled with optimal cutting medium (O.C.T; Sakura), and cryosectioned at 16-µm thickness on a Leica CM1860 cryostat microtome. Coronal sections containing the PVN were collected serially on SuperFrost+ glass slides (ThermoFisher), air-dried for 20 min, and stored at -80 °C until processing. Tissue sections were immersion fixed in 4% paraformaldehyde (PFA) in 0.05M phosphate buffered-saline (PBS, pH 7.4) at 4 °C for 20 min, rinsed in PBS, and subsequently dehydrated in an ascending gradient of ethanol (25%, 50%, 75%, and 100%, 5 min each). In situ hybridization was multiplexed according to the HCR v3.0 protocol for ‘generic sample on slide’ with probe sets combining Slc32a1, Crh, Trh, Oxt, Cnr1, Dagla, Daglb, and Mgll (all from Molecular Instruments). Sections were counterstained with Hoechst 33,342 (Sigma Aldrich) and mounted with Entellan (Merck). Sections with two or more colours from appropriately labelled hairpin combinations were imaged on an LSM880 confocal microscope (Zeiss; pinhole set to 1 airy unit, and minimal laser power [<5% per channel]; 20x/0.8 NA objective for survey images and Plan-Apochromat 63x/1.4 N.A. objective for high-resolution images), processed with the ZEN software (Zeiss), and compiled as multi-panel images in CorelDRAW 2022 (Corel Corp.).
Immunohistochemistry. Whole heads of mouse foetuses (E15.5) were immersion fixed overnight with 4% PFA in 0.05M PBS at 4 °C before cryoprotection in 30% sucrose in 0.05M PBS. P21 mice were transcardially perfused with 4% PFA in 0.1M phosphate buffer (PB, pH 7.4), with their brains removed and post-fixed at 4 °C overnight, before cryoprotection in 30% sucrose in 0.05M PBS. Tissues were rapidly frozen and cryosectioned on a Leica CM1860 cryostat at either 20 µm (E15.5) and collected on SuperFrost+ glass slides (Thermo Fisher) or 50 µm for free-floating labelling (P21). Next, sections were incubated with a blocking solution containing 5% normal donkey serum (NDS, Jackson ImmunoResearch), 2% bovine serum albumin (BSA, Sigma) and 0.2% Triton X-100 (Sigma) in PBS at room temperature for 1h to block non-specific binding. Tissues were subsequently exposed to a combination of primary antibodies (guinea pig anti-CB1R [Af530], 1:500, Nittobo Medical; goat anti-DAGLα [Af1080], 1:500, Nittobo Medical, and rabbit anti-oxytocin [AB911], 1:1,000; Merck Millipore) diluted in 2% NDS, 0.1% BSA, 0.2% Triton X-100 in PBS at 4 °C for 72h. After extensive rinsing in PBS, appropriate combinations of secondary IgGs conjugated with carbocyanine (Cy)2, 3 or 5 (raised in donkey, 1:300, Jackson ImmunoResearch) were applied at 22-24 oC for 2h. Sections were counterstained with Hoechst 33,342 (Sigma Aldrich) to visualize nuclei. After extensive washing in PBS, sections were rinsed in distilled water, air-dried, and cover slipped with Entellan (in xylene, Sigma-Aldrich).
Supplementary Materials
The following supporting information can be downloaded at the website of this paper posted on Preprints.org.
Author Contributions
E.T. and T.H. defined the scope of this study. E.T., Z.H., C.B., A.A., and E.K. performed experiments and analyzed data. E.K. and T.H. wrote the manuscript.
Funding
This work was supported by the Austrian Science Fund (FWF, P 34121-B to E.K.; COE-16B to T.H.), the Swedish Research Council (2023-03058, T.H.), the Novo Nordisk Foundation (NNF23OC0084476, to T.H.), the European Research Council (FOODFORLIFE, ERC-2020-AdG-101021016; to T.H.), the National Brain Research Program of Hungary (NAP2022-I-1/2022 to A.A.) and the Excellence Program for Higher Education of Hungary (TKP-EGA-25, to A.A.).
Code availability
Analysis of RNA-seq data relied on published protocols15.
Data availability
The snRNA-seq data generated in this study have been deposited in the NCBI Gene Expression Omnibus database under accession code (GSE132730). All primary data were made publicly available at https://github.com/EugOT/eCB-hypothalamus-development and deposited to Figshare.com with DOI: 10.6084/m9.figshare.28816100. All other relevant data were included in the figures.
Competing interests statement
The authors of this manuscript declare no conflict of interest.
References
- Fong, H., Zheng, J. & Kurrasch, D. The structural and functional complexity of the integrative hypothalamus. Science 382, 388–394 (2023). [CrossRef]
- Qin, C., Li, J. & Tang, K. The Paraventricular Nucleus of the Hypothalamus: Development, Function, and Human Diseases. Endocrinology 159, 3458–3472 (2018). [CrossRef]
- Ben-Shlomo, A. & Melmed, S. Pituitary Somatostatin Receptor Signaling. Trends Endocrinol Metab 21, 123–133 (2010). [CrossRef]
- Wang, J. et al. Role and mechanism of PVN-sympathetic-adipose circuit in depression and insulin resistance induced by chronic stress. EMBO Rep 24, e57176 (2023). [CrossRef]
- Li, Y.-J. et al. Paraventricular nucleus-central amygdala oxytocinergic projection modulates pain-related anxiety-like behaviors in mice. CNS Neurosci Ther 29, 3493–3506 (2023). [CrossRef]
- Fenselau, H. et al. A rapidly acting glutamatergic ARC→PVH satiety circuit postsynaptically regulated by α-MSH. Nat Neurosci 20, 42–51 (2017). [CrossRef]
- Krashes, M. J., Shah, B. P., Koda, S. & Lowell, B. B. Rapid versus Delayed Stimulation of Feeding by the Endogenously Released AgRP Neuron Mediators GABA, NPY, and AgRP. Cell Metabolism 18, 588–595 (2013). [CrossRef]
- Cowley, M. A. et al. Leptin activates anorexigenic POMC neurons through a neural network in the arcuate nucleus. Nature 411, 480–484 (2001). [CrossRef]
- Caron, A. et al. POMC neurons expressing leptin receptors coordinate metabolic responses to fasting via suppression of leptin levels. eLife 7, e33710. [CrossRef]
- Kondoh, K. et al. A specific area of olfactory cortex involved in stress hormone responses to predator odours. Nature 532, 103–106 (2016). [CrossRef]
- Kaouane, N., Ada, S., Hausleitner, M. & Haubensak, W. Dorsal Bed Nucleus of the Stria Terminalis-Subcortical Output Circuits Encode Positive Bias in Pavlovian Fear and Reward. Front Neural Circuits 15, 772512 (2021). [CrossRef]
- Decavel, C. & Van Den Pol, A. N. GABA: A dominant neurotransmitter in the hypothalamus. Journal of Comparative Neurology 302, 1019–1037 (1990). [CrossRef]
- Mendonça, M. M. et al. Involvement of GABAergic and Adrenergic Neurotransmissions on Paraventricular Nucleus of Hypothalamus in the Control of Cardiac Function. Front. Physiol. 9, (2018). [CrossRef]
- Li, Y.-F., Jackson, K. L., Stern, J. E., Rabeler, B. & Patel, K. P. Interaction between glutamate and GABA systems in the integration of sympathetic outflow by the paraventricular nucleus of the hypothalamus. American Journal of Physiology-Heart and Circulatory Physiology 291, H2847–H2856 (2006). [CrossRef]
- Romanov, R. A. et al. Molecular design of hypothalamus development. Nature 1–7 (2020). [CrossRef]
- Matsuda, L. A., Lolait, S. J., Brownstein, M. J., Young, A. C. & Bonner, T. I. Structure of a cannabinoid receptor and functional expression of the cloned cDNA. Nature 346, 561–564 (1990). [CrossRef]
- Mechoulam, R. et al. Identification of an endogenous 2-monoglyceride, present in canine gut, that binds to cannabinoid receptors. Biochem. Pharmacol. 50, 83–90 (1995). [CrossRef]
- Stella, N., Schweitzer, P. & Piomelli, D. A second endogenous cannabinoid that modulates long-term potentiation. Nature 388, 773–778 (1997). [CrossRef]
- Kano, M., Ohno-Shosaku, T., Hashimotodani, Y., Uchigashima, M. & Watanabe, M. Endocannabinoid-mediated control of synaptic transmission. Physiol. Rev. 89, 309–380 (2009). [CrossRef]
- Cardinal, P. et al. Cannabinoid type 1 (CB1) receptors on Sim1-expressing neurons regulate energy expenditure in male mice. Endocrinology 156, 411–418 (2015). [CrossRef]
- Mazier, W. et al. mTORC1 and CB1 receptor signaling regulate excitatory glutamatergic inputs onto the hypothalamic paraventricular nucleus in response to energy availability. Mol Metab 28, 151–159 (2019). [CrossRef]
- Cruz-Martínez, A. M. et al. CB1 receptors in the paraventricular nucleus of the hypothalamus modulate the release of 5-HT and GABA to stimulate food intake in rats. Eur Neuropsychopharmacol 28, 1247–1259 (2018). [CrossRef]
- Petrie, G. N. et al. Disruption of tonic endocannabinoid signalling triggers cellular, behavioural and neuroendocrine responses consistent with a stress response. Br J Pharmacol 180, 3146–3159 (2023). [CrossRef]
- Gorzalka, B. B. & Hill, M. N. Integration of endocannabinoid signaling into the neural network regulating stress-induced activation of the hypothalamic-pituitary-adrenal axis. Curr Top Behav Neurosci 1, 289–306 (2009). [CrossRef]
- Tanimura, A. et al. The endocannabinoid 2-arachidonoylglycerol produced by diacylglycerol lipase alpha mediates retrograde suppression of synaptic transmission. Neuron 65, 320–327 (2010). [CrossRef]
- Navarrete, M. & Araque, A. Endocannabinoids Mediate Neuron-Astrocyte Communication. Neuron 57, 883–893 (2008). [CrossRef]
- Navarrete, M. & Araque, A. Endocannabinoids Potentiate Synaptic Transmission through Stimulation of Astrocytes. Neuron 68, 113–126 (2010). [CrossRef]
- Ivell, R. & Richter, D. Structure and comparison of the oxytocin and vasopressin genes from rat. Proceedings of the National Academy of Sciences 81, 2006–2010 (1984). [CrossRef]
- Kim, D. W. et al. The cellular and molecular landscape of hypothalamic patterning and differentiation from embryonic to late postnatal development. Nat Commun 11, 4360 (2020). [CrossRef]
- Munro, S., Thomas, K. L. & Abu-Shaar, M. Molecular characterization of a peripheral receptor for cannabinoids. Nature 365, 61–65 (1993). [CrossRef]
- Lauckner, J. E. et al. GPR55 is a cannabinoid receptor that increases intracellular calcium and inhibits M current. Proc. Natl. Acad. Sci. U.S.A. 105, 2699–2704 (2008). [CrossRef]
- Grabon, W. et al. CB2 expression in mouse brain: from mapping to regulation in microglia under inflammatory conditions. Journal of Neuroinflammation 21, 206 (2024). [CrossRef]
- Cherif, H. et al. Role of GPR55 during Axon Growth and Target Innervation. eNeuro 2, (2015). [CrossRef]
- Harkany, T., Mackie, K. & Doherty, P. Wiring and firing neuronal networks: endocannabinoids take center stage. Curr Opin Neurobiol 18, 338–345 (2008). [CrossRef]
- Bisogno, T. et al. Cloning of the first sn1-DAG lipases points to the spatial and temporal regulation of endocannabinoid signaling in the brain. J. Cell Biol. 163, 463–468 (2003). [CrossRef]
- Dinh, T. P. et al. Brain monoglyceride lipase participating in endocannabinoid inactivation. Proc Natl Acad Sci U S A 99, 10819–10824 (2002). [CrossRef]
- Oudin, M. J., Hobbs, C. & Doherty, P. DAGL-dependent endocannabinoid signalling: roles in axonal pathfinding, synaptic plasticity and adult neurogenesis. Eur. J. Neurosci. 34, 1634–1646 (2011). [CrossRef]
- Mulder, J. et al. Endocannabinoid signaling controls pyramidal cell specification and long-range axon patterning. Proc. Natl. Acad. Sci. U.S.A. 105, 8760–8765 (2008). [CrossRef]
- Keimpema, E. et al. Diacylglycerol lipase alpha manipulation reveals developmental roles for intercellular endocannabinoid signaling. Scientific reports 3, 2093 (2013). [CrossRef]
- Okamoto, Y., Morishita, J., Tsuboi, K., Tonai, T. & Ueda, N. Molecular Characterization of a Phospholipase D Generating Anandamide and Its Congeners*. Journal of Biological Chemistry 279, 5298–5305 (2004). [CrossRef]
- Leishman, E., Mackie, K., Luquet, S. & Bradshaw, H. B. Lipidomics profile of a NAPE-PLD KO mouse provides evidence of a broader role of this enzyme in lipid metabolism in the brain. Biochim Biophys Acta 1861, 491–500 (2016). [CrossRef]
- Simon, G. M. & Cravatt, B. F. Anandamide Biosynthesis Catalyzed by the Phosphodiesterase GDE1 and Detection of Glycerophospho-N-acyl Ethanolamine Precursors in Mouse Brain*. Journal of Biological Chemistry 283, 9341–9349 (2008). [CrossRef]
- Deutsch, D. G. & Chin, S. A. Enzymatic synthesis and degradation of anandamide, a cannabinoid receptor agonist. Biochem Pharmacol 46, 791–796 (1993). [CrossRef]
- Hill, M. N. & Tasker, J. G. Endocannabinoid Signaling, Glucocorticoid-Mediated Negative Feedback and Regulation of the HPA Axis. Neuroscience 204, 5–16 (2012). [CrossRef]
- Coiret, G. et al. Neuron to astrocyte communication via cannabinoid receptors is necessary for sustained epileptiform activity in rat hippocampus. PLoS One 7, e37320 (2012). [CrossRef]
- Eraso-Pichot, A. et al. Endocannabinoid signaling in astrocytes. Glia 71, 44–59 (2023). [CrossRef]
- Hebert-Chatelain, E. et al. A cannabinoid link between mitochondria and memory. Nature 539, 555–559 (2016). [CrossRef]
- Akdemir, E. S., Huang, A. Y.-S. & Deneen, B. Astrocytogenesis: where, when, and how. F1000Res 9, F1000 Faculty Rev-233 (2020). [CrossRef]
- Rothstein, J. D. et al. Localization of neuronal and glial glutamate transporters. Neuron 13, 713–725 (1994). [CrossRef]
- Jacque, C. M. et al. Determination of glial fibrillary acidic protein (GFAP) in human brain tumors. Journal of the Neurological Sciences 35, 147–155 (1978). [CrossRef]
- Cahoy, J. D. et al. A Transcriptome Database for Astrocytes, Neurons, and Oligodendrocytes: A New Resource for Understanding Brain Development and Function. J. Neurosci. 28, 264–278 (2008). [CrossRef]
- Bosier, B. et al. Astroglial CB1 cannabinoid receptors regulate leptin signaling in mouse brain astrocytes. Molecular Metabolism 2, 393–404 (2013). [CrossRef]
- Jimenez-Blasco, D. et al. Glucose metabolism links astroglial mitochondria to cannabinoid effects. Nature 583, 603–608 (2020). [CrossRef]
- Dudek, K. A. et al. Astrocytic cannabinoid receptor 1 promotes resilience by dampening stress-induced blood-brain barrier alterations. Nat Neurosci 28, 766–782 (2025). [CrossRef]
- Moro Chao, D. H. et al. Hypothalamic astrocytes control systemic glucose metabolism and energy balance. Cell Metab 34, 1532-1547.e6 (2022). [CrossRef]
- Begbie, J., Doherty, P. & Graham, A. Cannabinoid receptor, CB1, expression follows neuronal differentiation in the early chick embryo. J Anat 205, 213–218 (2004). [CrossRef]
- Gao, Y. et al. Loss of Retrograde Endocannabinoid Signaling and Reduced Adult Neurogenesis in Diacylglycerol Lipase Knock-out Mice. J. Neurosci. 30, 2017–2024 (2010). [CrossRef]
- Zaia, C. T. B. V. et al. Vasoactive intestinal peptide promotes hypophagia and metabolic changes: Role of paraventricular hypothalamic nucleus and nitric oxide. Brain Research Bulletin 189, 102–110 (2022). [CrossRef]
- Abtahi, S., Mirza, A., Howell, E. & Currie, P. J. Ghrelin enhances food intake and carbohydrate oxidation in a nitric oxide dependent manner. General and Comparative Endocrinology 250, 9–14 (2017). [CrossRef]
- Zhang, K., Mayhan, W. G. & Patel, K. P. Nitric oxide within the paraventricular nucleus mediates changes in renal sympathetic nerve activity. Am J Physiol 273, R864-872 (1997). [CrossRef]
- McBryde, F. D., Liu, B. H., Roloff, E. V., Kasparov, S. & Paton, J. F. R. Hypothalamic paraventricular nucleus neuronal nitric oxide synthase activity is a major determinant of renal sympathetic discharge in conscious Wistar rats. Experimental Physiology 103, 419–428 (2018). [CrossRef]
- Yamaguchi, N., Okada, S., Usui, D. & Yokotani, K. Nitric oxide synthase isozymes in spinally projecting PVN neurons are involved in CRF-induced sympathetic activation. Autonomic Neuroscience 148, 83–89 (2009). [CrossRef]
- Savinainen, J. R., Saario, S. M. & Laitinen, J. T. The serine hydrolases MAGL, ABHD6 and ABHD12 as guardians of 2-arachidonoylglycerol signalling through cannabinoid receptors. Acta Physiol (Oxf) 204, 267–276 (2012). [CrossRef]
- Marrs, W. R. et al. The serine hydrolase ABHD6 controls the accumulation and efficacy of 2-AG at cannabinoid receptors. Nat Neurosci 13, 951–957 (2010). [CrossRef]
- Blankman, J. L., Simon, G. M. & Cravatt, B. F. A Comprehensive Profile of Brain Enzymes that Hydrolyze the Endocannabinoid 2-Arachidonoylglycerol. Chemistry & Biology 14, 1347–1356 (2007). [CrossRef]
- Maccarrone, M. Metabolism of the Endocannabinoid Anandamide: Open Questions after 25 Years. Front. Mol. Neurosci. 10, (2017). [CrossRef]
- Simard, M. et al. Biosynthesis and metabolism of endocannabinoids and their congeners from the monoacylglycerol and N-acyl-ethanolamine families. Biochemical Pharmacology 205, 115261 (2022). [CrossRef]
- Simon, G. M. & Cravatt, B. F. Characterization of mice lacking candidate N-acyl ethanolamine biosynthetic enzymes provides evidence for multiple pathways that contribute to endocannabinoid production in vivo. Mol. BioSyst. 6, 1411–1418 (2010). [CrossRef]
- Buczynski, M. W. & Parsons, L. H. Quantification of brain endocannabinoid levels: methods, interpretations and pitfalls. Br J Pharmacol 160, 423–442 (2010). [CrossRef]
- Ohno-Shosaku, T. & Kano, M. Endocannabinoid-mediated retrograde modulation of synaptic transmission. Current Opinion in Neurobiology 29, 1–8 (2014). [CrossRef]
- Savinainen, J. R., Järvinen, T., Laine, K. & Laitinen, J. T. Despite substantial degradation, 2-arachidonoylglycerol is a potent full efficacy agonist mediating CB1 receptor-dependent G-protein activation in rat cerebellar membranes. British Journal of Pharmacology 134, 664–672 (2001). [CrossRef]
- Chapman, C. D. et al. Paraventricular nucleus anandamide signaling alters eating and substrate oxidation. Neuroreport 23, 425–429 (2012). [CrossRef]
- Abruzzese, F., Greco, M., Perlino, E., Doonan, S. & Marra, E. Lack of correlation between mRNA expression and enzymatic activity of the aspartate aminotransferase isoenzymes in various tissues of the rat. FEBS Lett 366, 170–172 (1995). [CrossRef]
- Walter, L., Dinh, T. & Stella, N. ATP induces a rapid and pronounced increase in 2-arachidonoylglycerol production by astrocytes, a response limited by monoacylglycerol lipase. J Neurosci 24, 8068–8074 (2004). [CrossRef]
- Virshup, I., Rybakov, S., Theis, F. J., Angerer, P. & Wolf, F. A. anndata: Access and store annotated datamatrices. JOSS 9, 4371 (2024). [CrossRef]
- Blischak, J., Carbonetto, P. & Stephens, M. Creating and Sharing Reproducible Research Code the Workflowr Way. F1000research (2019). [CrossRef]
- Hao, Y. et al. Integrated analysis of multimodal single-cell data. Cell (2021). [CrossRef]
- McInnes, L., Healy, J., Saul, N. & Großberger, L. UMAP: Uniform Manifold Approximation and Projection. JOSS 3, 861 (2018). [CrossRef]
- Kobak, D. & Linderman, G. C. Initialization is critical for preserving global data structure in both t-SNE and UMAP. Nat Biotechnol 39, 156–157 (2021). [CrossRef]
- Zupančič, M. et al. Concerted transcriptional regulation of the morphogenesis of hypothalamic neurons by ONECUT3. Nat Commun 15, 8631 (2024). [CrossRef]
- Simmons, D. M. & Swanson, L. W. Comparison of the spatial distribution of seven types of neuroendocrine neurons in the rat paraventricular nucleus: toward a global 3D model. J Comp Neurol 516, 423–441 (2009). [CrossRef]
- Romanov, R. A. & Harkany, T. Neuronal heterogeneity in the paraventricular nucleus of the hypothalamus as revealed by single-cell RNA-seq. Current Opinion in Endocrine and Metabolic Research 25, 100366 (2022). [CrossRef]
- Keimpema, E., Di Marzo, V. & Harkany, T. Biological basis of cannabinoid medicines. Science 374, 1449–1450 (2021). [CrossRef]
- Maccarrone, M., Guzmán, M., Mackie, K., Doherty, P. & Harkany, T. Programming of neural cells by (endo)cannabinoids: from physiological rules to emerging therapies. Nat Rev Neurosci 15, 786–801 (2014). [CrossRef]
- Conway, J. R., Lex, A. & Gehlenborg, N. UpSetR: an R package for the visualization of intersecting sets and their properties. Bioinformatics 33, 2938–2940 (2017). [CrossRef]
Figure 1.
Cnr1 mRNA expression in the adult mouse PVN. (a-a2) Open-source in situ hybridization data from the Allen Brain Atlas (https://portal.brain-map.org/) in the adult mouse PVN reveals glutamatergic (Slc17a6+), but not GABAergic (Slc32a1+) neurons, along with the accumulation of Cnr1 mRNA. (b-b2) Multiplexed in situ hybridization confirmed Cnr1 mRNA expression in the PVN, at levels more pronounced than in neighboring regions, and Trh+ neurons being particularly labelled (closed vs. open arrowheads). Abbreviations: 3V, third ventricle; AHN, anterior hypothalamic nucleus; PVN, paraventricular nucleus; SCN, suprachiasmatic nucleus. Scale bars = 350 µm (a-a3), 200 µm (b), 50 µm (b1), 20 µm (b2).
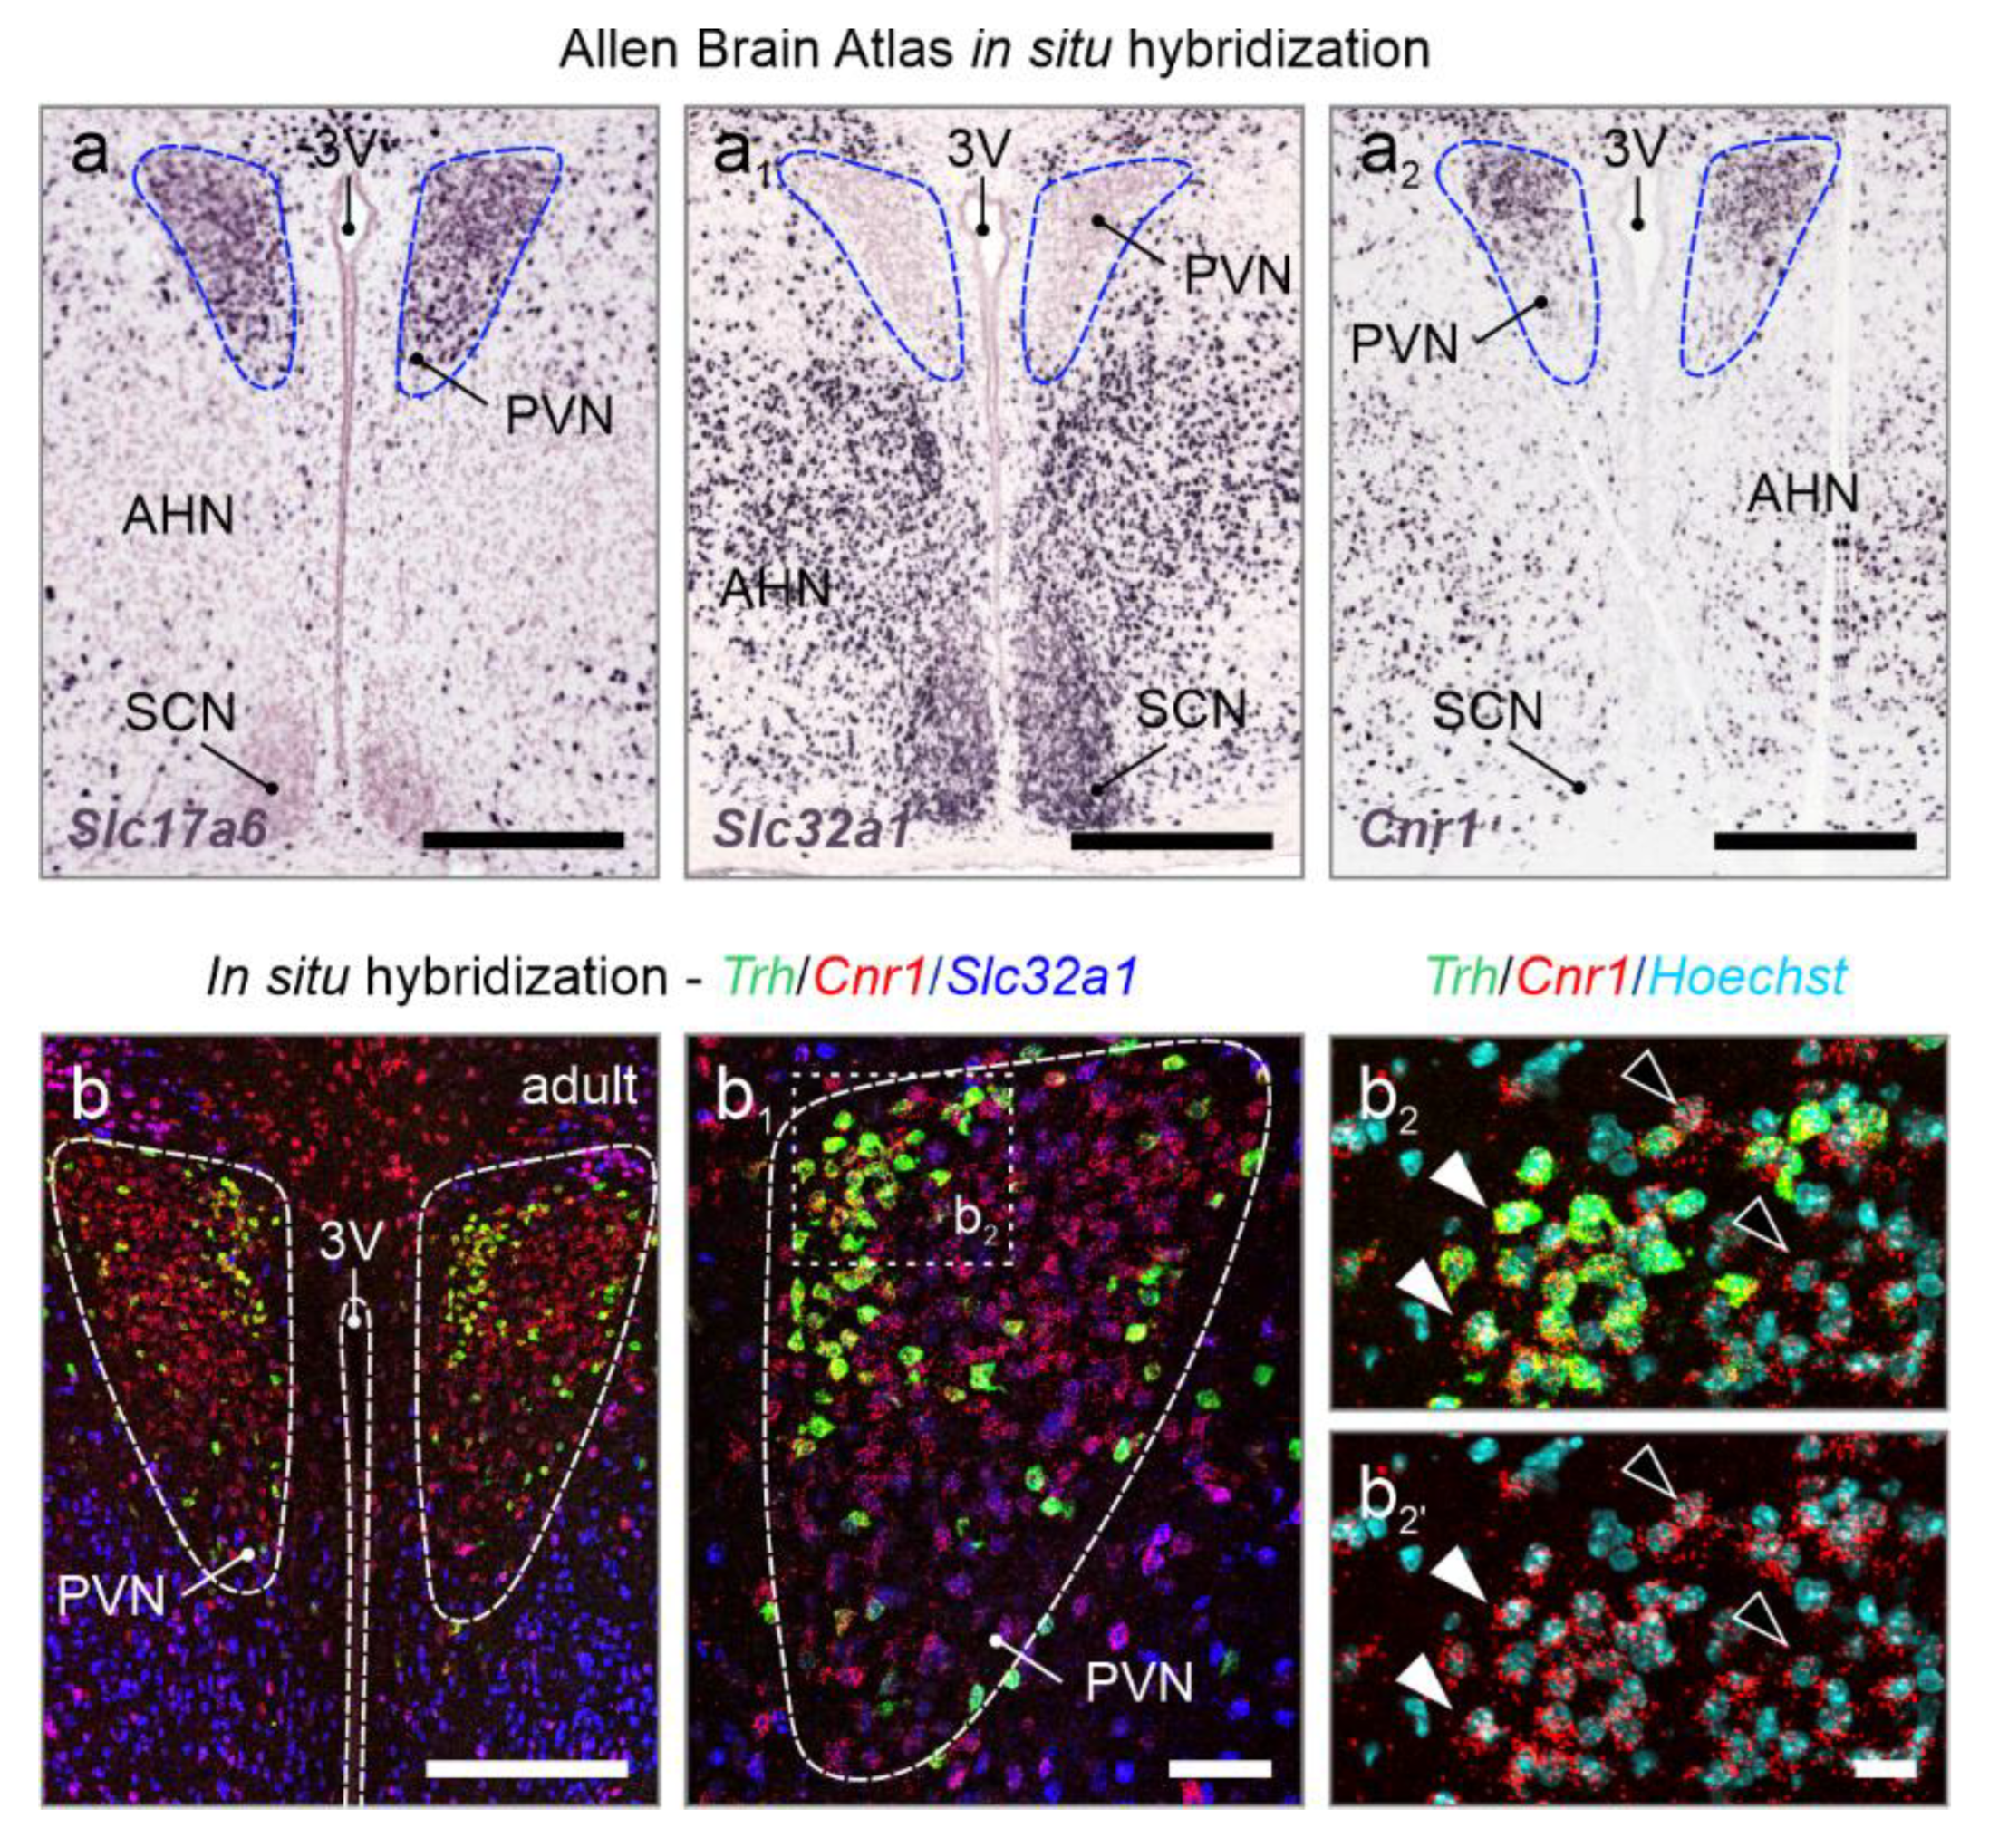
Figure 2.
Neuropeptide identifiers of the PVN. (a-a2) Multidimensional clustering based on neuropeptides revealed discrete magnocellular (mOXT, mAVP), and parvocellular cells, the latter containing Crh, Trh and Sst (pCRH, pTRH, pSST), across successive developmental stages in the PVN. Relative expression was color-coded for each gene analyzed (to the right).
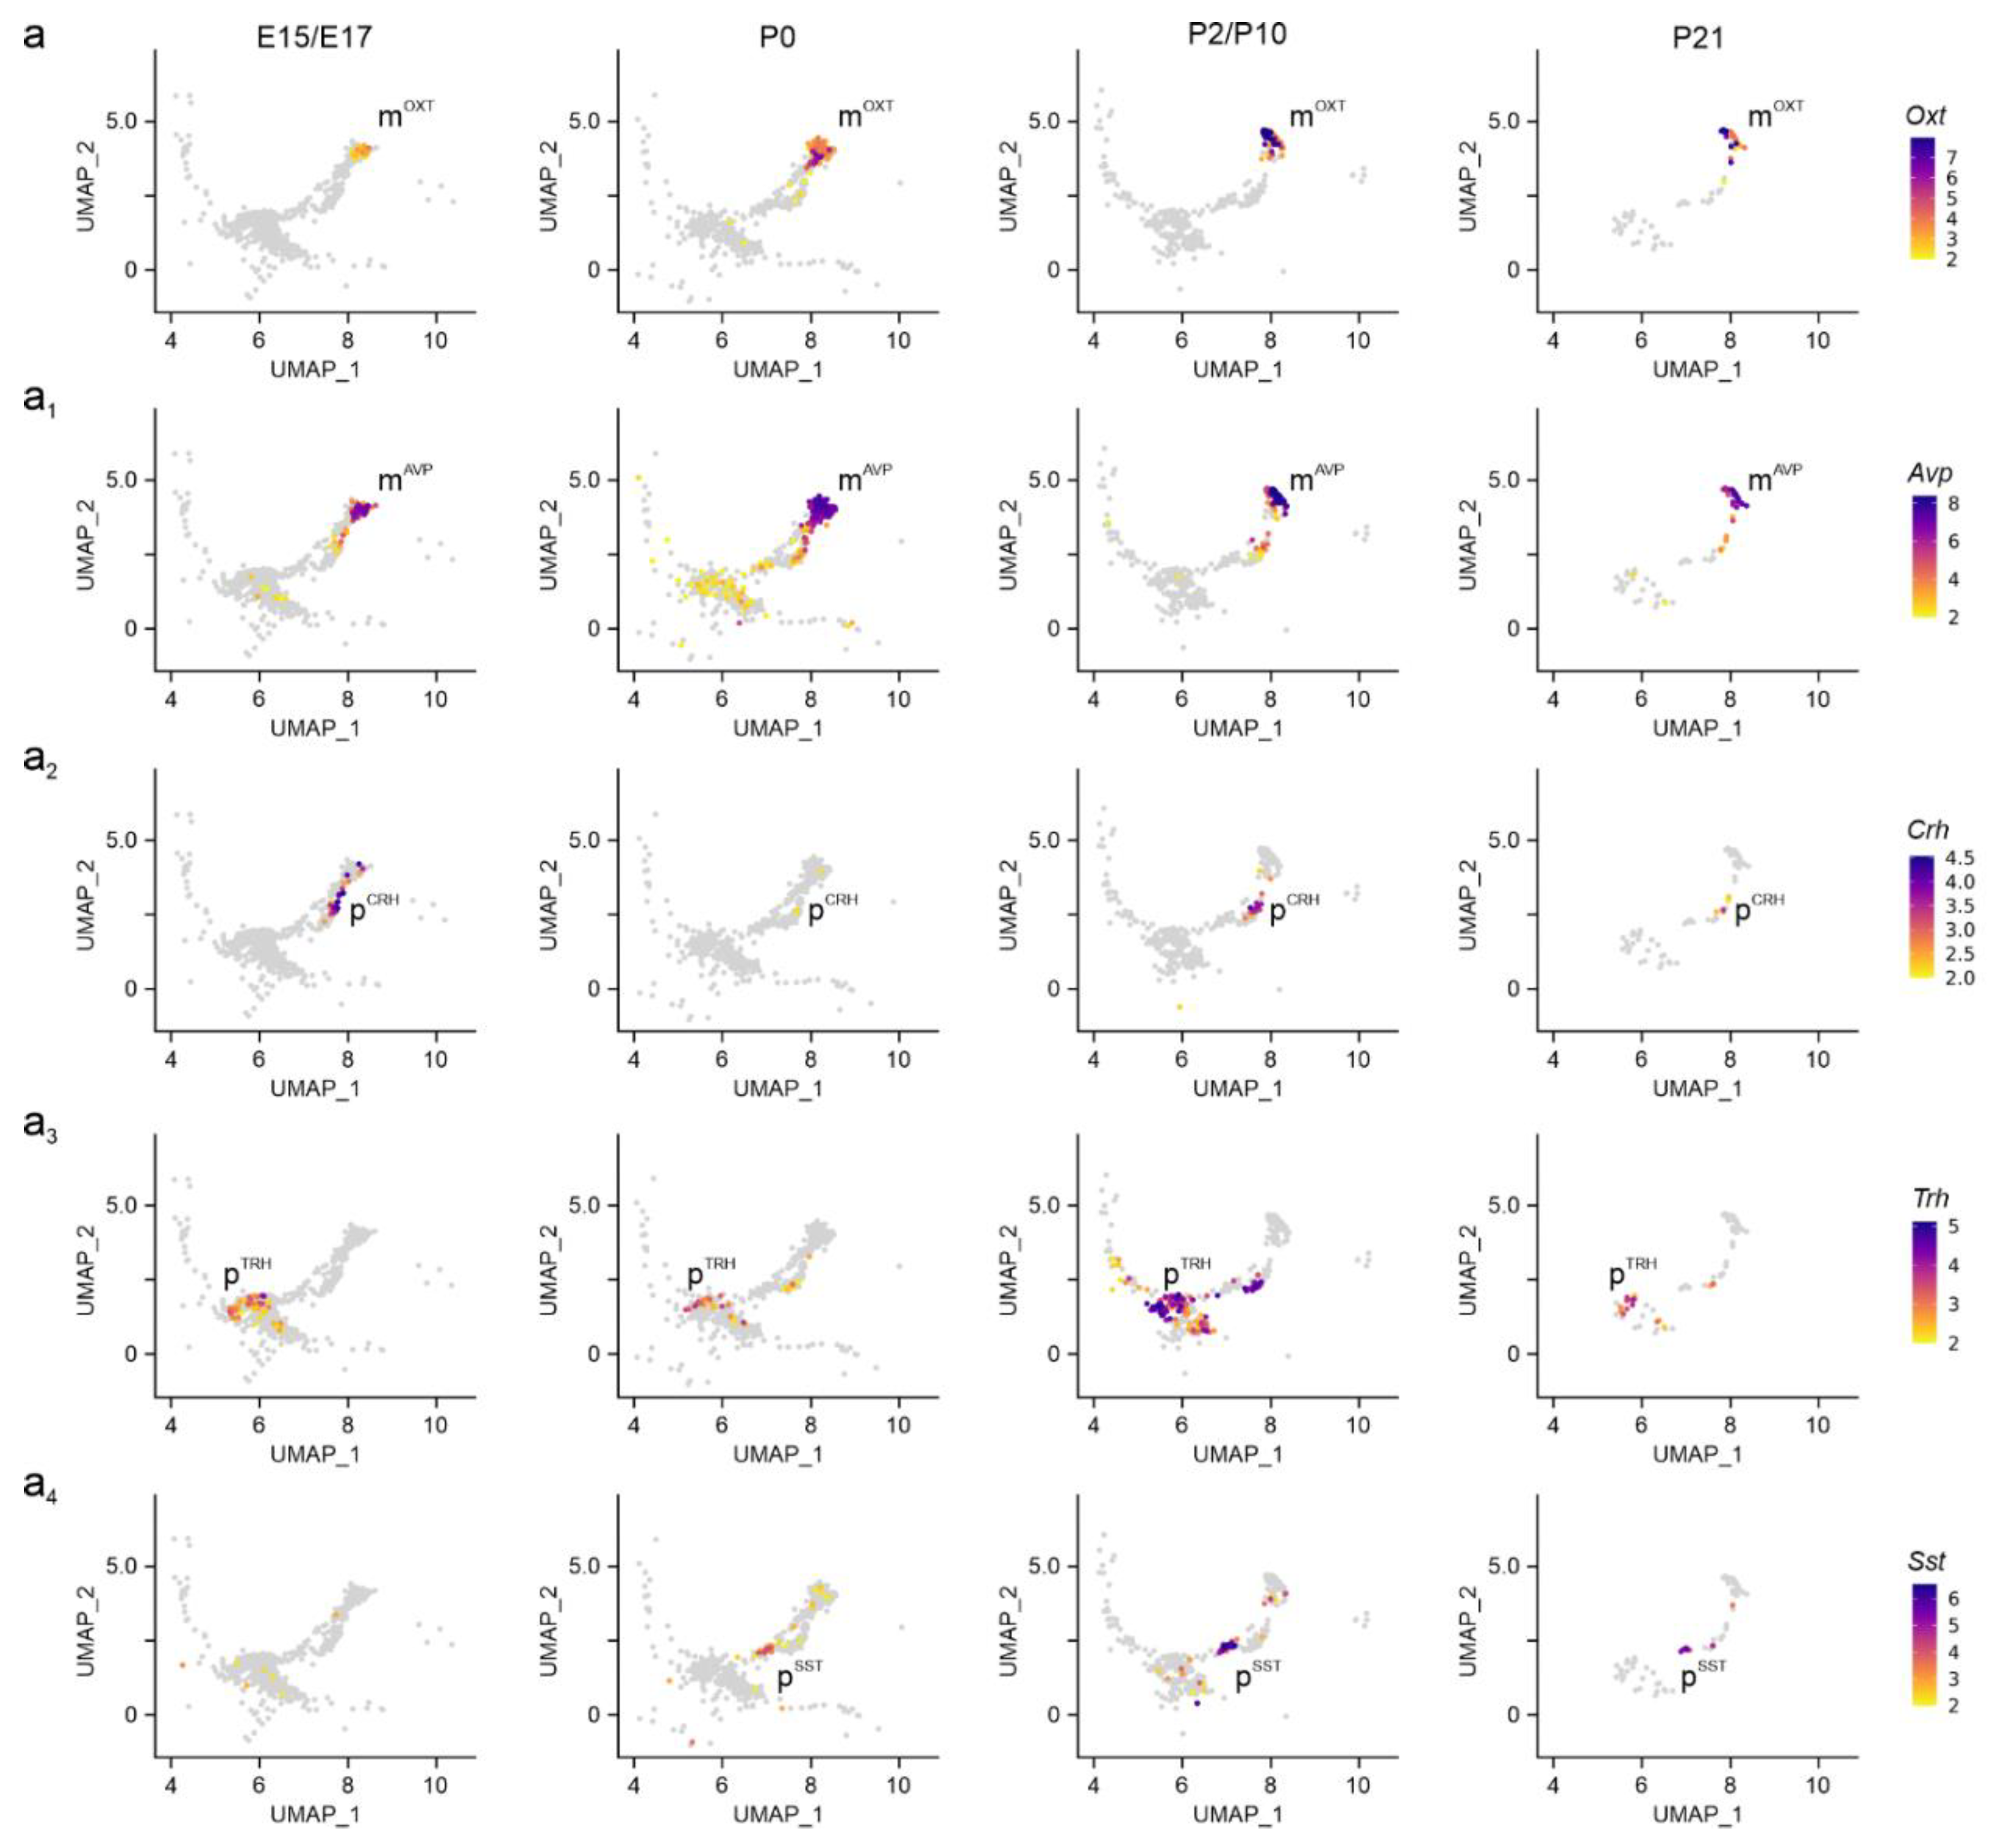
Figure 3.
Cannabinoid receptors in the PVN. (a-a2) UMAP representation of cannabinoid receptors identified Cnr1 as the dominant receptor in both magnocellular and parvocellular cells at all developmental stages analyzed, with minimal contributions from Cnr2 (a1) and Gpr55 (a2). Relative expression was color-coded for each gene analyzed (to the right). (b) UpSet plots showing gene enrichment and co-expression along brain development. Note the particular enrichment in mOXT and pTRH clusters (in blue), as compared to pCRH.
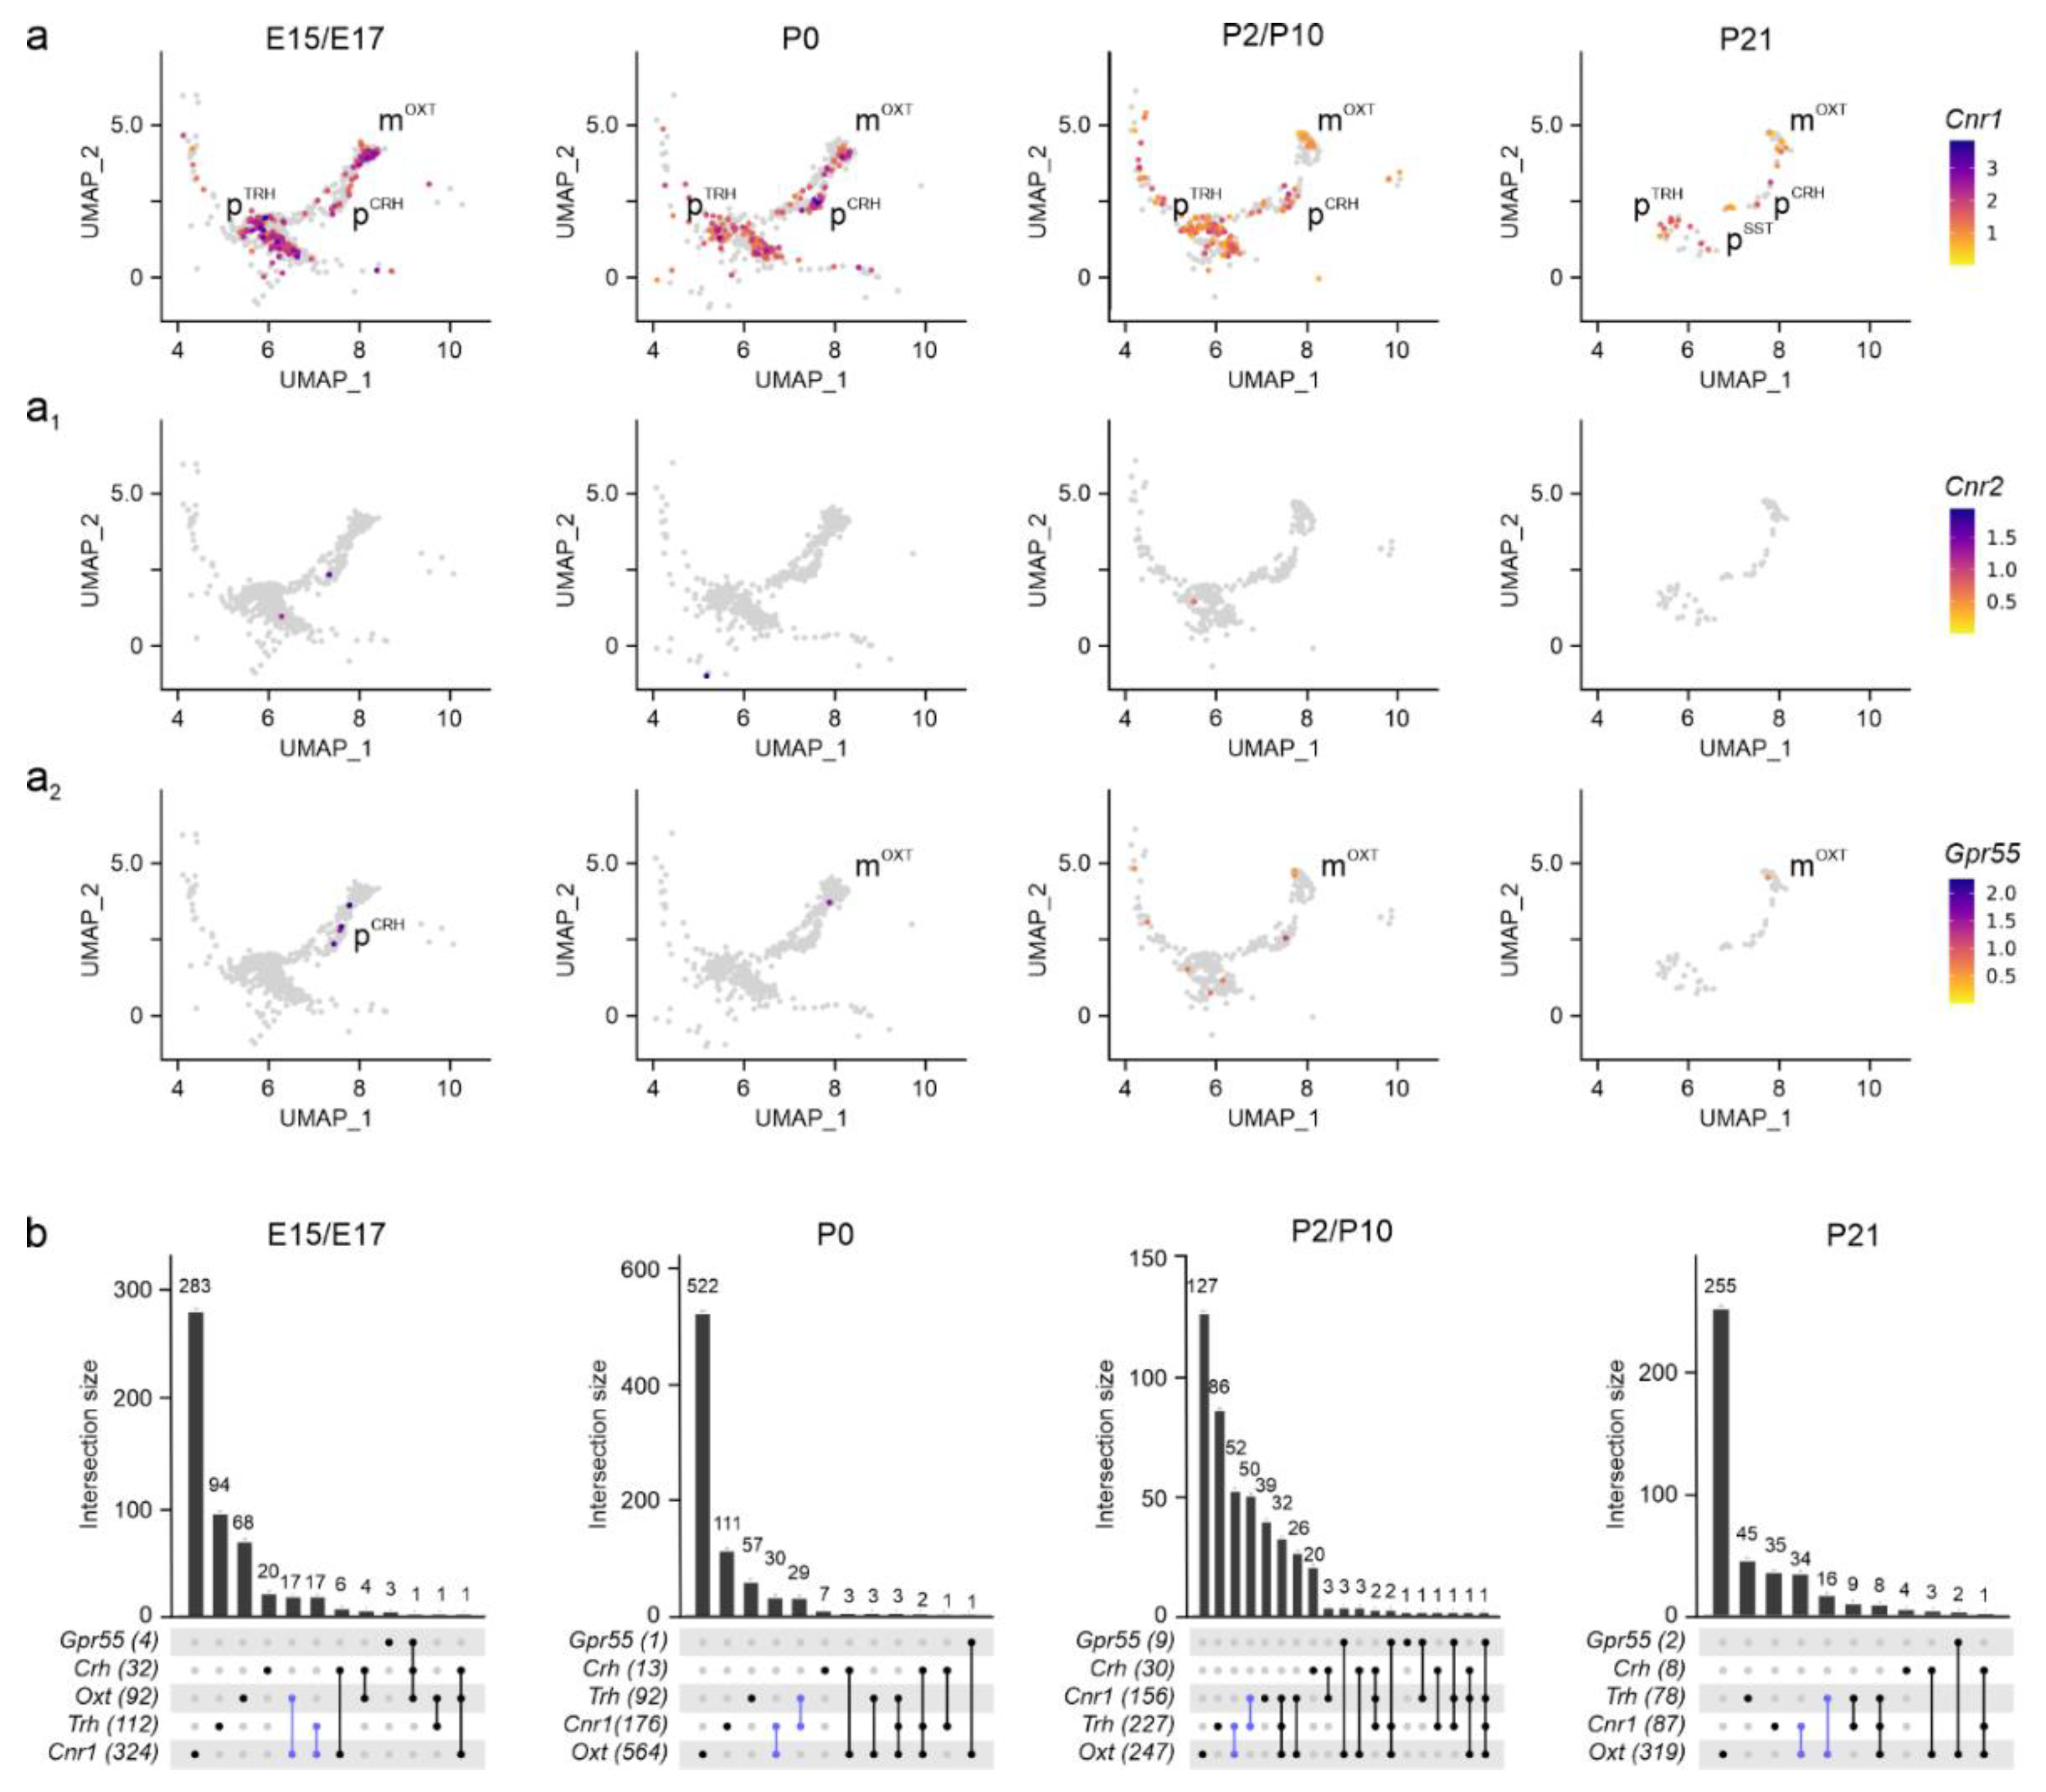
Figure 4.
Dagla/b and Mgll expression in the PVN. (a-a2) UMAP representation in developing neurons showed Dagla << Daglb until birth (b, in blue), and Mgll at all time points. Relative expression was color-coded (to the right) for each gene analyzed. (b) UpSet plots showing gene enrichment and co-expression along brain development for the genes analyzed.
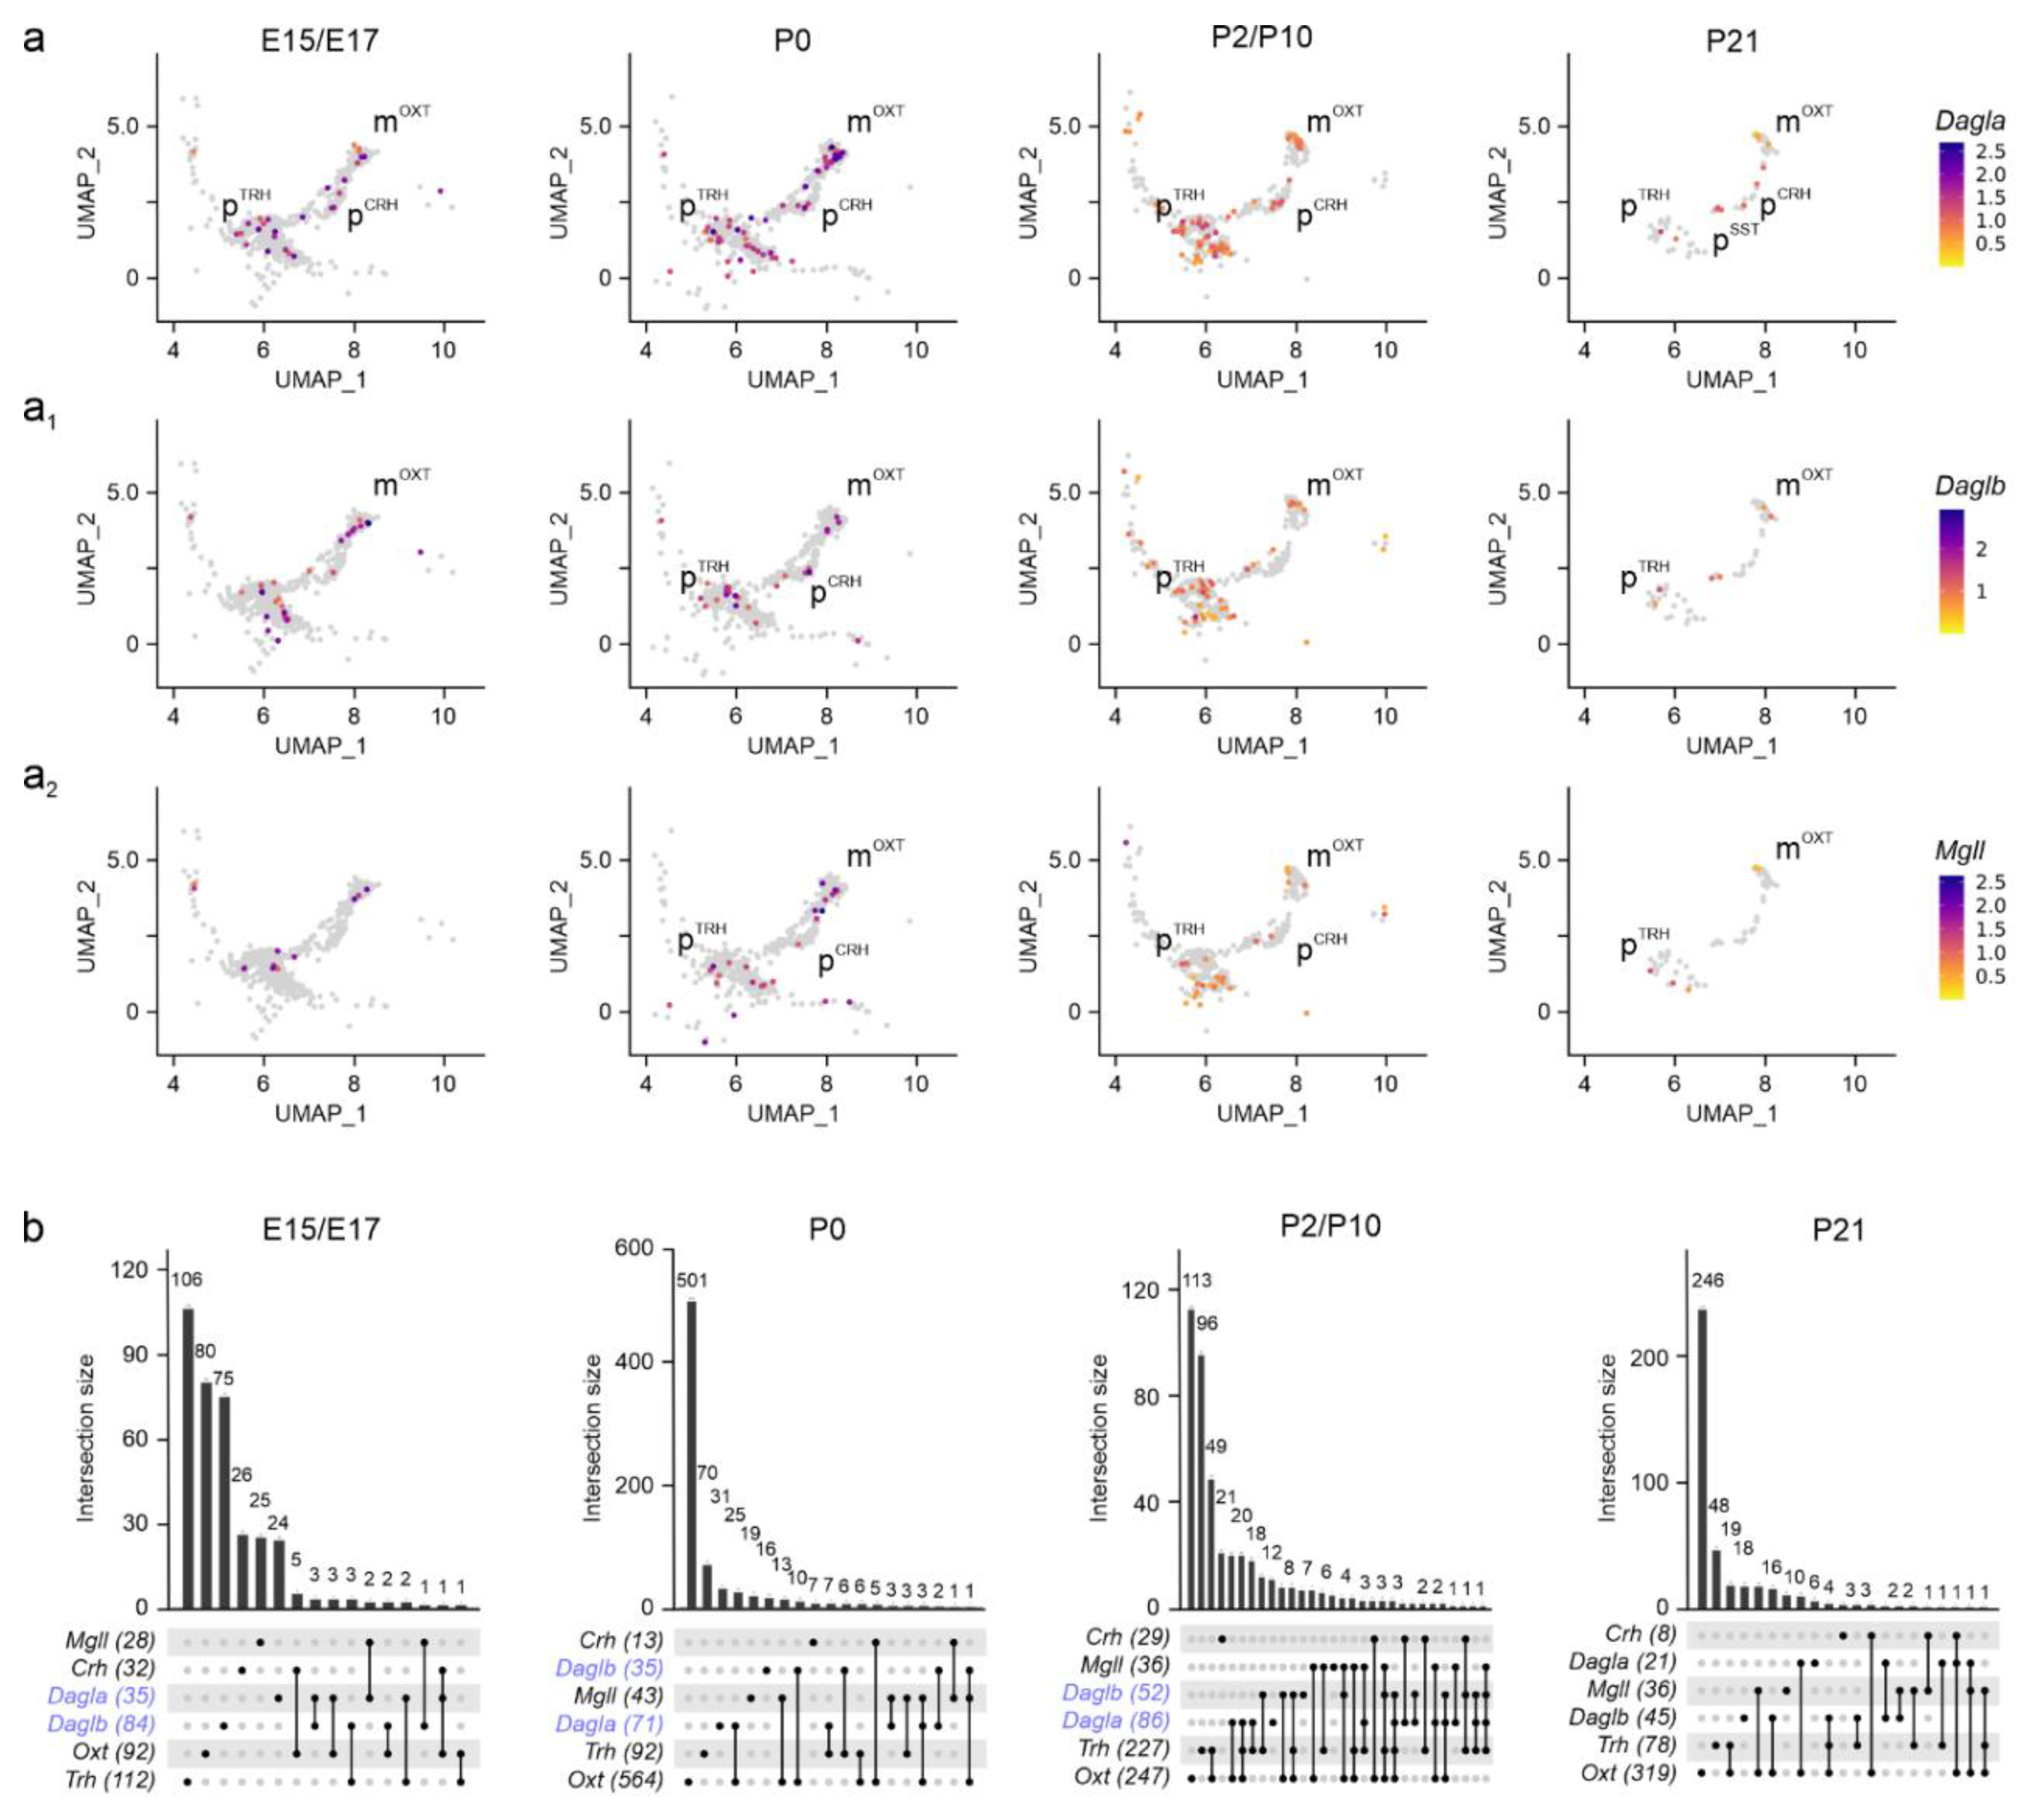
Figure 5.
Napepld, Gde1, and Faah expression in the PVN. (a-a2) UMAP representation of Napepld, Gde1, and Faah expression in neurons populating the PVN. Relative expression was color-coded (to the right) for each gene analyzed. (b) UpSet plots showing gene enrichment and co-expression along brain development for the genes analyzed.
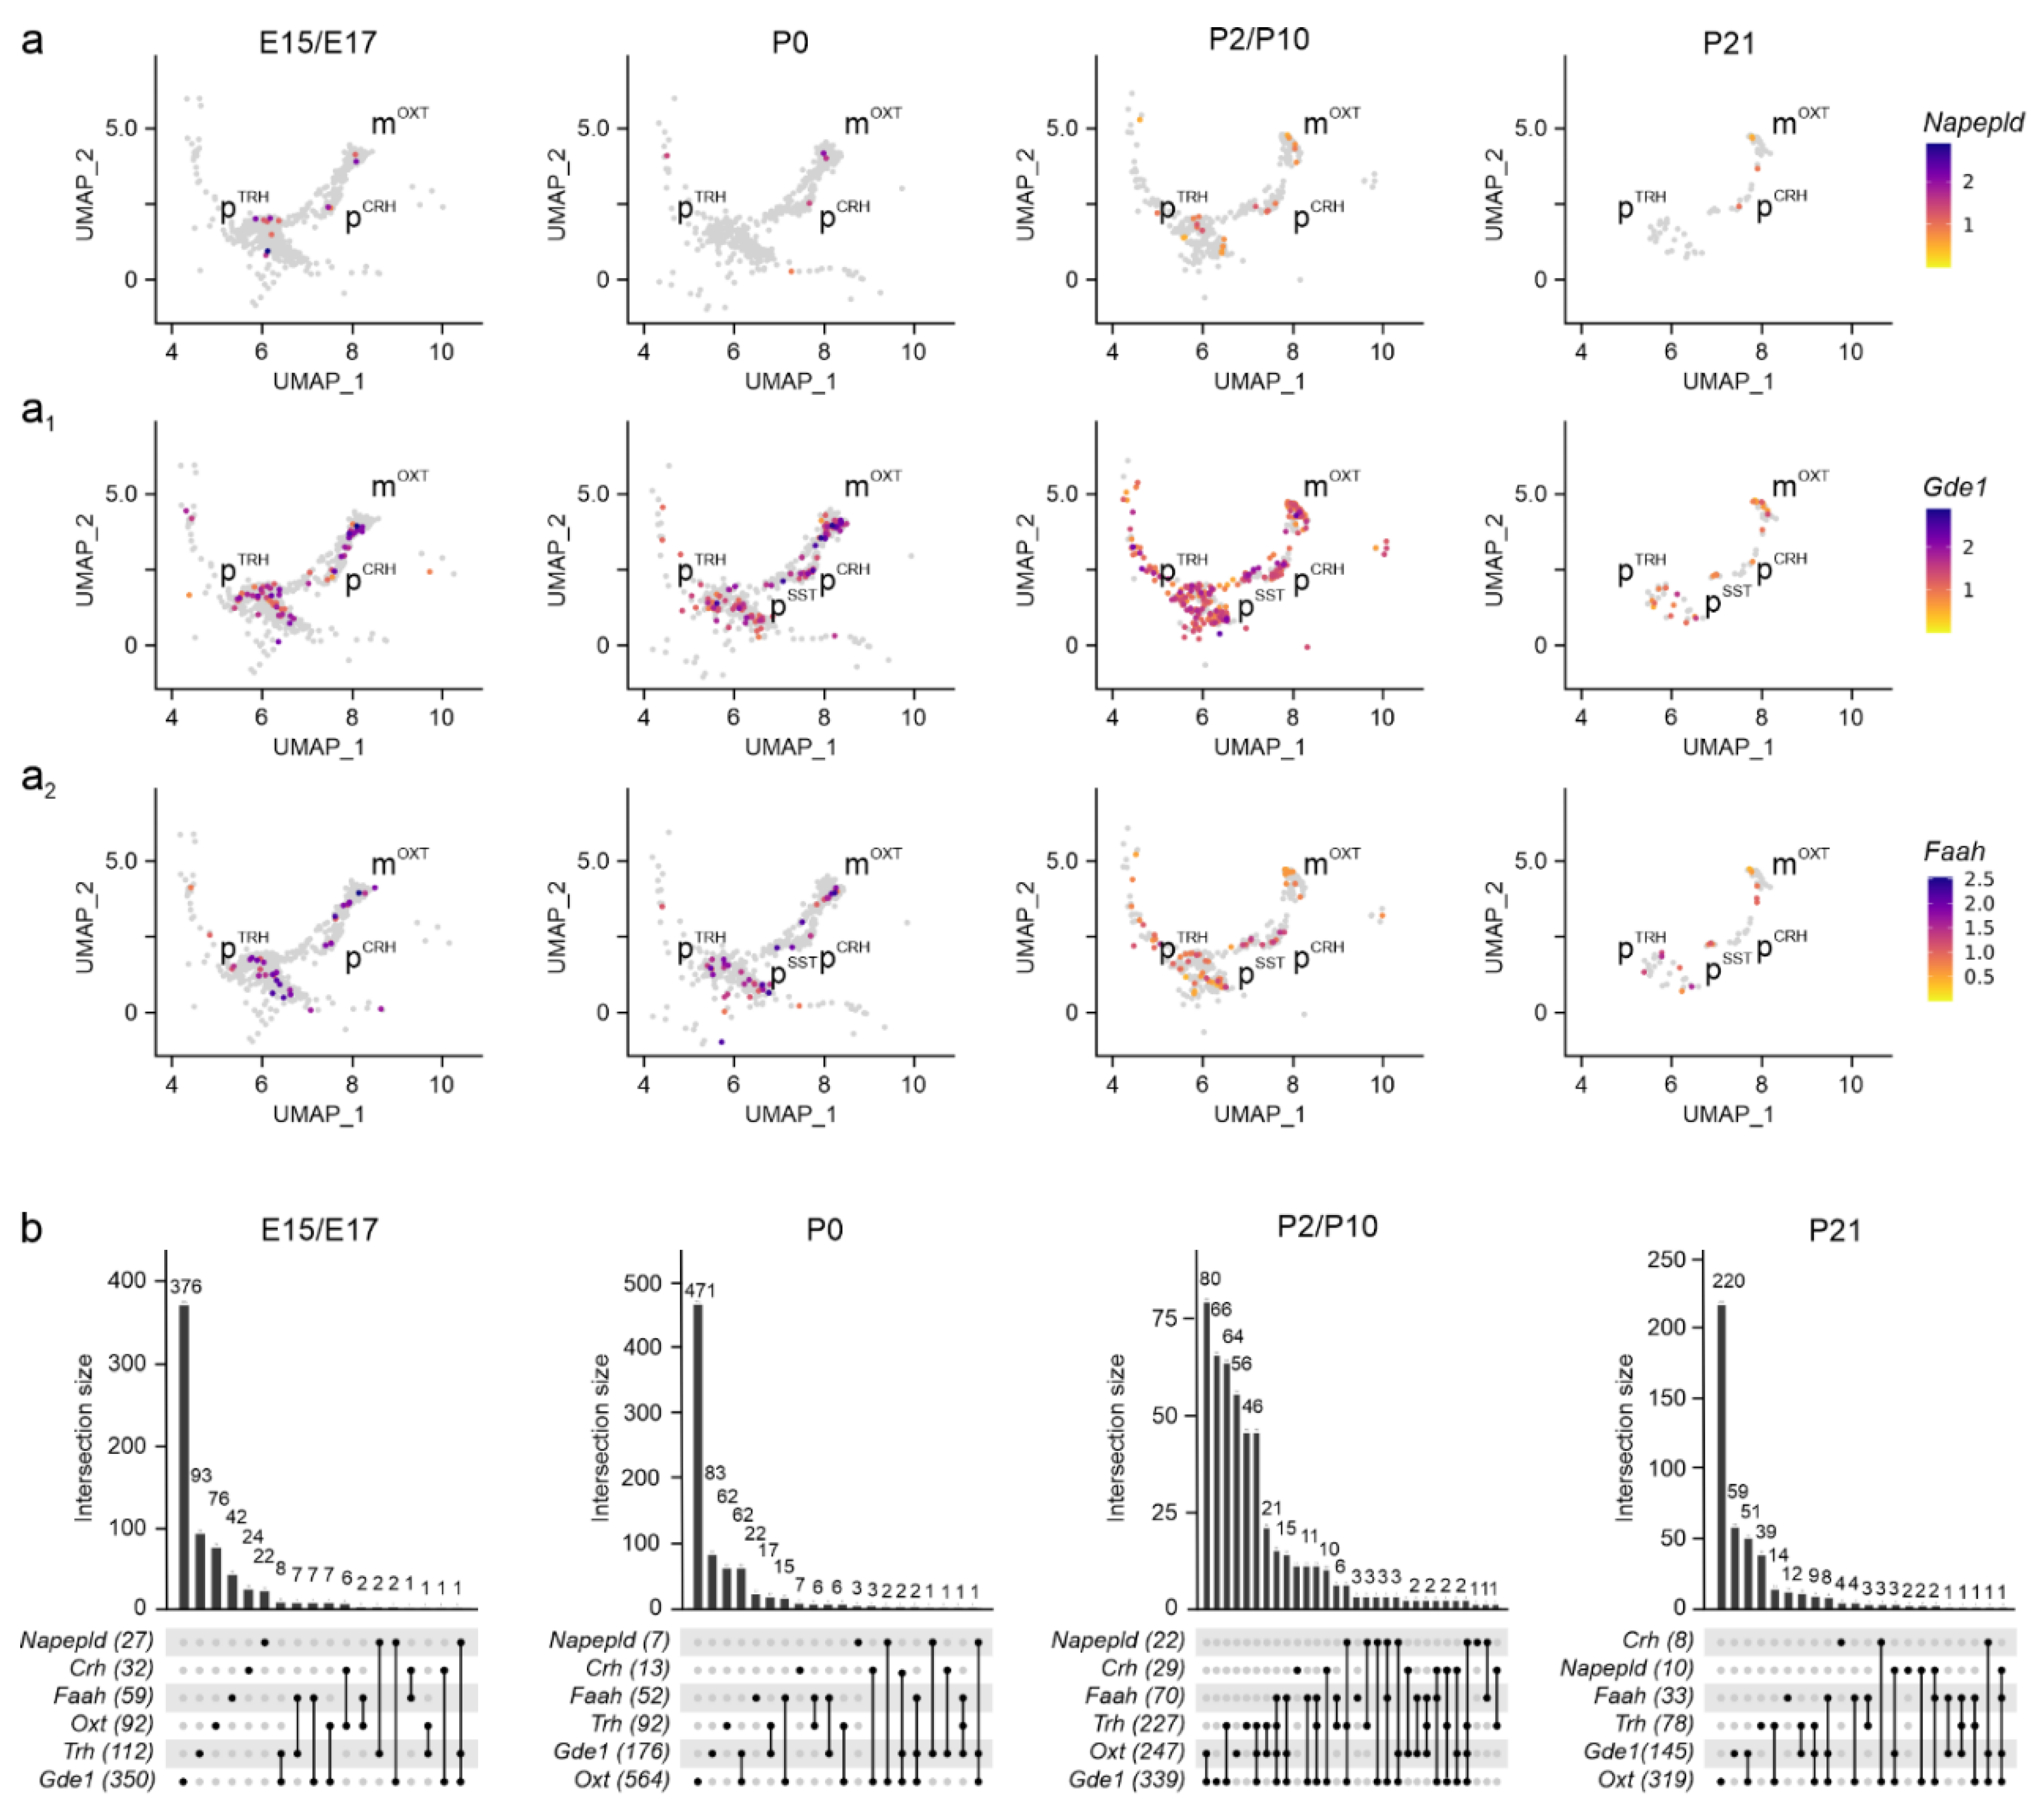
Figure 6.
Cell-type-specific localization of Dagla, Daglb, Magll, and Cnr1 by in situ hybrization. (a-a4) Already at E15.5, distinct neuronal populations expressed either Cnr1 or Daglb, or both. (b) At postnatal day 10 (P10), both Cnr1 and Daglb expression were maintained. (c-e1) At P21, PVN neurons continued to express Cnr1, Daglb, and Mgll, along with noticeable levels of Dagla (d2). (f-g2) Immunohistochemistry revealed the focal accumulation of CB1Rs in the PVN at E15.5, which remained unchanged until P21 (arrowheads, f1 vs. g1). DAGLα dominated at P21, when it frequently apposed CB1Rs in the somata and processes of, e.g., mOXT neurons (arrowheads, g2). Scale bars = 50 µm (a,a1,b,c,d,e,f,g), 20 µm (g1), 10 µm (a2,a3,a4,b1,b2,c1,d1,d2,e1), 5 µm (f1,g2).
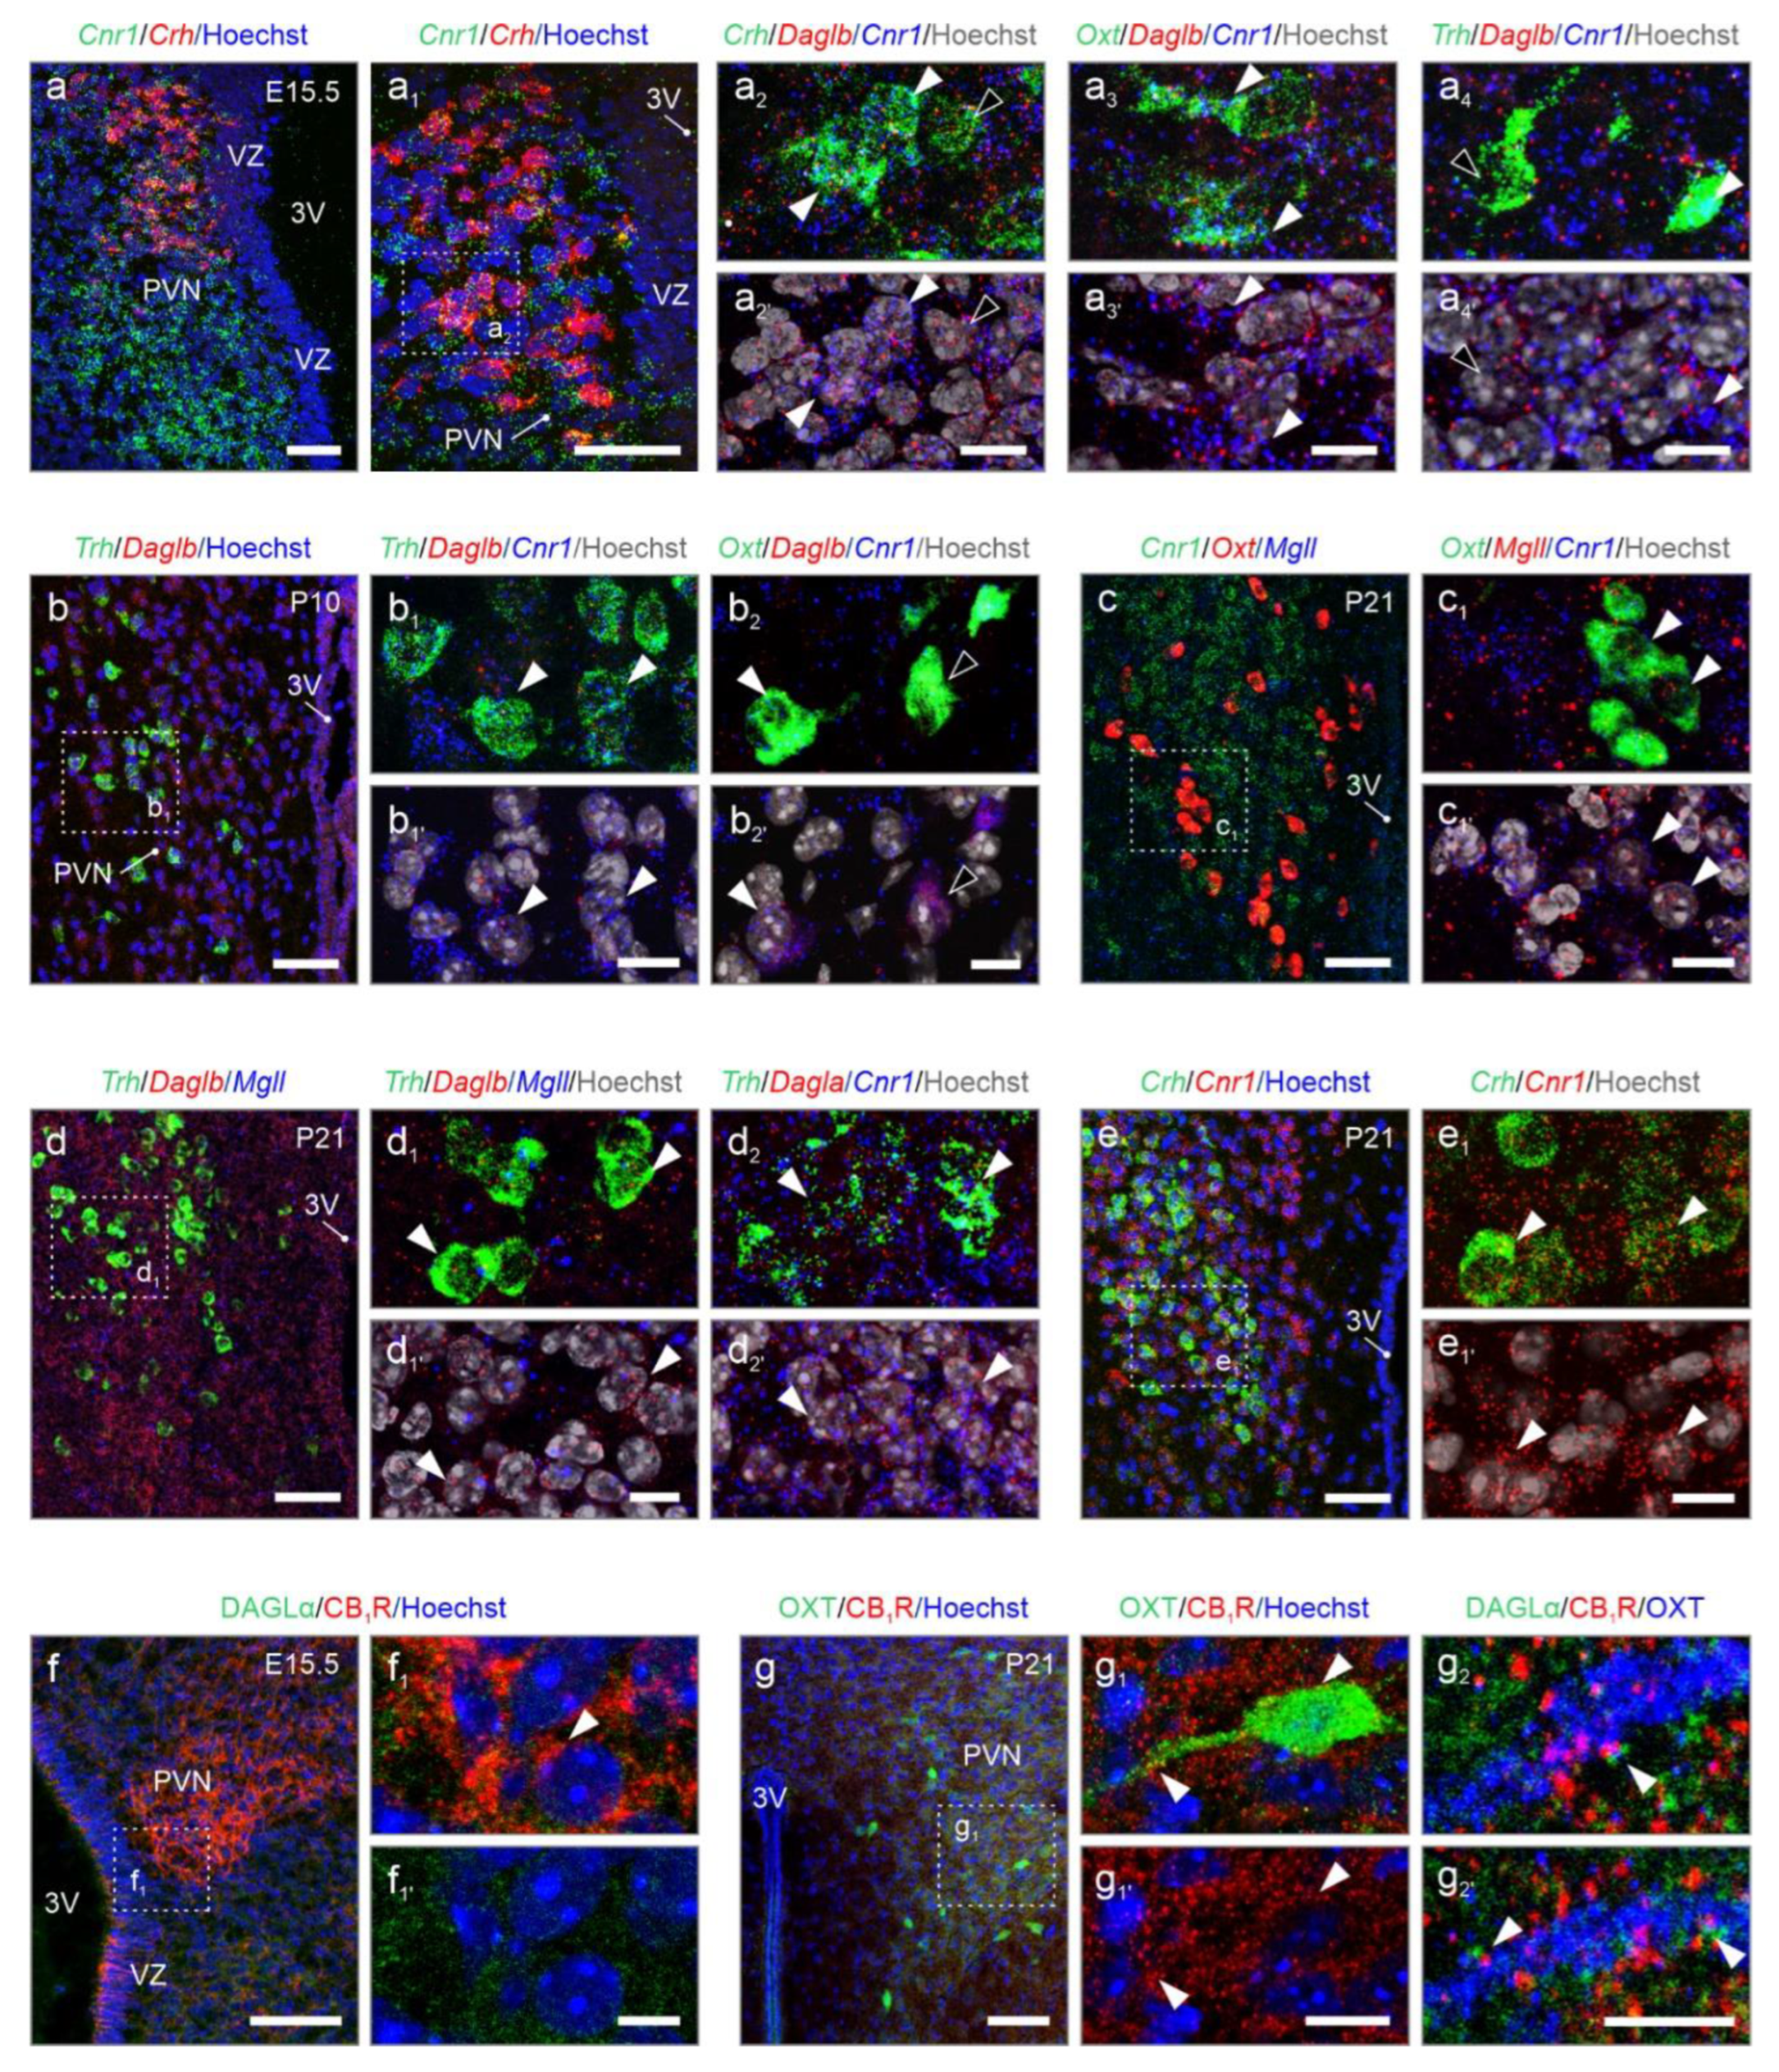
Figure 7.
Cannabinoid receptors and enzymes in astrocytes of the adult PVN. (a) Gene set used to identify astrocytes. (b-b2) Cannabinoid receptors (b), but not the machinery to control the bioavailability of 2-AG, were lacking in astrocytes. Relative expression was color-coded for each gene analyzed (to the right). (c) UpSet plots for gene enrichment in PVN astrocytes. Note the higher reliance on 2-AG signalling as compared to AEA (blue vs. green). (d) In situ hybridization confirmed the lack of Cnr1 in Gfap+ astrocytes (arrowheads indicate Gfap+/Cnr1- astrocytes vs. open arrowheads denoting Gfap-/Cnr1+ cells, presumed neurons). (d1) Gfap+ astrocytes contained Dagla mRNA, even if at low abundance (arrowheads). Scale bar = 5 µm (d1).
Disclaimer/Publisher’s Note: The statements, opinions and data contained in all publications are solely those of the individual author(s) and contributor(s) and not of MDPI and/or the editor(s). MDPI and/or the editor(s) disclaim responsibility for any injury to people or property resulting from any ideas, methods, instructions or products referred to in the content. |
© 2025 by the authors. Licensee MDPI, Basel, Switzerland. This article is an open access article distributed under the terms and conditions of the Creative Commons Attribution (CC BY) license (http://creativecommons.org/licenses/by/4.0/).
Copyright: This open access article is published under a Creative Commons CC BY 4.0 license, which permit the free download, distribution, and reuse, provided that the author and preprint are cited in any reuse.


