
Submitted:
01 May 2025
Posted:
02 May 2025
You are already at the latest version
Abstract
This study aimed to develop a “toxicity wind rose” for Riyadh City to investigate the di-rectional distribution of toxic PM₁₀ (particulate matter with aerodynamic diameter ≤ 10 µm) in the ambient atmosphere. The data collection approach combined an online moni-toring system with an offline sampling method. The monitoring instruments operated continuously, recording concentrations of key air pollutants including PM₁₀, PM₂.₅, NO₂, and SO₂, as well as meteorological parameters such as wind direction, temperature, and relative humidity. Concurrently, PM₁₀ samples were collected using Teflon and quartz fil-ters for subsequent chemical and toxicological analysis. The sampling campaign spanned from December 2019 to August 2020, covering both warm and cool seasons. The chemical and dithiothreitol (DTT) activity data were integrated with hourly wind direction meas-urements to construct pollutant and toxicity wind rose diagrams. During the warm sea-son, PM₁₀ concentrations exceeded 350 µg/m³ from the northwest and east, while the cool season showed elevated concentrations from the northeast. In contrast, the highest levels of oxidative potential (DTT activity) were associated with air masses originating from the north and west during the warm season and from the north during the cool season. These results demonstrate that high PM₁₀ mass concentrations do not necessarily coincide with high toxicity, highlighting the importance of considering both quantity and oxidative ca-pacity in air quality assessments.
Keywords:
Air Pollution
; Particulate Matter
; Toxicity
; DTT
; Wind Rose
; Riyadh
1. Introduction
Air is one of the most important elements of life, and its pollution harms humans, animals, and even buildings [1]. The impact of air pollution on humans begins before birth, as exposure to PM10 (particulate matter with an aerodynamic diameter of 10 micrometers (µm) or less) may lead to low birth weight, incomplete lung development, and premature birth [2]. After birth, the risks increase, as an increase in PM10 concentration by 10 µg/m3 has been linked to higher rates of cardiovascular and respiratory diseases such as bronchitis, asthma, and pneumonia, which may lead to death [3,4,5,6]. In addition, recent studies have shown that short-term exposure to elevated levels of NO₂, PM, and O₃ significantly increases the risk of respiratory illness, with effects lasting up to 100 days post-exposure and contributing to oxidative stress and inflammation even at low concentrations [7,8].
Many studies focus on particulate matter levels rather than their toxicity and what they carry, such as heavy metals, chemicals, and biological materials. Indeed, the danger of particulate matter lies in their toxicity, which is the main factor behind many acute, immediate, and long-term health effects. Ignoring this risk increases the likelihood of cancer and organ damage [9]. Acellular assay-based epidemiological studies have revealed that exposure to particulate matter (PM) with high oxidative potential (OP) can adversely affect cardiorespiratory health [10,11]. Notably, Bates (2019) [10] have found that OP is more strongly linked to acute cardiac and respiratory events than fine PM concentration, suggesting that OP could serve as a more significant health metric than PM mass for specific health outcomes.
Wind rose diagrams are traditionally constructed using wind speed, direction, and time data, enabling the visualization of prevailing wind patterns and their influence on pollutant dispersion [12]. By incorporating pollutant concentration data into these diagrams, it becomes possible to identify likely pollution sources based on directional trends, such as emissions from nearby factories, construction activities, or highways [13]. Recent studies across China, Europe, the Middle East, and Gulf countries have demonstrated the effectiveness of wind rose diagrams in analyzing air quality and informing pollution control strategies [14,15,16,17,18]. For example, Al–Dabbous (2025) [16]employed wind rose plots to identify the predominant wind directions contributing to elevated pollutant concentrations in Kuwait. Extending this application, the current study presents a novel approach by incorporating oxidative potential measurements, specifically from the dithiothreitol (DTT) assay, into the wind rose format. To the best of our knowledge, this is the first attempt to integrate DTT-based toxicity data with wind direction analysis. This method allows for the differentiation between pollutant mass and its associated oxidative capacity, providing a more comprehensive understanding of health-relevant exposure.
Riyadh, the capital of Saudi Arabia, is one of the fastest-growing cities, hosting more than 7 million people and preparing to increase the number to 10 million [19]. Riyadh’s air quality has been classified as “moderate” according to the global air quality index (AQI) in 2024 [20]. According to 11 monitoring stations distributed across the city, the average PM10 concentration increased by 126% between April 2020 and April 2021. The sources of pollution in Riyadh are multiple and widespread, including dust storms, environmental erosion, and construction [21]. The pollutants are particularly concentrated in the north and south of the city, where the north contains construction pollutants, vehicle emissions, and agricultural sources [22]. The south, on the other hand, includes cement factories, power generation stations, and waste landfills [23]. Additionally, the weather in Riyadh, which is warm most of the time, contributes to the increase and easy dispersion of pollutants and dust, with PM10 being one of the most prevalent pollutants [5,24]. Notably, there has been a lack of comprehensive studies examining pollutant and toxicity wind roses in the area, thereby underscoring the significance of this work.
In this study, we will develop a specialized “Toxicity Wind Rose” for Riyadh, specifically for Al-Malaz district, which is located in the heart of the city and witnesses high population density along with various sources of pollution (e.g., factories, roads and construction activities). The study also examines the rose diagrams for multiple pollutants, such as PM10, PM2.5, NO2, O3, and different metal PM species. Two time periods are investigated: the cool period and the warm period. The aim of this work is to to support decision-makers in designing more effective air quality management strategies, prioritizing interventions based on toxicity rather than concentration alone. This approach aligns with the objectives of the United Nations Sustainable Development Goals 3 and 11, which aim to enhance public health and promote sustainable urban environments.
2. Materials and Methods
2.1. Sampling Location and Period
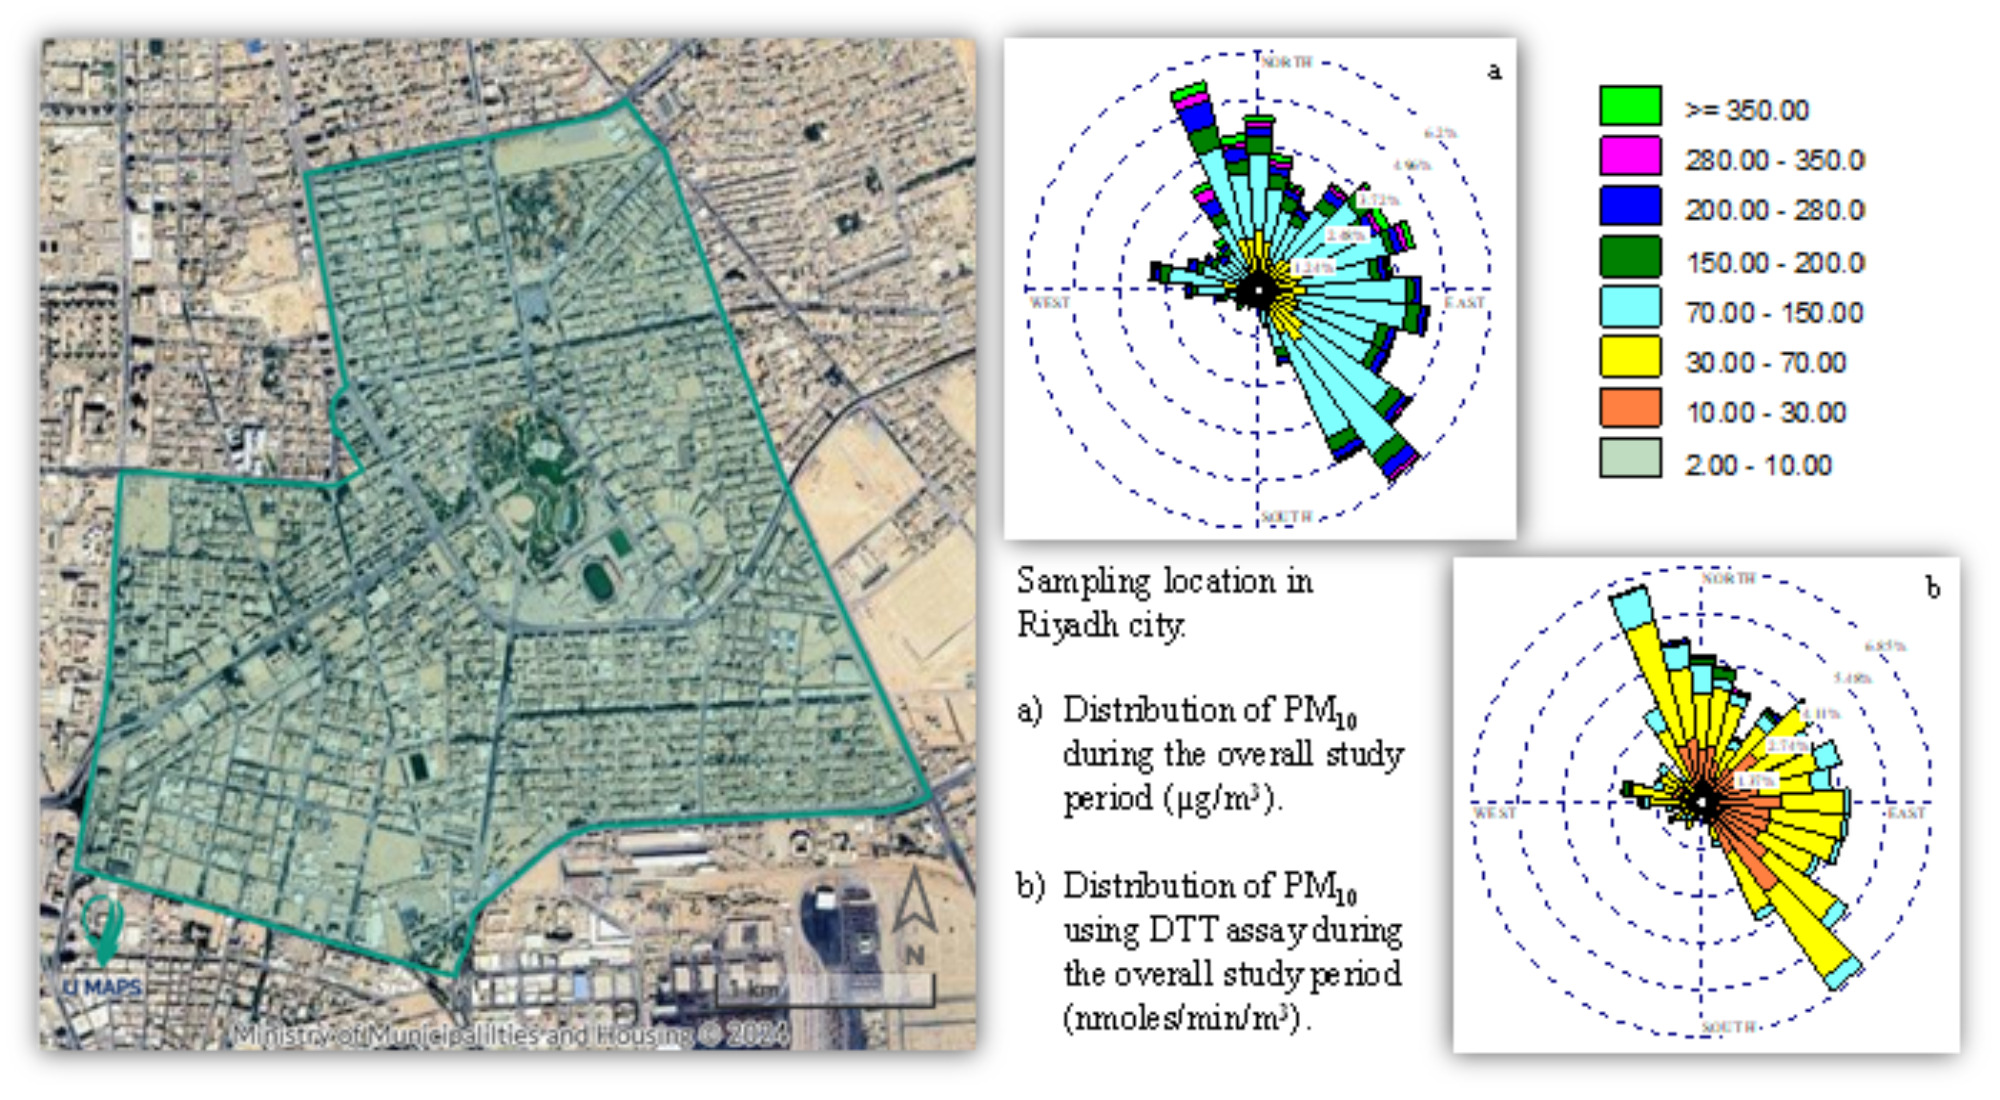
Figure 1 shows the location of the sampling site in the Al-Malaz district, located in the center of Riyadh, the capital of the Kingdom of Saudi Arabia. The sampling site was precisely located in a park in the middle of the Al-Malaz district at coordinates (24°38′55″N, 46°43′16″E). This area was selected based on several factors that make it an ideal location for collecting data on air pollution. The neighborhood is considered to have a high population density, which increases fuel consumption and transportation rates, causing air pollution. Furthermore, the area hosts numerous industrial activities that contribute to higher emissions, such as a large industrial complex spanning more than 4 million square meters, along with diesel-powered engines that contribute to elevated pollution levels and ongoing construction activities in the region. These activities may lead to higher concentrations of fine particles in the air (e.g., PM10 and PM2.5), which are considered major pollutants in urban environments. Previous studies, such as those conducted by Alharbi (2014) [25] and Bian (2016) [26], have shown that such activities significantly contribute to the degradation of Riyadh’s local air quality. In addition, the site’s proximity (approximately 2 km) to King Fahad Highway, one of the city’s main congested roads, further makes it an ideal location for our study. Given that], it can be reasonably argued that this site is representative of population exposure to key sources of air pollution in the Riyadh metropolitan area. Therefore, it can be reasonably argued that this site is representative of typical population exposure to key sources of air pollution in the Riyadh metropolitan area.
Data collection was conducted during two distinct periods: the cool period (December 2019 to March 2020) and the warm period (May to August 2020). Meteorological data (e.g., wind directions, and relative humidity) were obtained from the local air quality station of the Royal Commission for Riyadh City (RCRC), which is located in the same location as our sampling site. The average relative humidity during the entire period was 21.00 ± 16.83%, while the average temperature was 27.88 ± 9.85°C (Table S1). Further details can be found at Altuwayjiri (2022) [27]. While the data collection period, which extended from December 2019 to August 2020, partially coincided with the COVID-19 pandemic, the influence of pandemic-related restrictions on the sampling process was limited. These restrictions were not applied uniformly throughout the period, and essential activities such as industrial transportation, freight movement, and manufacturing operations largely continued.
2.2. Instrumentation
In this study, continuous monitoring equipment was employed to measure pollutant concentrations such as PM₁₀, PM₂.₅, NO₂, and SO₂, along with meteorological parameters including relative humidity, temperature, and wind direction. This system operated in conjunction with an offline medium-sized sampler (model URG3000ABC, URG Corp, Chapel Hill, North Carolina, USA), which was equipped with quartz (47 mm diameter, Whatman) and Teflon filters (47 mm diameter, Tisch Scientific). The pore size of the quartz filters was 2.5 micrometers, while the Teflon filters had pores of 1 micrometer. The mass of PM10 was measured using an analytical balance (MT5, Mettler Toledo Inc., Columbus, Ohio) by weighing the filters before and after sample collection. The PM10 concentration was then calculated by dividing the filter mass difference by the volume of air that passed through the filter during the sampling period. This process was carried out in a controlled environment, with a temperature range of 22 to 24°C and relative humidity between 40-50% to ensure accurate measurements. All procedures were performed carefully to ensure reliable results.
2.3. Chemical and Toxicological Analysis
The DTT (Dithiothreitol) assay was used to assess the oxidative capacity of the collected PM10 samples. The DTT test is a widely recognized and proven technique for measuring oxidative stress caused by reactive radical species produced by particles suspended in the air [28,29]. The test principle is based on measuring the consumption of DTT as an indicator of the oxidative potential of the sampled particles. The samples were stored at -20°C to preserve their chemical composition before analysis. The particles were extracted using distilled water with continuous shaking in the dark. The extracts were then mixed with a potassium phosphate solution and DTT to initiate the oxidative reaction. The reaction was gradually stopped by adding trichloroacetic acid, and absorbance was measured at wavelengths of 412 nm and 650 nm to determine the amount of remaining DTT [30]. This allows for the calculation of the DTT consumption rate, which serves as an indicator of the oxidative capacity of particles, helping to understand their health and environmental impacts [31,32].
Additionally, Inductively Coupled Plasma Mass Spectrometry (ICP-MS) was used to measure the concentration of metals and trace elements in the PM10 samples, following the Methodologies described by Aldekheel (2024) [33], Herner (2006) [34] and Karthikeyan (2006) [35] . These measurements offer valuable insights into the chemical composition of the pollutants, enhancing our understanding of their sources and characteristics.
2.4. Wind and Pollutant Rose Techniques
The “Wind Rose” technique was employed to visualize wind direction and speed in conjunction with air pollution data, enabling the analysis of distribution patterns for both gaseous and particulate pollutants in urban areas. To ensure accurate analysis, the interquartile range (IQR) method was applied to remove outliers from the data. This method involves identifying outliers using the first quartile (Q1) and third quartile (Q3) of the data, then calculating the interquartile range (IQR), which represents the difference between Q3 and Q1. Data points falling outside the range (Q1 − 1.5 × IQR, Q3 + 1.5 × IQR) are considered outliers and excluded from the analysis [36,37]. After filtering the data, the refined dataset was analyzed using WRPlot View software (Version 8.0.2). The software requires input parameters such as wind direction, wind speed, pollutant concentrations (e.g., PM10), and time-related information, including year, month, day, and hour. The data was adjusted to define the specific time periods for analysis, such as specific intervals or diurnal patterns, to examine temporal variations in pollutant concentrations and their correlation with wind behavior [13,38].
3. Results and Discussion
3.1. Wind and Gaseous Pollutant Rose Diagrams
Figure 2 represents the wind speed and direction in Riyadh during the overall, cool and warm periods (i.e., from December 2019 to August 2020). Figure 2 (a) indicates that the predominant wind directions are northwest and southeast, each with a frequency of approximately 8.75%; wind speeds from the northwest ranged between 1–5 m/s, while those from the southeast were slightly higher, ranging between 1–6 m/s. Regarding the east direction, the wind speed ranged between 1–4 m/s with a frequency of less than 1.75%, and winds from the west were negligible, indicating minimal to no wind activity from that direction during the investigated period. This seasonal pattern is further illustrated in Figure 2 (b) and (c), and supported by the data in Table S4, which show that during the cool period (Figure b), winds were moderate and predominantly from the northwest and southeast, reflecting stable atmospheric conditions with a bimodal distribution. In contrast, during the warm period (Figure c), stronger and more persistent winds were observed from the north-northwest and south-southeast, indicating increased thermal activity and stronger pressure gradients typical of warmer seasons. According to Alharbi (2017) [39] andMeteostat (2020) [40] , our findings align with their data, confirming that the northwest and southeast directions are the predominant wind patterns in Riyadh.
The ozone (O3) rose diagram during the warm period is demonstrated in Figure 3(c), which illustrates a significant increase in the O3 concentration, reaching 150 parts per billion (ppb) with a frequency exceeding 4.86% in the eastern direction. However, the ozone concentrations during the cool period, as shown in Figure 3(b), were moderate and did not exceed 70 ppb, with the southeastern direction being the most frequent. Lower ozone concentrations during the colder season were likely due to reduced photochemical reactions [41], while higher contributions were observed in the warmer season. Regarding nitrogen dioxide (NO2), the concentrations were elevated throughout the entire study period, particularly in the eastern direction, as shown in Figure 4(a), with values ranging between 10–150 parts per billion (ppb). Given the substantial contribution of traffic combustion sources in urban environments, local NO2 is frequently utilized as a marker for road traffic emissions [42], which are notably distributed throughout Riyadh city [25,43]. In the cool period (Figure 4(b)), the most frequent direction of NO2 was southeast, while in the warm period (Figure 4(c)), the northwest direction was the most frequent.
The wind roses indicate that ozone (O3) and nitrogen dioxide (NO2) exhibit similar directional patterns (Figure 3 and Figure 4), although they show opposite concentration levels during the two distinct periods.In particular , ozone levels are higher in the warmer months, while nitrogen dioxide levels peak in the colder months.Both pollutants exhibit increased concentrations in the eastern direction, attributed to the presence of pollution sources such as industrial facilities and a train station [44]. The overlap in the directions of ozone and nitrogen dioxide is due to the fact that ozone is a secondary pollutant formed through chemical reactions involving nitrogen oxides, which are primarily emitted from industrial activities. Additionally, the wind roses show that nitrogen dioxide concentrations are typically higher than ozone concentrations, which aligns with the chemical reaction that leads to the destruction of ozone [45,46]. However, during the warm periods (Figure 3(c)) and (Figure 4(c)), where sunlight increases, the photochemical reaction that promotes ozone formation is triggered, resulting in higher ozone concentrations compared to the cool periods [47,48]. In line with our findings, a previous study by Alharbi (2017) [39] showed that ozone (O₃) concentrations decrease with increasing NOₓ levels and increase with rising VOC levels.
The distribution of pollutants, including toluene (TULO), sulfur dioxide (SO2), and carbon monoxide (CO), is illustrated in Figure 5. According to John H. Offenberg (2007) [49] , toluene (TULO) is emitted from industrial sources such as paint and adhesive manufacturing processes, as well as urban sources with intensive human activities (e.g., vehicle emissions and fossil fuel use). Based on Figure 5(a), the distribution of toluene was concentrated in the southeastern, eastern, and western directions, which are areas where factories are concentrated in the city. Hildebrandt (2009) [50] noted that toluene reacts with nitrogen oxides (NO2) to form ozone upon exposure to radiation. Referring to the nitrogen oxide rose diagram (Figure 4(a)), high NO2 concentrations, indicated in blue (70–150 ppb), are observed in the same southeastern, eastern, and western directions. A comparison with the toluene rose diagram (Figure 5(a)) reveals that toluene concentrations, albeit lower (ranging between 10–30 ppb), occur in these same directions, highlighting the spatial correlation between NO2 and toluene emissions from industrial sources. Several studies have shown a positive correlation between NO₂ and toluene, particularly in urban environments influenced by vehicular traffic and industrial activities [51,52,53,54]. For instance, Schnitzhofer (2008) [53] conducted a study in the alpine Inn valley and observed that NO₂ and toluene levels were significantly correlated, especially during peak traffic periods, indicating a shared origin from vehicle emissions. Similarly, a study on urban street canyons by Kourtidis (2002) [51] showed that both NO₂ and toluene concentrations were elevated in areas with high traffic density, further supporting the association between these pollutants. Conversely, the northern region for TULO shows low concentrations, reflecting the absence of industrial activity in that area [24,26].
Numerous studies have attributed elevated sulfur dioxide (SO2) levels to heavy reliance on fossil fuels containing sulfur as a primary energy source, particularly in industrial areas [55,56,57]. Other studies have shown that the proliferation of factories increases SO2 emissions due to the use of coal as an energy source. As shown in Figure 5(b), the southeastern and eastern directions were the most affected, with concentrations reaching approximately 150 ppb, due to the high density of factories in these areas [58].
According to Chen (2021) [59] and Gamnitzer (2006) [60] , the primary source of carbon monoxide (CO) is vehicle exhaust emissions, especially in urban areas with high traffic density. Residential heating systems relying on fossil fuels also significantly contribute to CO emissions, in addition to natural and anthropogenic fires [61,62]. As shown in Figure 5(c), the distribution of CO varied, with notable concentrations in the northern and western directions (2–30 ppb) and the southeastern direction (2–10 ppb). This is attributed to continuous traffic in the city, alongside the reliance on biomass burning for heating during winter, which contributes to the spread of this pollutant [26,63].
3.2. Metal Rose Diagrams
Figure S1(a) illustrates the distribution of copper (Cu) over the entire study period, showing consistently high levels across all directions. The most frequent directions were northwest and southeast. Vehicle brake wear is a significant source of copper pollution, producing fine particles containing copper during brake abrasion. Approximately 50% of the worn material consists of copper [64,65,66]. This is closely tied to Riyadh’s high population density and the extensive reliance on personal transportation.
The study by Flament (2008) [67] identifies heavy metal industries as the primary source of iron (Fe) emissions. Factories emit around 3,000 tons of suspended particles annually, predominantly composed of iron oxides such as hematite and magnetite [68,69]. Figure S2 shows that southeastern and eastern directions dominate in iron emissions, reflecting the location of the largest industrial zones in Riyadh. Previous research indicates that approximately 96% of urban air iron pollution comes from factory-emitted iron oxides, explaining the concentration variations in iron distribution near industrial areas [70,71].
Potassium (K) is an essential indicator of air pollution resulting from biomass burning (e.g., straw and wood) [72,73]. Natural sources, such as mineral dust, also contribute to potassium levels, often becoming airborne due to human activity or natural phenomena like wind [74]. Urban industrial activities further emit potassium into the air [73,74]. Figure S3(a) demonstrates that potassium concentrations exceeded 350 ng/m³ across all directions, with the highest frequencies observed in the southeast, which hosts significant industrial activity. During the warm period (Figure S3(c)), potassium frequencies increased in the northwest direction, reaching 1.18%. This is likely due to human activities (e.g., traffic) combined with natural factors such as wind and dust. The highest average potassium concentration was recorded during this warm period, with a value of 32,644.86 ± 1,596.18 ng/m³ (Table S3).
Industrial activities also represent a major source of zinc (Zn) pollution, particularly in urban areas with intensive industrial operations [75,76,77,78]. Zinc distribution in Riyadh (Figure S4(a)) shows concentrations predominantly in the eastern and southeastern directions, with levels exceeding 350 ng/m³. Additionally, vehicle exhaust and industrial transportation emissions contain high zinc levels, further increasing air pollution. Zinc concentrations were also elevated in the northern direction, an area without significant industrial density (Figure S4(a)). This is attributed to heavy traffic in the north, which serves as a key transportation route for industrial goods to areas outside Riyadh, such as Sudair Industrial City [75,79,80,81].
3.3. Particulate Matter Rose Diagrams
Figure 6 and Figure 7 present pollution rose diagrams for PM2.5 and PM10, respectively, over the investigated period. A higher frequency of PM2.5 was observed in the northern and southeastern directions, with concentrations predominantly ranging between 10 to 70 µg/m³, as shown in Figure 6(a). In addition, peak PM2.5 concentrations reached up to 280 µg/m³ in the northern and northwestern directions. In contrast, PM2.5 levels in the southern and southeastern directions remained below 150 µg/m³. During the cool period, as shown in Figure 6(b), the concentration in the northeast direction had a frequency of approximately 4.3% and increased to more than 350 µg/m³. In the southeastern direction, the frequency reached 11% with concentrations between 70 and 150 µg/m³. During the warm period, as illustrated in Figure 6(c), high PM2.5 concentrations, reaching up to 280 µg/m³, were also observed from the north and northwest with an occurrence frequency between 4% to 12%. According to pollutant trends illustrated in Figure 6, Alharbi (2015) [24], Amato (2014) [82] and Bian (2018) [43] reported that local vehicle emissions are the primary source of PM2.5 pollution, explaining the high pollutant concentrations in the northern region (Figure 6(c)). This area is considered a vital zone in Riyadh, hosting numerous companies and workplaces frequented daily, resulting in high vehicle emissions density. Meanwhile, Alharbi (2015) [83] pointed out that industrial emissions, including those from factories such as cement plants and refineries, significantly contribute to air pollution (including PM2.5 production). The eastern part of the city hosts a large industrial zone, including car workshops and factories (e.g., cement factories), which has led to high PM2.5 levels (Figure 6). Additionally, this source (i.e., factories) has significant impacts on human lifespan and health [84].
PM10 concentrations were notably high throughout the overall study period (Figure 7(a)), exceeding 350 µg/m³ in the northern and northeastern directions, while concentrations ranged between 30 and 350 µg/m³ in the southeastern direction. During the cool period, as shown in Figure 7(b), the PM10 concentrations in the northeastern direction had a frequency of approximately 4.5% with values exceeding 350 µg/m³, while the southeastern direction recorded the highest frequency at 11.3%. The average PM10 concentration during the cool period was 100 ± 48.88 µg/m³, which was 2.9% lower than the warm period average of 103.20 ± 44.13 µg/m³. During the warm period, the most frequent direction is northwest, at a frequency of nearly 12%. The eastern direction in the warm period also recorded high PM10 concentrations, with a frequency of 4.5%. It is worth noting that the annual average PM10 concentration observed in this study (97.98 ± 45.97 µg/m3, Table S2) exceeds the World Health Organization (WHO) recommended limit of 15 µg/m3 by approximately six times with recent WHO concerns on air pollution (WHO, 2021). Providing additional context to these findings, Figure S5 presents the mean PM₁₀ concentrations by wind direction across the overall, warm, and cool seasons. The figure reveals that concentrations were consistently elevated from the NW, NNW, and SW sectors, particularly during the warm season.
Industrial emissions, construction and demolition activities, and mineral dust rich in soil elements (e.g., Cu) are the main sources of PM10 pollution, as mentioned in the study by Manousakas (2021) [85] . These sources had a significant impact on the eastern direction due to the factories and excavation work, which was high in both periods (cool and warm). Additionally, the eastern and southeastern directions of the city are characterized by low population density but are significantly exposed to dust and sandstorms originating from outside the city due to sparse urbanization, as noted by Altuwayjiri (2022) [27] . The study by Khodeir (2012) [86] revealed that 18% of PM10 mass originates from heavy fuel combustion. Additionally, non-exhaust emissions, such as tire and brake wear, are significant contributors to PM10 pollution, as highlighted by El-Mubarak (2015) [22] and Bian (2016) [26]. This phenomenon accounts for the elevated pollution levels in the northern areas, characterized by high traffic volumes and dense population.
When comparing pollutant concentrations in Riyadh to other countries, the average concentration in Kuwait was 361 µg/m³ according to Al-Hemoud (2018) [87] , while Serbia recorded a concentration of 68.4 µg/m³ according to Mijić (2009) [88] , and concentrations in Mexico ranged between 55 and 85 µg/m³ as reported by Aguirre-López (2022) [89] . These results indicate that pollutant concentrations in Riyadh are lower than those recorded in Kuwait (which shares similar climatic conditions) but exceed concentrations recorded in colder-climate countries. Nevertheless, the toxicity levels of these pollutants and their harmful impact on public health remain the primary focus of this study.
3.4. PM Toxicity Rose Diagrams
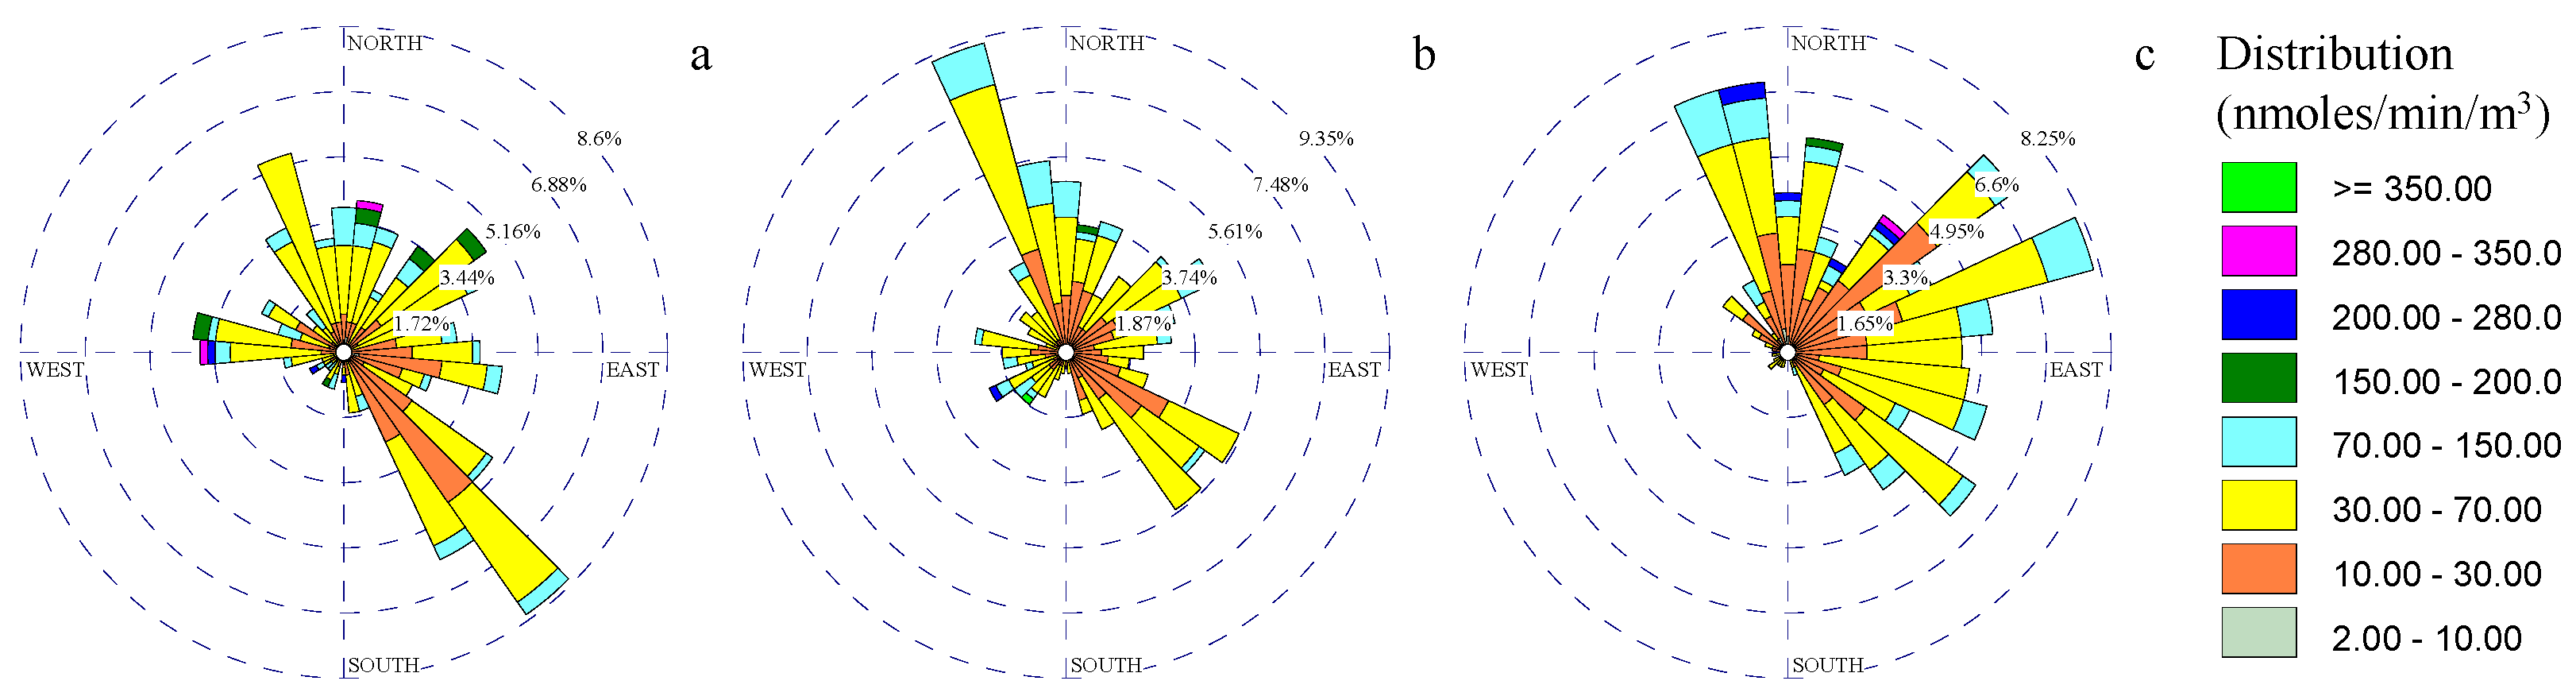
Figure 8(a) shows that the highest oxidative potential (measured as DTT) of PM10 was observed in the northern, northeastern, and western directions, reaching 350 nmol/min/m³ . In contrast, the northwestern and southeastern directions recorded lower DTT concentrations (10–150 nmol/min/m³) but with higher frequencies, reaching approximately 7% over the entire study period (Figure 8(a)). A statistical comparison between high and low DTT wind sectors confirmed that these differences were significant (p < 0.05), indicating that air masses originating from northern and western directions are associated with significantly elevated oxidative potential. Furthermore, the DTT rose demonstrated that not every direction with high PM10 concentrations necessarily results in increased oxidative potential or contributes to oxidative stress. For instance, during the warm period in Figure 7(c), the highest PM10 concentrations were observed in the northwestern and eastern directions. However, the DTT rose for the same period (Figure 8(c)) reveals that the directions with the highest oxidative potential for PM₁₀ were from the north and west.
Figure S6 further characterizes the seasonal distribution of PM10 toxcity using DTT by wind direction across the overall, warm, and cold periods. The results confirm that oxidative potential was consistently higher during the warm season, particularly from the NNW, NW, and W sectors, which may reflect the influence of enhanced photochemical activity, increased anthropogenic emissions, and regional combustion sources prevalent during warmer conditions. In contrast, wind originating from the southern and southeastern sectors was associated with lower DTT values, suggesting relatively cleaner air masses. The cold season exhibited generally reduced DTT levels across all directions, likely due to lower photochemical activity, which can limit the formation of redox-active particulate components.
Recent studies have shown that components from anthropogenic sources, particularly vehicle emissions, contribute significantly to the oxidative potential (OP) of PM₁₀, accounting for a substantial portion of its overall oxidative activity [90,91]. Transition metals such as copper (Cu), iron (Fe), and zinc (Zn), commonly emitted from brake and tire wear, are among the primary contributors to this activity [27,92]. These metals, along with organic compounds from combustion processes, enhance the redox reactivity of airborne particles. The northern direction exhibited high frequency throughout the overall study period (Figure 8(a)), which can be attributed to the population density and traffic in this area.
Additionally, oxidative activity is linked to organic carbon (OC) and elemental carbon (EC) derived from fossil fuel and biomass combustion, as highlighted by Fang (2016) [31] and Lyu (2018) [93]. Other studies revealed that gasoline-powered vehicle emissions account for approximately 15% of oxidative activity, while biomass burning contributes about 50%, as reported by Weber (2021) [91]. This explains the elevated concentrations in the western direction, which is an agricultural area with extensive biomass-burning activities. Finally, resuspended dust emerges as a significant contributor to particulate matter concentrations during dry seasons such as summer and autumn, primarily due to limited precipitation and increased anthropogenic activities, including vehicular movement. Evidence from previous studies indicates that in urban and arid environments, accumulated road dust becomes a prominent source of airborne particles upon disturbance. For example, Weber (2021) [91] identified soil and resuspended dust as major contributors to oxidative potential, accounting for over 30% of the total measured OP. Similarly, Cipoli (2024) [94] reported that road dust resuspension in urban settings substantially increases human exposure to toxic metals and organic compounds, thereby enhancing the oxidative potential of PM₁₀. These findings underscore the pivotal role of resuspended dust in influencing seasonal variations in air quality and oxidative activity. This phenomenon may also account for the elevated wind frequency observed in the southeastern sector of the city, where sparse urban development and frequent dust events lead to higher frequencies, as illustrated in Figure 8(a), despite comparatively lower particle concentrations relative to other directions.
By studying PM10 mass concentrations and DTT levels throughout the day (i.e., by the hour), it was observed that PM10 concentrations during the morning period (06:00–11:00 AM) recorded the highest frequency in the southeastern direction, while the highest concentrations were recorded in the northern direction (70–350 µg/m³) (Figure 9(a)). Regarding DTT levels of PM10, Figure 10(a) shows that the directions contributing to high PM10 toxicity levels are the west and northeast (10–350 nmol/min/m³), followed by the southeast, which exhibits a high frequency (8.5%). The morning period coincides with the time when residents leave for work or study, resulting in heavy traffic in the northern area due to its high population density and the presence of companies and universities. Therefore, the most toxicity directions were the west and northeast, likely because residents commute to the northern area from these directions. Notably, the western direction includes one of the busiest morning roads (i.e., the Suspended Bridge).
Figure 9(b) and Figure 10(b) illustrate the distribution of PM10 and its toxicity during the afternoon period (12:00–17:00 PM). The directional patterns in the two charts are almost identical. however, they reveal that not all directions with high PM10 concentrations correspond to higher PM10 toxicity. PM10 mass concentrations increased in the northeast, northwest, and southwest directions, with concentrations reaching 350 µg/m³. Meanwhile, PM10 toxicity increased in the north, with concentrations reaching 200 nmol/min/m³, surpassed by the southwest, which reached 280 nmol/min/m³. The high PM10 toxicity in the north direction can be attributed to the same reasons discussed earlier (i.e., population, traffic, and construction activity), which also explains the high northern PM10 toxicity levels in the evening period (18:00–23:00 PM). As for the southwestern direction, it is characterized as an industrial area and is known for its numerous industrial and commercial establishments, which may contribute to increased emissions of PM toxic species, thereby leading to higher PM toxicity (i.e., DTT) levels observed in the rose diagram (Figure 10(b)).
4. Conclusions
This study introduced a “toxicity wind rose” to assess the spatial variability of PM₁₀ concentrations and their associated oxidative potential in Riyadh. While the highest PM₁₀ mass concentrations were observed from the northwest and southeast, the most toxic air masses originated from the northeast and west, indicating that areas with elevated particle levels are not always the most harmful. These findings highlight the need for air quality assessments that account for both pollutant mass and toxicity. The toxicity wind rose provides a valuable tool for policymakers by enabling the identification of high-risk emission sectors, optimizing the placement of monitoring stations, guiding zoning and emission control regulations, and informing targeted public health advisories based on toxicological risk rather than concentration alone. Future research should further incorporate seasonal variations and chemical speciation to enhance the method’s utility for evidence-based environmental management and policy development.
Supplementary Materials
The following supporting information can be downloaded at the website of this paper posted on Preprints.org, Figure S1: Cu metal roses for: a) overall period, b) cool period, c) warm period; Figure S2: Fe metal roses for: a) overall period, b) cool period, c) warm period; Figure S3: K metal roses for: a) overall period, b) cool period, c) warm period; Figure S4: Zn metal roses for: a) overall period, b) cool period, c) warm period; Table S1: The average (± standard deviation) of meteorological parameters; Table S2: The concentrations of PM10 during the study periods; Table S3:The average (± standard deviation) of metals.
Author Contributions
Conceptualization, A.T.; methodology, A.T and A.M.; software, A.T and A.M.; validation, A.T., A.M. and M.A.; formal analysis, A.T., A.M. and M.A.; investigation, A.T., A.M. and M.A.; data curation, A.T and A.M.; writing—original draft preparation, A.T and A.M.; writing—review and editing, , A.T., A.M. and M.A; visualization, , A.T., A.M. and M.A; supervision, A.T and M.A.; project administration, A.T.; funding acquisition, A.T. All authors have read and agreed to the published version of the manuscript.
Funding
The Deanship of Post graduate Studies and Scientific Research at Majmaah University.
Institutional Review Board Statement
Not applicable.
Informed Consent Statement
Not applicable.
Data Availability Statement
The data set used in this study can be obtained from the corresponding author on reasonable request.
Acknowledgments
The authors extend the appreciation to the Deanship of Post graduate Studies and Scientific Research at Majmaah University for funding this research work.
Conflicts of Interest
The authors declare no conflicts of interest.
References
- Manisalidis, I.; Stavropoulou, E.; Stavropoulos, A.; Bezirtzoglou, E. Environmental and Health Impacts of Air Pollution: A Review. Front. Public Heal. 2020, 8. [CrossRef]
- Kim, D.; Chen, Z.; Zhou, L.; Huang, S. Air Pollutants and Early Origins of Respiratory Diseases. Chronic Dis. Transl. Med. 2018, 4, 75–94. [CrossRef]
- Badyda, A.; Gayer, A.; Czechowski, P.; Majewski, G.; Dąbrowiecki, P. Pulmonary Function and Incidence of Selected Respiratory Diseases Depending on the Exposure to Ambient PM10. Int. J. Mol. Sci. 2016, 17, 1954. [CrossRef]
- Dobaradaran, S., Geravandi, S., Goudarzi, G., Idani, E., Salmanzadeh, S., Soltani, F., Yari, A. R., & Mohammadi, M.J. Determination of Cardiovascular and Respiratory Diseases Caused by PM10 Exposure in Bushehr. 2016.
- Khaniabadi, Y.O.; Polosa, R.; Chuturkova, R.Z.; Daryanoosh, M.; Goudarzi, G.; Borgini, A.; Tittarelli, A.; Basiri, H.; Armin, H.; Nourmoradi, H.; et al. Human Health Risk Assessment Due to Ambient PM10 and SO2 by an Air Quality Modeling Technique. Process Saf. Environ. Prot. 2017, 111, 346–354. [CrossRef]
- Wong, C.-M.; Vichit-Vadakan, N.; Kan, H.; Qian, Z. Public Health and Air Pollution in Asia (PAPA): A Multicity Study of Short-Term Effects of Air Pollution on Mortality. Environ. Health Perspect. 2008, 116, 1195–1202. [CrossRef]
- Mebrahtu, T.F.; Santorelli, G.; Yang, T.C.; Wright, J.; Tate, J.; McEachan, R.R. The Effects of Exposure to NO2, PM2.5 and PM10 on Health Service Attendances with Respiratory Illnesses: A Time-Series Analysis. Environ. Pollut. 2023, 333, 122123. [CrossRef]
- Choi, H.; Seo, J.H.; Weon, S. Visualizing Indoor Ozone Exposures via O-Dianisidine Based Colorimetric Passive Sampler. J. Hazard. Mater. 2023, 460, 132510. [CrossRef]
- Brook, R.D.; Rajagopalan, S.; Pope, C.A.; Brook, J.R.; Bhatnagar, A.; Diez-Roux, A. V.; Holguin, F.; Hong, Y.; Luepker, R. V.; Mittleman, M.A.; et al. Particulate Matter Air Pollution and Cardiovascular Disease: An Update to the Scientific Statement from the American Heart Association. Circulation 2010, 121, 2331–2378. [CrossRef]
- Bates, J.T.; Fang, T.; Verma, V.; Zeng, L.; Weber, R.J.; Tolbert, P.E.; Abrams, J.Y.; Sarnat, S.E.; Klein, M.; Mulholland, J.A.; et al. Review of Acellular Assays of Ambient Particulate Matter Oxidative Potential: Methods and Relationships with Composition, Sources, and Health Effects. Environ. Sci. Technol. 2019, 53, 4003–4019. [CrossRef]
- Lionetto, M.; Guascito, M.; Giordano, M.; Caricato, R.; De Bartolomeo, A.; Romano, M.; Conte, M.; Dinoi, A.; Contini, D. Oxidative Potential, Cytotoxicity, and Intracellular Oxidative Stress Generating Capacity of PM10: A Case Study in South of Italy. Atmosphere (Basel). 2021, 12, 464. [CrossRef]
- Ratto, G.; Maronna, R.; Berri, G. Analysis of Wind Roses Using Hierarchical Cluster and Multidimensional Scaling Analysis at La Plata, Argentina. Boundary-Layer Meteorol. 2010, 137, 477–492. [CrossRef]
- AZIZI, M.; Hashim, N.H. Wind Rose Analysis for UTHM and Possible Pollution Sources Zone. Prog. Eng. Appl. Technol. 2021, 2, 432–443.
- Linda, J.; Hasečić, A.; Pospíšil, J.; Kudela, L.; Brzezina, J. Impact of Wind-Induced Resuspension on Urban Air Quality: A CFD Study with Air Quality Data Comparison. npj Clim. Atmos. Sci. 2025, 8, 74. [CrossRef]
- Al–Dabbous, A.N.; Goel, A.; Alsulaili, A.; Al-Dabbous, S.K.; Shalash, M. Evaluating Particulate Matter Mass and Count Concentrations in a Vehicle Cabin: Insights from Kuwait City. J. Eng. Res. 2025. [CrossRef]
- Al-Dabbous, A.N.; Khan, A.R.; Al-Rashidi, M.S.; Awadi, L. Carbon Dioxide and Volatile Organic Compounds Levels in Mosque in Hot Arid Climate. Indoor Built Environ. 2013, 22, 456–464. [CrossRef]
- Al Nadhairi, R.; Al Kalbani, M.; Al Khazami, S.; Al Hashmi, M.; Al Zadai, S.; Al-Rumhi, Y.; Al-Kindi, K.M. Air Quality and Health Risk Assessment during Middle Eastern Dust Storms: A Study of Particulate Matter. Air Qual. Atmos. Heal. 2025, 18, 587–603. [CrossRef]
- He, C.; Hong, S.; Mu, H.; Tu, P.; Yang, L.; Ke, B.; Huang, J. Characteristics and Meteorological Factors of Severe Haze Pollution in China. Adv. Meteorol. 2021, 2021, 1–15. [CrossRef]
- Saudi General Authority for Statistics General Authority for Statistics Available online: https://portal.saudicensus.sa/portal/public/1/15/1367?type=DASHBOARD.
- IQAIR Riyadh Air Quality Index (AQI) Available online: https://www.iqair.com/saudi-arabia/ar-riyad/riyadh.
- Alghamdi, A.G.; EL-Saeid, M.H.; Alzahrani, A.J.; Ibrahim, H.M. Heavy Metal Pollution and Associated Health Risk Assessment of Urban Dust in Riyadh, Saudi Arabia. PLoS One 2022, 17, e0261957. [CrossRef]
- El-Mubarak, A.H.; Rushdi, A.I.; Al-Mutlaq, K.F.; Bazeyad, A.Y.; Simonich, S.L.M.; Simoneit, B.R.T. Occurrence of High Levels of Persistent Organic Pollutants (POPs) in Particulate Matter of the Ambient Air of Riyadh, Saudi Arabia. Arab. J. Sci. Eng. 2015, 40, 81–92. [CrossRef]
- Salman, A.; Al-Tayib, M.; Hag-Elsafi, S.; Al-Duwarij, N. Assessment of Pollution Sources in the Southeastern of the Riyadh and Its Impact on the Population/Saudi Arabia. Arab. J. Geosci. 2016, 9, 328. [CrossRef]
- Alharbi, B.; Shareef, M.M.; Husain, T. Study of Chemical Characteristics of Particulate Matter Concentrations in Riyadh, Saudi Arabia. Atmos. Pollut. Res. 2015, 6, 88–98. [CrossRef]
- Alharbi, B.; Pasha, M.; N, T. Assessment of Ambient Air Quality in Riyadh City, Saudi Arabia. Curr. World Environ. 2014, 9, 227–236. [CrossRef]
- Bian, Q.; Alharbi, B.; Collett, J.; Kreidenweis, S.; Pasha, M.J. Measurements and Source Apportionment of Particle-Associated Polycyclic Aromatic Hydrocarbons in Ambient Air in Riyadh, Saudi Arabia. Atmos. Environ. 2016, 137, 186–198. [CrossRef]
- Altuwayjiri, A.; Pirhadi, M.; Kalafy, M.; Alharbi, B.; Sioutas, C. Impact of Different Sources on the Oxidative Potential of Ambient Particulate Matter PM10 in Riyadh, Saudi Arabia: A Focus on Dust Emissions. Sci. Total Environ. 2022, 806, 150590. [CrossRef]
- Romano, S.; Perrone, M.R.; Becagli, S.; Pietrogrande, M.C.; Russo, M.; Caricato, R.; Lionetto, M.G. Ecotoxicity, Genotoxicity, and Oxidative Potential Tests of Atmospheric PM10 Particles. Atmos. Environ. 2020, 221, 117085. [CrossRef]
- Hu, S.; Polidori, A.; Arhami, M.; Shafer, M.M.; Schauer, J.J.; Cho, A.; Sioutas, C. Redox Activity and Chemical Speciation of Size Fractioned PM in the Communities of the Los Angeles-Long Beach Harbor. Atmos. Chem. Phys. 2008, 8, 6439–6451. [CrossRef]
- Shafer, M.M.; Hemming, J.D.C.; Antkiewicz, D.S.; Schauer, J.J. Oxidative Potential of Size-Fractionated Atmospheric Aerosol in Urban and Rural Sites across Europe. Faraday Discuss. 2016, 189, 381–405. [CrossRef]
- Fang, T.; Verma, V.; Bates, J.T.; Abrams, J.; Klein, M.; Strickland, M.J.; Sarnat, S.E.; Chang, H.H.; Mulholland, J.A.; Tolbert, P.E.; et al. Oxidative Potential of Ambient Water-Soluble PM 2.5 in the Southeastern United States: Contrasts in Sources and Health Associations between Ascorbic Acid (AA) and Dithiothreitol (DTT) Assays. Atmos. Chem. Phys. 2016, 16, 3865–3879. [CrossRef]
- Jiang, H.; Ahmed, C.M.S.; Canchola, A.; Chen, J.Y.; Lin, Y.-H. Use of Dithiothreitol Assay to Evaluate the Oxidative Potential of Atmospheric Aerosols. Atmosphere (Basel). 2019, 10, 571. [CrossRef]
- Aldekheel, M.; Tohidi, R.; Al-Hemoud, A.; Alkudari, F.; Verma, V.; Subramanian, P.S.G.; Sioutas, C. Identifying Urban Emission Sources and Their Contribution to the Oxidative Potential of Fine Particulate Matter (Pm2.5) in Kuwait 2023.
- Herner, J.D.; Green, P.G.; Kleeman, M.J. Measuring the Trace Elemental Composition of Size-Resolved Airborne Particles. Environ. Sci. Technol. 2006, 40, 1925–1933. [CrossRef]
- Karthikeyan, S.; Balasubramanian, R. Determination of Water-Soluble Inorganic and Organic Species in Atmospheric Fine Particulate Matter. Microchem. J. 2006, 82, 49–55. [CrossRef]
- Chuang, K.-J.; Chan, C.-C.; Su, T.-C.; Lee, C.-T.; Tang, C.-S. The Effect of Urban Air Pollution on Inflammation, Oxidative Stress, Coagulation, and Autonomic Dysfunction in Young Adults. Am. J. Respir. Crit. Care Med. 2007, 176, 370–376. [CrossRef]
- O’Leary, B.; Reiners, J.J.; Xu, X.; Lemke, L.D. Identification and Influence of Spatio-Temporal Outliers in Urban Air Quality Measurements. Sci. Total Environ. 2016, 573, 55–65. [CrossRef]
- Samani, A.A.N.; Dadfar, S.; Shahbazi, A. A Study on Dust Storms Using Wind Rose, Storm Rose and Sand Rose (Case Study: Tehran Province). Desert 2013, 18, 9–18.
- Alharbi, B.H.; Alduwais, A.K.; Alhudhodi, A.H. An Analysis of the Spatial Distribution of O 3 and Its Precursors during Summer in the Urban Atmosphere of Riyadh, Saudi Arabia. Atmos. Pollut. Res. 2017, 8, 861–872. [CrossRef]
- Meteostat Meteostat Riyadh Available online: https://meteostat.net/en/place/sa/riyadh?s=40438&t=2019-12-01/2020-09-25.
- Altuwayjiri, A.; Pirhadi, M.; Taghvaee, S.; Sioutas, C. Long-Term Trends in the Contribution of PM 2.5 Sources to Organic Carbon (OC) in the Los Angeles Basin and the Effect of PM Emission Regulations. Faraday Discuss. 2020, 0–37. [CrossRef]
- Ogen, Y. Assessing Nitrogen Dioxide (NO2) Levels as a Contributing Factor to Coronavirus (COVID-19) Fatality. Sci. Total Environ. 2020, 726, 138605. [CrossRef]
- Bian, Q.; Alharbi, B.; Shareef, M.M.; Husain, T.; Pasha, M.J.; Atwood, S.A.; Kreidenweis, S.M. Sources of PM 2.5 Carbonaceous Aerosol in Riyadh, Saudi Arabia. Atmos. Chem. Phys. 2018, 18, 3969–3985. [CrossRef]
- Alharbi, B.; Shareef, M.M.; Husain, T. Study of Chemical Characteristics of Particulate Matter Concentrations in Riyadh, Saudi Arabia. Atmos. Pollut. Res. 2015, 6, 88–98. [CrossRef]
- Mittal, M.L.; Hess, P.G.; Jain, S.L.; Arya, B.C.; Sharma, C. Surface Ozone in the Indian Region. Atmos. Environ. 2007, 41, 6572–6584. [CrossRef]
- Amouei Torkmahalleh, M.; Hopke, P.K.; Broomandi, P.; Naseri, M.; Abdrakhmanov, T.; Ishanov, A.; Kim, J.; Shah, D.; Kumar, P. Exposure to Particulate Matter and Gaseous Pollutants during Cab Commuting in Nur-Sultan City of Kazakhstan. Atmos. Pollut. Res. 2020, 11, 880–885. [CrossRef]
- Liu, C.; Chen, R.; Sera, F.; Vicedo-Cabrera, A.M.; Guo, Y.; Tong, S.; Lavigne, E.; Correa, P.M.; Ortega, N.V.; Achilleos, S.; et al. Interactive Effects of Ambient Fine Particulate Matter and Ozone on Daily Mortality in 372 Cities: Two Stage Time Series Analysis. BMJ 2023, e075203. [CrossRef]
- Shareef, M.M.; Husain, T.; Alharbi, B. Analysis of Relationship between O3, NO, and NO2 in Riyadh, Saudi Arabia. Asian J. Atmos. Environ. 2018, 12, 17–29. [CrossRef]
- Offenberg, J.H.; Lewis, C.W.; Lewandowski, M.; Jaoui, M.; Kleindienst, T.E.; Edney, E.O. Contributions of Toluene and α-Pinene to SOA Formed in an Irradiated Toluene/α-Pinene/NOx/ Air Mixture: Comparison of Results Using 14C Content and SOA Organic Tracer Methods. Environ. Sci. Technol. 2007, 41, 3972–3976. [CrossRef]
- Hildebrandt, L.; Donahue, N.M.; Pandis, S.N. High Formation of Secondary Organic Aerosol from the Photo-Oxidation of Toluene. Atmos. Chem. Phys. 2009, 9, 2973–2986. [CrossRef]
- Kourtidis, K.A.; Ziomas, I.; Zerefos, C.; Kosmidis, E.; Symeonidis, P.; Christophilopoulos, E.; Karathanassis, S.; Mploutsos, A. Benzene, Toluene, Ozone, NO2 and SO2 Measurements in an Urban Street Canyon in Thessaloniki, Greece. Atmos. Environ. 2002, 36, 5355–5364. [CrossRef]
- Carr, D.; von Ehrenstein, O.; Weiland, S.; Wagner, C.; Wellie, O.; Nicolai, T.; von Mutius, E. Modeling Annual Benzene, Toluene, NO2, and Soot Concentrations on the Basis of Road Traffic Characteristics. Environ. Res. 2002, 90, 111–118. [CrossRef]
- Schnitzhofer, R.; Beauchamp, J.; Dunkl, J.; Wisthaler, A.; Weber, A.; Hansel, A. Long-Term Measurements of CO, NO, NO2, Benzene, Toluene and PM10 at a Motorway Location in an Austrian Valley. Atmos. Environ. 2008, 42, 1012–1024. [CrossRef]
- Zuraski, K.; Harkins, C.; Peischl, J.; Coggon, M.M.; Stockwell, C.E.; Robinson, M.A.; Gilman, J.; Warneke, C.; McDonald, B.C.; Brown, S.S. On-Road Measurements of Nitrogen Oxides, CO, CO 2 , and VOC Emissions in Two Southwestern U.S. Cities. ACS ES&T Air 2025, 2, 589–598. [CrossRef]
- Al-Zboon, K. Effect of Cement Industry on Ambient Air Quality and Potential Health Risk: A Case Study from Riyadh, Saudi Arabia. JORDANIAN J. Eng. Chem. Ind. 2021, 4, 14–23. [CrossRef]
- Stanislaus, A.; Marafi, A.; Rana, M.S. Recent Advances in the Science and Technology of Ultra Low Sulfur Diesel (ULSD) Production. Catal. Today 2010, 153, 1–68. [CrossRef]
- Wallington, T.J.; Anderson, J.E.; Dolan, R.H.; Winkler, S.L. Vehicle Emissions and Urban Air Quality: 60 Years of Progress. Atmosphere (Basel). 2022, 13. [CrossRef]
- Miyama, E.; Managi, S. Global Environmental Emissions Estimate: Application of Multiple Imputation. Environ. Econ. Policy Stud. 2014, 16, 115–135. [CrossRef]
- Chen, Y.; Dombek, T.; Hand, J.; Zhang, Z.; Gold, A.; Ault, A.P.; Levine, K.E.; Surratt, J.D. Seasonal Contribution of Isoprene-Derived Organosulfates to Total Water-Soluble Fine Particulate Organic Sulfur in the United States. ACS Earth Sp. Chem. 2021, 5, 2419–2432. [CrossRef]
- Gamnitzer, U.; Karstens, U.; Kromer, B.; Neubert, R.E.M.; Meijer, H.A.J.; Schroeder, H.; Levin, I. Carbon Monoxide: A Quantitative Tracer for Fossil Fuel CO2? J. Geophys. Res. Atmos. 2006, 111, 1–19. [CrossRef]
- Okoshi, R.; Rasheed, A.; Chen Reddy, G.; McCrowey, C.P.; Curtis, D.B. Size and Mass Distributions of Ground-Level Sub-Micrometer Biomass Burning Aerosol from Small Wildfires. Atmos. Environ. 2014, 89, 392–402. [CrossRef]
- Verma, V.; Polidori, A.; Schauer, J.J.; Shafer, M.M.; Cassee, F.R.; Sioutas, C. Physicochemical and Toxicological Profiles of Particulate Matter in Los Angeles during the October 2007 Southern California Wildfires. Environ. Sci. Technol. 2009, 43, 954–960. [CrossRef]
- Altuwayjiri, A.; Pirhadi, M.; Taghvaee, S.; Sioutas, C. Long-Term Trends in the Contribution of PM 2.5 Sources to Organic Carbon (OC) in the Los Angeles Basin and the Effect of PM Emission Regulations. Faraday Discuss. 2021, 226, 74–99. [CrossRef]
- Fussell, J.C.; Franklin, M.; Green, D.C.; Gustafsson, M.; Harrison, R.M.; Hicks, W.; Kelly, F.J.; Kishta, F.; Miller, M.R.; Mudway, I.S.; et al. A Review of Road Traffic-Derived Non-Exhaust Particles: Emissions, Physicochemical Characteristics, Health Risks, and Mitigation Measures. Environ. Sci. Technol. 2022, 56, 6813–6835. [CrossRef]
- Grigoratos, T.; Martini, G. Brake Wear Particle Emissions: A Review. Environ. Sci. Pollut. Res. 2015, 22, 2491–2504. [CrossRef]
- Hulskotte, J.H.J.; Denier van der Gon, H.A.C.; Visschedijk, A.J.H.; Schaap, M. Brake Wear from Vehicles as an Important Source of Diffuse Copper Pollution. Water Sci. Technol. 2007, 56, 223–231. [CrossRef]
- Flament, P.; Mattielli, N.; Aimoz, L.; Choël, M.; Deboudt, K.; Jong, J. de; Rimetz-Planchon, J.; Weis, D. Iron Isotopic Fractionation in Industrial Emissions and Urban Aerosols. Chemosphere 2008, 73, 1793–1798. [CrossRef]
- Wiederhold, J.G.; Kraemer, S.M.; Teutsch, N.; Borer, P.M.; Halliday, A.N.; Kretzschmar, R. Iron Isotope Fractionation during Proton-Promoted, Ligand-Controlled, and Reductive Dissolution of Goethite. Environ. Sci. Technol. 2006, 40, 3787–3793. [CrossRef]
- Wu, B.; Amelung, W.; Xing, Y.; Bol, R.; Berns, A.E. Iron Cycling and Isotope Fractionation in Terrestrial Ecosystems. Earth-Science Rev. 2019, 190, 323–352. [CrossRef]
- Choël, M.; Deboudt, K.; Osán, J.; Flament, P.; Van Grieken, R. Quantitative Determination of Low- Z Elements in Single Atmospheric Particles on Boron Substrates by Automated Scanning Electron Microscopy−Energy-Dispersive X-Ray Spectrometry. Anal. Chem. 2005, 77, 5686–5692. [CrossRef]
- Kandler, K.; Benker, N.; Bundke, U.; Cuevas, E.; Ebert, M.; Knippertz, P.; Rodríguez, S.; Schütz, L.; Weinbruch, S. Chemical Composition and Complex Refractive Index of Saharan Mineral Dust at Izaña, Tenerife (Spain) Derived by Electron Microscopy. Atmos. Environ. 2007, 41, 8058–8074. [CrossRef]
- Du, Z.; He, K.; Cheng, Y.; Duan, F.; Ma, Y.; Liu, J.; Zhang, X.; Zheng, M.; Weber, R. A Yearlong Study of Water-Soluble Organic Carbon in Beijing II: Light Absorption Properties. Atmos. Environ. 2014, 89, 235–241. [CrossRef]
- Sun, Z.; Mu, Y.; Liu, Y.; Shao, L. A Comparison Study on Airborne Particles during Haze Days and Non-Haze Days in Beijing. Sci. Total Environ. 2013, 456–457, 1–8. [CrossRef]
- Zhang, R.; Jing, J.; Tao, J.; Hsu, S.C.; Wang, G.; Cao, J.; Lee, C.S.L.; Zhu, L.; Chen, Z.; Zhao, Y.; et al. Chemical Characterization and Source Apportionment of PM2.5 in Beijing: Seasonal Perspective. Atmos. Chem. Phys. 2013, 13, 7053–7074. [CrossRef]
- Dai, Q.-L.; Bi, X.-H.; Wu, J.-H.; Zhang, Y.-F.; Wang, J.; Xu, H.; Yao, L.; Jiao, L.; Feng, Y.-C. Characterization and Source Identification of Heavy Metals in Ambient PM10 and PM2.5 in an Integrated Iron and Steel Industry Zone Compared with a Background Site. Aerosol Air Qual. Res. 2015, 15, 875–887. [CrossRef]
- Matović, V.; Buha, A.; Bulat, Z.; Đukić-Ćosić, D. Cadmium Toxicity Revisited: Focus on Oxidative Stress Induction and Interactions with Zinc and Magnesium. Arch. Ind. Hyg. Toxicol. 2011, 62, 65–76. [CrossRef]
- Pant, P.; Harrison, R.M. Estimation of the Contribution of Road Traffic Emissions to Particulate Matter Concentrations from Field Measurements : A Review. Atmos. Environ. 2013, 77, 78–97. [CrossRef]
- Yin, S.; Wang, C.; Wei, J.; Wang, D.; Jin, L.; Liu, J.; Wang, L.; Li, Z.; Ren, A.; Yin, C. Essential Trace Elements in Placental Tissue and Risk for Fetal Neural Tube Defects. Environ. Int. 2020, 139, 105688. [CrossRef]
- Alahabadi, A.; Ehrampoush, M.H.; Miri, M.; Ebrahimi Aval, H.; Yousefzadeh, S.; Ghaffari, H.R.; Ahmadi, E.; Talebi, P.; Abaszadeh Fathabadi, Z.; Babai, F.; et al. A Comparative Study on Capability of Different Tree Species in Accumulating Heavy Metals from Soil and Ambient Air. Chemosphere 2017, 172, 459–467. [CrossRef]
- Rai, P.K.; Lee, S.S.; Zhang, M.; Tsang, Y.F.; Kim, K.-H. Heavy Metals in Food Crops: Health Risks, Fate, Mechanisms, and Management. Environ. Int. 2019, 125, 365–385. [CrossRef]
- Ronco, A.M.; Arguello, G.; Suazo, M.; Llanos, M.N. Increased Levels of Metallothionein in Placenta of Smokers. Toxicology 2005, 208, 133–139. [CrossRef]
- Amato, F.; Cassee, F.R.; van der Gon, H.A.C.D.; Gehrig, R.; Gustafsson, M.; Hafner, W.; Harrison, R.M.; Jozwicka, M.; Kelly, F.J.; Moreno, T. Urban Air Quality: The Challenge of Traffic Non-Exhaust Emissions. J. Hazard. Mater. 2014, 275, 31–36.
- Alharbi, B.; Shareef, M.M.; Husain, T. Study of Chemical Characteristics of Particulate Matter Concentrations in Riyadh, Saudi Arabia. Atmos. Pollut. Res. 2015, 6, 88–98. [CrossRef]
- Pope, C.A.; Ezzati, M.; Dockery, D.W. Fine-Particulate Air Pollution and Life Expectancy in the United States. N. Engl. J. Med. 2009, 360, 376–386. [CrossRef]
- Manousakas, M.; Diapouli, E.; Belis, C.A.; Vasilatou, V.; Gini, M.; Lucarelli, F.; Querol, X.; Eleftheriadis, K. Quantitative Assessment of the Variability in Chemical Profiles from Source Apportionment Analysis of PM10 and PM2.5 at Different Sites within a Large Metropolitan Area. Environ. Res. 2021, 192, 110257. [CrossRef]
- Khodeir, M.; Shamy, M.; Alghamdi, M.; Zhong, M.; Sun, H.; Costa, M.; Chen, L.C.; Maciejczyk, P. Source Apportionment and Elemental Composition of PM2.5 and PM10 in Jeddah City, Saudi Arabia. Atmos. Pollut. Res. 2012, 3, 331–340. [CrossRef]
- Al-Hemoud, A.; Al-Dousari, A.; Al-Shatti, A.; Al-Khayat, A.; Behbehani, W.; Malak, M. Health Impact Assessment Associated with Exposure to PM10 and Dust Storms in Kuwait. Atmosphere (Basel). 2018, 9, 6. [CrossRef]
- Mijić, Z.; Tasić, M.; Rajšić, S.; Novaković, V. The Statistical Characters of PM10 in Belgrade Area. Atmos. Res. 2009, 92, 420–426. [CrossRef]
- Aguirre-López, M.A.; Rodríguez-González, M.A.; Soto-Villalobos, R.; Gómez-Sánchez, L.E.; Benavides-Ríos, Á.G.; Benavides-Bravo, F.G.; Walle-García, O.; Pamanés-Aguilar, M.G. Statistical Analysis of PM10 Concentration in the Monterrey Metropolitan Area, Mexico (2010–2018). Atmosphere (Basel). 2022, 13, 297. [CrossRef]
- Borlaza, L.J.; Weber, S.; Marsal, A.; Uzu, G.; Jacob, V.; Besombes, J.-L.; Chatain, M.; Conil, S.; Jaffrezo, J.-L. Nine-Year Trends of PM 10 Sources and Oxidative Potential in a Rural Background Site in France. Atmos. Chem. Phys. 2022, 22, 8701–8723. [CrossRef]
- Weber, S.; Uzu, G.; Favez, O.; Borlaza, L.J.S.; Calas, A.; Salameh, D.; Chevrier, F.; Allard, J.; Besombes, J.-L.; Albinet, A.; et al. Source Apportionment of Atmospheric PM 10 Oxidative Potential: Synthesis of 15 Year-Round Urban Datasets in France. Atmos. Chem. Phys. 2021, 21, 11353–11378. [CrossRef]
- Boogaard, H.; Janssen, N.A.H.; Fischer, P.H.; Kos, G.P.A.; Weijers, E.P.; Cassee, F.R.; van der Zee, S.C.; de Hartog, J.J.; Brunekreef, B.; Hoek, G. Contrasts in Oxidative Potential and Other Particulate Matter Characteristics Collected Near Major Streets and Background Locations. Environ. Health Perspect. 2012, 120, 185–191. [CrossRef]
- Lyu, Y.; Guo, H.; Cheng, T.; Li, X. Particle Size Distributions of Oxidative Potential of Lung-Deposited Particles: Assessing Contributions from Quinones and Water-Soluble Metals. Environ. Sci. Technol. 2018, 52, 6592–6600. [CrossRef]
- Cipoli, Y.A.; Rienda, I.C.; de la Campa, A.M.S.; Kováts, N.; Nunes, T.; Feliciano, M.; Hoffer, A.; Jancsek-Turóczi, B.; Alves, C. Emission Factors, Chemical Composition and Ecotoxicity of PM10 from Road Dust Resuspension in a Small Inland City. Water, Air, Soil Pollut. 2024, 235, 748. [CrossRef]
Figure 1.
Location of the study area in Riyadh, the capital of Saudi Arabia.
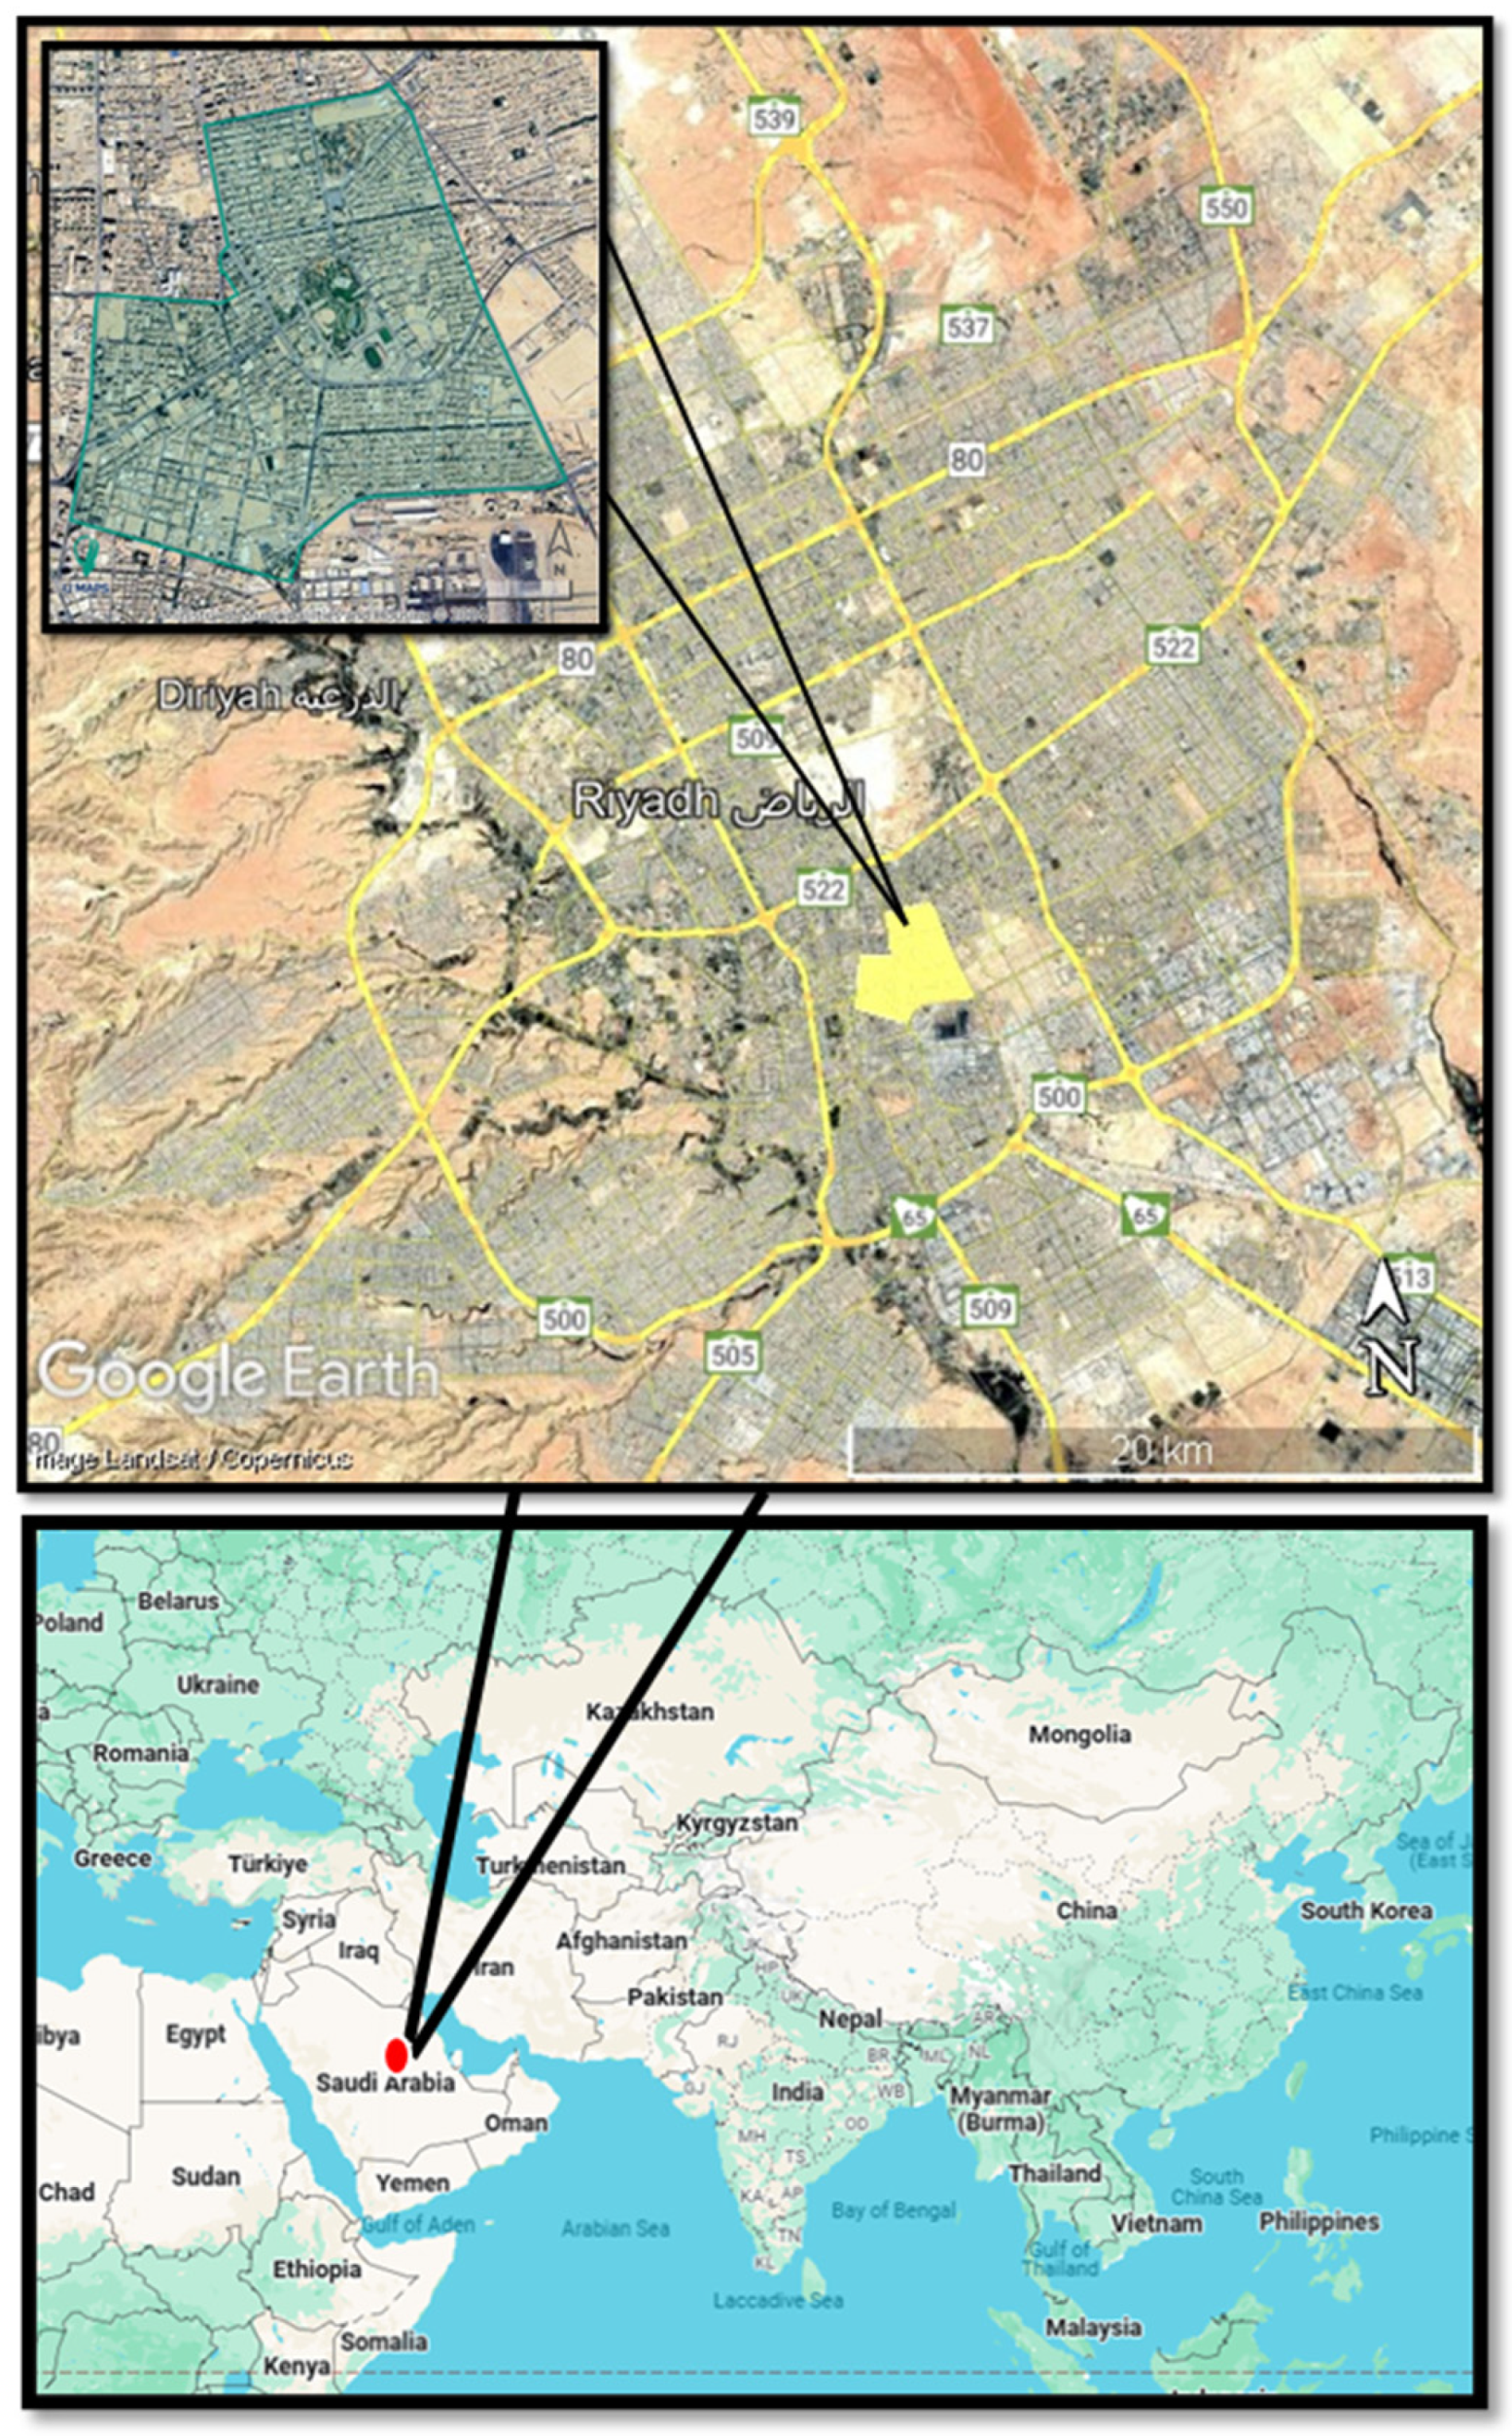
Figure 2.
Wind rose for: a) overall period, b) cool period, c) warm period.
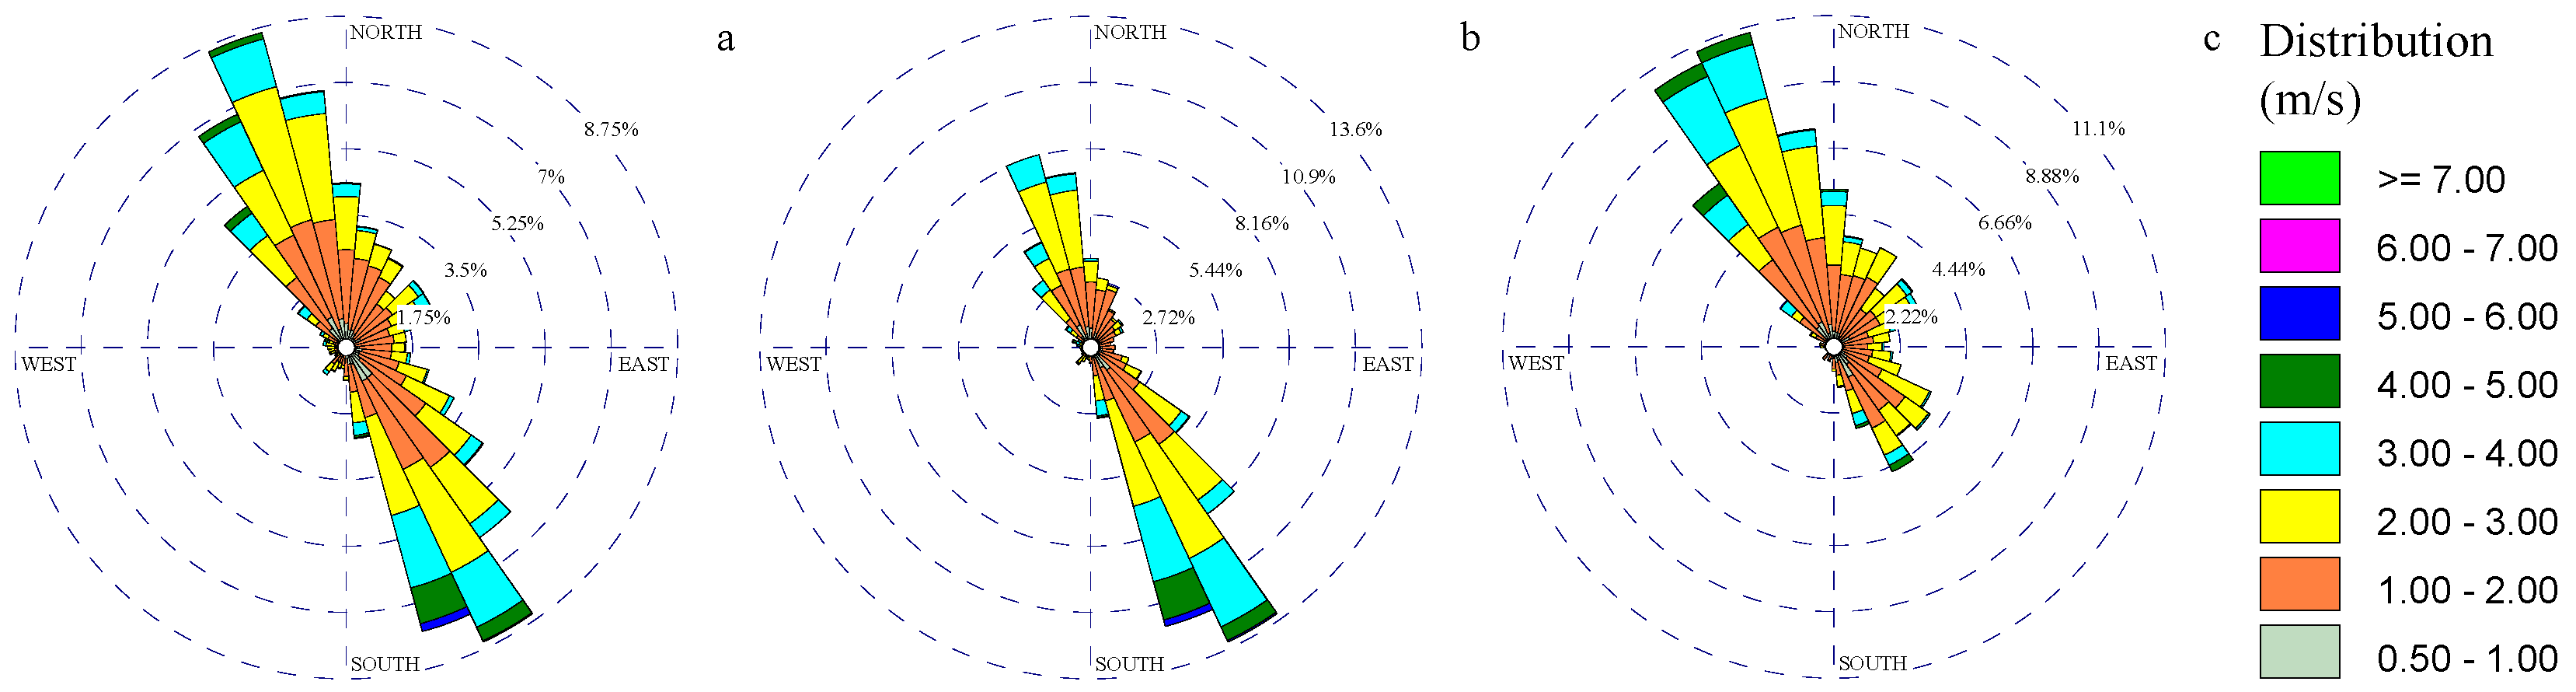
Figure 3.
O3 roses for: a) overall period, b) cool period, c) warm period.
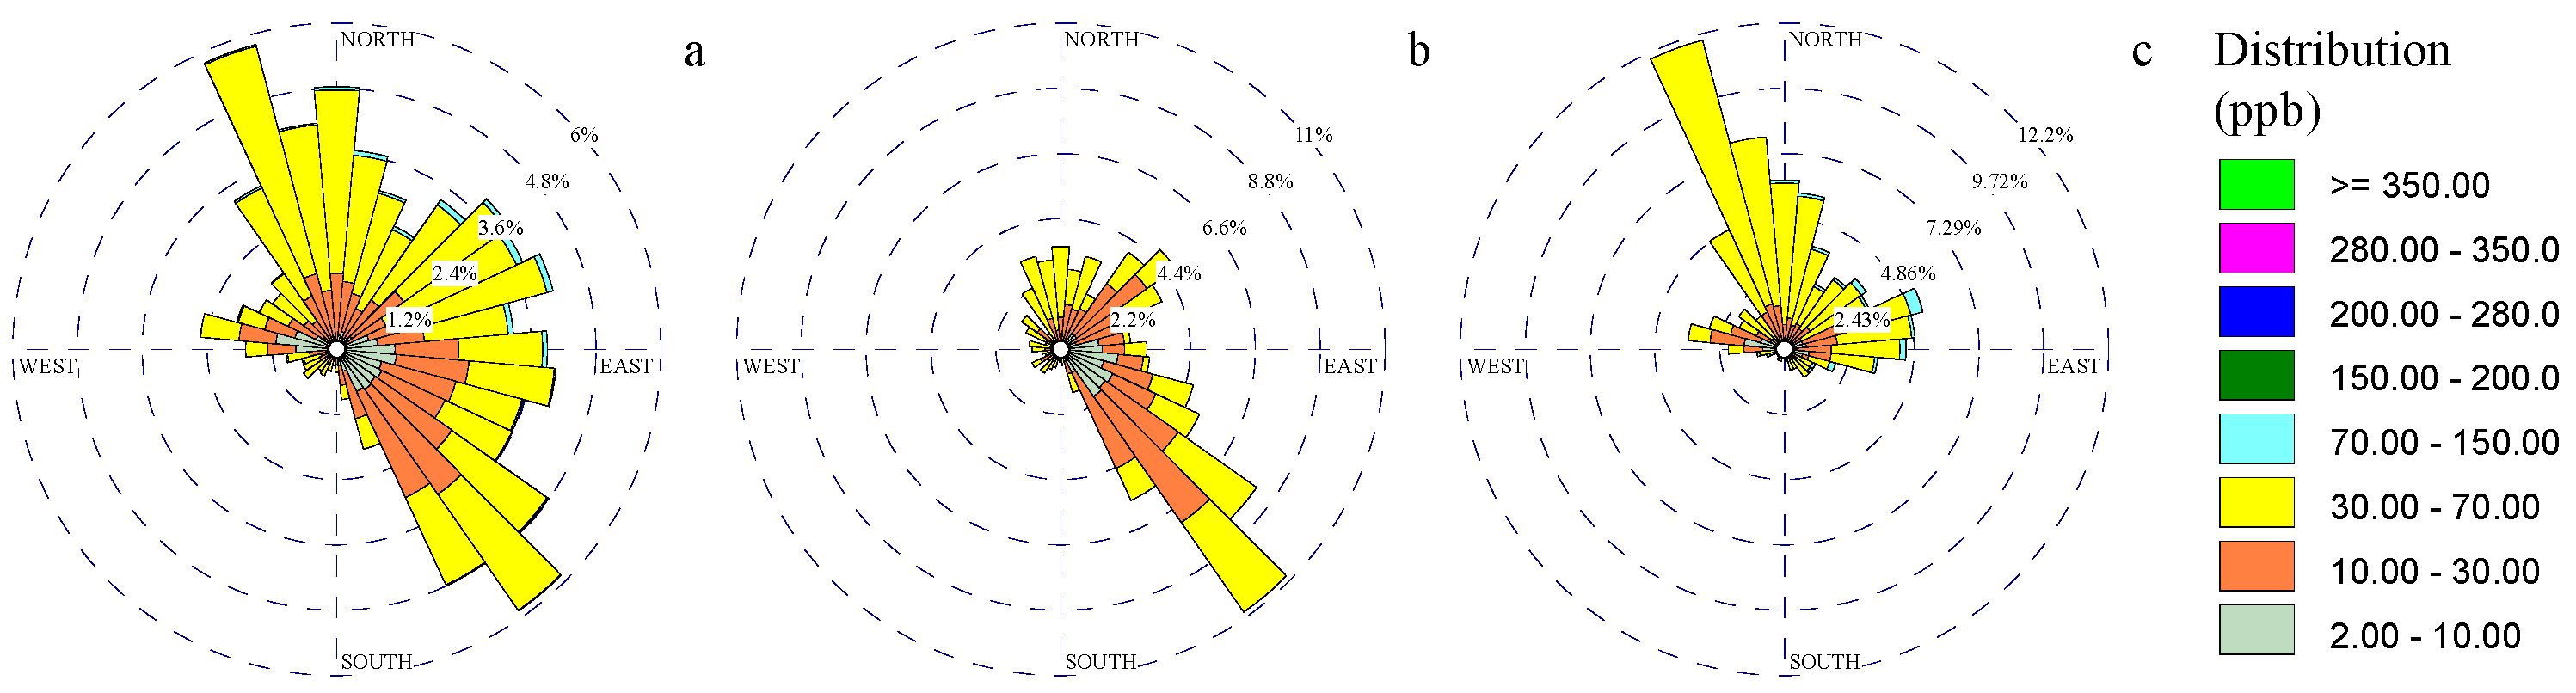
Figure 4.
NO2 roses for: a) overall period, b) cool period, c) warm period.
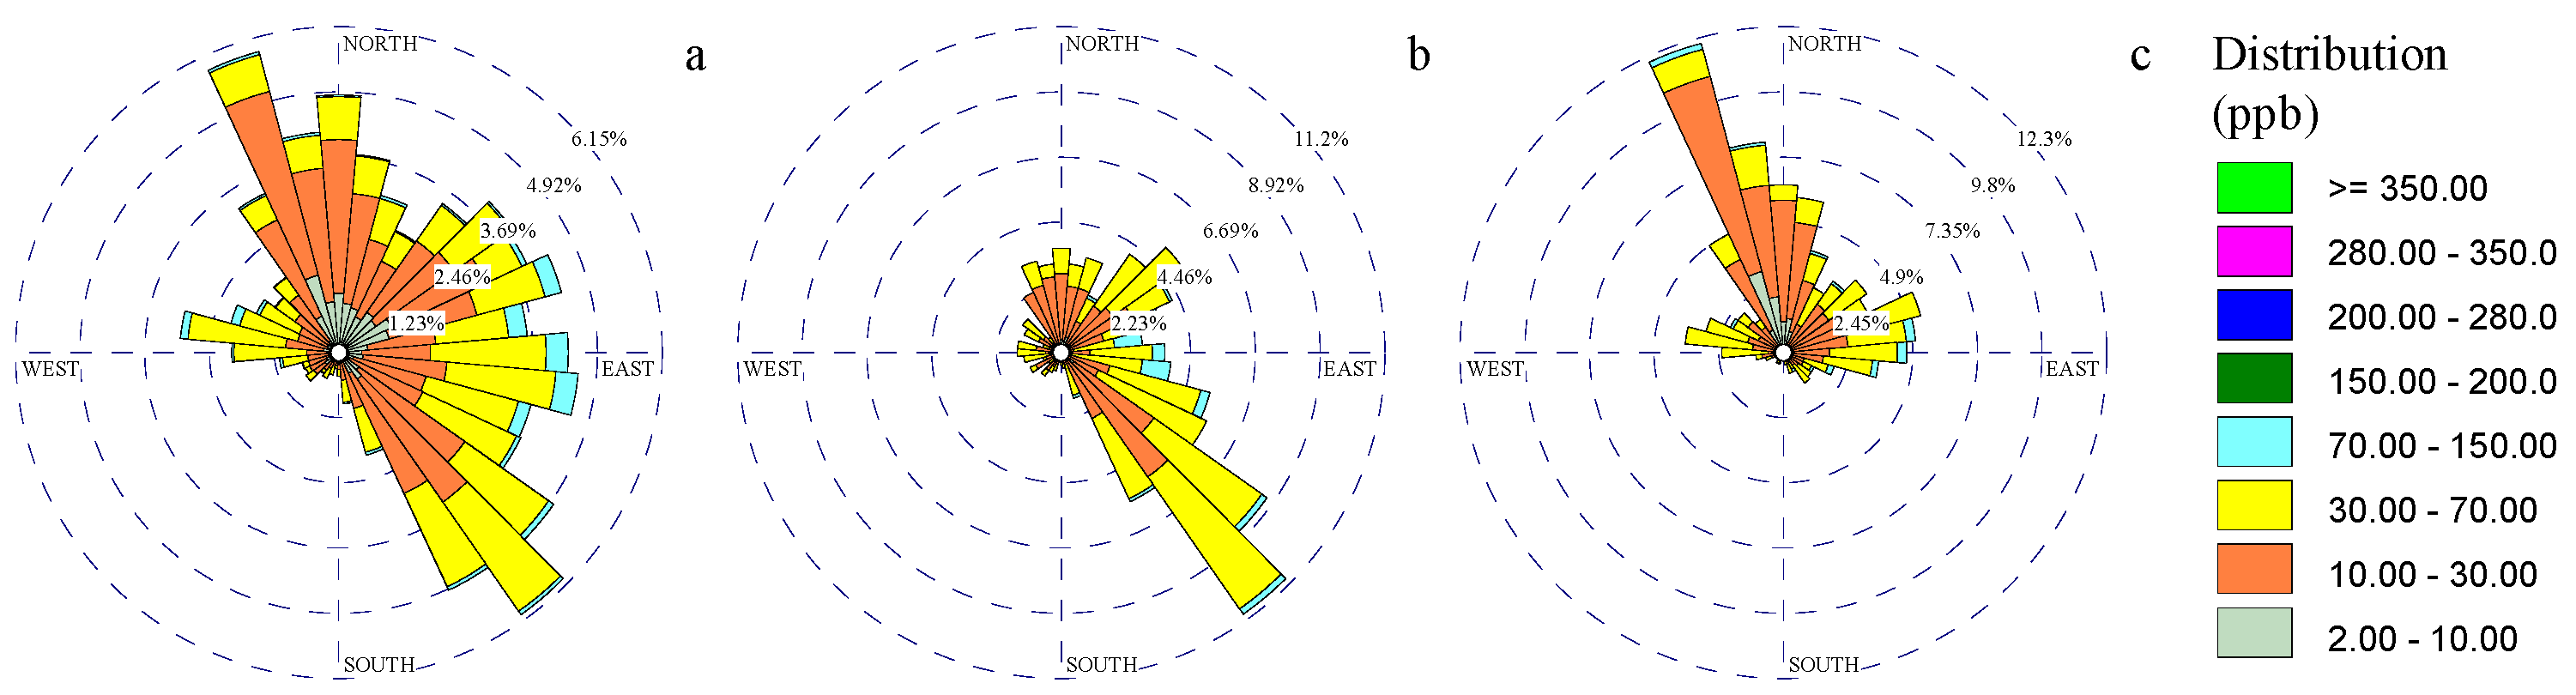
Figure 5.
A pollutants rose for the overall period for: a) TOLU, b) SO2, c) CO.
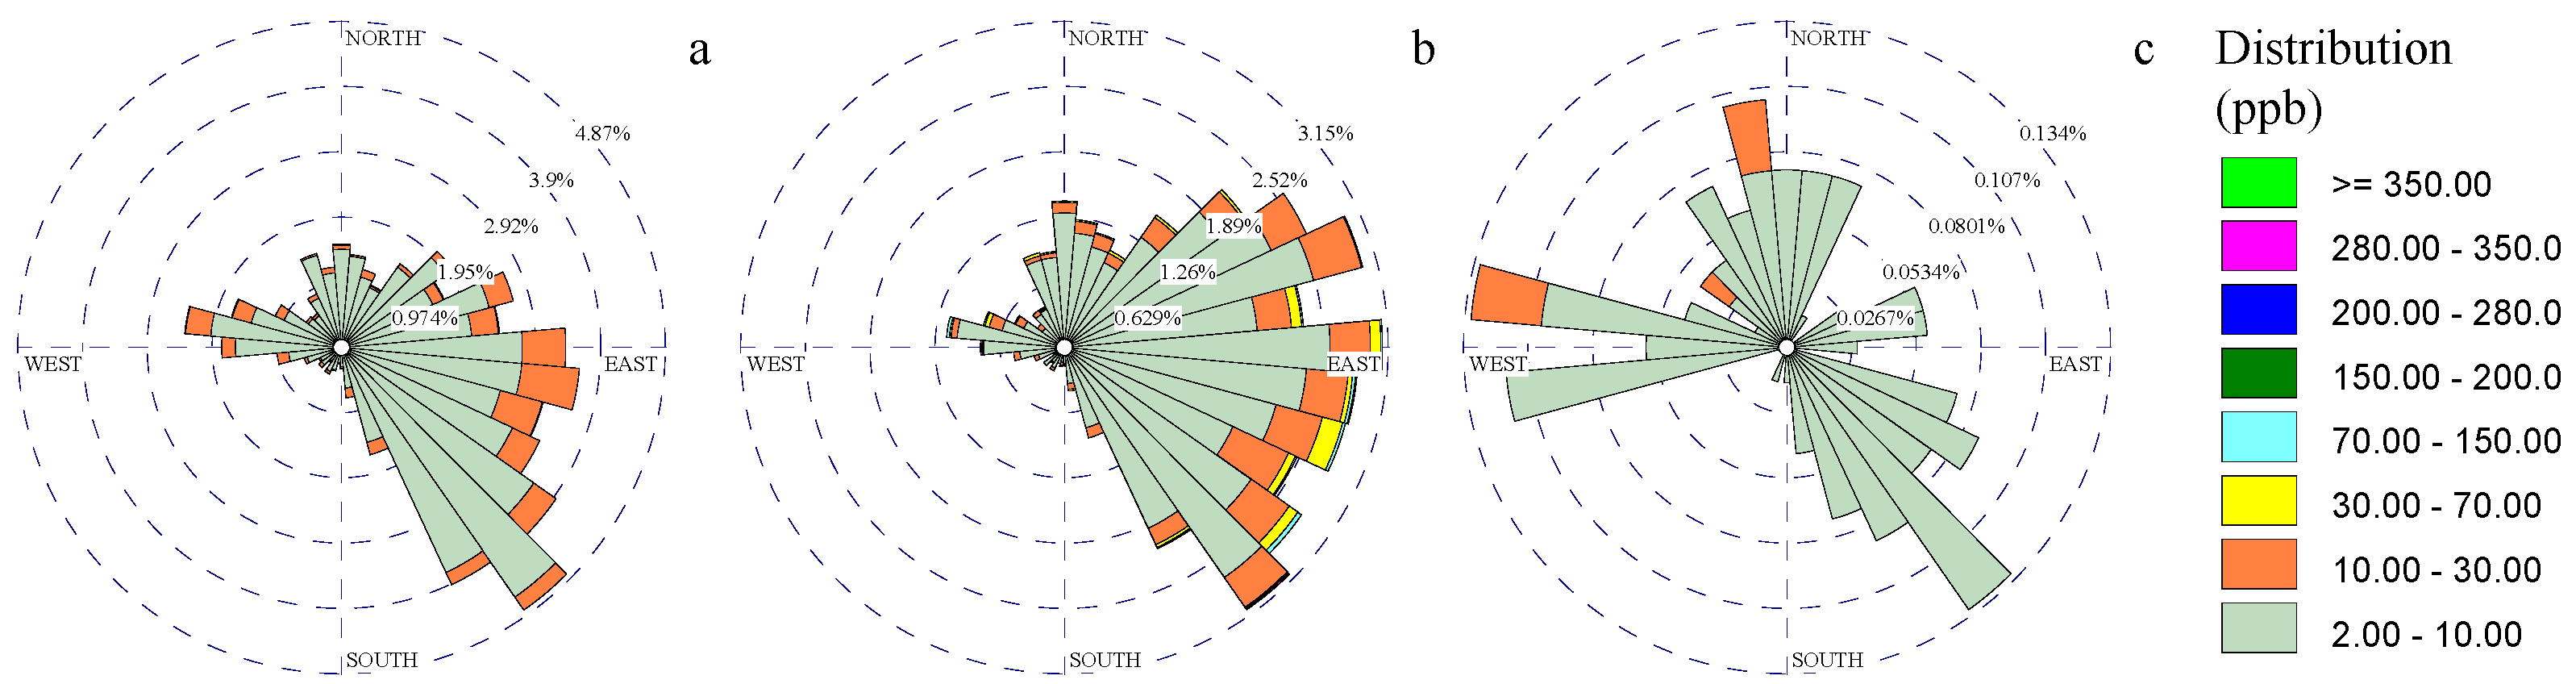
Figure 6.
PM2.5 roses for: a) overall period, b) cool period, c) warm period.
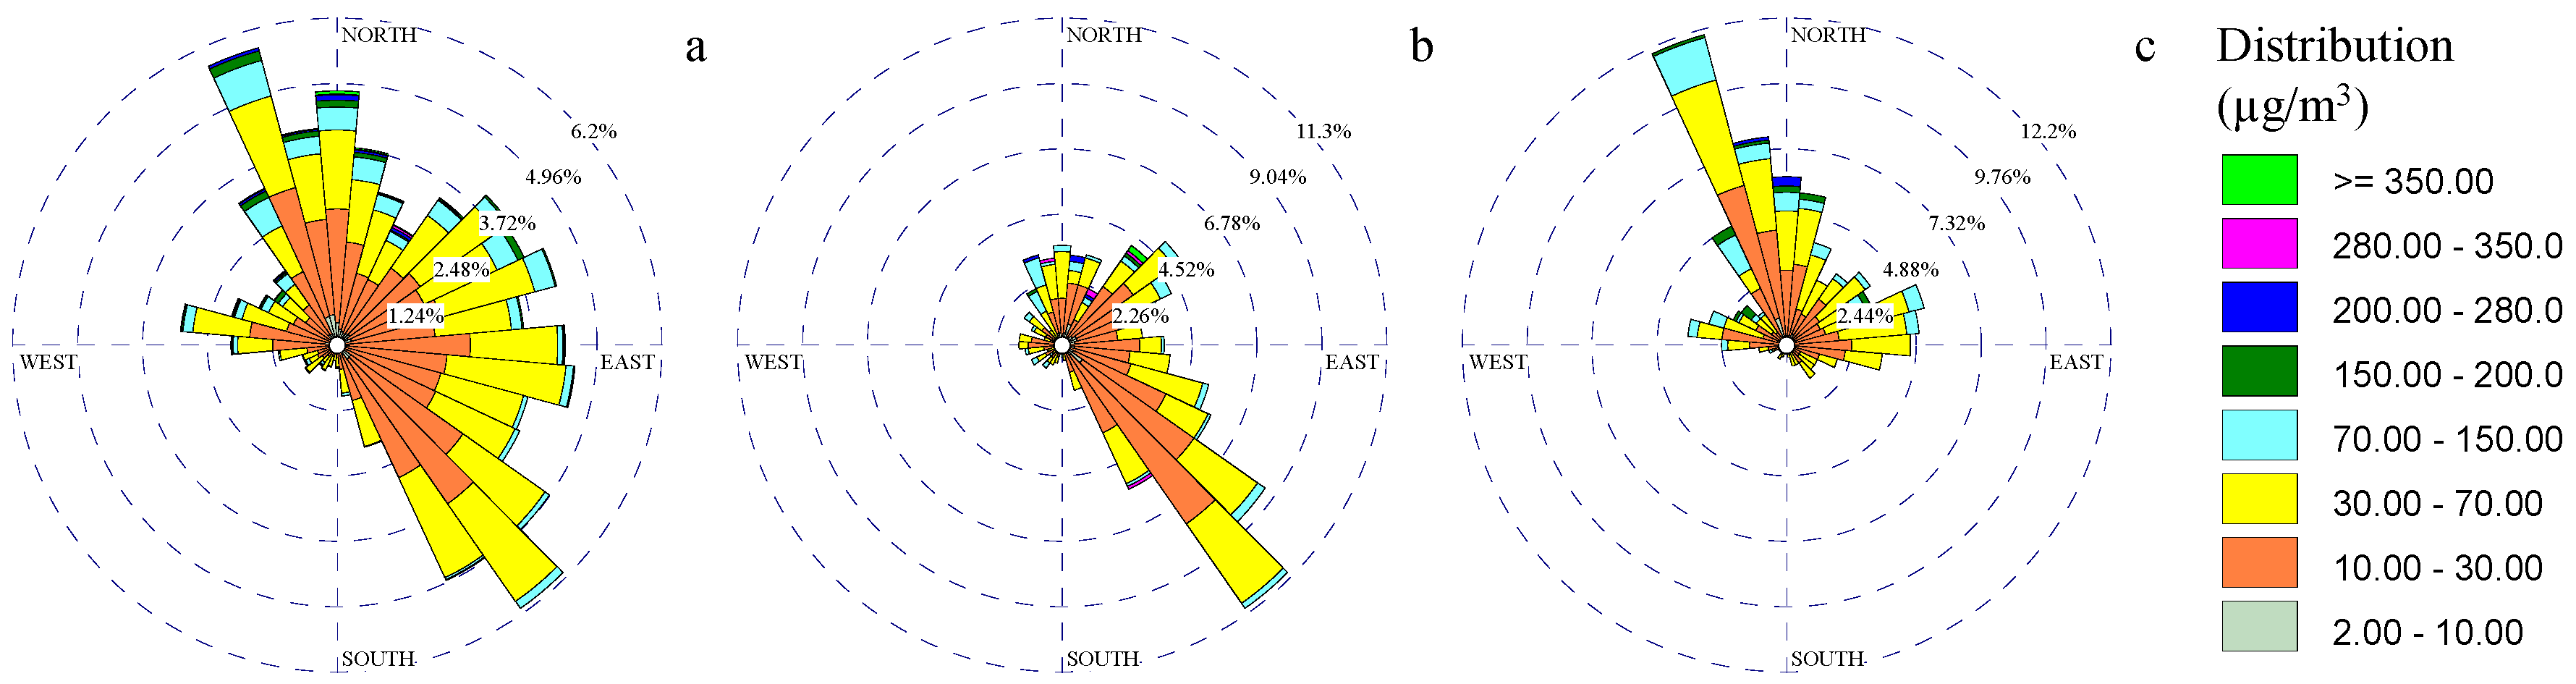
Figure 7.
PM10 roses for: a) overall period, b) cool period, c) warm period.
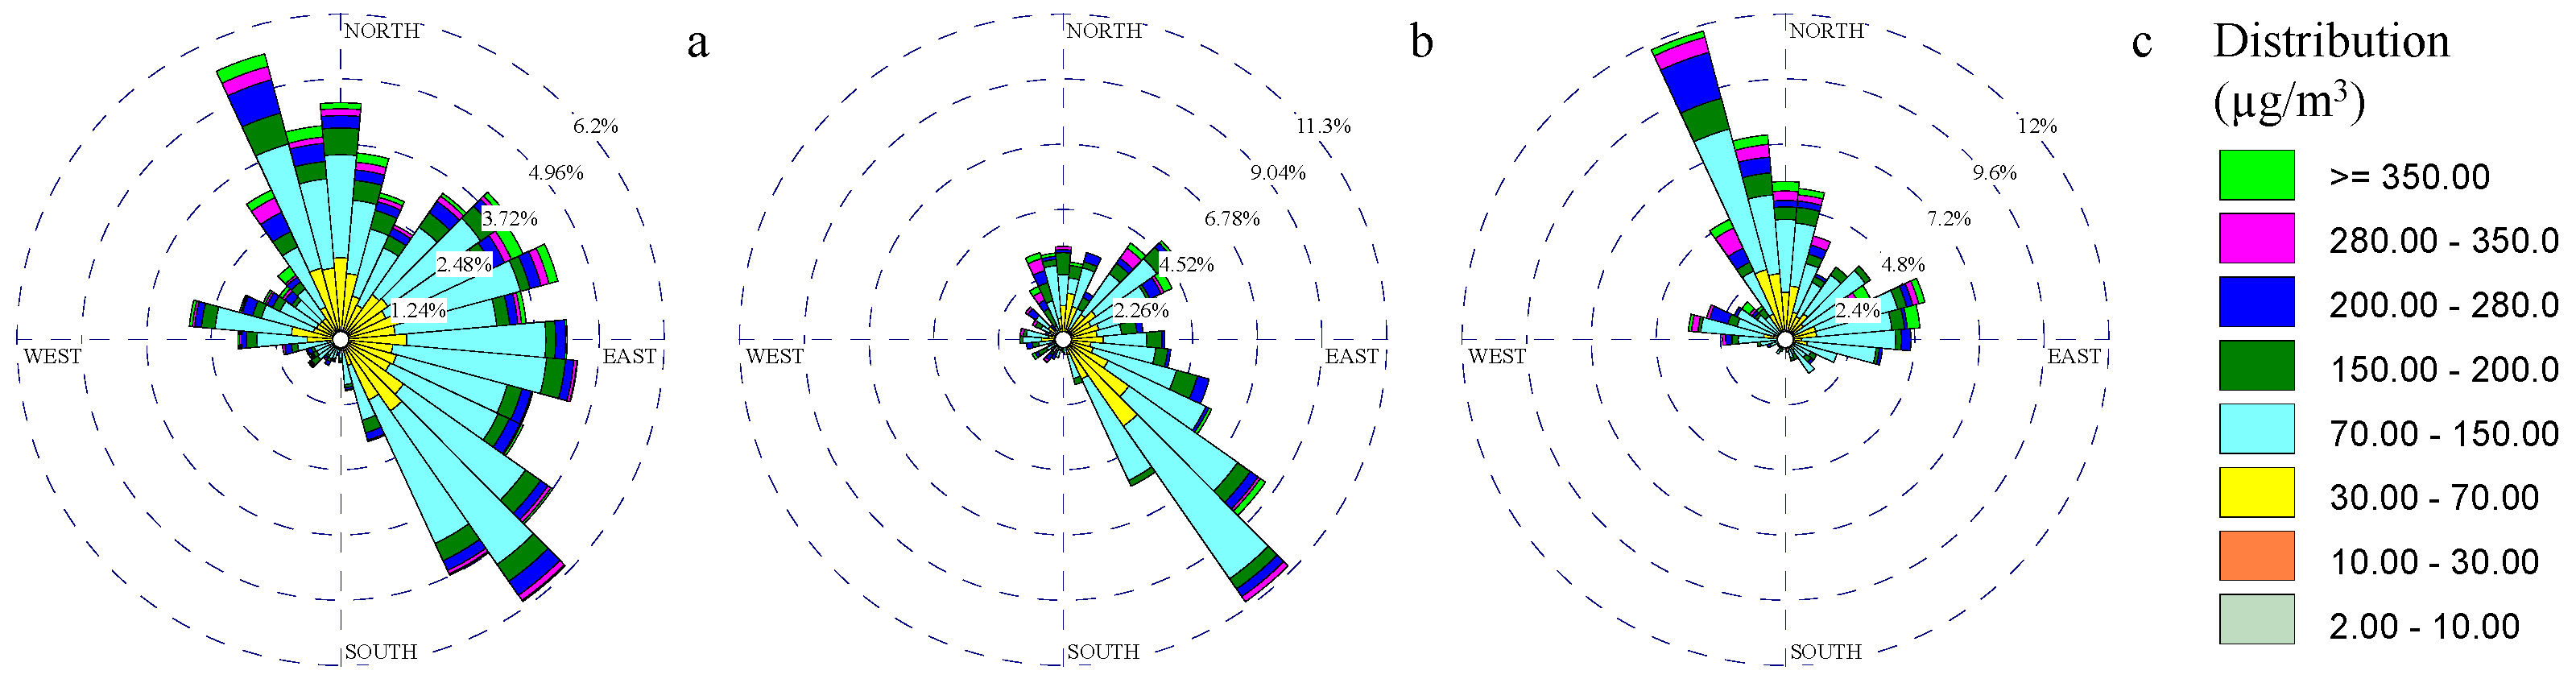
Figure 8.
PM10 toxcity roses using DTT assay for: a) overall period, b) cool period, c) warm period.
Figure 8.
PM10 toxcity roses using DTT assay for: a) overall period, b) cool period, c) warm period.
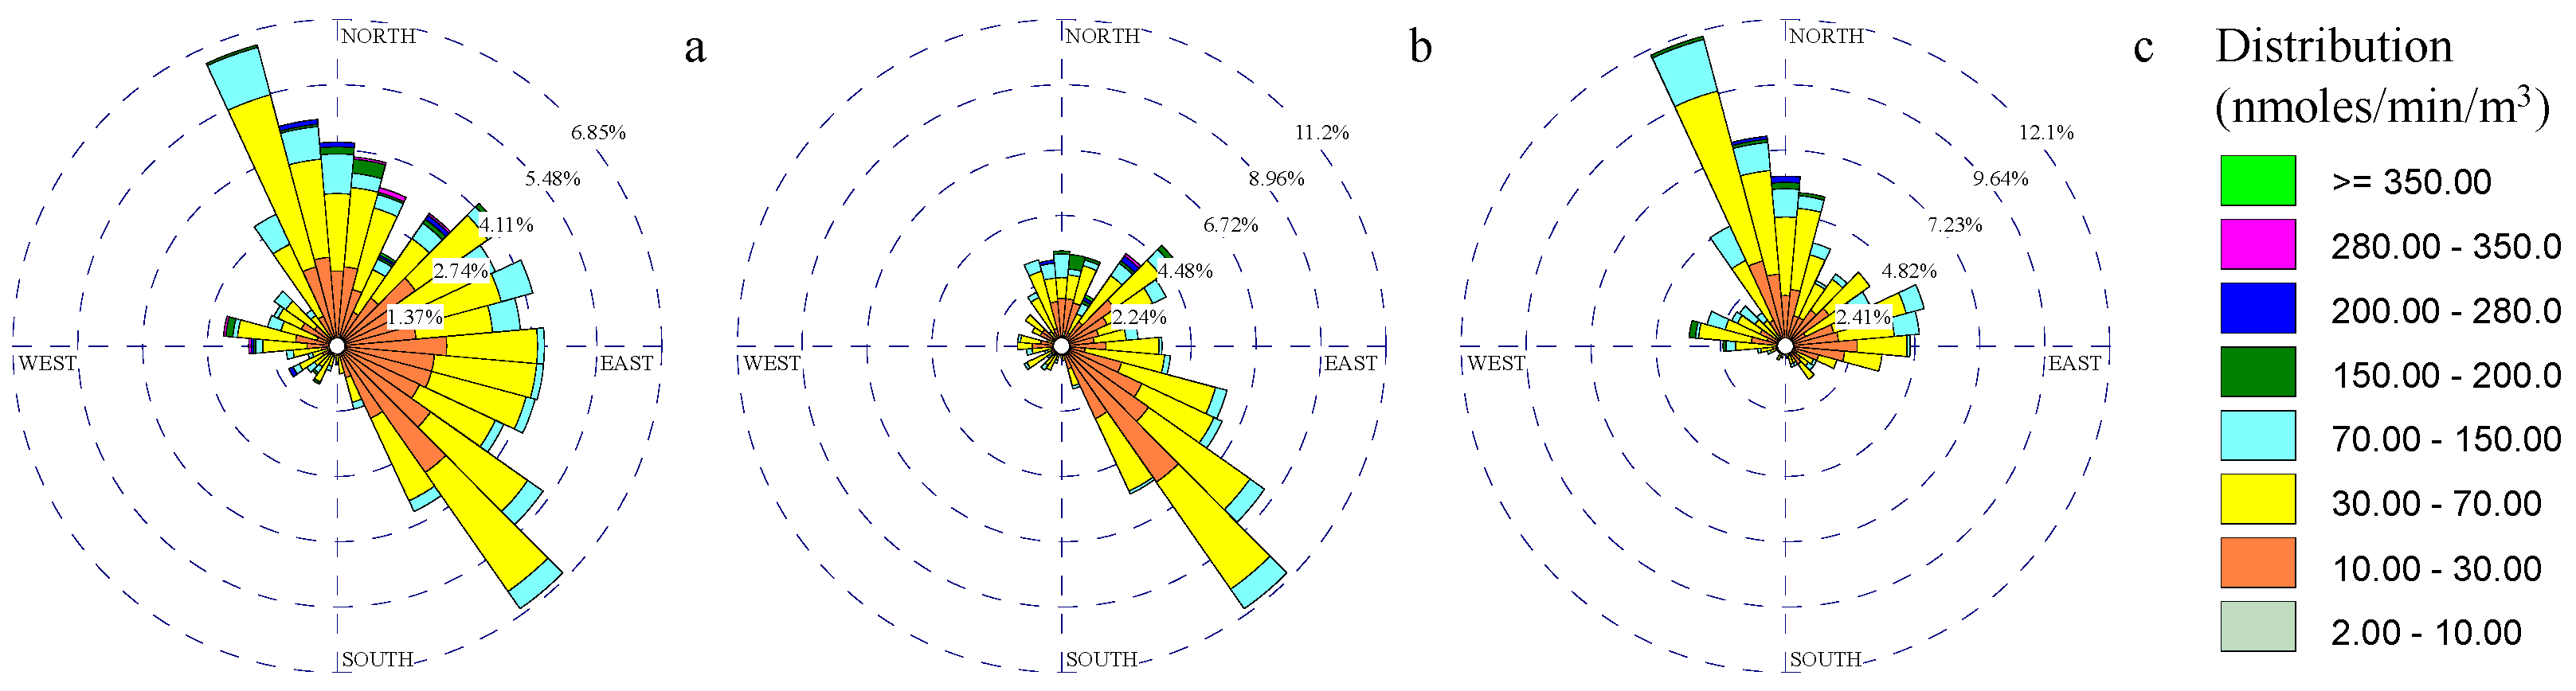
Figure 9.
PM10 rose for three different daily period: a) 06:00-11:00, b) 12:00-17:00, c) 18:00-23:00.
Figure 9.
PM10 rose for three different daily period: a) 06:00-11:00, b) 12:00-17:00, c) 18:00-23:00.
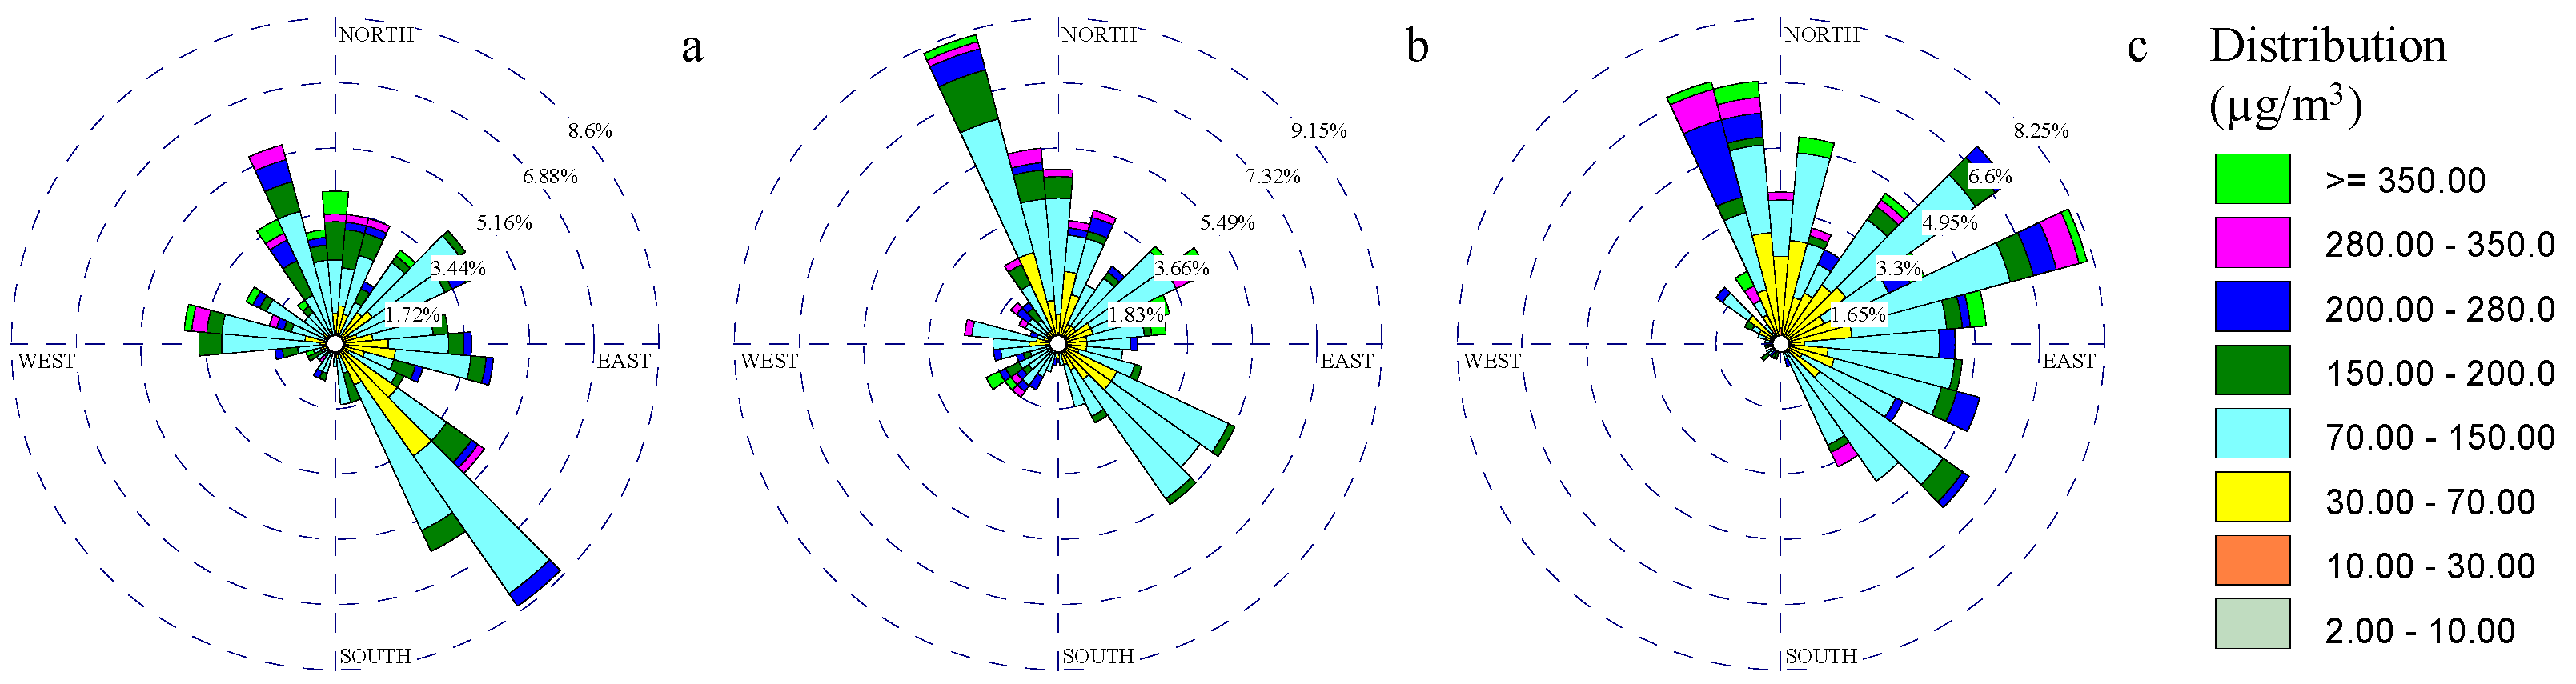
Figure 10.
PM10 toxcity rose using DTT assay for three different daily period: a) 06:00-11:00, b) 12:00-17:00, c) 18:00-23:00.
Figure 10.
PM10 toxcity rose using DTT assay for three different daily period: a) 06:00-11:00, b) 12:00-17:00, c) 18:00-23:00.
Disclaimer/Publisher’s Note: The statements, opinions and data contained in all publications are solely those of the individual author(s) and contributor(s) and not of MDPI and/or the editor(s). MDPI and/or the editor(s) disclaim responsibility for any injury to people or property resulting from any ideas, methods, instructions or products referred to in the content. |
© 2025 by the authors. Licensee MDPI, Basel, Switzerland. This article is an open access article distributed under the terms and conditions of the Creative Commons Attribution (CC BY) license (http://creativecommons.org/licenses/by/4.0/).
Copyright: This open access article is published under a Creative Commons CC BY 4.0 license, which permit the free download, distribution, and reuse, provided that the author and preprint are cited in any reuse.


