
Submitted:
01 April 2025
Posted:
23 April 2025
You are already at the latest version
Abstract
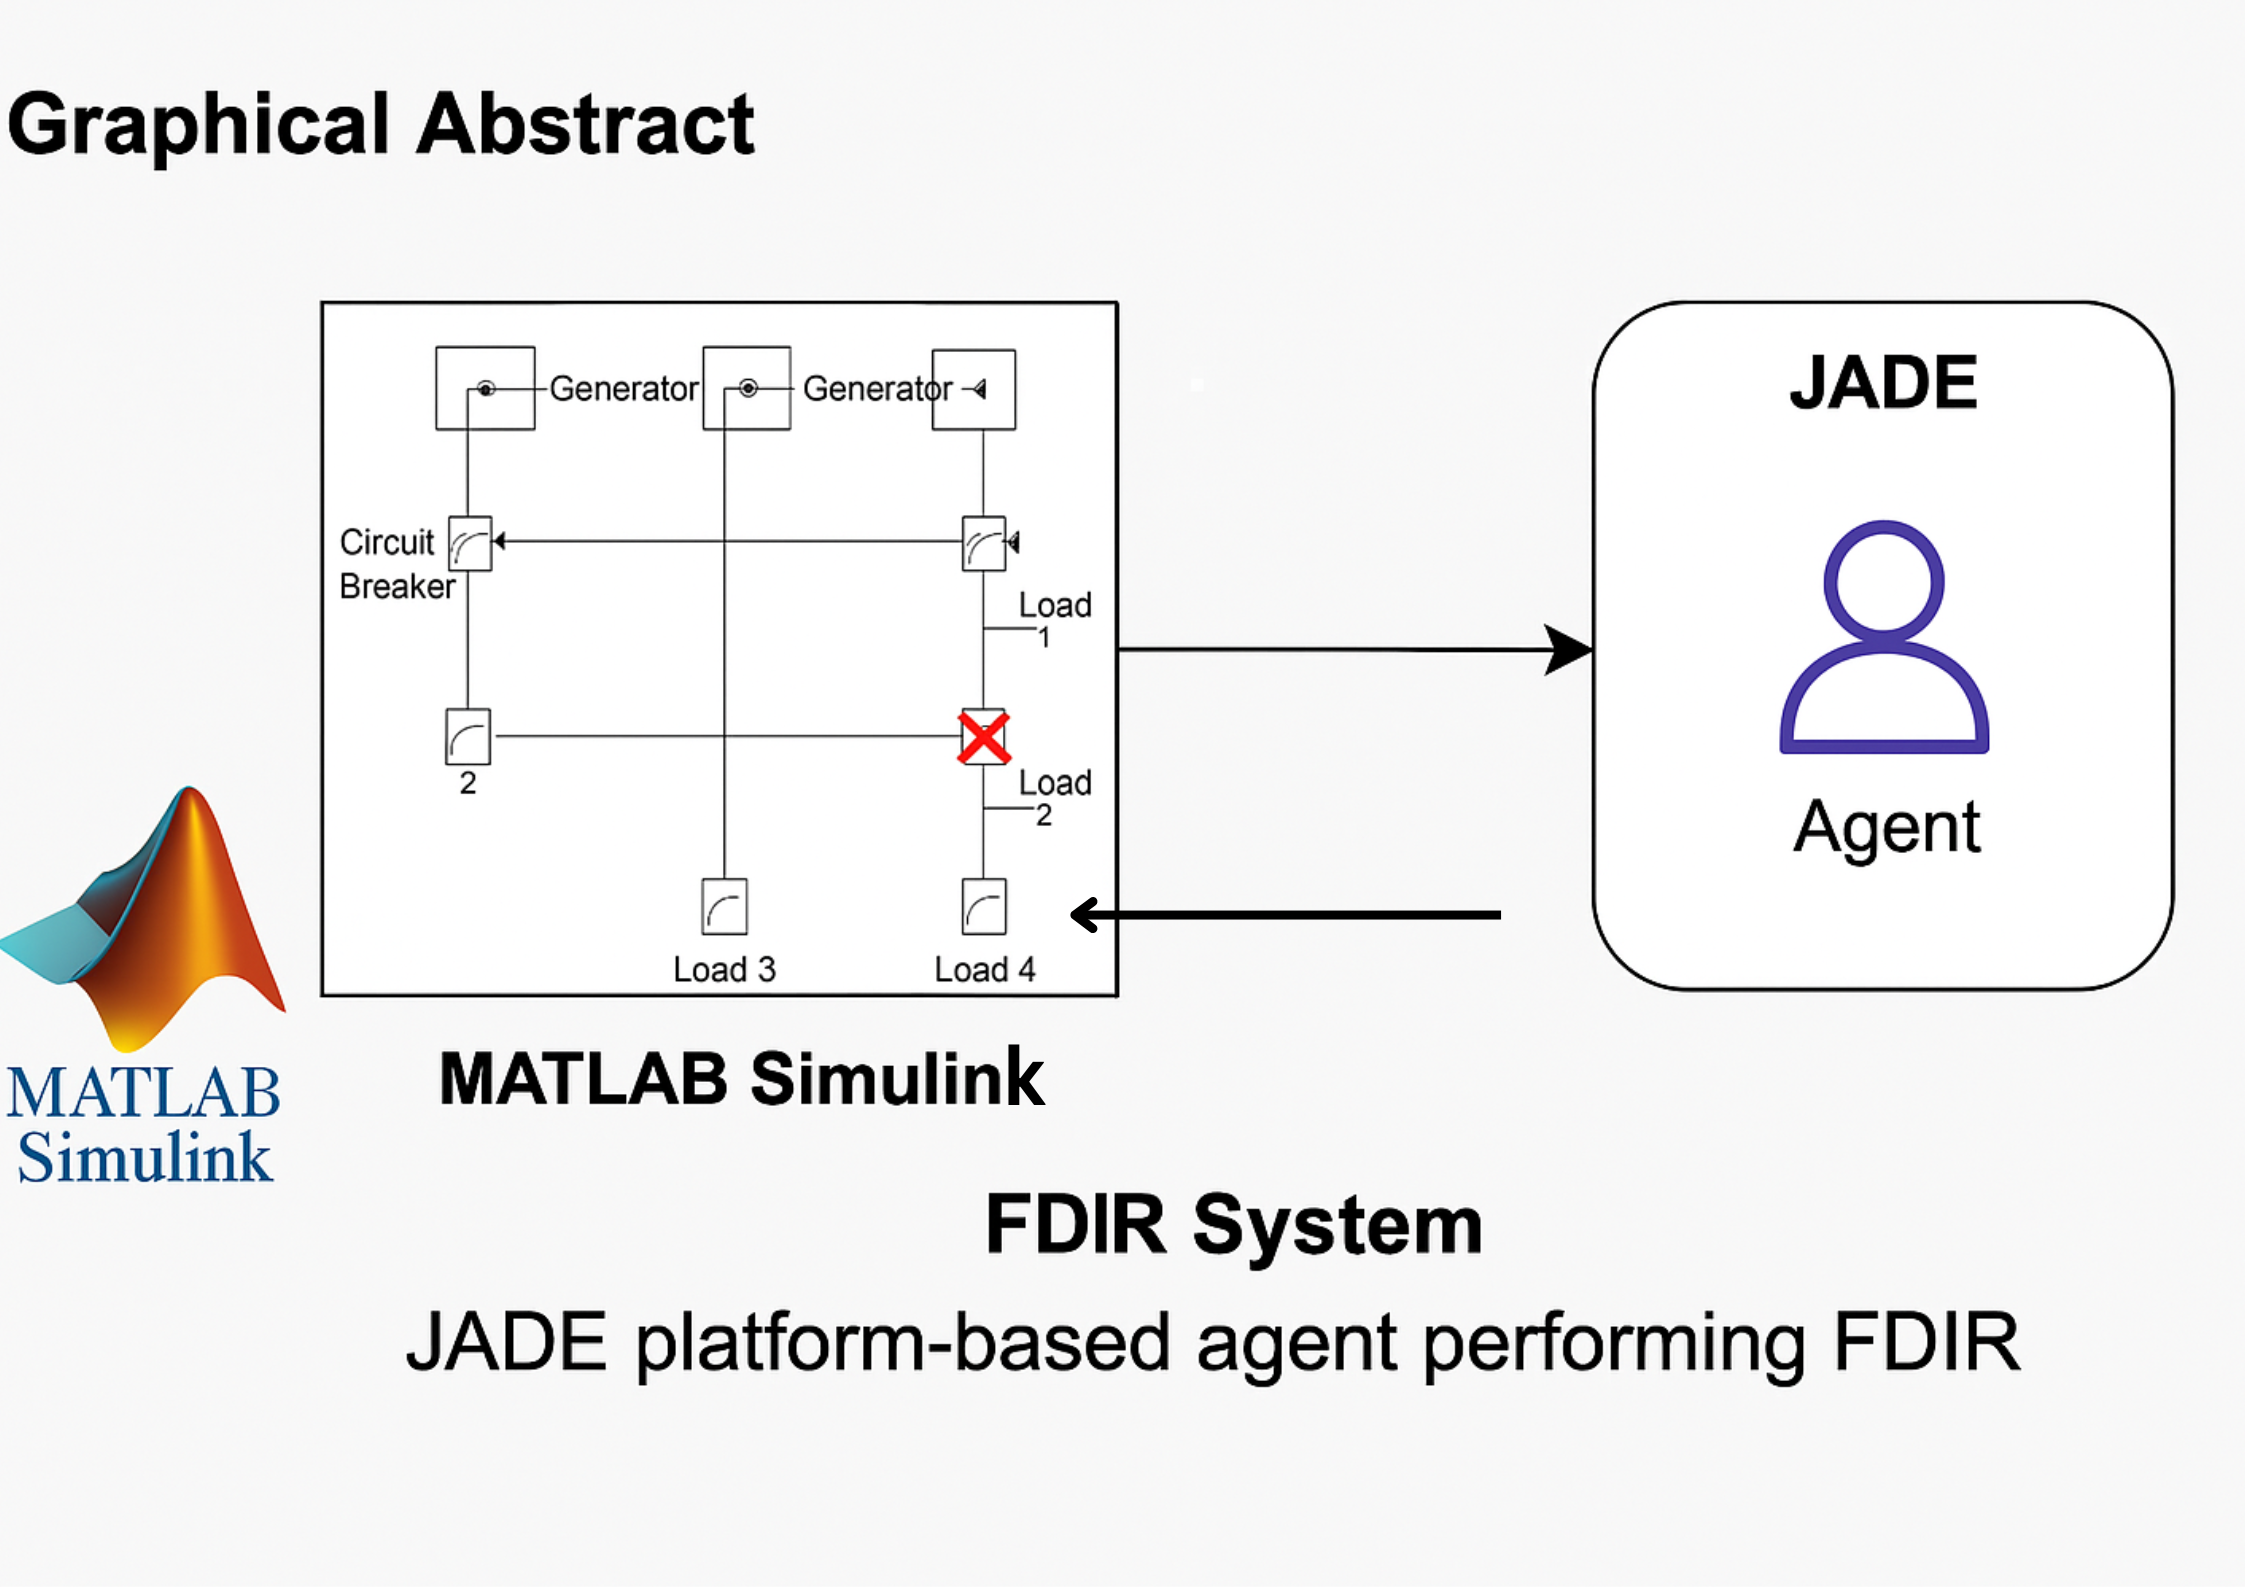
This paper introduces a novel architecture for a Multi-Agent System (MAS) designed to enhance self-healing capabilities within smart power distribution systems. As power distribution networks grow increasingly complex and laden with intercon- nected renewable energy sources, ensuring stability and reliability in the face of faults becomes paramount. Our approach integrates the Java Agent Development Environment (JADE) with MATLAB/Simulink, facilitating a robust simulation environment where dynamic fault scenarios can be tested and analyzed. The proposed system utilizes Fault Detection, Isolation, and Restoration (FDIR) techniques to automate the process of fault management. Through the implementation of MAS, the system autonomously detects faults, isolates damaged sections, and reroutes power to minimize service interruptions. The effectiveness of this architecture was validated through detailed simulations on a nine-bus distribution network model and a practical hardware implementation using Raspberry Pi, demonstrating the system’s capability to significantly reduce outage times and improve the reliability of power delivery. Key results indicate that the MAS effectively manages and restores power with minimal human intervention, showcasing a significant reduction in the duration and impact of outages. This research not only contributes to the theoretical framework of smart grid resilience but also provides a scalable model for future smart grids that incorporate extensive use of renewable energy sources and require high levels of automation in fault management
Keywords:
Smart Grid
; Self Healing
; JADE
; Multi-Agent20
1. Introduction
The smart grid is an efficient electrical system that incorporates the current electrical infrastructure and IT communication technologies for supporting all the future electrical needs [2]. The fundamentals of Smart Grid include the integration of renewable energy, definitions, architecture, formulation of performance requirements, discussion of the development of analytical and decision support tools, [3]. One of the key research subjects of smart grid technology is self-healing which is the key function for reliable and high-quality power supply [4]. A wide range of applications requiring flexibility and adaptability uses Multi Agent Systems with a rapidly changing environment due to their distributed nature, modularity, and ease of implementation [5].The self-healing capability of a smart grid is capable of preventing or mitigating power quality issues, power outages, and service disruptions by utilising real-time data from embedded sensors and automated controls to identify, predict, and address systemic issues. It is possible for a multi-agent system (MAS) to regulate the Self-Healing Grid [6]. The self-healing system is composed of three distinct layers: problem recognition, fault diagnosis, and corrective action [7]. Agent-based computation has been the subject of research within the domain of distributed artificial intelligence for a number of years. The technology is implemented in various sectors, including protection systems, strategic power infrastructure defence systems, energy management systems, transformer status monitoring systems, power markets, and power system restoration [8]. The agent communication specifications established by FIPA (Foundation for Intelligent Physical Agents) govern agent communication protocols, messages, message exchange protocols, communicative activities, and agent communication language. Programmed agents utilise specialised platforms like JADE (Java Agent Development Environment). An effective Smart Grid must possess an abundance of data, be instrumented, integrated, and networked, and be controlled as a unified "end to end" system [9]. The foundational concept of a Smart Infrastructure is to transform the current centralised electrical grid into one that is decentralised, deregulated, and consumer-friendly. By merging control and communication systems with modern sensing technologies, a smart grid incorporates information and communication technology into power generation, distribution, and consumption, thereby making it more environmentally friendly, dependable, and efficient. Self-healing is an essential attribute that is sought after in order to automate the system’s recovery procedure.
A self-restoration system is capable of consistently mitigating power outages, power quality issues, and power disruptions by utilising real-time data from a variety of embedded sensors located in different locations (termed agents) and automated controls to predict, identify, and respond to the issues. Achieving the full potential of smart grids is contingent upon the accurate expansion of the Smart Grid Communications Network (SGCN) [10]. It is capable of supporting every smart grid function, including self-healing. In order to maintain elevated levels of dependability, the wireless networking and communication protocols incorporated into the smart grid system must also possess exceptional self-healing capabilities. The FDIR (Fault Detection Isolation and Restoration) method facilitates self-healing by redirecting power from alternative feeders to the affected section of the feeder while a fault is present [11]. This isolates only the faulty portion of the feeder and prevents power from reaching it until the fault is rectified. A self-healing protection mechanism is introduced for the distribution side in this paper. The FDIR technique is employed to develop self-healing characteristics [1]. Analyses are conducted and a 9-bus distribution network with self-healing capabilities is modelled utilising the appropriate tools. An analysis of the loads impacted by power outages caused by faults is conducted both prior to and subsequent to the deployment of FDIR. A deeper explanation of a hardware-implemented agent-based system is provided.
- Scenario 1: Dynamic Self-Healing in a 9-Bus Active System This scenario involves simulating a dynamic self-healing process within a 9-bus active system, incorporating eleven loads and four generators. The system utilizes the Fault Detection, Isolation, and Restoration (FDIR) technique to manage faults and ensure the continuity of power supply across the network.
- Scenario 2: Multi-Agent System Simulation Using JADE and MATLAB/Simulink This scenario explores the deployment of a Multi-Agent System (MAS) for self-healing, implemented through simulations in MATLAB/Simulink and JADE (Java Agent Development Environment). This simulation demonstrates the effectiveness of MAS in managing grid resilience and enhancing its adaptive capabilities.
- Scenario 3: Practical Hardware Implementation and Validation Using Raspberry Pi This scenario describes a tangible hardware implementation of the self-healing system using a Raspberry Pi and other components to demonstrate its practical application in real-world environments. This setup not only showcases how physical hardware integrates with intelligent algorithms to manage and restore system faults but also validates the operational capabilities of the system under realistic conditions.
These scenarios collectively underscore the advanced technologies and methodologies that enhance the reliability and efficiency of smart power distribution systems through automated self-healing processes. The remainder of this paper is organized as follows: Section 2, Dynamic Self-Healing in a 9-Bus Active System (Scenario 1), describes the methodology and the tools used for developing the multi-agent system for self-healing in smart power distribution systems. Section 3, Multi-Agent System Simulation Using JADE and MATLAB/Simulink (Scenario 2), discusses the implementation details of the multi-agent system, including simulations and system configurations. Section 4, Practical Hardware Implementation and Validation Using Raspberry Pi (Scenario 3)), details the practical aspects of the system hardware, including the use of current transformers, burden resistors, and Arduino setup. Section 5, Conclusion, summarizes the findings, the effectiveness of the proposed system, and potential areas for future research. Finally, Section 6, References, lists all the bibliographic references used to prepare and support this manuscript.
2. Dynamic Self-Healing in a 9-Bus Active System(Scenario 1)
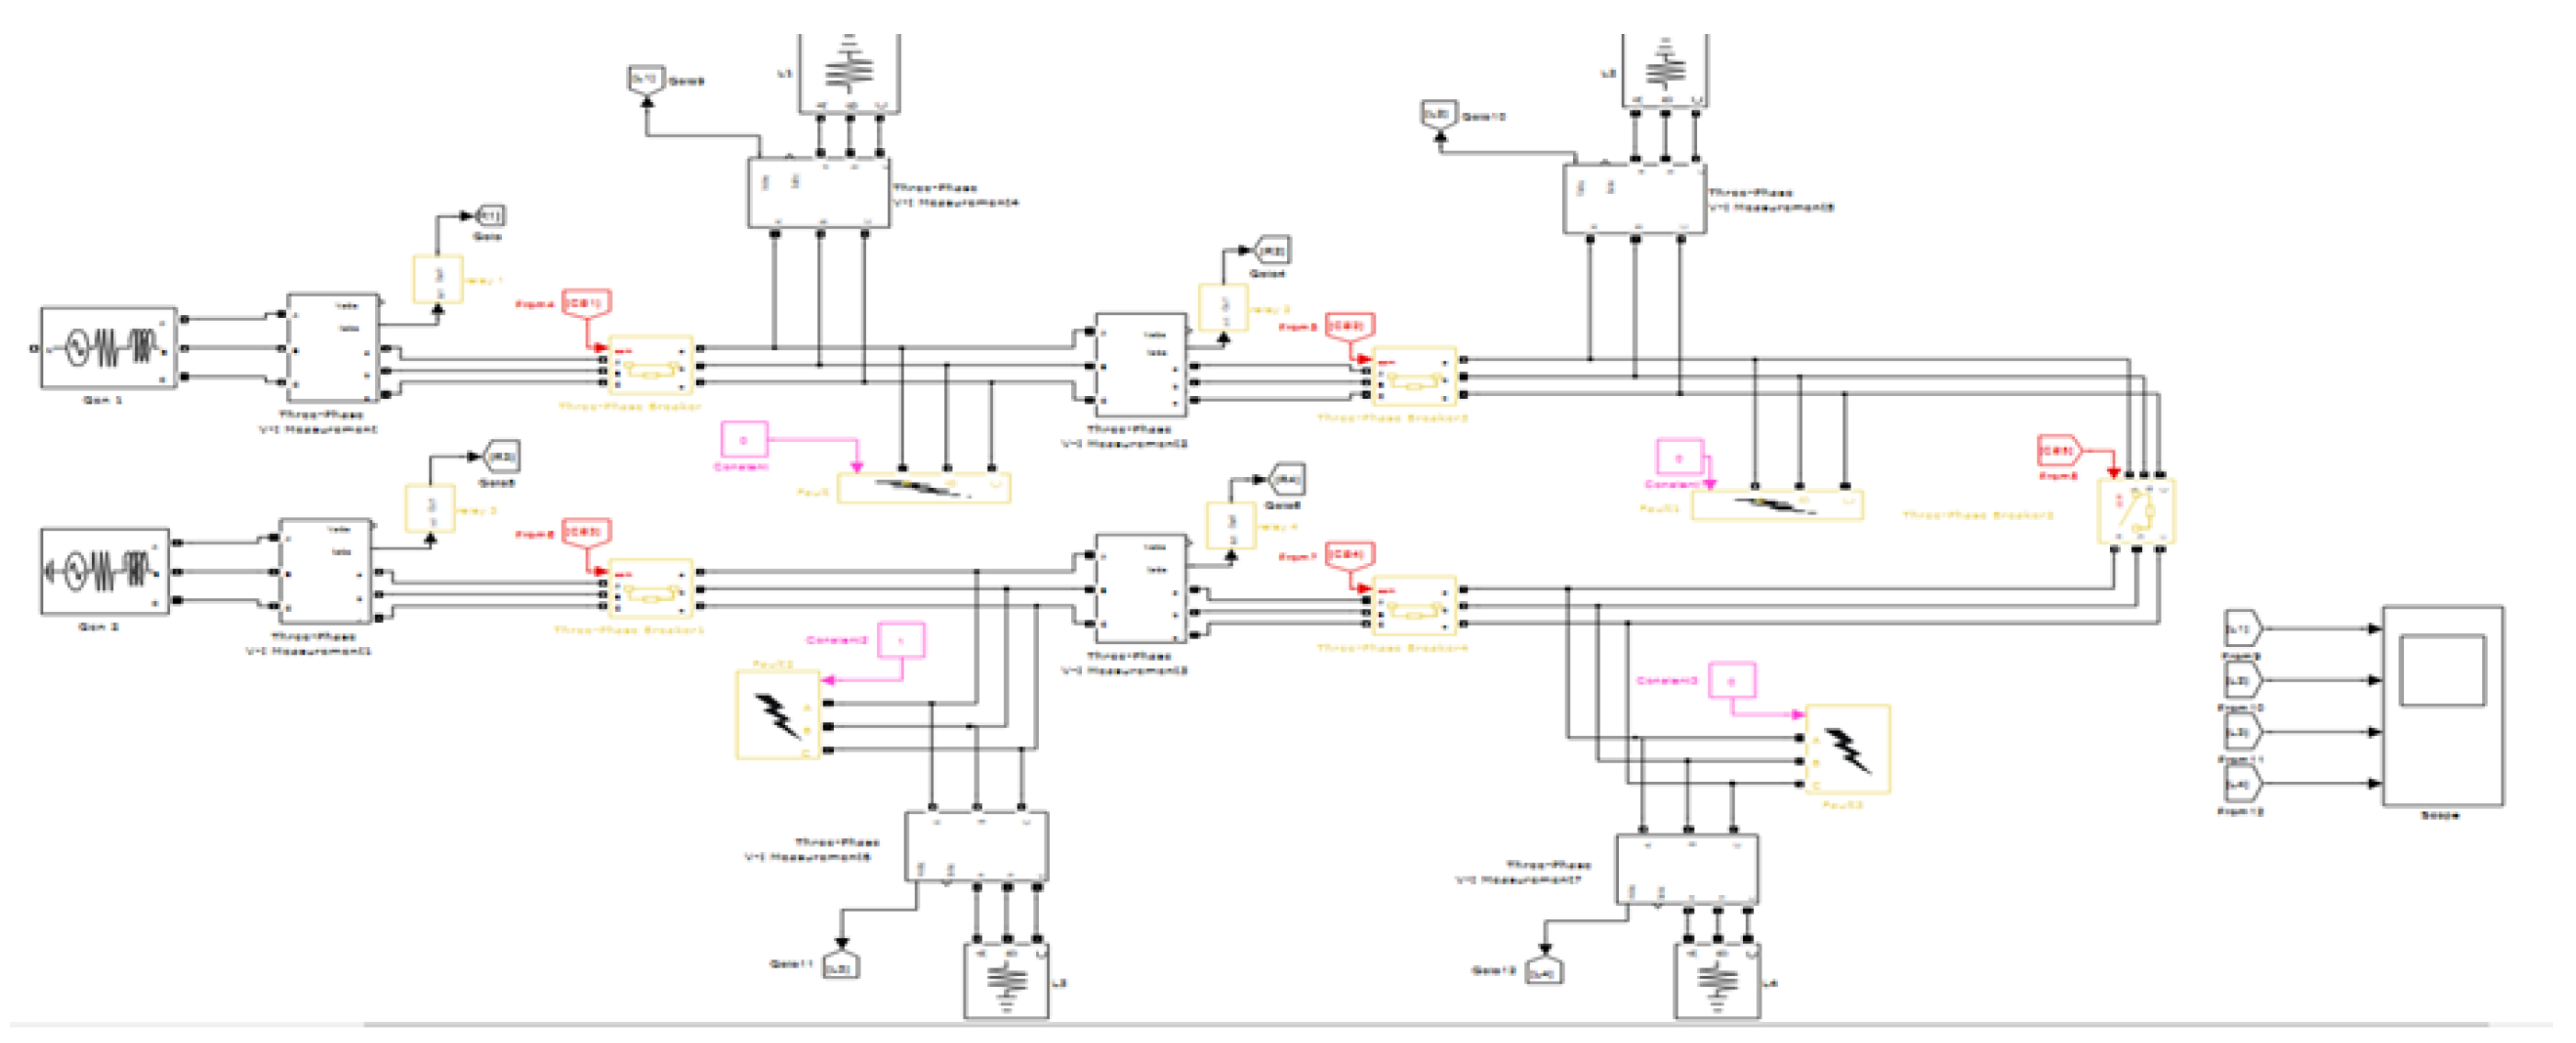
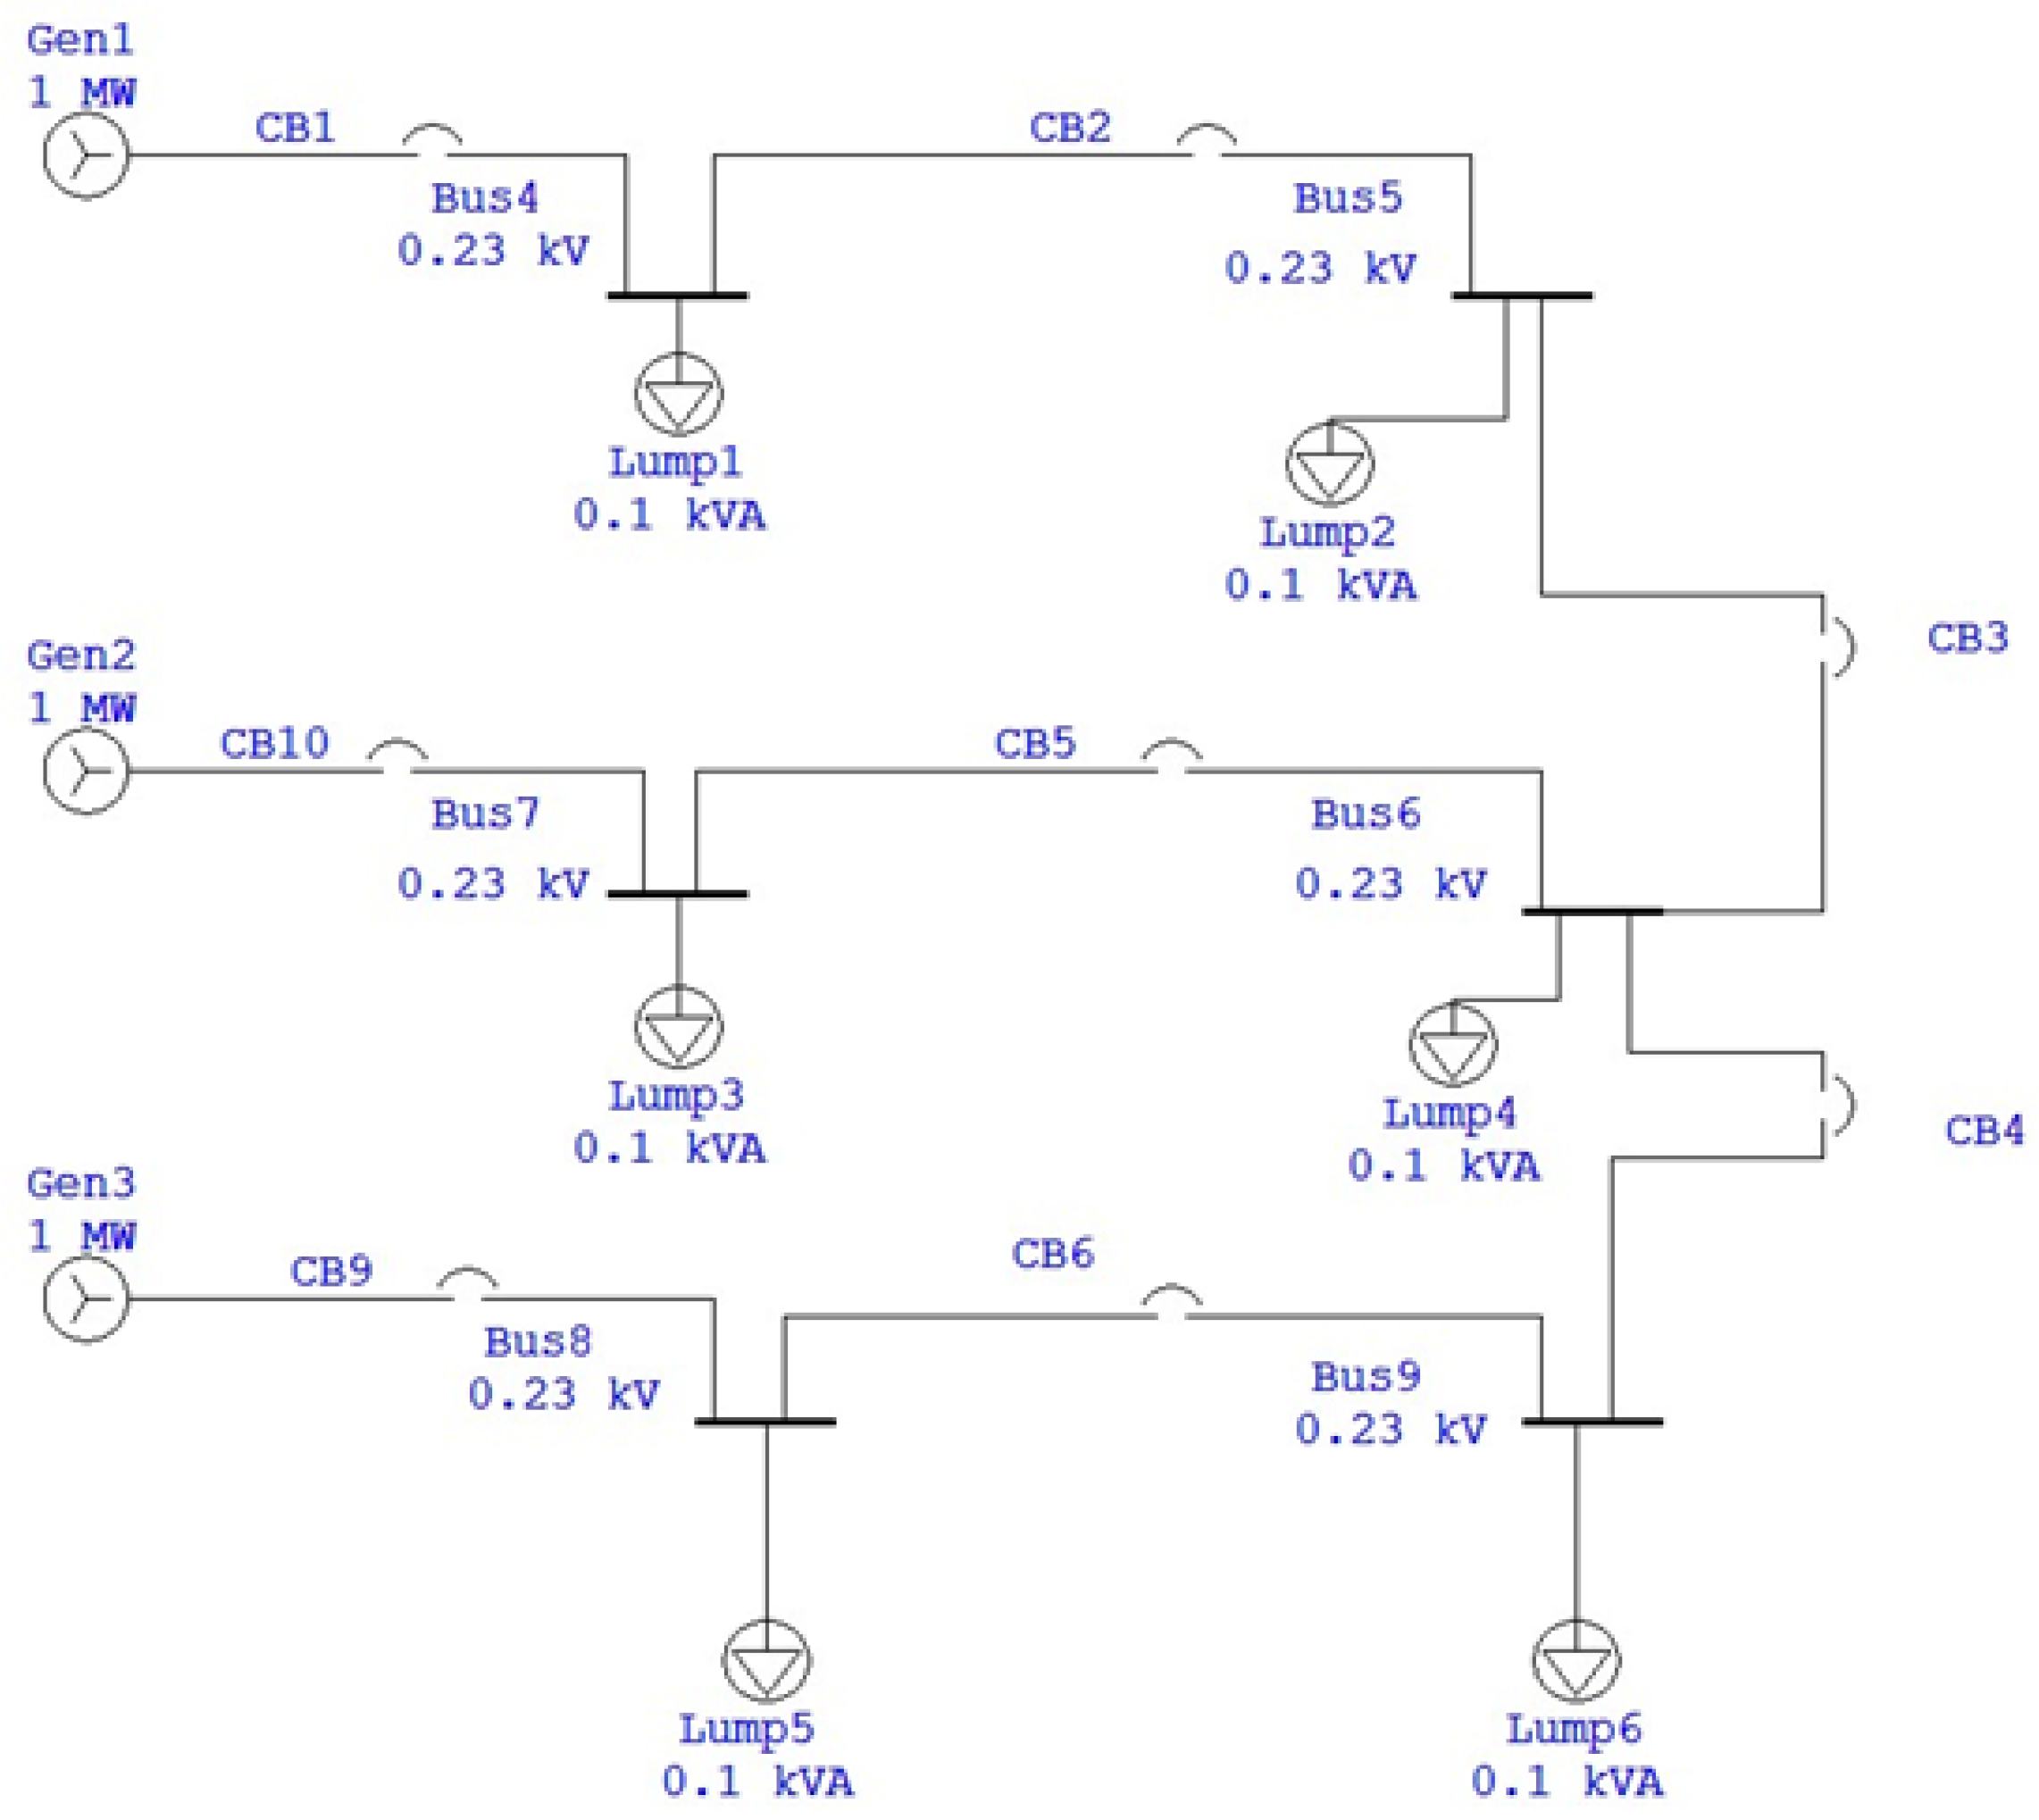
In SIMULINK/MATLAB, a nine-bus active system comprised of eleven loads and four generators is modelled. Six PQ buses and three swing buses comprise the model. The model as a whole consists of three components. The DES is a tiny generator connected to one of the PQ buses (Distributed Energy Source). Four loads comprise the initial segment, which is supplied electricity by the DES and Generator 1. Generator 2 supplies power to Section 2’s four loads. The Generator 3 provides power to the remaining three loads in the third section. The DES is intimately associated with two loads, hence classifying the system as active. With a base power of 100kVA, a base frequency of 50Hz, and a maximum of 50 iterations, a load flow study was conducted. The load flow report provides insights into the system’s load management and stability. The system’s single-line diagram is seen in Figure 1.
For self-healing, the previously discussed FDIR technique is used. In the Simulink-designed nine-bus system, a symmetrical three-line-to-ground fault (LLLG fault) was assigned to six different sites. A three-phase V-I measurement device was used to evaluate the fault current, and it was applied to all generators and loads. Based on the result, the pick-up currents required for the overcurrent relays were computed. Each defect’s influence on loads was noted, and load analysis was carried out based on the availability of any rerouting networks. During the fault isolation procedure, some loads that are near the problem will be completely isolated. As a result, it is impossible to reroute power to specific loads. By using sectionalizing breakers to redirect supply from alternate sources, remaining loads can be protected from power outages. Consequently, each problem was rerouted appropriately, and methods were developed for each instance to guarantee correct breaker flipping. The overcurrent relays were simulated using Simulink by include their detecting delay, pickup current value, and reset time.
Seven overcurrent relays were placed in strategic spots across the system to determine the location of the malfunction. The pre-programmed pickup current, or fault current, is detected by the relays. By analyzing all of the relay outputs connected to that branch, it is possible to pinpoint the exact system branch where the issue occurred. As a result, a failure scenario is defined for every relay output sequence, and then a suitable breaker operation algorithm is created for each scenario. All loads and faults can be monitored simultaneously by viewing the results using a logic analyzer. examination of load power outages before and after the implementation of FDIR.
2.1. Logic Analyzer Output Without Re-Routing
A logic analyzer was used to identify all six issues and an eleven-load configuration. The load current was measured during the thirteen-second simulation period, and six LLLG failures were simulated at six different places for one second each. Every second, the system returns to its initial condition when the pertinent defect has been eliminated.
Figure 2.
Logic Analyzer output without re-routing
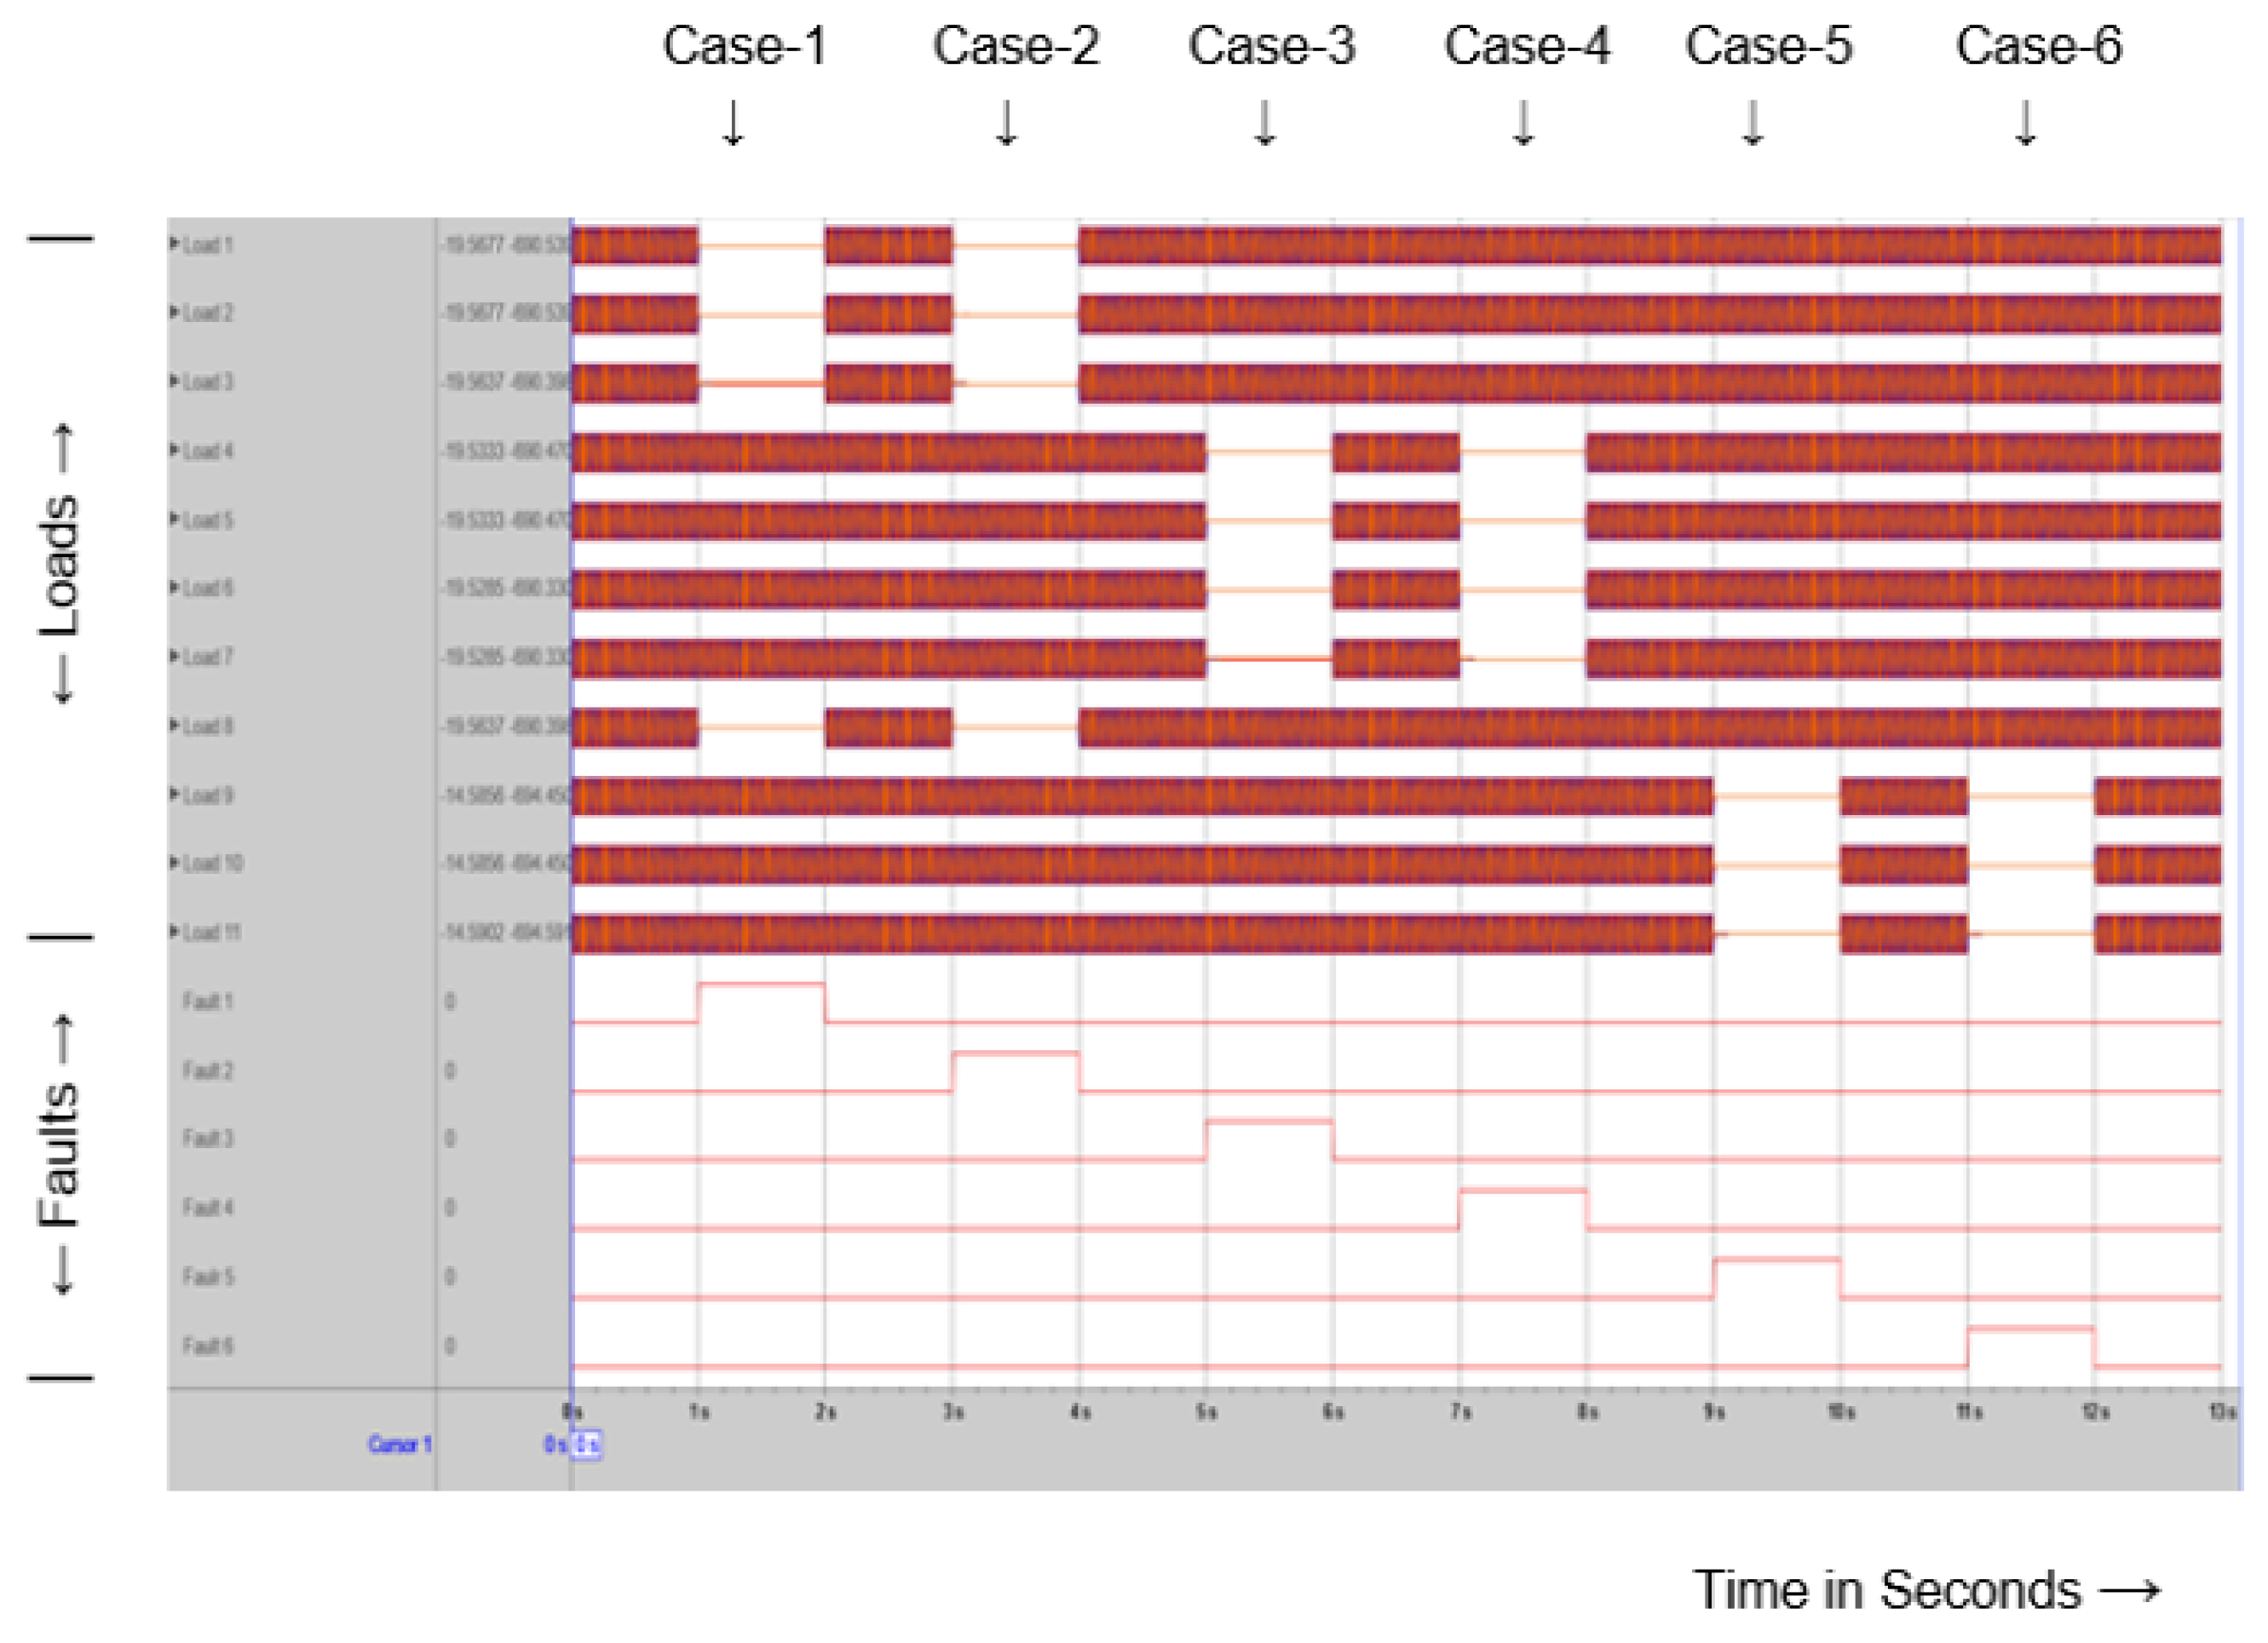

Table 1.
Cases without rerouting.
| Case | Condition |
|---|---|
| Case 1 and Case 2 | Faults 1 and 2 were assigned to distinct locations within a segment powered by Generator 1 and a Distributed Energy source (Generator 4). We isolate these two generators from the system to protect them from the faults; consequently, the power outage impacts all loads connected to that line. Loads 1, 2, 3, and 8 are the loads that are now encountering outages |
| Case 3 and Case 4 | We assigned faults 3 and 4 to separate locations within an additional area that only receives power from Generator 2. Consequently, in both instances, the loads that impact the power loss are Load 4, Load 5, Load 6, and Load 7 |
| Case 5 and Case 6 | We assigned Fault 5 and Fault 6 to different locations within a separate area that solely relies on Generator 3. Consequently, in both instances, the loads that impact the power loss are Load 9, Load 10, and Load 11 1 |
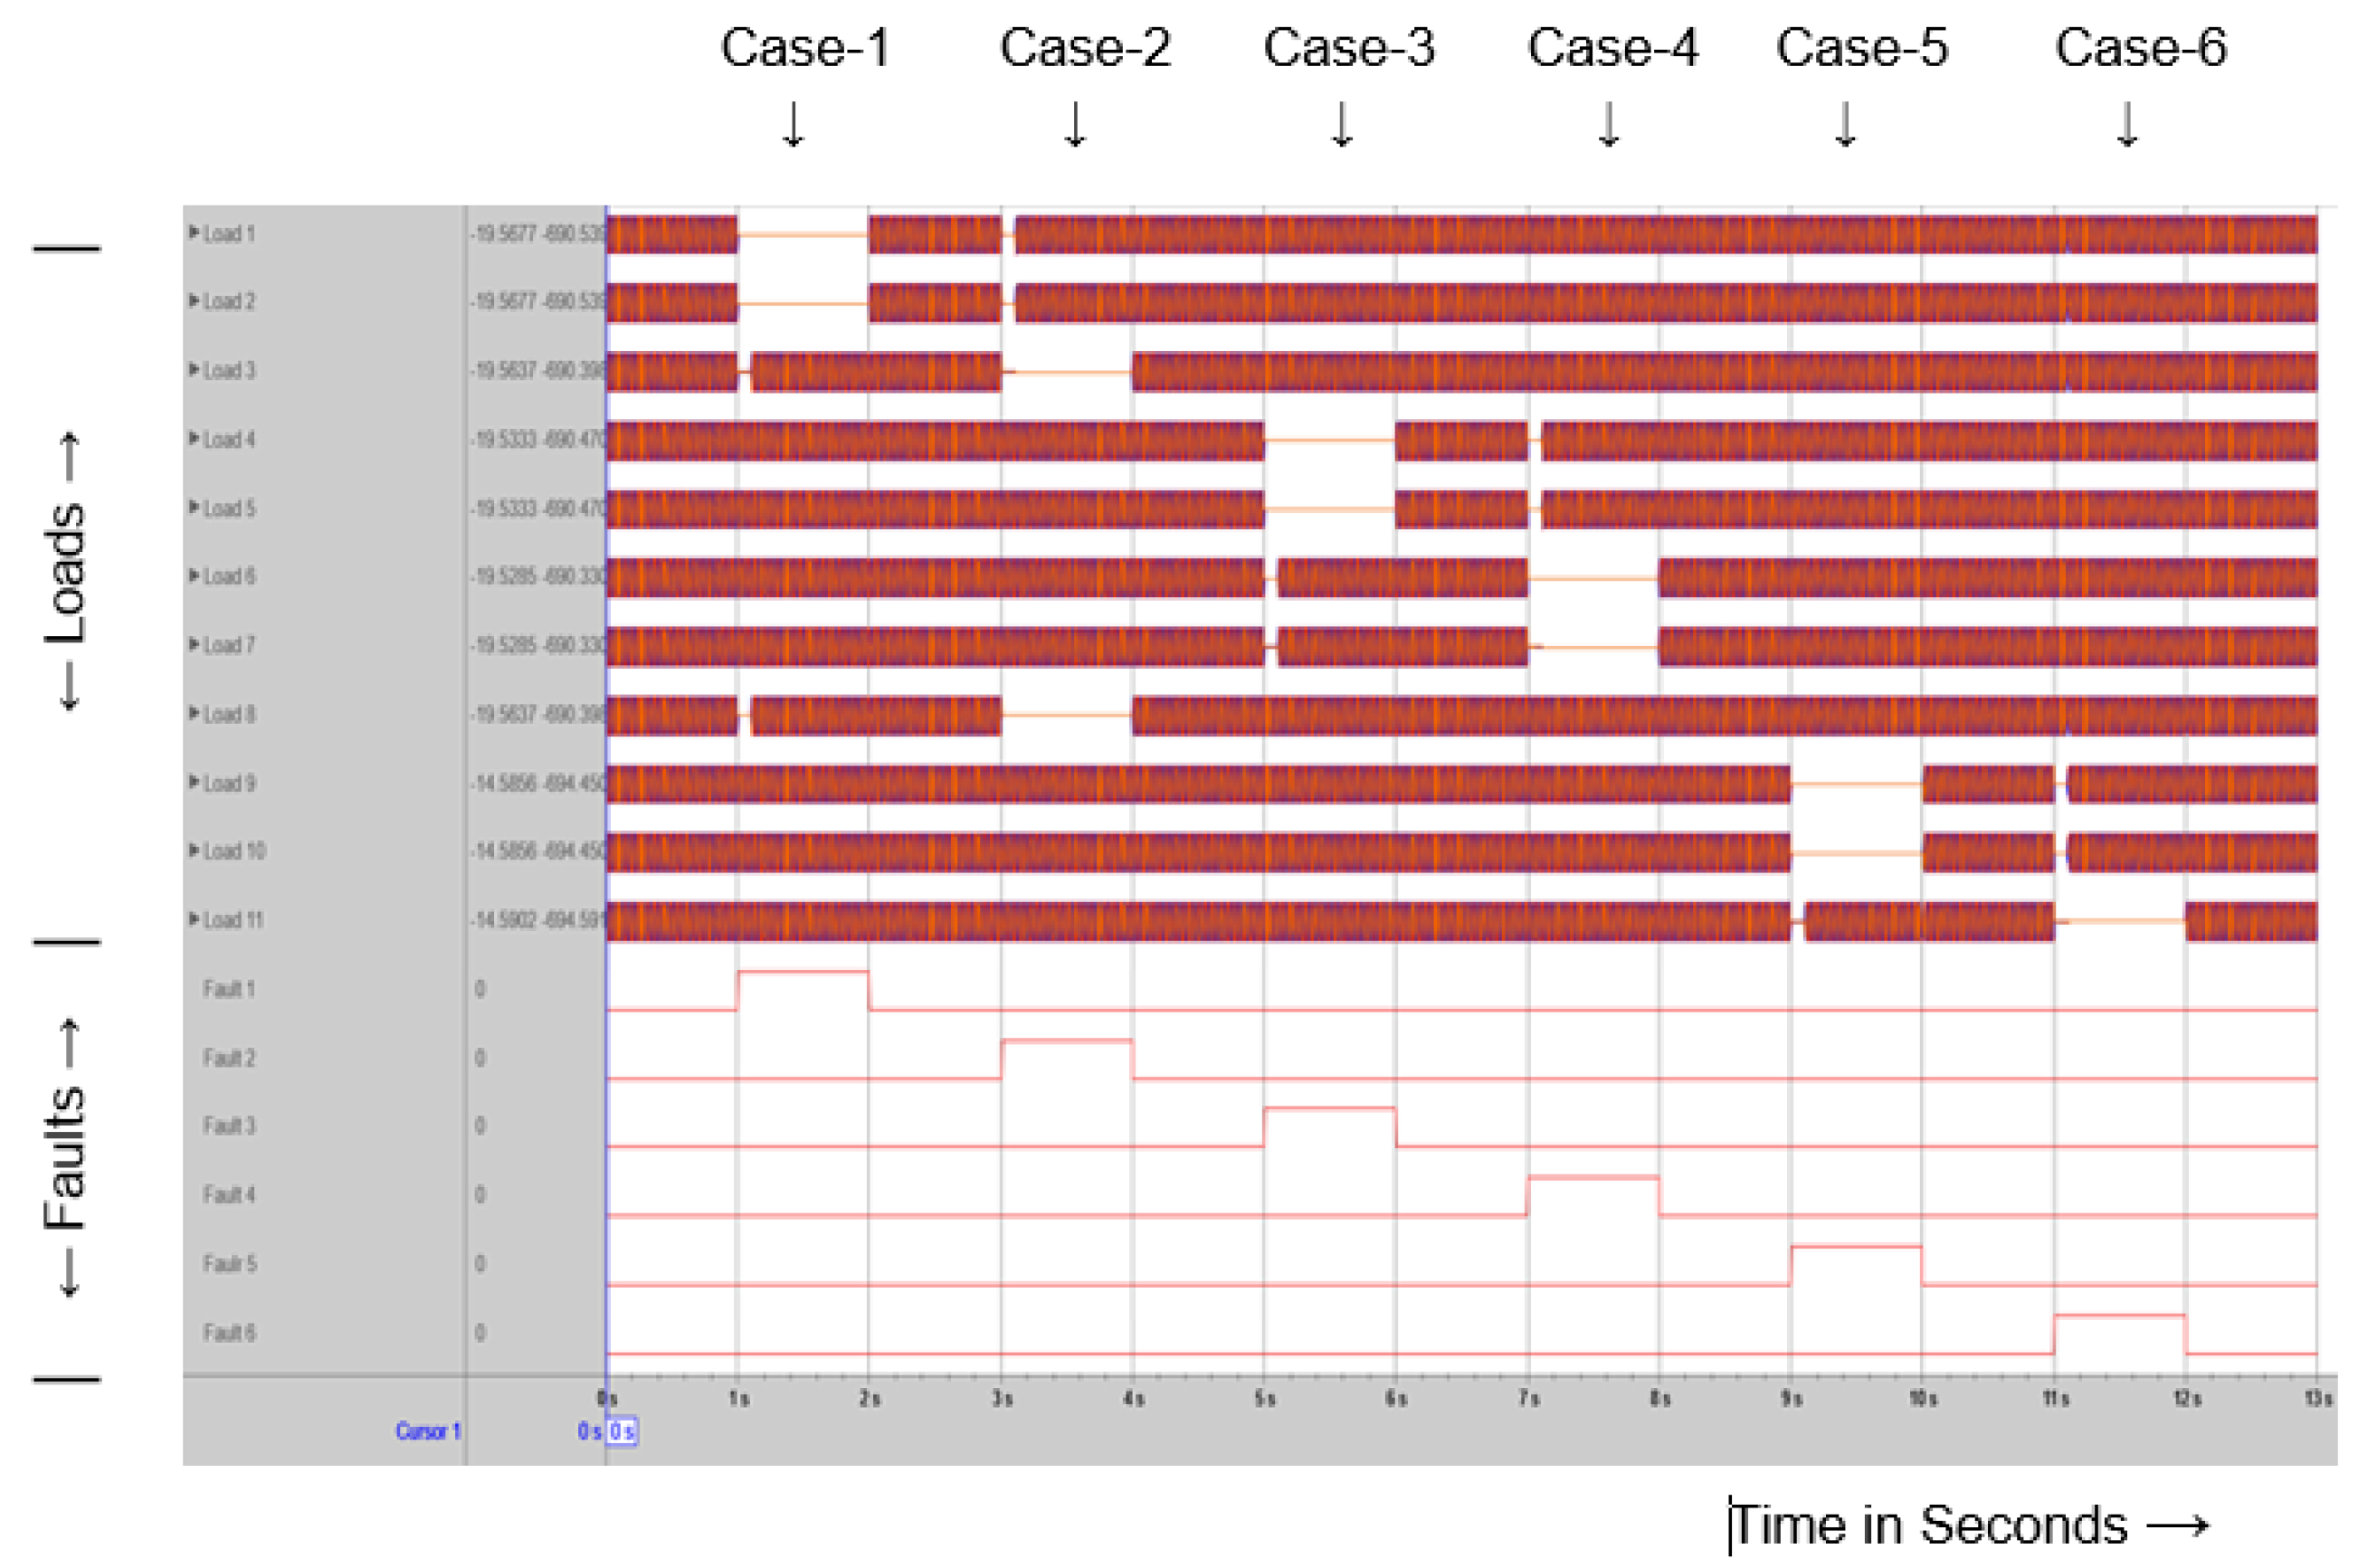
2.2. Logic Analyzer Output with Re-Routing
After the implementation of the FDIR algorithms to the system, it is again observed for the same conditions, and the logic analyzer output is shown in fig 3.
Figure 3.
Logic Analyzer output with re-routing
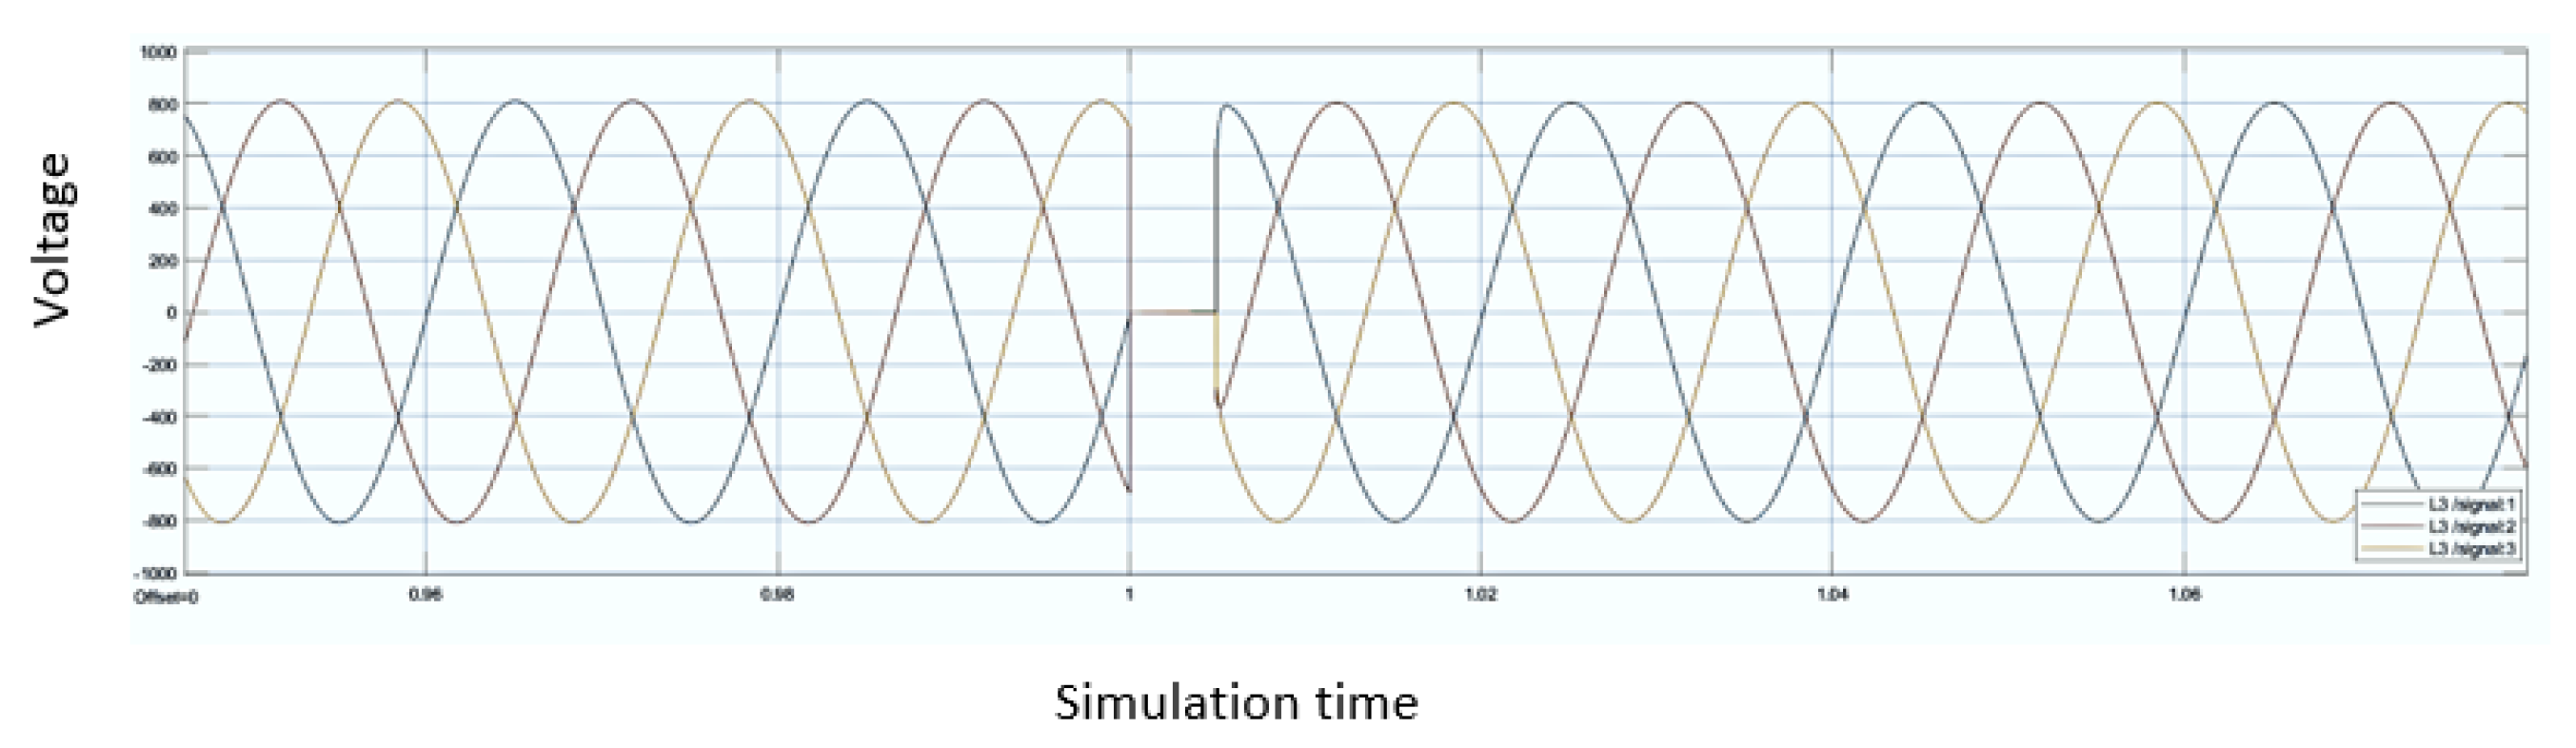
The voltage profile representing load 3 in the event of a fault is illustrated in Figure 4. It is evident that the voltage drops to zero immediately upon the occurrence of the problem, and the load promptly regains its power supply as a result of being redirected from an alternative generator. The brief interruption occurs due to the duration required for the relays and circuit breakers to activate
Table 2.
Cases after rerouting.
| Case | Condition |
|---|---|
| Case 1 | Following the introduction of FDIR, power was restored to Load 3 and Load 8 after a 0.1s delay (which is the relay operating delay). Generator 2 was utilised to redirect power to loads 3 and 8 through the implementation of suitable circuit breakers. |
| Case 2 | Loads 1 and 2 were supplied with power again by Generator 1. |
| Case 3 | Loads 6 and 7 have been supplied with power that has been redirected from Generator 1. |
| Case 4 | Loads 4 and 5 were supplied with power from Generator 2. |
| Case 5 | Generator 3 restored power to Load 11. |
| Case 6 | Loads 9 and 10 were supplied with diverted electricity from Generator 1. |
| 1 |
Figure 4.
Voltage Plot for load 3
3. Multi-Agent System Simulation Using JADE and MATLAB/Simulink(Scenario 2)
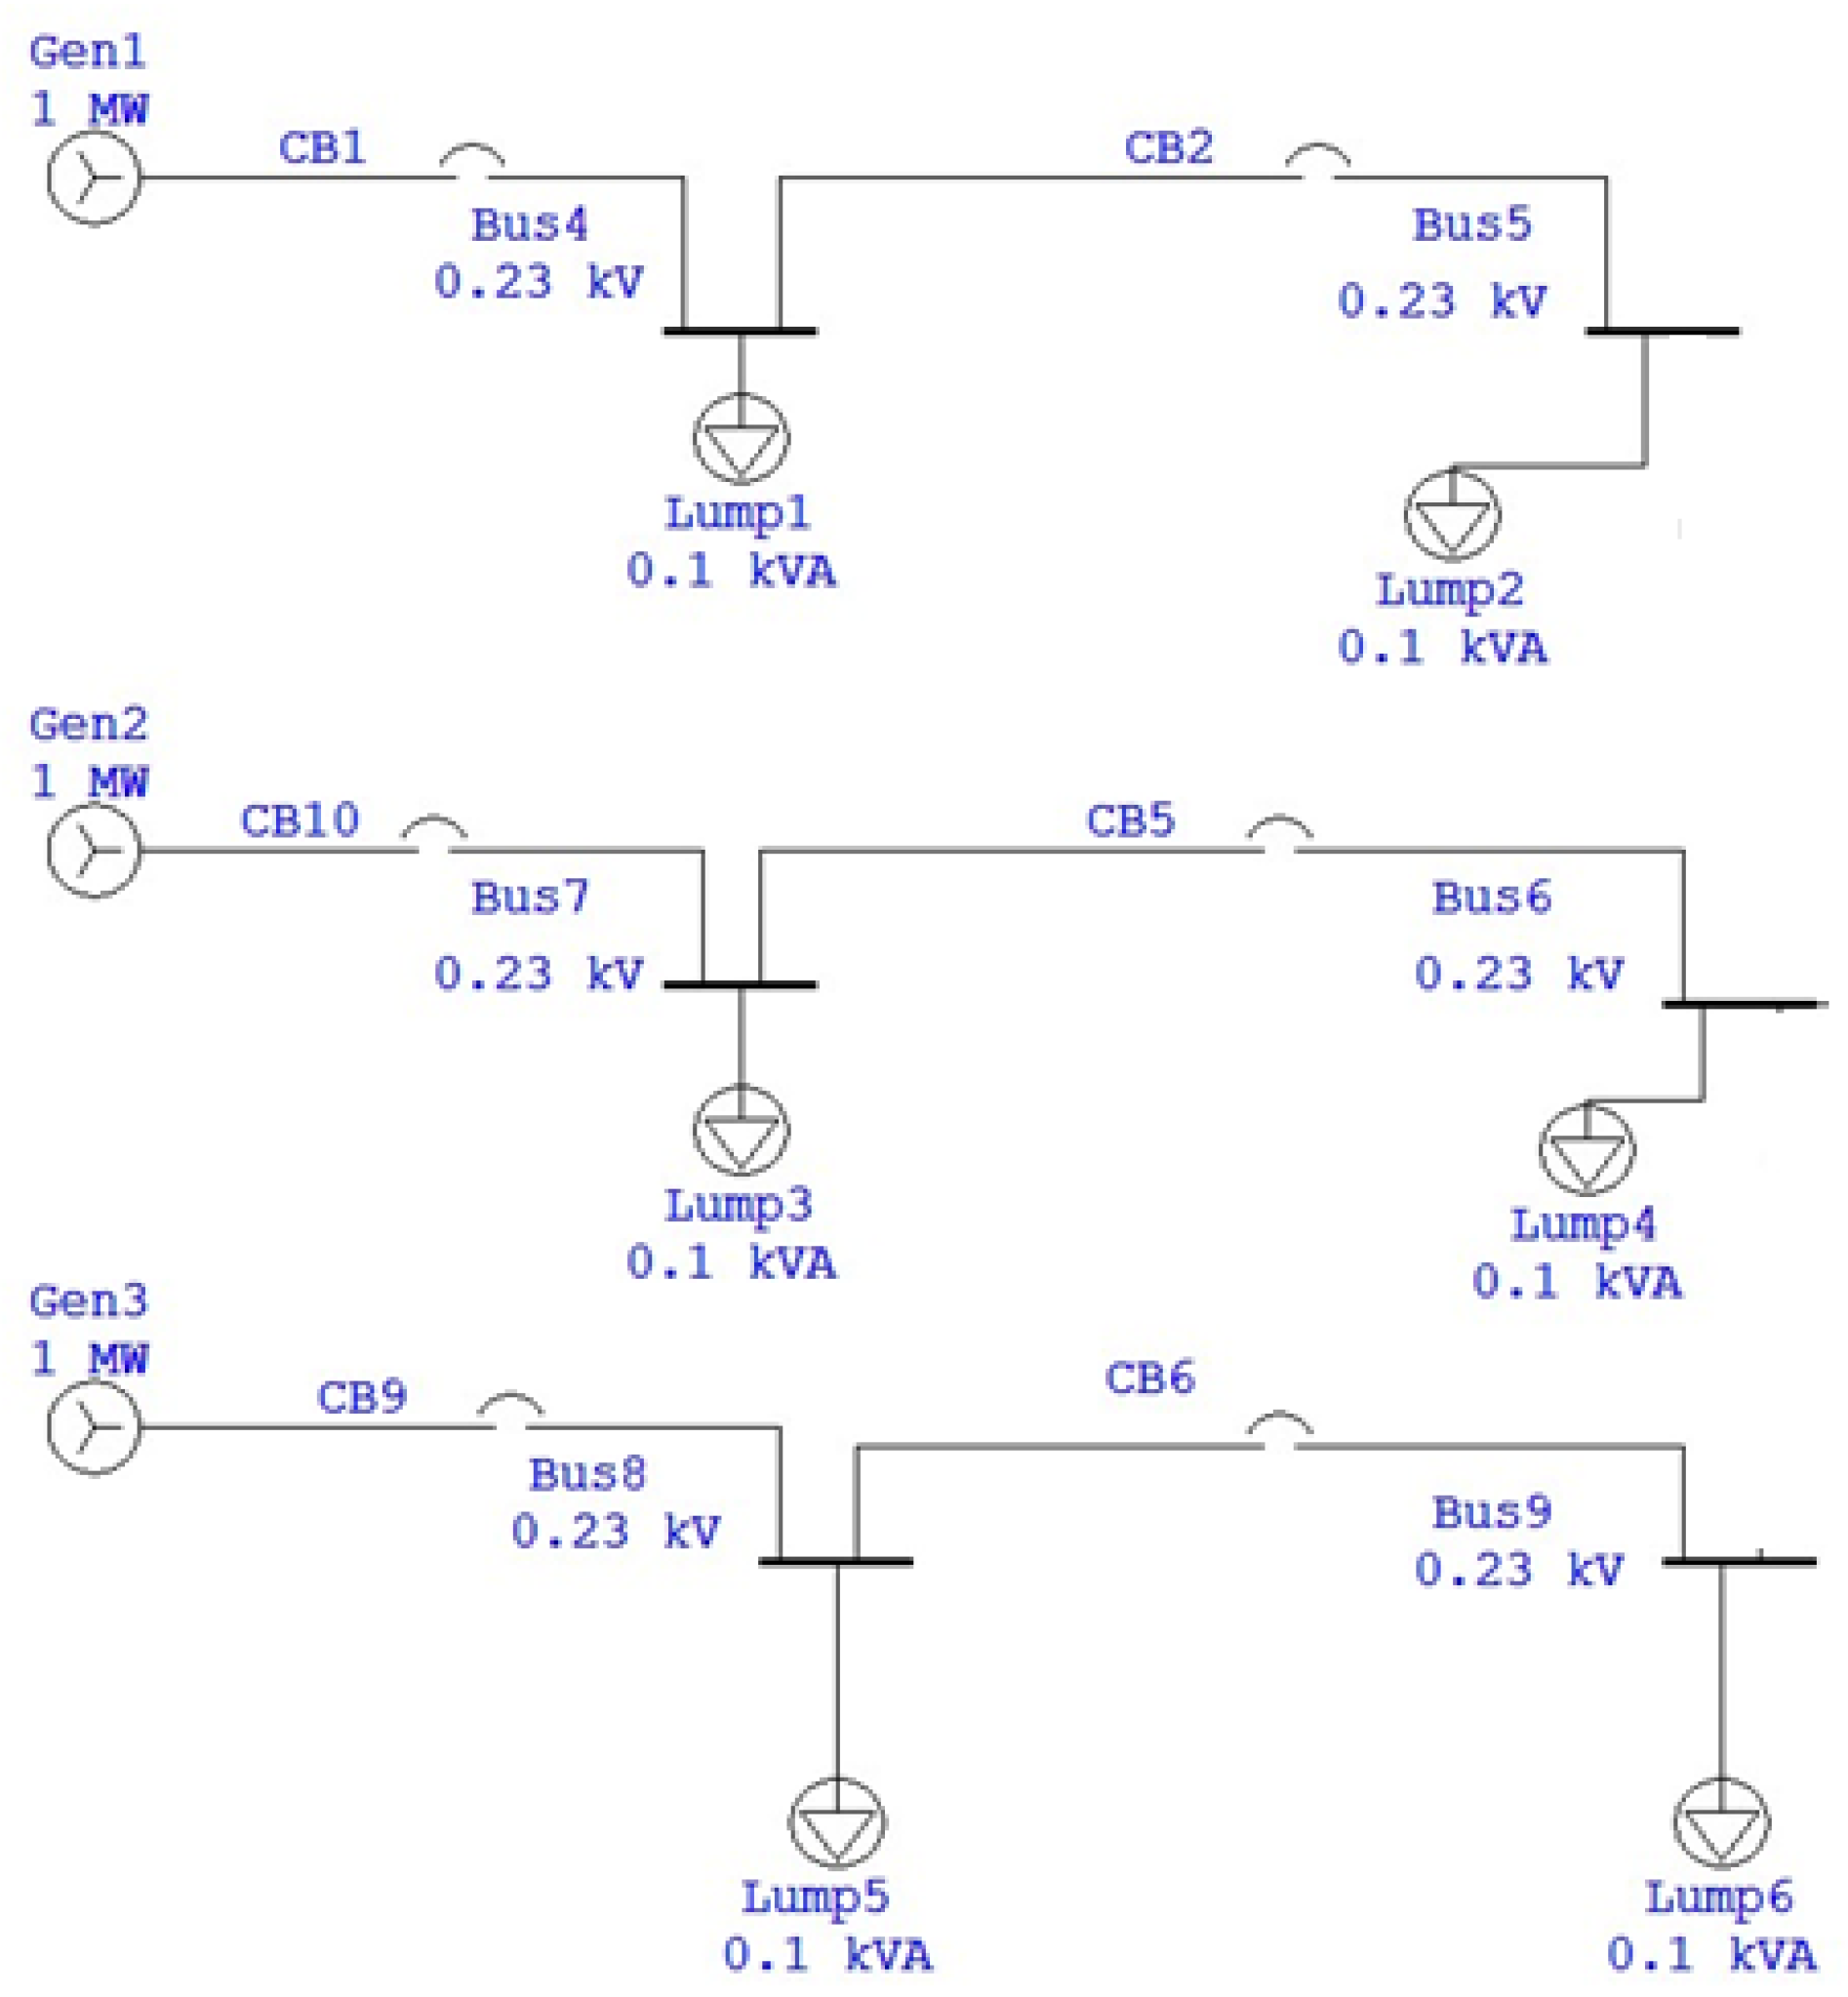
To implement the proposed multi-agent system, a new simulation is developed (Figure 5) utilising MATLAB Simulink [11] and comprises the following simplified circuit: Two 415V distributed generators, four 100W loads, voltage-current measurements, overcurrent relays, circuit breakers, and four faults.
Case 1: When the fault occurs at location 1, both loads linked to generator 1 are impacted by the power outage. The fault is initially isolated, and subsequently, with the FDIR approach, power is restored to load 2 by shutting circuit breaker 3.
Case 2: When the fault occurs at position 2, both loads dependent on generator 1 are impacted by the power outage. The fault is isolated by disconnecting circuit breaker 2 utilising the FDIR approach.
Table 3.
Output and Circuit Breaker Status
| O1 | O2 | B1 | B2 | B3 | B4 | B5 |
| 0 | 0 | 1 | 0 | 1 | 1 | 0 |
| 0 | 1 | 0 | 0 | 1 | 1 | - |
| 1 | 0 | 1 | 1 | 0 | 0 | 1 |
| 1 | 1 | 1 | 1 | 1 | 1 | 0 |
Table 4.
Relay and Input status
| R 1 | R 4 | R 3 | R2 | INPUT 1 | INPUT 2 |
| 0 | 1 | 1 | 0 | 0 | 0 |
| 0 | 1 | 1 | 1 | 0 | 1 |
| 1 | 1 | 0 | 1 | 1 | 0 |
| 1 | 1 | 1 | 1 | 1 | 1 |
Figure 5.
System for the implementation of FDIR
The identical techniques are reiterated when a fault arises at position 3,
The system employs two agents. The initial agent gathers data from four overcurrent relays utilising logic gates. This data is subsequently analysed and transmitted to the next agent, which identifies the fault location employing the FDIR technique. It then issues the appropriate logical signal to the corresponding circuit breaker, which is decoded using logic gates. The relevant signals are sent to five circuit breakers, which operate to isolate the fault and restore power to the remaining load by activating an alternate circuit breaker. The breaker transmits information to the MACSimJX block, where the relay agent processes it and relays it to the agent at the circuit breaker end, which, based on logical circuits, determines the set of circuit breakers to be activated. The relay agent transmits two values to the agent according to the logic outlined in table 1, while the circuit breaker agent provides values to the corresponding breakers based on the logic in table 2. In Table 1, ’0’ signifies a fault occurrence, whereas ’1’ denotes the absence of a fault. In Table 2, ’0’ represents the opening of the breaker, while ’1’ shows its closing. (R denotes Relay, O signifies Output, B represents Circuit Breaker)
Upon the occurrence of a fault inside a system, the overcurrent relay positioned at various locations detects the fault and transmits the appropriate logic signal, either 0 or 1, to the logic gates linked to the MACSimJX block (fig7). This block transmits data to the relay agent within the JADE environment, which subsequently forwards it to the circuit breaker agent. This agent relays the information back to SIMULINK, enabling the circuit breaker agent to identify the fault and operate the appropriate circuit breaker combination based on the logic circuit output derived from the table. Figure 6 illustrates the system incorporating the MACSimJX block.
Figure 6.
MACSimJX Block
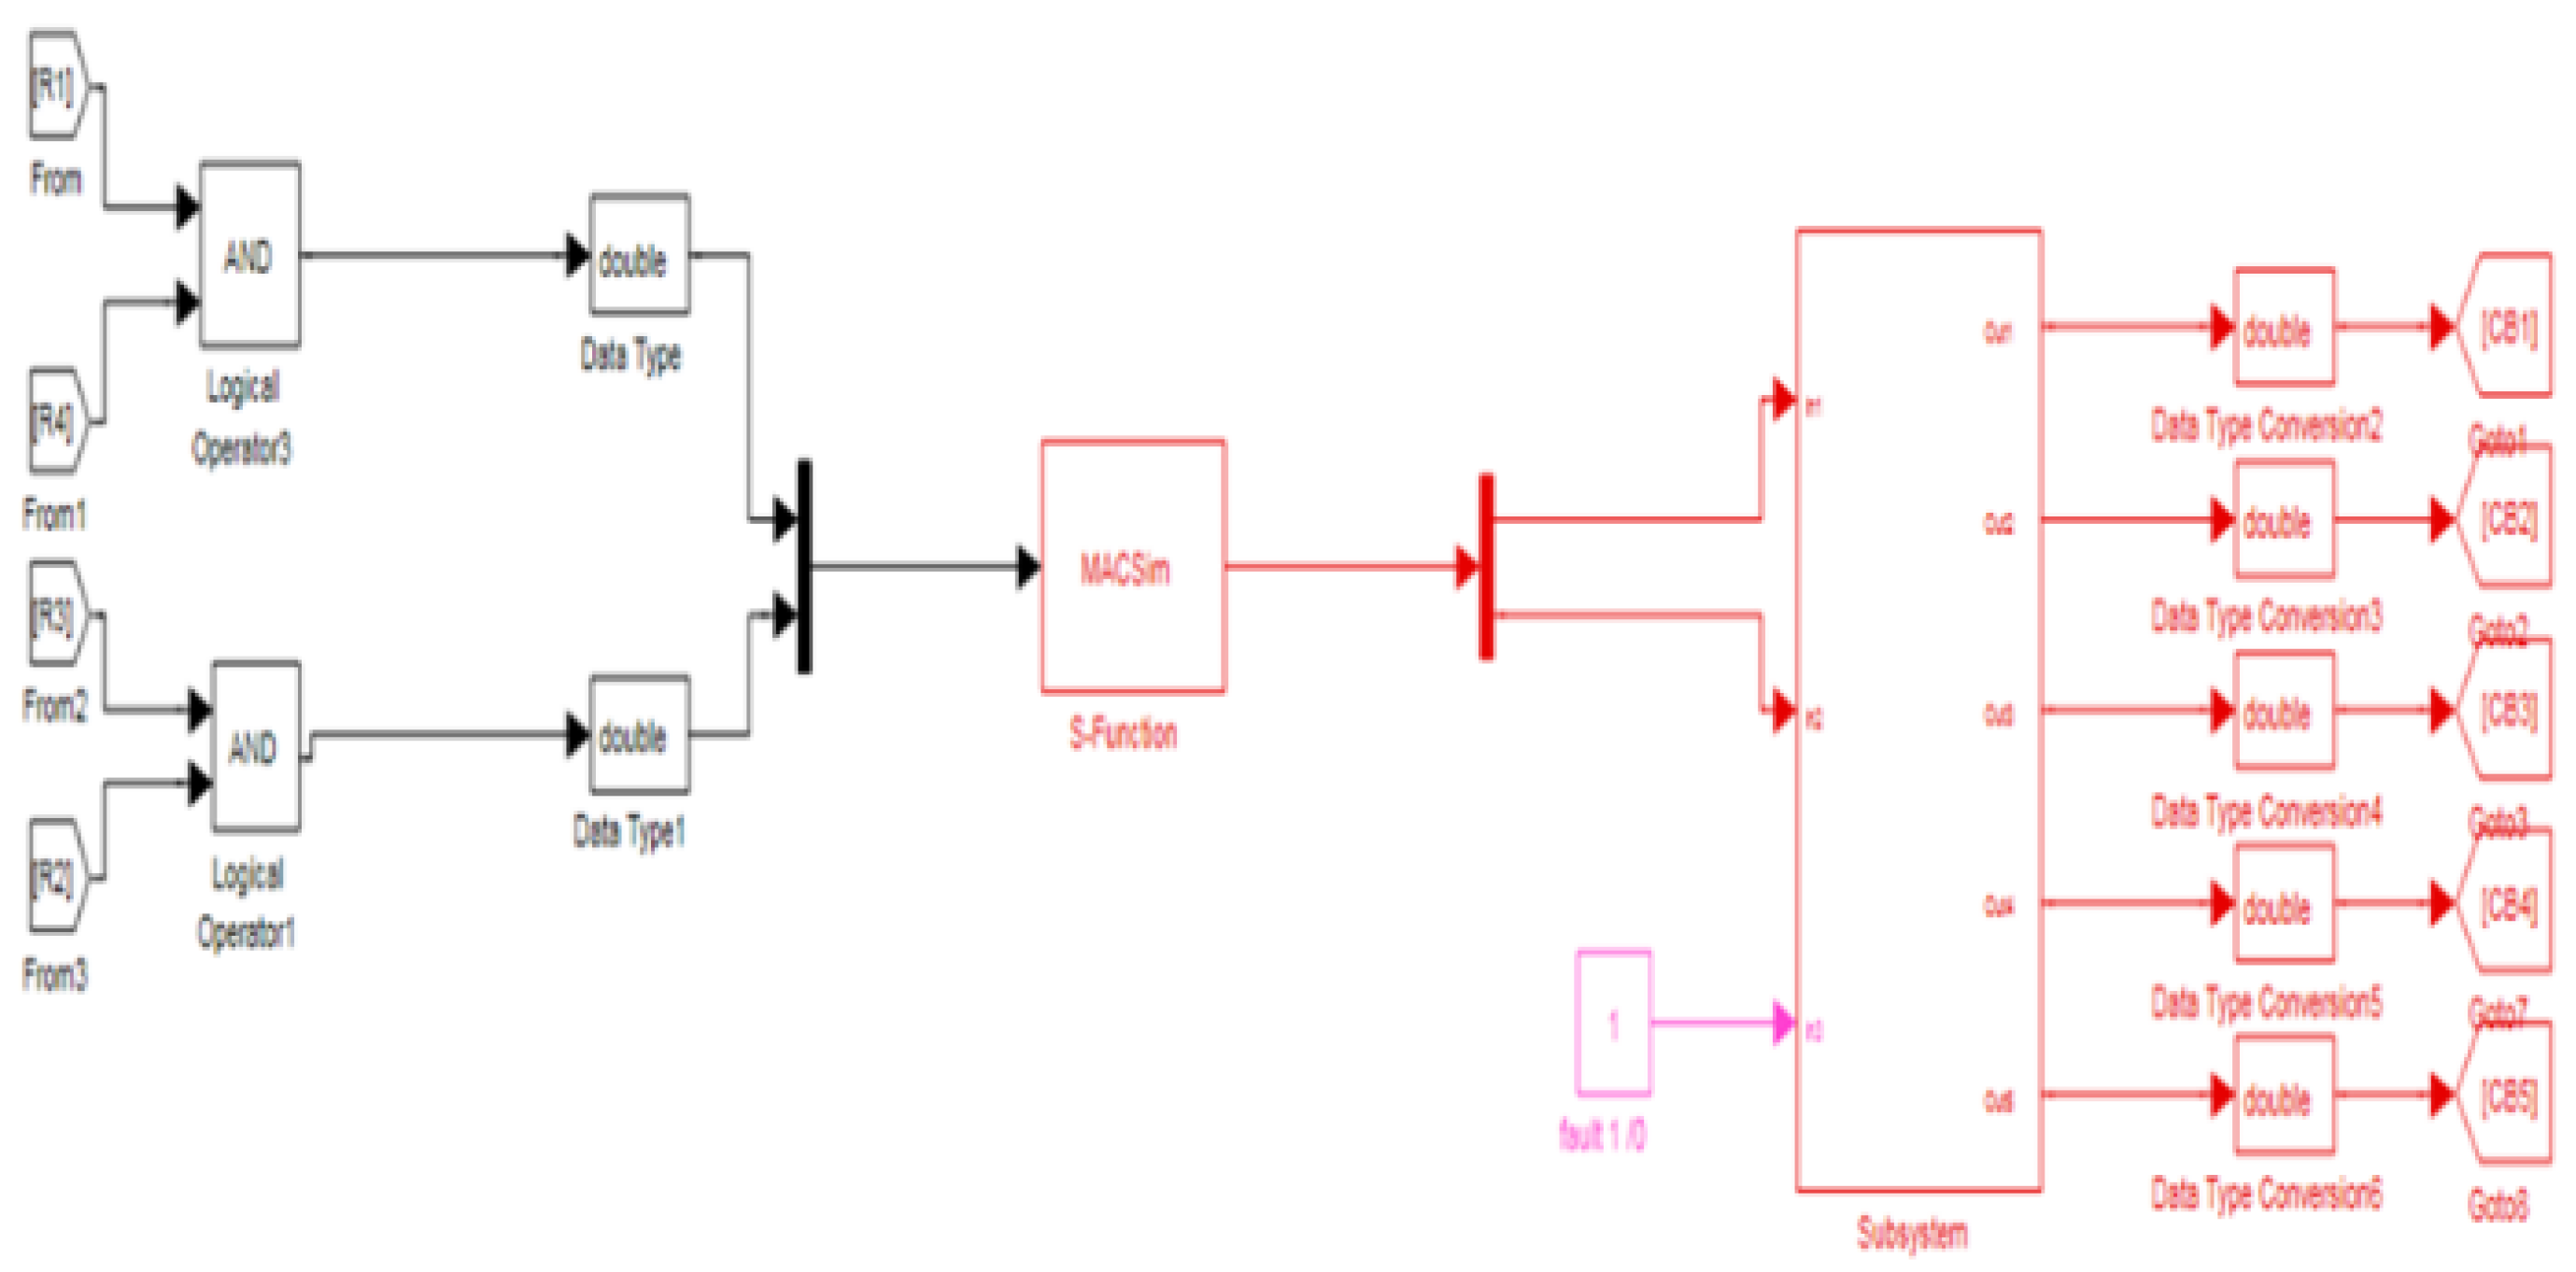
Figure 7.
Case 1 : Voltage Waveform for Load 2 during a Fault
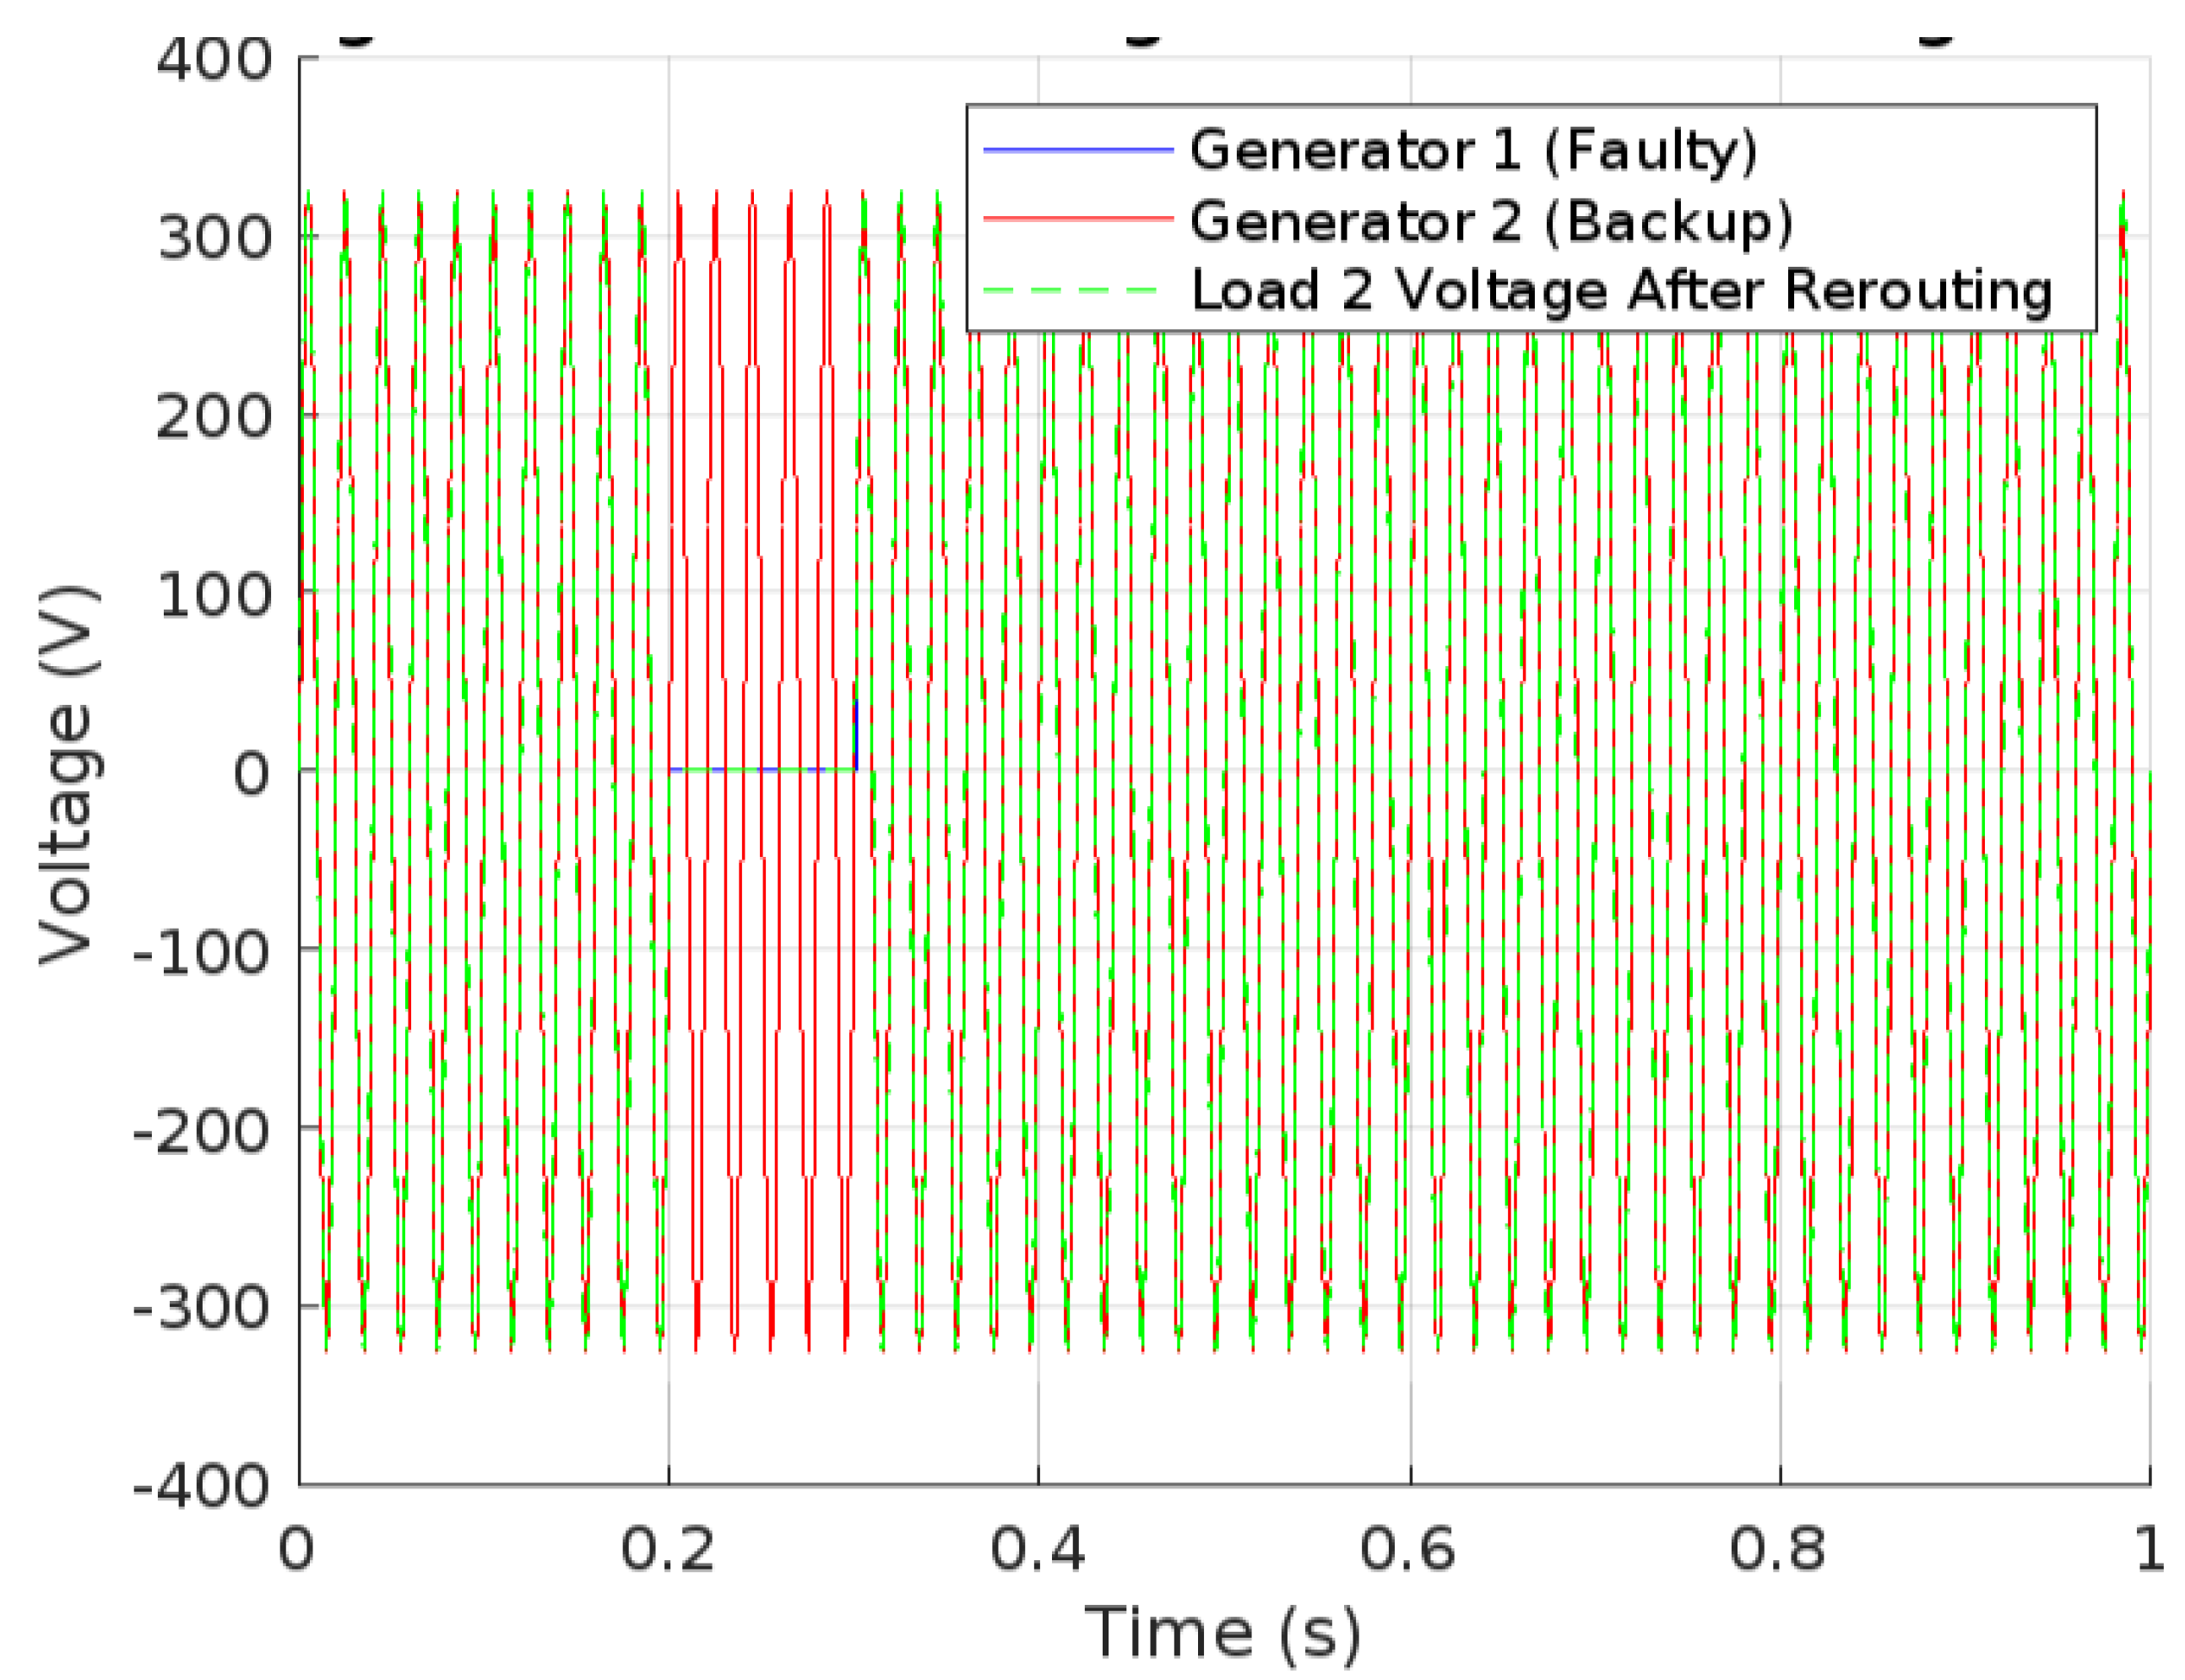
The graph(Figure 7) shows the voltage waveform associated with load 2 (in case 1) in the system. When a fault occurs in line 1, which is powered by generator 1,usually all the loads connected to it will experience power outage due to the fault which can be avoided by rerouting the power from nearby generator with the help of a circuit breaker which is controlled by agents. Here the voltage at load 1 after isolation becomes very low whereas load 2 gets its power restored.
4. Practical Hardware Implementation and Validation Using Raspberry Pi(Scenario 3)
4.1. Configuration of a Distribution Network
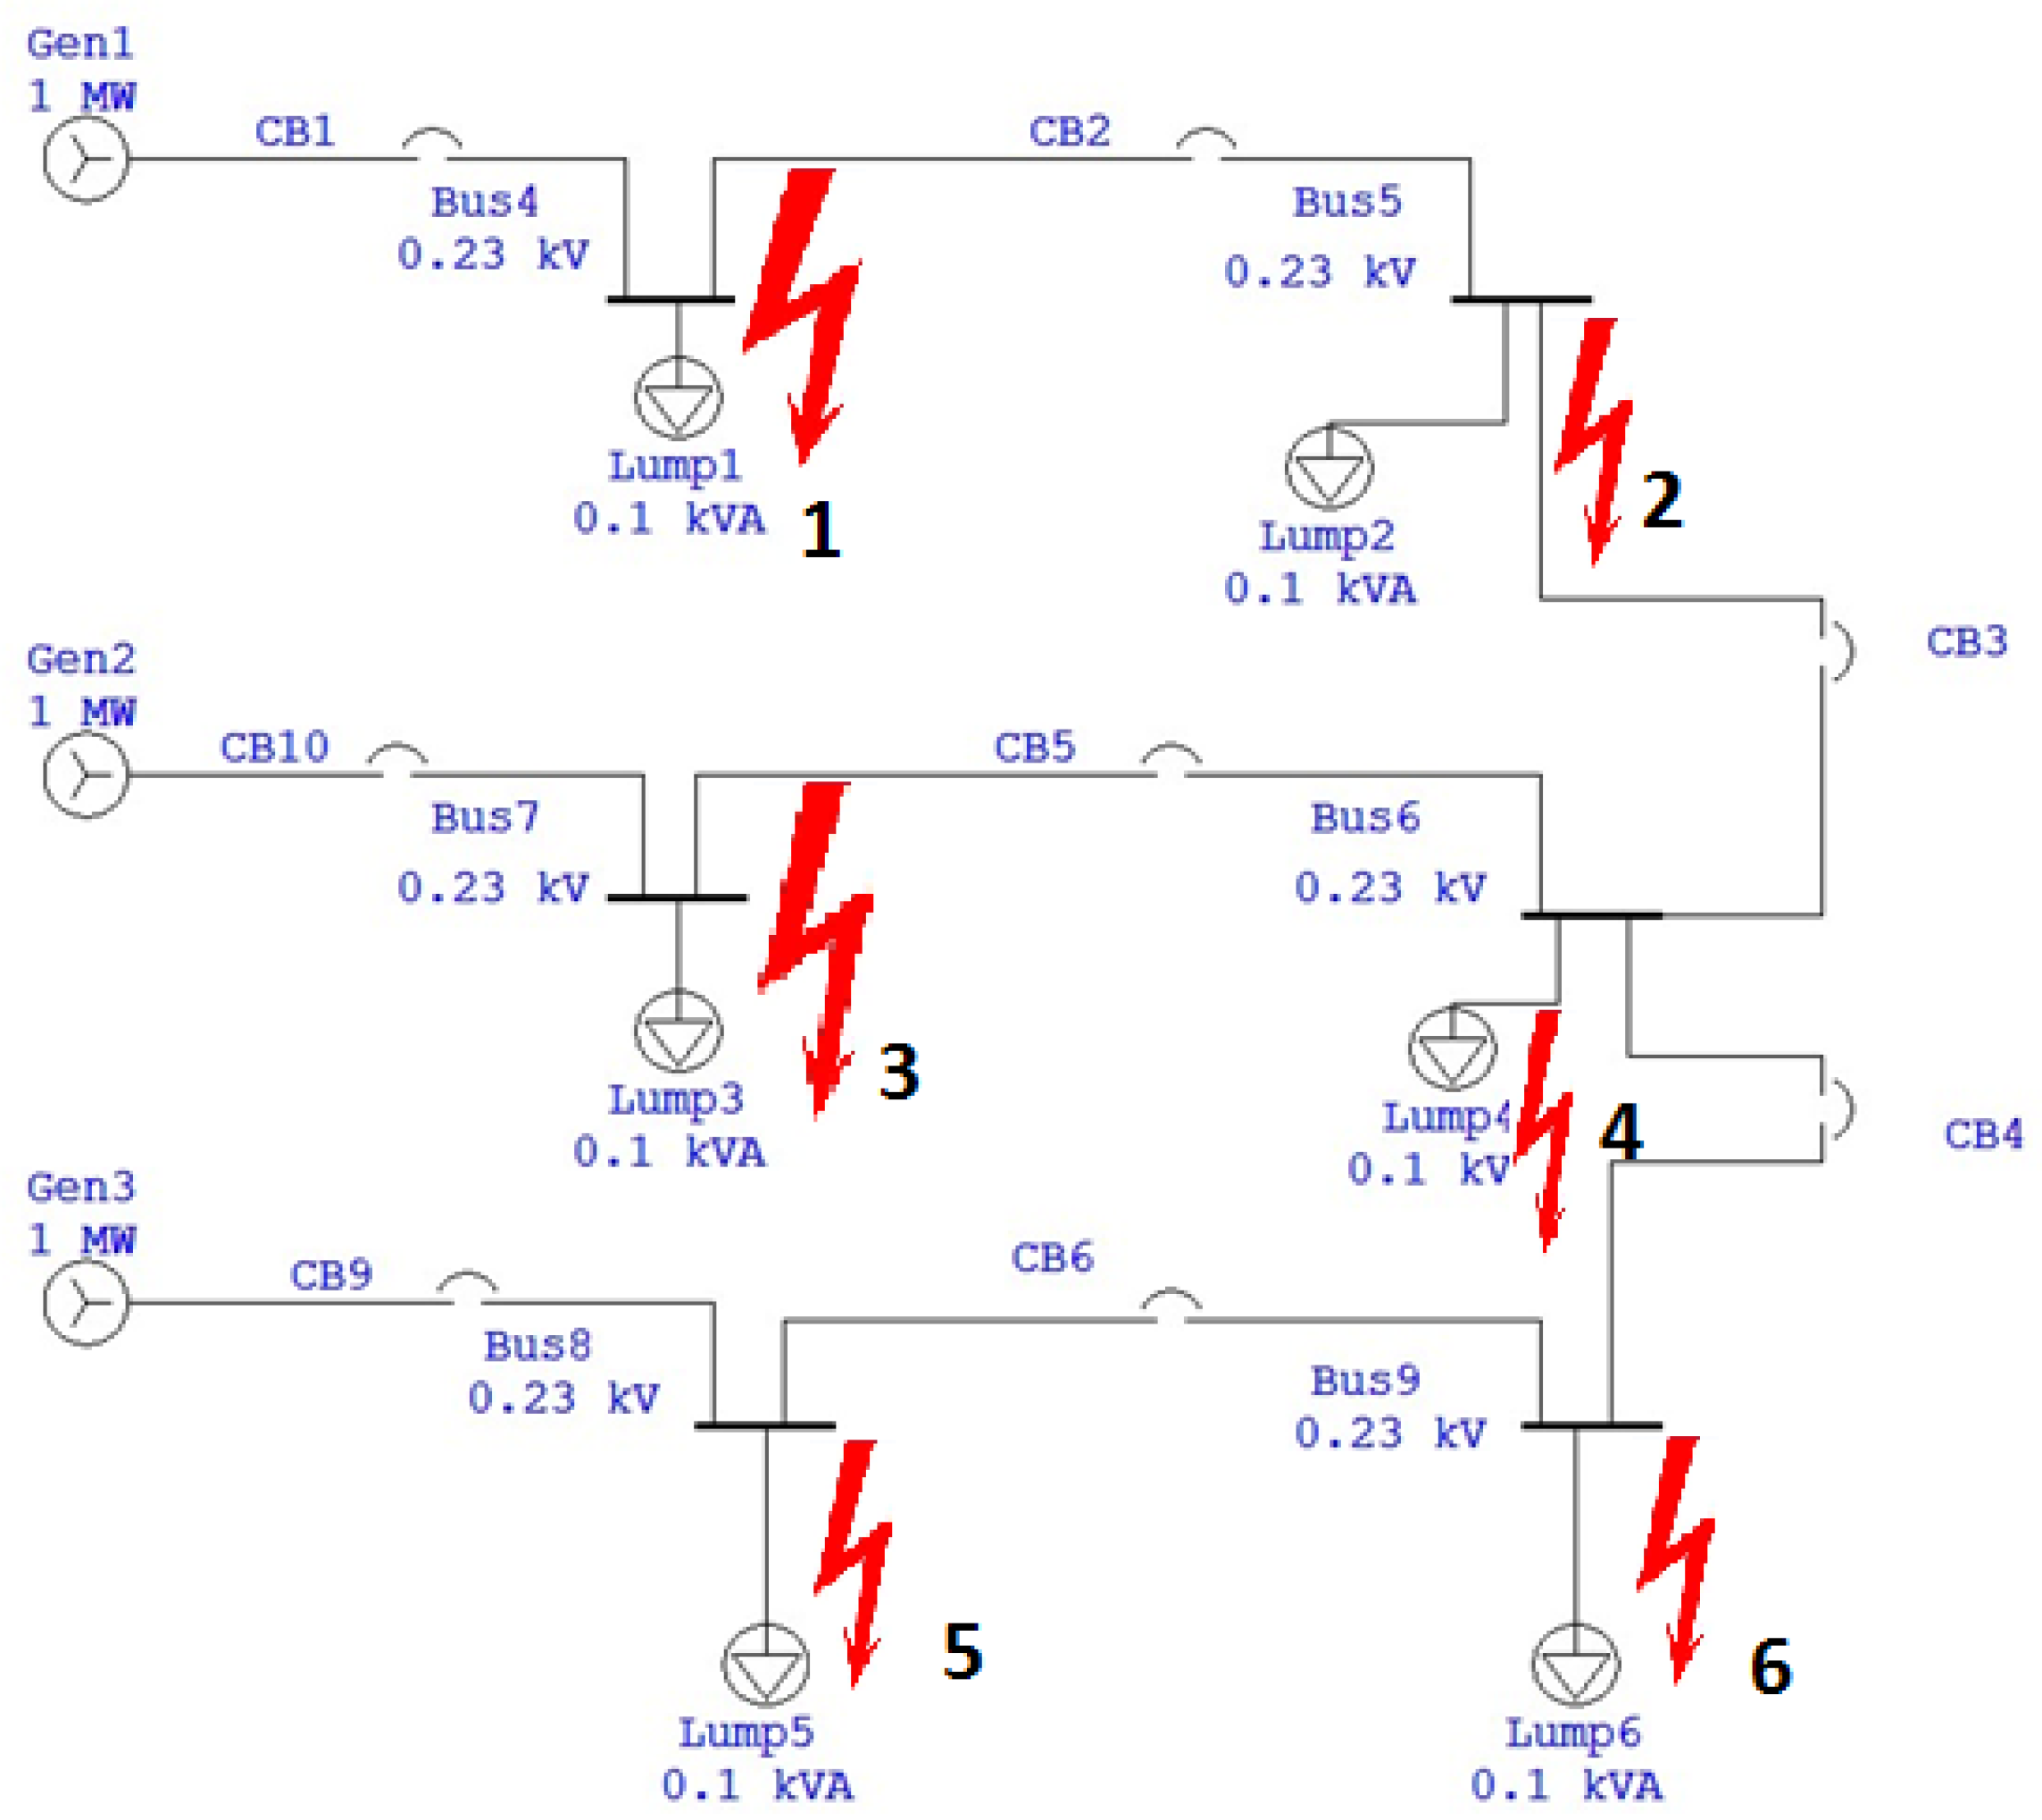
A model of a distribution network with six loads and three generators was created. Three 230V 50Hz generator phases were employed in the network. The loads were 60W incandescent lamps. Each load was isolated using six single-phase contractors. The contactor’s operating voltage is 230V AC. As seen in Fig. 8, a generator provides power to two distinct loads
Figure 8.
The fault locations in the prototype
The current is detected by means of the CT 1270 current transformer. The burden resistor conducts this current, producing a voltage that the Arduino may utilise. Connecting a current-carrying conductor to an unburdened CT (i.e., one without a burden resistor) will result in the CT producing an unsafe voltage at its leads, which could cause insulation degradation and C.T. destruction.
The CT1270 has a current range of 0 to 5 A. For this prototype, 1 A was chosen as the maximum current.
The relationship between the peak current and the RMS current is given by:
For an RMS current of 1 A:
The relationship between the primary peak current () and the secondary peak current () in a transformer is given by:
where N is the turns ratio of the transformer.
For a primary peak current of 1.414 A and a turns ratio of 700:
To maximize measurement resolution, the voltage across the burden resistor at peak current should be equal to one-half of the Arduino’s analog reference voltage (AREF/2). For an Arduino operating at 5V, this equates to:
The ideal burden resistance () can be calculated using Ohm’s Law:
Given: - - Substituting these values:
Since standard resistor values do not include 1237.6237 ohm, the nearest standard value should be selected, considering the measurement accuracy and the input range of the Arduino’s analog-to-digital converter.
Figure 9.
Circuit diagram showing the setup of the CT circuit
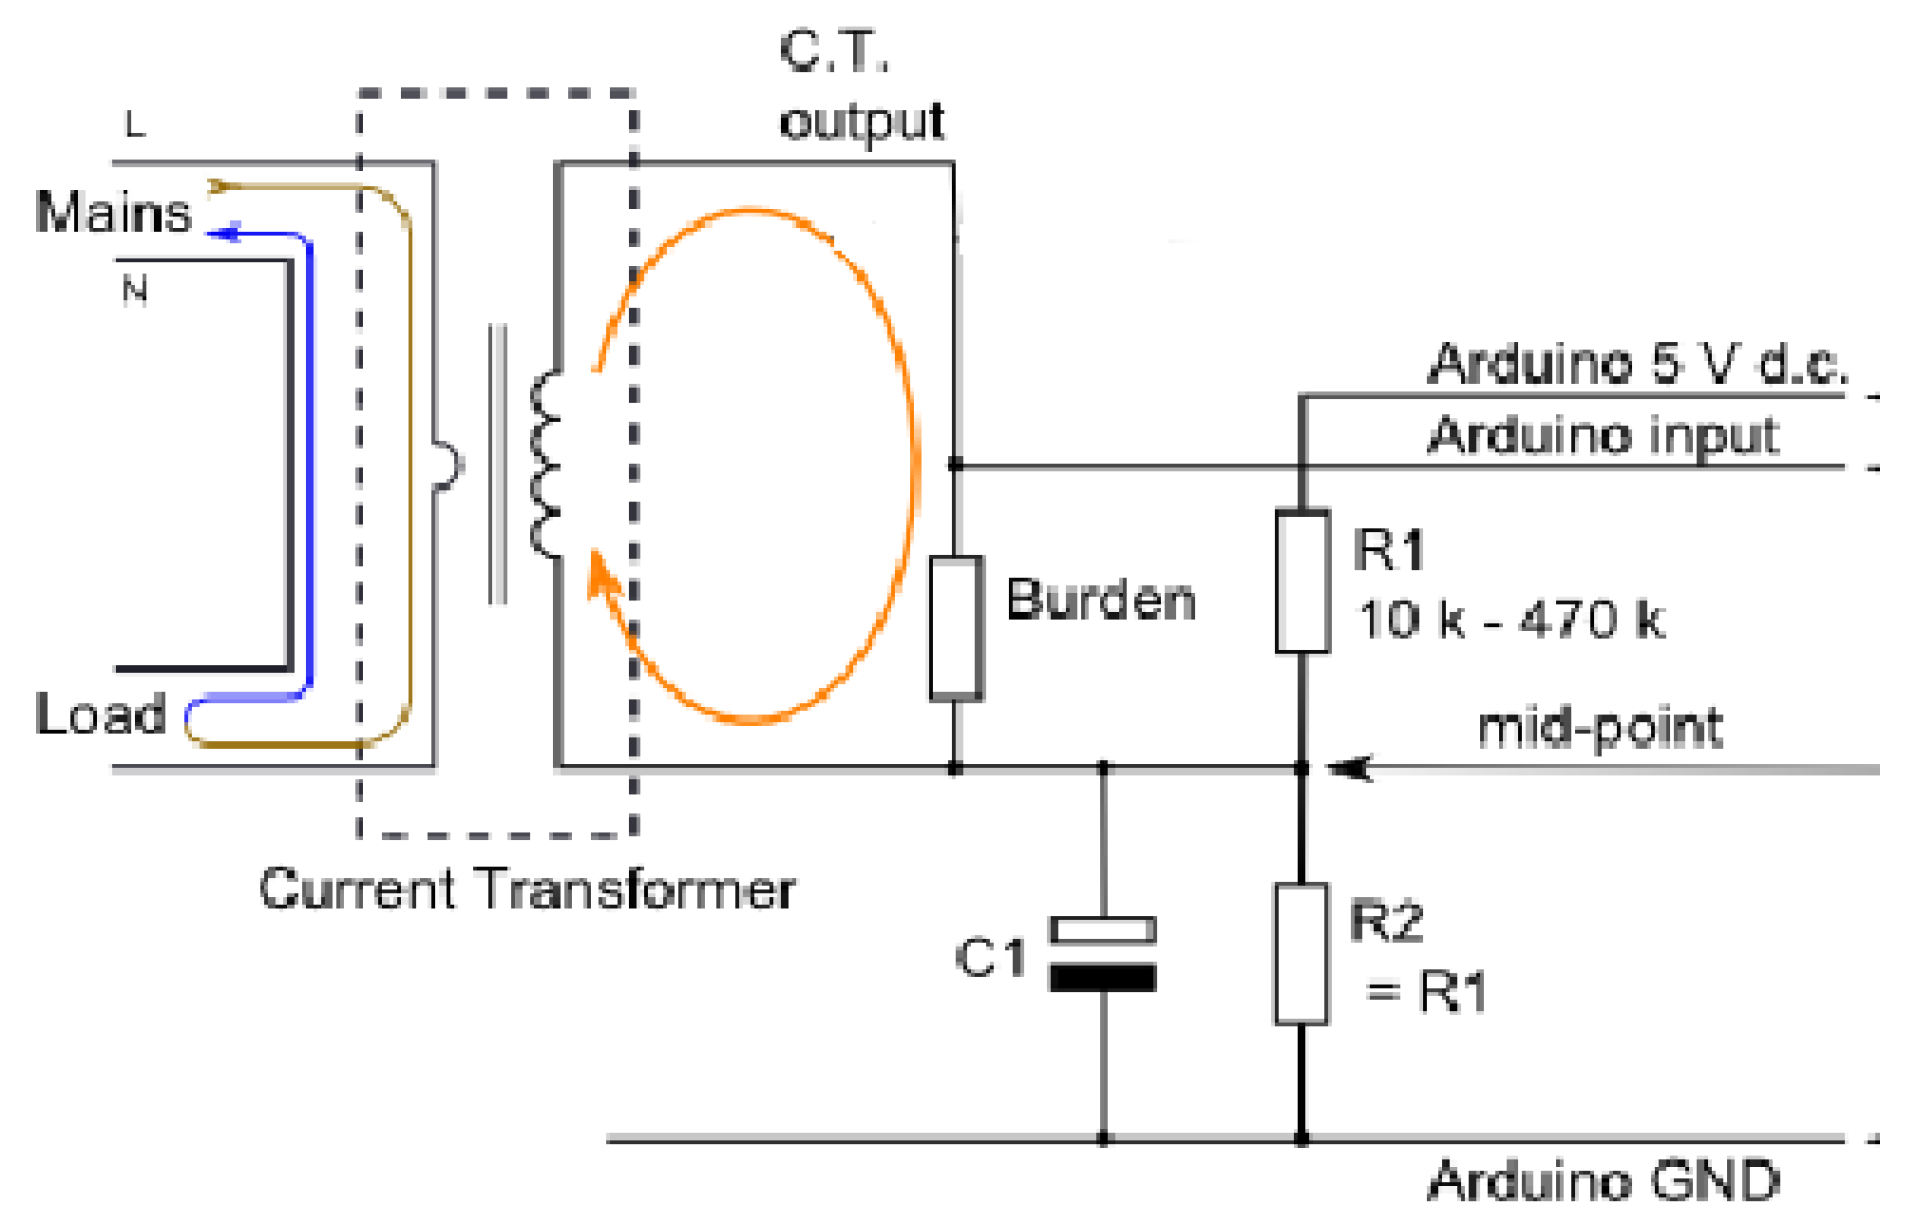
The output from the CT is directed to the analogue pins of the Arduino (Figure 9). Six sets of current transformers are utilised, positioned at each of the buses. The Arduino acquires values from the current transformers, identifies the fault site, and transmits the information to the Raspberry Pi over serial connection. The Arduino, in conjunction with the Raspberry Pi, functions as an intermediary for the load/bus.
4.1.1. Communication Between Raspberry Pi and ESP8266
The communication between the Raspberry Pi and ESP8266 is facilitated over Wi-Fi utilising the MQTT (Message Queuing Telemetry Transport) protocol. To facilitate communication between the Raspberry Pi and the ESP8266, the subsequent procedures are executed:
- The MQTT server has been established on the Raspberry Pi, and the requisite libraries have been installed. The most recent iteration of the MQTT server and client has been installed on the Raspberry Pi.
- The libraries for NodeMCU to function with MQTT are installed in the Arduino IDE, the code is uploaded, and the device’s operation is verified.
- A script is developed on Raspberry Pi, the necessary code is uploaded to NodeMCU, and the Python script is executed on the Raspberry Pi.
The server is a Raspberry Pi, while the client is a NodeMCU. The fault messages transmitted from the Arduino to the Raspberry Pi are subsequently relayed to the ESP8266 client, which functions as an intermediary for the circuit breakers.
4.2. Breaker Operation
The data from the RPi is transmitted to the ESP8266, which regulates the circuit breakers. The breaker coil operates at a voltage of 230V, which the microcontroller cannot supply. A relay module is employed for this purpose, with the output from the ESP8266 serving as the control signal for the relay, as illustrated in Figure 10.
4.3. Intelligent Restoration after Reconfiguration
For the fault 3 lamps of 100W each was used which gives an overcurrent of approximately 0.5A.
- Case 1: When a failure occurs at position 1, both loads linked to generator 1 experience a power outage.The problem is initially isolated, after which the FDIR approach is employed to restore power to load 2 by closing circuit breaker 3 (see Figure 10)..
- Case 2:When a failure occurs at position 2, both loads linked to generator 1 experience a power outage.The issue is isolated by opening circuit breaker 2 utilising the FDIR approach.
Figure 11.
Control mechanism of the entire system
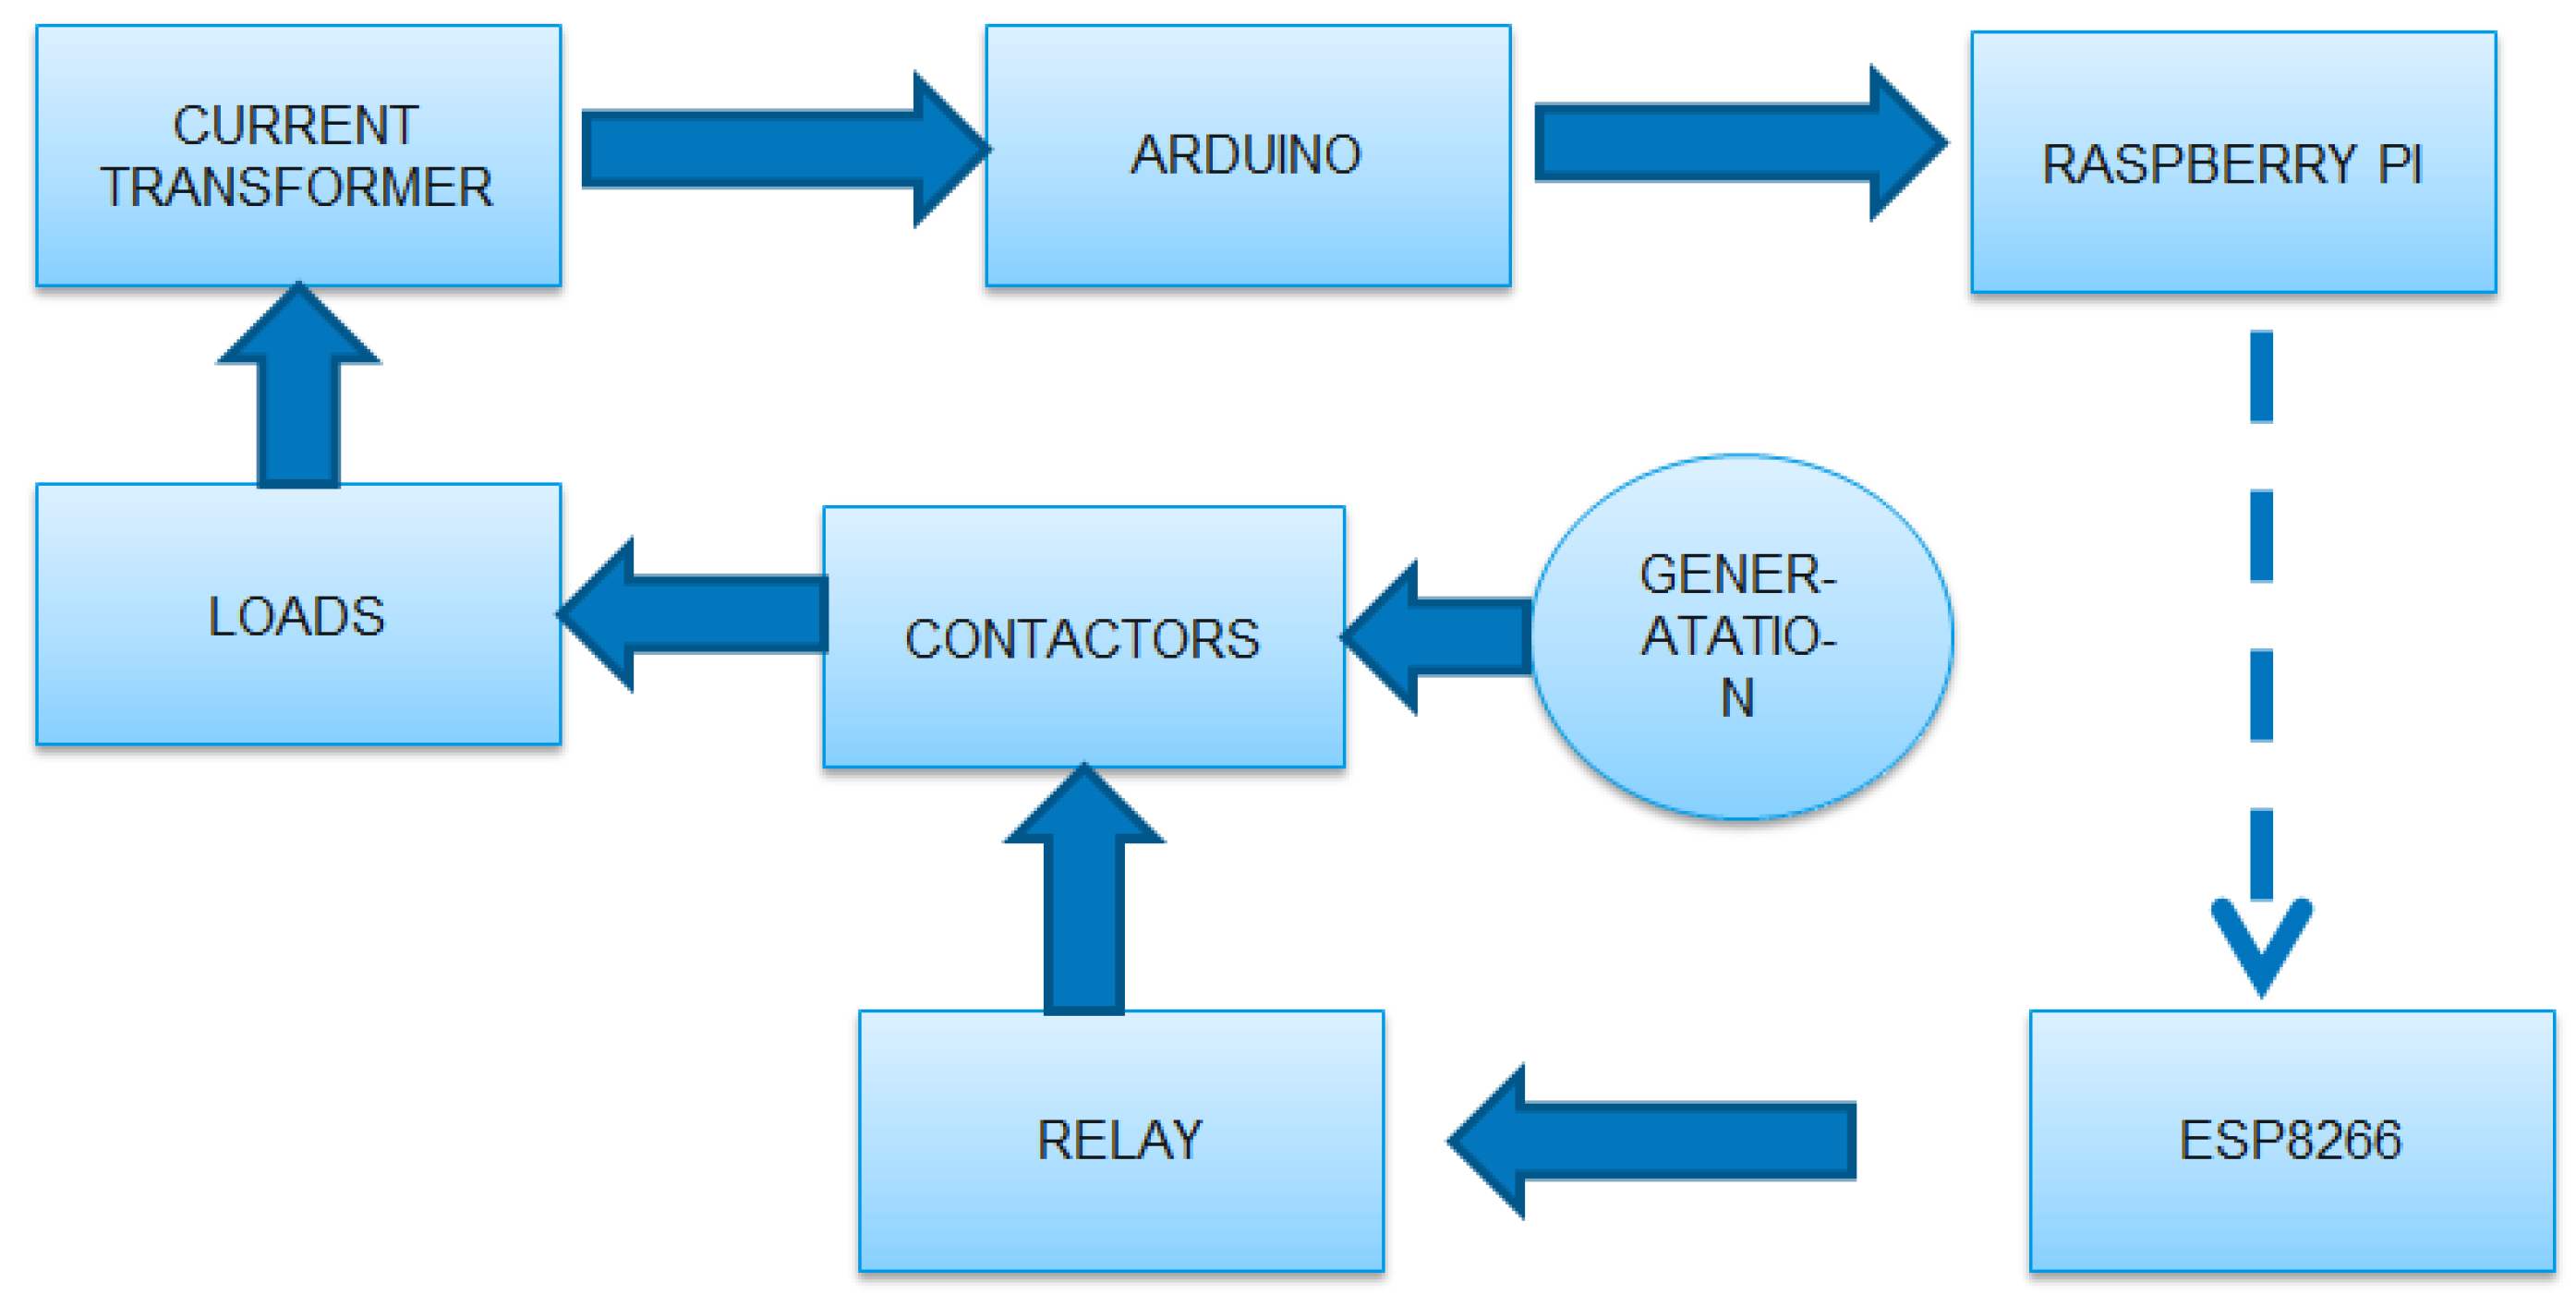
The control mechanism for the comprehensive restoration process is depicted in the block diagram illustrated in Figure 11. The dotted line signifies wireless communication via the MQTT protocol. The Raspberry Pi, in conjunction with the Arduino, functions as an intermediary for the loads, identifying faults and their locations, and subsequently transmitting messages to the ESP8266, which regulates the operation of the circuit breakers.
4.4. System Response for Different Faults
Upon a fault in bus 4, the power supply to all loads linked to generator 1 is disrupted. Upon a fault in load bus 7, the power supply to load 2 is disrupted. The identical conditions apply to each generator. Figure 12 When a fault arises in bus 5, bus 6, and bus 9, the power supply to load 2, load 4, and load 6, respectively, is disrupted, but can be reinstated by the assistance of neighbouring generators by reconfiguring the system.
4.5. Reconfiguration of the Distribution Network
To execute the self-healing and Fault Detection, Isolation, and Restoration (FDIR) technique, the system can be changed into a ring main system utilising two supplementary contactors, each positioned between two contiguous phases. The entire restructured distribution network is seen in Figure 13.
Figure 12.
System Before Reconfiguration
The algorithm for effective FDIR was developed and for each case of fault, the state of the loads before and after FDIR implementation is shown in table 6 and table 7 respectively.
Table 5.
Fault and Load Status with Number of Affected Loads
| FAULT | LOAD 1 | LOAD 2 | LOAD 3 | LOAD 4 | LOAD 5 | LOAD 6 | NUMBER OF AFFECTED LOADS |
| 1 | OFF | OFF | ON | ON | ON | ON | 2 |
| 2 | ON | OFF | OFF | ON | ON | ON | 1 |
| 3 | ON | ON | OFF | OFF | ON | ON | 2 |
| 4 | ON | ON | ON | OFF | OFF | ON | 1 |
| 5 | ON | ON | ON | OFF | ON | OFF | 2 |
| 6 | ON | ON | ON | ON | OFF | OFF | 1 |
Table 6.
Load Status and Number of Affected Loads
| FAULT | LOAD 1 | LOAD 2 | LOAD 3 | LOAD 4 | LOAD 5 | LOAD 6 | NUMBER OF AFFECTED LOADS |
| 1 | OFF | ON | ON | ON | ON | ON | 1 |
| 2 | ON | OFF | ON | ON | ON | ON | 1 |
| 3 | ON | ON | OFF | ON | ON | ON | 1 |
| 4 | ON | ON | ON | OFF | ON | ON | 1 |
| 5 | ON | ON | ON | ON | OFF | ON | 1 |
| 6 | ON | ON | ON | ON | ON | OFF | 1 |
It can be seen that after the implementation of FDIR algorithm, the number of affected loads has been decreased to 1 for all the fault cases In the event of a fault in the system, the current transformers positioned at various locations detect the corresponding fault current and transmit the fault current value to the Arduino. The Arduino identifies the fault using the FDIR approach and transmits the message to the ESP8266 via the Raspberry Pi. Based on the message, the ESP8266 activates the necessary circuit breakers through relays, therefore detecting and isolating the fault. An alternative circuit breaker is activated to supply power to the unaffected loads from a different generator. The RPi and ESP8266 function as two agents that convey information pertaining to the issue. Consequently, the FDIR (Fault Detection, Isolation, and Restoration) operation has been successfully executed in the prototype.
5. Conclusion
In this paper, we presented a novel architecture for implementing self-healing mechanisms within smart power distribution systems using a Multi-Agent System (MAS). Our approach leveraged the capabilities of the Java Agent Development Environment (JADE) integrated with MATLAB/Simulink to simulate dynamic fault scenarios and the subsequent intelligent responses of the system. The proposed system significantly enhances the reliability and efficiency of power distribution by enabling automated fault detection, isolation, and restoration (FDIR) processes.
The simulation results from the nine-bus distribution network demonstrate the effectiveness of our MAS in managing faults dynamically and restoring power promptly. By utilizing FDIR techniques, the system effectively minimized the duration and impact of power outages across the network. The practical implementation and validation using Raspberry Pi further confirmed the operational capabilities of the system, showcasing its potential for real-world applications.
The integration of MAS not only automates the recovery process but also ensures a high degree of adaptability and scalability, making it suitable for evolving smart grid environments. This research contributes to the field of smart grids by providing a robust framework for enhancing grid resilience against faults and disruptions.
Abbreviations
The following abbreviations are used in this manuscript:
| FDIR | Fault Detection, Isolation, and Restoration |
| MAS | Multi-Agent System |
| FIPA | Foundation for Intelligent Physical Agents |
| JADE | Java Agent Development Environment |
| MACSimJX | MACSim Java Extension |
| TCP/IP | Transmission Control Protocol/Internet Protocol |
| SGCN | Smart Grid Communications Network |
References
- Kiasari, M.; Ghaffari, M.; Aly, H.H. A Comprehensive Review of the Current Status of Smart Grid Technologies for Renewable Energies Integration and Future Trends: The Role of Machine Learning and Energy Storage Systems. Energies 2024, 17(16), 4128. [CrossRef]
- Liu, Y.; Yang, X.; Wang, Z. Enhancing Smart Grid Integrated Renewable Distributed Generation. Renewable Energy 2023, 45, 154–172. [Google Scholar] [CrossRef]
- Zhang, Q.; Cheng, M.; Luo, F. Game Theory in Smart Grids: Strategic Decision-Making for Renewable Energy Management. IEEE Transactions on Sustainable Energy 2024, 15(3), 1040-1055. [CrossRef]
- McKinsey & Company. Integrating Renewable Energy Sources into Grids. McKinsey Global Energy Perspective 2023, McKinsey, November 2023. https://www.mckinsey.com/industries/electric-power-and-natural-gas/our-insights/global-energy-perspective. /.
- Ren, J.; Lee, S.; Park, J. Integration of Wind Energy in Smart Grid: A Review. American Institute of Physics 2023, 1–15. [Google Scholar] [CrossRef]
- Murthy, S.; Kumar, A.; Singh, B. Integration of Electric Vehicles, Renewable Energy Sources, and IoT for Smart Grid Applications. IEEE Explore 2024. https://ieeexplore.ieee.org/document/9145221.
- Fan, Q.; Gao, W.; Zhou, M. Renewable Energy Integration of IoT Systems for Smart Grid Applications. IEEE Transactions on Industrial Informatics 2023, 19, 3700–3711. https://ieeexplore.ieee.org/abstract/document/8759241.
- Khan, I.; Ahmad, A.; Almogren, A. A Review of the Integration Techniques for Renewable Energy Sources with Smart Grids. Journal of Cleaner Production 2023, 291, Article 125624. [Google Scholar] [CrossRef]
- Chen, L.; Zheng, Y.; Song, S. Empowering the Grid: A Comprehensive Review of Artificial Intelligence in Smart Grids. IEEE Transactions on Artificial Intelligence 2023, 2(5), 445-462. https://ieeexplore.ieee.org/abstract/document/9079119.
- Wang, X.; Li, X.; Zhang, Y. Analyzing Complexities of Integrating Renewable Energy Sources into Smart Grids. Energy Strategy Reviews 2024, 50, 101247. [Google Scholar] [CrossRef]
- Patel, S.; Singh, R.; Sharma, N. Systematic Review Towards Integrative Energy Management of Smart Grids. IEEE Access 2023, 11, 17471–17484. [Google Scholar] [CrossRef]
Figure 1.
Single line diagram of the system
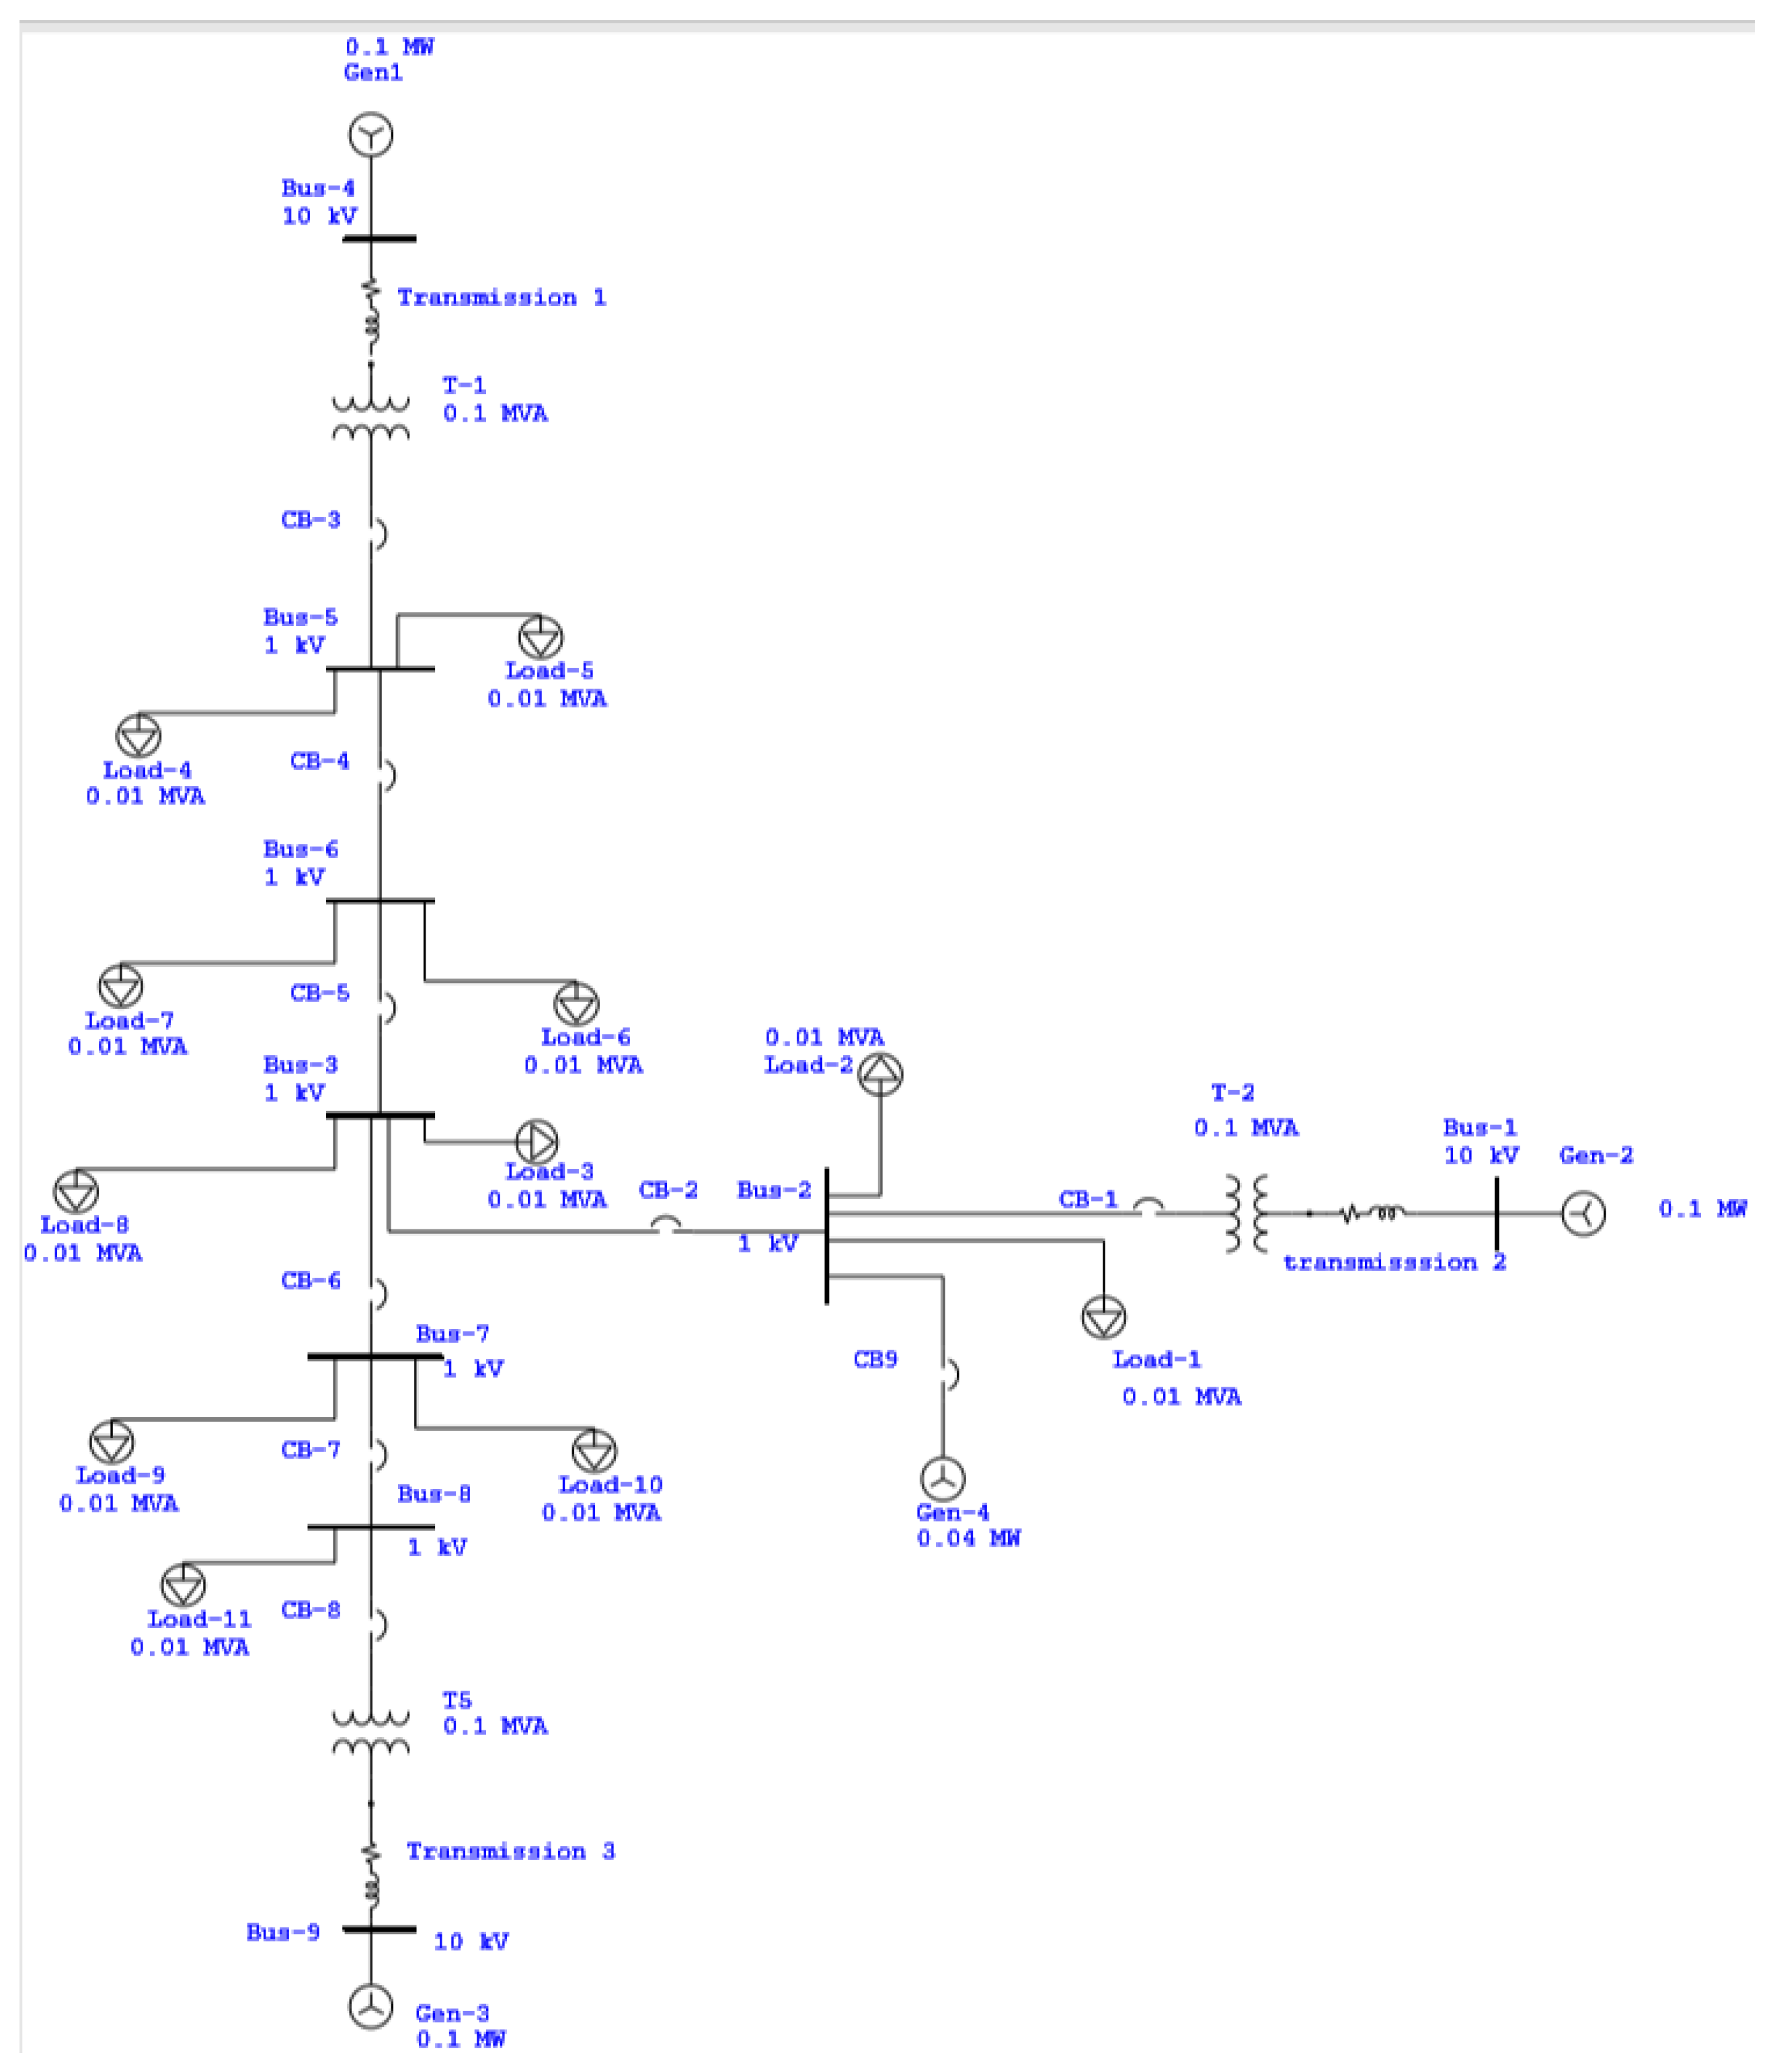
Figure 10.
relay module circuit
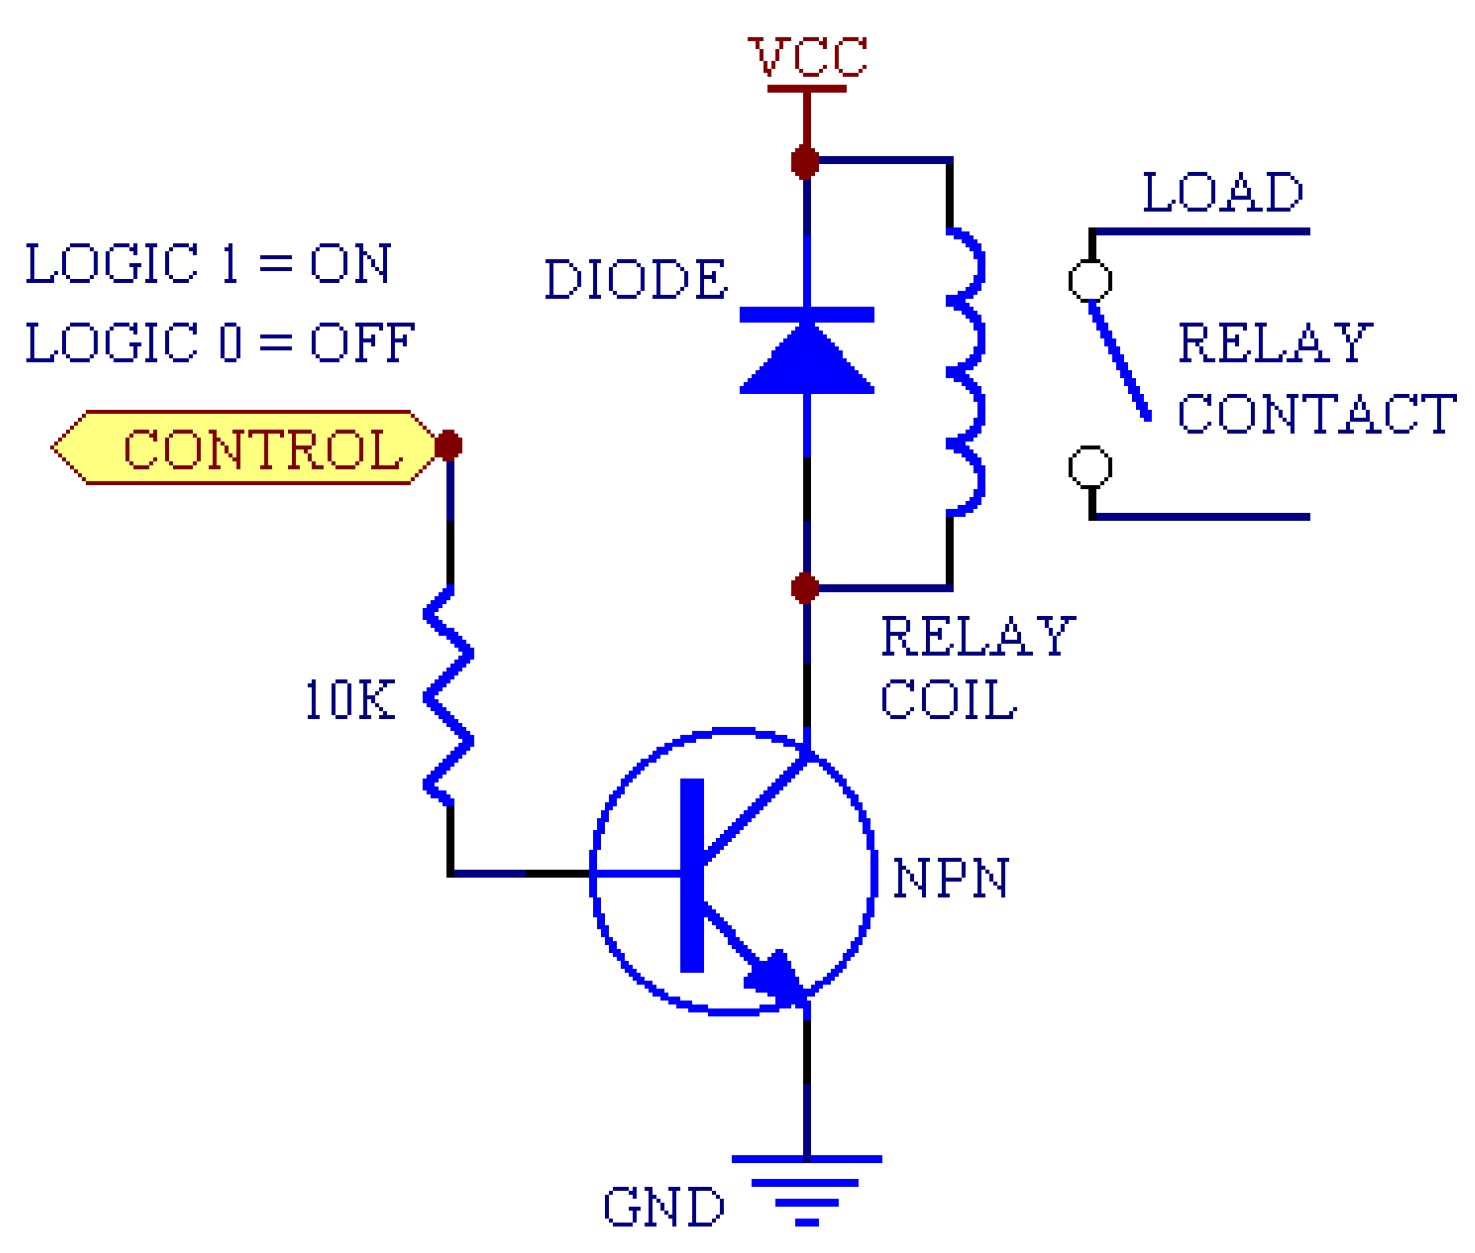
Figure 13.
System after Reconfiguration
Disclaimer/Publisher’s Note: The statements, opinions and data contained in all publications are solely those of the individual author(s) and contributor(s) and not of MDPI and/or the editor(s). MDPI and/or the editor(s) disclaim responsibility for any injury to people or property resulting from any ideas, methods, instructions or products referred to in the content. |
© 2025 by the authors. Licensee MDPI, Basel, Switzerland. This article is an open access article distributed under the terms and conditions of the Creative Commons Attribution (CC BY) license (http://creativecommons.org/licenses/by/4.0/).
Copyright: This open access article is published under a Creative Commons CC BY 4.0 license, which permit the free download, distribution, and reuse, provided that the author and preprint are cited in any reuse.


