
Submitted:
14 April 2025
Posted:
15 April 2025
You are already at the latest version
Abstract
In this study, the CrCuFeNiTiAl1 equiatomic alloy was used as a base, which was modified by adding graphite in proportions of 0.5, 1.0, 2.5, and 5.0 mol%. The samples were obtained by powder metallurgy and sintering at 1,200°C for 2 h in a furnace with a protective argon atmosphere. The structural characterization was performed by XRD. Microstructural evaluation was determined by SEM. The best mechanical microhardness and compressive strength results were obtained in the samples with the lowest amount of graphite (238 mHV and 1000 MPa, respectively). Density values showed that samples with low amounts of graphite have better densification, lower porosity, and finer structural characteristics than those with graphite percentages higher than 1 mol%. The XRD studies determined the formation of a mixture of crystalline structures composed of FCC due to the presence of Cu, Ni, and Al metals, BCC due to Fe and Cr metals, and HCP due to Ti, and the formation of Cr7C3 compound. SEM analysis showed the formation of cracks and porosity due to the formation of carbides.
Keywords:
high entropy alloy
; multicomponent
; microstructure
; structure
; graphite
1. Introduction
High-entropy alloys are characterized by having an equiatomic combination of multiple elements in their composition. Unlike conventional alloys, which usually have one or two main elements, high entropy materials contain four or more elements in similar atomic proportions [1]. The idea behind high-entropy materials is to create a composition of elements that provides a crystalline structure with dislocations without following a specific pattern. High configurational entropy can generate beneficial effects, such as increased microstructural stability, higher mechanical strength and toughness, and hardness properties [2,3,4,5,6]. Cantor alloy (CoCrFeMnNi) is a high-entropy multicomponent alloy first developed by Cantor et al. in early 2004 [7]. Some of the characteristics and properties of the Cantor alloy are: considerably high mechanical hardness and toughness, good ductility, corrosion resistance, thermal stability, and low degradation at high temperatures compared to conventional/traditional alloys [8]. The CoCrFeMnNi alloy is widely considered an exemplary high-entropy material, which is stable as a single solid solution at all temperatures below its melting point [9]. Hence, from Cantor's alloy, many more have been developed with some variations in the alloying elements, giving rise to a large number of alloys with different characteristics [10,11]—for instance, the CoCrFeNiAlX alloy results in a multicomponent material with promising thermo-mechanical properties. Recent studies have indicated that the combination of strength and ductility results from the complex interplay between multiple strengthening mechanisms created by varying the aluminum concentration in the alloy [12,13,14]. Since the macroscopic properties of this type of alloy depend to a large extent on interatomic interactions, it is convenient to probe the local structure and structural disorder around each element using specific techniques [15]. The conventional way to develop a new material is to select the main component based on some primary property requirements, and use alloying additions to impart secondary properties. This strategy has resulted in many successful multicomponent materials with remarkably good physical properties for engineering uses, such as toughness, fatigue resistance, hardness, and fracture toughness [16]. Different metallurgical processing routes, such as forging and casting, can be used to obtain this type of alloy. It is also possible to opt for more sophisticated methods that provide greater control over the microscopic and macroscopic structure of the alloy, such as direct energy deposition, blinder jetting, spark plasma sintering, and powder metallurgy. The disorder caused by multiple elements tends to inhibit the formation of brittle phases by randomly dispersing atoms of each element, leading to increased strength and toughness. So far, several HEAs with outstanding properties have been discovered, including new superior HEAs beyond conventional alloys. Table 1 compares new HEAs obtained by different processing routes, with their final phases and obtained microhardness.
The objective of this work is to study the effect of graphite addition in different concentrations on the phase evolution, microstructure, and mechanical properties of the high-entropy CrCuFeNiTiAl1CX alloy synthesized by the powder metallurgy route. This alloy is considered a unique multicomponent alloy due to the characteristics it can adopt if manufactured by the powder processing route. By presenting a structure without specific order, the alloy acquires properties of each of its components, thus improving its physical characteristics [21].
2. Materials and Methods
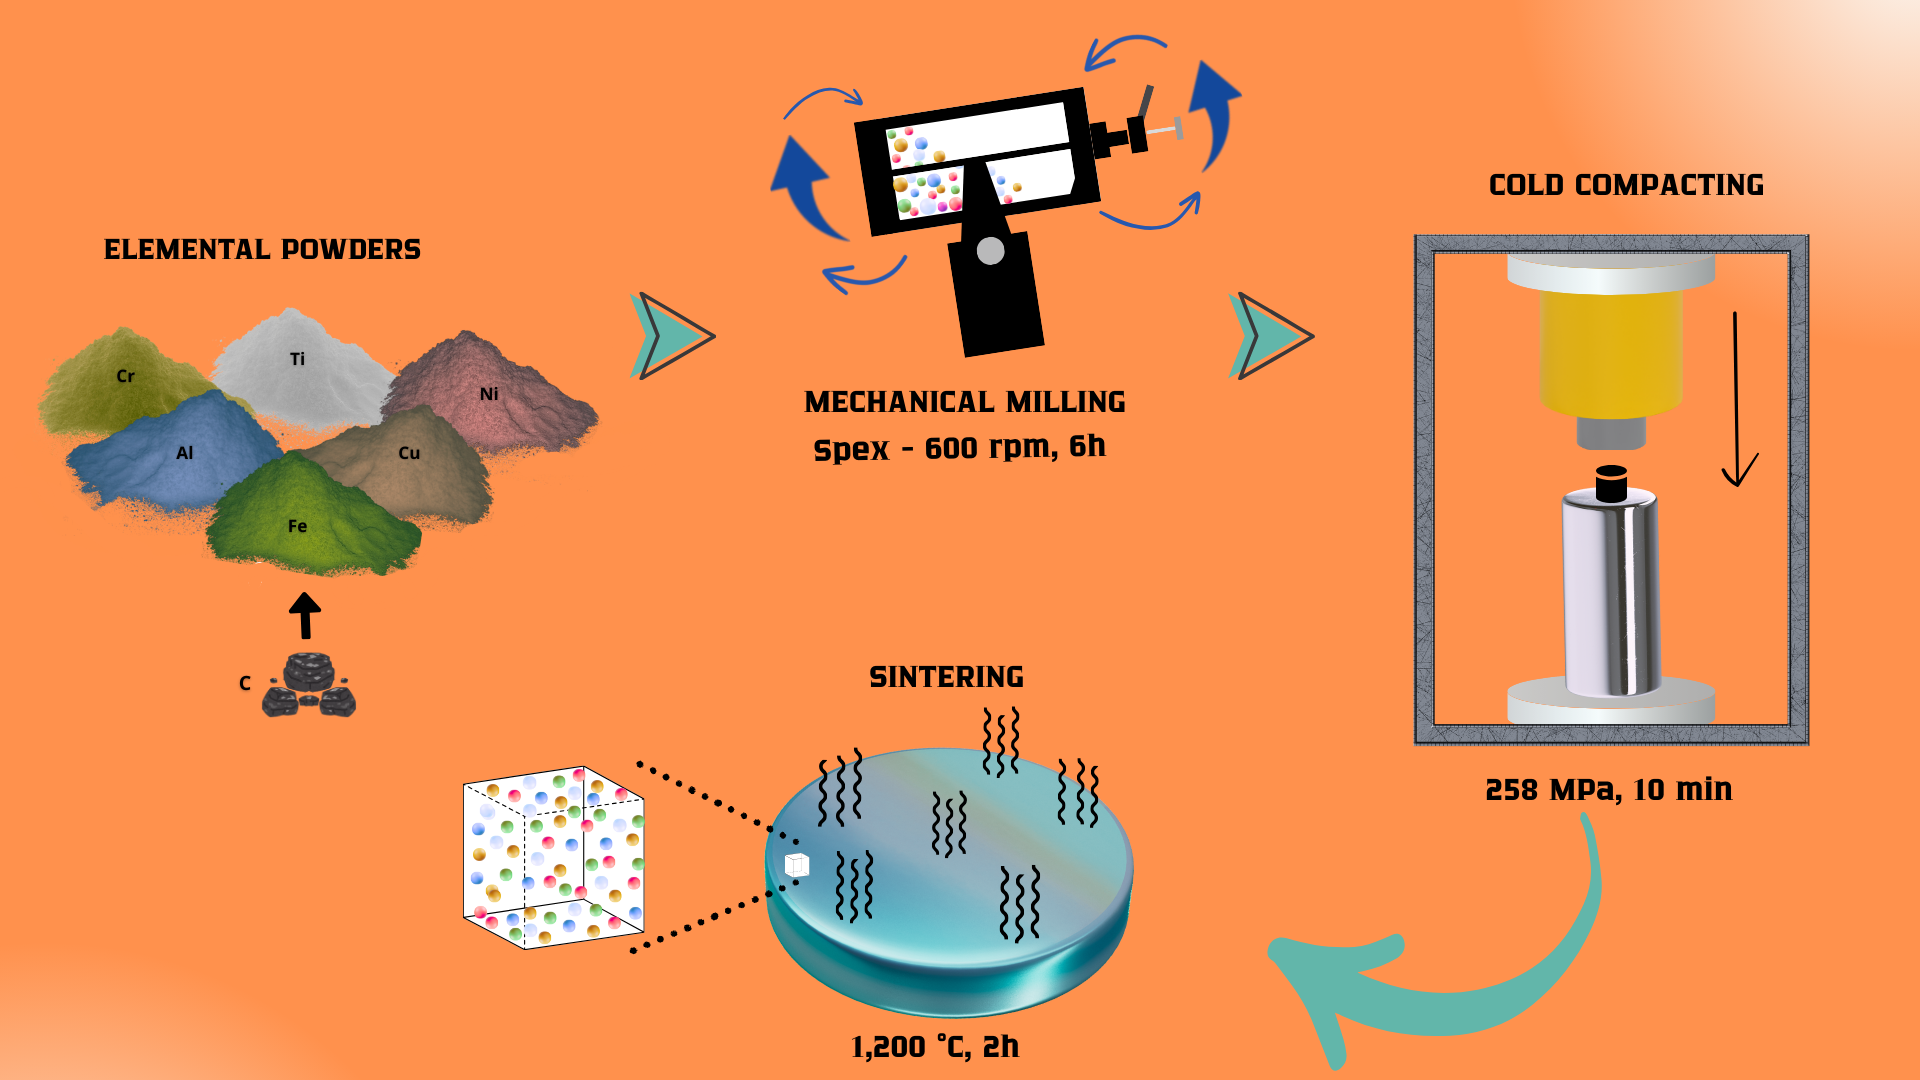
Elemental powders of Al, Cr, Cu, Fe, Ni, and Ti (SkySpring Nanomaterials, Inc.) with purity greater than 99% and sizes of 1 – 2 μm and graphite (Alfa Aesar, 99.9%, 1 μm) were mechanically processed with a SPEX 8000M high-energy mill in a hardened steel container with 13 mm balls as milling media and an inert Ar atmosphere. The milling ball to powder ratio (in wt.) was kept 5 to 1 for all experimental runs. Milling was conducted in an argon atmosphere at 600 rpm for 6 h. To control particle size distribution and segregation of the powder particles during the ball milling action, 1 mL of CH3OH was used as process control agent. The studied system was: CrCuFeNiTiAl1CX, where x = 0, 0.5, 1, 2.5, 5 mol%; the remaining metals were added in equimolar fractions. Samples have been labeled as 1, 2, 3, 4, and 5 for carbon content of x = 0, 0.5, 1.0, 2.5, and 5.0 mol%, respectively. After the grinding process, the samples were passivated for 24 h in a glove box filled with an Air-Ar mixture. With the help of a uniaxial press (Montequipo 9T, Mexico), the resulting powder from the grinding stage was compacted into cylindrical green samples, using 258 MPa for 10 minutes. Before the sintering process, the five alloy samples were placed in a ceramic quartz tube separated by quartz pads, as shown in Figure 1; this is done in order to avoid component diffusion during sintering.
Samples were sintered in an electrical furnace (Carbolite Gero, England) with argon atmosphere at 1,200 °C for 2 h, using a heating speed of 10°C/min. Before characterization of the sintered samples, their surfaces were ground with SiC sandpaper and then polished using diamond suspension. In order to observe the structure and microstructure of the alloy, an electrochemical attack on the surface of the samples was performed. To remove oxides, 10% oxalic acid solution in distilled water was used for microetching. Electrochemical etching was carried out as follows: a power source was used to apply an electrical discharge on the surface of the samples with the help of a mm diameter electrode, using 6 V and 10 A for 12 seconds. A Shimadzu SALD-201V laser diffraction equipment was used to measure the particle size distribution. The density of the samples was determined using the Archimedes method. Crystalline phases of sintered alloys were determined using X-ray diffraction analysis (XRD) under CuKα radiation, performed on DRX D8 Advance and interpreted with the X'Pert Highscore Plus PANalytical software using patterns in the ICDD PDF2 database. The microstructural features of the HEAs were analyzed in an optical microscope Zeiss Axio and scanning electron microscope FEI Quanta 200 FEG equipped with an EDX-LE Shimadzu for chemical analysis of samples. Microhardness was determined in agreement with the ASTM E384–16 standard [22]. In this case, ten measurements were performed, and each indentation was made at a spacing distance of at least 5 times the size of each print; the used load was 9.8N for 15 s. These measurements were performed with a microhardness tester (Wilson Instruments Model S400, USA). The compressive strength was evaluated with a Universal Material Tester WP 300 Gunt.
3. Results
3.1. Particle Size Distribution
Figure 2 shows the particle size distribution for each system. In this figure, it can be seen that the samples with 0.5 C, 1.0 C, and 2.5% C presented a trend which ranged from 3 to 5 μm. The sample without the dopant element presented particle sizes from 0.5 to 0.8 μm, while the sample with 5% C presented diametric ranges from 6 to 9.5 μm, indicating the formation of agglomerates of the powder used for the alloy, this is corroborated by the image in Figure 3, where the images of sample 1 (0% C) and sample 5 (5% C) are presented. In these images, it can be observed in the sample with C that there is a strong agglomeration and lamination of the metallic particles, this may be due in part to the presence of graphite that coats the metal particles, thereby increasing their static charge, and hence the electrostatic attraction between the powders, causing them to agglomerate.
3.2. Density
Figure 4 shows the density graphs and porosity measurements of the sintered samples. These plots show that the reached density in the alloys was very low, since samples 1 and 2 are the ones that best densified, reaching approximately 80% of their relative density. It is also observed that as the alloy's C content increases, the alloy's relative density tends to decrease with a consequent increase in the porosity of the alloy. The C in the alloys plays a very important role in the densification of the alloys since it has already been observed that milling tends to make the particles agglomerate. Commercially chemically purified graphite normally contains a large amount of chemically occluded gases, which during sintering are desorbed, generating porosity in the material, in addition the carbon reacts at high temperature with the oxidized surface layer of some powdered metals generating gaseous products (CO and CO2) that decrease the densification of the samples, the higher the concentration of graphite, this effect is intensified.
3.3. Structure
Figure 5 shows the diffraction patterns of the five samples after the sintering stage. In this figure it can be observed for the alloys with 0 and 0.5 % mol C at 39.3, 42.1, 51.3 and 76.2° reflections which are normally related to some FCC solid solution phases have formed, due to the presence of copper, nickel and aluminum, on the other hand, at 32.3, 37.2, 63.1, 78.4 and 99.1° the presence of the solid solution BCC phase due to chromium and iron present in the alloy appears. The figure shows that from 1 % mol C in the diffraction patterns at 2 theta degree angles of 71.4°, 82.6°, and 93.2°, the presence of the compact hexagonal structure appears, which corresponds to the formation of carbides in the alloys, as well as to titanium characteristic reflections. The carbides formed are mainly of the Cr7C3 type. On the other hand, the diffraction patterns also show that the intensity of the FCC phase increases as the C content increases in the alloy, while the BCC phase tends to decrease in intensity. Due to the high electronegativity of C, this is a strong carbide former, mainly with Cr, Fe, and Ti [23]. This is because the phases formed between C and Fe, and C and Ti are FCC. Moreover, C forms carbides with Cr. Both Cr and Fe are BCC elements and when forming carbides, the presence of the BCC phase should tend to decrease, increasing consequently the presence of the FCC phase and appearing the HCP phase. It can be seen that the alloys have a mixture of different crystalline structures, causing microstructural disorder, which is expected for a high-entropy alloy.
3.4. Microstructure
Figure 6 shows a comparison of the observed microstructure by optical microscopy of the five alloys. In these images, it can be seen that the microstructure is characterized by the presence of grains with a similar size distribution that do not follow a specific pattern and are microstructurally disordered due to the number of elements contained in the alloy, nevertheless, it can be seen that by increasing the amount of the dopant element, cracks and pores are observed. Higher porosity is observed in the samples with more than 1.0 mol % C with cracks reaching 200 μm, thus confirming the observations made in the density measurements that as the C content increases the density decreases, increasing in turn the porosity, a situation due to the agglomeration of the particles by the presence of C and the abnormal growth of the microstructure during sintering. The presence of cracks is likely to affect the mechanical properties of the alloys. The images also show a diversity of shades on the surface of the alloys due to the different phases present in the alloys, which in turn is indicative of the entropy present in the alloys.
3.5. Mapping
Figure 7 shows some SEM images and their corresponding mappings to verify the spatial distribution of the alloy components. Elemental mapping indicated that after sintering, CrCuFeNiTiAl1CX alloys are constituted by a multi-phase microstructure, as can be seen in the figure by the zones with different contrasts in the microstructure. In the mapping of spatial regions, a good distribution of alloying elements was observed, indicating the formation of the high entropy alloys. From these results, it can be inferred that the microstructure of this alloy was composed of a high Cu, Fe, and Ni solid solution (light region); a dark region composed of Ti and Cr; and dispersed chromium carbide phases.
3.6. Energy-Dispersive X-Ray Spectroscopy (EDS)
The microstructure and the chemical composition of the different prepared CrCuFeNiTiAl1CX alloys were characterized by SEM and EDS analysis, as shown in Figure 8. In this figure, the microstructures with different phases can be observed and distinguished by their different contrasts, indicating a variation in their chemical composition. On the right side of each image, the corresponding spectrum is shown, which presents the elemental constituents of the alloy, and the chart with the results of the chemical analysis. These analyses in all cases specify that the resulting chemical composition was close to the hypothesized composition. Thus, the X-ray diffraction results and the observations made in the mappings are confirmed. Thus, it is related to the presence of these phases in the microstructure, and the chemical analyses suggest the formation of alloys between the used elements that, in turn form a solid solution and, consequently, have a high entropy. In all alloys, the microstructure shows a non-homogeneous grain distribution due to the presence of the different phases that make up the sample. As the C content in the alloys increases, grain size growth is observed also; for higher C contents, some dark zones can be observed, indicating the formation of porosity and carbides in these sample areas.
3.7. Mechanical Properties
3.7.1. Microhardness
Figure 9 shows the microhardness for each alloy. The best microhardness value with 238 HV is obtained in the sample that does not contain C, while the sample with 5% mol C presents the lowest microhardness value with 137 HV. According to this graph, with increasing C content in the alloy, the microhardness of the alloy tends to decrease. Although, an increase in the hardness of the alloys could be expected due to the formation of carbides, it can be inferred from these results and the observations made in the previous analyses that the formation of porosity and cracks in the microstructure of the alloys due to agglomeration of the powders during milling and abnormal grain growth during sintering impede the full hardening of the sample.
3.7.2. Compression Strength
Figure 9 shows the compressive strength values. Similar to what was found in the hardness measurements, in this graph, it can be observed that the sample that obtained the best compressive strength value is the sample that does not contain the dopant element, while the one that contains the highest amount of C is the one that presents the lowest strength value. From all this, it can be concluded that graphite is not a component that benefits the mechanical properties of this type of alloy. This was already mentioned due to the agglomeration of the powders during milling, the grain growth during sintering, and the formation of carbides and porosity in the last stage of manufacture.
4. Conclusions
High-entropy alloys were successfully fabricated by powder metallurgy. However, from the results obtained, it can be deduced that the use of C is not recommended to increase the mechanical properties of this type of alloy. Based on the experimentation and analysis carried out on the alloys, the following conclusions were obtained:
- ○
- With increasing C, there is agglomeration of the metal particles, which causes the generation of large agglomerates and consequently abnormal grain growth during sintering.
- ○
- The structure consists of cubic phases centered on the body and faces for samples with 0 and 0.5% C, while for higher C contents the compact hexagonal structure appears due to the formation of carbides mainly of chromium (Cr7C3).
- ○
- The microstructure is characterized by the presence of grains with a similar size distribution that do not follow a specific pattern and are disordered due to the number of elements contained in the alloy. Also, increasing the amount of the dopant element causes cracking and pore formation.
- ○
- Elemental mapping indicated that the samples with sintered CrCuFeNiTiAl1CX alloys are formed by a multi-phase microstructure, as can be seen by the zones with different contrasts in the microstructure.
- ○
- The mechanical properties (microhardness and compressive strength) are negatively affected as the C content of the alloy increases.
Author Contributions
Conceptualization, SAG-E., I.E.-G and ER-R.; methodology, SAG-E., JAC-R, CGG-R and CDG-E.; software, JAC-R and JAR-G.; validation, I.E.-G, RM-S and ER-R.; formal analysis, , SAG-E., JAC-R, CGG-R and CDG-E.; investigation, SAG-E, CGG-R and CDG-E.; resources, CAC-A and RM-S.; data curation, SAG-E., JAC-R, CGG-R and CDG-E; writing—original draft preparation, SAG-E., JAR-G, CGG-R and CDG-E; writing—review and editing, SAG-E., I.E.-G, CAC-A and ER-R.; visualization, I.E.-G, RM-S, CAC-A and ER-R..; supervision, I.E.-G. and CGG-R.; All authors have read and agreed to the published version of the manuscript.
Funding
This research received no external funding.
Data Availability Statement
The original contributions presented in the study are included in the article; further inquiries can be directed to the corresponding author.
Conflicts of Interest
The authors declare that they have no interests or personal relationships that could influence the work reported in this paper.
Abbreviations
The following abbreviations are used in this manuscript:
| SEM | Scanning electron microscopy |
| XRD | X-ray diffraction |
| FCC | Face center cubic |
| BCC | Body center cubic |
| HCP | Hexagonal compact |
| EDS | Energy dispersive of X-ray spectroscopy |
| C | Carbon |
| μHV | Micro hardness Vickers |
| HEAs | High-entropy alloys |
References
- Zhang, Y.; Zuo, T.T.; Tang, Z.; Gao, M.C.; Dahmen, K.A.; Liaw, P.K.; Lu, Z.P. Microstructures and properties of high-entropy alloys. Prog. Mater. Sci. 2014, 61, 1–93. [CrossRef]
- Liu, F.; Liaw, P.K.; Zhang, Y. Recent Progress with BCC-Structured High-Entropy Alloys. Metals 2022, 12, 501. [CrossRef]
- Yeh, J.-W.; Chen, S.K.; Lin, S.-J.; Gan, J.-Y.; Chin, T.-S.; Shun, T.-T.; Tsau, C.-H.; Chang, S.-Y. Nanostructured High-Entropy Alloys with Multiple Principal Elements: Novel Alloy Design Concepts and Outcomes. Adv. Eng. Mater. 2004, 6, 299–303. [CrossRef]
- H. H. Mao, H.L. Chen, Q. Chen, TCHEA1: A thermodynamic database not limited for “high entropy” alloys. J. Phase Equilibria Diffus. 2017, 38, 353–368.
- Otto, F.; Yang, Y.; Bei, H.; George, E. Relative effects of enthalpy and entropy on the phase stability of equiatomic high-entropy alloys. Acta Mater. 2013, 61, 2628–2638. [CrossRef]
- Poletti, M.; Battezzati, L. Electronic and thermodynamic criteria for the occurrence of high entropy alloys in metallic systems. Acta Mater. 2014, 75, 297–306. [CrossRef]
- Cantor, B. Multicomponent high-entropy Cantor alloys. Prog. Mater. Sci. 2021, 120. [CrossRef]
- Mukarram, M.; Mujahid, M.; Yaqoob, K. Design and development of CoCrFeNiTa eutectic high entropy alloys. J. Mater. Res. Technol. 2021, 10, 1243–1249. [CrossRef]
- Mukarram, M.; Mujahid, M.; Yaqoob, K. Design and development of CoCrFeNiTa eutectic high entropy alloys. J. Mater. Res. Technol. 2021, 10, 1243–1249. [CrossRef]
- M. Manzonia, U. Glatzelb, New multiphase compositionally complex alloys driven by the high entropy alloy approach. Mater. Charact. 2019, 147, 512–532.
- MacDonald, B.E.; Fu, Z.; Zheng, B.; Chen, W.; Lin, Y.; Chen, F.; Zhang, L.; Ivanisenko, J.; Zhou, Y.; Hahn, H.; et al. Recent Progress in High Entropy Alloy Research. JOM 2017, 69, 2024–2031. [CrossRef]
- Li, J.; Yang, H.; Wang, W.Y.; Kou, H.; Wang, J. Thermal–Mechanical Processing and Strengthen in AlxCoCrFeNi High-Entropy Alloys. Front. Mater. 2021, 7. [CrossRef]
- R. Sriharitha, B. S. Murty, R. S. Kottada, Phase formation in mechanically alloyed AlxCoCrCuFeNi (x=0.45, 1, 2.5, 5 mol) high entropy alloys. Intermetallics, 2013, 32, 119–126.
- Ruiz-Jasso, G.E.; la Torre, S.D.-D.; Escalona-González, R.; Méndez-García, J.C.; Robles, J.A.C.; Refugio-García, E.; Rangel, E.R. Synthesis of CuCrFeNiTiAlx high entropy alloys by means of mechanical alloying and spark plasma sintering. Can. Met. Q. 2021, 60, 66–74. [CrossRef]
- Tsai, M.-H.; Yeh, J.-W. High-Entropy Alloys: A Critical Review. Mater. Res. Let. 2014, 2, 107–123. [CrossRef]
- Miracle, D.B.; Senkov, O.N. A critical review of high entropy alloys and related concepts. Acta Mater. 2017, 122, 448–511. [CrossRef]
- Zang, C.; Rivera-Díaz-Del-Castillo, P.E.J. High entropy alloy strengthening modelling. Model. Simul. Mater. Sci. Eng. 2022, 30, 063001. [CrossRef]
- Zhou, H.; Wang, Q.; Wang, L.; Zhao, X.; Feng, G. Digitalization and third-party logistics performance: Exploring the roles of customer collaboration and government. International Journal of Physical Distribution & Logistics Management 2023, 53, 467–488. https://doi org.dlsu.idm.oclc.org:9443/10.1108/IJPDLM-12-2021-0532.
- Wei, C.-B.; Du, X.-H.; Lu, Y.-P.; Jiang, H.; Li, T.-J.; Wang, T.-M. Novel as-cast AlCrFe2Ni2Ti05 high-entropy alloy with excellent mechanical properties. Int. J. Miner. Met. Mater. 2020, 27, 1312–1317. [CrossRef]
- Cantor, B.; Chang, I.T.H.; Knight, P.; Vincent, A.J.B. Microstructural development in equiatomic multicomponent alloys. Mater. Sci. Eng. A 2004, 375–377, 213–218. [CrossRef]
- Gromov, V.E.; Rubannikova, Y.A.; Konovalov, S.V.; Osintsev, K.A.; Vorob’ev, S.V. Generation of increased mechanical properties of Cantor high entropy alloy. Izv. Ferr. Met. 2021, 64, 599-605. [CrossRef]
- ASTM E384–16; Standard Test Method for Microindentation Hardness of Materials. ASTM International: West Conshohocken, PA, USA, 2016.
- The Chemistry of Carbon, Available online: https://chemed.chem.purdue.edu/genchem/topicreview/bp/ch10/carbon.php (accessed 8 March, 2025).
Figure 1.
Ceramic quartz with the five samples inside it.
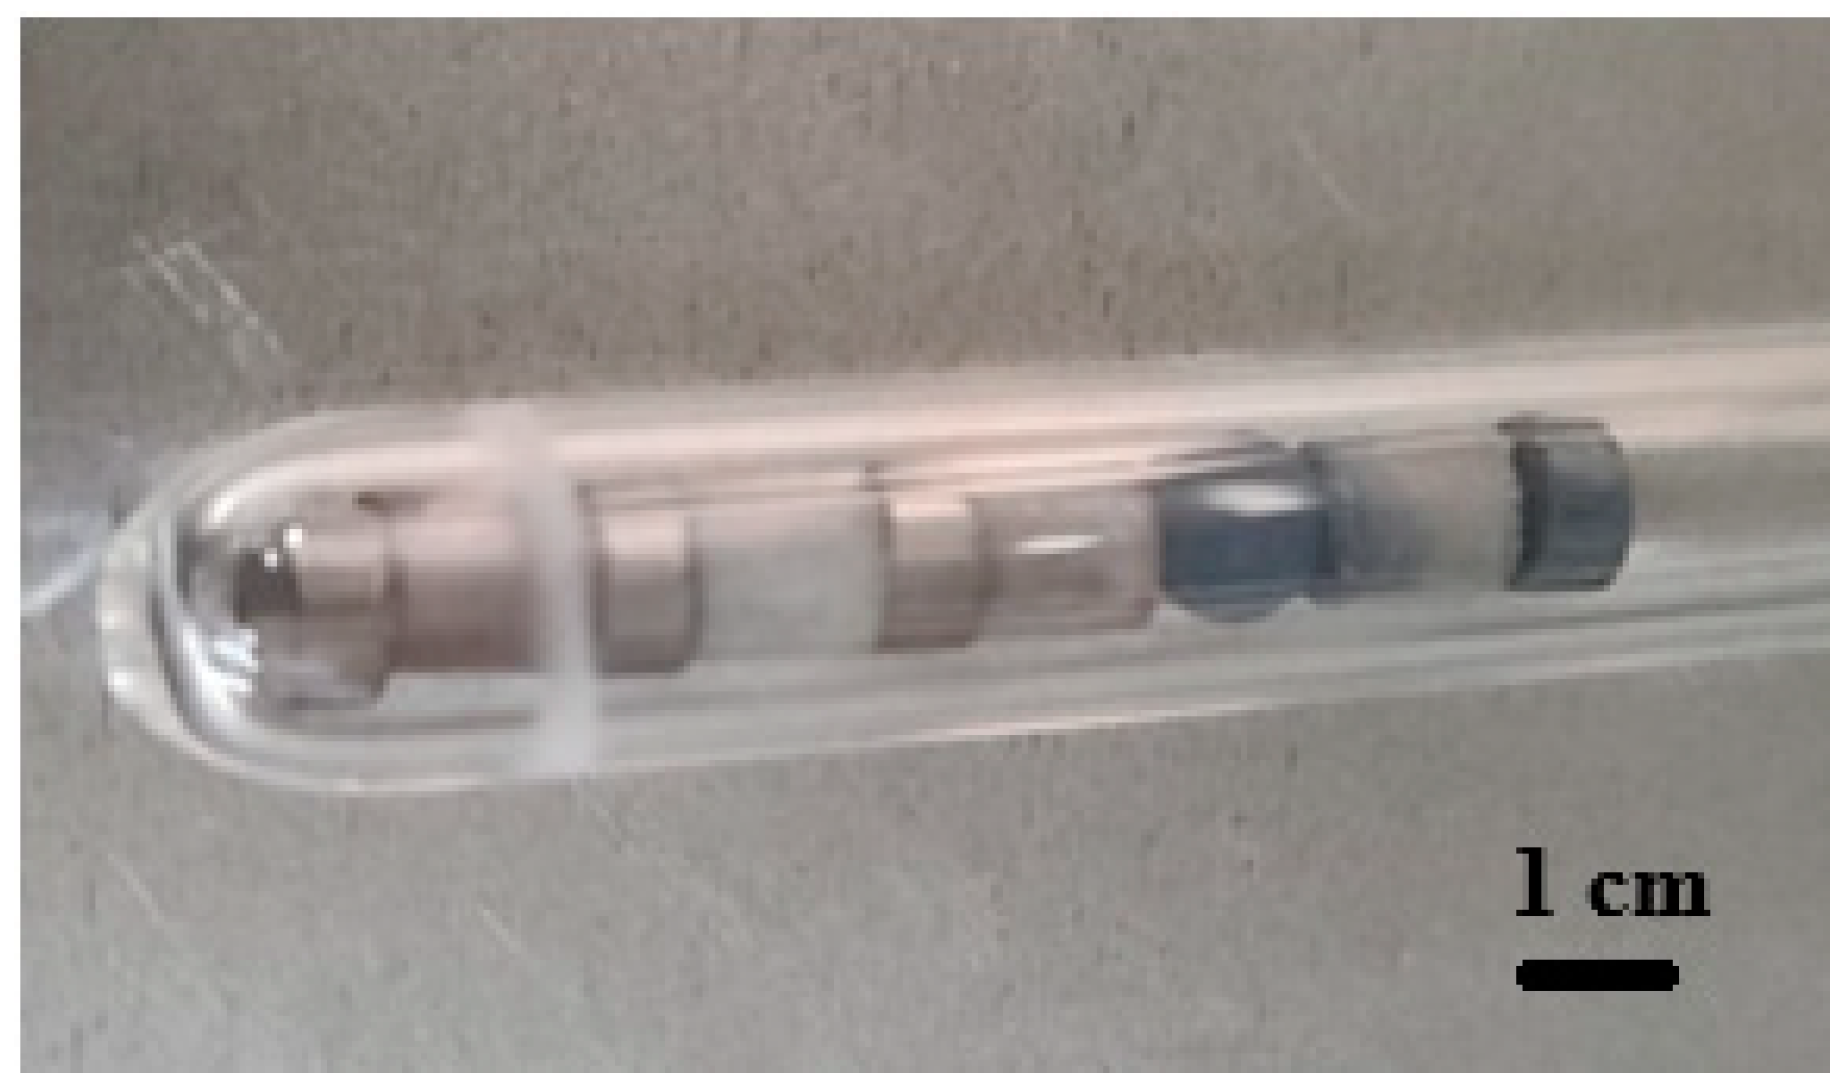
Figure 2.
Particle size distribution after the grinding stage.
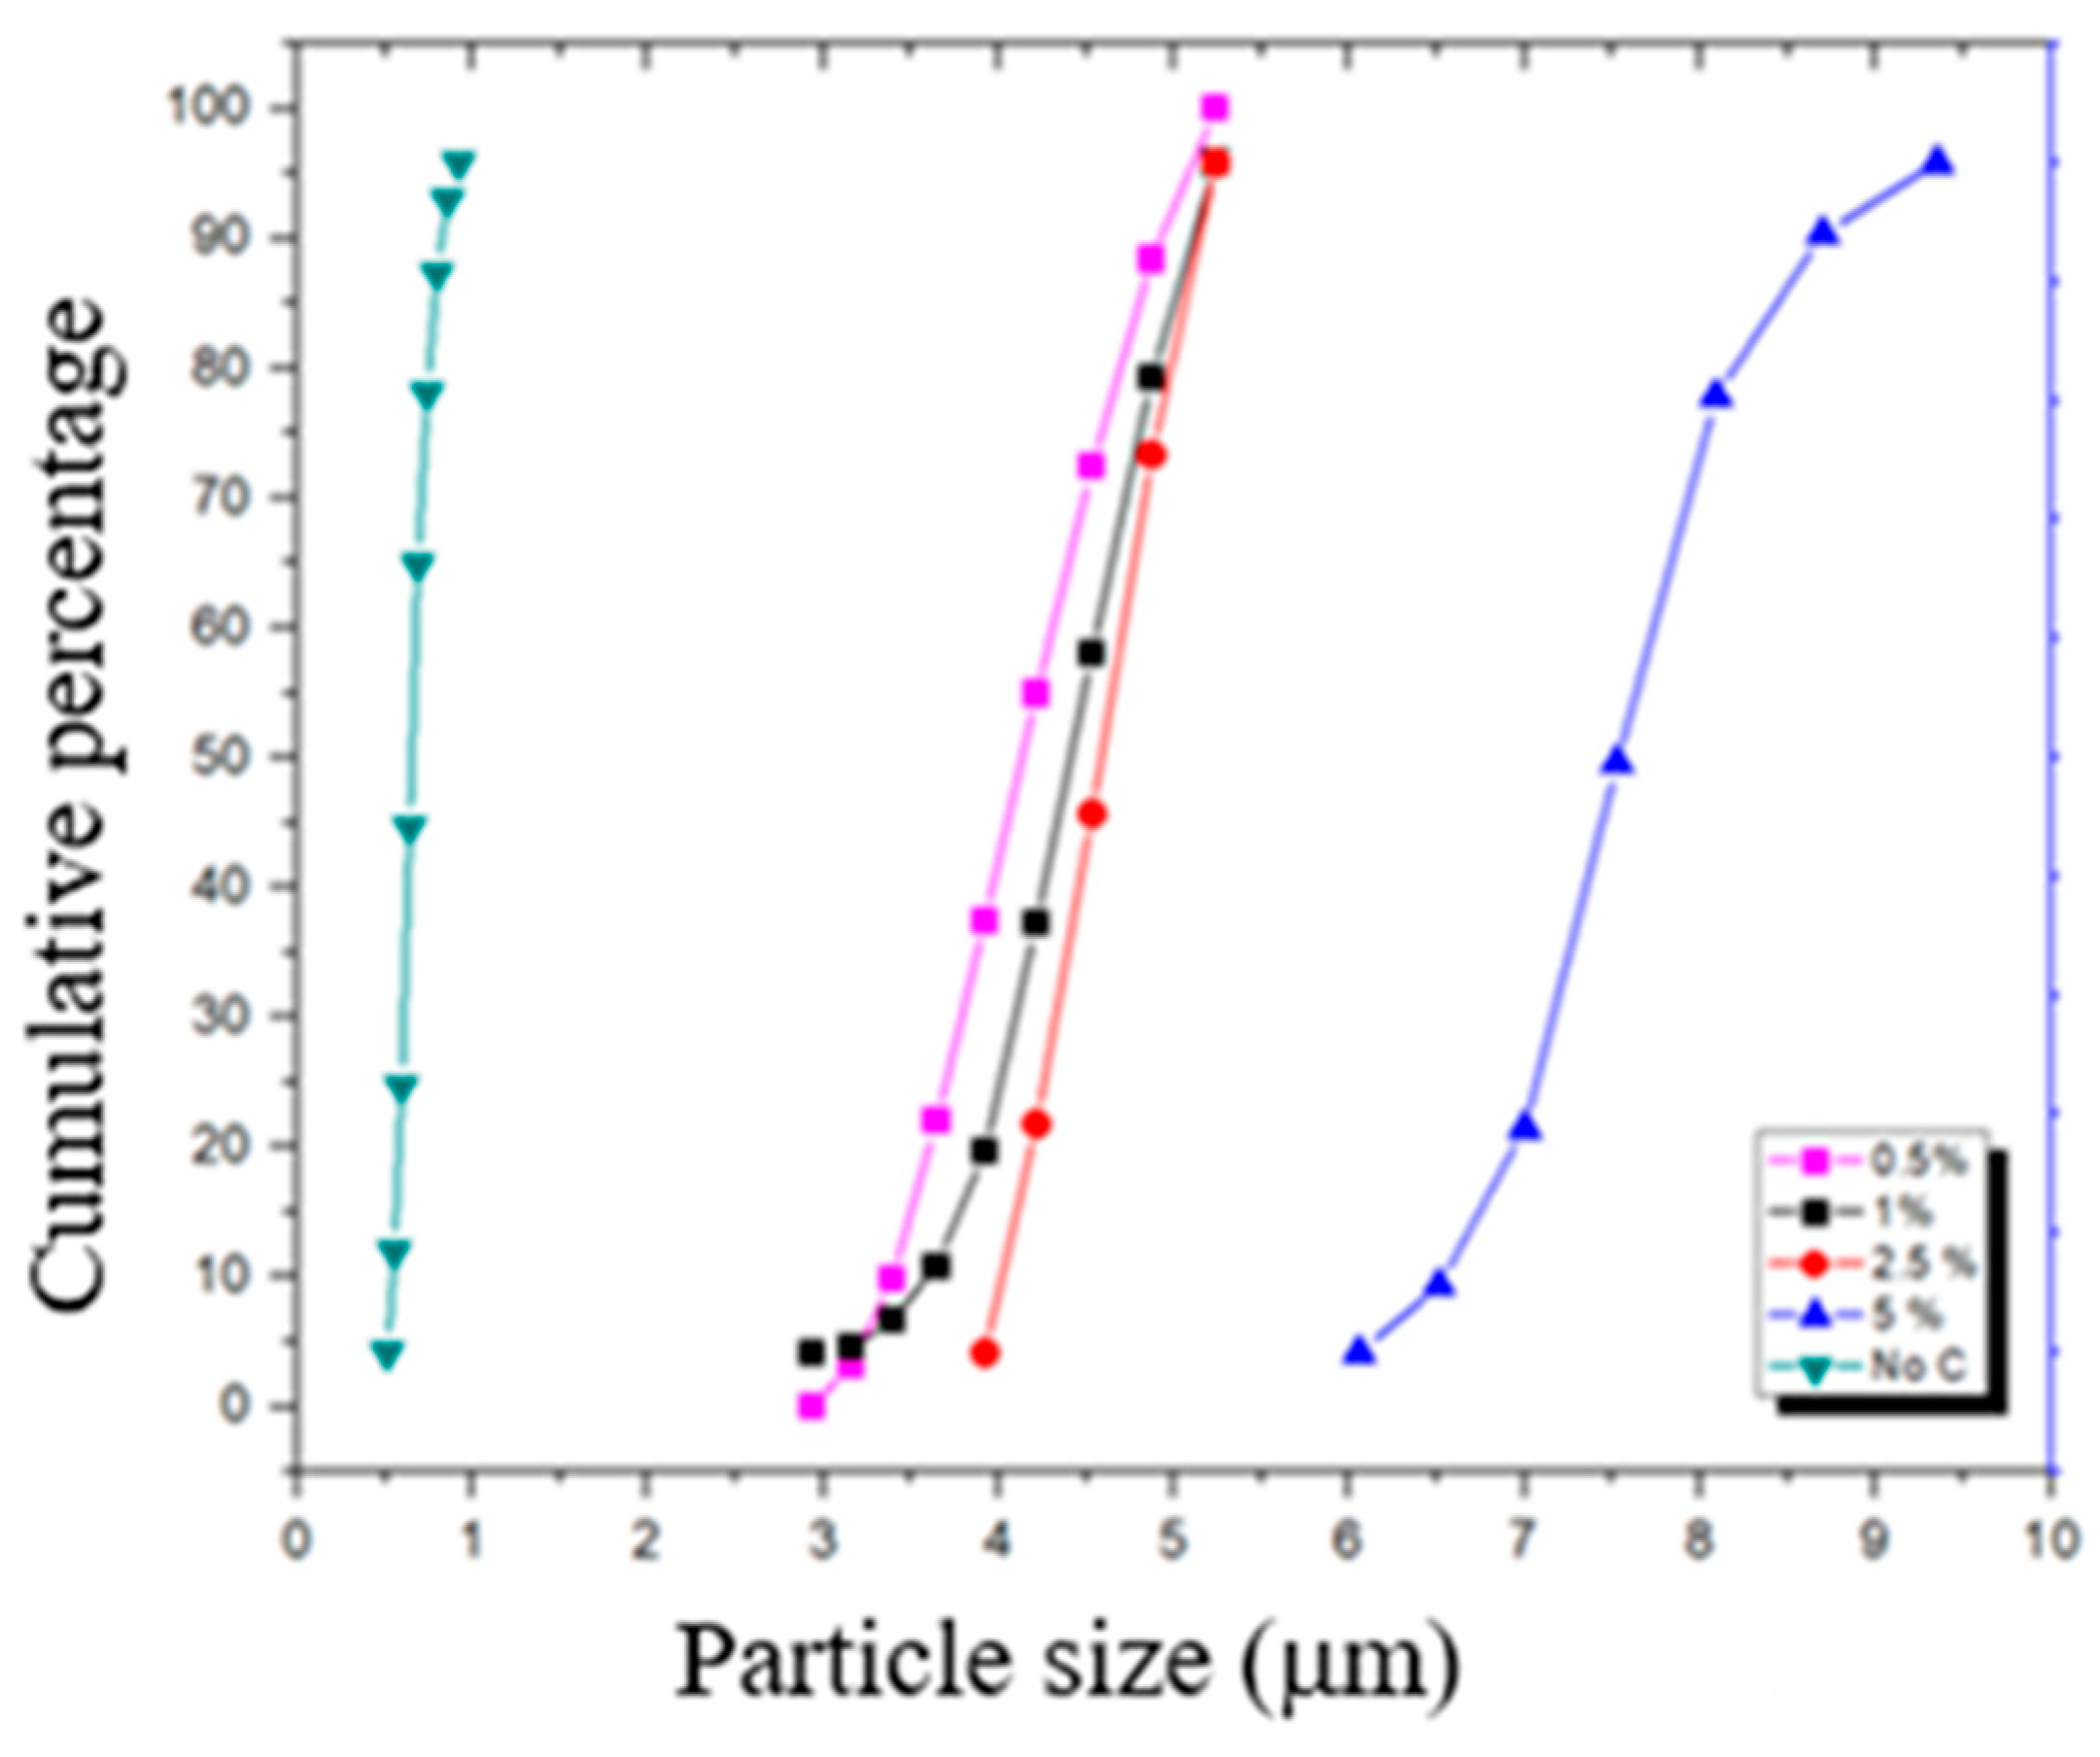
Figure 3.
Images of powders after the milling process.
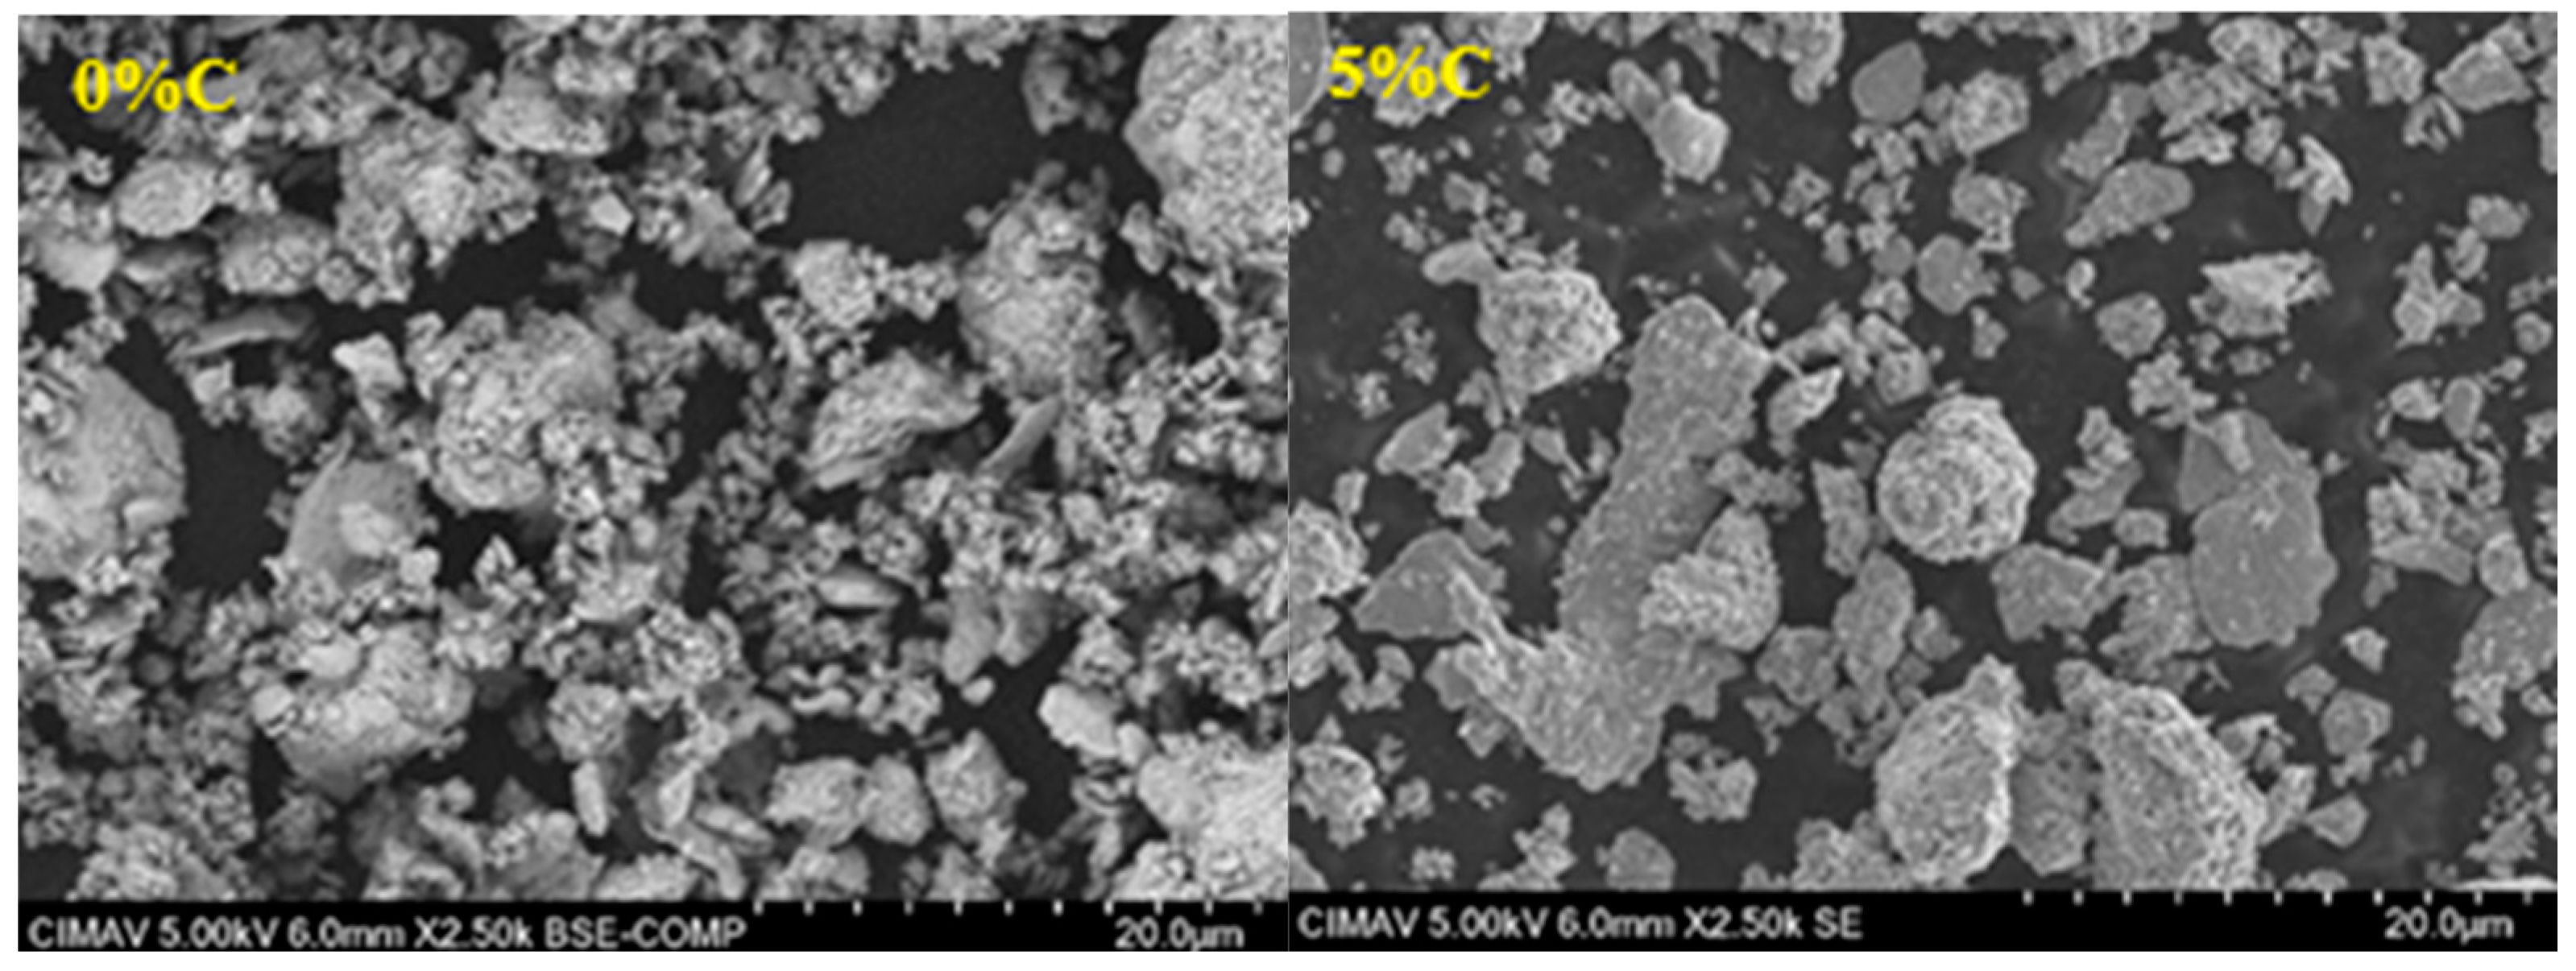
Figure 4.
Relative density and porosity of alloys sintered at 1200 °C for 2 h.
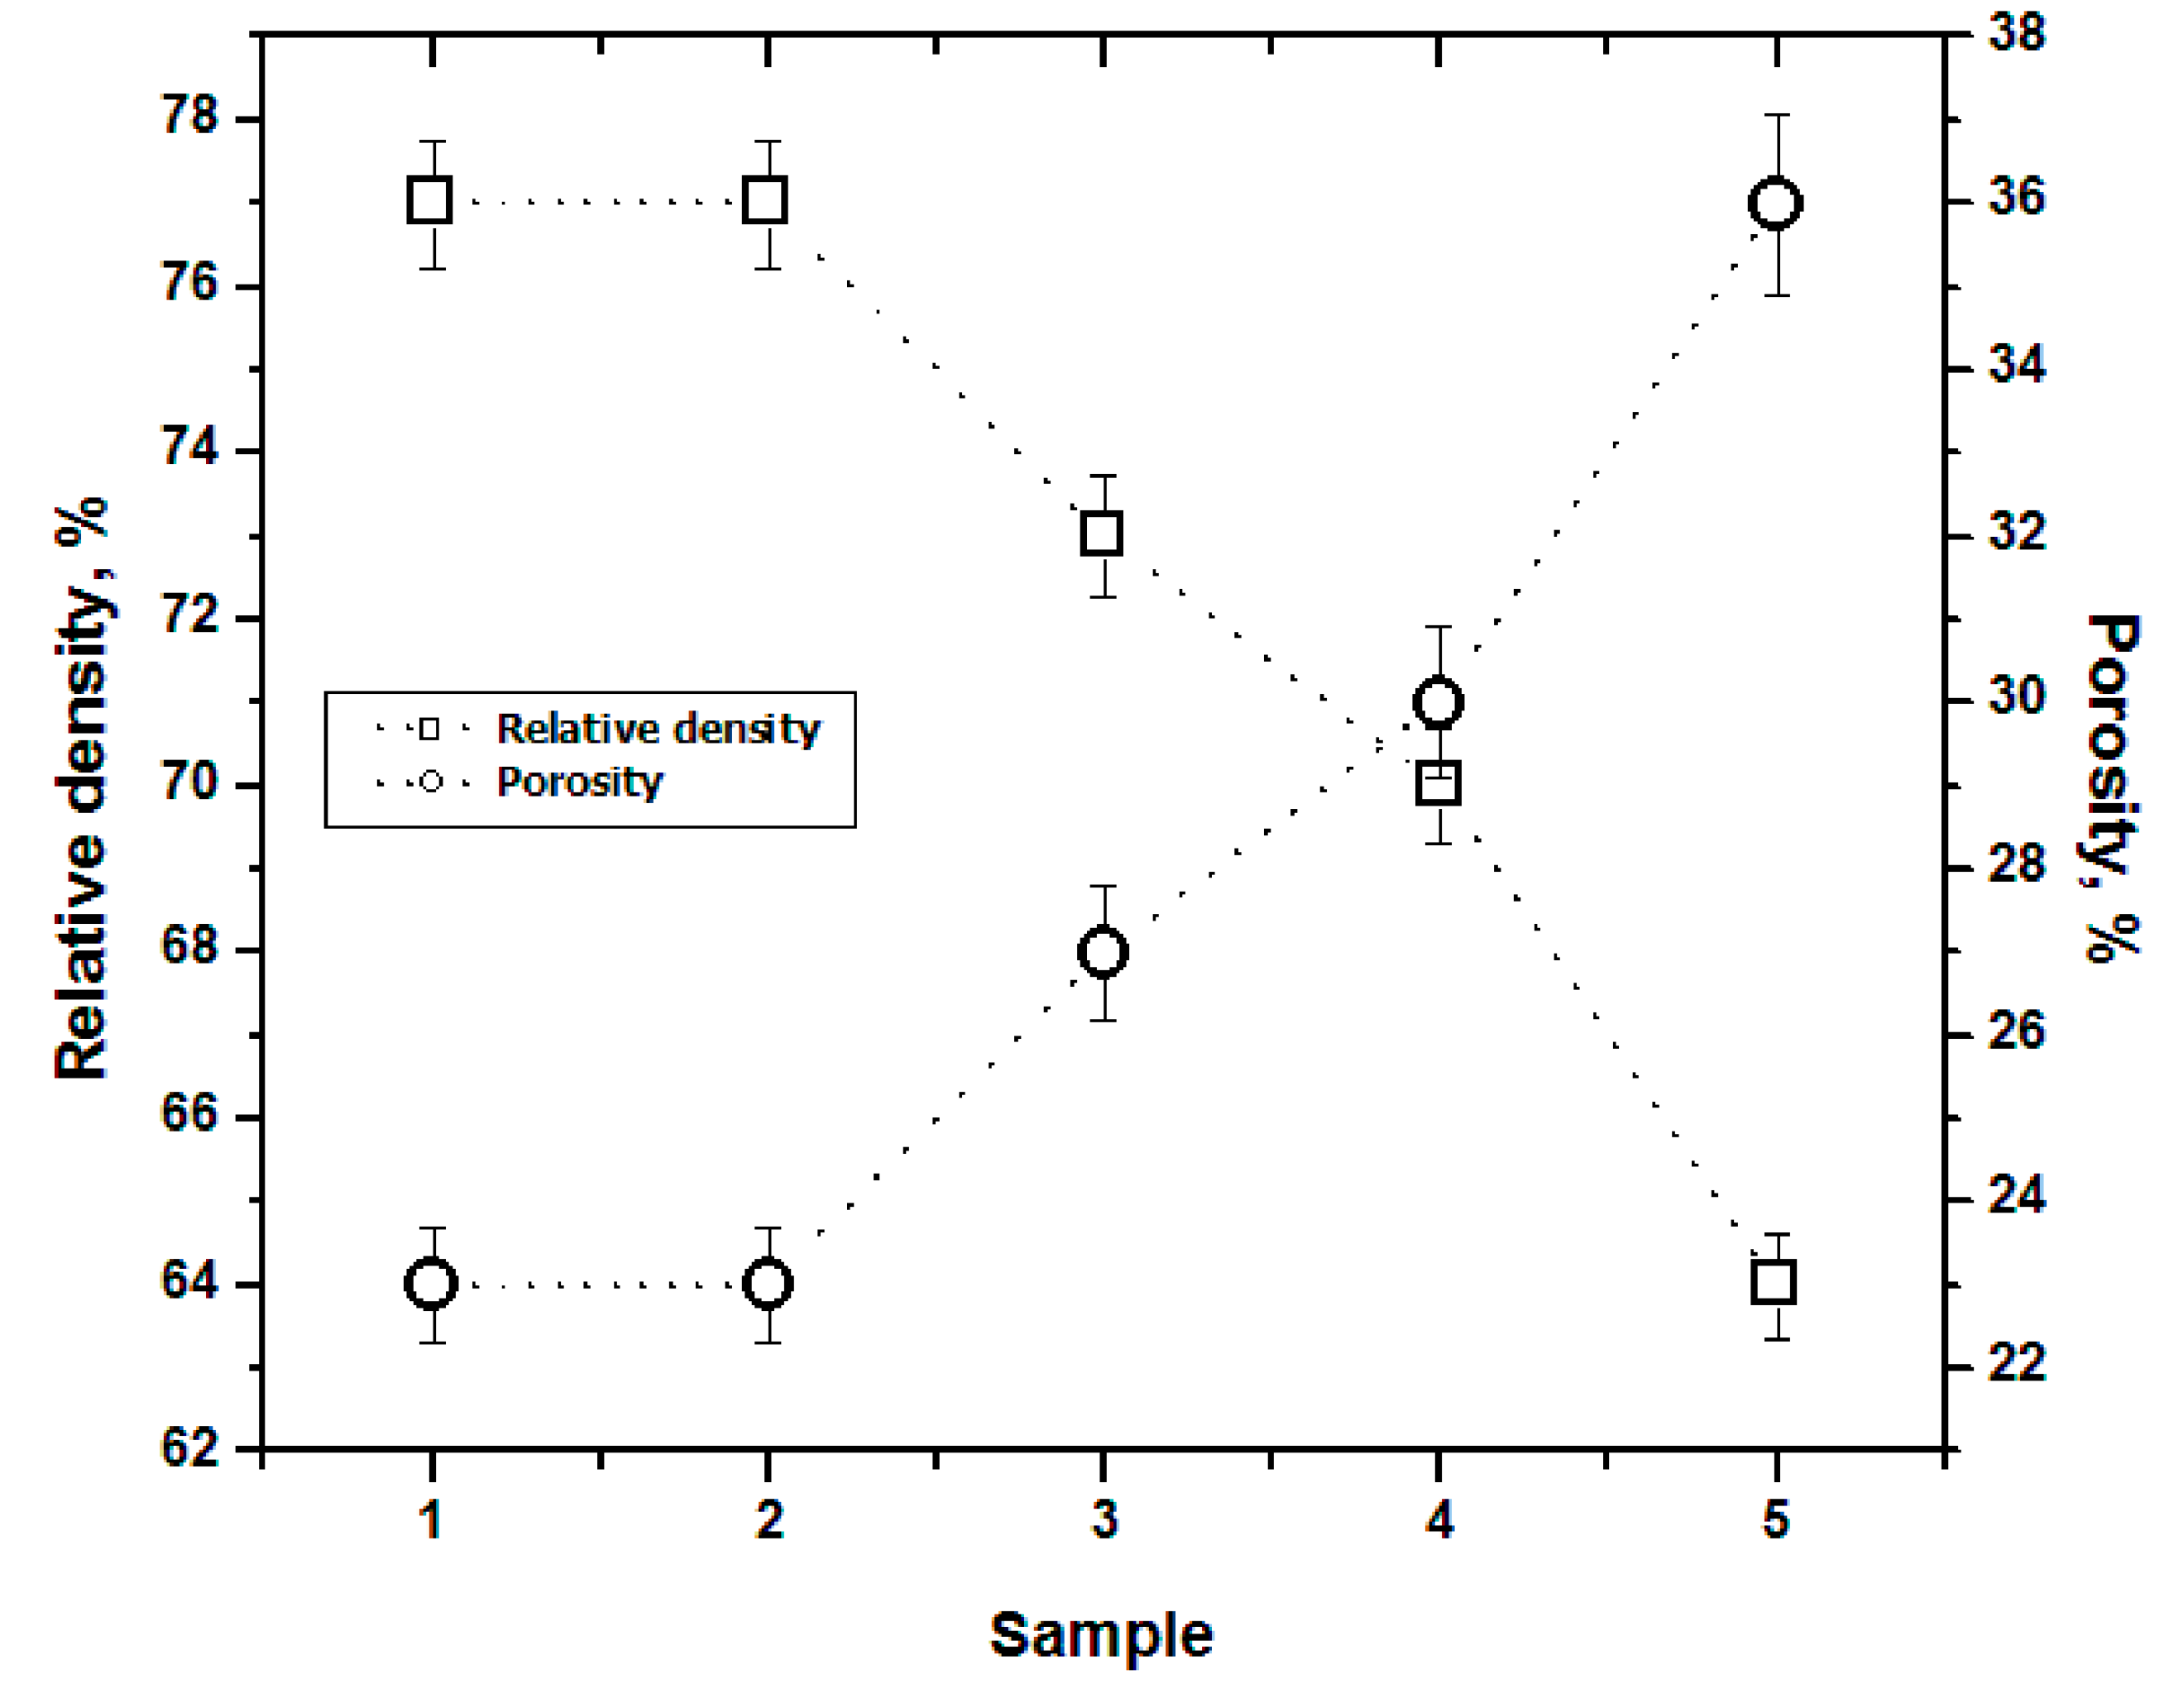
Figure 5.
X-ray diffraction patterns of sintered alloys.
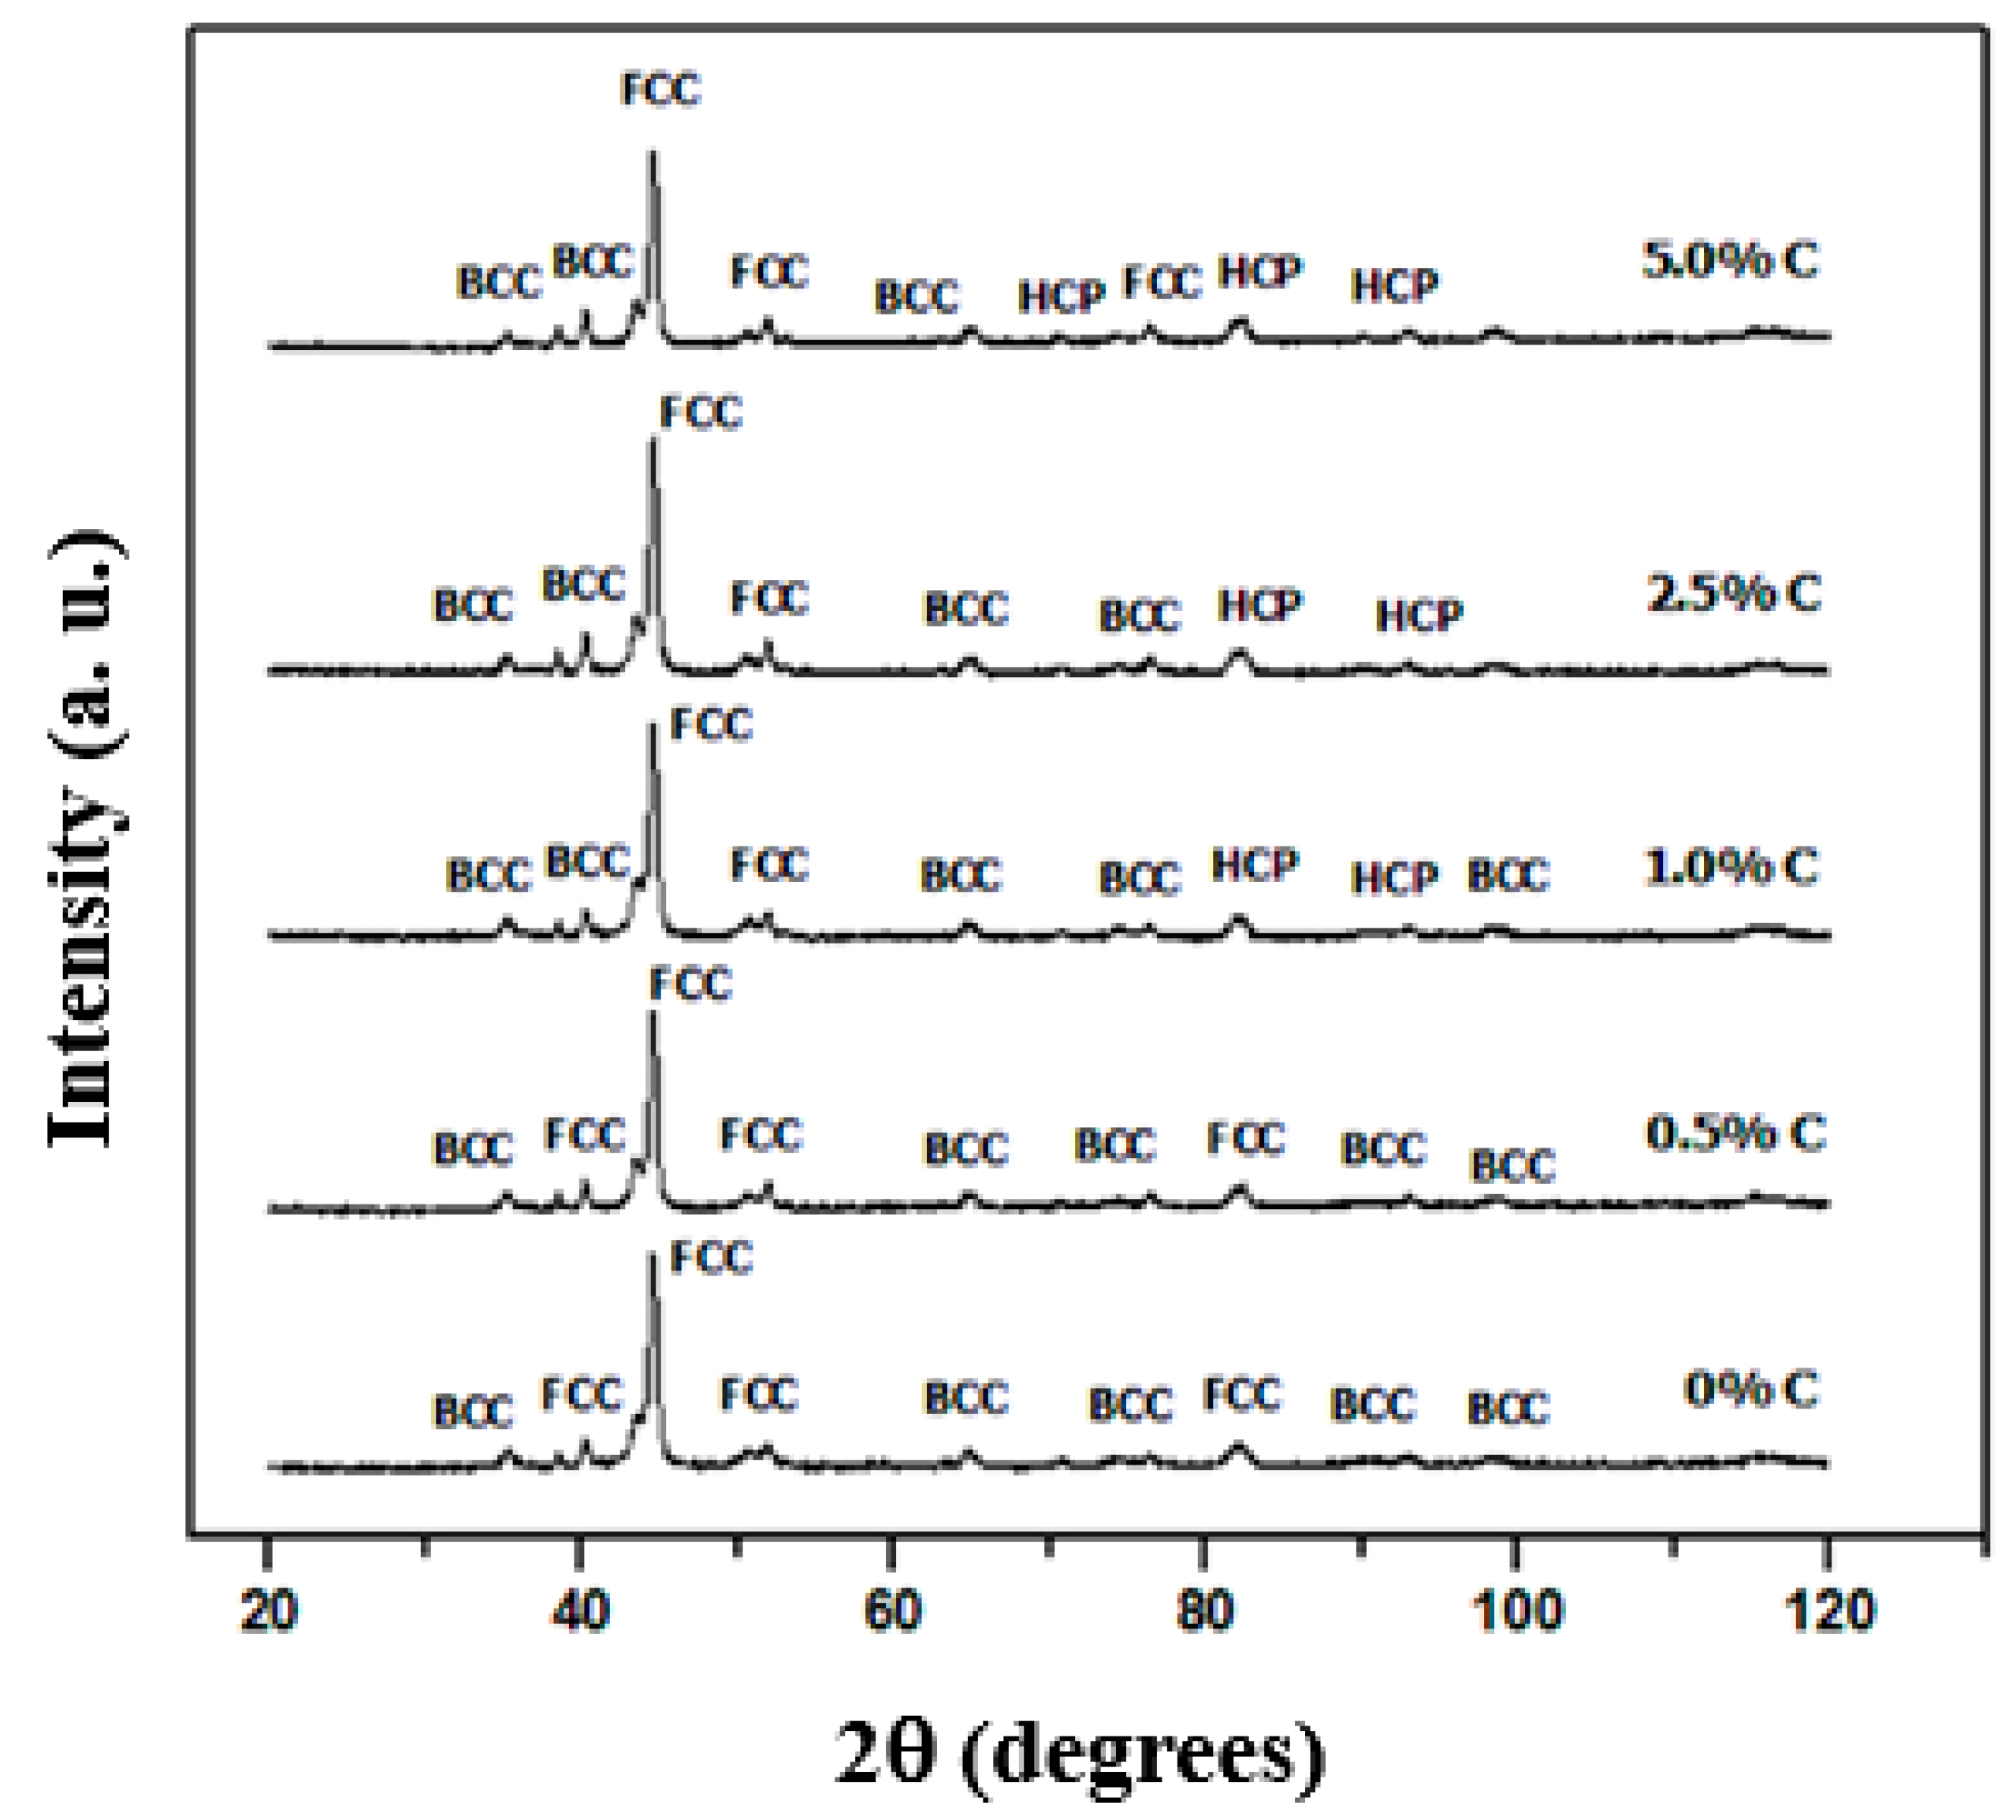
Figure 6.
Optical micrographs showing the microstructure and porosity of sintered alloys.
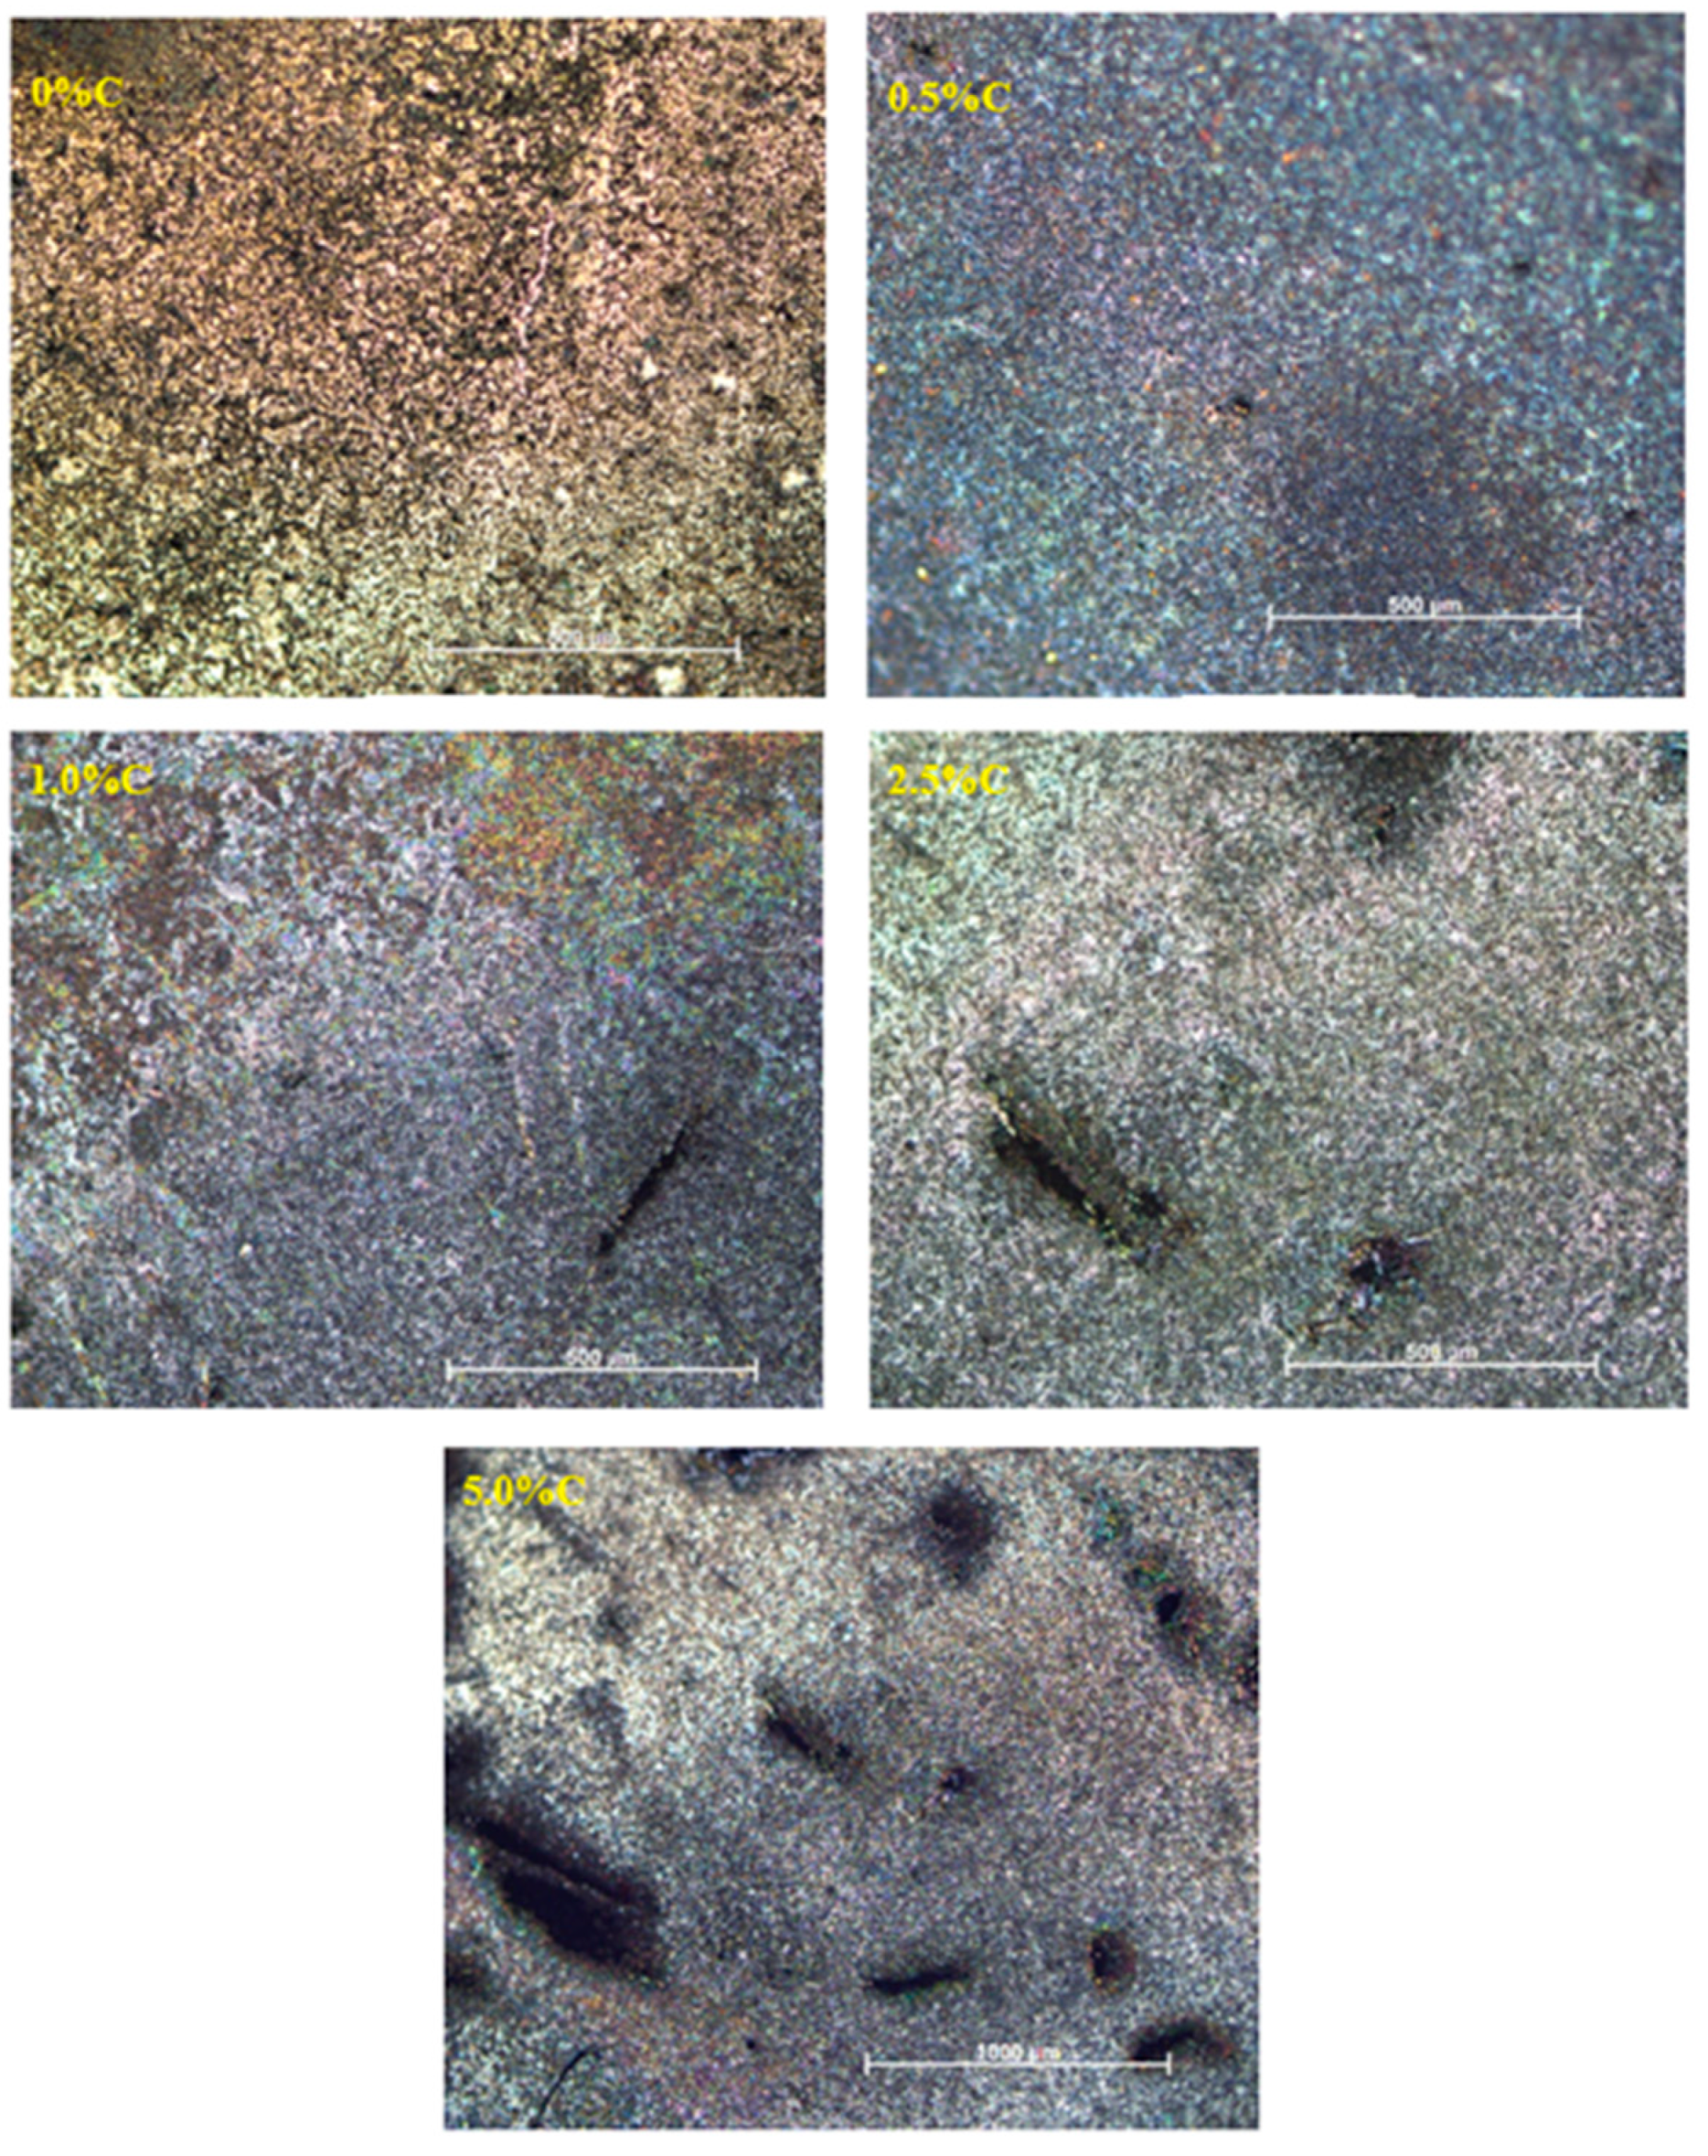
Figure 7.
Mappings on each sample to check the spatial distribution of the alloy components.
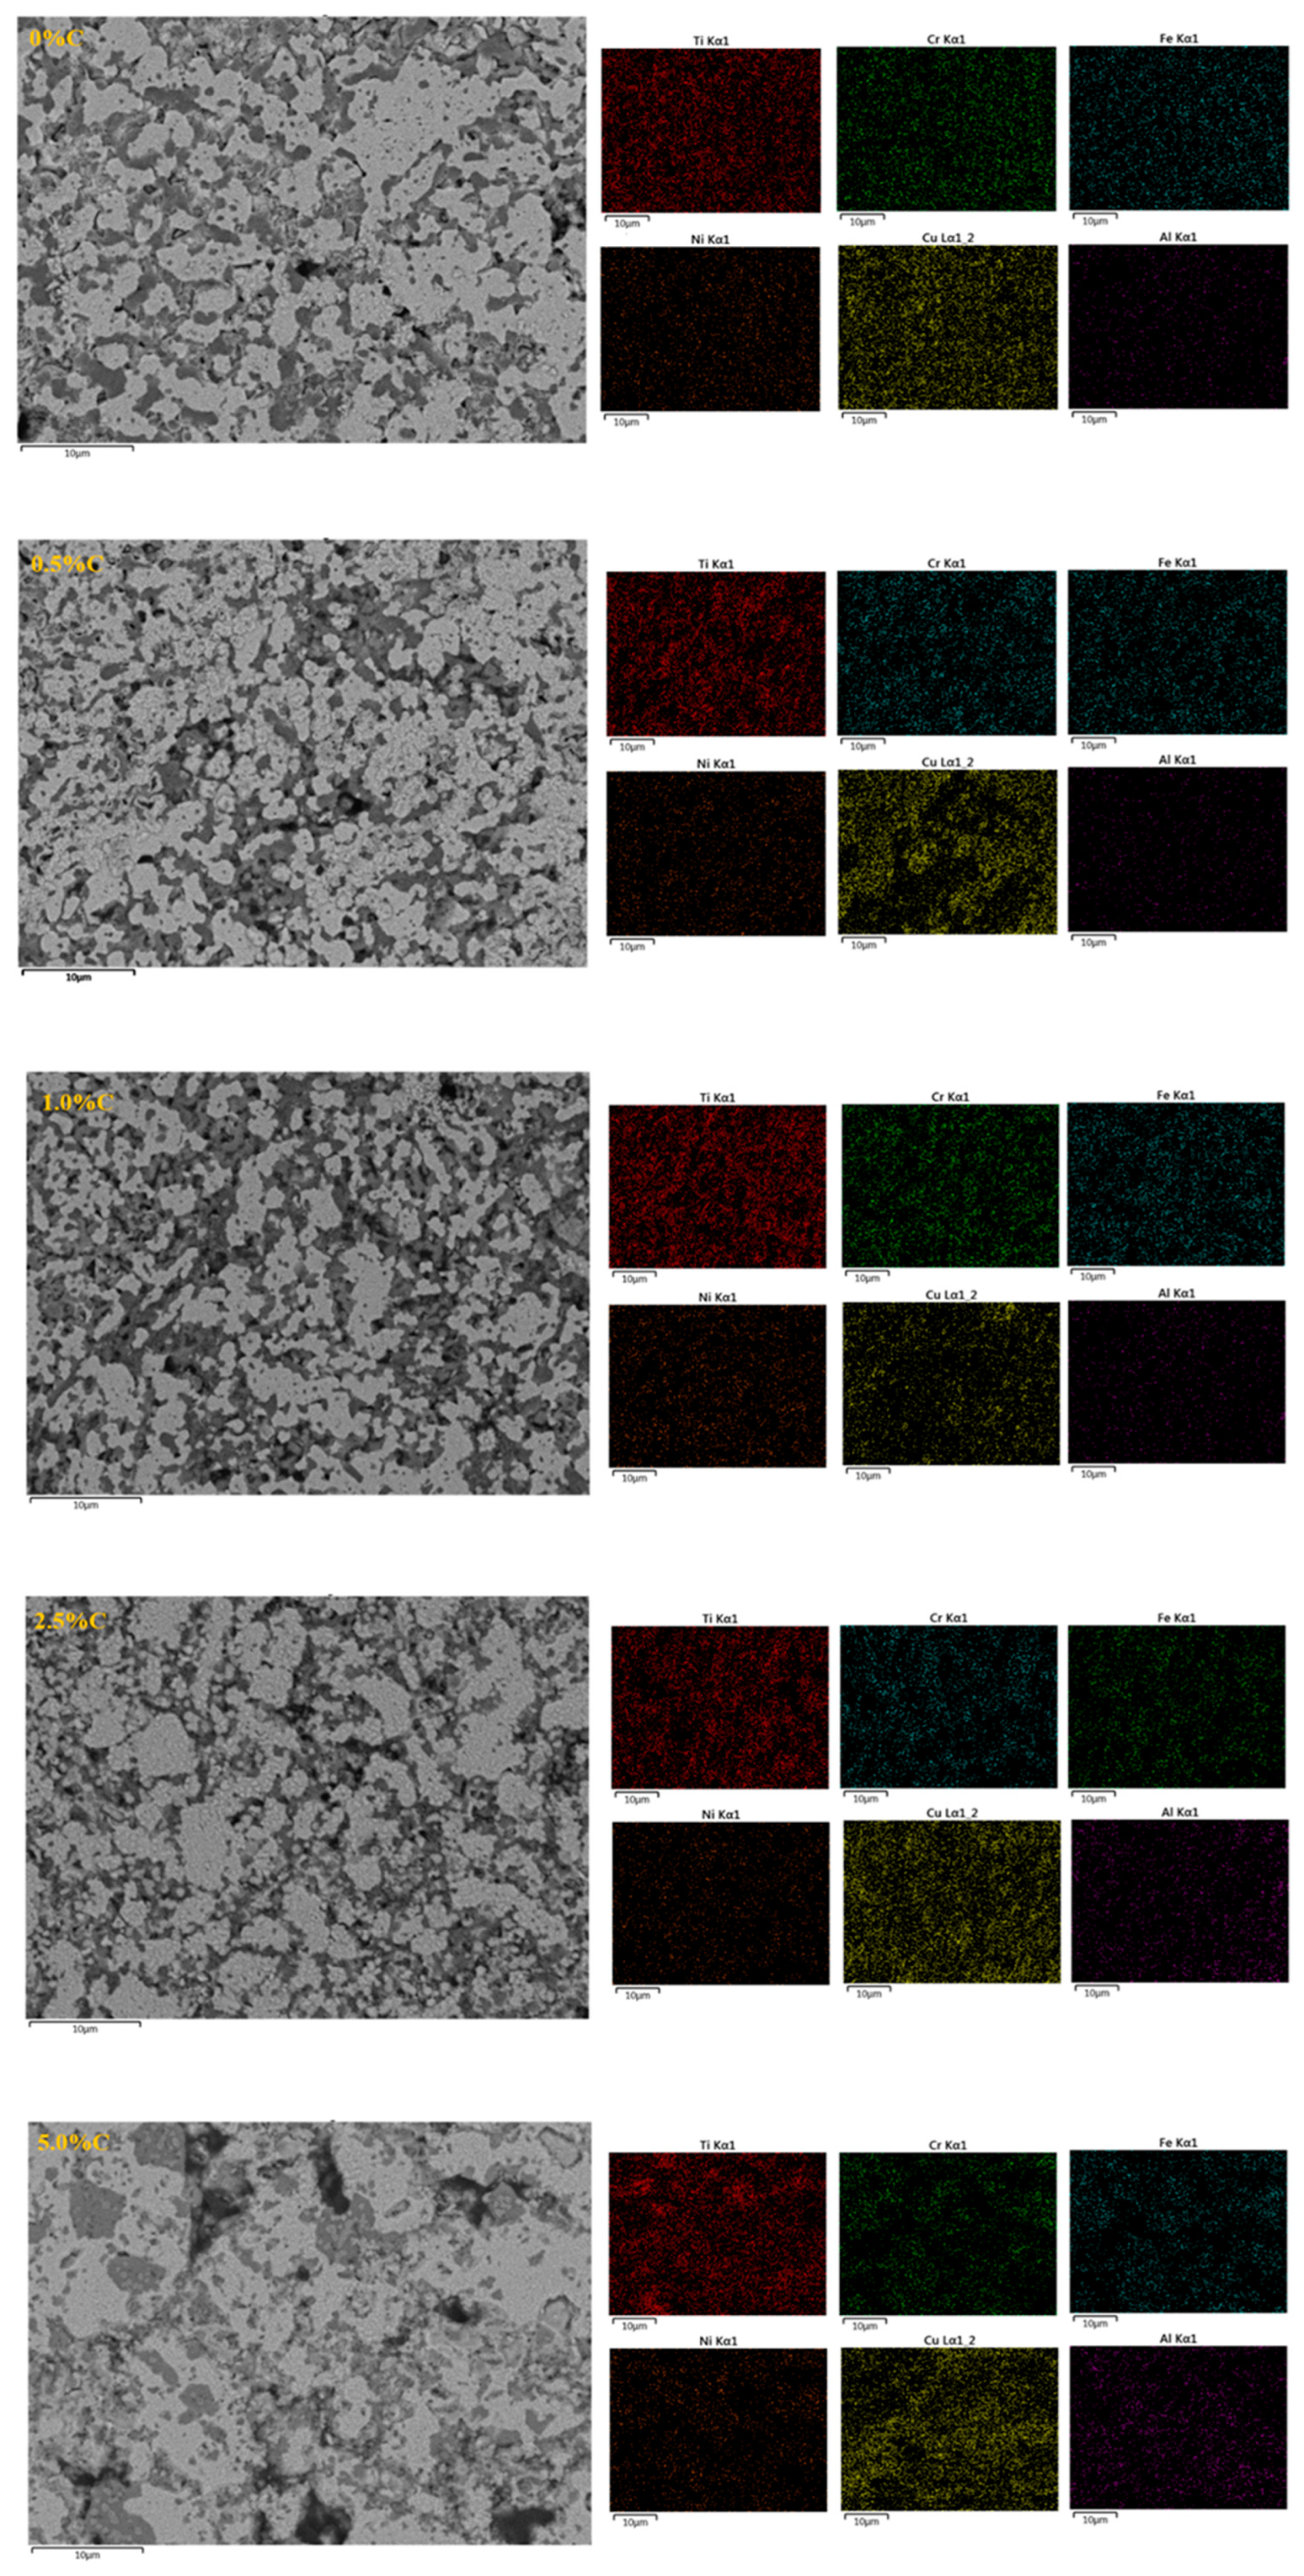
Figure 8.
Energy dispersive X-ray spectroscopy analysis of CrCuFeNiTiAl1CX alloys.
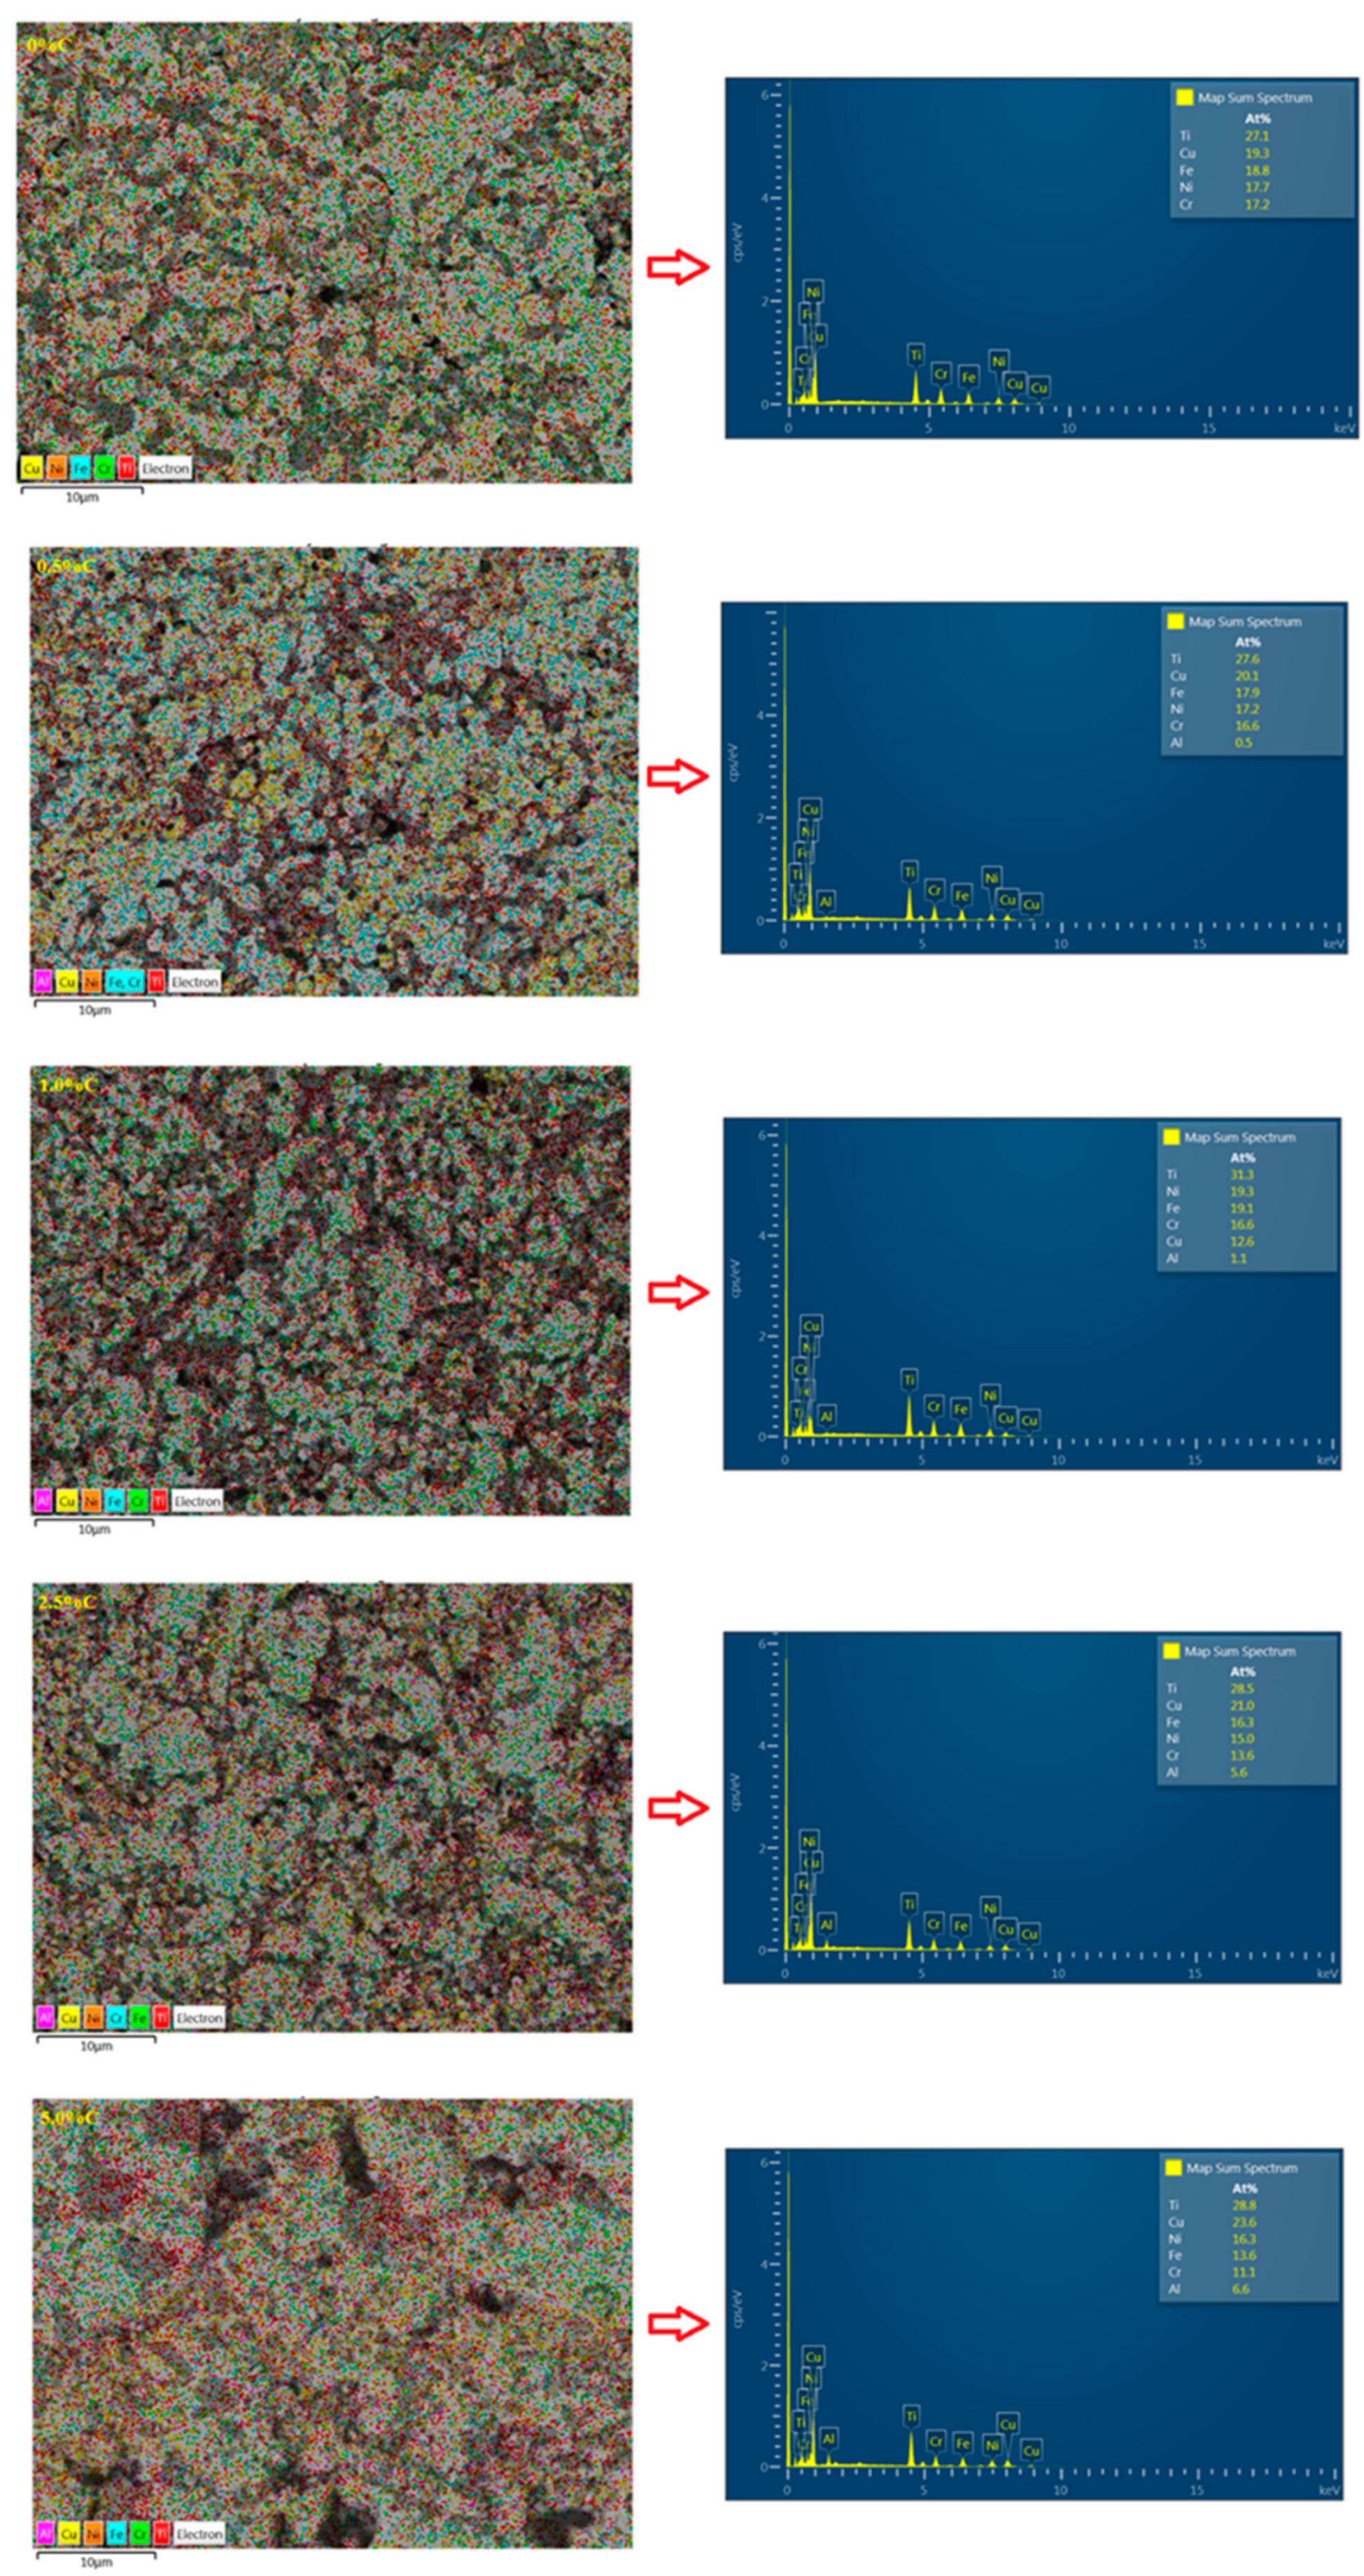
Figure 9.
Mechanical response of samples as a function of carbon addition. .
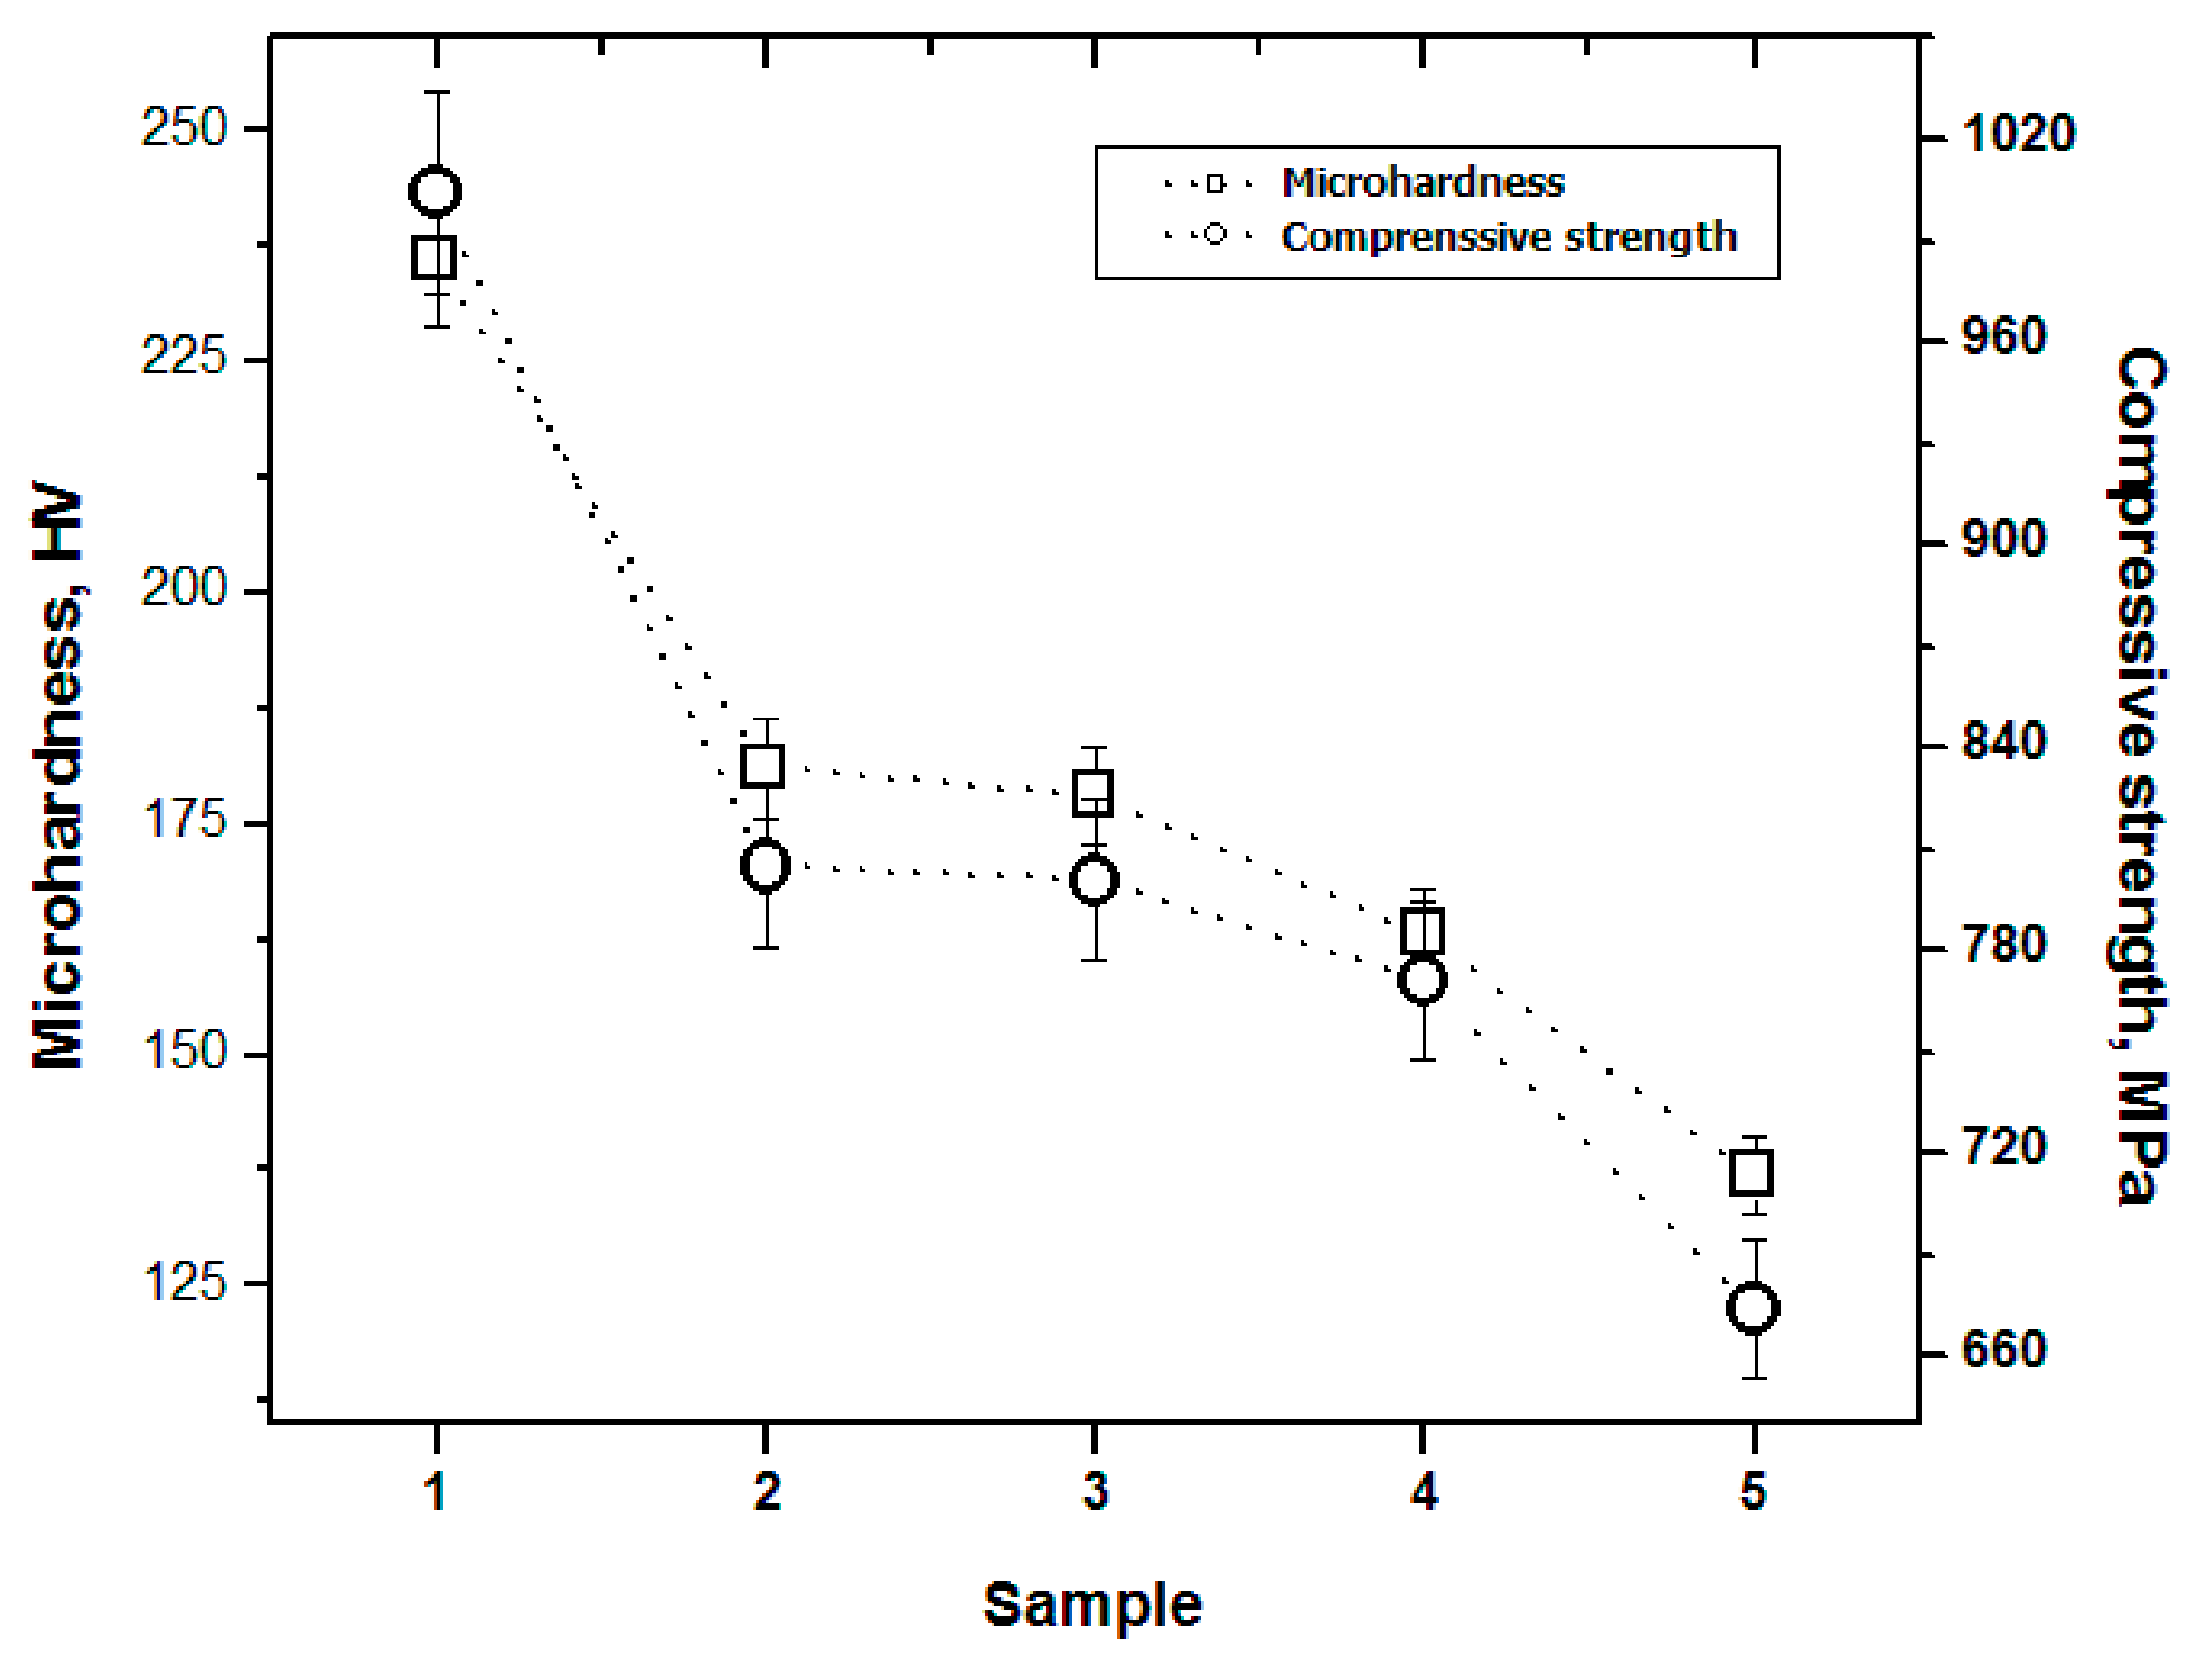

Table 1.
Comparison of properties and phases in high entropy alloys.
| Multicomponentsystem | Process | Reference |
| CuCrFeNiTiAlx | Mechanical alloying | [14] |
| CrCuFeNiTiAl1Cx | Powder metallurgy | [17] |
| Al2CoCrFeNiSi | Laser cladding | [17] |
| Al2CoCrCuFeNi1.5Ti | Laser cladding | [17] |
| AlCoCrCuFeNi1 | Laser surface alloying | [17] |
| AlCoCrCuFe | Laser surface alloying | [17] |
| CuCoFeNiTix | Electric arc melting | [18] |
| AlCrFeNi2Ti0.5 | Electric arc melting | [19] |
| Fe20Cr20Mn20Ni20Co20 | Induction melting | [20] |
Disclaimer/Publisher’s Note: The statements, opinions and data contained in all publications are solely those of the individual author(s) and contributor(s) and not of MDPI and/or the editor(s). MDPI and/or the editor(s) disclaim responsibility for any injury to people or property resulting from any ideas, methods, instructions or products referred to in the content. |
© 2025 by the authors. Licensee MDPI, Basel, Switzerland. This article is an open access article distributed under the terms and conditions of the Creative Commons Attribution (CC BY) license (http://creativecommons.org/licenses/by/4.0/).
Copyright: This open access article is published under a Creative Commons CC BY 4.0 license, which permit the free download, distribution, and reuse, provided that the author and preprint are cited in any reuse.


