
Submitted:
12 April 2025
Posted:
15 April 2025
You are already at the latest version
Abstract
This study investigates the potential of a biofertilizer derived from the invasive brown alga Rugulopteryx okamurae (RoB) to enhance lettuce growth and improve its phytochemical profile. The extraction of the biofertilizer was optimised through the implementation of a Box-Behnken design, and the resulting extract was then compared with a commercial Ascophyllum nodosum-based product (AnB). This comparison was made under both optimal and suboptimal fertigation conditions in a controlled, soilless culture. Lettuce plants were monitored for water and nutrient uptake, growth parameters, and accumulation of key phytochemicals such as carotenoids, tocols, sterols, and squalene. The results obtained demonstrated that RoB significantly increased fresh and dry biomass, with enhanced nitrate and potassium uptake, in comparison to standard nutrient solution controls. Treatments incorporating RoB consistently resulted in higher concentrations of lutein, β-sitosterol, and squalene, particularly under suboptimal conditions, thus suggesting a strong biostimulant effect that mitigates nutrient stress. Furthermore, Principal Component Analysis demonstrated that biofertilizer application induces distinct metabolic profiles, highlighting the coordinated regulation of antioxidant pigments and sterol compounds. The findings support the dual benefits of algae-derived biofertilizers in promoting sustainable crop production by improving yield quality and increasing health-promoting phytochemicals, paving the way for innovative, eco-friendly fertilization practices in modern agriculture.

Keywords:
Ascophyllum nodosum
; Rugulopteryx okamurae
; lettuce
; stress tolerance
; soilless culture
; biostimulant
1. Introduction
Seaweed extracts have been used in agriculture as soil conditioners or as plant growth biostimulators [1,2]. In agriculture, macroalgae have been used to compensate the deficiency of plant nutrients, for instance of N, P, and K. It has been reported that seaweed extracts stimulate seed germination, induce better root development, enhance frost resistance, and increase nutrient uptake, improve resistance to pests, and allow high yields. Moreover, better performance of seaweed manure to conventional organic one has been reported [3]. Currently, nearly 47 companies worldwide are involved in manufacturing extracts from Ascophyllum nodosum for agricultural and horticultural applications [4,5].
Beach cast macroalgae have been suggested as possible raw material for organic fertilizers [6], and currently, macroalgae are under investigation as biofertilizers or biostimulants. The nutrient-rich algal biomass with a high content of organic material and inorganic nutrients can be used directly as an organic fertilizer to the soil [7], or nutrients can be extracted from the biomass. Macroalgal biostimulants have been shown to stimulate plant growth and yield with beneficial effects on root development and mineral absorption, enhancement of plant chlorophyll, crop yield, and resistance to environmental and biotic stresses. Among macroalgae, brown ones are commonly used for biostimulants production, given they are rich in polysaccharides such as alginates, fucoidans, and laminarin, which enhance the natural defense response of plants [4]. Until recently, every EU member state has applied its policies in regulating the acceptance, marketing, and use of biostimulants in agriculture. Considering the fast-growing market for biostimulants, the Regulation EU 2019/1009 is timely, as it lays down a common definition and regulations also for biostimulants. In the regulation, biostimulants are defined as “products that stimulate plant nutrition processes independently of the product’s nutrient content by improving plant’s nutrient use efficiency, tolerance to abiotic stress, quality traits, or availability of confined nutrients in soil or rhizosphere”. Maximum limits for heavy metals are defined in the regulation and are identical to the ones set for biofertilizers, and this content poses some restrictions to the use of macroalgae as biofertilizers. Depending on the water quality, macroalgae may accumulate notable quantities of heavy metals, whose maximum levels (cadmium, hexavalent chromium, mercury, nickel, lead and inorganic arsenic) have been defined in Regulation EU 2019/1009. Moreover, the newly established maximum level for cadmium in biofertilizers in the EU is 1.5 mg/kg (Regulation EU 2019/1009). Thus, the harvesting site and species composition should be considered to avoid harmful concentrations of heavy metals.
The utilization of biofertilisers derived from macroalgae has demonstrated favourable outcomes in promoting lettuce growth and yield while sustaining optimal electrical conductivity (EC) levels in the nutrient solution. For instance, Macrocystis pyrifera extracts have been evidenced to enhance seed germination, root growth, and seedling establishment, thereby augmenting nutrient and water uptake [8]. When combined with the plant growth-promoting bacterium Azospirillum brasilense, these biofertilizers further enhance lettuce growth under different irrigation treatments, suggesting a synergistic effect [8]. Additionally, macroalgal extracts help plants adapt to unfavourable conditions, such as water deficits, when the crop is being cultivated under optimal conditions. Consequently, numerous researchers have examined the potential benefits of various factors, including cultural management, active material, and biostimulants, under both optimal and suboptimal conditions. These studies have revealed substantial variations in the observed benefits [9,10,11].
The study's primary hypothesis is that biofertiliser derived from the brown macroalga R. okamurae will enhance the productivity and quality of lettuce crops, with results comparable to those achieved with other biofertilisers derived from the brown macroalga A. nodosum, a common agricultural product. To this end, the study examined the effects of bioactive extracts in the nutrient solution on achieving optimal plant growth and determined the concentration of bioactive compounds in the harvested vegetable products.
2. Materials and Methods
2.1. Solvents and Reagents
Unless otherwise stated, all solvents and reagents used in the current work were purchased from Merck (Madrid, Spain).
2.2. Biofertilizer Obtainment
Raw samples of R. okamurae were collected in December 2023 on the coast of Benalmádena (Málaga, Spain; geographic coordinates 36.580544, -4.539112) and delivered refrigerated to the laboratory. Samples were then washed with distilled water to remove salt, epiphytes, and sand, and placed in a forced air oven at 50 °C for 24 h. Once dried, samples were powdered and stored at 4 °C until analyses. The taxonomic identification of R. okamurae was confirmed by optical microscopy images (Supplementary File S1).
The biomass of R. okamurae was shredded and dried in an oven at 60 °C for 72 h. The dried algal biomass was ground into powder form and screened through 20–80 mesh sieves. The algal extract used as biofertilizer was prepared from previously dehydrated algae. The extraction was performed using distilled water, and maximum yield variables were fine-tunned through a response surface experimental design of Box–Behnken, in which the algae:solvent ratio (1:10, 1:20, and 1:30, w/v), extraction time (1, 2, and 3 h), and extraction temperature (20, 40, and 60 °C), were considered. The extraction yield was determined by drying all the extracts at 100 °C. The maximum dry extract yield (4.2 g of extracts by 100 g dry algae) was obtained with the conditions of 3 h, 60 °C, algae:solvent ratio of 1:30 (w/v), and using pure water as extracting solvent. After extraction, the supernatant was filtered through a 0.22 μm filter paper using a vacuum filtration assembly.
The biofertilizer extract obtained was stored at 4 °C until utilization, with a maximum duration of three days. Both the commercial biofertilizer from A. nodosum, which yielded a dry residue of 11.5% on dry weight (dw), and the experimental biofertilizer from R. okamurae obtained as described above, were diluted to the same dry matter concentration before use.
2.3. Biofertilizers Analysis
Two biofertilizers were checked in this work as indicated below. One of them was the biofertilizer obtained from A. nodosum (Jospalga 25, AnB), which was supplied by the company Interjospal S.L. Another assayed biofertilizer was obtained from R. okamurae in the laboratory (RoB), and both were analyzed following the procedures described by Rincón-Cervera et al. [12]. The composition of both biofertilizers is detailed in Table 1.
Alginate, mannitol, and phlorotannin’s were determined as previously reported [12], following the protocols described in Supplementary File S2. Trace elements were measured in each digested sample by Inductively Coupled Plasma-Mass Spectrometry (ICP-MS) using a Hewlett Packard 4500 STS spectrometer, following the methodology of Gonzáez et al. [13], as detailed in Supplementary File S2.
2.4. Lettuce Samples
Table 2 details the treatments developed in the experimental crops. The treatments are grouped into two conditions: i) under optimal growing conditions; ii) suboptimal conditions. Then, the following culture conditions were set: T0 = Nutrient solution, standard conditions of fertigation; TR = T0 + RoB; TA = T0 + AnB; t0 = ½ nutrient solution, sub-optimum of fertigation conditions; tR= t0 + RoB; tA = t0 + AnB. The suboptimal conditions were assayed considering that the response to biostimulants can differ depending on the environmental conditions [9,11].
2.5. Fertigation Parameters and Crop Conditions
Both the commercial biofertilizer from A. nodosum and the experimental biofertilizer from R. okamurae obtained as described above were diluted to the same concentration on a dry matter before use.
The experiment was carried out in controlled growth chambers located at the University of Almeria (Spain) from November to December 2023. The environmental variables in the chamber were a photoperiod of 16/8 h (day/night), at 18 to 22 °C, at a relative humidity of 65 to 75% and at a photosynthetic photon flux density of 250 μmol m-2 s−1 (400-700 nm) provided by L18 T8 AP67 LED lamps (Valoya, Helsinki, Finland), and the experiment’s duration was a 30-day cycle. Seedlings with 4 true leaves of lettuce cv “Maravilla de Verano” were transplanted into 250 mL plastic pots filled with coconut fiber, whose physical characteristics have been described by Rodriguez et al. [14]. The two algal-based biostimulants types were dissolved in the nutrient solution and compared to standard fertigation (Supplementary Table S1). The doses incorporated into the nutrient solution of the AnB were designed as indicated in the commercial product data sheet (JOSPALGA 25 ECO®, Interjospal, Almeria, Spain), while RoB was dosed so that the concentration of its dry matter was equivalent to the AnB one.
The fertigation management in the experiment was carried out following the criteria of Rodriguez et al. [14] and Urrestarazu and Carrasco [15]. The application of new fertigation was supplied when the plant has transpired a ratio volume of water corresponding to 10% of the readily available water of substrate, an extra volume was supplied to obtain a 15-25% drainage [16]. The pH, EC, nitrate, and potassium content of the nutritive solution and the drainage volume were measured using a Crison MM40+ pH meter (Hach® LPV2500.98.0002, Loveland, CO, USA), an EC-Meter Crison BASIC 30 conductivity meter (Hach® LPV2500.98.0002, Loveland, Colorado, USA), and a LAQUATwin B-742 and B-731 (Horiba®, Moulton, Northampton, UK), respectively. The ratio of drainage was measured using a test tube graduated to one-hundredth of a millimeter.
2.6. Growth Parameters and Sample for Chemical Analysis
The lettuce plants were harvested 30 days after transplantation at the tender leaf stage (16-17 leaves). Four plants of each treatment were divided by their different organs; the fresh weight (fw) of roots, stems and leaves was measured, and then the dw was obtained by placing the material in an oven (Thermo Scientific Heratherm, Waltham, MA, USA) at 85 °C until constant weight. A precision analytical balance (model AX 124/E, OHAUS Corporation, Parsippany, NJ, USA) was used, expressing the result as g plant−1.
For chemical analysis, two plants per treatment from each replicate were harvested. After collecting, the plants were stored in thermal bags and frozen at −24 °C until processing. Once in the laboratory, they were labelled, weighed, measured, and placed into a glass desiccator until analysis.
2.7. Carotenoids Analysis
Carotenoids were extracted using acetone, as detailed in Supplementary File S2. High-Performance Liquid Chromatography (HPLC) analyses of the carotenoid profiles were conducted using a Finnigan Surveyor chromatograph equipped with a diode-array detector (DAD) and a reverse-phase C18 column. A 450 nm-HPLC-DAD chromatogram of a lettuce sample is included in Supplementary File S2. Quantification of the compounds was achieved using external calibration curves prepared with pure β-carotene.
2.8. Tocopherol and Tocotrienol Analysis
The extraction and quantification of tocopherols (Tp) and tocotrienols (T3) was carried out according to Fabrikov et al. [17] with some modifications. This methodology is fully described in Supplementary File S2. HPLC analyses of Tp and T3 were conducted using the previously described HPLC-DAD system at a constant temperature of 30 °C. The mobile phase consisted of methanol:acetonitrile (95:5, v/v, phase A) and 2-propanol:n-hexane (50:50, v/v, phase B), with a flow rate of 0.5 mL min−1. The total running time was 60 min. A 290 nm-HPLC-DAD chromatogram of a lettuce sample is shown in Supplementary File S2. The identification of peaks was based on Tp and T3 homologues (α, β, γ, and δ).
2.9. Phytosterols and Squalene Analysis
Phytosterols and squalene were quantified according to Fabrikov et al. [17] procedure, as detailed in Supplementary File S2. Quantification was effected using calibration curves built with pure standards: stigmasterol, β-sitosterol, campesterol), and squalene. The results were expressed in mg 100 g−1 fw. HPLC analyses of phytosterols and squalene were conducted using the previously described HPLC system at a fixed temperature of 30 °C. An isocratic elution system was employed using a binary solvent mixture (methanol:acetonitrile, 70:30, v/v), with a flow rate of 0.4 mL min−1 maintained for 45 min. The injection volume was 10 µL, and detection was performed at a wavelength of 210 nm. A 210 nm-HPLC-DAD chromatogram of lettuce is shown in Supplementary File S2. Quantification of the compounds was achieved using external calibration curves prepared with pure compounds.
2.10. Statistical Analysis
A randomized complete block design [18] was utilized to evaluate the effect of various treatments on lettuce growth. The experiment consisted of four replicates per treatment, with six plants allocated to each experimental unit. Chemical analyses were carried out in triplicate and results were reported as mean value ± standard deviation. Data was assessed for normality using a Shapiro-Wilk test and submitted to one-way ANOVA, and the comparison of means was made using Duncan´s Multiple Range Test. P < 0.05 was regarded as significant. Principal Component Analysis (PCA) and the remaining statistical analyses were performed using Statgraphics© Centurion XVI (StatPoint Technologies, Warrenton-Virginia, USA).
3. Results
3.1. Effect of Biofertilizer Application via Fertigation on Monitoring Parameters
The fertigation drainage volume fraction ranged between 0.2 and 0.3 (data not shown), ensuring that the matric potential of the nutrient solution in the substrate remained within an optimal range [16]. EC values between 1 and 2 dS m−1 above the fertigation levels are considered acceptable for maintaining a suitable osmotic potential in the rhizosphere [15,19]. All treatments maintained EC values within this acceptable range, with an increase of approximately 1-2 dS m−1 above the supplied fertigation levels.
Throughout the cultivation period, drainage EC values remained stable but varied among treatments, reaching up to two units above the fertigation values by the end of the experiment (Supplementary Figure S1). As shown in Supplementary Figure S1B, the average EC of drainage values differed significantly among treatments, influenced by both the type of biofertilizer applied and the fertigation system. The highest drainage EC values were observed in the treatment that combined standard optimal fertigation with R. okamurae biofertilizer.
The pH values demonstrated stability across all treatments, maintaining a consistent range between 6.9 and 7.4 during the cultivation process (Supplementary Figure S1C). The lowest recorded pH value was observed in the standard optimum fertigation biofertilizer treatment, measuring 1.2 units above the fertigation pH of 5.8 (Supplementary Figure S1D). The mean pH of drainage across treatments was 7.25, indicating optimal growth, as this value falls within the range of 1-2 units above the standard fertigation pH of 5.8 [14,15,20].
3.2. Effect of Biofertilizers on Fertigation Uptake and Growth Parameters
From the first to the fourth week after transplanting, water consumption increased by more than 100% across all treatments (Figure 1A). Treatments under optimal fertigation conditions exhibited higher water uptake from the second week onward, compared to those under suboptimal conditions. Furthermore, over the entire crop cycle, plants receiving a full nutrient solution exhibited an average water absorption rate 25.8% higher than those subjected to nutrient-deficient conditions (Figure 1B).
Nitrate and potassium uptake followed a pattern similar to water absorption, with significant differences among treatments (Figure 1). Nitrate uptake increased linearly throughout cultivation, whereas potassium uptake remained relatively constant, except for a notable fluctuation in the TR treatment during the second week (Figure 1C and 1E). While nitrate uptake was generally higher under optimal fertigation, potassium absorption was higher in the TR and TA treatments (Figure 1D and 1F). Atero-Calvo et al. [21] recently identified a significant biostimulant effect on the uptake of essential nutrients in lettuce plants by applying Macrocystis algae extract in conjunction with a mixture of amino acids, corn steep liquor extract, calcium, and the bioactive compound glycine betaine.
Fresh and dry biomass yields mirrored the trends observed for water and nutrient uptake (Figure 2). The different treatments had a significant impact on production, with a 50% reduction in mineral nutrition —representing sub-optimal fertigation— leading to a 38% and 20% decline in fw and dw, respectively. The application of biostimulants in the nutrient solution had varying effects depending on fertigation conditions. Under optimal fertigation, both tested algal biofertilizers demonstrated a clear biostimulant benefit, with RoB increasing fw and dw by 13% and 5.6%, respectively. Notably, RoB also exhibited a positive effect under sub-optimal conditions, reinforcing its potential as a growth enhancer.
The effects of the two seaweed extracts were very different under optimal and suboptimal conditions (Table 3). The biostimulant effect of the two algae extracts was significantly more pronounced under optimal fertigation conditions (15%) than under suboptimal conditions (9%). In all conditions, the extract of R. okamurae exhibited a biostimulating effect on both fertigation (water, nitrate, and potassium uptake) and yield (dry and fresh weight), whereas the extract of A. nodosum demonstrated a clear positive effect only under optimal fertigation conditions.
3.3. Phytochemicals Content in Lettuce
Carotenoid profiles are detailed in Table 4. Total carotenoids were highest in lettuce grown with algae-based biofertilizers, regardless of nutrient solution concentration. The highest carotenoid content was quantified in TA (15.8 mg 100 g−1 fw), tR (15.5 mg 100 g−1 fw), and TR (15.1 mg 100 g−1 fw). The lowest carotenoid content was detected in the T0 samples (10.8 mg 100 g−1 fw), indicating that the standard nutrient solution alone resulted in significantly lower carotenoid accumulation. Lutein, the main carotenoid, increased in biofertiliser-treated samples, especially in TR and tR, suggesting that RoB stimulated lutein accumulation.
Tocols, sterols, and squalene are detailed in Table 5. The highest total tocol content was found in samples grown using RoB, in tR (0.57 mg 100 g−1 fw), which was significantly higher than the control, t0 (0.46 mg 100 g−1 fw).
The highest total sterol content was also found in tR (30.8 mg 100 g−1 fw), followed by TR (29.1 mg 100 g−1 fw). Lettuces treated with R. okamurae had a notable increase in sterol content, particularly β-sitosterol. The highest squalene content was found in tR (0.2 mg 100 g−1 fw), while it was undetected in t0. This suggests that biofertilization enhances squalene accumulation even under sub-optimal conditions.
3.4. Principal Component Analysis
To investigate the potential relationship between the analyzed parameters and the sample characteristics, PCA was performed (Figure 3). The PCA was executed using the dataset encompassing all the variables presented in the plot. The analysis yielded 26 components. Collectively, these components account for 100.0% of the variability observed in the original data. The initial two components accounted for 38.14% and 20.63% of the total variance, respectively, representing 58.77% of the total variability. The biplot, a unique feature of PCA tools, facilitated a more nuanced interpretation of the data. The horizontal axis corresponds to PC1, while the vertical axis corresponds to PC2. Through geometrical representation, it is possible to observe that the samples can be grouped according to their values for the measured variables. As illustrated in Figure 3, the projection of the PCA biplots onto the plane defined by the first two principal components is depicted: PC1 and PC2.
4. Discussion
4.1. Effect of Biofertilizer Application via Fertigation on Monitoring Parameters
The fraction of drainage volume, electrical conductivity (EC), and pH are key parameters for monitoring and controlling nutrient solution management in fertigation systems [14,20]. As shown in Supplementary Table S2, under standard fertigation conditions with adequate drainage EC, the correlation between fertigation parameters —such as water and nutrient uptake— and yield was not significantly affected. Drainage pH showed a significant correlation with the assessed parameters of fertigation monitoring, consistently displaying a negative relationship with the amount of water uptake.
Classical research by Arnon and Johnson [22] established that an acidity level between 5.0 and 6.0 provides optimal conditions for lettuce cultivation. This finding suggests that, under standard fertigation conditions, pH values can serve as a reliable indicator for monitoring and optimizing crop fertigation.
4.2. Effect of Biofertilizers on Fertigation Uptake and Growth Parameters
Among all evaluated parameters, water uptake exhibited the strongest correlation with crop production, consistent with findings under similar lettuce cultivation conditions [11]. The extract derived from R. okamurae demonstrated a pronounced biostimulant effect in both fertigation scenarios. In contrast, contrary to the findings of Shukla et al. [4], the extract from A. nodosum did not confer any significant benefits when plants were subjected to a suboptimal nutrient solution. Notably, the average biostimulant effect observed at harvest —measured through fresh and dry biomass— was 15 percentage points higher than uptake indicators, such as water and nitrate absorption. Ergun et al. [23] and Julia et al. [8] also observed a significant positive effect on the growth of lettuce plants when using a different seaweed extract from Chlorella vulgaris and Macrocystis pyrifera, respectively.
4.3. Effect of Biofertilizers on the Phytochemical Composition of Lettuce
It has previously been documented that algae have a beneficial effect on the growth and nutrient composition of lettuce. For instance, a low concentration of algae (15% C. vulgaris and 25% Ulva lactuca) in the extracts contributed to the production of plants with a satisfactory nutritional profile (gross composition and mineral elements), while a high concentration (75% U. lactuca) was conducive to lettuce production with some parameters not suitable for human diet and health [24]. Furthermore, the application of a combined biostimulant consisting of plant growth-promoting bacteria and freshwater algae (C. vulgaris) significantly affected the plant weight of both romaine and leaf lettuce in the spring and summer seasons [24]. Furthermore, an increase in total antioxidant capacity and total carotenoid content was observed in the summer crop of romaine lettuce [25]. Furthermore, the incorporation of C. vulgaris within the nutrient solution employed in hydroponic lettuce production has been shown to reduce the volume of solution by up to 60%, whilst concomitantly increasing the total soluble solids (°Brix) and vitamin C content of the plants [23]. The application of a biostimulant comprising Macrocystis algae extract and a mixture of biostimulant compounds to the green leaves of lettuce has been shown to enhance growth and quality parameters, including phenolic compounds, ascorbate, and antioxidant capacity [21]. In a separate study, lettuce cultivated in hydroponic experiments with a biofertilizer derived from the microalgae Tetradesmus obliquus increased lipids, protein, some enzymatic activity, chlorophylls, and polysaccharides [26].
To date, a few experiments have been conducted using biofertilizers derived from algae, in which the nutritional composition of lettuce was analyzed. However, the phytochemical modification of lettuce induced by the use of invasive algae, such as R. okamurae, remains unexplored. In the present study, the application of algae-derived biofertilizers resulted in enhanced accumulation of key phytochemicals in lettuce cultivated under both standard (T0) and sub-optimal (t0) nutrient conditions, as compared with controls that utilized the nutrient solution alone. The total carotenoid content in the biofertilized treatments (TA, TR, tA, and tR) ranged from approximately 15.1 to 15.8 mg 100 g fw−1, compared with 10.8 mg 100 g−1 fw in the T0 treatment. A similar trend was observed in the levels of tocols and sterols, with the tR treatment (a sub-optimal nutrient solution augmented with RoB) exhibiting significantly elevated values.
Within the biofertilizer treatments, the RoB one (TR, tR) demonstrated notable efficacy in enhancing lutein, sterols (particularly β-sitosterol), and squalene content. Conversely, the AnB (TA, tA) exhibited a predominant effect on total carotenoids and β-carotene, though its influence on sterols and squalene was less pronounced. On the other hand, in scenarios where nutrient input is sub-optimal, biofertilizers have been shown to be effective in compensating for reduced nutrient input, as evidenced by the higher phytochemical levels observed in the tR treatment.
The enhanced phytochemicals under scrutiny in this study have been demonstrated to be of significance to health. Carotenoids such as lutein, β-carotene, and zeaxanthin have been shown to play crucial roles in protecting against oxidative stress, maintaining eye health, and potentially preventing chronic diseases. Their antioxidant properties and their ability to filter out harmful light have been demonstrated to support these benefits [27,28]. Tocols (vitamin E compounds) contribute to cellular protection by scavenging free radicals [29,30], while plant sterols have been associated with cholesterol-lowering effects [31,32]. The presence of squalene, with its potential cardio-protective and chemopreventive properties [33,34], further improves the nutritional profile of the lettuce.
From an agronomic perspective, the utilization of green biofertilizers derived from algae supports sustainable cultivation practices. These biofertilizers enhance the nutritional quality of lettuce by increasing health-promoting phytochemicals, thus offering a viable strategy for reducing conventional chemical fertilizer inputs. This approach is consistent with current trends in sustainable agriculture, which aim to enhance crop quality while minimizing environmental impacts.
4.4. Principal Component Analysis
In the biplot analysis, it is evident that variables with longer vectors exert a greater influence on PC's. For instance, as illustrated in Figure 3, DW and several carotenoids exhibit prominent vectors along PC1, thereby underscoring their significance in differentiating the treatments. Vectors that are close in angle indicate a positive correlation. For instance, the close grouping of sterol-related compounds supports the idea that their biosynthesis is interlinked. The analysis suggests that PC1 (38.1% of variance) captures overall differences in plant growth and metabolic status. Treatments with optimal nutrient conditions (T0, TR, TA) and those under suboptimal conditions (t0, tR, tA) separate along this component. Variables that exhibit strong loading on this component (e.g., DW, certain carotenoids, and sterol compounds) are found to be influential in explaining differences in biomass accumulation and metabolic profiles. With regard to PC2 (which accounts for 20.6% of the variance), this axis appears to accentuate more subtle biochemical distinctions, potentially indicative of stress responses or alterations in pigment composition. It is further hypothesised that variables such as different xanthophylls (violaxanthin, zeaxanthin) and specific antioxidant-related compounds may be more pronounced along this axis.
Concerning the relationships among the measured variables, the antioxidant carotenoids (violaxanthin, zeaxanthin, anteraxanthin, luteoxanthin, cryptoxanthins, and total carotenoids) have been observed to tend to align in analogous directions. This observation suggests a potential for co-regulation of these pigments [35]. This co-variation may indicate that under both optimal and suboptimal conditions, the plant modulates these compounds as part of its photoprotection and oxidative stress management systems [36]. Regarding sterols (campesterol, sitosterol, stigmasterol, total sterols), and squalene, there is a notable co-variation, suggesting a coordinated regulatory mechanism. The grouping of these compounds suggests that changes in membrane composition or signalling lipids are integral to how plants adjust to different nutrient regimes and biofertilizer applications. These influence sterol composition and signalling pathways, potentially enhancing plant growth and stress tolerance. The specific mechanisms and outcomes depend on the types of biofertilizers and the plant species involved [37]. As shown in Figure 3, total St, β-sitosterol, and campesterol exhibit negative loadings for both PC1 and PC2, indicating their orientation towards the suboptimal tR treatment. This observation suggests an increased concentration of these compounds in response to a limited nutrient supply, a finding that aligns with previous reports on how nutrient limitation can trigger metabolic adjustments in plants, i.e., microalgae increase sterol production under nutrient stress [38].
About biomass and nutrient-related traits: DW is a critical marker of overall growth and is influenced by nutrient availability [39]. It has positive scores for both PC1 and PC2, and its positioning relative to other variables (K, EC, water, nitrate, and FW) suggests that the plant's biomass accumulation is closely linked to these culture variables and that both treatments (AnB and RoB) induced plant growth.
With respect to the impact of biofertilizers, the biplot reveals that the application of biofertilizers (RoB and AnB) under standard nutrient conditions results in a metabolic profile that differs from that of the control. The TR and TA clusters near one another imply that, despite employing different biofertilizers, their overall impact on the measured metabolites is similar.
Finally, the ubication of optimal vs. suboptimal nutrient conditions (T0, TR, TA vs. t0, tR, tA), i.e., full (T0-related) vs. half nutrient solutions (t0-related), indicated that nutrient availability is a strong driver of metabolic change. In the context of suboptimal conditions, the supplementary application of biofertilizers (tR and tA) appears to modify the metabolic responses of the plants, potentially mitigating stress or altering specific pathways (e.g., pigment synthesis or lipid metabolism).
5. Conclusions
This study provides compelling evidence that biofertilizers derived from algae, specifically those produced from the invasive brown alga R. okamurae (RoB), offer significant agronomic and nutritional benefits for lettuce cultivation. The optimized extraction process, utilizing a Box–Behnken experimental design, has yielded a biofertilizer characterized by an efficient yield of bioactive compounds. When applied under both optimal and suboptimal fertigation conditions in a controlled, soilless system, RoB significantly enhanced water and nutrient uptake, resulting in higher fresh and dry biomass compared to plants receiving the standard nutrient solution. A key finding of this research is the pronounced biostimulant effect of RoB on the phytochemical composition of lettuce. Treatments involving RoB resulted in substantial increases in bioactive compounds, including carotenoids (particularly lutein), sterols (notably β-sitosterol) and squalene. These compounds are recognized for their antioxidant properties and health benefits, suggesting that the application of macroalgal biofertilisers not only enhances yield but also improves the nutritional and functional quality of the produce. These enhancements are of critical importance in meeting the growing consumer demand for health-promoting food products. In addition, PCA of the dataset has revealed that biofertilizer application gives rise to discrete metabolic profiles in lettuce. The clear separation between treatments under optimal and suboptimal conditions highlights the role of nutrient availability in shaping metabolic responses. The coordinated regulation of antioxidant pigments and lipid-related compounds observed in the PCA underscores the potential of algae-based biofertilizers to induce adaptive stress responses in plants, thereby enhancing their resilience to nutrient limitations. From an agronomic perspective, the findings of this study lend support to the adoption of biofertilizers derived from algae as a sustainable alternative to conventional chemical fertilizers. The promotion of enhanced nutrient uptake and the augmentation of secondary metabolite production are key mechanisms through which these biofertilizers function, thereby reducing the environmental impact associated with over-fertilization while concomitantly improving crop quality. The dual benefits of enhanced yield and increased accumulation of health-promoting phytochemicals offer a promising strategy for the development of resilient, high-quality, and eco-friendly cropping systems. In conclusion, the successful application of RoB not only contributes to the advancement of sustainable agricultural practices but also provides a viable route to improve the nutritional quality of crops. These findings lay the foundation for further research, including the optimization and broader application of macroalgal biofertilizers, which have the potential to extend their benefits to a wider range of crops and agricultural systems.
Supplementary Materials
The following supporting information can be downloaded at the website of this paper posted on Preprints.org. Supplementary File S1. Clues for the identification of Rugulopteryx okamurae and differentiation from Dictyota dichotoma; Supplementary File S2. Material and Methods; Supplementary Table S1. Nutrient solution used for the crop of lettuce; Supplementary Figure S1. Electrical conductivity (A and B) and pH (C and D) of lettuce plants grown in coconut soilless culture under different fertigation with RoB and AnB.
Author Contributions
Conceptualization, T.P.L.C.-C. and J.L.G.-G.; methodology, T.P.L.C.-C., T.C.-C., M.E., M.U., and J.L.G.-G.; software, T.P.L.C.-C., T.C.-C., M.E., M.U., and J.L.G.-G.; validation, T.P.L.C.-C., M.U., and J.L.G.-G.; formal analysis, T.P.L.C.-C., T.C.-C., M.E., M.U., J.D.C.M., and J.L.G.-G.; investigation, M.U. and J.L.G.-G.; resources, M.U. and J.L.G.-G.; data curation, T.P.L.C-C, T.C.-C., M.E., M.U., J.D.C.M., and J.L.G.-G.; writing—original draft preparation, T.P.L.C.-C., T.C.-C., M.U., and J.L.G.-G.; writing—review and editing, J.L.G.-G.; visualization, T.P.L.C.-C., T.C.-C., M.E., M.U., J.D.C.M., and J.L.G.-G.; supervision, J.L.G.-G.; project administration, J.L.G.-G.; funding acquisition, M.U., and J.L.G.-G. All authors have read and agreed to the published version of the manuscript.
Funding
The authors acknowledge the financial support of the Vice-Rectorate of Scientific Policy of the University of Almería (Project LANZADERA 2023/003 and P_FORT_GRUPOS_2023/88).
Data Availability Statement
The authors confirm that the data supporting the findings of this study are available within the article and its Supplementary Materials.
Conflicts of Interest
The authors declare no conflicts of interest.
References
- Popescu, M. Agricultural uses of seaweeds extracts. Curr. Trends Nat. Sci. 2013, 2, 36–39. [Google Scholar]
- Rienth, M.; Torregrosa, L.; Luchaire, N.; Chatbanyong, R.; Lecourieux, D.; Kelly, M.T.; Romieu, C. Day and night heat stress trigger different transcriptomic responses in green and ripening grapevine (Vitis vinifera) fruit. BMC Plant Biol. 2014, 14, 108. [Google Scholar] [CrossRef] [PubMed]
- Raghunandan, B.L.; Vyas, R.V.; Patel, H.K.; Jhala, Y.K. Perspectives of seaweed as organic fertilizer in agriculture. Soil Fert. Manag. Sust. Develop. 2019, 267–289. [Google Scholar] [CrossRef]
- Shukla, P.S.; Mantin, E.G.; Adil, M.; Bajpai, S.; Critchley, A.T.; Prithiviraj, B. Ascophyllum nodosum-based biostimulants: sustainable applications in agriculture for the stimulation of plant growth, stress tolerance, and disease management. Front Plant Sci. 2019, 29, 655. [Google Scholar] [CrossRef]
- Van Oosten, M.J.; Pepe, O.; De Pascale, S.; Silletti, S.; Maggio, A. The role of biostimulants and bioeffectors as alleviators of abiotic stress in crop plants. Chem. Biol. Technol. Agric. 2017, 4, 5. [Google Scholar] [CrossRef]
- Zodape, S.T. Seaweeds as a biofertilizer. J. Sci. Ind. Res. 2001, 60, 378–382. [Google Scholar]
- Tabarsa, M.; Rezaei, M.; Ramezanpour, Z.; Waaland, J. R Chemical compositions of the marine algae Gracilaria Salicornia (Rhodophyta) and Ulva lactuca (Chlorophyta) as a potential food source. J. Sci. Food Agric. 2012, 92, 2500–2506. [Google Scholar] [CrossRef]
- Julia, I.; Oscar, M.; Analía, L.; Virginia, L. Biofertilization with Macrocystis pyrifera algae extracts combined with PGPR-enhanced growth in Lactuca sativa seedlings. J. Appl. Phycol. 2020, 32, 4361–4371. [Google Scholar] [CrossRef]
- Ferrón-Carrillo, F.; Cunha-Chiamolera, T.P.L.; Peña, A.A.; Urrestarazu, M. Silicon enhances production and quality of blueberry fruits (Vaccinium corymbosum L.). J. Plant Nutr. 2021, 45, 1563–1571. [Google Scholar] [CrossRef]
- Ferruzca-Campos, E.A.; Rico-Chávez, A.K.; Guevara-González, R.G.; Urrestarazu, M.; Cunha-Chiamolera, T.P.L.; Reynoso-Camacho, R.; Guzmán-Cruz, R. Biostimulant and elicitor responses to cricket frass (Acheta domesticus) in tomato (Solanum lycopersicum L.) under protected conditions. Plants 2023, 12, 1327. [Google Scholar] [CrossRef]
- Cunha-Chiamolera, T.P.L.; Urrestarazu, M.; Carbajal-Valenzuela, I.A.; Ramos, J.B.; Ortega, R.; Miralles, I.; Guevara-González, R.G. Extracellular fragmented self-DNA displays biostimulation of lettuce in soilless culture. Horticulturae 2024, 10, 964. [Google Scholar] [CrossRef]
- Rincón-Cervera, M. A.; de Burgos-Navarro, I.; Chileh-Chelh, T.; Belarbi, E. H.; Álvarez-Corral, M.; Carmona-Fernández, M. , Ezzaitouni, M.; Guil-Guerrero, J. L. The agronomic potential of the invasive brown seaweed Rugulopteryx okamurae: Optimisation of alginate, mannitol, and phlorotannin extraction. Plants, 2024, 13, 3539. [Google Scholar] [CrossRef] [PubMed]
- González, V.; Díez-Ortiz, M.; Simón, M.; van Gestel, C. A. Application of bioassays with Enchytraeus crypticus and Folsomia candida to evaluate the toxicity of a metal-contaminated soil, before and after remediation. Journal of Soils and Sediments 2011, 11, 1199–1208. [Google Scholar] [CrossRef]
- Rodríguez, D.; Reca, J.; Martínez, J.; Lao, M.T.; Urrestarazu, M. Effect of controlling the leaching fraction on the fertigation and production of a tomato crop under soilless culture. Sci. Hortic. 2014, 179, 153–157. [Google Scholar] [CrossRef]
- Urrestarazu, M.; Carrasco, G. Soilless Culture and Hydroponics. Mundi-Prensa, Madrid, Spain, 2023; 279 pp. ISBN 13: 9788484767664.
- Peçanha, D.A.; Cunha-Chiamolera, T.P.L.; Chourak, Y.; Martínez-Rivera, E.Y.; Urrestarazu, M. Effect of the matric potential on growth and water, nitrate and potassium absorption of vegetables under soilless culture. J Soil Sci Plant Nutr. 2021, 21, 3493–3501. [Google Scholar] [CrossRef]
- Fabrikov, D.; Guil-Guerrero, J.L.; González-Fernández, M.J.; Rodríguez-García, I.; Gómez-Mercado, F.; Urrestarazu, M.; Lao, M.T.; Rincón-Cervera, M. A.; Álvaro, J. E.; S., Lyashenko. Borage oil: Tocopherols, sterols and squalene in farmed and endemic-wild Borago species. J. Food Compos. Anal., 2019, 83, 103299. [Google Scholar] [CrossRef]
- Petersen, R.G. Agricultural field experiments. Marcel Dekker. New York, NY, 1994; 409 pp. ISBN 0-8247-8912-1.
- Cunha-Chiamolera, T.P.L.; Urrestarazu, M.; Cecilio Filho, A.B.; Morales, I. Agronomic and economic feasibility of tomato and lettuce intercropping in a soilless system as a function of the electrical conductivity of the nutrient solution. HortScience 2017, 52, 1195–1200. [Google Scholar] [CrossRef]
- Moya, C.; Oyanedel, E.; Verdugo, G.; Flores, M.F.; Urrestarazu, M.; Álvaro, J.E. Increased electrical conductivity in nutrient solution management enhances dietary and organoleptic qualities in soilless culture tomato. HortScience 2017, 52, 868–872. [Google Scholar] [CrossRef]
- Atero-Calvo, S.; Izquierdo-Ramos, M.J.; García-Huertas, C.; Rodríguez-Alcántara, M.; Navarro-Morillo, I.; Navarro-León, E. An Evaluation of the effectivity of the green leaves biostimulant on lettuce growth, nutritional quality, and mineral element efficiencies under optimal growth conditions. Plants, 2024, 13, 917. [Google Scholar] [CrossRef]
- Arnon, D.I.; Johnson, C.M. Influence of hydrogen ion concentration on the growth of higher plants under controlled conditions. Plant Physiol. 1942, 17, 525–539. [Google Scholar] [CrossRef]
- Ergun, O.; Dasgan, H. Y.; Isık, O. Effects of microalgae Chlorella vulgaris on hydroponically grown lettuce. In XXX International Horticultural Congress IHC2018: II International Symposium on Soilless Culture and VIII International 1273, 2018; pp. 169-176.
- Ammaturo, C.; Pacheco, D.; Cotas, J.; Formisano, L.; Ciriello, M.; Pereira, L.; Bahcevandziev, K. Use of Chlorella vulgaris and Ulva lactuca as biostimulant on lettuce. Appl. Sci. 2023, 13, 9046. [Google Scholar] [CrossRef]
- Kopta, T.; Pavlikova, M.; Sękara, A.; Pokluda, R.; Maršálek, B. Effect of bacterial-algal biostimulant on the yield and internal quality of lettuce (Lactuca sativa L.) produced for spring and summer crop. Not Bot Horti Agrobo. 2018, 46, 615–621. [Google Scholar] [CrossRef]
- Chen, X.; Song, M.; Zhao, J.; Yin, D.; Ye, X.; Yu, J. Excessive composite pollution carbon sources enhance the bio-fertilizer efficiency of Tetradesmus obliquus: focused on cultivation period. Environ. Sci. Pollut. Res. Int. 2024, 31, 6054–6066. [Google Scholar] [CrossRef] [PubMed]
- Rodriguez-Amaya, D. B. Carotenes and xanthophylls as antioxidants. In Handbook of Antioxidants for food preservation. Woodhead Publishing. 2015; pp. 17-50.
- Eggersdorfer, M.; Wyss, A. Carotenoids in human nutrition and health. Arch. Biochem. Biophys. 2018, 652, 18–26. [Google Scholar] [CrossRef]
- Ishar, M.P.S. Mechanism of antioxidant action of vitamin-E: Role of charge transfer/electron transfer in free radical quenching by alpha-tocopherol and its oxidative transformations-A review. Proc. Natl. Acad. Sci. India 2006, 76, 265. [Google Scholar]
- Meulmeester, F.L.; Luo, J.; Martens, L.G.; Mills, K.; van Heemst, D.; Noordam, R. Antioxidant supplementation in oxidative stress-related diseases: What have we learned from studies on alpha-tocopherol? Antioxidants 2022, 11, 2322. [Google Scholar] [CrossRef]
- Gupta, A.K.; Savopoulos, C.G.; Ahuja, J.; Hatzitolios, A.I. Role of phytosterols in lipid-lowering: current perspectives. QJM: Int. J. Med. 2011, 104, 301–308. [Google Scholar] [CrossRef]
- AbuMweis, S.S.; Jones, P.J. Cholesterol-lowering effect of plant sterols. Curr. Atheroscler. Rep. 2008, 10, 467–472. [Google Scholar] [CrossRef]
- Kelly, G.S. Squalene and its potential clinical uses. Altern Med Rev. 1999, 4, 29–36. [Google Scholar]
- Cárdeno, A.; Aparicio-Soto, M.; Montserrat-de la Paz, S.; Bermúdez, B.; Muriana, F. J.; Alarcón-de-la-Lastra, C. Squalene targets pro-and anti-inflammatory mediators and pathways to modulate over-activation of neutrophils, monocytes and macrophages. J. Funct. Foods 2015, 14, 779–790. [Google Scholar] [CrossRef]
- Toledo-Ortiz, G.; Huq, E.; Rodríguez-Concepción, M. Direct regulation of phytoene synthase gene expression and carotenoid biosynthesis by phytochrome-interacting factors. Proc. Natl. Acad. Sci. 2010, 107, 11626–11631. [Google Scholar] [CrossRef] [PubMed]
- Caliandro, R.; Nagel, K.A.; Kastenholz, B.; Bassi, R.; Li, Z.; Niyogi, K.K.; Pogson, B.J.; Schurr, U.; Matsubara, S. Effects of altered α-and β-branch carotenoid biosynthesis on photoprotection and whole-plant acclimation of Arabidopsis to photo-oxidative stress. Plant Cell Environ. 2013, 36, 438–453. [Google Scholar] [CrossRef] [PubMed]
- Maldini, M.; Natella, F.; Baima, S.; Morelli, G.; Scaccini, C.; Langridge, J.; Astarita, G. Untargeted metabolomics reveals predominant alterations in lipid metabolism following light exposure in broccoli sprouts. Int. J. Mol. Sci. 2015, 16, 13678–13691. [Google Scholar] [CrossRef] [PubMed]
- Randhir, A.; Laird, D.W.; Maker, G.; Trengove, R.; Moheimani, N.R. Microalgae: a potential sustainable commercial source of sterols. Algal Res. 2020, 46, 101772. [Google Scholar] [CrossRef]
- Zandvakili, O.R.; Barker, A.V.; Hashemi, M.; Etemadi, F.; Autio, W.R. Comparisons of commercial organic and chemical fertilizer solutions on growth and composition of lettuce. J. Plant Nutr. 2019, 42, 990–1000. [Google Scholar] [CrossRef]
- García Gómez, J.C.; Sempere Valverde, J.; Ostalé Valriberas, E.; Martínez, M.; Olaya Ponzone, L.; Roi González, A.; Espinosa Torre, F.; Sánchez Moyano, J.E.; Megina Martínez, C.; Parada, J.A. Rugulopteryx okamurae (EY Dawson) IK Hwang, WJ Lee & HS Kim (Dictyotales, Ochrophyta), alga exótica “explosiva” en el estrecho de Gibraltar. Observaciones preliminares de su distribución e impacto. Almoraima. Revista de Estudios Campogibraltareños 2018, 49, 97–113. [Google Scholar]
- Kimura, M.; Rodríguez-Amaya, D.B. A scheme for obtaining standards and HPLC quantification of leafy vegetable carotenoids. Food Chem. 2002, 78, 389–398. [Google Scholar] [CrossRef]
- Ortíz, C.L.; Moya, M.P.; Navarro, V.B. A rapid chromatographic method for simultaneous determination of β-sitosterol and tocopherol homologues in vegetable oils. J. Food Compos. Anal. 2006, 19, 141–149. [Google Scholar] [CrossRef]
- González, V.; García, I.; Del Moral, F.; De Haro, S.; Sánchez, J. A.; Simón, M. Impact of unconfined sulphur-mine waste on a semi-arid environment (Almería, SE Spain). J. Environ. Manage. 2011, 92, 1509–1519. [Google Scholar] [CrossRef]
- Li, Y.; Fu, X.; Duan, D.; Liu, X.; Xu, J.; Gao, X. Extraction and identification of phlorotannins from the brown alga, Sargassum fusiforme (Harvey) Setchell. Mar. Drugs 2017, 15, 49. [Google Scholar] [CrossRef]
- Sonneveld, C.; Straver, N.B. Nutrient solution for vegetables and flowers grown in water or substrates, 10th ed.; Glasshouse Crops Research Station: Naaldwijk, The Netherland, 1994; pp. 1–33. [Google Scholar]
Figure 1.
Water, nitrate, and potassium uptake per week (A, C and E) and total (B, D and F), respectively, of lettuce plants grown in coconut soilless culture under different fertigations with biofertilizers extracted from invasive (R. okamurae) and commercial (A. nodosum) algae. T0: standard optimum fertigation; TR: standard optimum fertigation plus RoB; TA: standard optimum fertigation plus AnB; t0: suboptimal fertigation; tR: suboptimal fertigation plus RoB; tA: suboptimal fertigation plus AnB. Different letters denote statistically significant differences at P < 0.05.
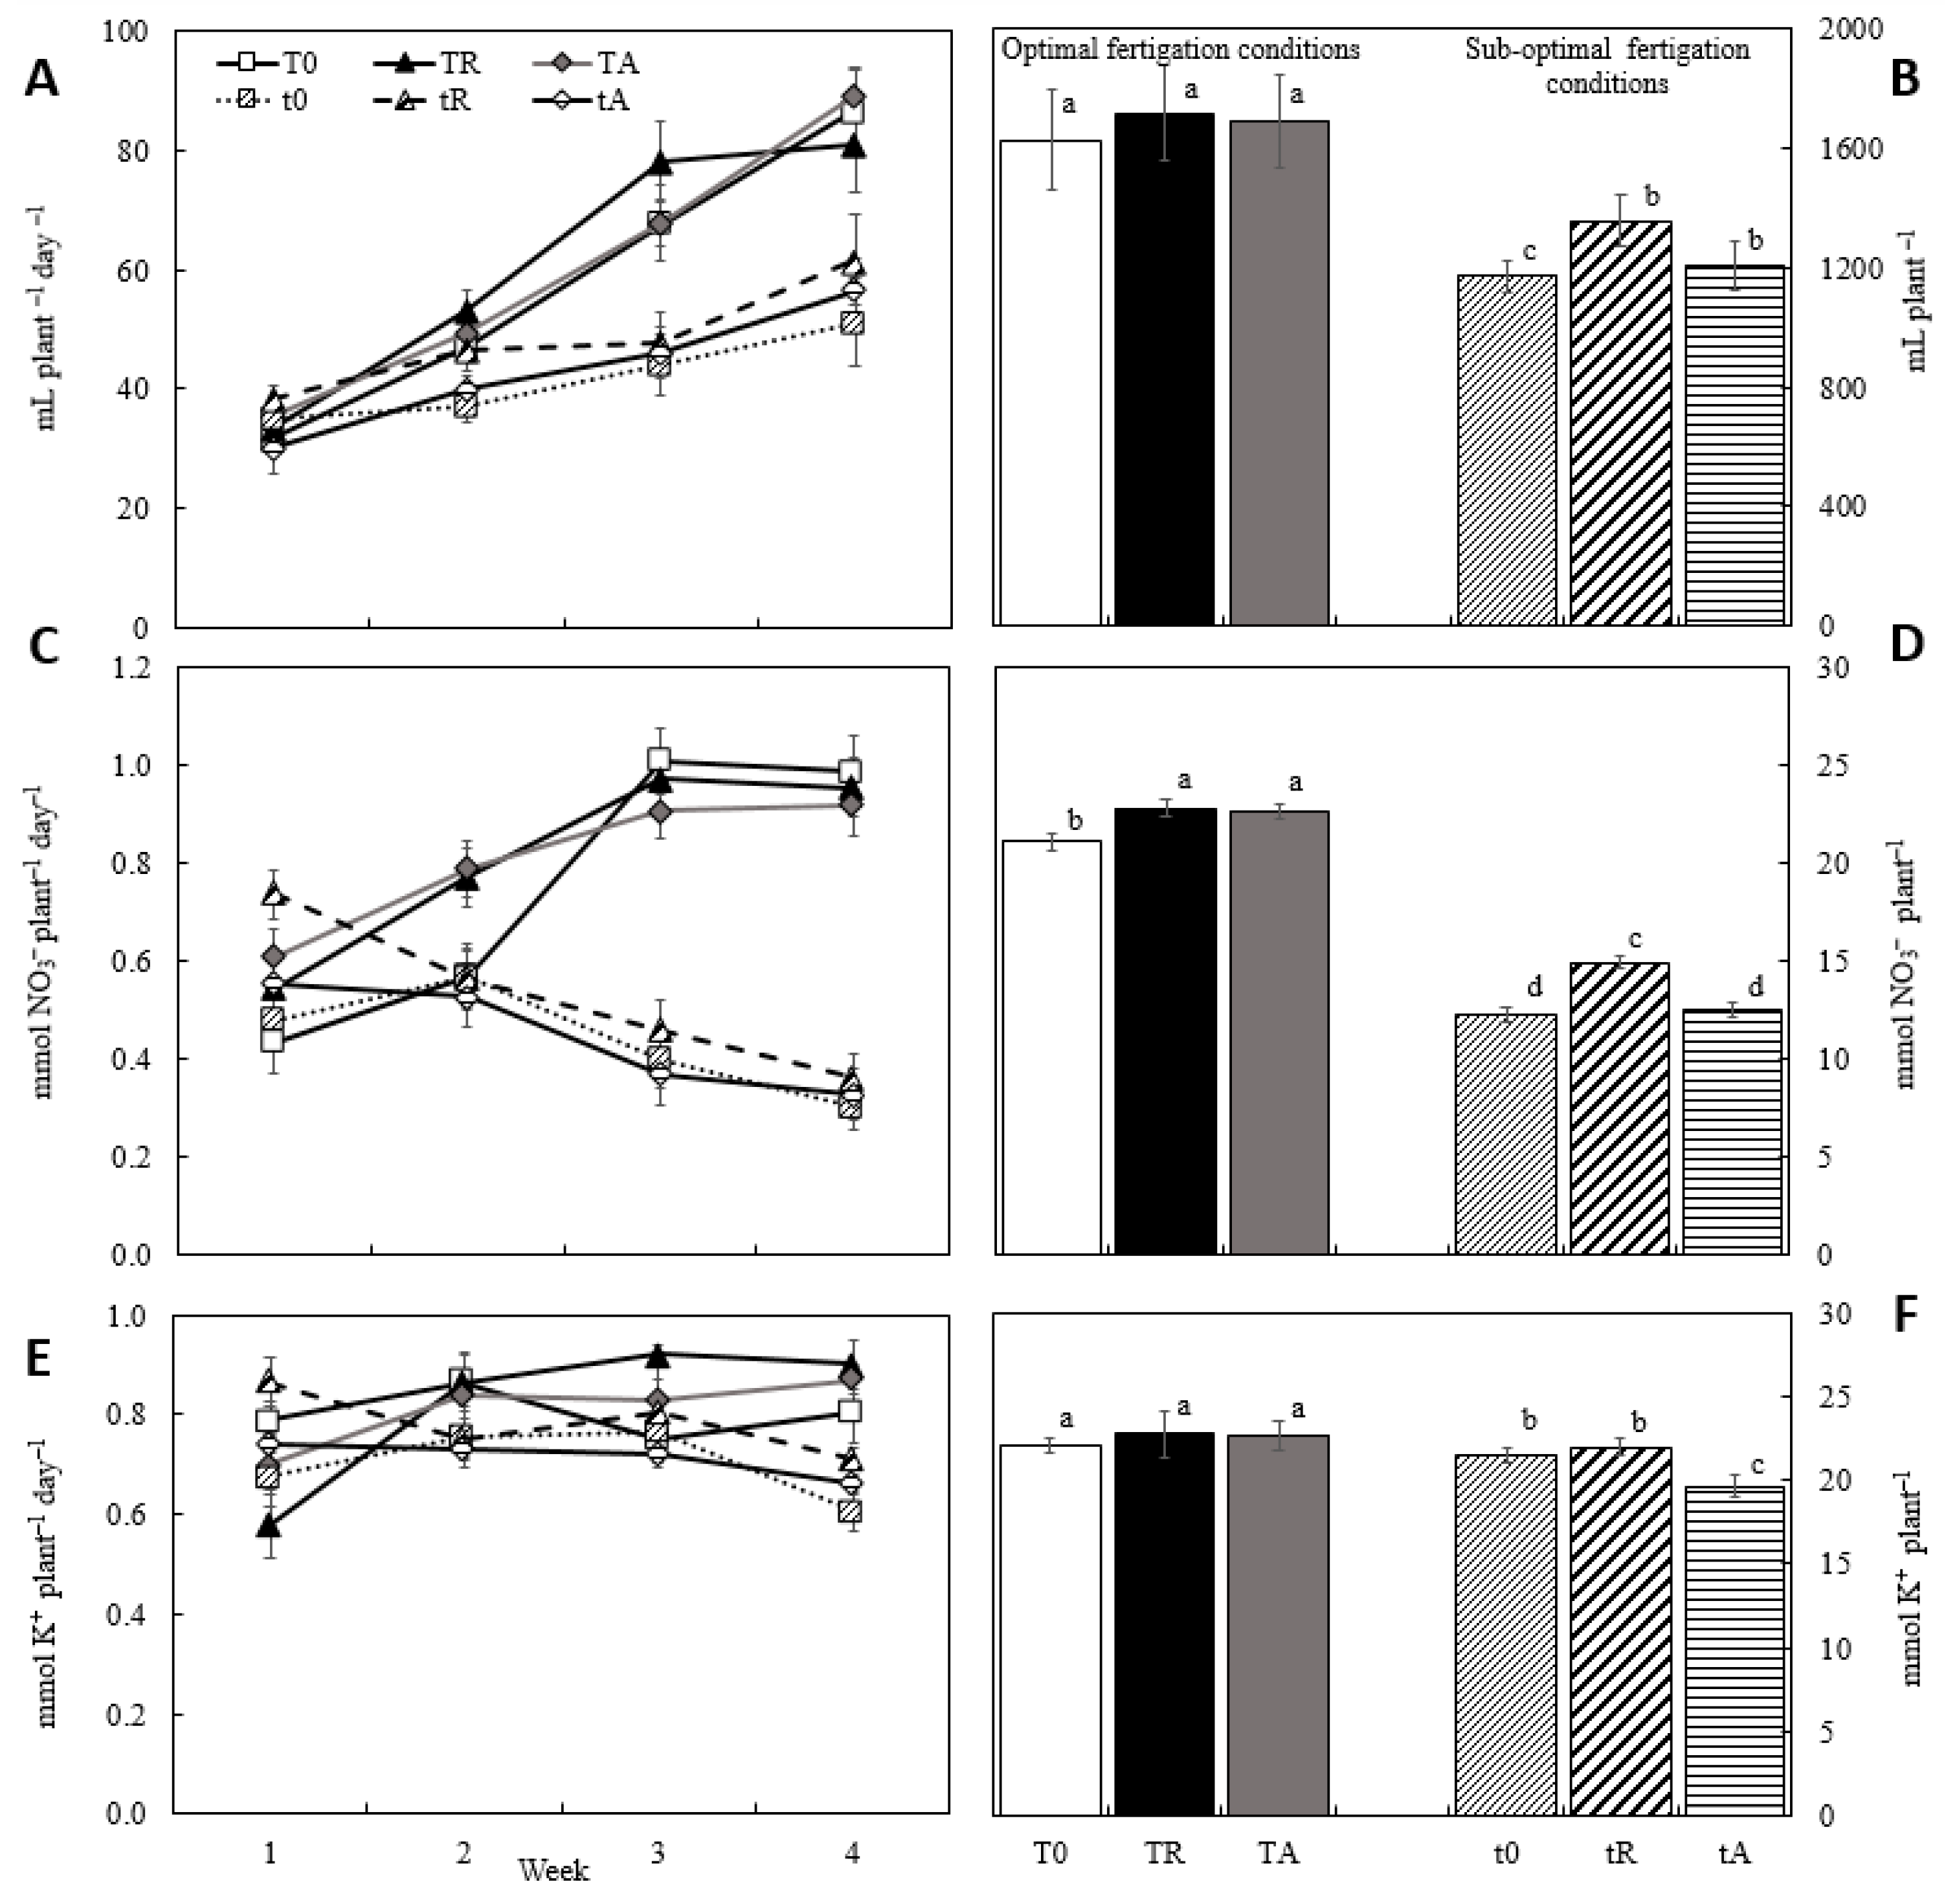
Figure 2.
Fresh (FW - A) and dry weight (DW - B) of lettuce plants grown coconut soilles culture under different fertigations with biofertilizers extracted from invasive (Rugulopteryx okamurae) and commercial (Ascophyllum nodosum) algae. T0: standard optimum fertigation; TR: standard optimum fertigation plus R. okamurae biofertilizer; TA: standard optimum fertigation plus A. nodosum biofertilizer; t0: suboptimal fertigation; tR: suboptimal fertigation plus R. okamurae biofertilizer; tA: suboptimal fertigation plus A. nodosum biofertilizer. Different letters denote statistically significant differences at P < 0.05 by Tukey test.
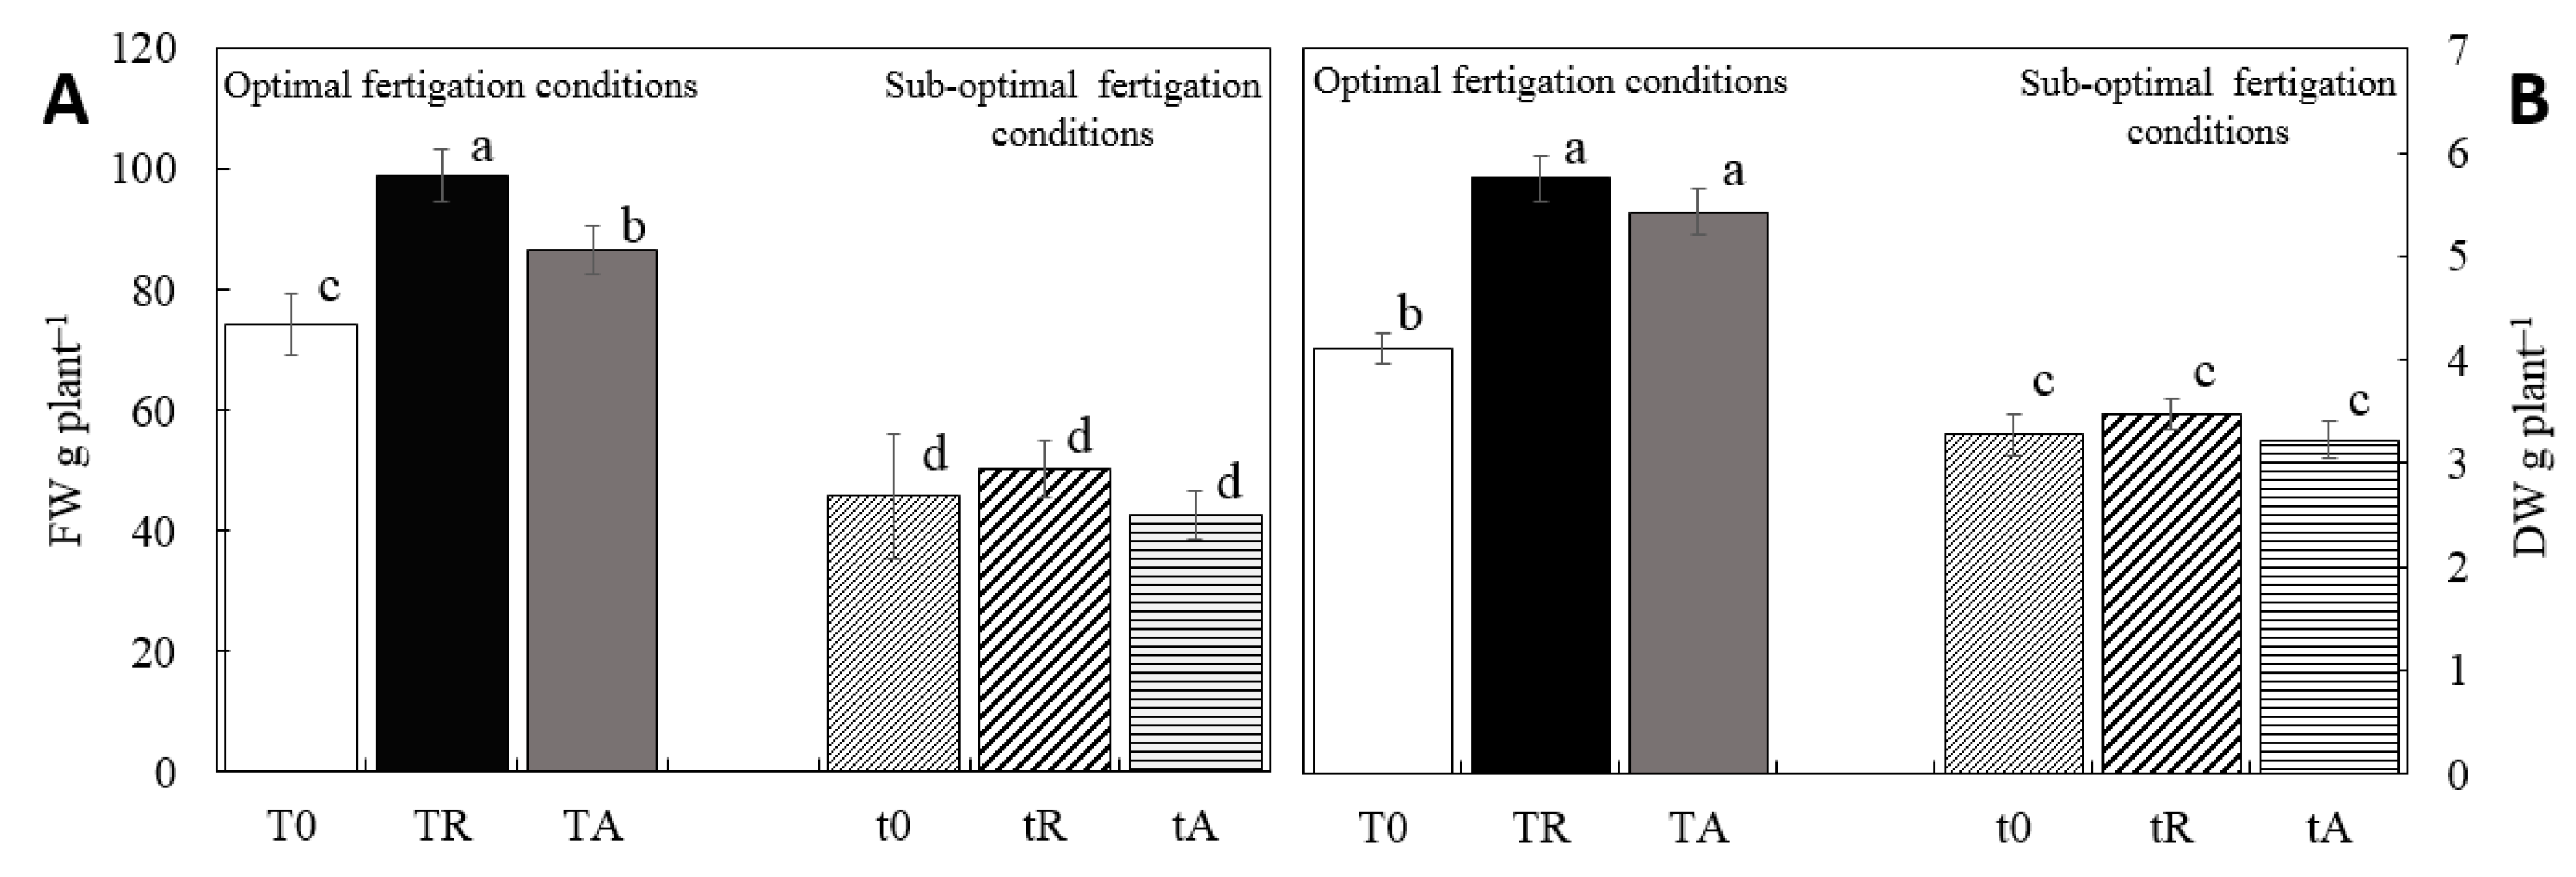
Figure 3.
Biplot for the two first component weights. Culture treatments: T0 = Nutrient solution, standard conditions of fertigation; TR = T0 + RoB; TA = T0 + AnB; t0 = ½ nutrient solution, sub-optimun of fertigation conditions; tR= t0 + RoB; tA = t0 + AnB. Abbreviations for measured variables: anterax – anterxanthin; carot – carotenoids; camp – campesterol; cryptox – cryptoxanthin; DW – dry weight; EC – electrical conductivity; luteox –luteoxanthin; sitost – sitosterol; St – sterols; stigm – stigmasterol; Sq – squalene; T3 – tocotrienols; Tp – tocopherols; violax – violaxanthin; zeax - zeaxanthin. AnB: Ascophyllum nodosum biofertilizer. RoB: Rugulopteryx okamurae biofertilizer.
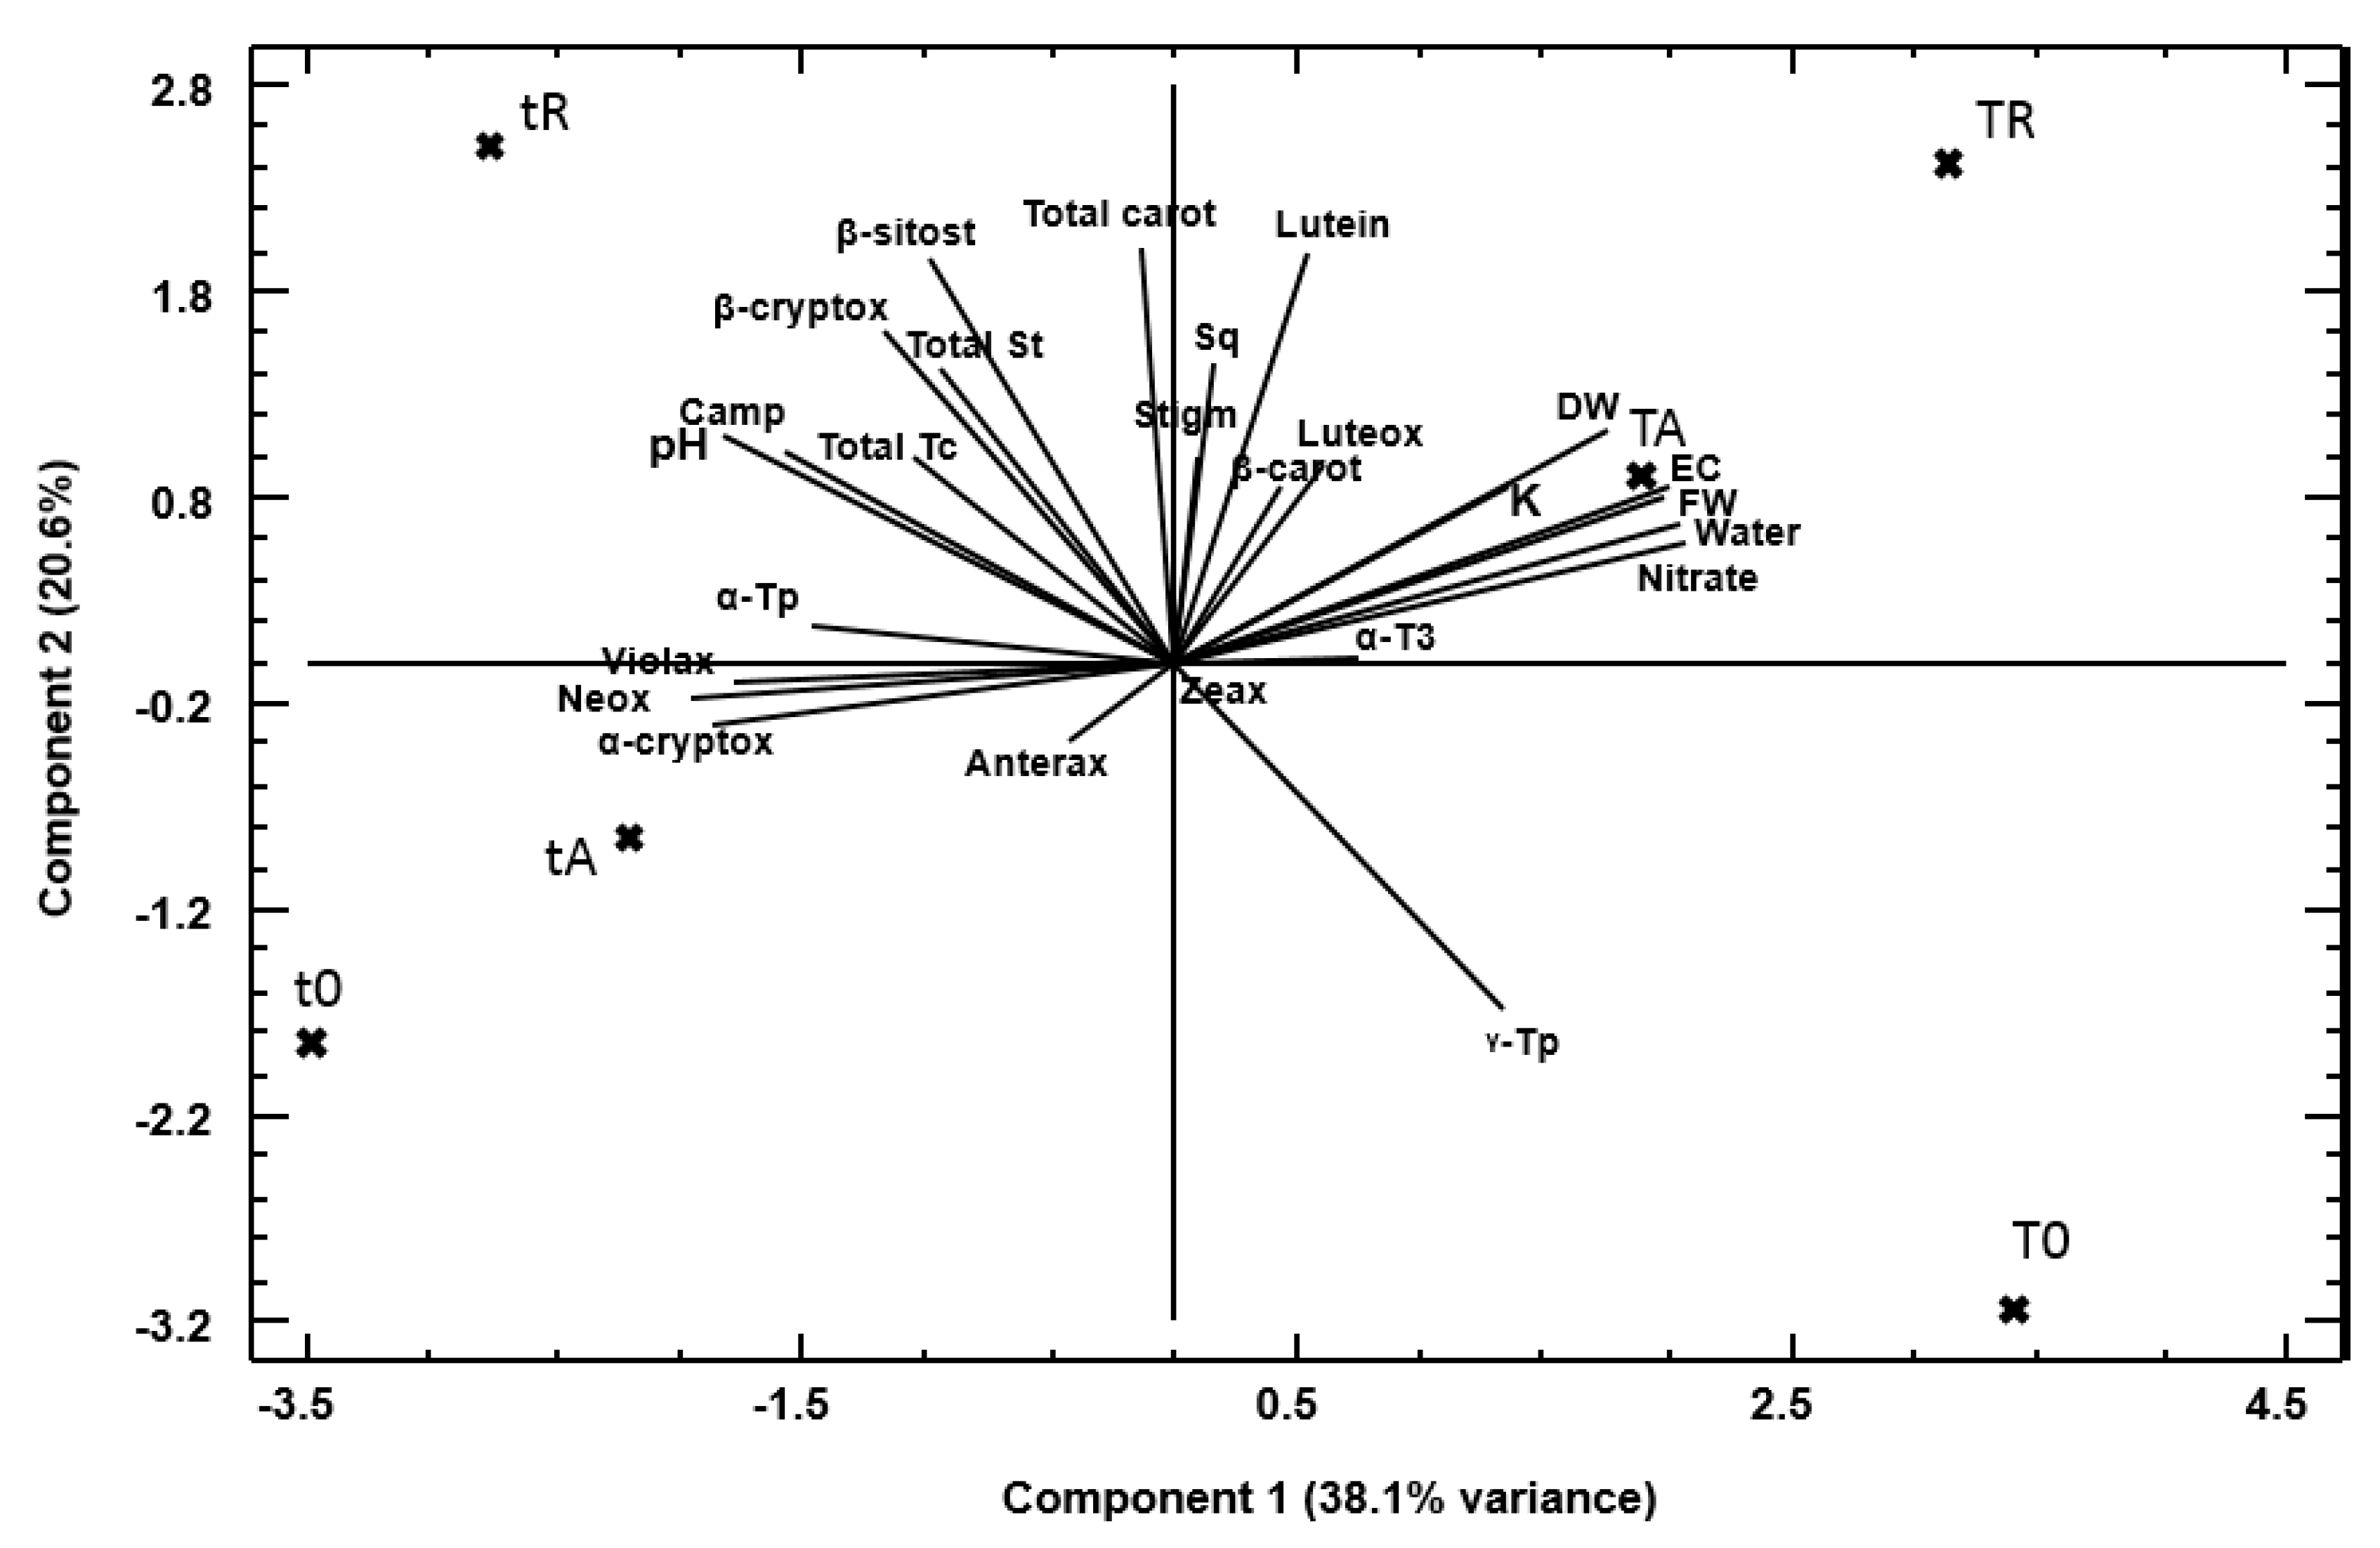

Table 1.
Bioactive compounds and trace metals content in the biofertilizers assayed in this work.
|
A. nodosum (Jospalga 25) |
R. okamurae | Regulation (EU) 2019/1009 | |
| Alginate (g 100 g−1 dw) | 14.5 | 19.4 | - |
| Mannitol (g 100 g−1 dw) | 5.6 | 7.9 | - |
| Phlorotannins (g 100 g−1 dw) | 0.56 | 0.35 | - |
| As (mg kg−1 dw) | 25 | 19 | 40 mg kg-1 dw |
| Cd (mg kg−1 dw) | 0.5 | 0.7 | 1.5 mg kg-1 dw |
| Pb (mg kg−1 dw) | 60 | 46 | 120 mg kg-1 dw |
Table 2.
Composition of the nutrient solution of the fertigation used in each of the treatments.
| Nutrient solution | Biofertiliser extracted | |||
| Macronutrient | Micronutrient | R. okamurae | A. nodosum | |
| T0 | 100% | √ | ‒ | ‒ |
| TR | 100% | √ | √ | ‒ |
| TA | 100% | √ | ‒ | √ |
| t0 | 50% | √ | ‒ | ‒ |
| tR | 50% | √ | √ | ‒ |
| tA | 50% | √ | ‒ | √ |
T0 = Nutrient solution, standard conditions of fertigation; TR = T0 + RoB; TA = T0 + AnB; t0 = ½ nutrient solution, sub-optimun of fertigation conditions; tR= t0 + RoB; tA = t0 + AnB. AnB: Ascophyllum nodosum biofertilizer. RoB: Rugulopteryx okamurae biofertilizer.
Table 3.
Average biostimulation values for fertigation uptake and yield of an extract of Rugulopteryx okamurae and Ascophyllum nodosum applied by standard and deficient fertigation expressed as a percentage increase over a standard solution.
Table 3.
Average biostimulation values for fertigation uptake and yield of an extract of Rugulopteryx okamurae and Ascophyllum nodosum applied by standard and deficient fertigation expressed as a percentage increase over a standard solution.
| Standard optimum fertigation | Sub-optimal fertigation | ||||
| TR | TA | tR | tA | ||
| Uptake | Water | 6.12 | 3.82 | 15.95 | 3.06 |
| Nitrate | 8.02 | 7.27 | 21.56 | 2.04 | |
| Potassium | 3.03 | 2.76 | 1.99 | ‒ 8.79 | |
| Yield | Fresh weight | 33.29 | 16.39 | 9.79 | ‒ 6.69 |
| Dry weight | 39.90 | 32.12 | 6.09 | ‒1.83 | |
| Mean | 18.07 | 12.47 | 11.08 | ‒ 2.44 | |
T0 = Nutrient solution, standard conditions of fertigation; TR = T0 + RoB; TA = T0 + AnB; t0 = ½ nutrient solution (sub-optimun of fertigation conditions); tR= t0 + RoB; tA = t0 + AnB. AnB: Ascophyllum nodosum biofertilizer. RoB: Rugulopteryx okamurae biofertilizer.
Table 4.
Carotenoid contents (mg 100 g-1 fw) of lettuce samples a,b,c.
| Samplesd | All-trans- violaxanthin |
9′-cis-Neoxanthin | Luteoxanthin | Antheraxanthin | Lutein | All-trans-Zeaxanthin | α-Cryptoxanthin | β-Cryptoxanthin | All-trans-β-Carotene | Total Carotenoids mg 100 g-1 fw |
| T0 | 0.9 ± 0.1d | 1.8 ± 0.1d | 0.3 ± 0.0b | 0.1 ± 0.0a | 6.3 ± 0.3c | 0.1 ± 0.0a | traces | traces | 1.2 ± 0.1b | 10.8 ± 0.4b |
| TA | 1.6 ± 0.3b | 2.3 ± 0.5bc | 0.4 ± 0.1b | 0.2 ± 0.0a | 8.8 ± 0.4b | 0.1 ± 0.0a | 0.1 ± 0.0a | 0.1 ± 0.0a | 2.3 ± 0.3a | 15.8 ± 0.8a |
| TR | 1.1 ± 0.1cd | 1.9 ± 0.0cd | 0.8 ± 0.0a | 0.1 ± 0.0a | 9.8 ± 0.3a | 0.1 ± 0.0a | traces | 0.1 ± 0.0a | 1.2 ± 0.2b | 15.1 ± 0.3a |
| t0 | 2.1 ± 0.0a | 2.7 ± 0.1a | 0.5 ± 0.1ab | 0.2 ± 0.0a | 4.4 ± 0.5c | 0.1 ± 0.0a | 0.2 ± 0.0a | 0.1 ± 0.0a | 1.1 ± 0.1b | 11.4 ± 0.5b |
| tA | 1.6 ± 0.1b | 2.8 ± 0.3a | 0.4 ± 0.1b | 0.1 ± 0.0a | 8.8 ± 0.4b | 0.1 ± 0.0a | 0.1 ± 0.0a | 0.1 ± 0.0a | 1.3 ± 0.2b | 15.3 ± 0.6a |
| tR | 1.5 ± 0.1bc | 2.4 ± 0.2ab | 0.3 ± 0.1b | 0.1 ± 0.0a | 9.4 ± 0.2ab | 0.1 ± 0.0a | 0.1 ± 0.0a | 0.1 ± 0.0a | 1.5 ± 0.2b | 15.5 ± 0.4a |
a Data represent means ± standard deviation of seeds analyzed in triplicate; b Differences in carotenoid amounts were tested according to one-way ANOVA followed by Duncan’s test; c In a column means followed by the same superscript letters are not different according to Duncan’s test (P < 0.05); n.d.: not detected; dCodes as in Table 1.
Table 5.
Tocols, sterols and squalene contents in lettuce samples a,b,c.
| Species /codes |
Tocols (mg/100 g fw) | Total Tc mg 100 g-1 fw |
Sterols (mg/100 g fw) | Total St mg 100 g-1 fw |
Squalene mg 100 g-1 fw |
|||||
| α-T3 | α-Tp | γ-Tp | δ -Tp | Stigmasterol | Campesterol | β-sitosterol | ||||
| T0 | 0.02 ± 0.00b | 0.15 ± 0.01bc | 0.26 ± 0.00b | traces | 0.44 ± 0.01b | 20.9 ± 2.8bc | 2.2 ± 0.2d | 0.2 ± 0.0b | 23.3 ± 2.8cd | 0.1 ± 0.0a |
| TA | 0.08 ± 0.02a | 0.12 ± 0.00c | 0.24 ± 0.08b | traces | 0.45 ± 0.08b | 17.9 ± 2.6c | 3.9 ± 0.4c | 0.4 ± 0.1a | 22.2 ± 2.6d | 0.1 ± 0.0a |
| TR | 0.03 ± 0.01b | 0.14 ± 0.01bc | 0.25 ± 0.04b | traces | 0.42 ± 0.04b | 25.6 ± 0.7a | 3.2 ± 0.1c | 0.4 ± 0.0a | 29.1 ± 0.7ab | 0.1 ± 0.0a |
| t0 | 0.03 ± 0.01b | 0.18 ± 0.03ab | 0.26 ± 0.05b | traces | 0.46 ± 0.06b | 21.1 ± 2.1b | 5.9 ± 0.6b | 0.4 ± 0.1a | 27.4 ± 1.2bc | traces |
| tA | 0.03 ± 0.01b | 0.14 ± 0.00bc | 0.26 ± 0.02b | traces | 0.42 ± 0.02b | 21.8 ± 2.1b | 3.0 ± 0.4cd | 0.3 ± 0.0ab | 25.1 ± 2.2c | 0.1 ± 0.0a |
| tR | 0.02 ± 0.00b | 0.20 ± 0.01a | 0.35 ± 0.03a | traces | 0.57 ± 0.03a | 22.6 ± 1.3ab | 7.7 ± 0.6a | 0.5 ± 0.0a | 30.8 ± 1.0a | 0.2 ± 0.0a |
a Data represent means ± standard deviation of seeds analyzed in triplicate; b Differences in Tc, St and Sq amounts were tested according to one-way ANOVA followed by Duncan’s test; c In a column means followed by the same superscript letters are not different according to Duncan’s test (P < 0.05); n.d.: not detected; dCodes as in Table 1.
Disclaimer/Publisher’s Note: The statements, opinions and data contained in all publications are solely those of the individual author(s) and contributor(s) and not of MDPI and/or the editor(s). MDPI and/or the editor(s) disclaim responsibility for any injury to people or property resulting from any ideas, methods, instructions or products referred to in the content. |
© 2025 by the authors. Licensee MDPI, Basel, Switzerland. This article is an open access article distributed under the terms and conditions of the Creative Commons Attribution (CC BY) license (http://creativecommons.org/licenses/by/4.0/).
Copyright: This open access article is published under a Creative Commons CC BY 4.0 license, which permit the free download, distribution, and reuse, provided that the author and preprint are cited in any reuse.


