

Submitted:
10 April 2025
Posted:
11 April 2025
You are already at the latest version
Abstract
In the past three years, electric vehicle (EV) sales in Indonesia have increased significantly, reflecting a positive trend in the country’s efforts to reduce carbon emissions. However, research by Canals Casals et al. (2016) highlights that EV adoption in developing countries may not always lead to effective carbon emission reductions. The environmental benefits of EVs are highly dependent on the electricity generation mix of a given country. Since Indonesia still relies heavily on fossil fuel-based power plants, the positive impact of EV usage on emission reduction needs to be critically assessed. this paper examines the adoption of electric vehicles (EVs) as a strategic pathway to reduce fossil fuel import dependency and carbon emissions. Using emissions data provided by the Google Environmental Insights Explorer (EIE) in West Nusa Tenggara Province (NTB), this study adopts a System Dynamics approach to explore various policy and energy transition scenarios that could maximize the environmental benefits of EV use. The findings of this research are expected to serve as a foundation for formulating more effective electric vehicle development policies in Indonesia.
Keywords:
electric vehicle
; google environment insight explorer
; low carbon mobility
; sustainability development goals
; system dynamics
; transportation
1. Introduction
The transition toward low-carbon transportation modes is an integral component of Indonesia's national strategy to address climate change, as outlined in the strategic agenda of the National Development Planning Agency [1,2]. This transition requires well-designed and specific scenarios that consider multiple interrelated aspects, including energy security, the competitiveness of electric vehicles, and transportation emissions [3-5]. These three dimensions are interconnected, thereby necessitating a comprehensive analysis to inform effective policy formulation.
Electric vehicle (EV) sales in Indonesia experienced a remarkable increase between 2021 and 2023, with an average annual growth rate of 206.6% [6]. However, without a parallel transition to renewable electricity sources, EV adoption may introduce new challenges. This concern is echoed in the work of Canals Casals et al. [7], who demonstrate that the emission reduction benefits of EVs are highly dependent on the source of electricity generation. If the national grid is still dominated by fossil fuels, EV usage can produce carbon emissions comparable to—or even higher than—those of internal combustion engine (ICE) vehicles. Conversely, Atabani et al. [8] show that fuel efficiency improvements and emission reductions can be achieved through energy-efficient vehicle technologies. Indonesia faces considerable challenges in its transition to EVs, largely due to its continued reliance on fossil fuels [9]. Currently, renewable energy contributes only 14% to the national electricity mix. State Electricity Company (PLN) aims to increase this share to 23% by 2030 [1,10,11]. However, no comprehensive study has yet examined whether EV deployment in Indonesia will bring substantial climate mitigation benefits.
Meanwhile, ICE-based transportation continues to present serious challenges, particularly regarding carbon emissions and the nation’s heavy reliance on imported petroleum fuels [12]. To meet domestic demand, Indonesia imports a substantial volume of fossil fuels [13], which contributes to rising national expenditure, trade balance pressures, and the weakening of foreign exchange reserves [14].
Although various policies have been issued to promote the adoption of electric vehicles (EVs), to date, there is a lack of research that systematically integrates the dynamics of energy mix, emission impacts, and fossil fuel dependency into a unified, data-driven transition framework. To address this gap, this study poses three core research questions: (1) What form should a transition model from internal combustion engine (ICE) vehicles to EVs take in order to reflect the dynamics of energy demand and emission efficiency? (2) What percentage of EV adoption is required to eliminate Indonesia’s dependency on imported fossil fuels? (3) What is the most optimal scenario to ensure a sustainable transportation system in Indonesia?
This study has the potential to provide important implications for government policy in designing a more systematic, data-based transportation transition strategy that aligns with the country’s Net Zero Emissions (NZE) target by 2050 [15]. From an academic standpoint, the results of this study are expected to enrich the literature on sustainability and energy transition in developing countries.
A study by Edwaren Liun [16] using the MESSAGE method indicates that, with the same amount of energy consumption, electric vehicles are 18% more efficient than ICE vehicles. While this demonstrates EVs' potential to reduce carbon emissions, the study does not elaborate on how emissions from both vehicle types are accounted for or how the energy supply strategy supports transportation sustainability. To analyze such aspects, a bottom-up approach to emission inventories and transport behavior modeling may be employed. Arioli et al. [17] suggest that the bottom-up method is more effective for designing targeted transport policies. However, this approach often faces challenges related to data availability and the high cost of large-scale information collection. Therefore, leveraging technological tools becomes essential to overcome these limitations [18].
As an alternative, the Google Environmental Insights Explorer (Google EIE) provides a bottom-up framework to efficiently estimate emissions and transportation behavior. Google EIE is a data-driven platform that integrates Google Maps and traffic sensor data to generate emissions inventories and behavioral analyses [19]. This technology replaces traditional methods that rely heavily on manual field surveys. It has already undergone validation in the United States [20], making it a suitable tool for this study. Currently, Google EIE has only been implemented in one Indonesian province, West Nusa Tenggara (NTB), which has therefore been selected as the case study area to assess the integration of Google EIE into low-carbon transport transition scenarios.
Since Banister [4] introduced the sustainable transportation paradigm, understanding transport systems has required multiple perspectives beyond linear approaches. Sustainable transportation systems must consider not only mobility needs but also energy availability, environmental impacts, and economic implications. In the analysis of transport policy systems, several studies have recommended the use of System Dynamics (SD). SD is powerful in analyzing the complexity of interconnected systems [21], allowing for the qualitative mapping of causal relationships between variables and the numerical simulation of scenarios to achieve desired indicators [22-24]. Given that this research demands a systemic thinking framework combined with numerical simulations, the SD approach is deemed suitable for generating robust policy insights.
By integrating the SD approach with technologically derived data from Google EIE, this study aims to construct a low-carbon transport transition model that is contextually relevant for Indonesia and potentially replicable in other regions with similar characteristics. The following section outlines the methodological framework used to develop the model.
2. Method
2.1. System Dynamics Approach
In this study, the System Dynamics (SD) approach was chosen as it is more suitable for analyzing low-carbon transportation systems that are aggregate, macro-level, and oriented toward long-term policy planning. While Agent-Based Modeling (ABM) excels in capturing individual micro-level behaviors and agent interactions, SD offers superior capability in mapping systemic structures and feedback-based causal relationships, such as the interplay between energy mix, EV adoption rates, and carbon emissions. Furthermore, SD enables the exploration of policy scenarios through numerical simulation over extended time horizons, making it more appropriate for modeling the dynamics of accumulated variables such as vehicle ownership or energy demand. Given the focus of this study on data-driven scenario formulation and systemic policy impact forecasting, SD is deemed more relevant than ABM. The latter is more appropriate for exploring individual behavior and micro-level scenarios, which are not the primary focus of this research [25].
As a computer-based simulation method, SD facilitates the modeling of systemic thinking frameworks by considering the interrelationships between various elements of a system. One of the core tools in SD is the Causal Loop Diagram (CLD), which is used to visually represent cause-and-effect relationships within a system [23]. This diagram helps to understand how changes in one variable can influence others. CLDs consist of three key components: (1) Variables, representing system elements subject to change; (2) Causal Arrows, which denote the direction of influence between variables; and (3) Positive (+) and Negative (−) signs, indicating whether the relationship is reinforcing or balancing.
The CLD serves as the conceptual framework for simulating the transportation transition model. In line with the study's objectives, it is necessary to perform dynamic system behavior analysis through numerical computation and simulation [26]. These calculations address the core research questions, such as the required EV adoption rate to eliminate Indonesia’s dependency on imported fossil fuels, and the renewable energy ratio necessary to achieve a low-carbon transportation system. For this purpose, the CLD is further developed into a Stock and Flow Diagram (SFD), which facilitates the quantification of stocks and flows within the system and produces more accurate simulation outputs.
The analysis is based on a combination of official government data and transportation data from Google EIE for West Nusa Tenggara (NTB), which are dynamically processed through the SFD model. The SFD enables the development of multiple policy scenarios, allowing the transition strategy to be managed in a more flexible and adaptive manner. Three scenarios are explored: (1) Business as Usual (BAU), representing a trajectory with no significant policy intervention; (2) Moderate Scenario, a realistic scenario with limited policy intervention and implementation constraints; and (3) Optimistic Scenario, which assumes maximum policy interventions leading to significant environmental and economic impacts.
2.2. Scope and Limitation
In designing the Causal Loop Diagram (CLD), it is essential to define the system boundaries to ensure that the model remains focused, avoids excessive complexity, and stays aligned with the research objectives. The core focus of this analysis is the transition from internal combustion engine (ICE) vehicles to electric vehicles (EVs), taking into account national energy security and carbon emission reduction resulting from future transportation growth. Therefore, variables that do not have a significant impact on the study's focus are excluded. The system boundary setting follows the method proposed by Bureš [27], which includes: (1) Endogenization, or the elimination of exogenous variables that do not directly contribute to the system’s internal behavior; (2) Encapsulation, the merging of variables that serve only as single-input/single-output intermediaries, to simplify the model structure; and (3) Order-Oriented Reduction, the removal of connector variables that lack systemic relevance, such as public perception or communal awareness of environmentally friendly vehicles.
This study adopts the perspective of policymakers—particularly at the national and subnational levels. From a policy standpoint, the analysis presented in this research is intended to support institutions such as Bappenas (the National Development Planning Agency), the Ministry of Transportation, the Ministry of Energy, and the Provincial Government of West Nusa Tenggara in developing more effective low-carbon transportation transition strategies.
2.3. Model Variable Identification and Data Integration
The variables and parameters used in this study were derived from a review of credible journal literature that discusses transportation system modeling through a SD approach. These variables were then integrated with those provided by Google EIE, which serves as the primary data source for transportation-related emissions in West Nusa Tenggara (NTB). Studies by Onat et al. and Sayyadi [28,29] propose four main categories of variables that influence the adoption of electric vehicles: (1) transportation aspects, (2) economic aspects, (3) environmental aspects, and (4) social aspects. All relevant variables across these four categories were summarized alongside available supporting data.
The transportation aspect includes a set of variables representing the transportation system [29]. Population growth is the primary driver of increased travel demand, which, in turn, leads to greater use of transportation modes—both ICE- and EV-based. These two modes of transport consume fuel (gasoline or diesel) and electricity respectively, based on travel distance. ICE vehicles produce direct emissions from internal combustion, while EVs generate indirect emissions from electricity production.
In identifying economic aspects, studies have highlighted a strong correlation between economic growth and transport mobility [30]. Increased mobility enhances productivity and stimulates economic growth, and vice versa [31]. From the perspective of externalities, previous studies have emphasized the long-term socioeconomic consequences of global warming [32,33]. There is a negative correlation between climate change and investment, employment availability, and overall well-being. Simulations by Masters and McMillan [34] also suggest that tropical countries face higher risks of slow economic growth compared to subtropical regions.
The urgency to adopt EVs is largely driven by the need to reduce transportation-related emissions, which pose significant environmental and social challenges. Lelieveld et al. [35] provide compelling evidence that phasing out fossil fuel use could prevent approximately 3.6 million (range: 2.96–4.21 million) premature deaths annually due to outdoor air pollution. Globally, fossil fuel-related emissions are responsible for around 65% of these excess deaths. James Woodcock [36] also argues that reducing motor vehicle use—especially through increased walking and cycling—provides substantial public health benefits. Thus, there is a direct relationship between transport-related externalities and public health.
2.4. EV Transition Simulation Design
To sharpen the formulation of the research questions, this study incorporates findings from previous transportation transition studies conducted in Indonesia. Lonan and Ardi [37] provide projections for feasible EV adoption rates within specific timeframes. Their study suggests that EV adoption can increase significantly if the government implements proper incentives, such as vehicle purchase subsidies, tax reductions, and the development of widespread charging infrastructure. In the most ambitious scenario, EVs are projected to replace up to 60% of ICE vehicles by 2040. This growth could be achieved if EV prices are reduced by 50%, domestic production capacity is expanded, and the charging station network develops faster than EV ownership itself. For this reason, the simulation in this study adopts an exploratory approach and does not consider the policy feasibility constraints when establishing the baseline.
The simulation assumes substantial growth in EV adoption based on the data presented by Ardiyanti et al. [6]. According to the Indonesian National Police Traffic Corps (Korlantas) in 2023, the number of registered four-wheeled vehicles in Indonesia reached 20.1 million units [38]. Over the past decade, annual vehicle sales in Indonesia have stagnated at around 1 million units [39], suggesting that recent EV sales may have started substituting for ICE vehicle sales over the last five years.
Indonesia has considerable potential to expand renewable energy (RE) as a primary source for electricity generation. Government Regulation No. 79 of 2014 on the National Energy Policy set a target for RE to contribute at least 23% of the national energy mix by 2025 and 31% by 2050 [40]. Indonesia’s estimated RE potential reaches 442 gigawatts (GW), yet by 2018, only 8.8 GW had been installed—approximately 14% of the national capacity of 64.5 GW. This indicates significant room for growth in RE deployment.
Conversely, the production of primary energy sources such as natural gas, petroleum, and coal has shown a declining trend in recent years. Meanwhile, the contribution of RE to the primary energy mix has steadily increased—from just 4.9% in 2015 to 12.16% in 2021. On the consumption side, between 2019 and 2023, Indonesia’s per capita electricity consumption increased by 23.3% [13]. The average annual growth rate of per capita electricity consumption over the last five years (2019–2023) has been approximately 5.38%.
The emission factor for coal combustion follows the IPCC guidelines [41], set at 0.0003406 tCO₂/KWh. According to technical estimates from Li et al. [42], the average energy consumption required for an EV to travel one kilometer is approximately 0.33 KWh/km. This value reflects the typical energy efficiency under normal operating conditions and serves as a baseline for estimating EV electricity demand in energy planning, transportation system simulation, and emission analysis based on electricity mix scenarios.
2.5. Data Acquisition and Validation
This study utilized three primary data sources collected during the 2022–2023 period to develop a sustainable transportation system model. The first source is travel and emissions inventory data from Google EIE, which served as the foundation for the transportation analysis. The second source consists of secondary data obtained from the Central Statistics Agency (BPS), government ministry reports, academic literature, and previous research studies to ensure the model's validity and reliability. The model structure was developed using Vensim software, which was employed to construct both the CLD and the SFD.
The validation process followed two approaches: (1) Structure Verification, in which the model structure was compared with insights from existing literature and expert knowledge, and (2) Behavior Reproduction Test, where the simulation output of the Business-as-Usual (BAU) scenario was matched against historical energy consumption trends in NTB Province.
To build the CLD structure, expert interviews were conducted as part of a Participatory Dynamic Modeling approach [48,49], involving purposively selected experts [50]. These experts were chosen based on their domain expertise in transportation, urban planning, sustainable development, and energy security. Three experts were interviewed to assess the reliability of the model: one academic who also serves as the head of an SDGs Center, a member of the National Energy Council, and a prominent transportation expert well-known in the media. These in-person interviews provided valuable feedback that helped confirm and enrich the model structure with expert insights.
Several limitations were acknowledged in this study: (1) The research did not incorporate qualitative data into the simulation framework, and therefore could not capture the social dynamics influencing EV adoption; (2) The model structure excludes public transportation systems, as this study specifically focuses on EV transition dynamics related to energy security, fiscal impact, and emissions. However, the inclusion of public transport aspects is recommended for future research; (3) A key limitation of the SD approach applied in this study is its inability to account for detailed individual behavioral dynamics, spatial effects, and user preferences toward EVs. As such, the simulation results should not be interpreted as precise forecasts, but rather as exploratory scenarios to support evidence-based policy design for transportation transition.
2.6. Google Environmental Insight Explorer
Arioli et al., in The Evolution of City-Scale GHG Emissions Inventory Methods: A Systematic Review [17], highlight the primary challenges in city-level transportation emissions inventory, particularly in the implementation of the bottom-up approach. While the bottom-up method is recognized as more accurate than the top-down approach, their study identifies significant barriers to its implementation, including data limitations, high costs, and a lack of standardization in transport data collection systems. In many cities, especially in developing countries, crucial transportation activity data such as Vehicle Kilometers Travelled (VKT), travel patterns, and fuel consumption remain poorly documented, making the bottom-up approach difficult to apply on a broader scale.
This study aims to refine the bottom-up approach by integrating real-time data-driven technology through Google EIE. By addressing the limitations identified in previous research, this study contributes not only to the enhancement of more efficient policy development but also to the advancement of the bottom-up methodology as previously discussed by Arioli et al. Google EIE has advantages over government methods in transportation emissions inventory [19]. As shown in Figure 1., Google EIE is able to detect emissions based on transportation mode type, while government methods still rely on calculating the total energy consumption of the transportation sector.
The Jakarta Environmental Agency document [51] states that transportation emissions are calculated as part of total energy consumption. Figure 2. illustrates the inventory method of the above needs which results in a lack of granularity in the data. With this approach, it is difficult to know the specific contribution of two-wheeled and four-wheeled vehicles to total emissions, in contrast to Google EIE which is able to present emission data in more detail.
Based on Table 3, Google EIE is considered more accurate in describing the details of motor vehicle emissions, so it needs to be further tested whether its use can provide new insights into sustainable transportation systems.
3. Transition Model
3.1. Causal Loop Diagram of Transportation Transition
The CLD sequence begins with the Transportation Driver Subsystem, as illustrated in Figure 3. Population and economic growth serve as the primary drivers of increased travel demand. Gross Domestic Product (GDP) and the number of trips are linked through a reinforcing feedback loop, as a higher volume of travel also contributes positively to economic activity. The number of trips influences the total travel distance across transportation modes. This travel distance is further affected by the average distance per trip.
Several factors can influence the average travel distance—such as land use patterns, the availability of public transportation, and geographical conditions. However, these factors were not included in the model, as they are not directly relevant to the central focus of this study.
The Transportation Driver CLD is then connected to the Electric Vehicle (EV) subsystem. Total travel distance is converted into EV-specific travel distance, which is derived from the number of EV trips and the average distance per trip. The number of EV trips is influenced by the EV adoption rate. This adoption rate is, in turn, affected by various factors such as government policies, pricing, reliability, public perception, and others. These factors are simplified in this model as they are not the primary focus of the study. The total EV travel distance drives electricity consumption, thereby increasing electricity demand.
Electricity demand simultaneously reduces electricity supply and stimulates electricity production. Electricity production is sourced from both fossil fuels and RE, each contributing to the overall electricity supply. However, non-renewable electricity generation increases coal usage. When multiplied by the carbon emission coefficient, coal combustion results in increased carbon emissions, which subsequently contributes to greenhouse gas (GHG) accumulation. The rise in GHG levels leads to climate change, which in turn may trigger negative economic consequences. This overall feedback loop forms a balancing loop, aiming to stabilize the system.
Figure 4 below illustrates how the share of renewable energy in the electricity mix plays a critical role in minimizing the externalities of EV usage. The use of fossil fuels for electricity production creates a chain of externalities that impact both environmental and economic dynamics. Nevertheless, despite the adverse emissions associated with fossil fuels, coal reserves in Indonesia remain abundant.
The Transportation Driver CLD is also connected to the Internal Combustion Engine (ICE) subsystem, as illustrated in Figure 5. The ICE subsystem features a more complex structure compared to the EV subsystem. Travel distance is converted into ICE-specific distance traveled, calculated based on the number of ICE trips and the average distance per trip. This ICE travel distance drives fuel consumption, which in turn increases fuel demand.
Rising fuel demand reduces the available fuel supply while simultaneously stimulating domestic fossil fuel production, encouraging biofuel development, and increasing fuel import expenditures. Imports continue to dominate the national fuel supply, thereby requiring sustained government budget allocations and placing pressure on fiscal resources. This situation can reduce the availability of funds for other, more productive sectors. Conversely, if fuel import spending could be eliminated, the reallocated funds could potentially be used to stimulate broader economic activity.
Unlike EVs, ICE vehicle usage results in not only carbon emissions but also direct and localized air pollution. These emissions can have social implications, particularly in terms of public health. Empirical evidence shows that vehicle-related air pollution negatively affects community health. In Indonesia, the government provides public healthcare subsidies, which means that declining public health conditions lead to increased healthcare spending. This increase in health-related expenditures reduces the government’s ability to allocate funding toward programs that promote economic growth.
The three CLDs were then integrated into a unified transition model illustrating the shift from ICE-based to EV-based transportation. As shown in Figure 6, both ICE and EV systems contribute to GHG emissions, but through different mechanisms. The ICE subsystem has a more direct emission pathway, as combustion occurs within the vehicle itself. In contrast, EV emissions originate indirectly from the combustion of fossil fuels used in electricity generation.
The fuel supply chain for ICE vehicles is more complex and involves higher externalities compared to EVs. Indonesia’s limited petroleum reserves necessitate reliance on imported fuel and the use of palm oil blends in fuel mixtures. Both sources carry potential negative implications if not managed carefully.
3.2. Stock and Flow Diagram: EV Adoption to Eliminate Fuel Imports
The SFD was developed based on the CLD of the transportation transition model to enable numerical simulation of scenarios aimed at eliminating fuel imports. Therefore, relevant variable data were integrated into the SFD to generate the desired quantitative calculations. Figure 3 below identifies the projected total number of EV and ICE vehicles in 2050, based on the vehicle growth rate observed over the past five years. The growth rate of EVs was calculated within the limits of overall vehicle growth. Given recent trends, EV adoption is expected to grow exponentially; however, this growth is subject to market saturation as it approaches the upper limit of market capacity.
As EVs gain market share, ICE vehicles are projected to experience a decline. However, this shift in market share between ICE and EV vehicles does not affect the total number of vehicles on the road. The decline in ICE vehicles leads to a reduction in ICE travel distance, which is offset by the increase in EV travel distance. As a result, the use of imported fuel can gradually be reduced. Fuel imports are projected to be eliminated once ICE vehicle travel drops by approximately 42% from current levels. This milestone is expected to occur around the year 2040, coinciding with the point at which EV growth begins to plateau.
3.3. Stock and Flow Diagram of Energy Mix Dynamics, Fuel Imports and EV Adoption
After establishing the baseline scenario for eliminating fuel imports, the sustainable transportation concept is further extended to include environmental impact considerations. Figure 6 illustrates the simulation of the EV transition in reducing negative impacts on environmental quality. However, model validation is necessary to ensure the reliability of the projected outcomes. The SFD simulation results were compared with available historical data, including vehicle ownership growth and electricity production trends.
Table 4 shows that the projected growth in future motor vehicle ownership generated by the SFD model aligns closely with historical trends. Likewise, Table 4 presents the SFD's projected growth in fossil-fuel-based electricity production, which is also consistent with observed historical data. These comparisons suggest that the SFD model produces projections that are reasonably representative of actual conditions.
Environmental quality improvements are pursued by reducing carbon emissions, both those generated directly from ICE vehicles and indirectly from electricity generation. In the long term, increased EV adoption will reduce emissions from ICE vehicles. However, this adoption also drives up electricity demand. In NTB Province, electricity is predominantly produced from coal-fired power plants. On the other hand, electricity production must also accommodate rising consumption from the general population. The development of RE sources faces inherent limitations, both in terms of primary resource potential and relatively higher capital costs compared to coal-based plants. These trade-offs create a complex dynamic in determining future policy priorities.
Several scenarios are illustrated in Figure 7 to identify the required share of renewable energy that must be increased to maintain electricity supply without disruption. As shown in Table 5, the first scenario—BAU—reflects current conditions regarding EV adoption, fossil-based power generation, renewable energy development, and other related variables in NTB. Electricity supply is projected to grow 10%–20% annually from coal-fired plants and 15%–20% annually from renewable energy. Meanwhile, electricity consumption is expected to increase by 6.6% per year, compounded by additional demand from EV adoption, which ranges from 5% to 75%. The simulation indicates that electricity supply may face a shortfall starting in 2028, with deficits continuing to deepen in subsequent years.
The BAU scenario, depicted in Figure 8, results in a cumulative carbon emission of over 41 million tCO₂e by 2050 and a 56% reduction in fossil fuel consumption. However, this scenario is projected to be unsustainable due to electricity shortages. Consequently, new growth targets must be defined to ensure that multiple policy objectives can be achieved in a sustainable manner.
The Moderate Scenario is designed to address the shortcomings of the BAU scenario while still aiming to reduce fossil fuel use. EV ownership growth is limited to 4%–64% to allow for greater flexibility in expanding electricity supply. The electricity mix is targeted to grow 15%–32% annually, with coal-based power generation increasing by 10%–40% to guarantee supply stability. The simulation shows that the Moderate Scenario can save up to 25% of fossil fuel consumption, potentially eliminating up to 60% of fuel imports. However, this scenario still results in a cumulative carbon emission similar to BAU—approximately 49 million tCO₂e—thus failing to fully address emission concerns.
The Optimistic Scenario aims to completely eliminate fossil fuel imports. EV ownership growth is maintained at BAU levels—between 5% and 75%—resulting in a significant increase in electricity demand. Therefore, fossil-based electricity production must be raised to 15%–45%, while renewable electricity generation is maximized in the range of 30%–65%. Under this scenario, the fiscal burden of fossil fuel imports can be fully eliminated. However, it still does not resolve the issue of rising emissions from both transportation and electricity sectors. High EV adoption levels lead to increased fossil-based electricity production, which causes cumulative emissions to remain around 50 million tCO₂e. Additionally, the Optimistic Scenario faces substantial challenges, particularly in terms of primary energy availability and the large investment required.
5. Discussion
The main findings from the transition model simulation reveal that adopting electric vehicles (EVs) in Indonesia presents significant challenges in reducing dependency on imported fossil fuels, particularly if the goal is to eliminate fuel imports entirely. These results underscore that, while EV adoption is a critical step, it is not yet sufficient to significantly reduce carbon emissions. Nevertheless, EV adoption remains essential for enhancing national energy security and achieving fiscal savings.
These outcomes are consistent with the findings of Santos-Paulino and Thirlwall [14], particularly in the context of maintaining macroeconomic stability. However, achieving these targets will heavily depend on cross-sectoral policy alignment—especially across the transportation, energy, and fiscal sectors.
As illustrated in Figure 9, achieving sustainable energy and environmental outcomes through EV adoption requires a massive expansion of RE. Under both the BAU and Optimistic scenarios, EV deployment could increase electricity consumption by up to 600 million kWh. To ensure that EV-related emissions are entirely clean, RE generation would need to grow by 30%–65% annually, assuming sufficient resource potential and investment capacity. The current estimated investment cost for renewable infrastructure ranges from USD 0.9 to 5.5 million per megawatt (MW).
On the other hand, reducing emissions from the transportation sector through EV adoption does not automatically guarantee environmental improvement if it is not accompanied by decarbonization of the electricity sector. Both the Optimistic and Moderate scenarios indicate that, while fuel imports could be eliminated, carbon emissions may still rise due to electricity demand for EVs being met largely by coal-fired power plants. This finding supports the argument made by Canals Casals et al. [7], which emphasizes that the environmental efficiency of EVs is highly dependent on the electricity mix. Therefore, EV adoption strategies must be pursued in parallel with accelerated development of renewable electricity generation, particularly in regions with significant potential such as NTB Province.
In the search for an optimal baseline, the Moderate Scenario offers a more realistic solution. Although EV adoption proceeds more slowly, the scenario still has the potential to reduce fuel import dependency by up to 60%, while supporting annual RE growth of 15%–32%. In contrast, the Optimistic Scenario aims for a 65% annual increase in RE capacity to meet the entire electricity demand from EVs. These findings align with the conclusions of Onat et al. [28], who argue that the integration of EVs and renewable energy presents the most effective pathway to achieving NZE targets. However, the greatest challenge in the Optimistic Scenario lies in the high investment required for renewable infrastructure—estimated at up to USD 5.5 million per MW.
These results demonstrate that energy and transportation transitions must be integrated to achieve sustainability. The success of EV adoption in reducing emissions and decreasing dependence on fuel imports is highly dependent on structural interventions in the national energy system. Therefore, a multi-level governance approach is needed, combining fiscal incentives (e.g., EV subsidies, tax incentives), energy policies (e.g., promoting renewable energy integration), and transportation regulations (e.g., emission standards, ICE restrictions). Without such a systemic approach, the potential of EVs as a sustainability solution may become a false solution—merely shifting emissions from the roads to the power plants.
6. Conclusions
This study demonstrates that the adoption of EV in Indonesia has a significant impact on reducing dependency on imported fossil fuels, while also lowering emissions from petroleum-based fuels. However, this does not automatically lead to a reduction in overall carbon emissions. The continued reliance on coal-fired electricity for EVs remains a major barrier to emission reduction. Through a SD approach and the utilization of data from Google EIE, the simulation model developed in this study successfully maps the complex relationships between vehicle growth, energy demand, and carbon emission dynamics. The results show that the elimination of fuel imports can be achieved once ICE-based vehicle travel is reduced by approximately 42%, which is projected to occur by 2040 under the Optimistic Scenario.
NTB Province must anticipate the medium- and long-term surge in EV growth. The BAU scenario suggests that NTB will face prolonged electricity supply deficits if it fails to expand power generation capacity—both conventional and renewable. It is therefore critical that the government adopts a systemic and cross-sectoral policy approach. This includes developing an integrated roadmap for EV adoption, aligned with renewable energy development plans, ICE vehicle restrictions, and fiscal and infrastructure policy reforms. Without comprehensive policy integration, EV adoption risks becoming a false solution that merely shifts emissions from vehicles to power plants.
Looking forward, this research can be further enhanced by incorporating ABM to capture the micro-level behavioral dynamics of vehicle users, as well as spatial data analysis to examine regional disparities in impacts. Additionally, integrating variables related to public transportation use and social dimensions—such as consumer preferences, technological gaps, and energy justice—would enrich the analysis of sustainable transport transition policies in Indonesia. Finally, this study recommends the broader use of Google EIE, which provides granular data for analyzing transportation behaviors and emissions with greater precision.
Conflicts of Interest
The authors declare no conflicts of interest.
References
- Bappenas. Peta Jalan SDGs Indonesia Menuju 2030. 2021.
- Bappenas. LAPORAN PELAKSANAAN PENCAPAIAN TUJUAN PEMBANGUNAN BERKELANJUTAN/SUSTAINABLE DEVELOPMENT GOALS (TPB/SDGs) TAHUN 2023. 2023.
- Banister, D. Sustainable urban development and transport -a Eurovision for 2020. Transport Reviews 2000, 20, 113–130. [Google Scholar] [CrossRef]
- Banister, D. The sustainable mobility paradigm. Transport Policy 2008, 15, 73–80. [Google Scholar] [CrossRef]
- Gudmundsson, H.; Hall, R.P.; Marsden, G.; Zietsman, J. Sustainable transportation. Heidelberg, Ger. Frederiksberg, Denmark, Spreinger-Verlag Samf 2016.
- Ardiyanti, D.; Kurniawan, F.; Raokter, U.; Wikansari, R. Analisis Penjualan Mobil Listrik Di Indonesia Dalam Rentang Waktu 2020-2023. Journal of Economics and Management 2023, 1, 114–122. [Google Scholar] [CrossRef]
- Canals Casals, L.; Martinez-Laserna, E.; Amante García, B.; Nieto, N. Sustainability analysis of the electric vehicle use in Europe for CO2 emissions reduction. Journal of Cleaner Production 2016, 127, 425–437. [Google Scholar] [CrossRef]
- Atabani, A.E.; Badruddin, I.A.; Mekhilef, S.; Silitonga, A.S. A review on global fuel economy standards, labels and technologies in the transportation sector. Renewable and Sustainable Energy Reviews 2011, 15, 4586–4610. [Google Scholar] [CrossRef]
- Aziz, M.; Marcellino, Y.; Rizki, I.A.; Ikhwanuddin, S.A.; Simatupang, J.W. Studi analisis perkembangan teknologi dan dukungan pemerintah Indonesia terkait mobil listrik. 2020.
- IESR. Indonesia Energy Transition Outlook 2023, Tracking Progress of Energy Transition in Indonesia: Pursuing Energy Security in the Time of Transition; Institute for Essential Services Reform (IESR): Jakarta, 2022. [Google Scholar]
- PLN. Statistik PLN 2023; PT. PLN: Jakarta, 2024. [Google Scholar]
- Holmberg, K.; Erdemir, A. The impact of tribology on energy use and CO2 emission globally and in combustion engine and electric cars. Tribology International 2019, 135, 389–396. [Google Scholar] [CrossRef]
- ESDM, K. Ini Strategi Pemerintah Tekan Impor Migas. 2024.
- Santos-Paulino, A.; Thirlwall, A.P. The Impact of Trade Liberalisation on Exports, Imports and the Balance of payments of Developing Countries. The Economic Journal 2004, 114, F50–F72. [Google Scholar] [CrossRef]
- Indonesia, R.o. ENHANCED NATIONALLY DETERMINED CONTRIBUTION REPUBLIC OF INDONESIA; 2022.
- Edwaren, L. Dampak Peralihan Massal Transportasi Jalan Raya Ke Mobil Listrik. Jurnal Pengembangan Energi Nuklir 2017, 19, 113–122. [Google Scholar] [CrossRef]
- Arioli, M.S.; D'Agosto, M.d.A.; Amaral, F.G.; Cybis, H.B.B. The evolution of city-scale GHG emissions inventory methods: A systematic review. Environmental Impact Assessment Review 2020, 80, 106316. [Google Scholar] [CrossRef]
- Magazzino, C.; Costantiello, A.; Laureti, L.; Leogrande, A.; Gattone, T. Greenhouse gas emissions and road infrastructure in Europe: A machine learning analysis. Transportation Research Part D: Transport and Environment 2025, 139, 104602. [Google Scholar] [CrossRef]
- Google. Environmental Insights Explorer. Available online: https://insights.sustainability.google/?hl=en-US (accessed on.
- Earth, G. Accelerating city climate action with high resolution geospatial data. Available online: https://medium.com/google-earth/accelerating-city-climate-action-with-high-resolution-geospatial-data-f7b489c9e9f6 (accessed on.
- Meadows, D.H. Thinking in Systems; Wright, D. (Eds.) ; Earthscan: UK, 2009.
- Forrester, J.W. Industrial Dynamics; M.I.T. Press: 1961.
- Kirkwood, C.W. System Dynamics Methods: A Quick Introduction; College of Business Arizona State University: 1998.
- Sterman, J. Business Dynamics: Systems Thinking and Modeling for a Complex World; Irwin/McGraw-Hill: 2000.
- Scholl, H.J. Agent-based and system dynamics modeling: A call for cross study and joint research. In Proceedings of the Proceedings of the 34th Annual Hawaii International Conference on System Sciences, 6-6 Jan.
- Coyle, G. Qualitative and quantitative modelling in system dynamics: Some research questions. System Dynamics Review 2000, 16, 225–244. [Google Scholar] [CrossRef]
- Bureš, V. A Method for Simplification of Complex Group Causal Loop Diagrams Based on Endogenisation, Encapsulation and Order-Oriented Reduction. Systems 2017, 5, 46. [Google Scholar] [CrossRef]
- Onat, N.C.; Kucukvar, M.; Tatari, O.; Egilmez, G. Integration of system dynamics approach toward deepening and broadening the life cycle sustainability assessment framework: A case for electric vehicles. The International Journal of Life Cycle Assessment 2016, 21, 1009–1034. [Google Scholar] [CrossRef]
- Sayyadi, R.; Awasthi, A. An integrated approach based on system dynamics and ANP for evaluating sustainable transportation policies. International Journal of Systems Science: Operations & Logistics 2020, 7, 182–191. [Google Scholar] [CrossRef]
- Wetwitoo, J.; Kato, H. Inter-regional transportation and economic productivity: A case study of regional agglomeration economies in Japan. The Annals of Regional Science 2017, 59, 321–344. [Google Scholar] [CrossRef]
- Kutty, A.A.; Yetiskin, Z.; Abraham, M.M.; Nooh, M.A.; Kucukvar, M.; Abdella, G.M. An empirical assessment on the transportation sustainability indicators and their impact on economic productivity. In Proceedings of the Proceedings of the 5th NA Conference on Industrial Engineering and Operations Management, 2020.
- Fankhauser, S. ; S. J. Tol, R. On climate change and economic growth. Resource and Energy Economics 2005, 27, 1–17. [Google Scholar]
- Intergovernmental Panel on Climate, C. Global Warming of 1.5°C: IPCC Special Report on Impacts of Global Warming of 1.5°C above Pre-industrial Levels in Context of Strengthening Response to Climate Change, Sustainable Development, and Efforts to Eradicate Poverty; Cambridge University Press: Cambridge, 2022. [Google Scholar]
- Masters, W.A.; McMillan, M.S. Climate and Scale in Economic Growth. Journal of Economic Growth 2001, 6, 167–186. [Google Scholar] [CrossRef]
- Lelieveld, J.; Klingmüller, K.; Pozzer, A.; Burnett, R.T.; Haines, A.; Ramanathan, V. Effects of fossil fuel and total anthropogenic emission removal on public health and climate. Proceedings of the National Academy of Sciences 2019, 116, 7192–7197. [Google Scholar] [CrossRef]
- James Woodcock, P.E. , Cathryn Tonne,Ben G Armstrong,Olu Ashiru,David Banister,Sean Beevers,Zaid Chalabi,Zohir Chowdhury,Aaron Cohen,Oscar H Franco,Andy Haines,Robin Hickman,Graeme Lindsay,Ishaan Mittal,Dinesh Mohan,Geetam Tiwari et al. Public health benefits of strategies to reduce greenhouse-gas emissions: Urban land transport. The Lancet 2009, 374, P1930–P1943. [Google Scholar]
- Lonan, E.S.; Ardi, R. Electric Vehicle Diffusion in the Indonesian Automobile Market: A System Dynamics Modelling. In Proceedings of the 2020 IEEE International Conference on Industrial Engineering and Engineering Management (IEEM), 2020, 14-17 Dec. 2020; pp. 43–47. [Google Scholar]
- Gaikindo. Jumlah Kendaraan di Indonesia 147 Juta Unit, 60 Persen di Pulau Jawa. 2023.
- Gaikindo. Bagaimana Tren Penjualan Mobil di Indonesia pada 2025? 2025.
- Rizky, L.; Pratiwi, T.S.; Wibawa, A.; Achdiyana, I. Peran Negara G20 dalam Percepatan Transisi Energi Baru Terbarukan (EBT) untuk Mewujudkan Ketahanan Energi Nasional. 2024 2024, 29. [Google Scholar] [CrossRef]
- IPCC. Stationary Combustion; IPCC: 2006.
- Li, J.; Wu, X.; Xu, M.; Liu, Y. A real-time optimization energy management of range extended electric vehicles for battery lifetime and energy consumption. Journal of Power Sources 2021, 498, 229939. [Google Scholar] [CrossRef]
- EIE, G. West Nusa Tenggara, Transportation emissions. Available online: https://insights.sustainability.google/places/ChIJIe0SGpQNuC0RxXX30MzCZ2k/transportation?hl=en-US (accessed on.
- BPS. Pertumbuhan Ekonomi Nusa Tenggara Barat Triwulan IV-2023; BPS: Mataram, 2024. [Google Scholar]
- ESDM, D. Laporan Kinerja Instansi Pemerintah; Dinas ESDM Nusa Tenggara Barat: Mataram, 2023. [Google Scholar]
- ESDM, K. Konferensi Pers Capaian 2023, Konsumsi Listrik Per Kapita Lebihi Target. Konferensi Pers Capaian 2023, Konsumsi Listrik Per Kapita Lebihi Target 2024.
- NTB, P.P. Rencana Umum Ketenagalistrikan Daerah Provinsi Nusa Tenggara Barat, Tahun 2015 - 2034. 2016.
- Rajah, J.K.; Kopainsky, B. A systematic method to integrate co-produced causal loop diagrams based on feedback stories. System Dynamics Review 2025, 41, e1794. [Google Scholar] [CrossRef]
- Stave, K. Participatory System Dynamics Modeling for Sustainable Environmental Management: Observations from Four Cases. Sustainability 2010, 2, 2762–2784. [Google Scholar] [CrossRef]
- Huberman, M.B.M.a.A.M. Qualitative Data Analysis: An Expanded Sourcebook; SAGE Publications: United States of America, 1994; Volume 3. [Google Scholar]
- Jakarta, D.P.D. Inventarisasi Profil Emisi dan Pelaporan Penurunan Emisi Gas Rumah Kaca Provinsi DKI Jakarta; Dinas Lingkungan Hidup Provinsi DKI Jakarta: Jakarta, 2023. [Google Scholar]
Figure 1.
Google EIE's emissions inventory method uses a bottom-up concept.
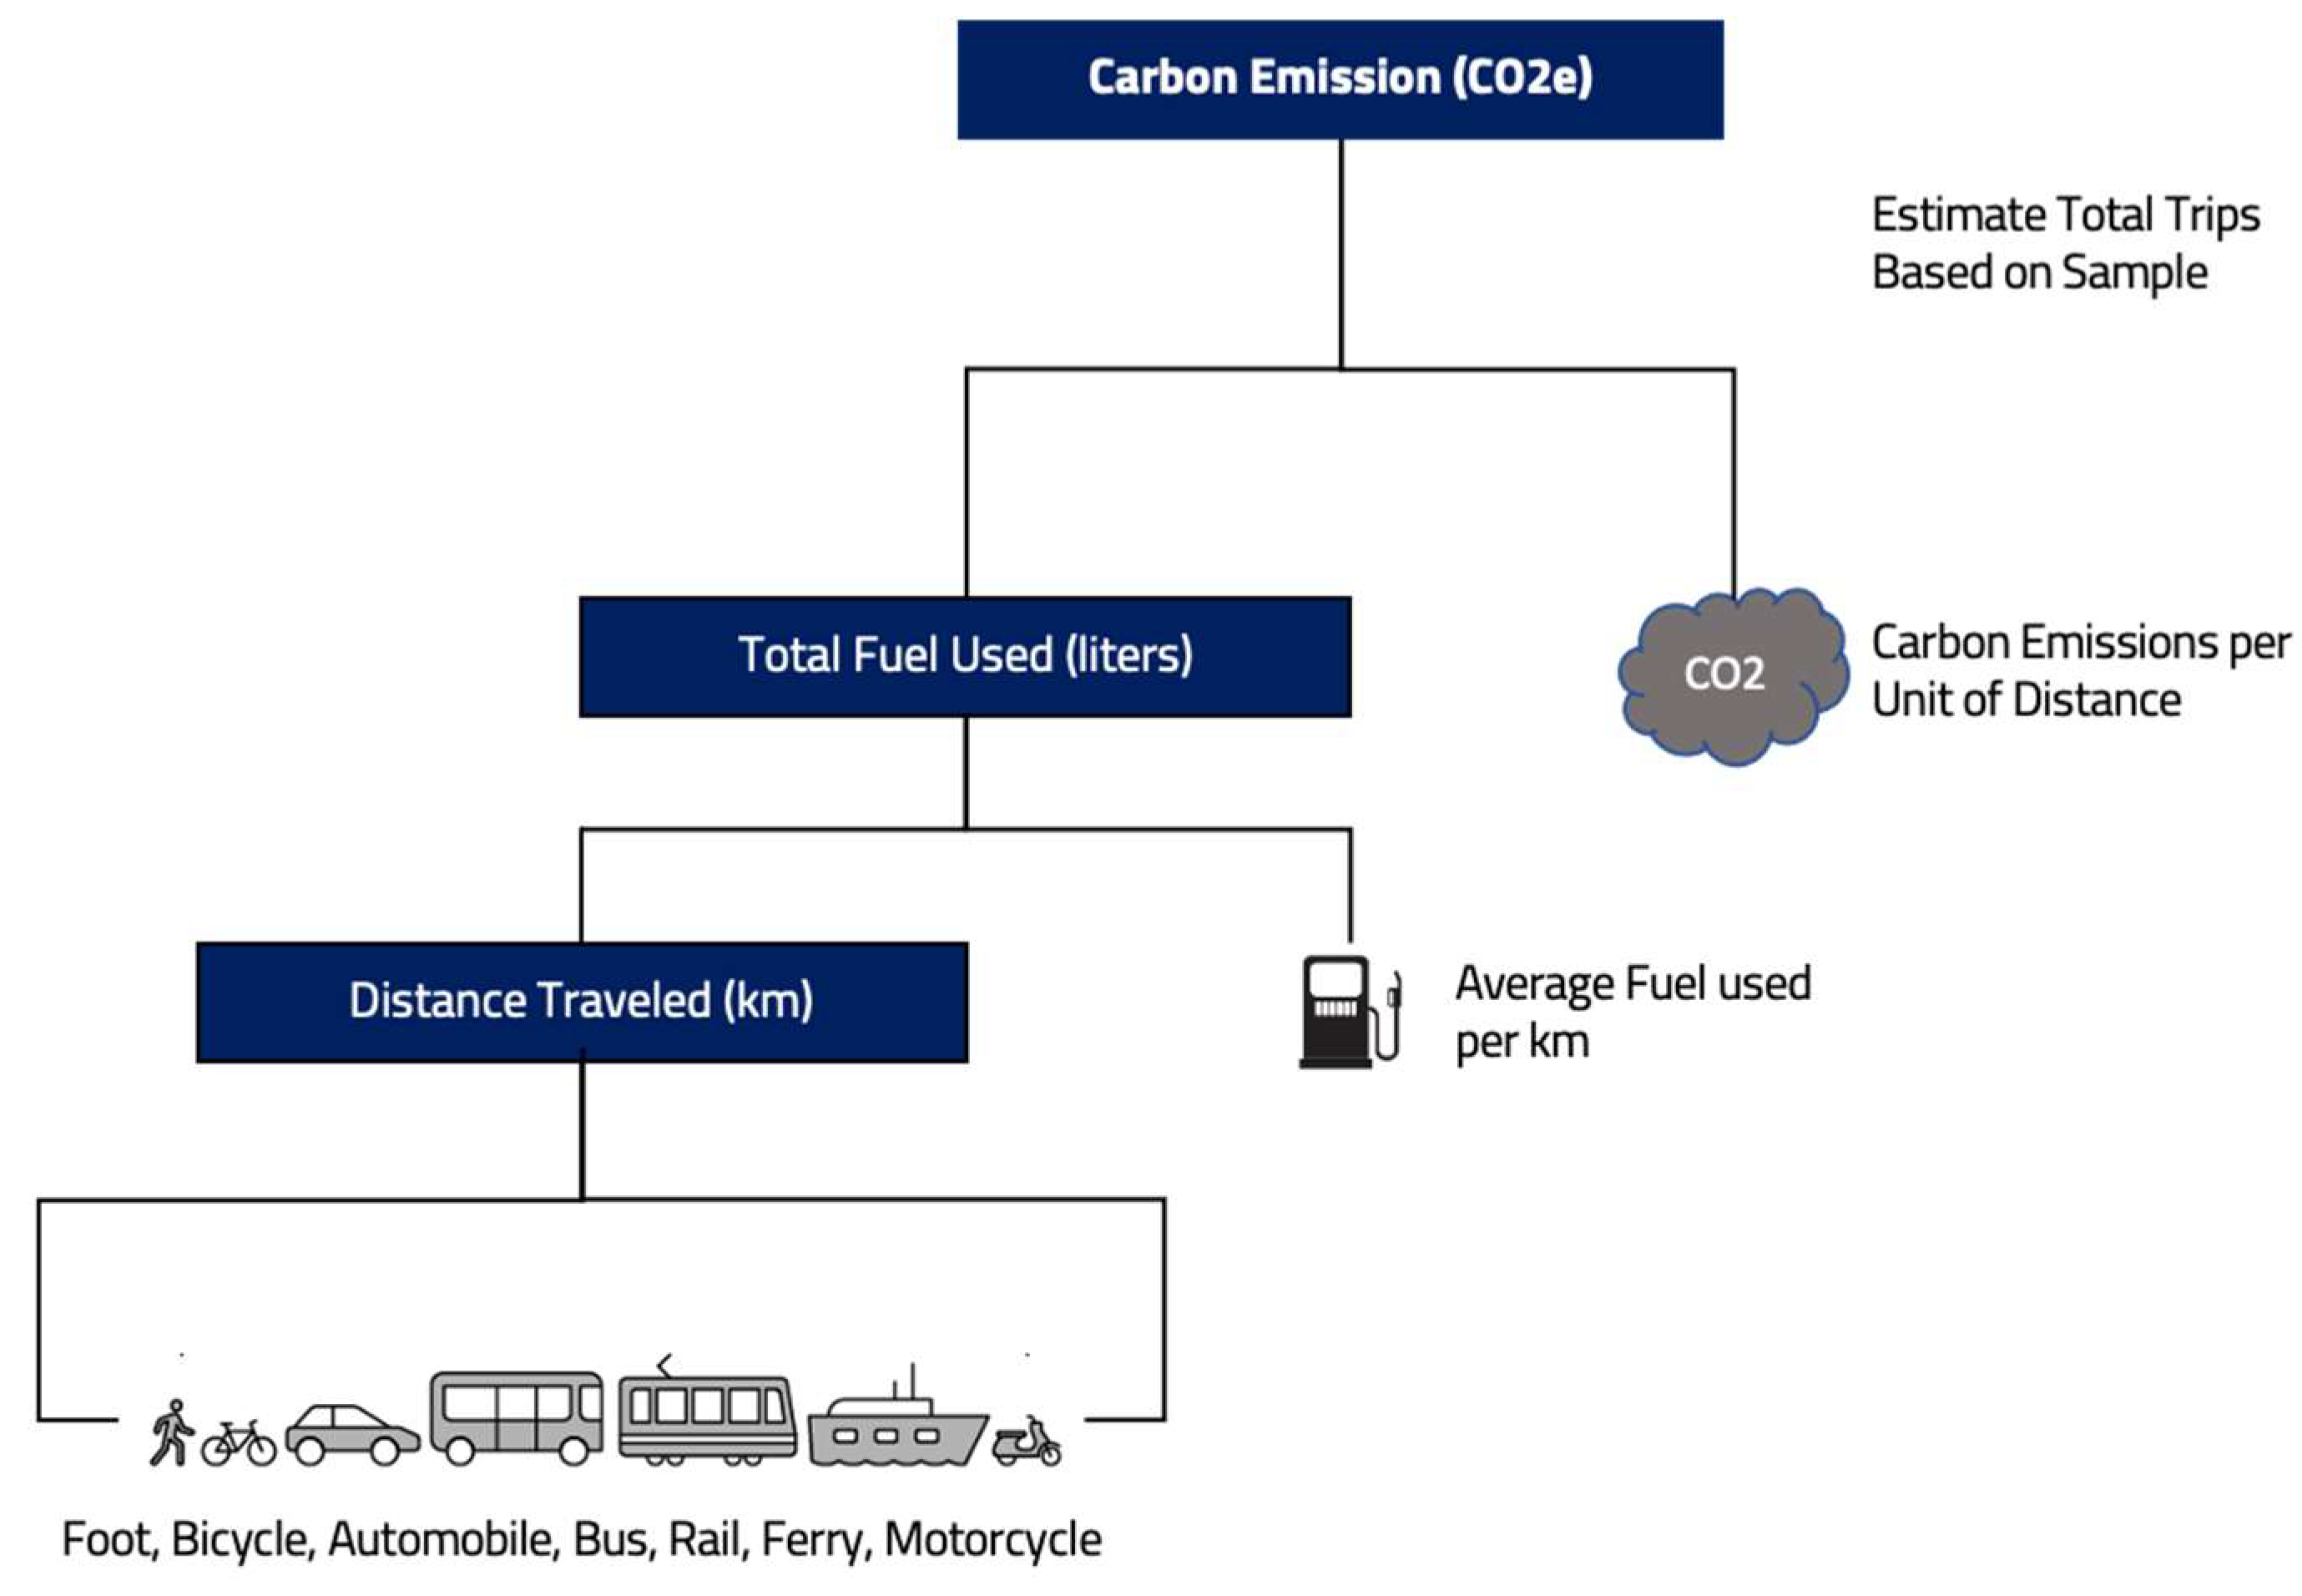
Figure 2.
The KLHK emission inventory method uses a top-down concept.
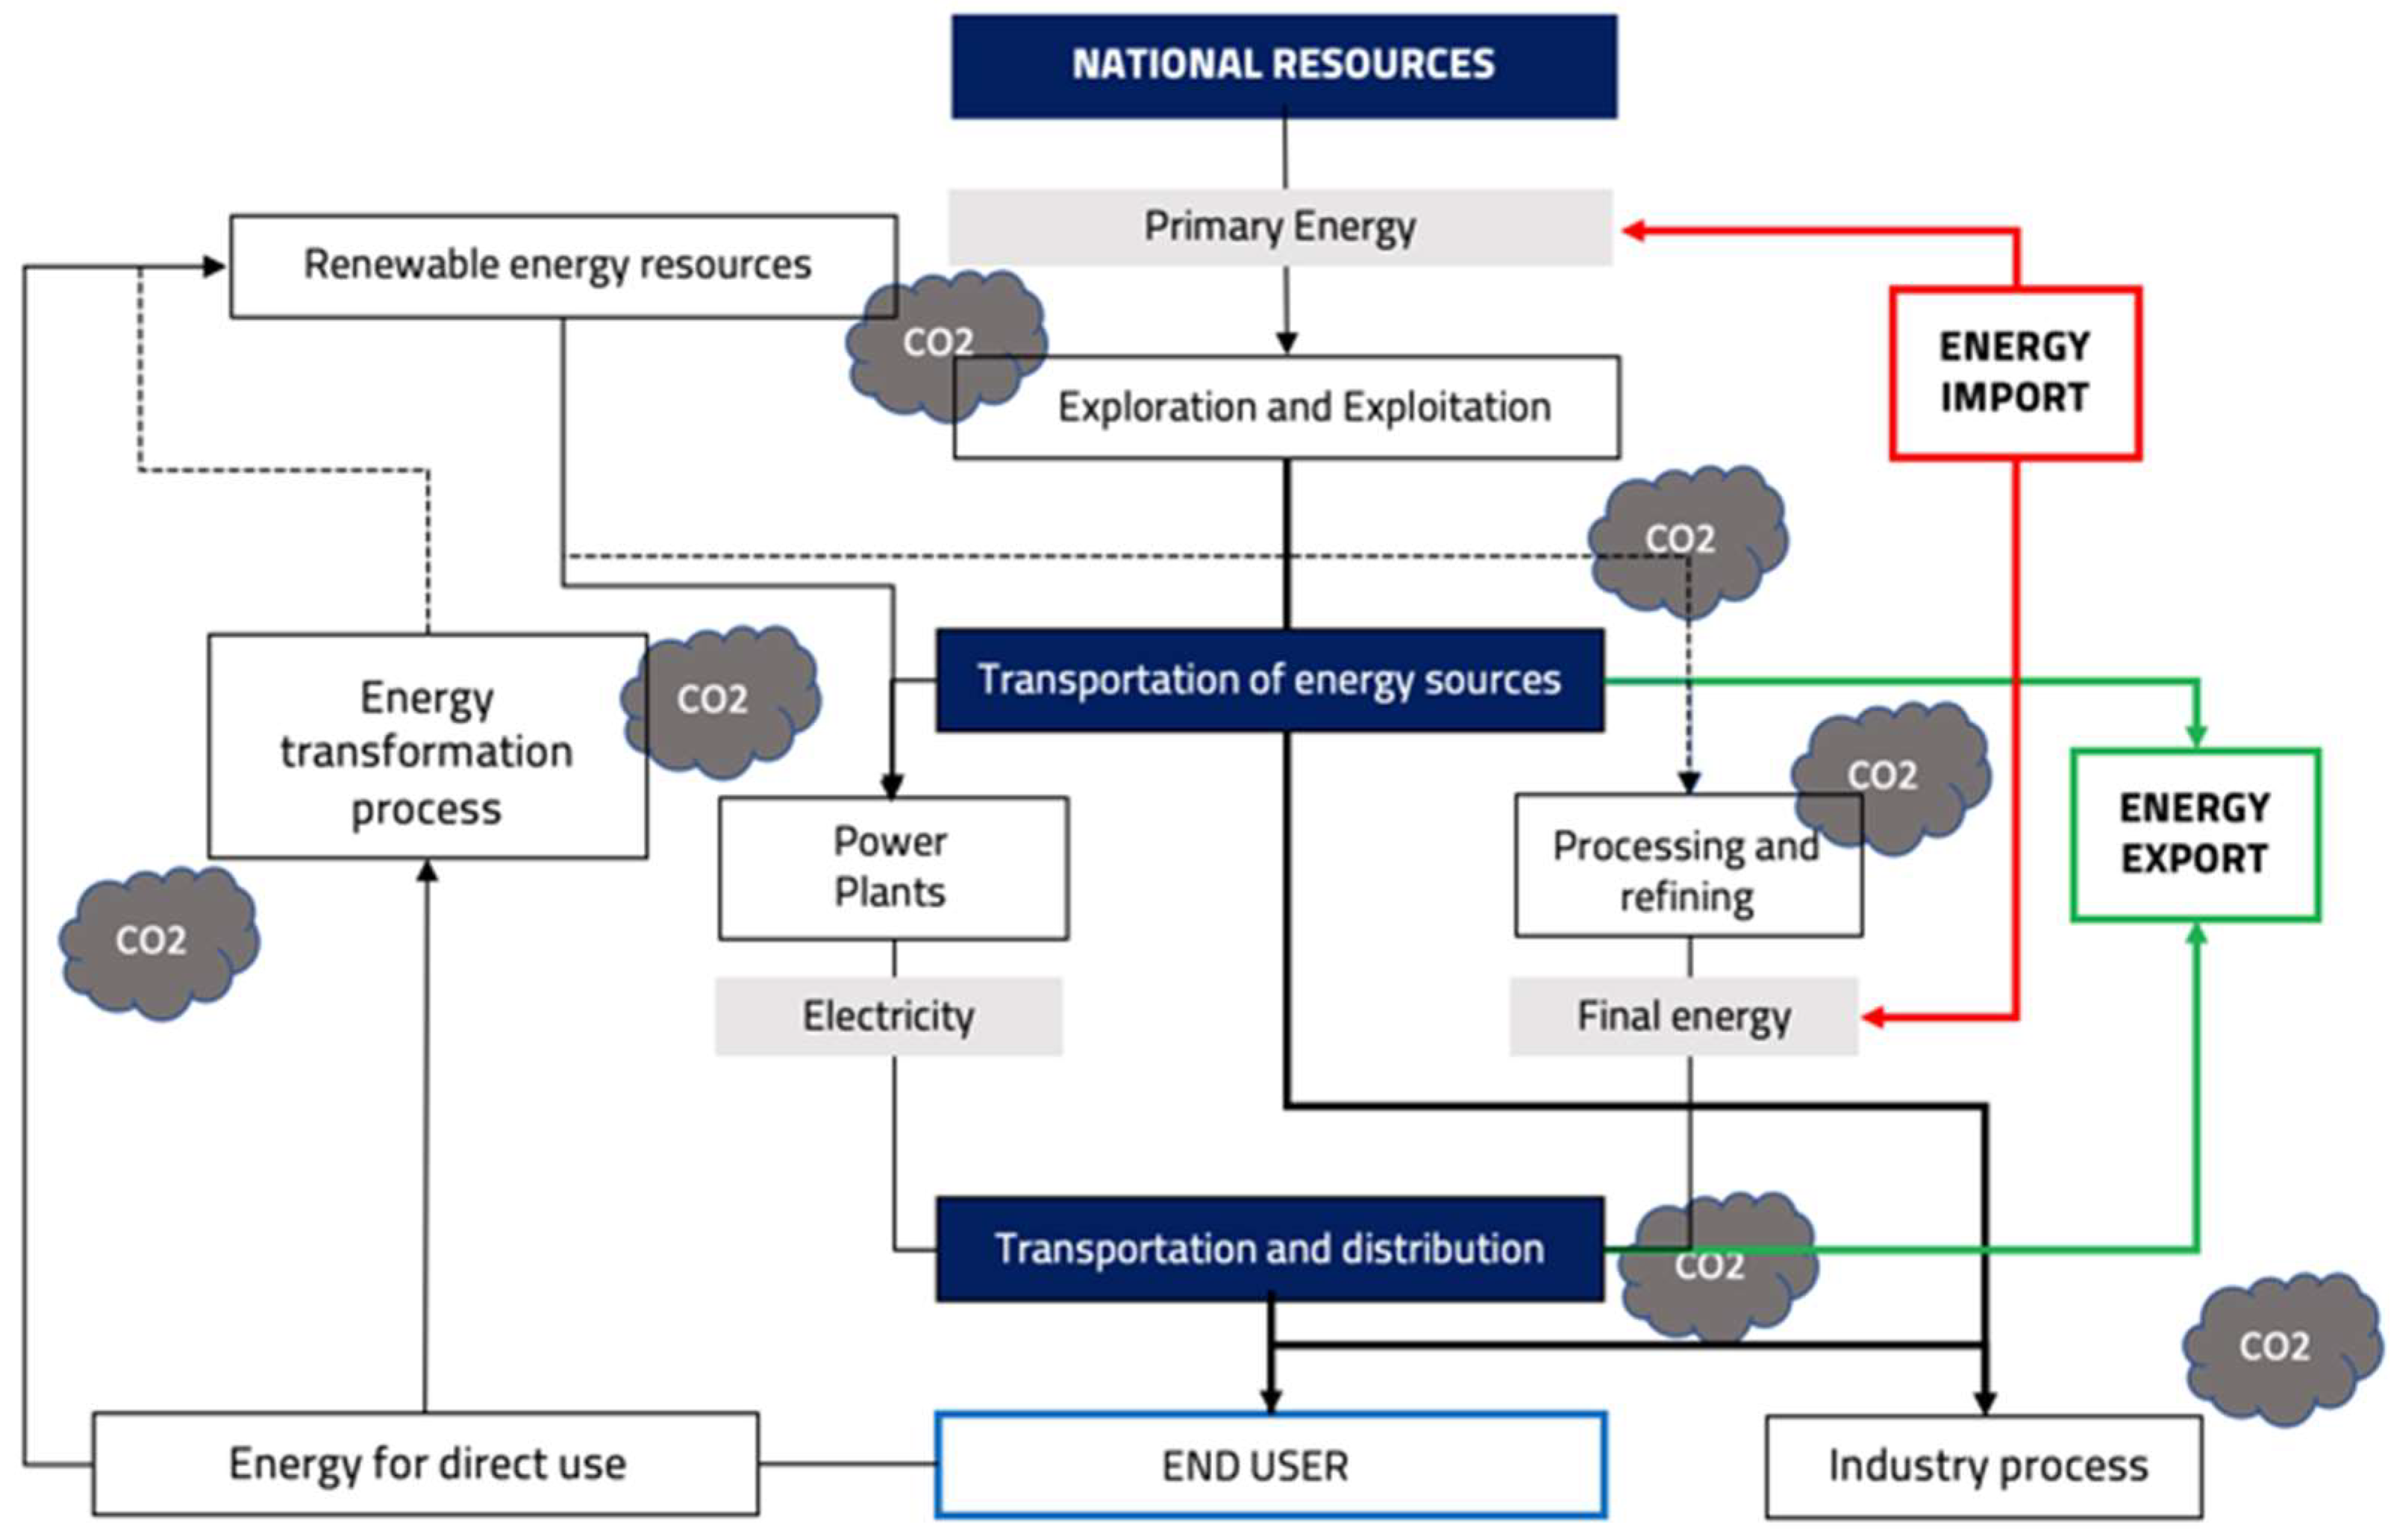
Figure 3.
Transportation Drive Subsystem.
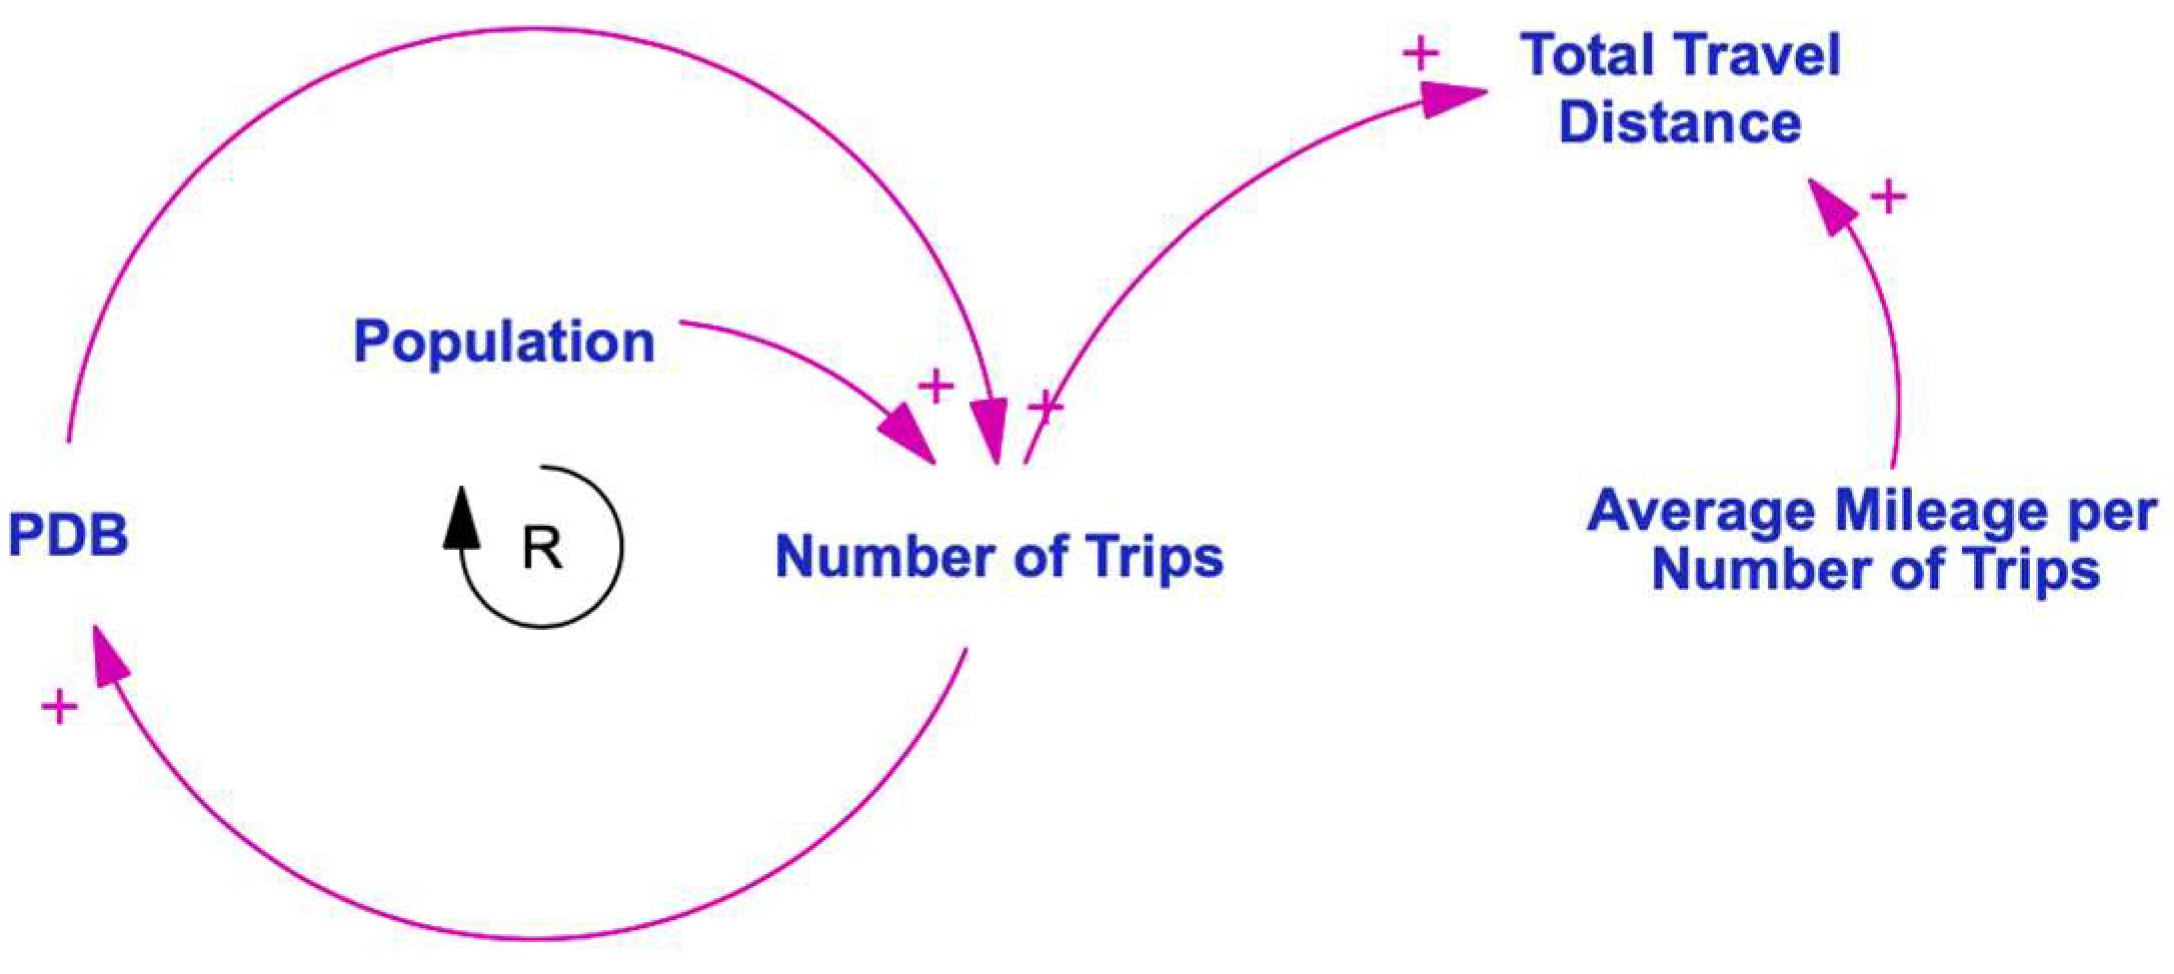
Figure 4.
EV transportation mode model structure.
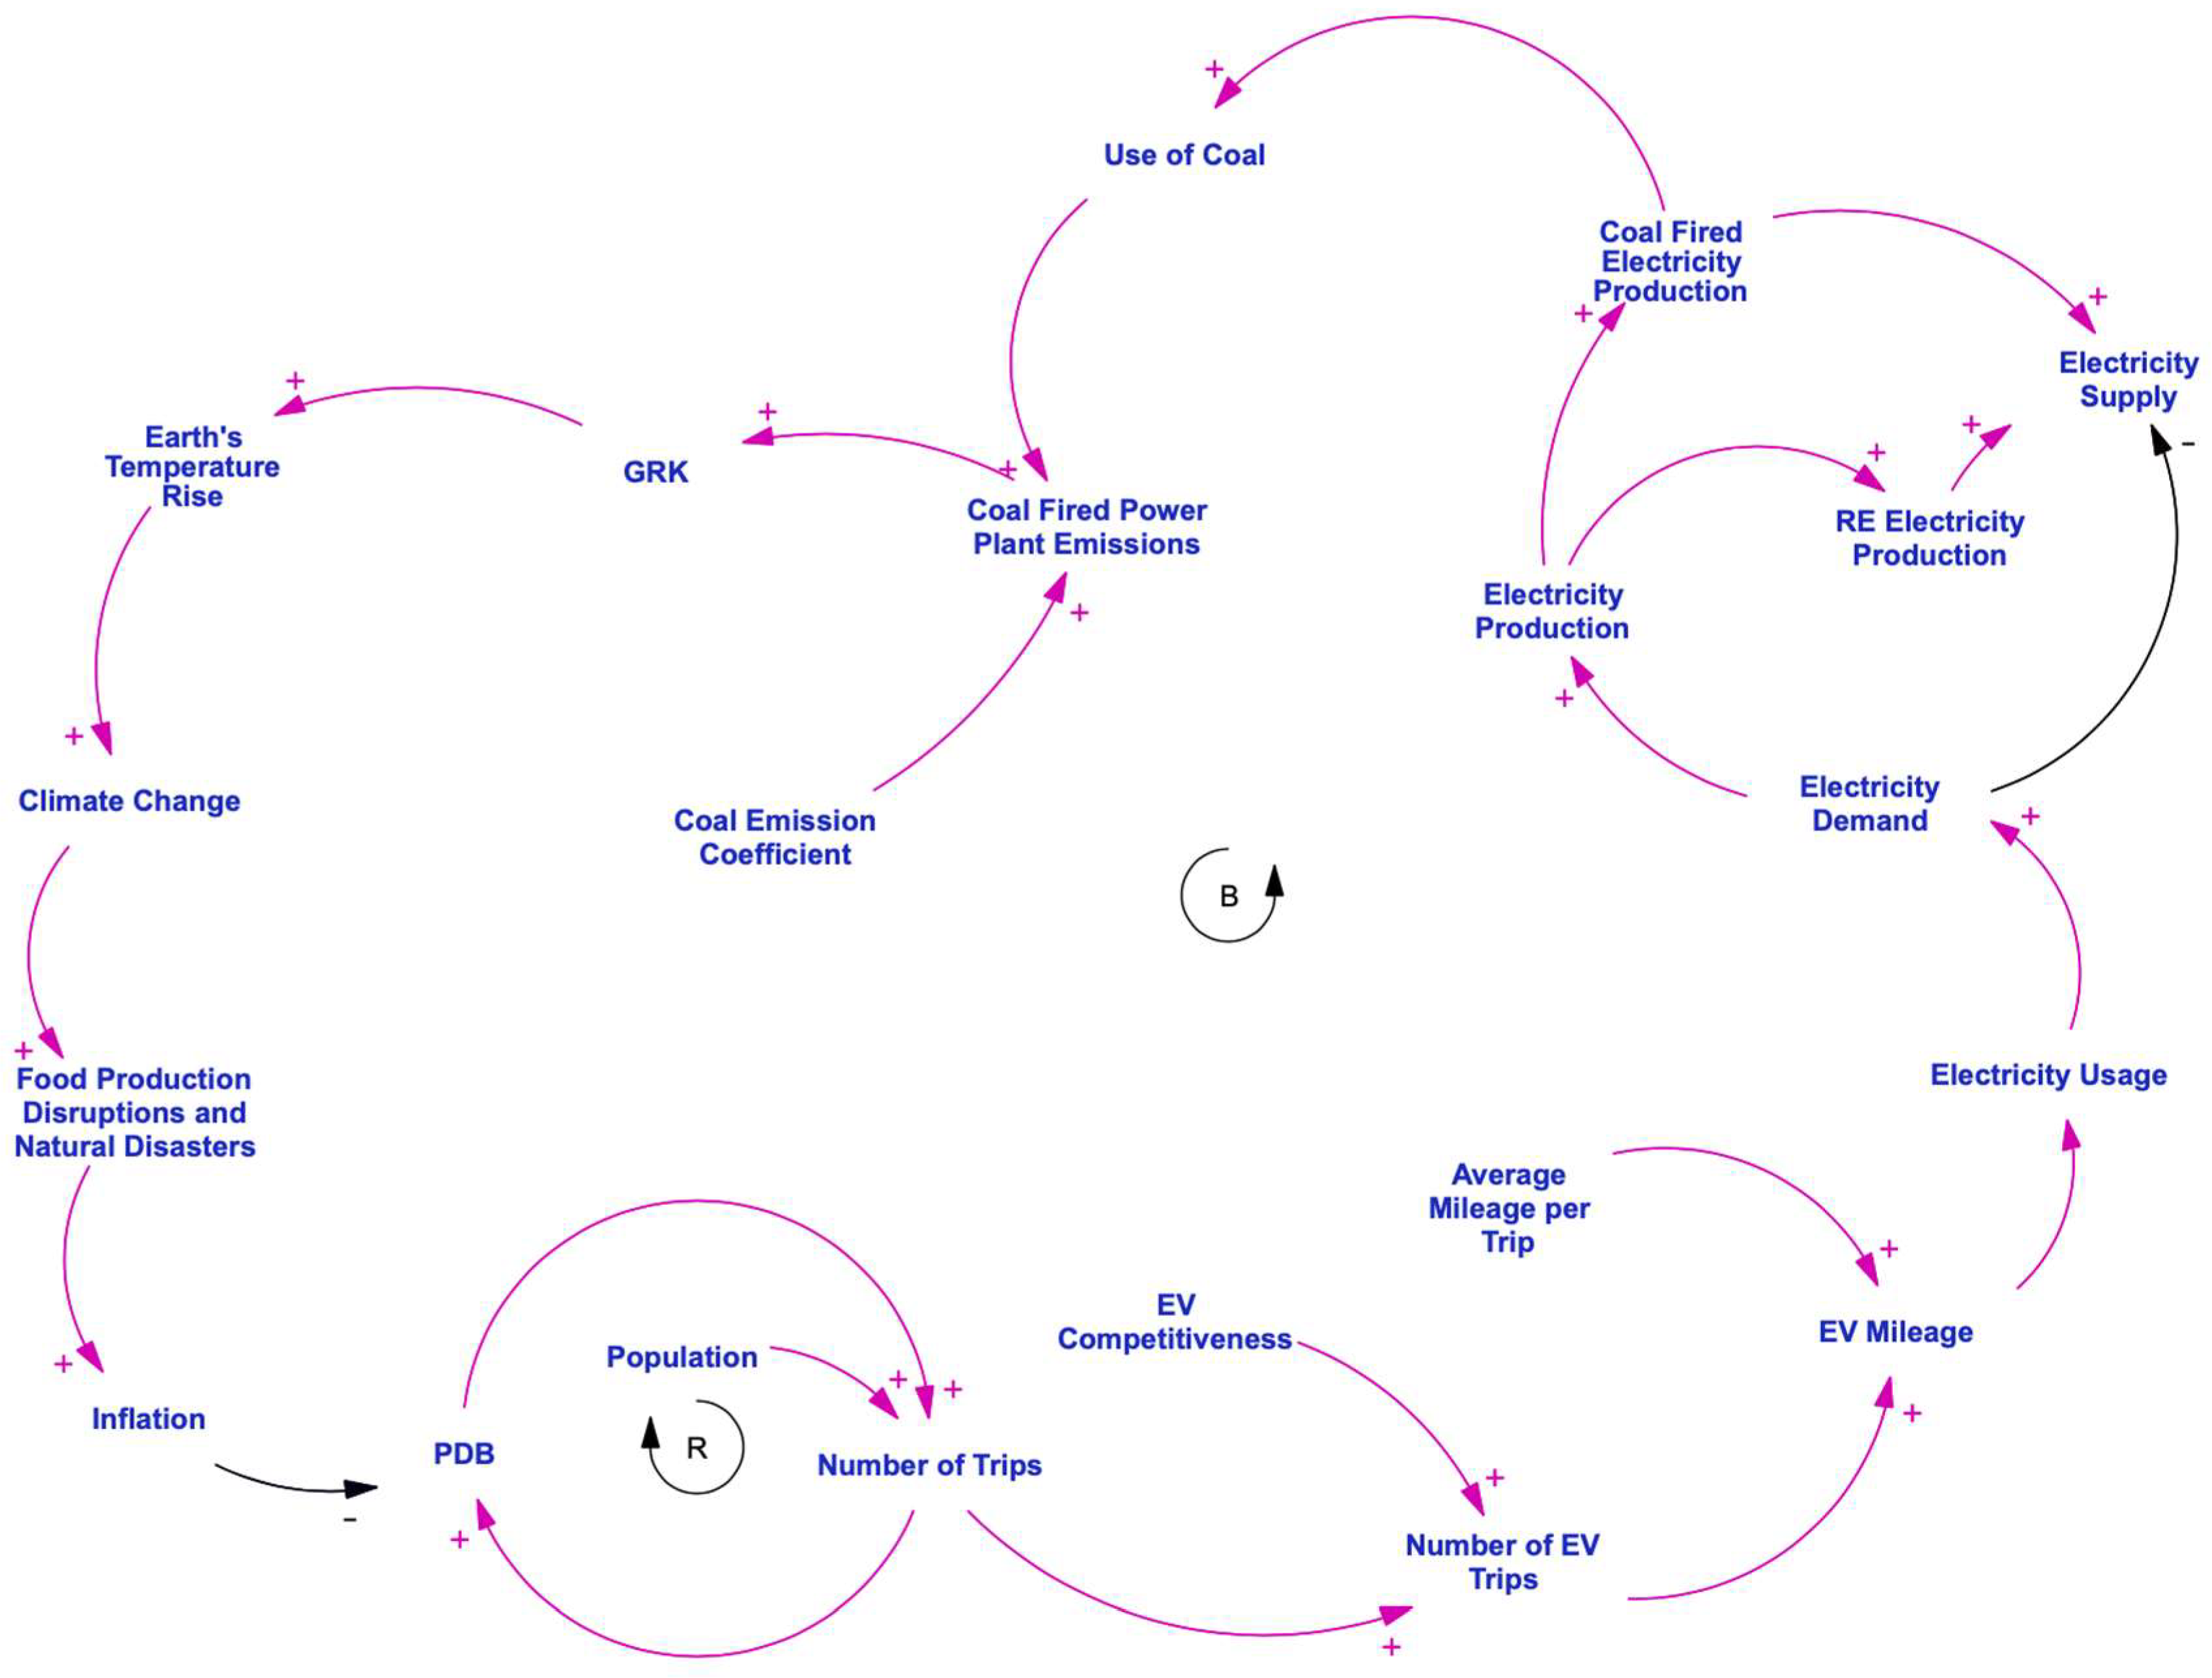
Figure 5.
ICE transport mode model structure.
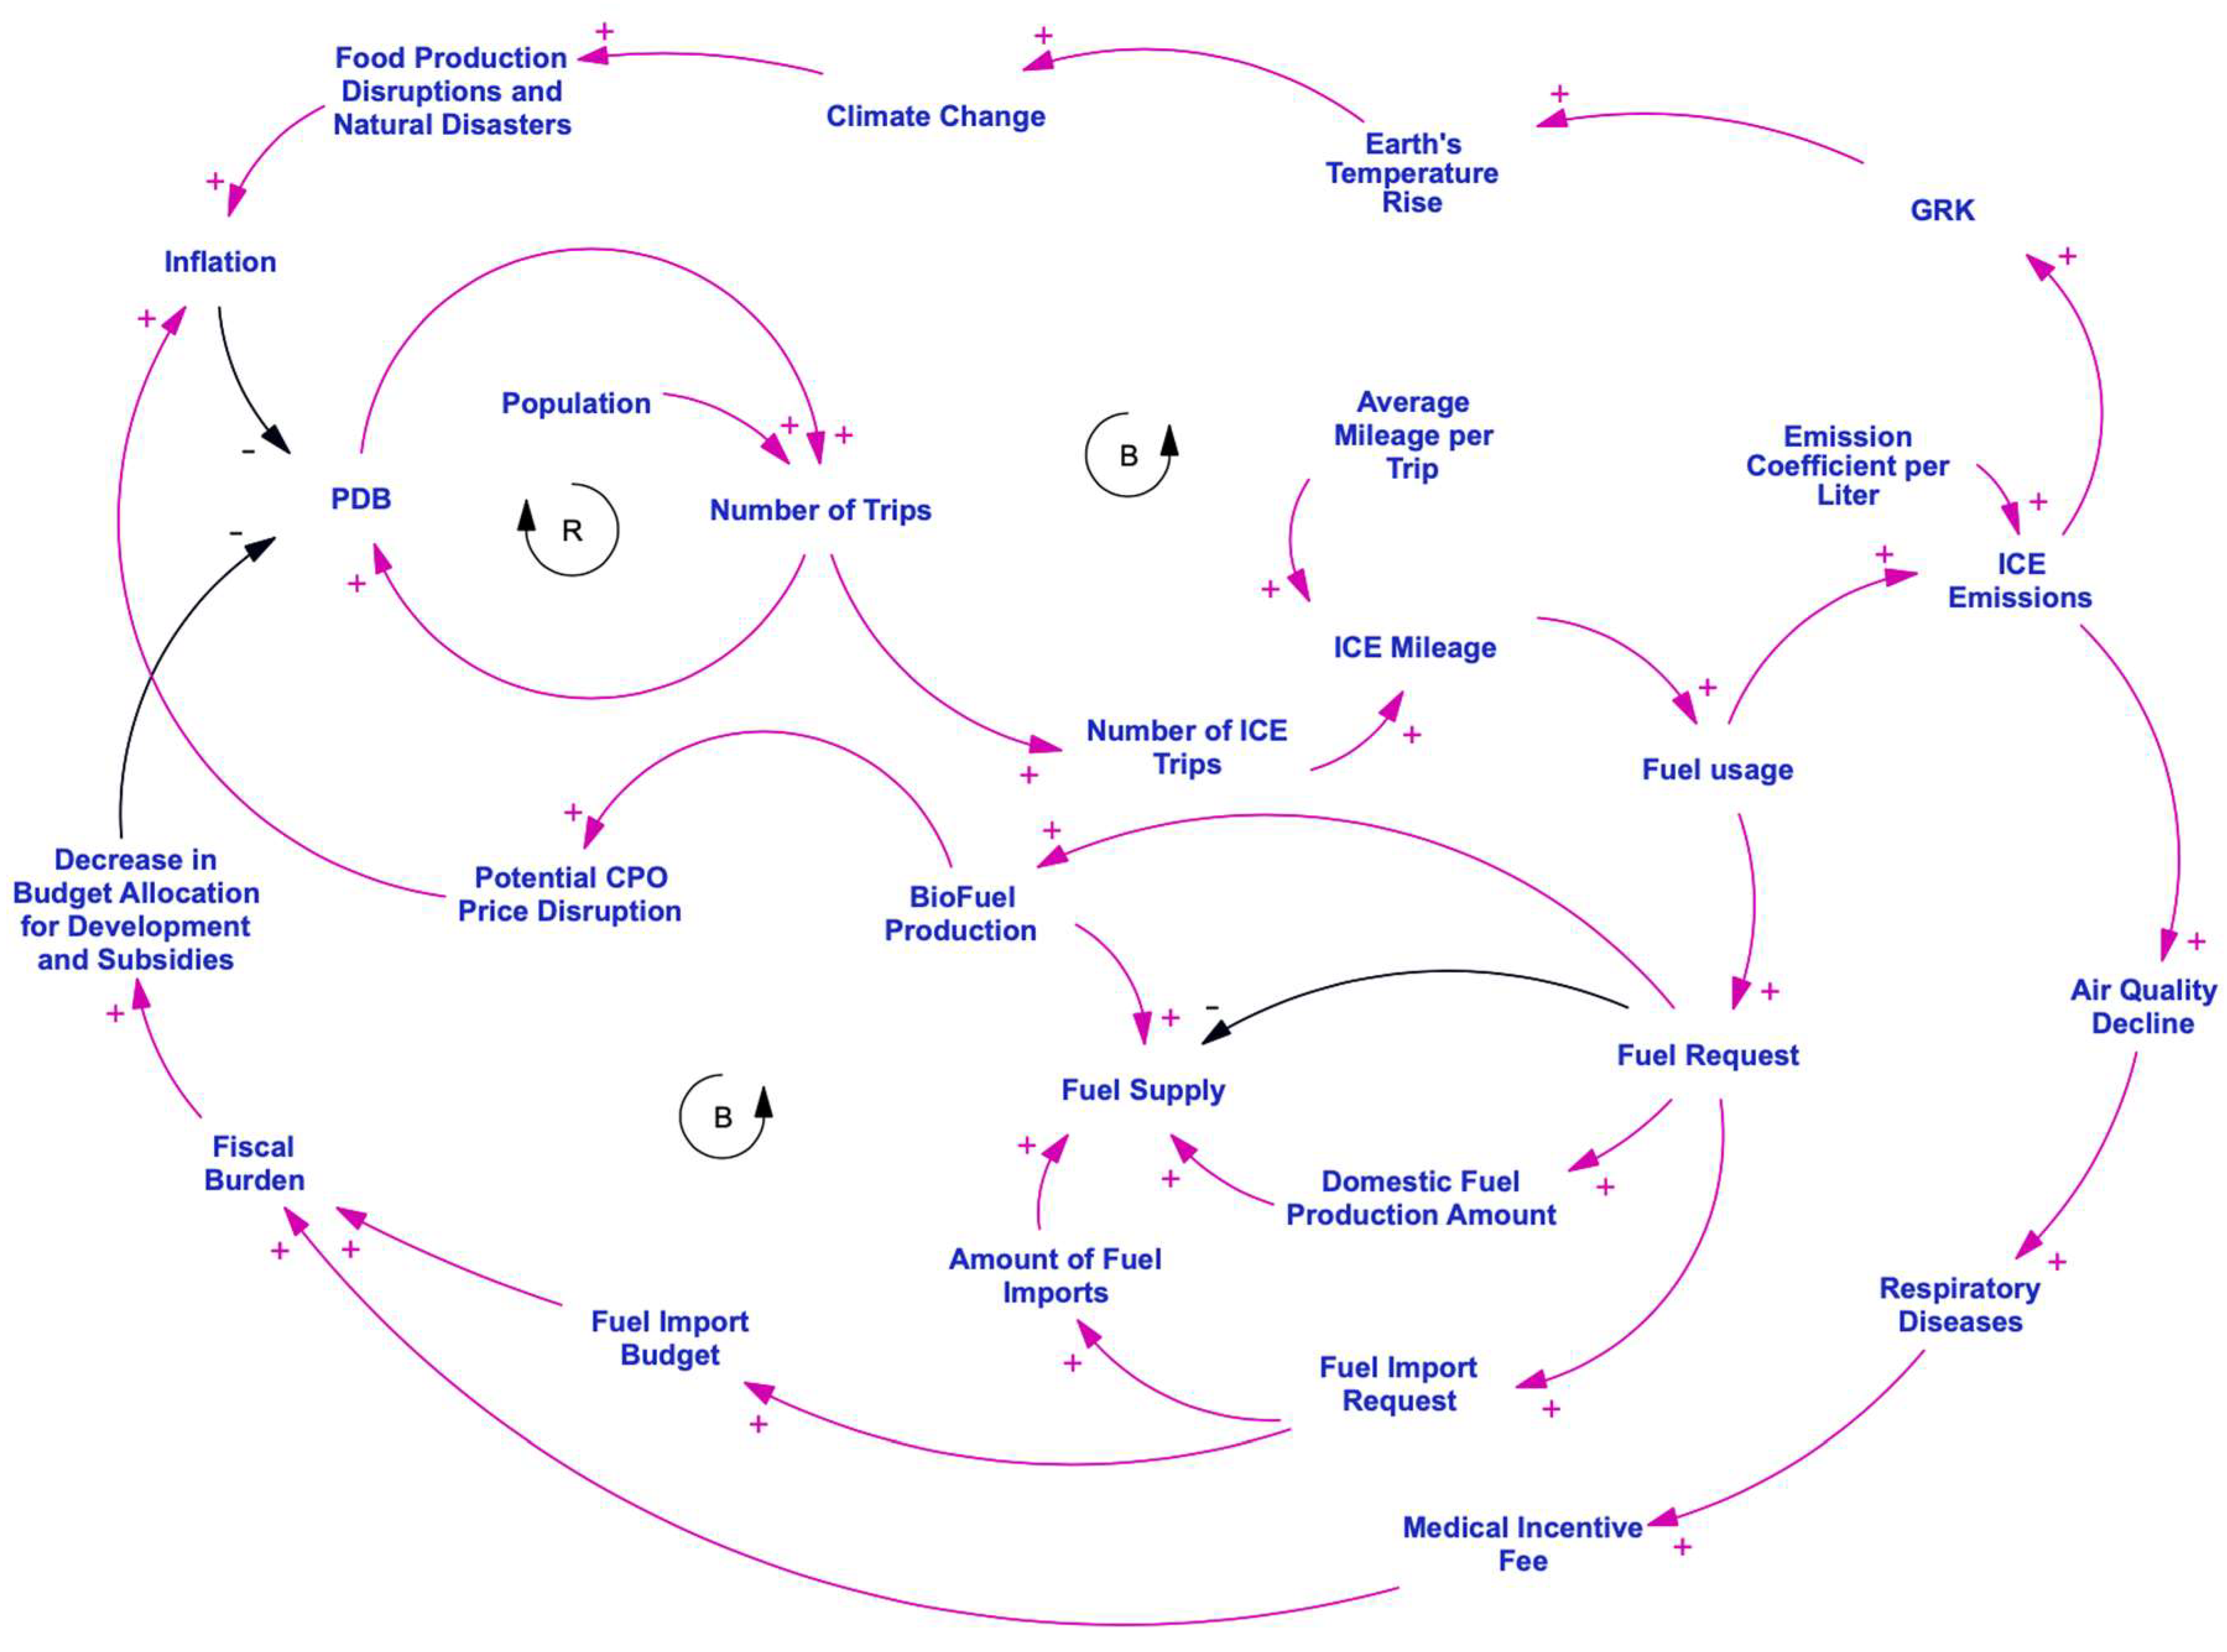
Figure 6.
The integration of EV and ICE systems shows the systemic loop from energy consumption to GHG impacts.
Figure 6.
The integration of EV and ICE systems shows the systemic loop from energy consumption to GHG impacts.
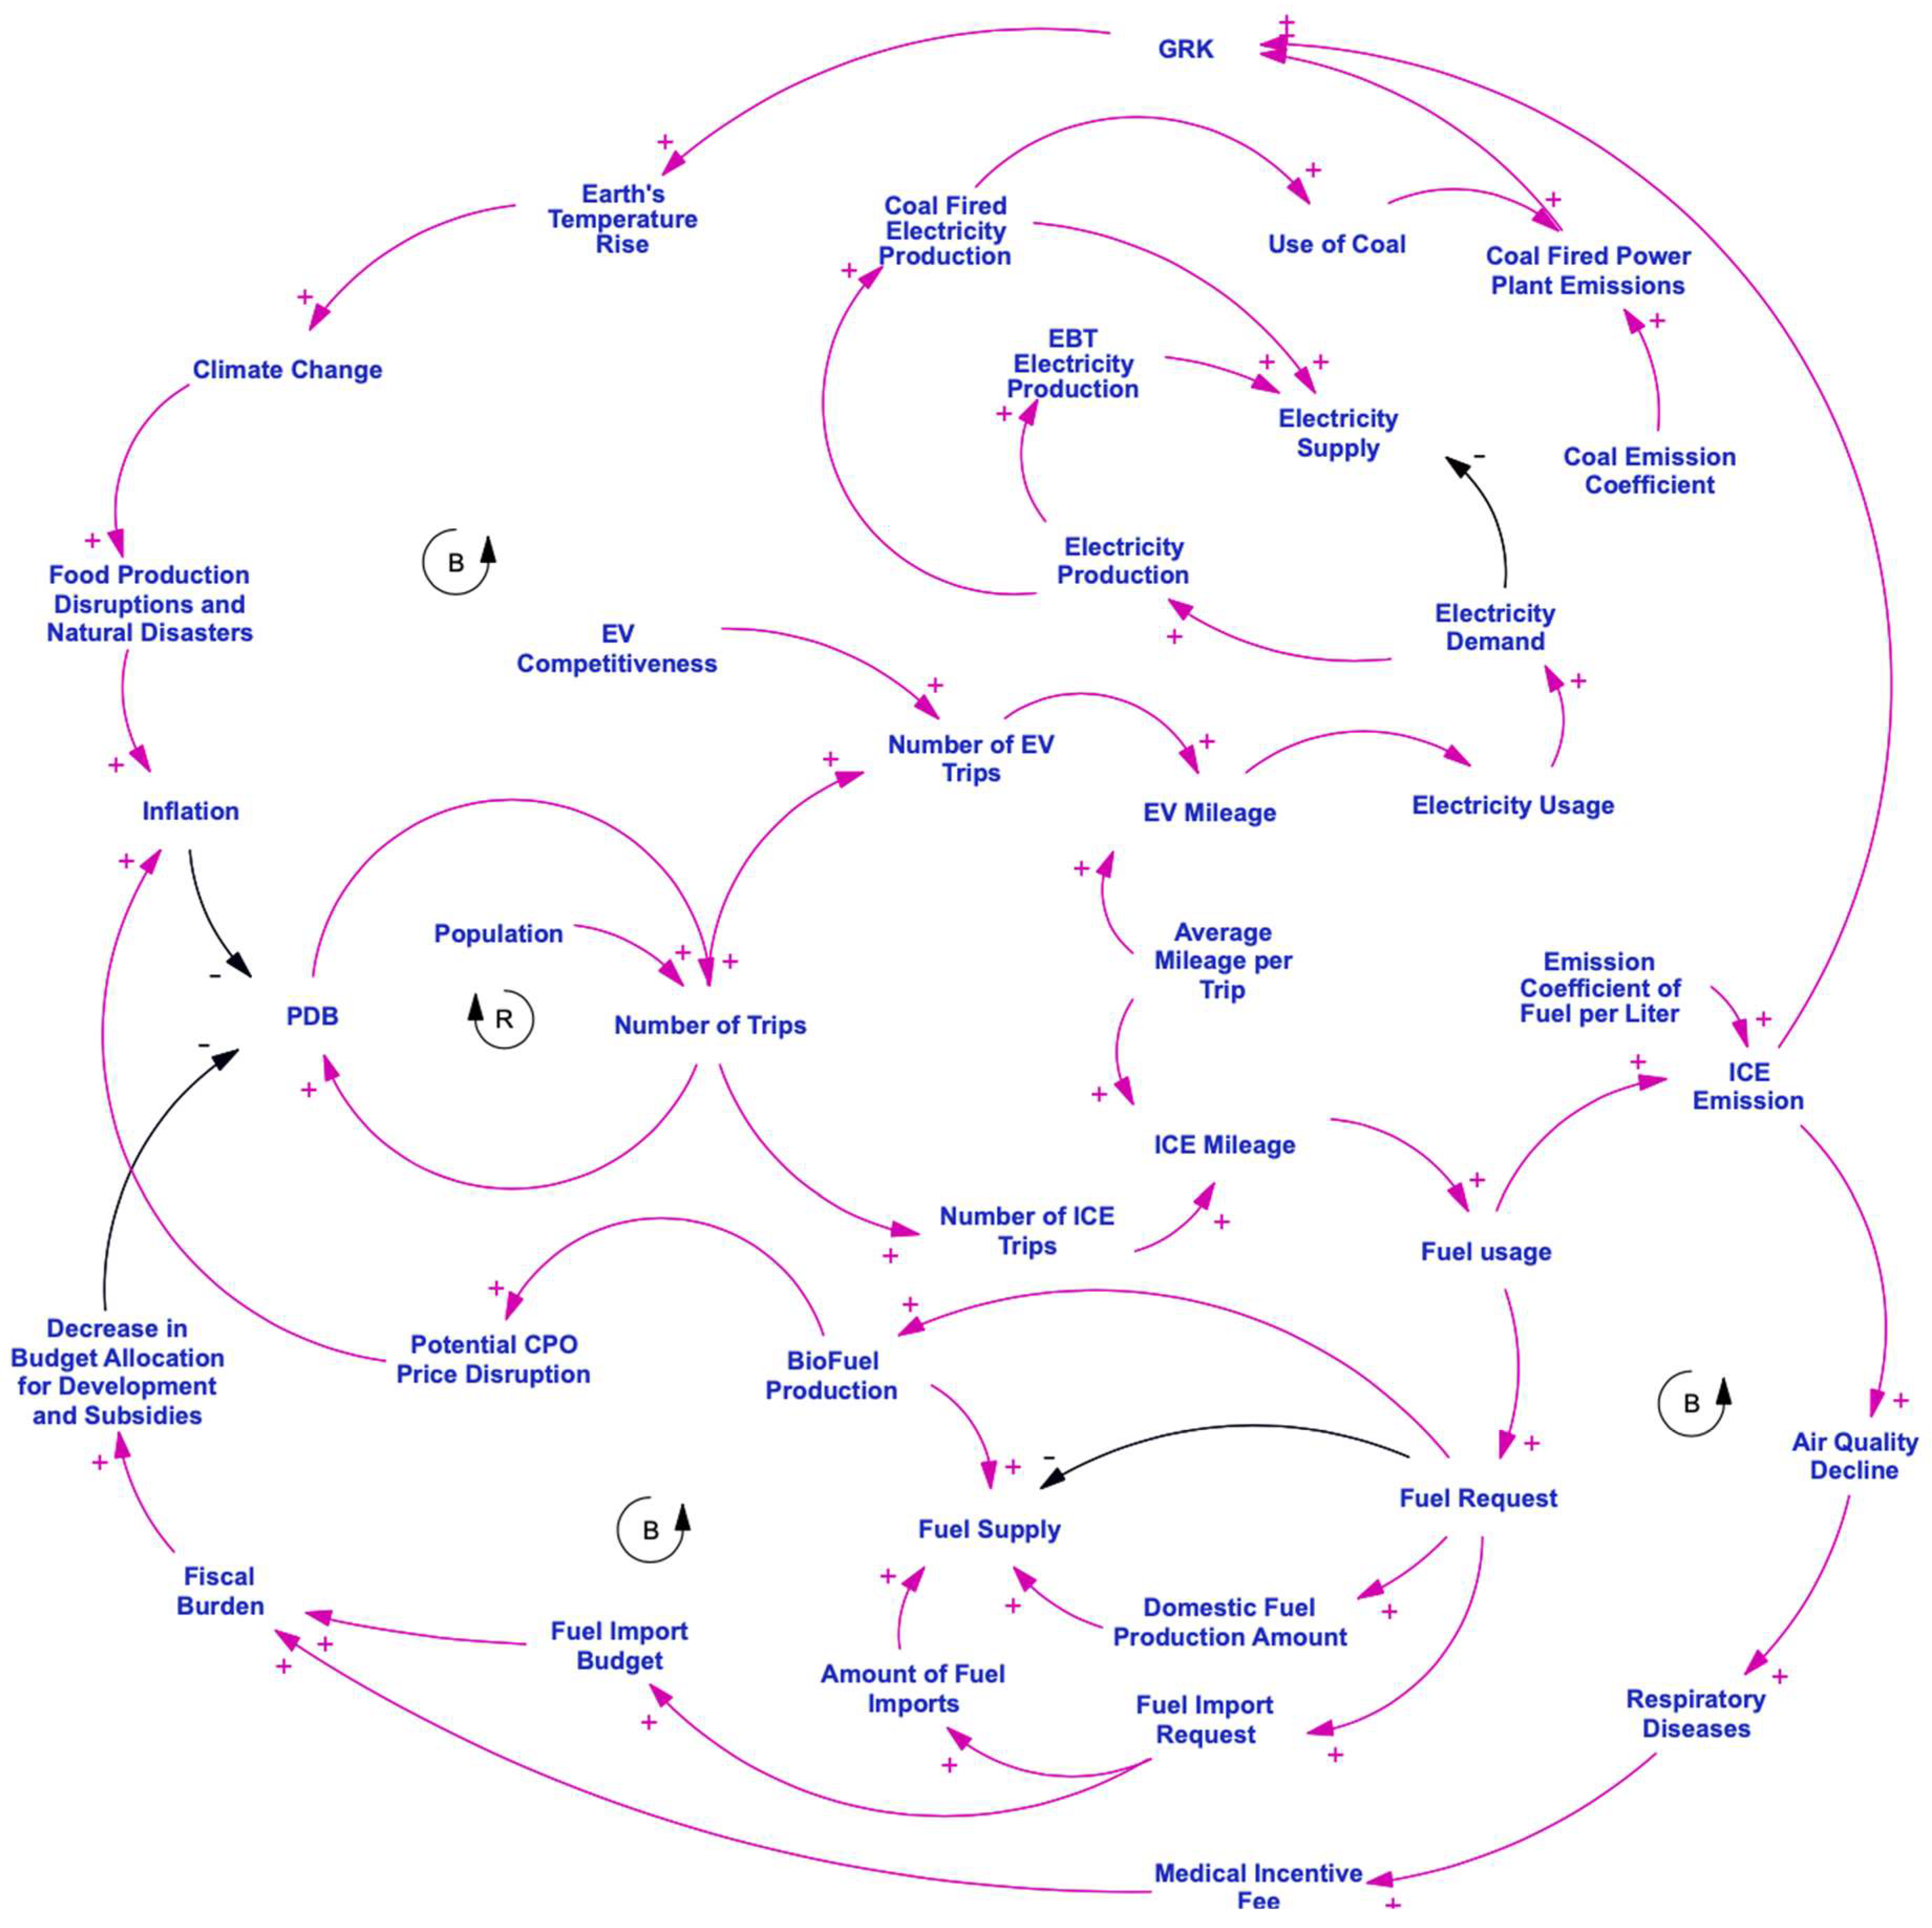
Figure 7.
Stock and flow diagram for EV transition.
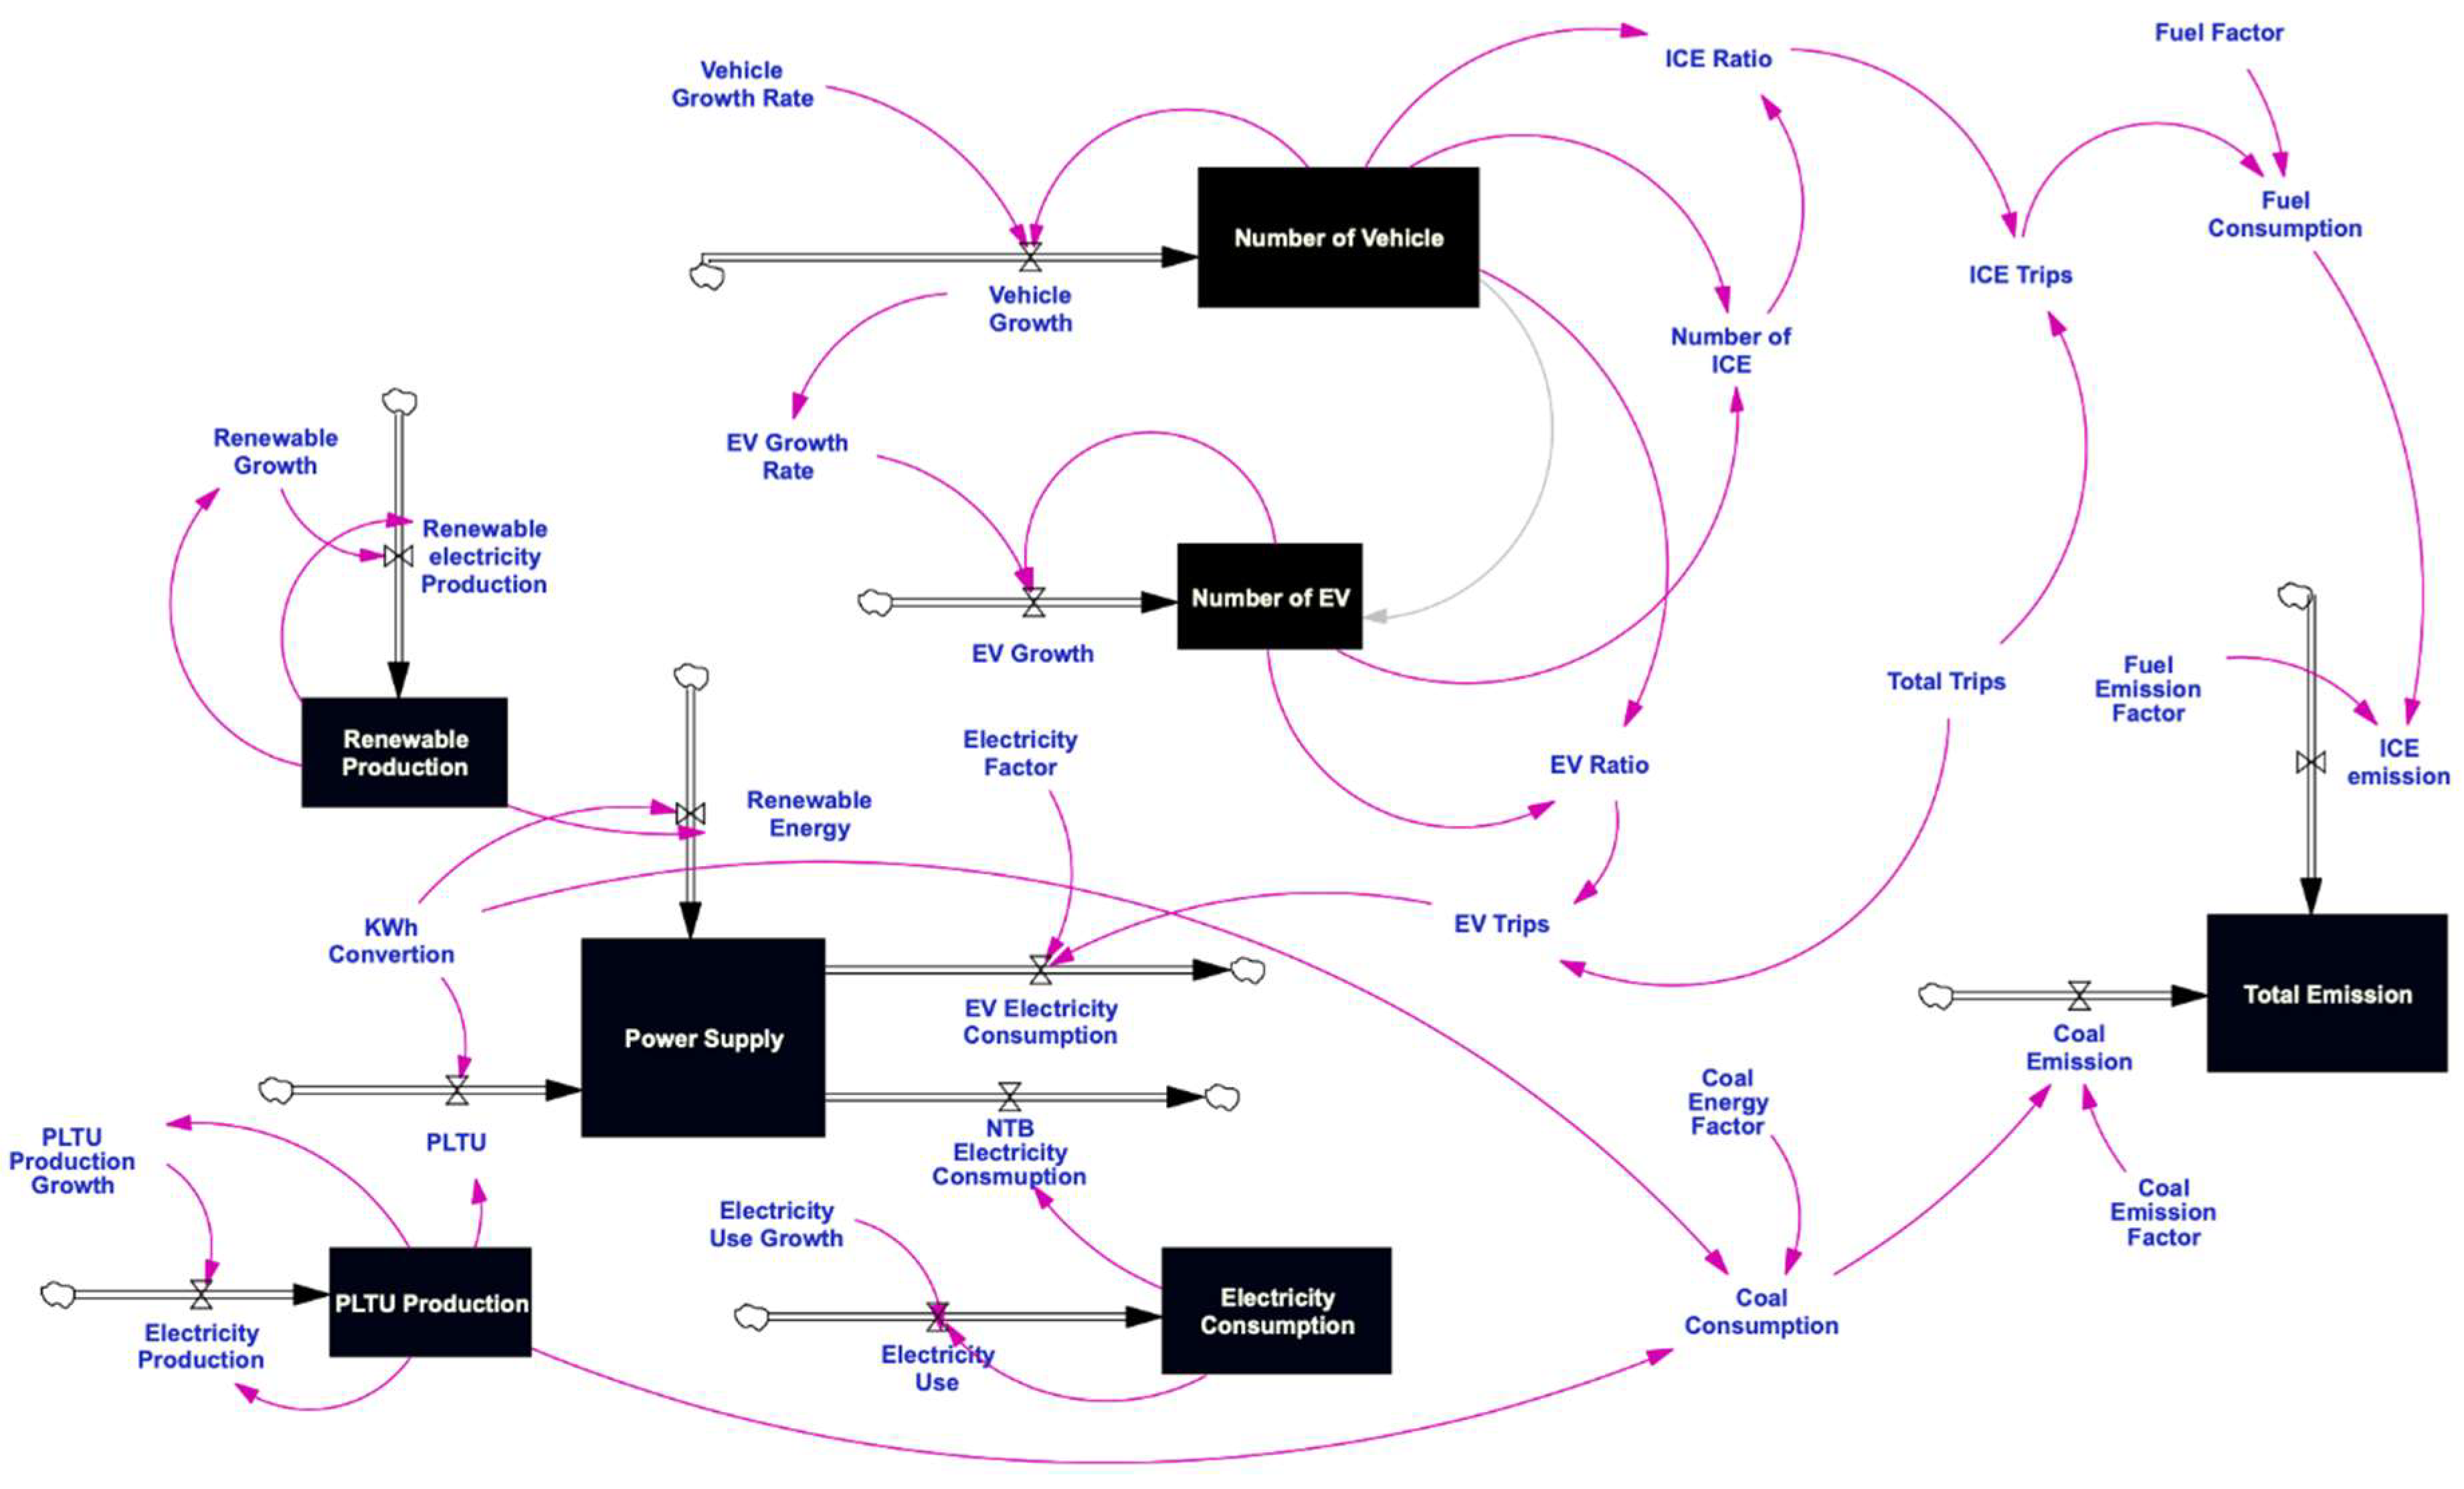
Figure 8.
Transportation Drive Subsystem.
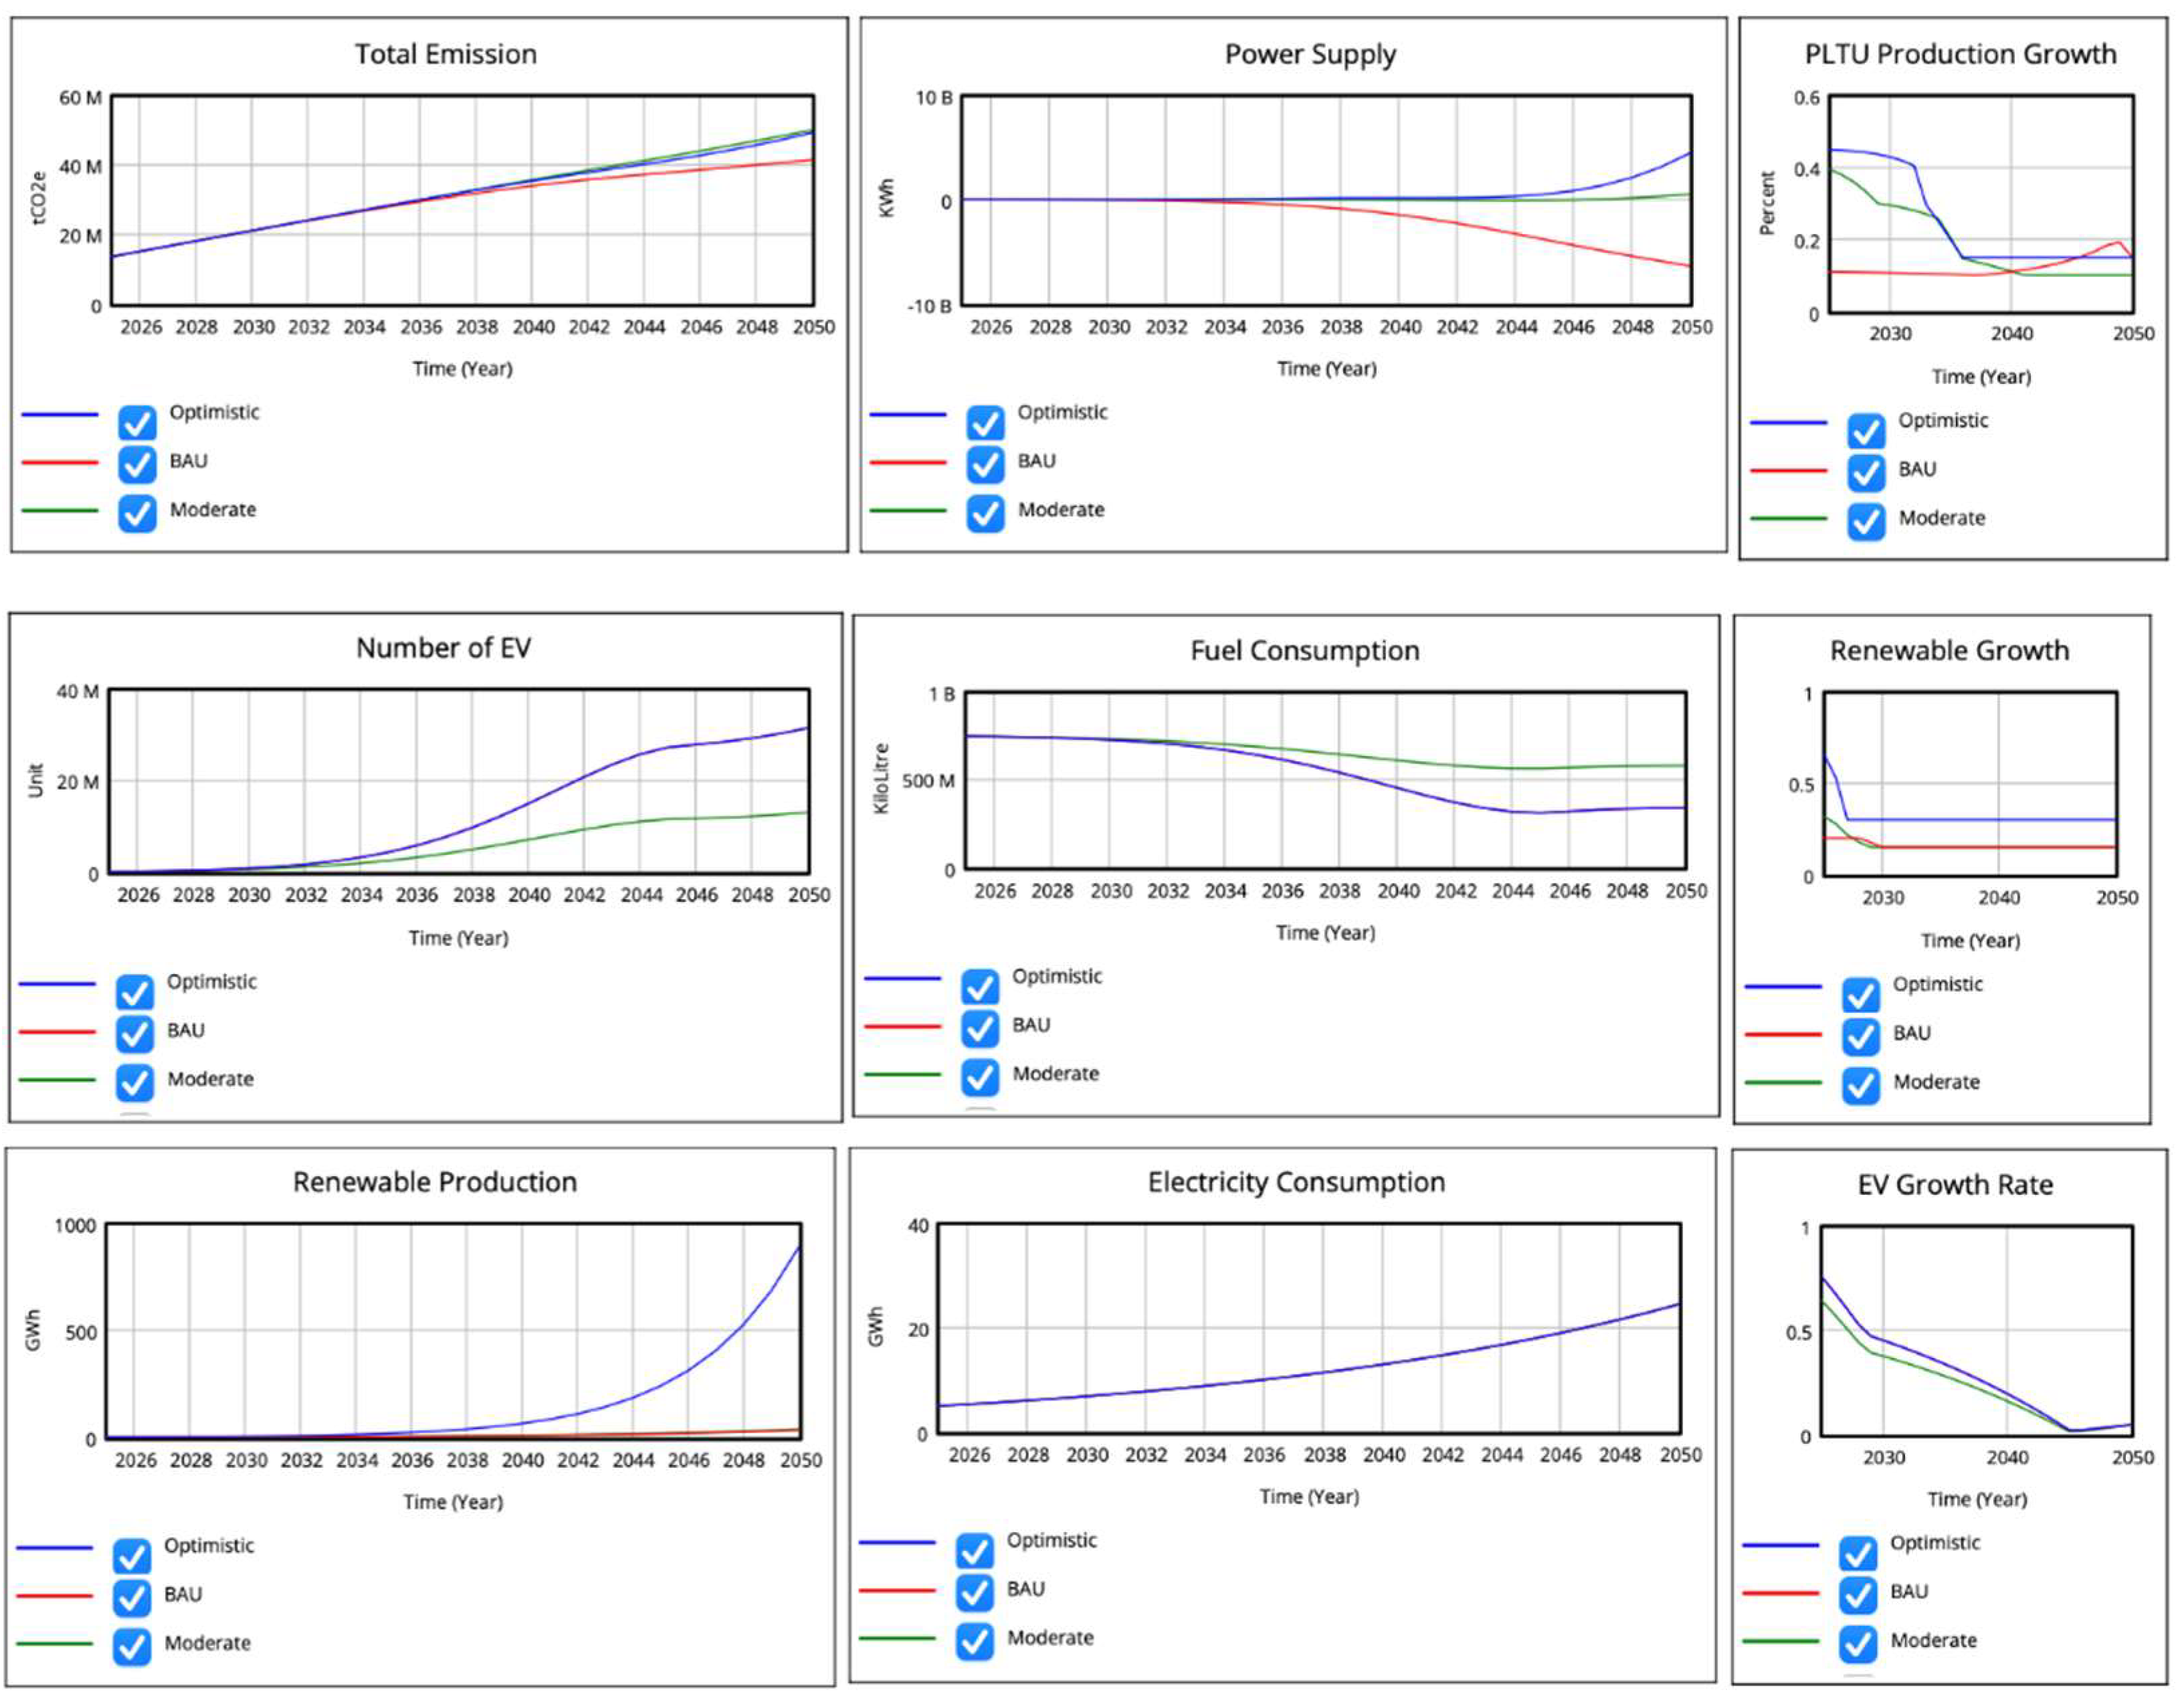
Figure 9.
Only in an optimistic scenario can EV electricity needs be met by renewable electricity production.
Figure 9.
Only in an optimistic scenario can EV electricity needs be met by renewable electricity production.
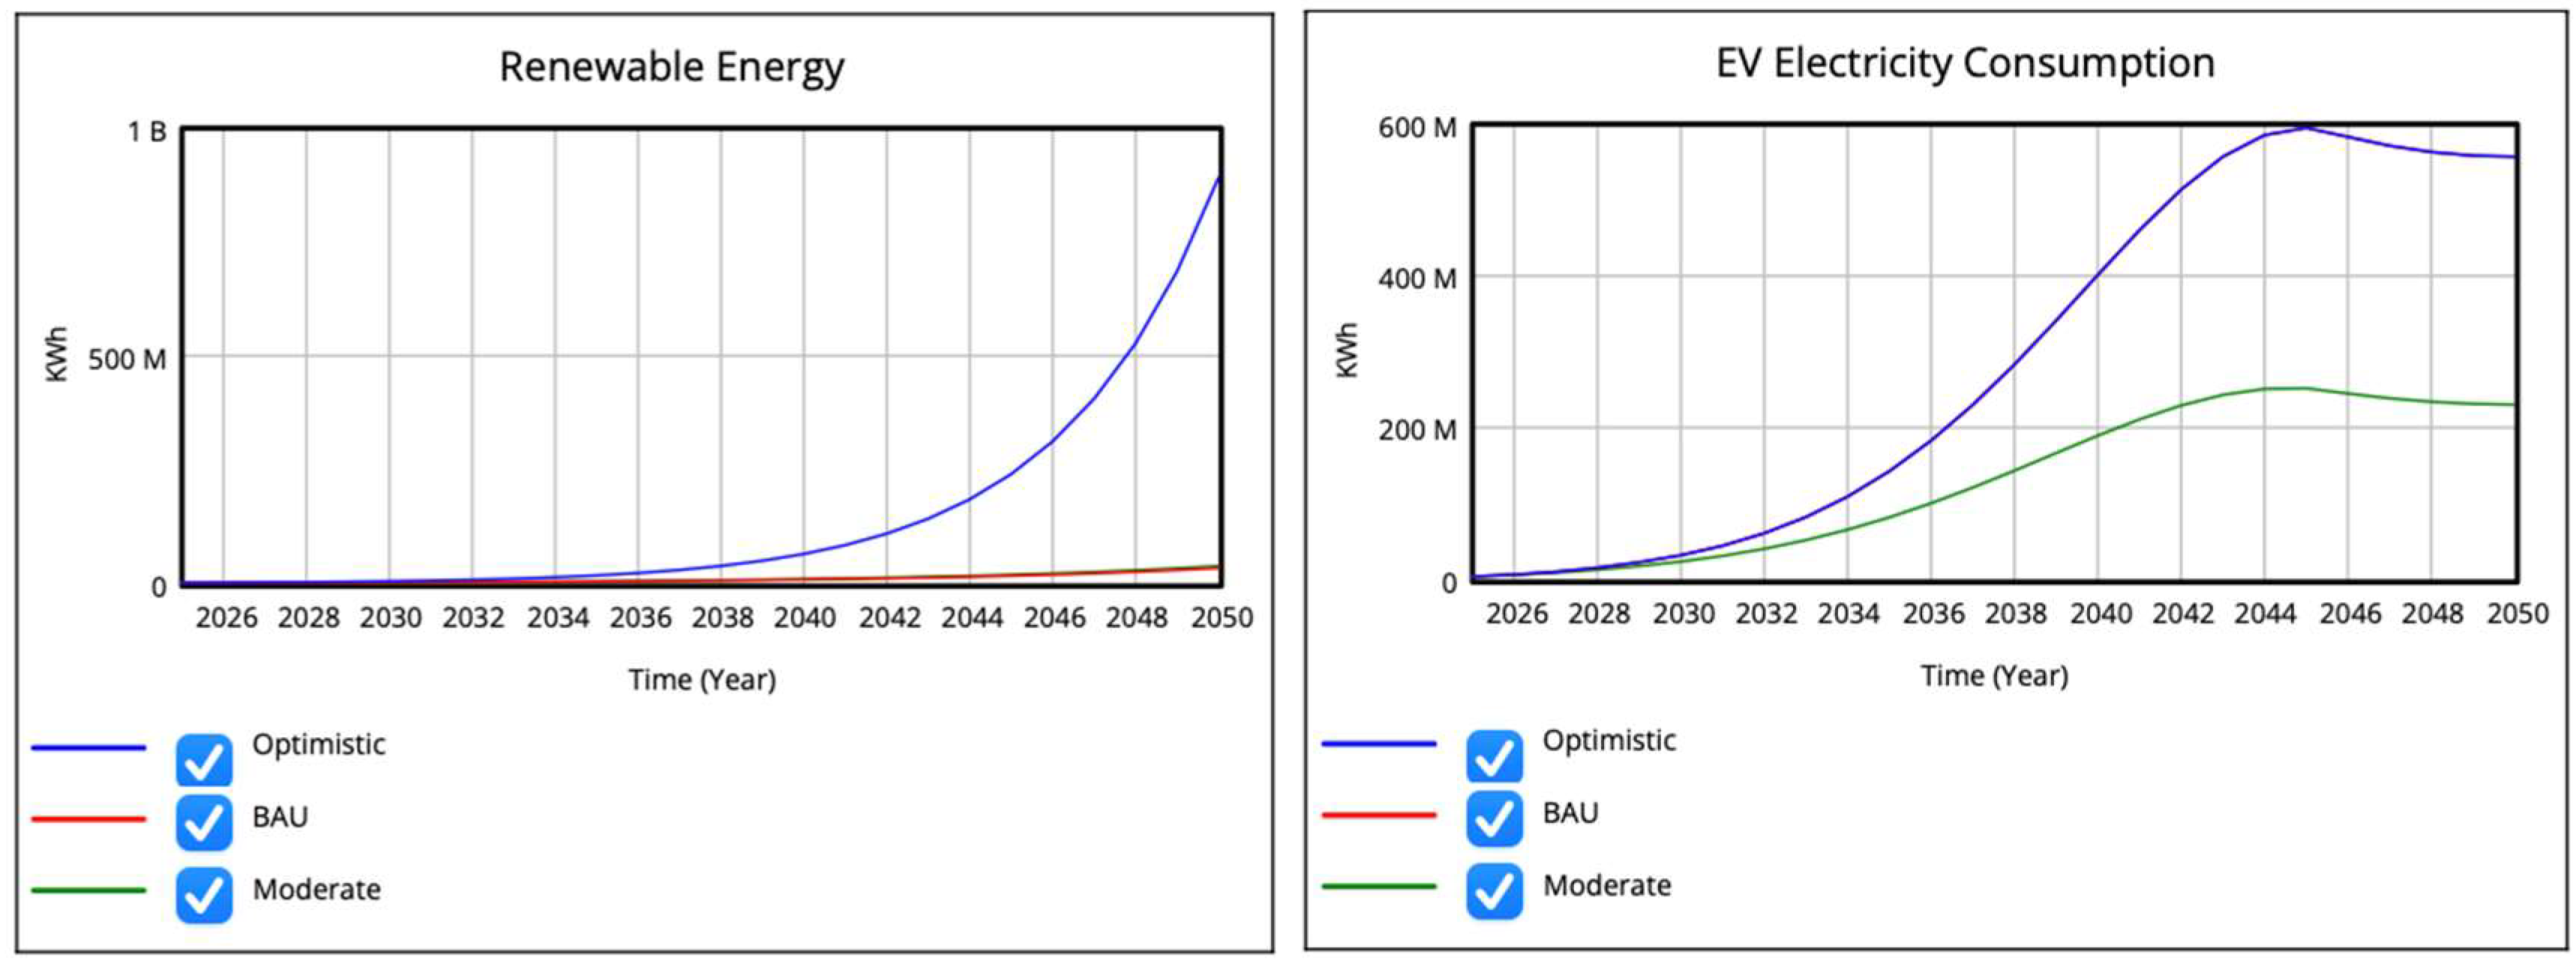

Table 1.
Aspect and variable of EV transition model.
| Aspect | Variable | Value | Unit | Data Source |
|---|---|---|---|---|
| Transportation | Number of Trips | 603 million | Times | Google EIE |
| Total Travel Distance | 6.76 billion | Kilometers | Google EIE | |
| Number of EVs | 72,360 | Units | Gaikindo | |
| Number of ICE | 20.1 million | Units | Gaikindo | |
| Emission from ICE | 1.7 million | tCO2e | Google EIE | |
| Economy | Gross Regional Domestic Product (GDRP | 43.6 trillion | Rupiah | BPS |
| Population | 5.67 million | People | BPS | |
| Fuel Import Expenditure | 2 trillion | Rupiah | ESDM | |
| Total Fuel Demand | 426,648 | Kiloliters | ESDM | |
| Total Electricity Demand | 2,572 | GWh | PLN | |
| Electricity Supply | 695.84 | MW | PLN | |
| Coal Consumption | 659,685 | Tons | ESDM | |
| Inflation Rate | 2.61 | Percent | BPS | |
| Environment | Temperature Increase | 1.5 | Celsius | IPCC |
| Number of Hydrological Disaster | 105 | Events | BPS | |
| Decline in Rice Production | 5.53 | Percent | BPS | |
| Social | Public Health Index | 39.4 | Percent | BPS |
* Compiled from various sources [33,38,39,43-47].
Table 2.
Parameter of EV transition model.
| Variable | Value | Unit | Data Source |
|---|---|---|---|
| Annual Vehicle Growth Rate | 4.2 | Percent | Gaikindo |
| Average Travel Distance | 11.3 | Kilometers | Google EIE |
| ICE Travel Distance per Liter | 8.98 | Kilometers | Google EIE |
| Fuel Consumption of ICE per Kilometer | 0.111 | Liters | Google EIE |
| Electricity Consumption per Kilometer (EV) | 0.33 | KWh/Km | Li, et al. |
| Average Annual EV Growth Rate in Past Five Years | 331 | Percent | Gaikindo |
| Annual Electricity Consumption Growth Rate | 6.6 | Percent | ESDM |
| RE Production Ratio in NTB | 22.43 | Percent | ESDM |
| Fuel Import Ratio | 57 | Percent | ESDM |
| Coal Emission Factor | 0.00034 | tCO2e/Ton | IPCC |
| Coal Requirement per 1 MW Generation | 0.0007 | Tons | IPCC |
| Annual Growth of Coal Power Plant (PLTU) | 10 | Percent | PLN NTB |
| Fuel Emission Factor | 0.002 | tCO2e/Liter | Google EIE |
* Compiled from various sources [38,39,41-43,45].
Table 3.
Comparison of emission inventory methods.
| Output | Government Emissions Inventory | Google EIE |
|---|---|---|
| Calculating total emissions | Yes | Yes |
| Calculating emissions by mode of transport | Yes | Yes |
| Calculating the total vehicle mileage | No | Yes |
| Calculating the number of trips | No | Yes |
| Inbound and outbound traffic | No | Yes |
* Reviewed from the Ministry of Environment and Google EIE statements.
Table 4.
BAU validation was carried out by comparing the projected electricity production growth trend under the BAU scenario with the historical growth trend from previous periods.
Table 4.
BAU validation was carried out by comparing the projected electricity production growth trend under the BAU scenario with the historical growth trend from previous periods.
| Year | 2015 | 2016 | 2017 | 2018 | 2019 | 2020 | 2021 | 2022 | 2023 |
|---|---|---|---|---|---|---|---|---|---|
| NTB Electricity Production (GWh)* | 2,539 | 2,768 | 3,040 | 3,363 | 3,753 | 4,204 | 4,686 | 5,180 | 5,742 |
| Growth Rate | 9% | 10% | 11% | 12% | 12% | 11% | 11% | 11% | |
| Year | 2025 | 2026 | 2027 | 2028 | 2029 | 2030 | 2031 | 2032 | 2033 |
| BAU Electricity Production Projection | 6,333 | 7,000 | 7,756 | 8,617 | 9,604 | 10,741 | 12,036 | 13,498 | 15,154 |
| Growth Rate | 10% | 10% | 10% | 10% | 11% | 11% | 11% | 11% |
* Based on PLN statistics 2023 [11].
Table 5.
Comparison of parameters of three scenarios.
| Scenario | BAU | Moderate Scenario |
Optimistic Scenario |
|---|---|---|---|
| RE Production Growth Rate | 15% – 20% | 15% – 32% | 30% – 65% |
| PLTU Production Growth Rate | 10% - 20% | 10% - 40% | 15% - 45% |
| EV Growth Rate | 5% - 75% | 5% - 64% | 5% - 75% |
| Electricity Consumption Growth Rate | 6.6% | 6.6% | 6.6% |
| Fuel Efficiency | Up to 56% | Up to 25% | Up to 56% |
Disclaimer/Publisher’s Note: The statements, opinions and data contained in all publications are solely those of the individual author(s) and contributor(s) and not of MDPI and/or the editor(s). MDPI and/or the editor(s) disclaim responsibility for any injury to people or property resulting from any ideas, methods, instructions or products referred to in the content. |
© 2025 by the authors. Licensee MDPI, Basel, Switzerland. This article is an open access article distributed under the terms and conditions of the Creative Commons Attribution (CC BY) license (http://creativecommons.org/licenses/by/4.0/).
Copyright: This open access article is published under a Creative Commons CC BY 4.0 license, which permit the free download, distribution, and reuse, provided that the author and preprint are cited in any reuse.


