
Submitted:
10 April 2025
Posted:
11 April 2025
You are already at the latest version
Abstract
The circular economy is becoming an increasingly important part of development strategies in various sectors, as it responds to critical challenges related to environmental protection, the rational use of natural resources and sustainable development. The transition from a linear to a circular model requires changes on many levels, both technological and social. In the circular model, it is crucial to design products with a view to their longer use and easier recycling and reuse.
The aim of the research was to determine the physical and mechanical parameters of mortars with the addition of recycled material. The effect of the additive on the compres-sive and flexural strength, water absorption and capillary suction of mortars was inves-tigated. The rheological properties of mortars, i.e. consistency, bulk density and setting time, were also studied. The internal structure of the samples was examined using an industrial computer tomograph Nikon XT H 225 ST and the microstructure of the mortars was analysed. Thermal conductivity coefficients for mortars were estimated. The analysis of the conducted tests shows that the addition of recycled material affects the rheological properties of mortars, causing an increase in the flow of fresh mortars, an extension of the setting time and a reduction in bulk density. The recycled material affects the parameters of the hardened mortar, resulting in a reduction in compressive and flexural strength. The biocomponent causes the cement matrix to seal, resulting in a reduction in weight gain in the water absorption and capillary rise tests.
Keywords:
cement
; recycled material
; compressive and flexural strength
; mortar
; mortar parameters
; rheological properties
1. Introduction
The circular economy is a key resource management approach that aims to create a more sustainable economic model. In addition to reducing waste and raw material consumption, the circular economy promotes innovation and the development of technologies that enable products to be used for longer and recycled and reused. The circular economy favours the preservation of ecosystems because it reduces the exploitation of natural resources, which consequently leads to less interference with nature. Rational resource management is key to maintaining the stability of ecosystems and protecting the natural environment. In addition, the circular economy can stimulate local markets and create jobs in the recycling and renewable materials sector, which contributes to economic and social development [1,2,3,4]. Education and public awareness of the circular economy are essential to encourage citizens to take action for sustainable development, such as waste separation or choosing environmentally friendly products. All these aspects make the Circular Economy not only beneficial for the environment, but also beneficial from a social and economic perspective, making it a fundamental element of sustainable development in the 21st century. Recycling plays a key role in the circular economy because it reduces the consumption of natural resources and the amount of waste that ends up in landfill [5,6,7,8].
Every year, more than two billion tonnes of solid municipal waste are generated worldwide. It is estimated that in 2030, only 0.49 billion tonnes of waste will be recycled, while 0.79 billion tonnes will end up in landfill. Only 0.35 billion tonnes of waste will be converted into energy. The problem is the waste that ends up in landfill. Waste that is difficult to recycle, such as food waste, dirty paper, non-recyclable plastics, chicken bones, nappies, etc. This waste has been processed by a company providing services for sustainable development into a recycling product - biocomposite. The waste was processed in accordance with industry standards such as: ISO 14044:2006+A1+A2:2020 [9], ISO 14040:2006 (ISO 14040, 2006a:2020) [10], ISO 14044, 2006b: 2020 [11], ISO 14025, 2006, [12], PCR 2010:16, VERSION 4.0.0, [13]. The impact of the new recycling product on the three main pillars of the environment was examined. The measurement of greenhouse gas emissions, comprehensive measurement of environmental impact and measurement of resource efficiency and non-recyclable waste management were examined. The production of recycled material generates less than 1/20 of the CO2 emissions compared to the production of primary polymers, [14,15,16]. It uses a minimum amount of land for production, processing and raw material extraction. A recycled product removes almost 1.2 kg of biogenic carbon per kilogram of product produced. The total impact on CO2 emissions is 1.2, making the recycled product a climate-positive material according to ISO 14040:2006, [10]. The new recycled material avoids landfill or incineration, thus significantly reducing greenhouse gases. It avoids emissions related to the extraction and processing of fossil fuels used as raw material in incineration plants [17,18,19,20]. The photochemical ozone creation potential of the new recycled material is comparable to that of recycled PP. Photochemical ozone formation is the process of ozone formation near the ground due to the interaction of sunlight with chemicals such as nitrogen oxides (NOₓ) and volatile organic compounds (VOCs), which are broken down by sunlight and react with oxygen (O₂) to form ozone. This ground-level ozone contributes to smog, which can cause health problems and damage plants. Each kg of new recycled material contains 1.5 kg of non-recyclable waste, which is landfilled or incinerated. Such activities contribute to improved financial performance and broader environmental and social benefits [21,22,23,24,25].
Biocomposite has found application in many fields such as automotive, logistics, as well as in the production of everyday objects. In construction, the recycled material has already been used in the production of floors, wall cladding, pipes and terrace materials [26].
The aim of the article was to examine the possibility of using in cement mortars a recycled material obtained from difficult-to-recycle waste, which often ends up in landfill dumps or incinerators. The issue has not been investigated by any scientific entity to date.
2. Materials and Methods
The test plan included the production of three series of mortar with the addition of recycled material and a reference series. Portland cement CEM I 42.5 R [Table 1, Figure 1] was used to make the mortar in accordance with the PN-EN 197-1: 2012 standard [27]. The aggregates used were quartz sand with a fraction of 0–2 mm in accordance with the PN-EN 12620+A1:2010 standard [28], tap water [29] and recycled material in quantities of 1%, 2%, and 3% in relation to the weight of the cement. All planned tests were carried out in the laboratories of the Kielce University of Technology. A standard mortar composition with a w/c ratio of 0.5 was used for the tests. The mortar ingredients were mixed according to EN 196-1:2016-07 [30], where the cement was initially mixed with water for 30 seconds, then the sand was dosed for 30 seconds while continuing to mix the ingredients. The mortar was continuously mixed for another 30 s, and then the recycled material was added. The mortar was left to stand for 90 s. The mortar was mixed again for 60 s. After this, the samples were formed into 4x4x16 cm cubes. The reference mortar cubes were labelled ‘SW’, with the addition of recycled material ‘1U, 2U, 3U’. The number indicates the amount of recycled material in the mortar.
An analysis of the cement particle size distribution shows that half of the particles are smaller than 9.14 µm. The largest concentration of particles is between 1 µm and 40 µm (Figure 2).
Based on the data obtained in the study of granulometric analysis of the recycled product (Figure 2), it can be concluded that the size of the biocomposite particles is 50% less than 97.51 µm. The highest concentration of particles is in the fraction range from 20 µm to 150 µm. The density of the recycled material is 2.69 g/cm3.
In laboratory tests, the influence of the length of the mortar curing period and the amount of recycled material introduced into the mortar composition on selected parameters was taken into account: compressive and flexural strength, water absorption and capillary suction of mortars, thermal conductivity and porosity. The characteristics of fresh mortar were also tested, such as consistency and bulk density. The mortars were subjected to microstructure tests using a scanning microscope and tests of the internal structure of the samples using an industrial computer tomograph.
2.1. Compressive and Flexural Strength Testing
The compressive and flexural strength tests were carried out on standard samples measuring 4x4x16 cm according to PN-EN 1015-11:2020-04 [32]. After moulding, the samples were stored in water at a temperature of +18±2ºC throughout the entire curing period. The compressive strength of the mortars was tested after 7, 14, 28, and 56 days, each time on six samples from each series.
2.2. Capillary Rise Test
The capillary rise test was carried out in accordance with the PN-88/B-06250 standard, [33] on mortar samples measuring 4x4x16 cm. After moulding, the beams were stored in water at a temperature of +18±2ºC for 7 days. Then, they were moved to an air-dry environment, also at the same temperature, for further curing until the 28th day. Before the test, the samples were placed in an air-conditioning chamber where a constant temperature of +40°C was maintained for 96 hours. After this period, the samples were removed from the chamber and the weight gain of the mortar was examined at different time intervals: 15 minutes, 30 minutes, 1 hour and 4 hours from the moment they were immersed in water. Further weight measurements were carried out every 24 hours, and the samples were immersed in water to a depth of about 3 mm throughout.
2.3. Water Absorption Test
The mortar absorbency test was carried out in accordance with the PN-88/B-06250 standard [33]. The 4x4x16 samples were stored for 7 days in water at a temperature of (+18±2ºC). They were then stored in the air for 21 days, also at a stable temperature (+18±2ºC). The samples were dried to a constant weight in an air-conditioned chamber at +40°C for 96 hours. They were then placed in water up to halfway up their height for 24 hours, after which they were completely submerged in water. The weight gain was checked every 24 hours until it stopped increasing. The test was carried out simultaneously on three samples from each series.
2.4. Setting Time
The setting time was tested at the beginning and end of the setting time in accordance with EN 196-3 [34] using a Vicat apparatus. The water/binder ratio was constant at 0.5. The determination was carried out using the SW standard cement slurry with the following composition: 450 g of binder, 225 g of water. In turn, the modified slurries contained additives in the same percentages as the mortars. Each sample of grout was placed in a Vicat ring on a glass plate. The needle was cleaned after each immersion. The beginning of setting was determined as the moment when the Vicat needle stopped at a distance of 6±3 mm above the surface of the glass plate, and the end at a depth of 1 mm.
2.5. Porosity Test with a Nikon XT H 225 ST Computer Tomography Scanner
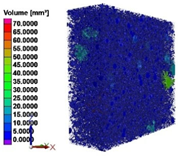
The internal structure of the samples was examined using an industrial computer tomograph, the Nikon XT H 225 ST. A reflection tube was used to perform the scans. The samples were scanned at a voltage of 201 kV and an intensity of 118 uA. During the scan, almost 4,500 images with a resolution of approx. 23 µm were generated. The exposure time was 354 ms. The images were reconstructed into a 3D model using CT Pro 3D, and all analyses were performed using VG Studio Max 2023.1. Sectional views were generated through the samples, which show the proportion and distribution of the additives used in the volume. In addition, a porosity analysis was carried out on a section of each of the samples, which, in addition to the percentage of pores, showed their size distribution in terms of volume and diameter, as well as a 3D model showing their distribution in the material.
2.6. Coefficient of Thermal Conductivity
The λ coefficient was measured using a needle probe device designed for solid samples (Thermtest MP-2). The samples were first dried to achieve dry mass, then stored for 14 days in a room with a temperature of 20.5°C and humidity of 60-65%. The tests were carried out on a sample drilled through to a depth of 50 mm on both sides (I used 1 sample each). Three measurements were taken in each hole. After each test, the device was checked for measurement compliance with the standard.
2.7. Porosity of Mortars
The tightness and porosity were calculated according to PN-76/B-06714, [35].
The total porosity P of the tested mortar was calculated according to the formula:
where:
Cw- density (specific gravity), [g/cm3]
Co-apparent density, [g/cm3]
The tightness S of the tested material is calculated according to the formula:
If the tightness has been calculated before, the porosity can be calculated according to the formula:
S=1-P
3. Results
The consistency of the mortars was determined based on the PN-EN 1015-6:2000 [36] standard using the slump test method.
According to the PN-EN 1015-6:2000 [36] standard, mortars with a flow value of less than 140 mm belong to the group of dense-plastic mortars (Table 2).
Another rheological test performed was to determine the bulk density of fresh mortar. The test was performed in accordance with PN-EN 1015-3:2000 [37].
The use of recycled material in the mortar composition resulted in a slight decrease in the bulk density of the mortar [Table 3]. The more biocomposite in the composition, the lower the bulk density of the mortar.
The setting time was tested at the beginning and end of the setting time in accordance with EN 196-3:2016-12 [34] using a Vicat apparatus.
The addition of recycled material in the composition resulted in an extension of the beginning and end of the binding of the grouts. And the more biocomposite, the longer this time is (Table 4).
The reference mortar has the highest increase in compressive strength, reaching 33.4 MPa after 56 days of curing. The series with 1% and 2% recycled material achieved a compressive strength of 29 MPa after 56 days of curing. The increased curing time of the mortar from 28 to 56 days resulted in an increase in strength of 4 MPa. The smallest increase in strength is characterised by the mortar with 3% biocomposite in its composition. Its compressive strength is 23MPa. The strength of the 3U series decreases by 31.1%, and the 1U and 2U series by 13.2% in relation to the reference series after 56 days of curing (Figure 3).
The reference series achieved the highest flexural strength, reaching a value of 6.7 MPa. The lowest strength was recorded for the series with 3% recycled material and amounted to 4.2MPa. This is a decrease of 37.3% compared to the SW series. The 1U and 2U series achieved a similar flexural strength of 5.5 MPa, which is 18% less than the reference series (Figure 4).
The water absorption and capillary rise tests were carried out on three 4x4x16 cm beams from each mortar series after 28 days of curing.
In the capillary rise test, the greatest increase in mass was recorded for the reference mortar (Figure 5). The addition of recycled material to the mortar composition causes a reduction in mass increase. For the 3U series, this decrease is 28.5%.
In mortars containing recycled material, they are characterised by a lower weight gain in relation to the reference series. The more recycled material in the mortar, the lower the weight gain. The addition of biocomposite to the mortar composition affects the sealing of the cement matrix (Figure 6).
The λ coefficient was measured using a device with a needle probe designed for solid samples (Thermtest MP-2).
The addition of recycled material in the composition of mortars reduces the thermal conductivity coefficient of mortars (Table 5).
The internal structure of the samples was examined using an industrial computer tomograph, Nikon XT H 225 ST.

Table 6.
Pore size and 3D model showing dispersion in the tested mortars.
| Series | SWU | 2U | 3U |
| Cross-section | 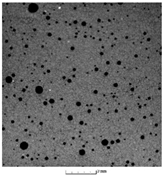 |
 |
 |
| 3D model of the pores | 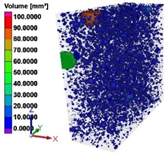 |
 |
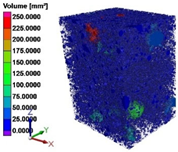 |
For the series tested, the percentage of pores is lowest for the reference mortar at 4.81% (Figure 7). For mortars with added recycled material, there was a large increase in pores. For the 2U series, the increase was 241.8%, and for the 3U series, 261% compared to the reference series. This is related to the pores formed as a result of the recycled material in the mortar composition.
The highest number of pores in the test was recorded for pores with a volume of 0-0.5 mm3, i.e., about 50% for the tested series (Figure 8). Pores of 0.5-1.0 mm3 account for more than 10% of all pores in all mortars. The remaining larger pores account for small amounts close to zero.
After conducting a leak and porosity test according to the PN-76/B-06714 standard, (Table 7). It can be seen that the tightness of mortars decreases with the addition of the biocomponent. The more of it in the mortar, the less tight it is. And the porosity increases for mortars with the addition of recycled material.
The percentage of pores in the internal structure of the mortar, measured using an industrial computer tomograph Nikon XT H 225 ST, showed a slightly higher porosity. This may be due to the location of the test sample and the distribution of the biocomponent in the mortar.
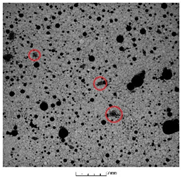
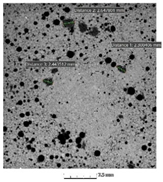
The microstructure of the mortar was analysed at selected points (Figure 9, Figure 10, Figure 11 and Figure 12).
The chemical composition analysis at points 1-4 indicates the components of the hydration process of the tested mortar. The chemical composition at these points consists mainly of calcium oxide and, to a lesser extent, silicon oxide, aluminium, sulphur, potassium, carbon and iron (Figure 9-10).
The chemical composition in areas 1-3 consists mainly of calcium oxide and, in much smaller quantities, of elements such as silicon oxide, aluminium, sulphur, potassium, carbon and iron, which are components of the hydration process (Figure 11- 12).
The analysis in point 4 shows a very high presence of silicon oxide, which indicates the aggregate content in the construction of the sample. The analysis in point 2 is noteworthy, where a small amount of chlorine was observed. Its presence may be due to the rinsing of waste products before the recycling process. Certainly, this type of recycled product cannot be used in mortars with steel reinforcement.
4. Conclusions
The results of the tests form the basis for the following conclusions:
- Rheological tests: Mortars with the addition of recycled material are characterised by a greater flow of fresh mortar compared to the reference series. The addition of biocomposite causes an extension of the beginning and end of mortar setting. The recycled material in the mortar composition also changed the bulk density of the mortars. Mortars with biocomposite are characterised by a decrease in bulk density compared to the reference series (SW). The more recycled material in the mortar, the greater the flow of fresh mortar, the longer the initial and final setting times, and the lower the bulk density.
- Testing of hardened mortar parameters: In the compressive strength test, the reference mortar has the highest compressive strength gain. It reaches 33.4 MPa after 56 days of curing. The mortar series with 1% and 2% recycled material achieved a compressive strength of 29MPa after 56 days of curing. Extending the curing time of the mortar to 56 days resulted in an increase in compressive strength of 4 MPa. The reference series achieved the highest flexural strength, reaching 6.7 MPa. The lowest strength was recorded for the series with 3% recycled material and was 4.2MPa. This is a decrease of 37.3%. Series 1U and 2U achieved a similar flexural strength of 5.5 MPa, which is 18% less than the reference series. In the capillary rise test, the greatest increase in mass was recorded for the reference mortar. The addition of recycled material to the mortar composition reduces the increase in mass. For the 3U series, this decrease is 28.5% compared to the SW series. In the water absorption test, the reference series is characterised by the highest mass increase of 5.9%. The 3U series, with a 3% recycled material content, had a weight gain of 4.3%. This means a decrease of 27.1% compared to the reference series. The addition of recycled material to the mortar composition reduces the thermal conductivity coefficient of the mortar. The more biocomposite, the lower the coefficient. After testing with a Nikon XT H 225 ST industrial computer tomograph, the lowest pore percentage was recorded for the reference mortar at 4.81%. A significant increase in pores was observed for mortars with recycled material. For the 2U series, the increase was 241.8%, and for the 3U series, it was 261% in relation to the comparative series. This is probably related to the pores formed as a result of the recycled material in the mortar composition. The microstructure of the mortar was also analysed at selected points. Chlorine was found in the recycled material. This may be due to the recycling of waste water. This recycled material is definitely not suitable for steel-reinforced mortars.
These aspects can contribute to a better utilisation of construction mortars with the addition of recycled material and the optimisation of their composition to increase the effectiveness and durability of the tested mortars.
5. Discussion
After laboratory tests of mortars containing 1%, 2% and 3% recycled material, several important rheological properties and hardened mortar parameters were evaluated. These tests answer the key question: Does adding recycled material to mortars change all the rheological properties and parameters of the hardened mortar? Is it possible to use the tested recycled material in mortar compositions? Furthermore, if specific rheological characteristics or hardened mortar parameters are prioritised, what amount of recycled material should be added to avoid impairing the selected characteristics? Finally, does the addition of recycled material have a negative impact on the properties of fresh or hardened mortar?
One of the preliminary observations is that the inclusion of recycled material in mortars increases the fluidity of fresh mortar, as measured by the slump test. This effect was most pronounced when 3% recycled material was used. All slumps of the tested mortars were within the limits of thick-paste mortars.
The addition of recycled material also affected the bulk density of the mortar, with the addition of recycled material to the mortar showing a decrease in bulk density compared to the reference series (SW). The more of this substitute, the lower the bulk density of the mortar.
When considering the addition of recycled material to the mortar composition, it affects the extension of the beginning and end of the grout setting. The more additive in the mortar composition, the longer the setting time.
In terms of compressive strength, the reference mortar achieved the highest compressive strength of 33.4 MPa after 56 days of curing. The addition of recycled material in the form of 1% and 2% reduced the compressive strength to 29 MPa, which indicates their moderate impact on the mechanical properties of mortars.
Extending the mortar’s maturation period from 28 to 56 days contributed to an increase in strength by 4 MPa, which suggests that maturation time is important for achieving optimal mechanical parameters. The lowest compressive strength of 23 MPa was observed in the mortar with 3% recycled material. It is also worth noting that the decrease in strength for mortars with 3% recycled material (series 3U) is 31.1% compared to the reference series, which is a significant reduction. In contrast, mortars with 1% and 2% recycled material (series 1U and 2U) show a lower strength reduction of 13.2% compared to the reference mortar. In conclusion, the addition of recycled material in larger quantities has a negative effect on the compressive strength of the mortar, and its use, in combination with the correct curing time, can lead to acceptable applications in construction.
The flexural strength analysis shows that the reference series has the highest flexural strength of 6.7 MPa. Meanwhile, the addition of recycled material significantly lowers this parameter. Series 1U and 2U, although they also show lower strength, perform better than series 3U with bioco-posite. In conclusion, the addition of recycled material can negatively affect the mechanical properties, which is worth considering when designing and selecting materials for future applications.
In the capillary rise test, it was noted that the reference mortar had the highest mass increase, which suggests that its water absorption capacity was the highest. The introduction of recycled material into the mortar composition resulted in a 28.5% decrease in this capacity for the 3U series. Such a decrease may affect the durability of the material, its resistance to moisture, as well as its thermal insulation. It is therefore worth considering the potential benefits of this parameter more carefully.
A similar trend was observed in the study of water absorption. In mortars in which recycled material was used, a lower increase in mass can be observed compared to the reference series. In addition, the use of recycled materials can affect the sealing of the cement matrix. This can lead to an improvement in properties such as weather resistance. Such changes can be beneficial, especially in the context of building materials exposed to the elements.
The addition of recycled material to construction mortars reduces their thermal conductivity. Lower thermal conductivity values mean better insulation properties. The introduction of recycled material can increase the porosity of mortars, which in turn leads to a reduction in thermal conductivity and thus improves the energy efficiency of buildings.
In the analysis of the pore content test results, the reference mortar has the lowest pore content of 4.81%, which serves as a reference point for further analyses. In contrast, a significant increase in pore content is observed for mortars with the addition of recycled material. In the case of the 2U series, this increase is 241.8%, while the 3U series shows an even greater increase of 261%. Such large differences indicate that the recycled material introduces additional pores into the mortar, which can affect the mechanical and insulating properties as well as the durability of the final product. When analysing the results, it is worth considering what mechanisms may be responsible for the formation of these pores. Possible causes are differences in the hydration process, changes in the crystalline structure or other chemical reactions that occur during the maturation of mortars. Other causes are the different composition of the recycled material, depending on the waste materials currently being processed.
References
- Aminoff A., Kettunen O., Sustainable Supply Chain Management in a Circular Economy – Towards Supply Circles, Smart Innovation, Systems and Technologies, 2016,Volume 52, pp. 61–72. [CrossRef]
- Bocken N. M. P. de Pauw I., Bakker C. van der Grinten B., Product design and business model strategies for a circular economy, Journal of Industrial and Production Engineering 2016, Volume 33, No 5, pp. 308–320. [CrossRef]
- Amir S., Salehi N., Roci M., Sweet S., Rashid A., Towards circular economy: A guiding framework for circular supply chain implementation, Business Strategy and the Environment, 2022, Volume 32, No 6, pp. 2684–2701. [CrossRef]
- Demirel P., Danisman G. O., Eco-Innovation and Firm Growth in the Circular Economy: Evidence from European SMEs, Business Strategy and the Environment, 2019, Volume 28, No8, pp. 1608– 1618. [CrossRef]
- Gregson N., Crang M., Fuller S., Holmes H., Interrogating the circular economy: the moral economy of resource recovery in the EU, Economy and Society, 2015, Volume 44, No 2, pp. 218–243. [CrossRef]
- De Angelis R., Howard M., Miemczyk, J., Supply chain management and the circular economy: towards the circular supply chain, Production Planning & Control, 2015, Volume 29, No 6, pp. 425–437. [CrossRef]
- Geissdoerfer M., Savaget P., Bocken N., Hultink E. J., The Circular Economy – A new sustainability paradigm?, Journal of Cleaner Production,2017, Volume 143, pp. 757–768. [CrossRef]
- Del Giudice M., Chierici R., Mazzucchelli A., Fiano F., Supply chain management in the era of circular economy: the moderating effect of big data, The International Journal of Logistics Management, 2021, Volume 32,No 2, pp. 337–356. [CrossRef]
- ISO 14044:2006+A1+A2:2020 Environmental management - Life cycle assessment - Requirements and guidelines (ISO 14044:2006).
- ISO 14040:2006 (ISO 14040, 2006a:2020) Environmental management — Life cycle assessment — Principles and framework.
- ISO 14044, 2006b:2020 Environmental management — Life cycle assessment — Requirements and guidelines.
- ISO 14025, 2006 Environmental labels and declarations — Type III environmental declarations — Principles and procedures.
- PCR 2010:16, WERSJA 4.0.0 Fertilisers Product Category Classification: Un Cpc 3461, 3462, 3463, 3464 & 3465, 2024-05-22.
- Plewa M., Giel R., Klimek M., Comparative analysis of waste management in Poland and other European countries, Logistyka, 2016, Volume 6.
- Toruński J., Management of municipal waste in Poland, Zeszyty Naukowe Uniwersytetu Przyrodniczo-Humanistycznego w Siedlcach, 2010, Volume 87.
- Zelga-Szmidla A., Ociepa-KubickaA., Rozpondek K., Municipal waste in Poland – management and utilisation issues, Zeszyty Naukowe Politechniki Częstochowskiej Zarządzanie, 2018, Volume 31,pp. 294-302.
- Pawłowski A., The multidimensionality of sustainable development, in: Problems of Ecological Development, Problems of Sustainable Development, 2016, Volume. 1, No 1, pp. 23-32.
- Piontek B., The concept of sustainable development in Poland, PWN, Warsaw 2002.
- Skowroński A., Sustainable development as a prospect for further civilisation progress, in: Problems of Eco-development, Problems of Sustainable Development, 2006, Volume. 1, No 2, pp. 51.
- Communication from the Commission to the European Parliament, the Council, the European Economic and Social Committee and the Committee of the Regions, Towards a circular economy: A zero waste programme for Europe, Brussels, 02.07.2014, 2014, Volume 398.
- Bum S. i Oskam, S., Increasing community recycling through persuasive communication and public engagement, Journal of Applied Social Psychology, 1986, Volume 16, pp. 29-41.
- Stern P. Oskamp S., Management of limited environmental resources, Handbook of environmental psychology, 1987, Nowy Jork, pp. 1044-1088.
- Sobiecki M., Poland’s fulfilment of the obligation to achieve the level of recovery and recycling of certain waste resulting from EU law, 5th Jubilee Waste Management Forum - Gniezno, Poznań – Poland 2003, pp. 149 –159.
- Company materials UBQ, www.ubqmaterials.com.
- Skalmowski K., Waste management guide. Legal status as of 15.03.2003 r. Warsaw 2004.
- Company brochure UBQ.
- PN-EN 197-1: 2012 Cement -- Part 1: Composition, requirements and conformity criteria for cements for general use, Polish Committee for Standardization, Warsaw, Poland, 2012.
- PN-EN 12620+A1:2010, Aggregates for concrete, Polish Committee for Standardization, Warsaw, Poland, 2010.
- PN-EN 1008:2004 Concrete batching water, Polish Committee for Standardization, Warsaw, Poland, 2004.
- PN-EN 196-1:2016-07 Methods of testing cement -- Part 1: Determination of strength, Polish Committee for Standardisation, Polish Committee for Standardization, Warsaw, Poland, 2016.
- www.dyckerhoff.pl, Cement Information Materials.
- PN-EN 1015-11:2020-04 Test methods for mortars for masonry -- Part 11: Determination of flexural and compressive strength of hardened mortar, Polski Komitet Normalizacyjny, Warsaw, Poland, 2020.
- PN-88/B-06250 Plain concrete, Polski Komitet Normalizacyjny, Warsaw, Poland, 1988.
- PN-EN 196-3:2016-12 – Metody badania cementu – część 3: Oznaczenie czasów wiązania i stałości objętości, Polish Committee for Standardization 2016; O.
- PN-76/B-06714 Kruszywa mineralne -- Badania -- Oznaczanie mrozoodporności metodą bezpośrednią, Polish Committee for Standardization, Warsaw, Poland, 2000.
- PN-EN 1015-3:2000 Test methods for mortars for masonry -- Determination of consistency of fresh mortar (using a spreading table), Polish Committee for Standardization, Warsaw, Poland, 2000.
- PN-EN 1015-6:2000 Methods for testing mortars for masonry -- Determination of volume density of fresh mortar, Polish Committee for Standardization, Warsaw, Poland, 2000.
Figure 1.
Grain size of CEM I 42.5R cement.
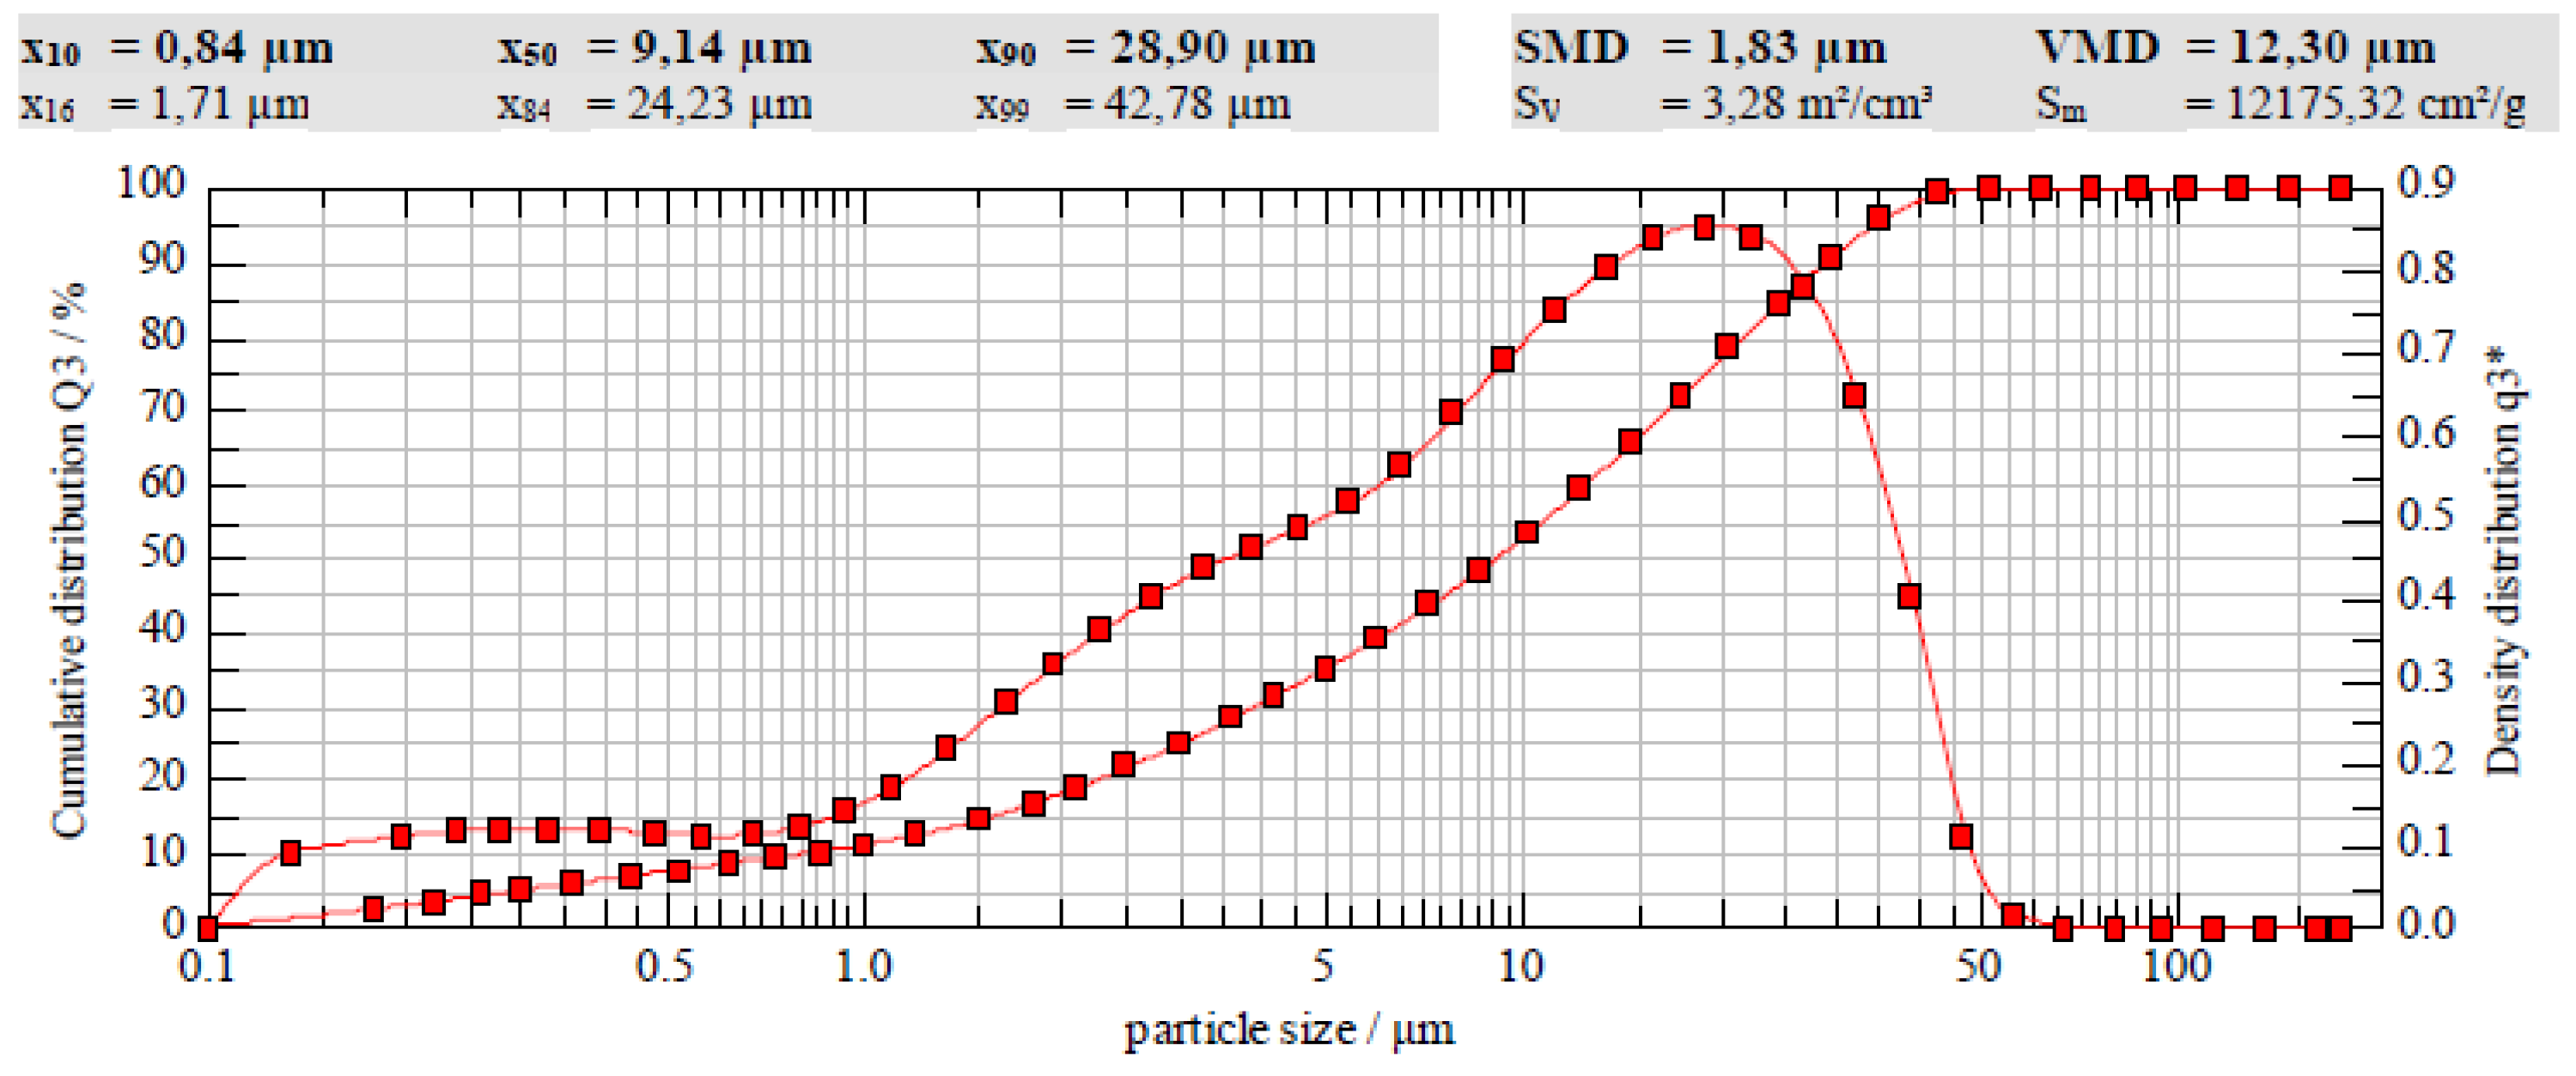
Figure 2.
Grain size of the recycled product.
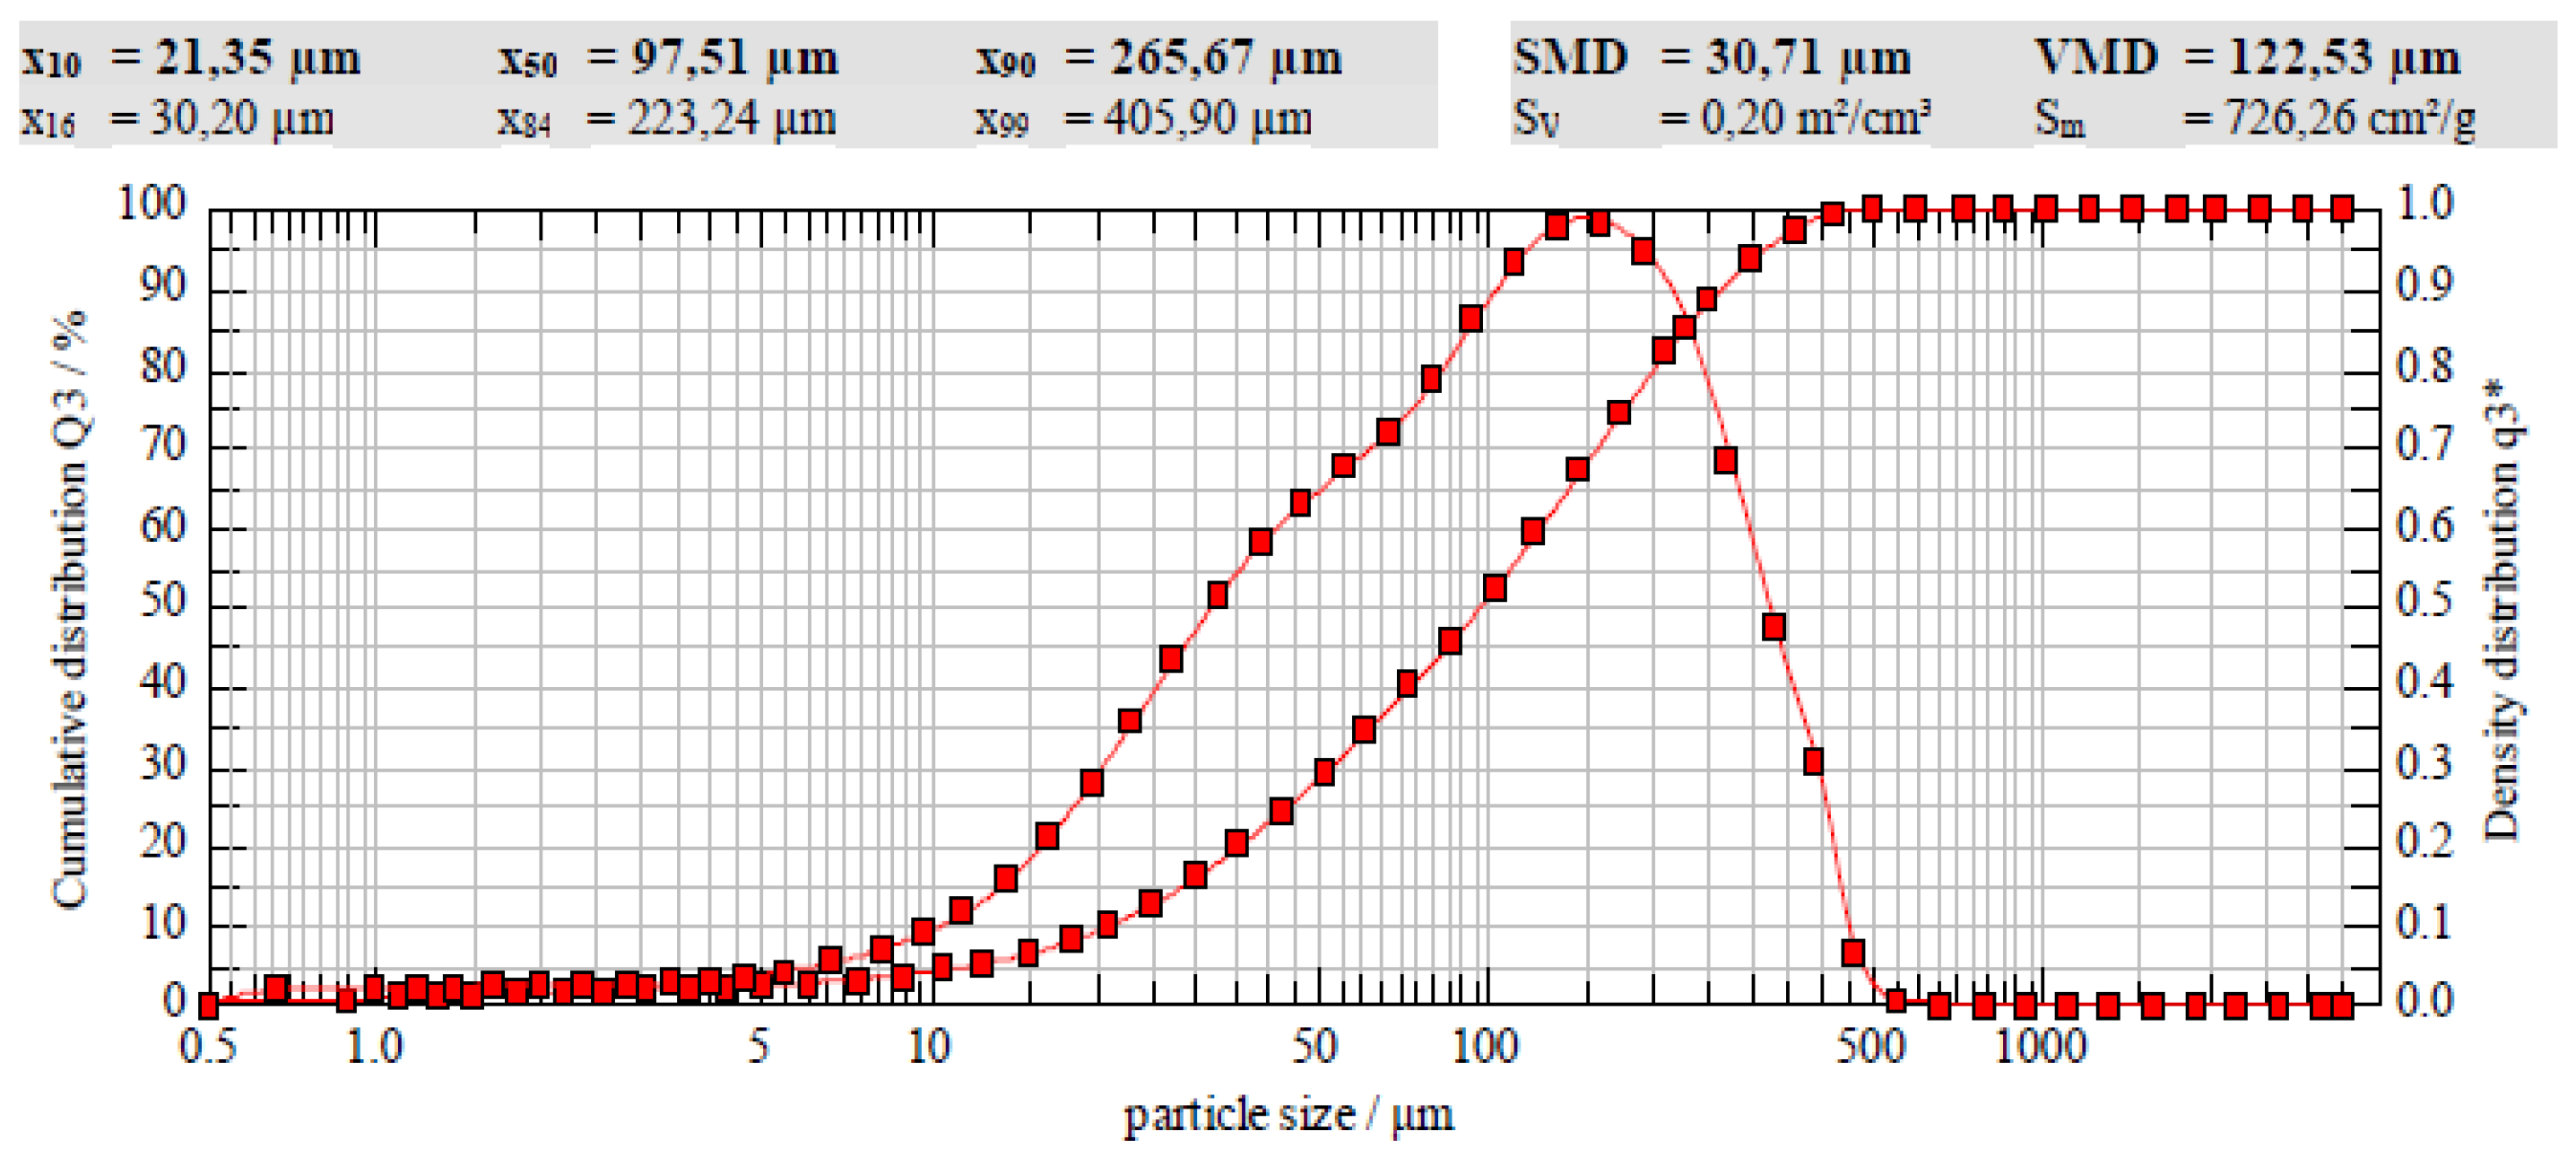
Figure 3.
Average increase in compressive strength of the tested series.
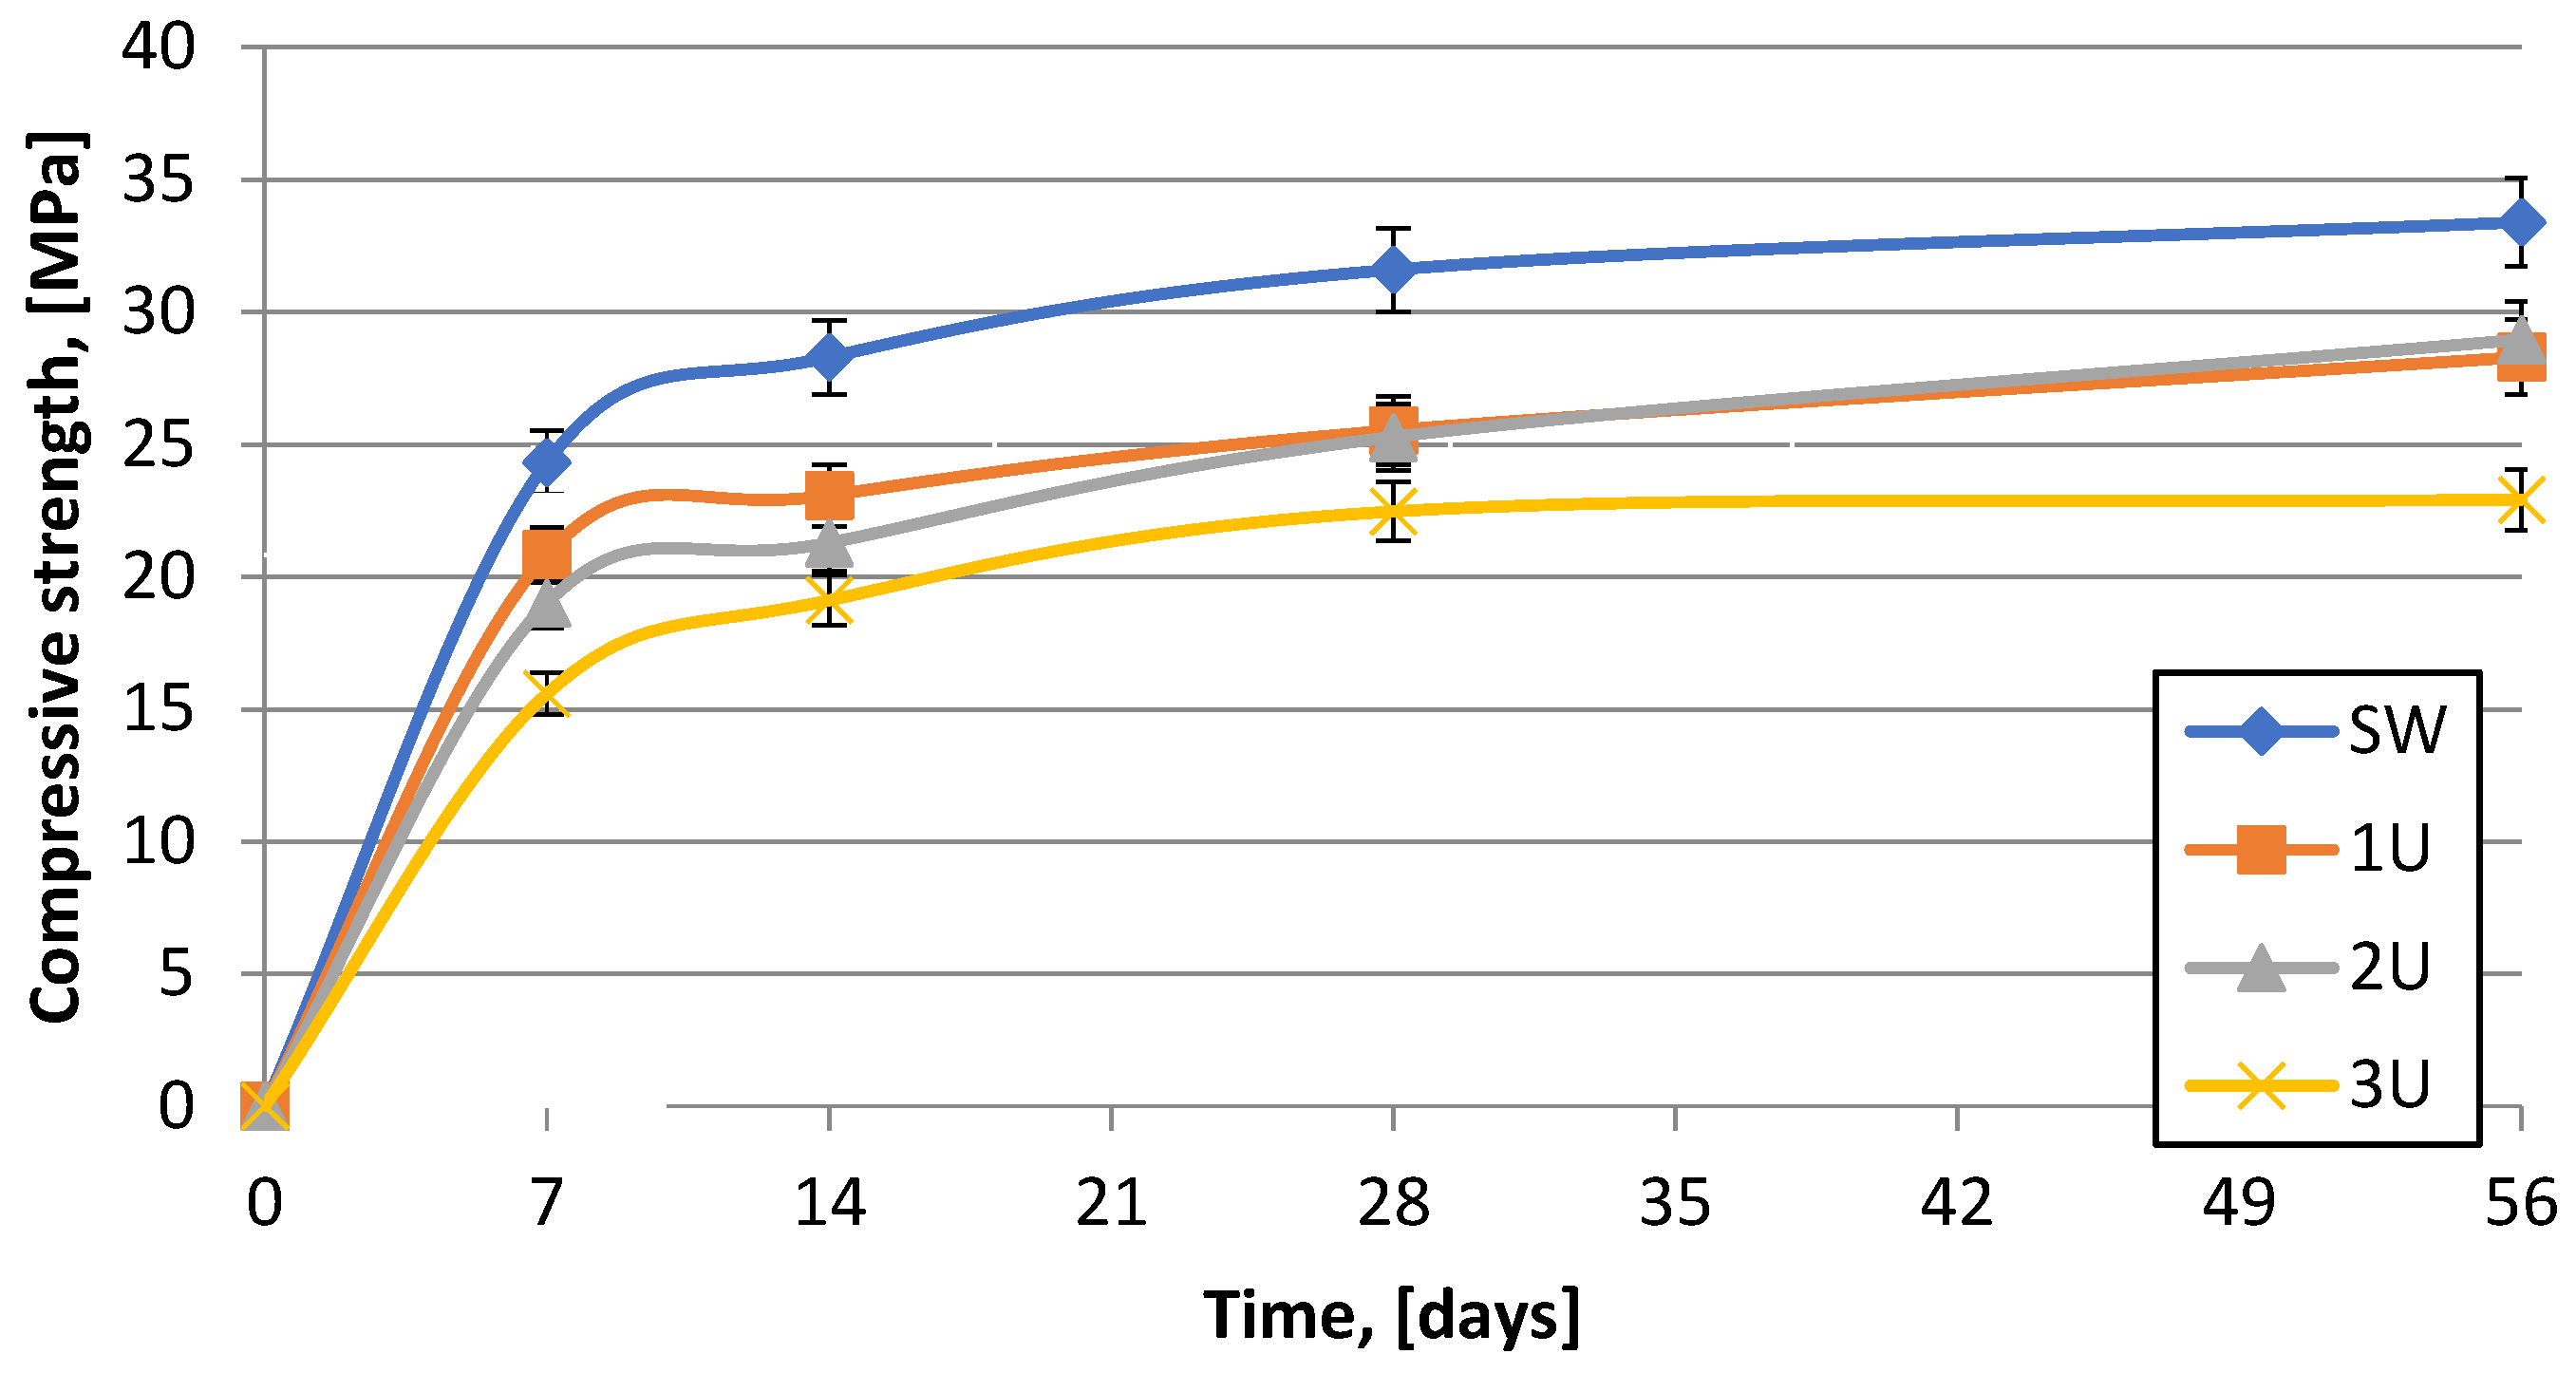
Figure 4.
Average increase in flexural strength of the tested series.
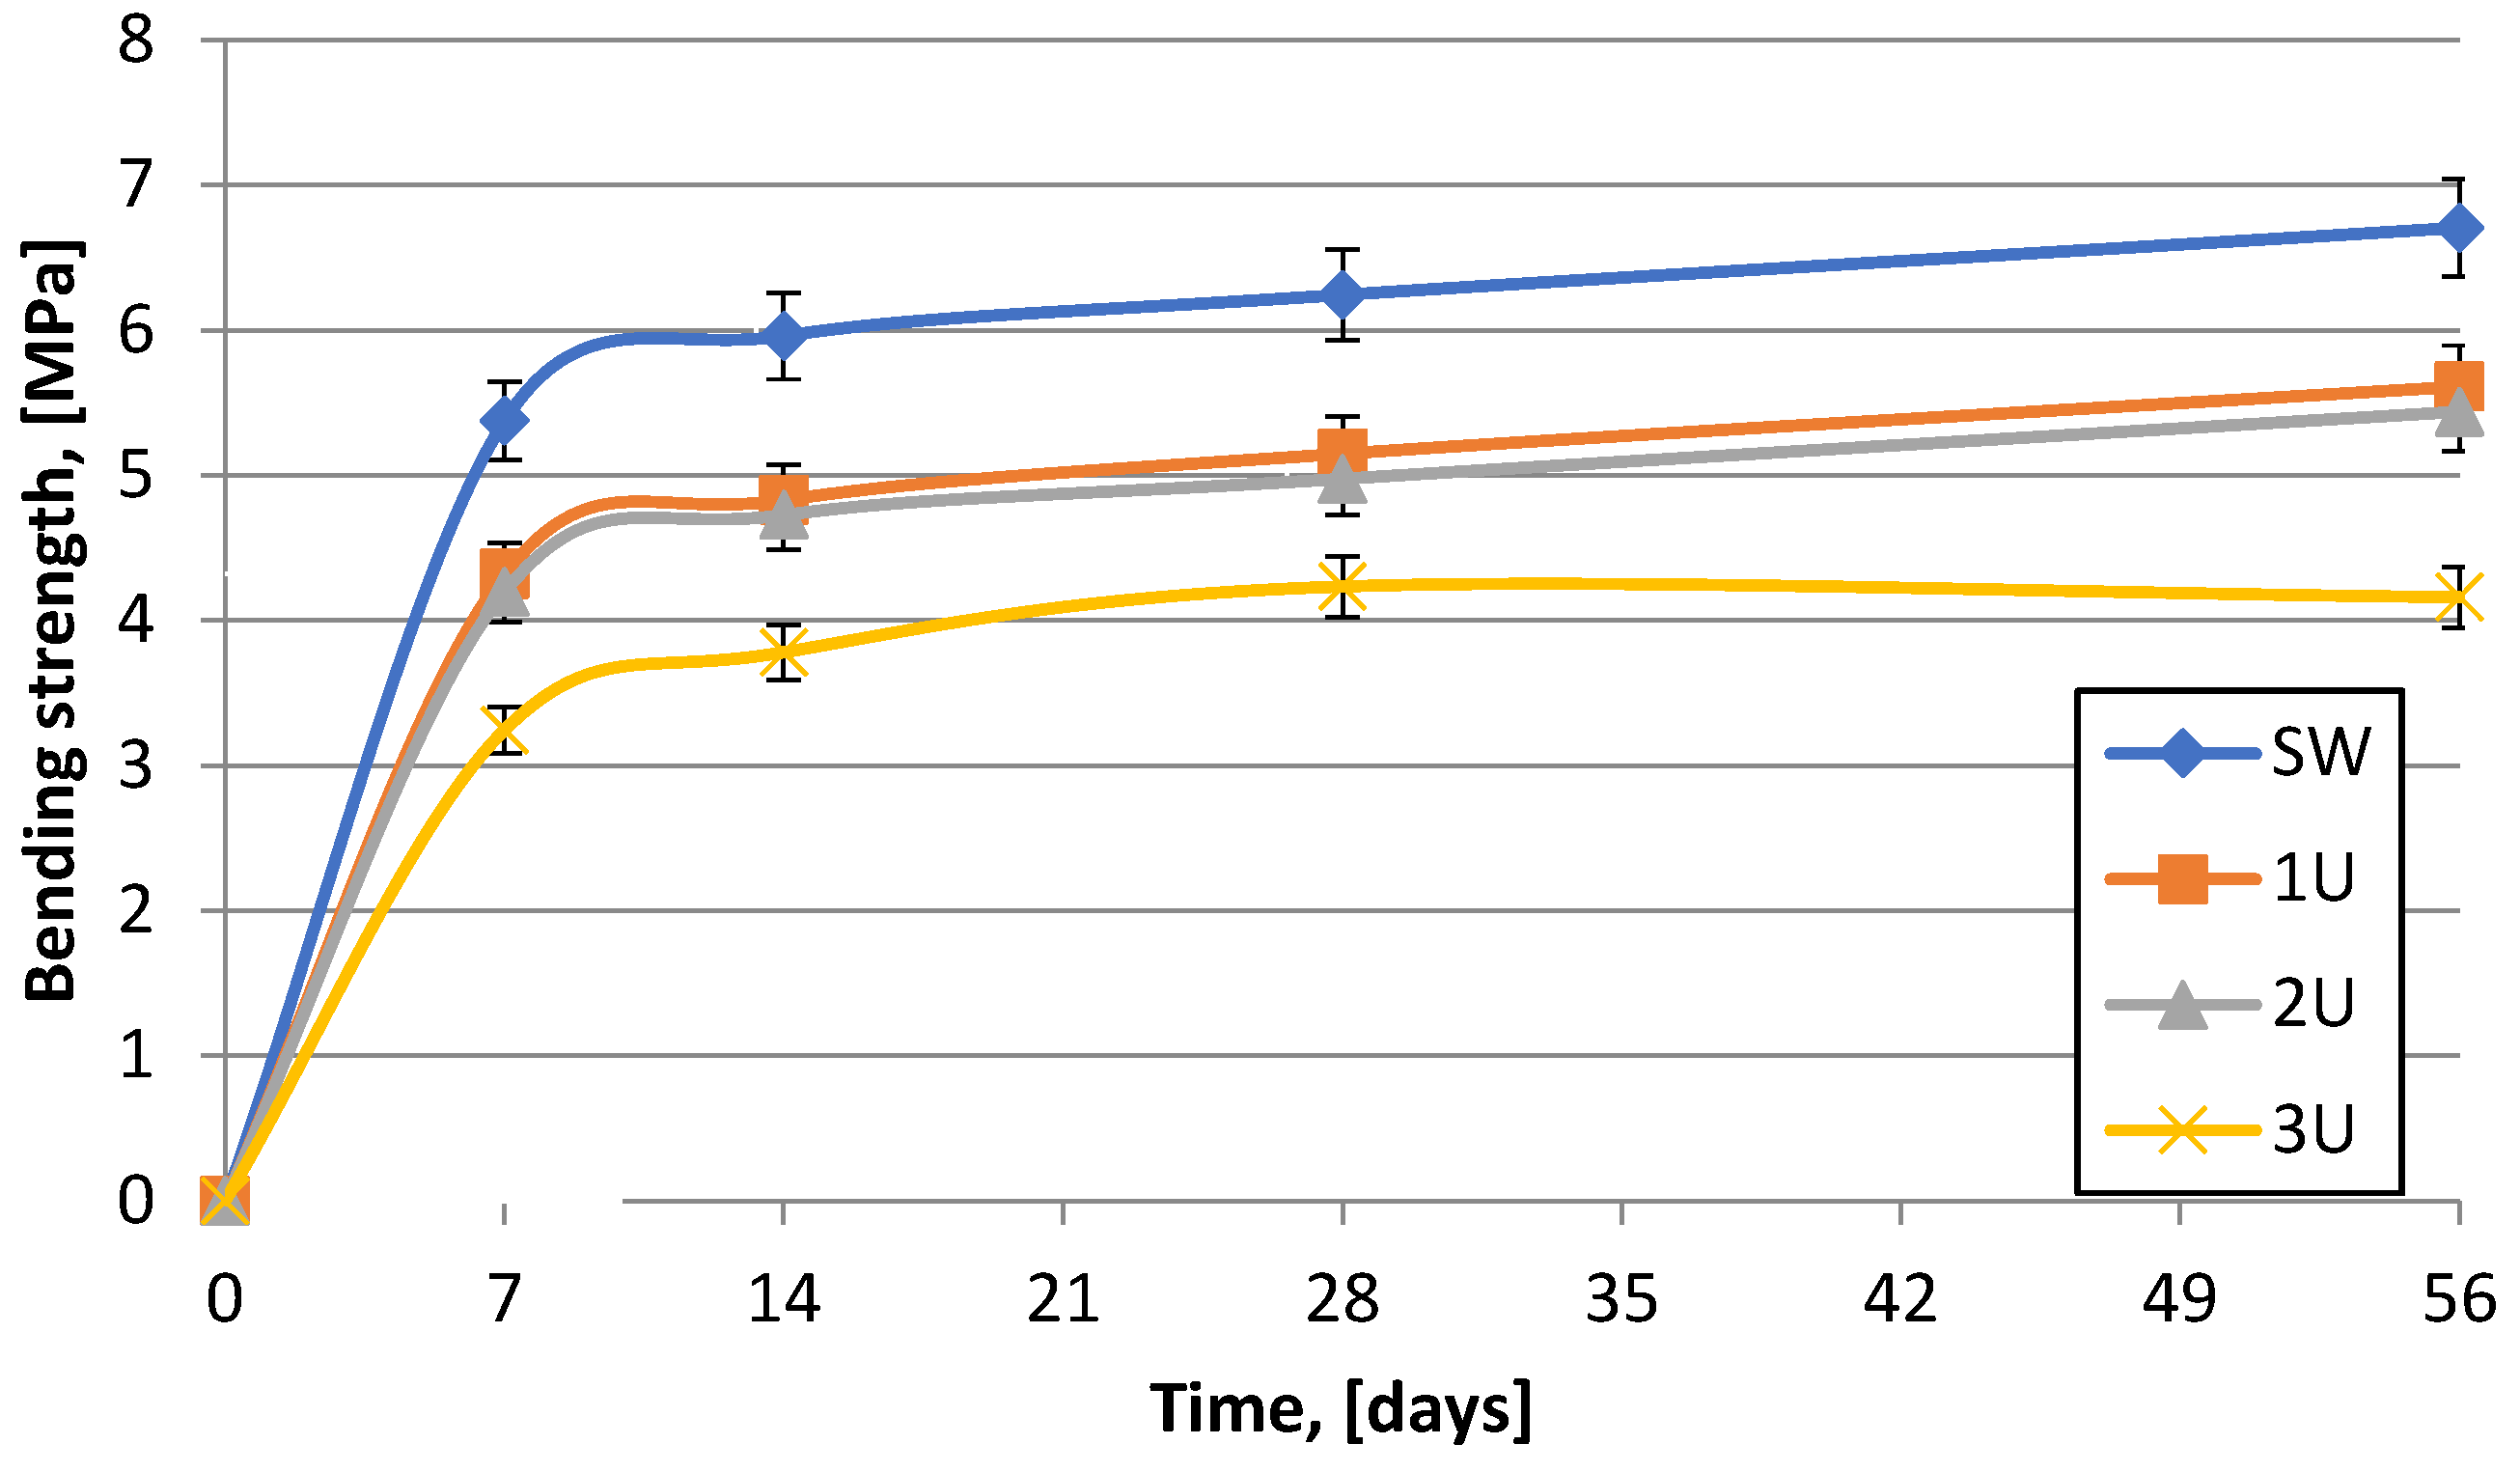
Figure 5.
Weight gain in the capillary rise test of mortars, [kg/m2].
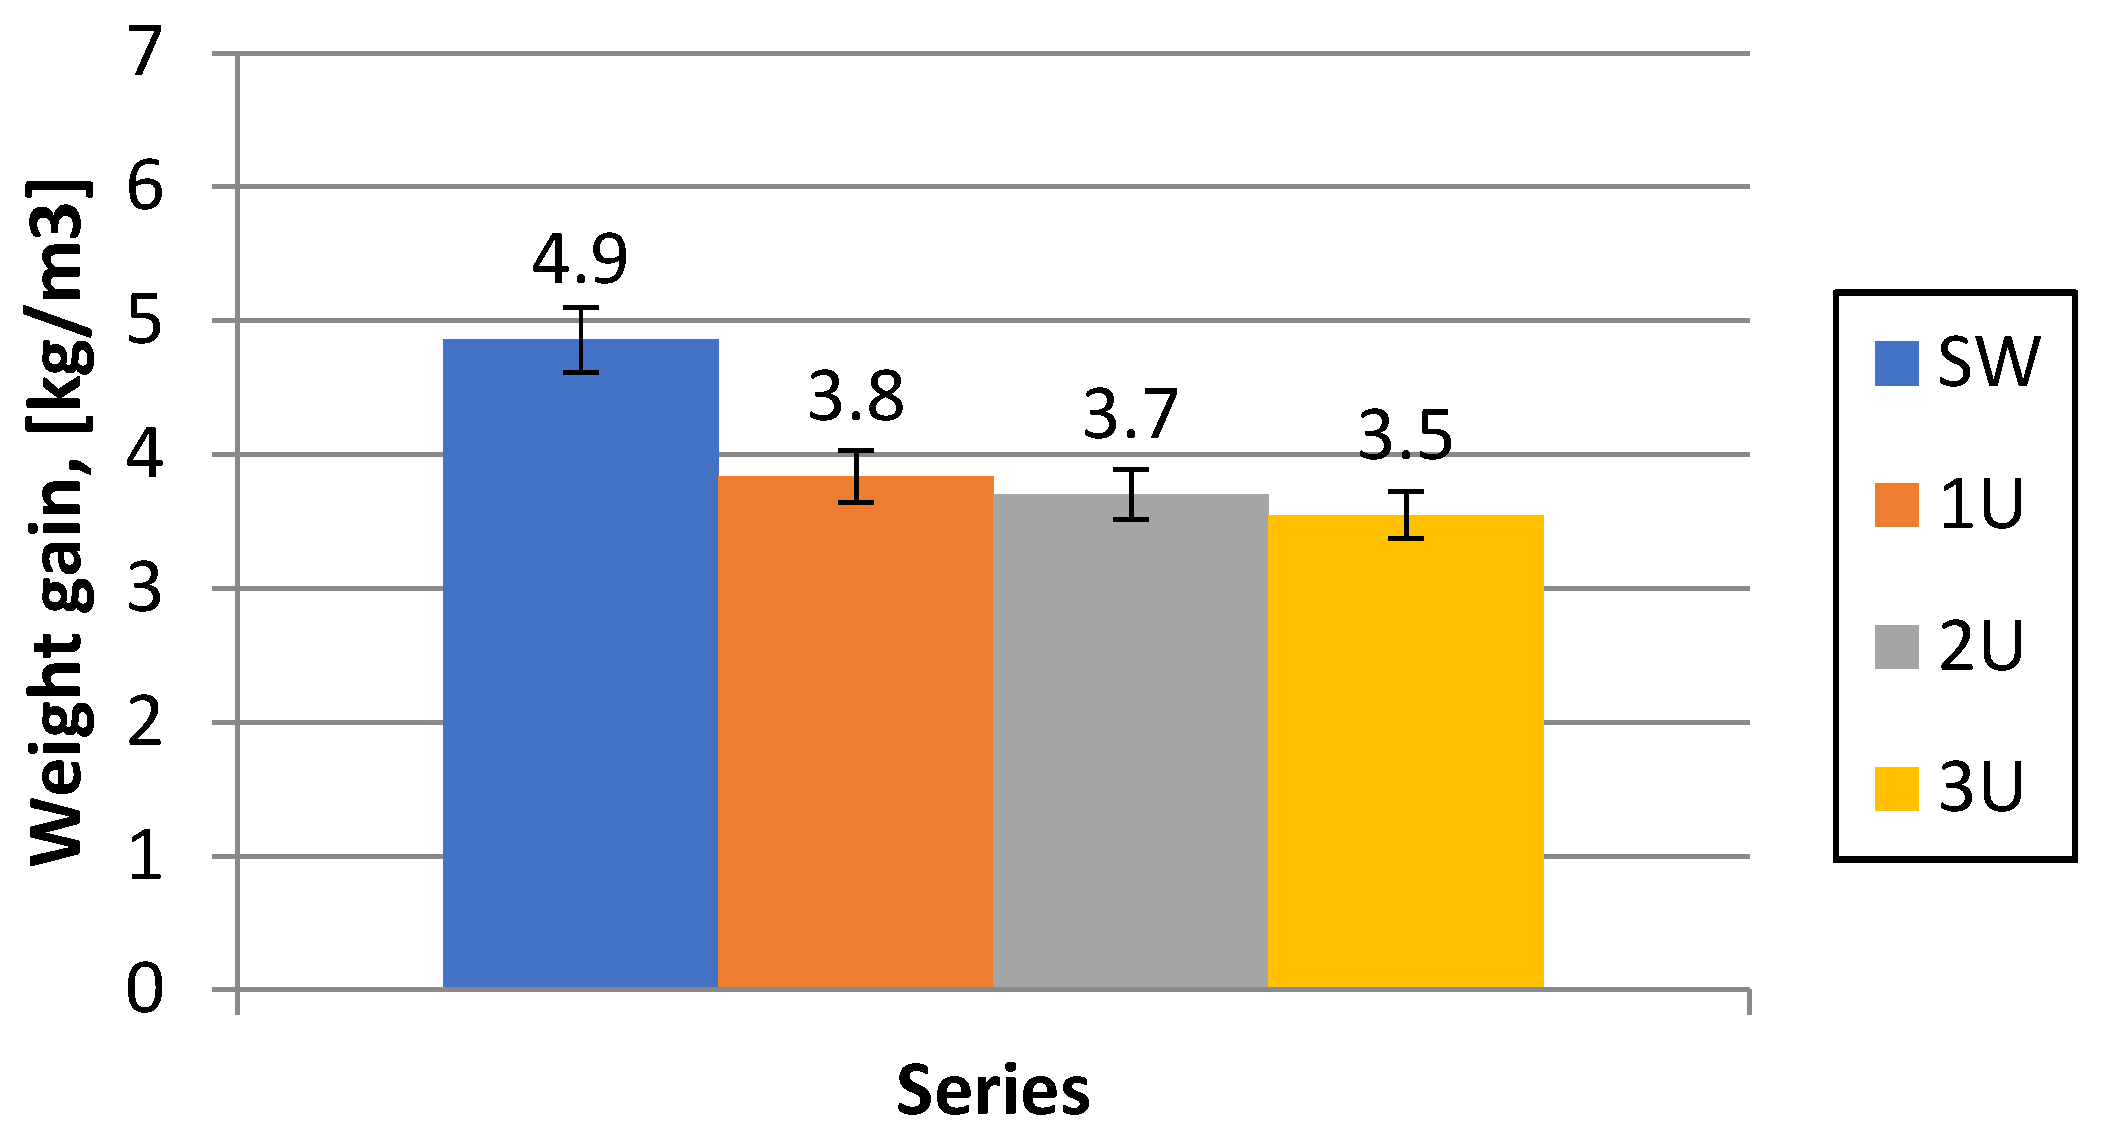
Figure 6.
Weight gain in the mortar absorbency test, [%].
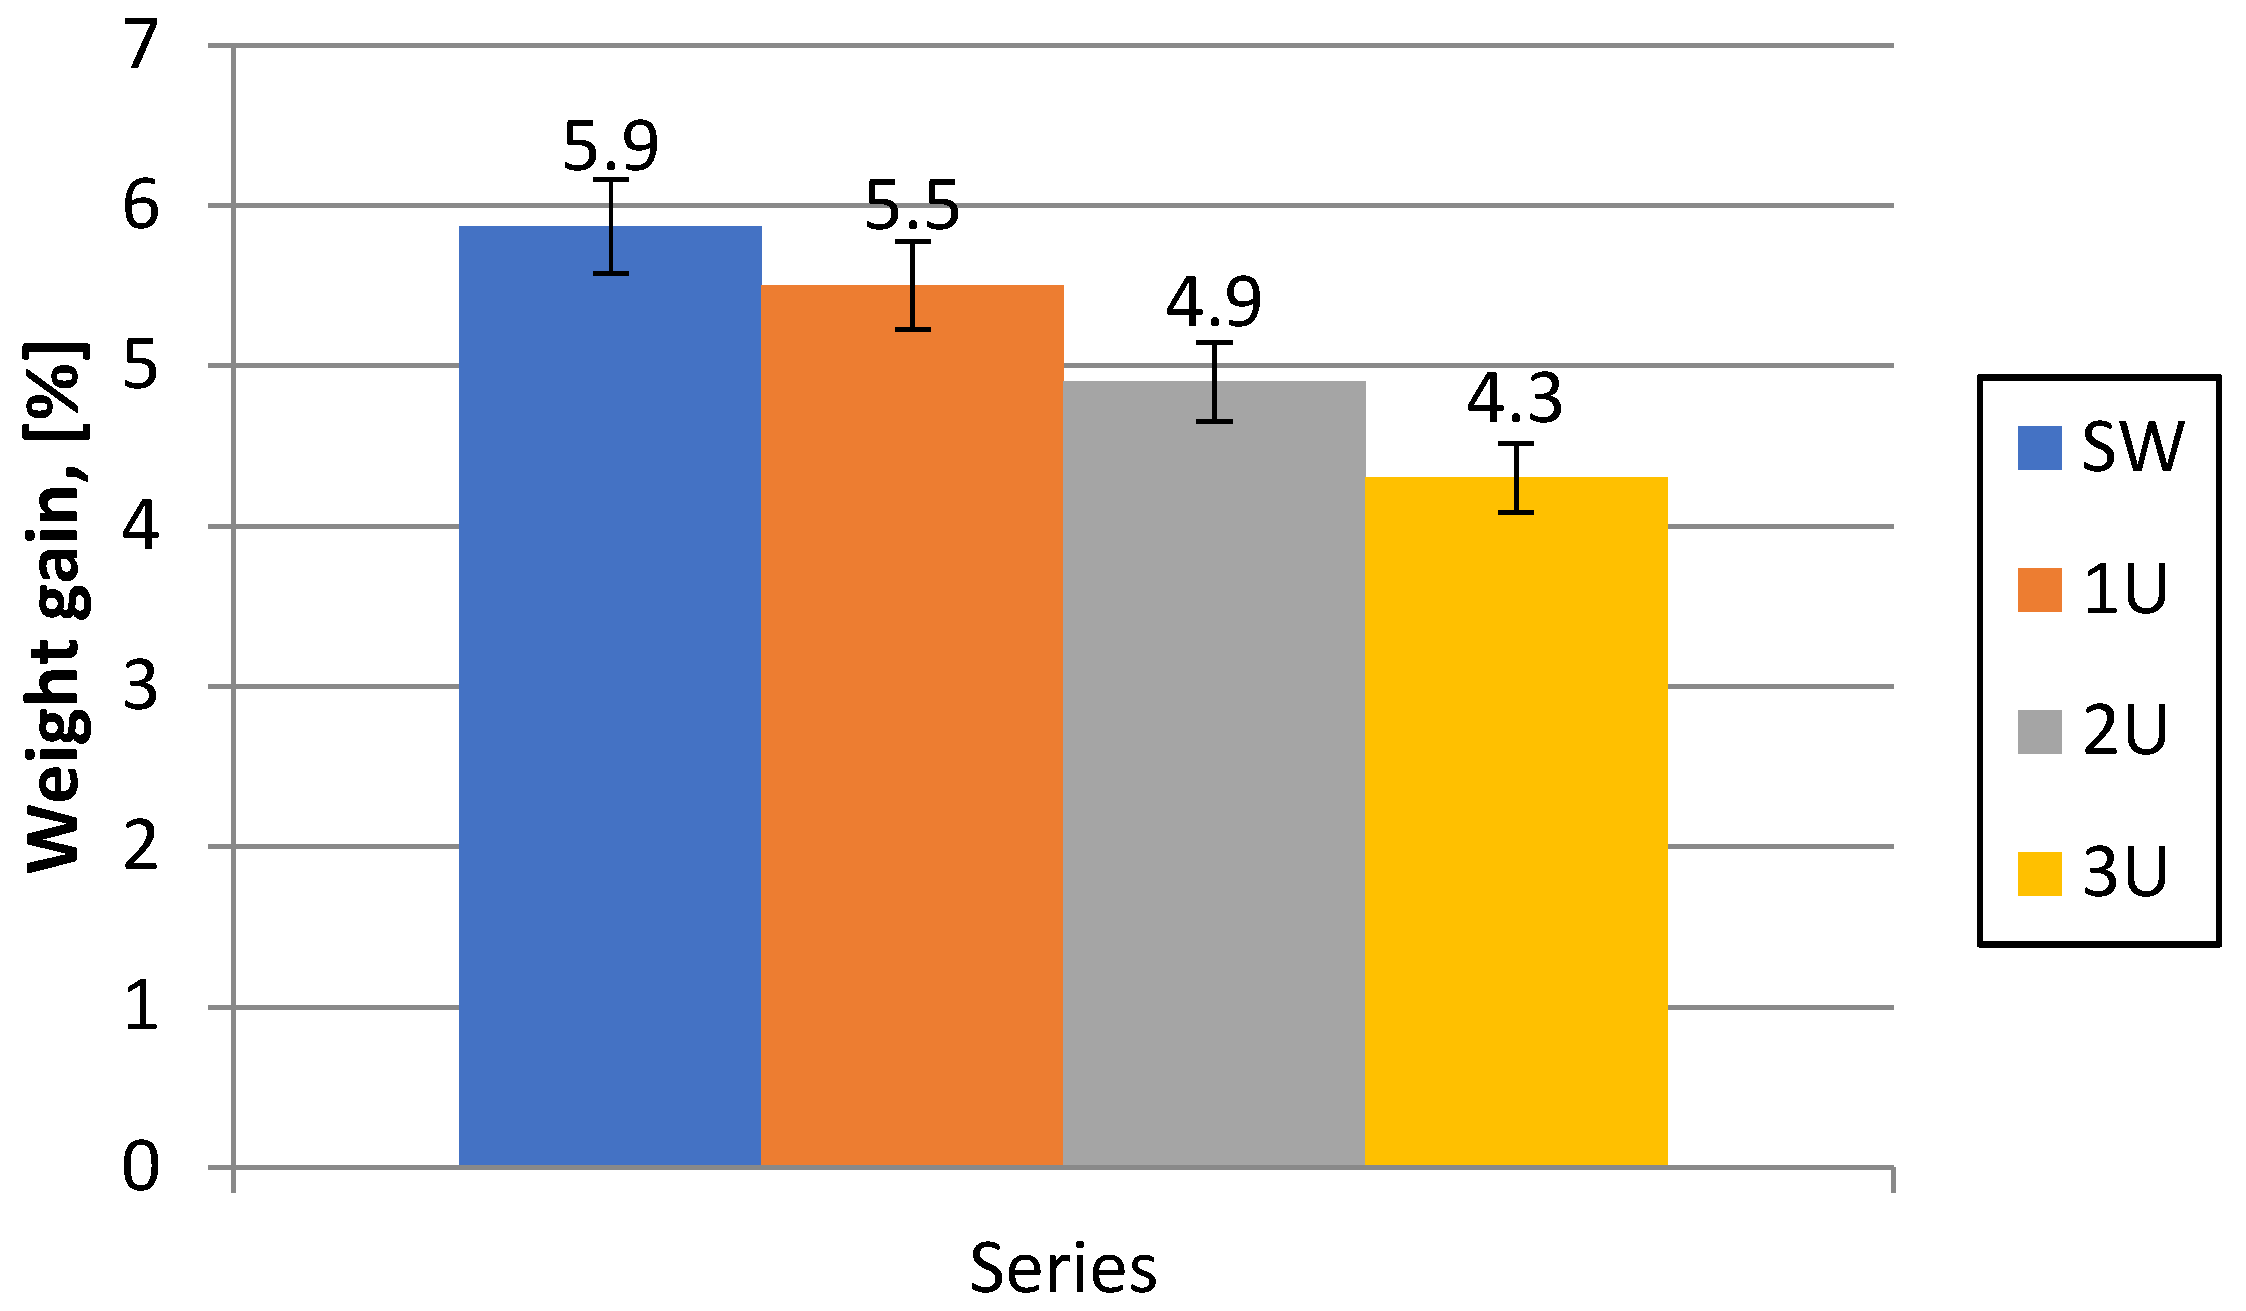
Figure 7.
Percentage of pores in the mortar cross-sections tested.
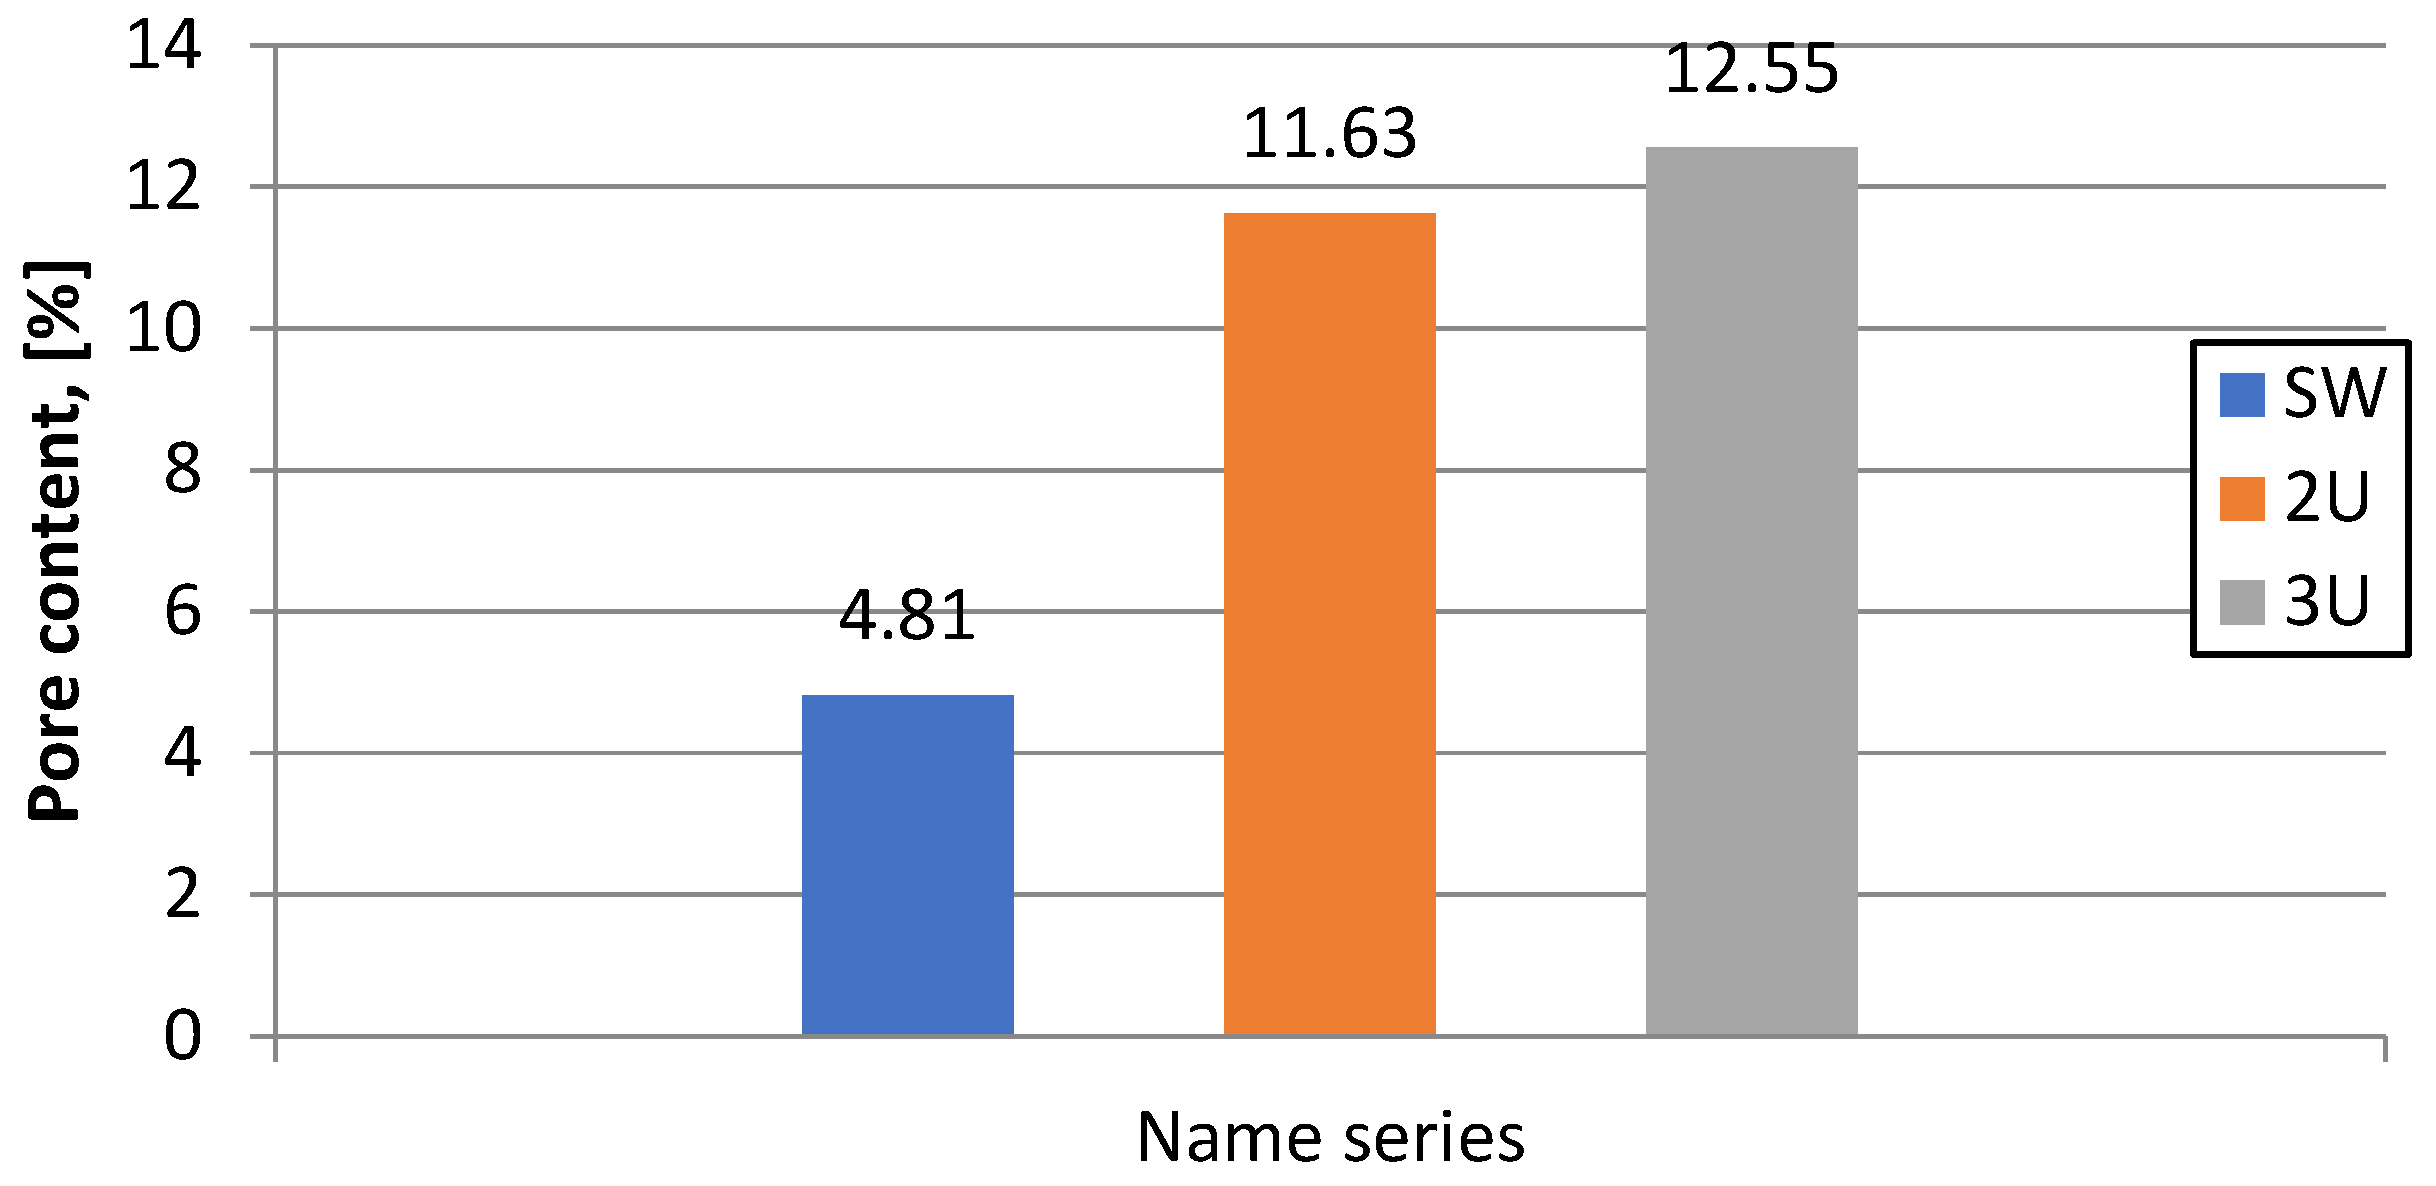
Figure 8.
Percentage share of pores with volumes in the range of 0-10 mm3 in the total pore content in the tested series.
Figure 8.
Percentage share of pores with volumes in the range of 0-10 mm3 in the total pore content in the tested series.
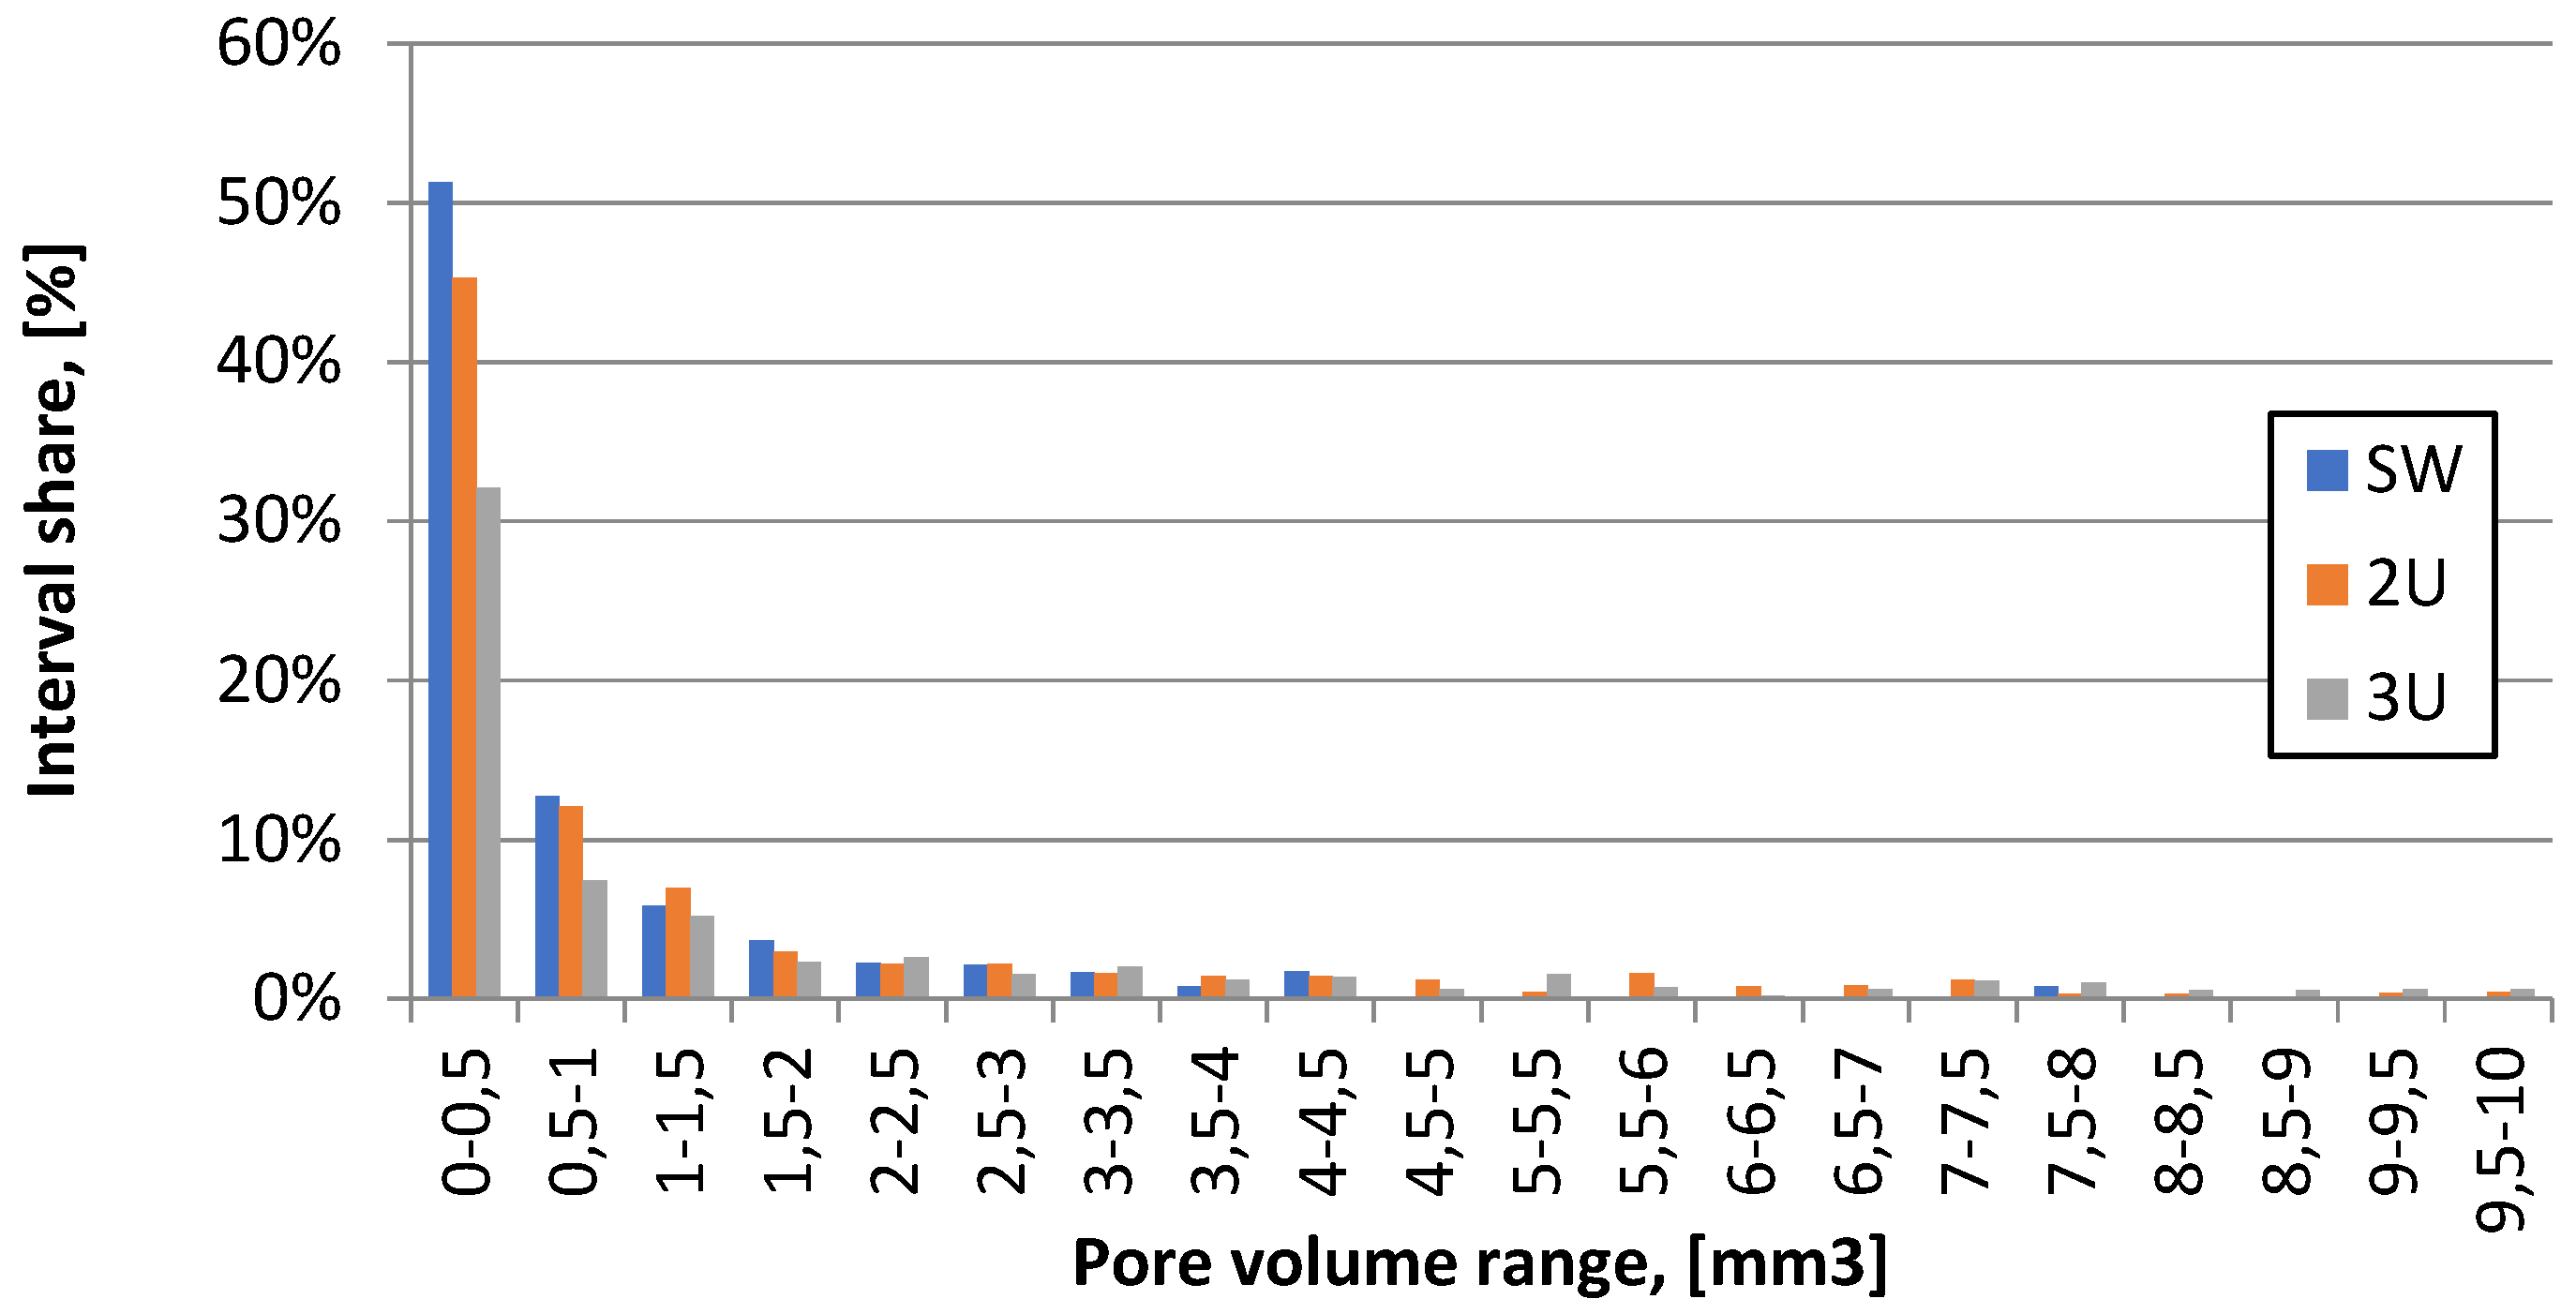
Figure 9.
Microstructure area of mortar SW with analysed points.
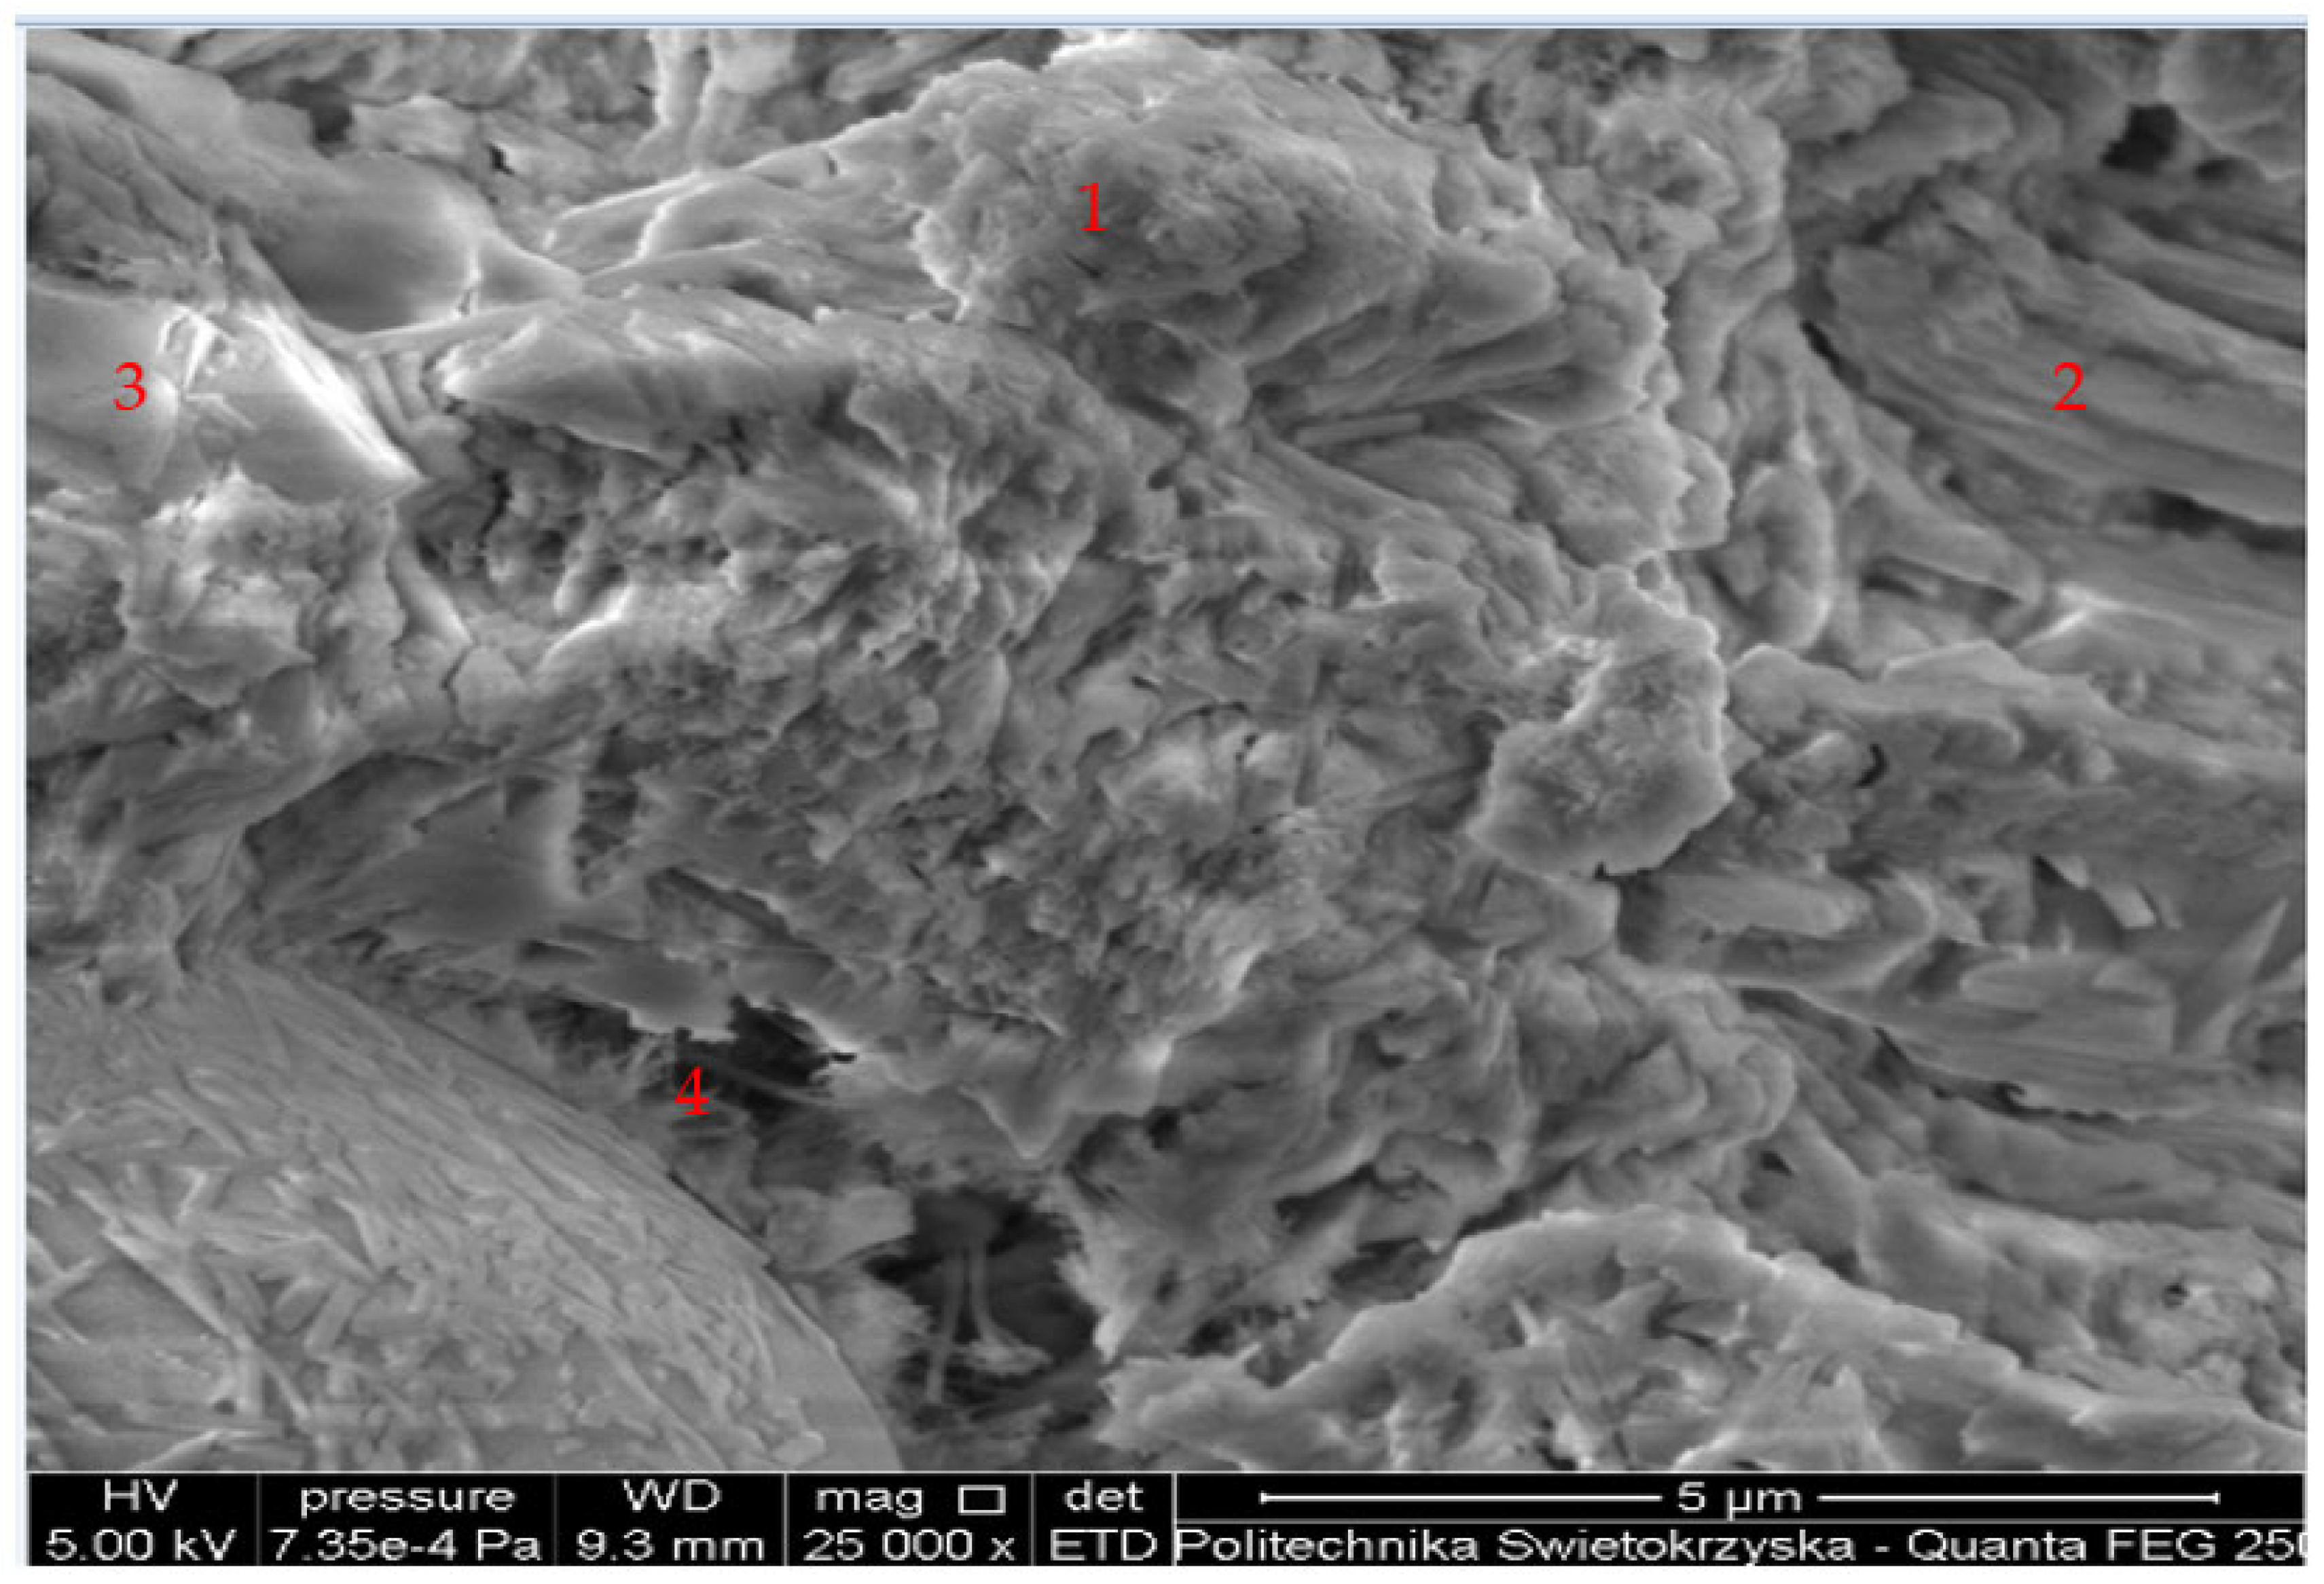
Figure 10.
Chemical composition analysis of the area of points 1-4 of the SW sample.
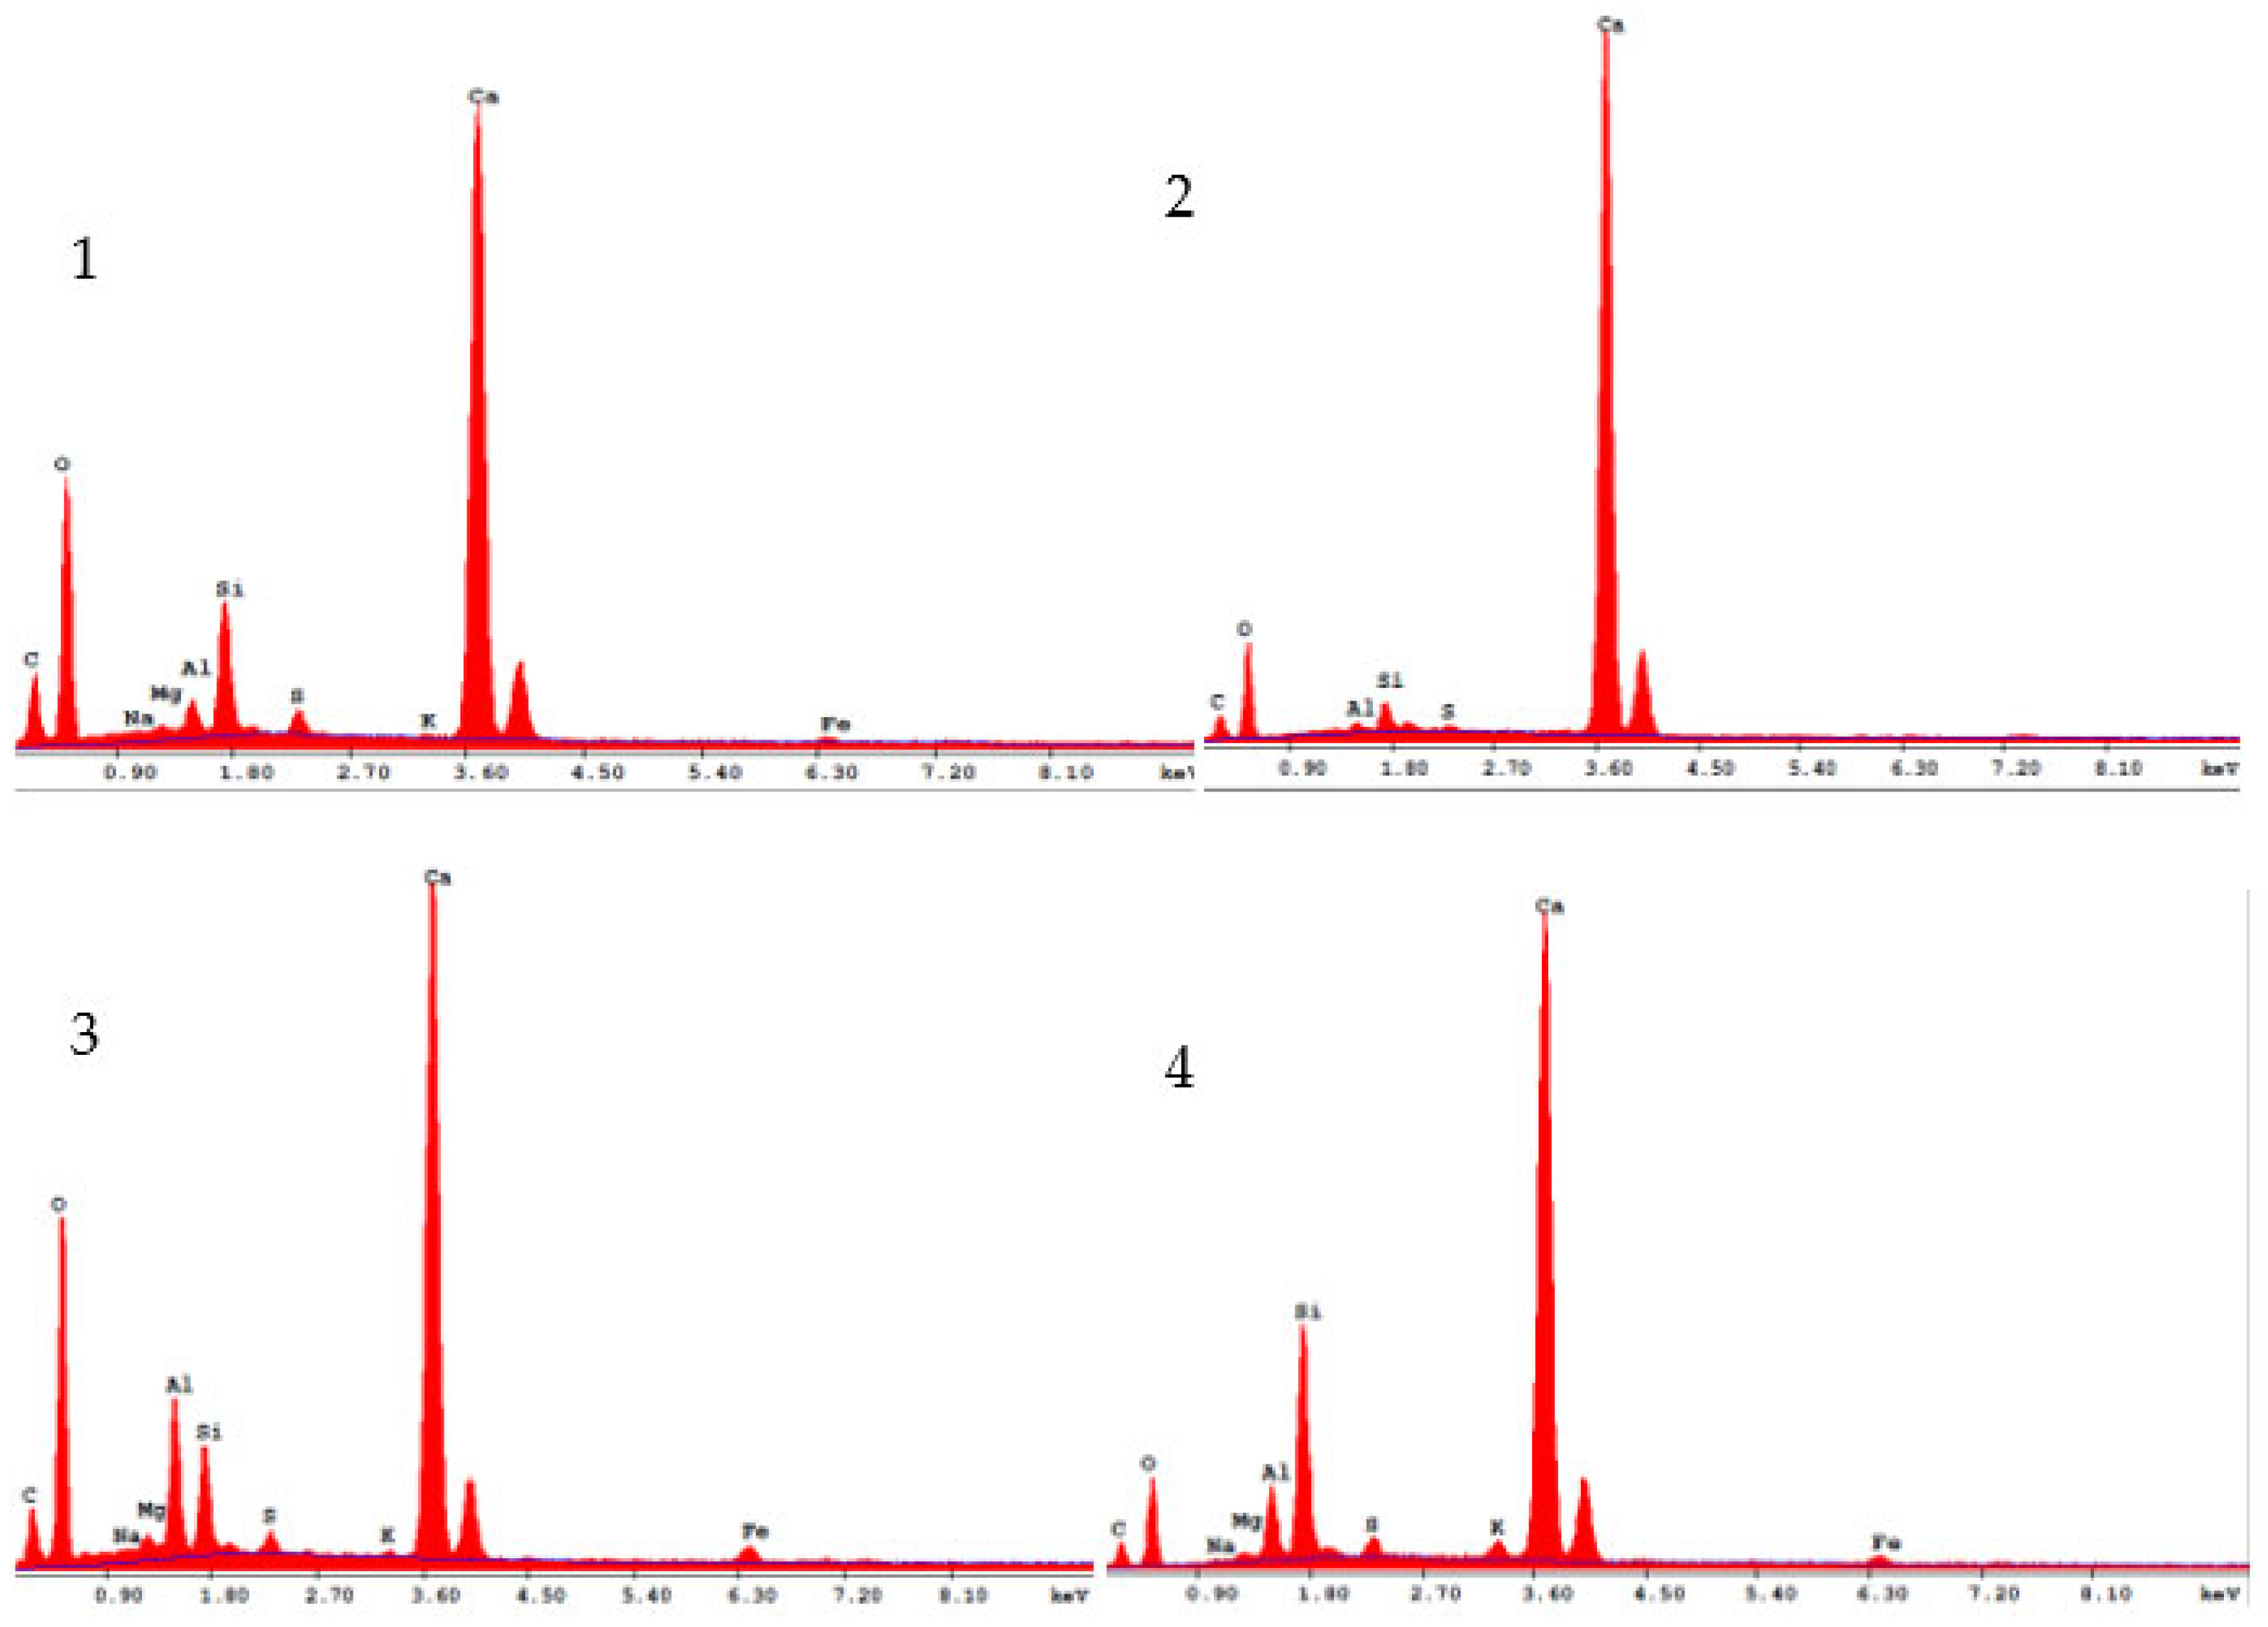
Figure 11.
Microstructure area of mortar 3U with analysed points.
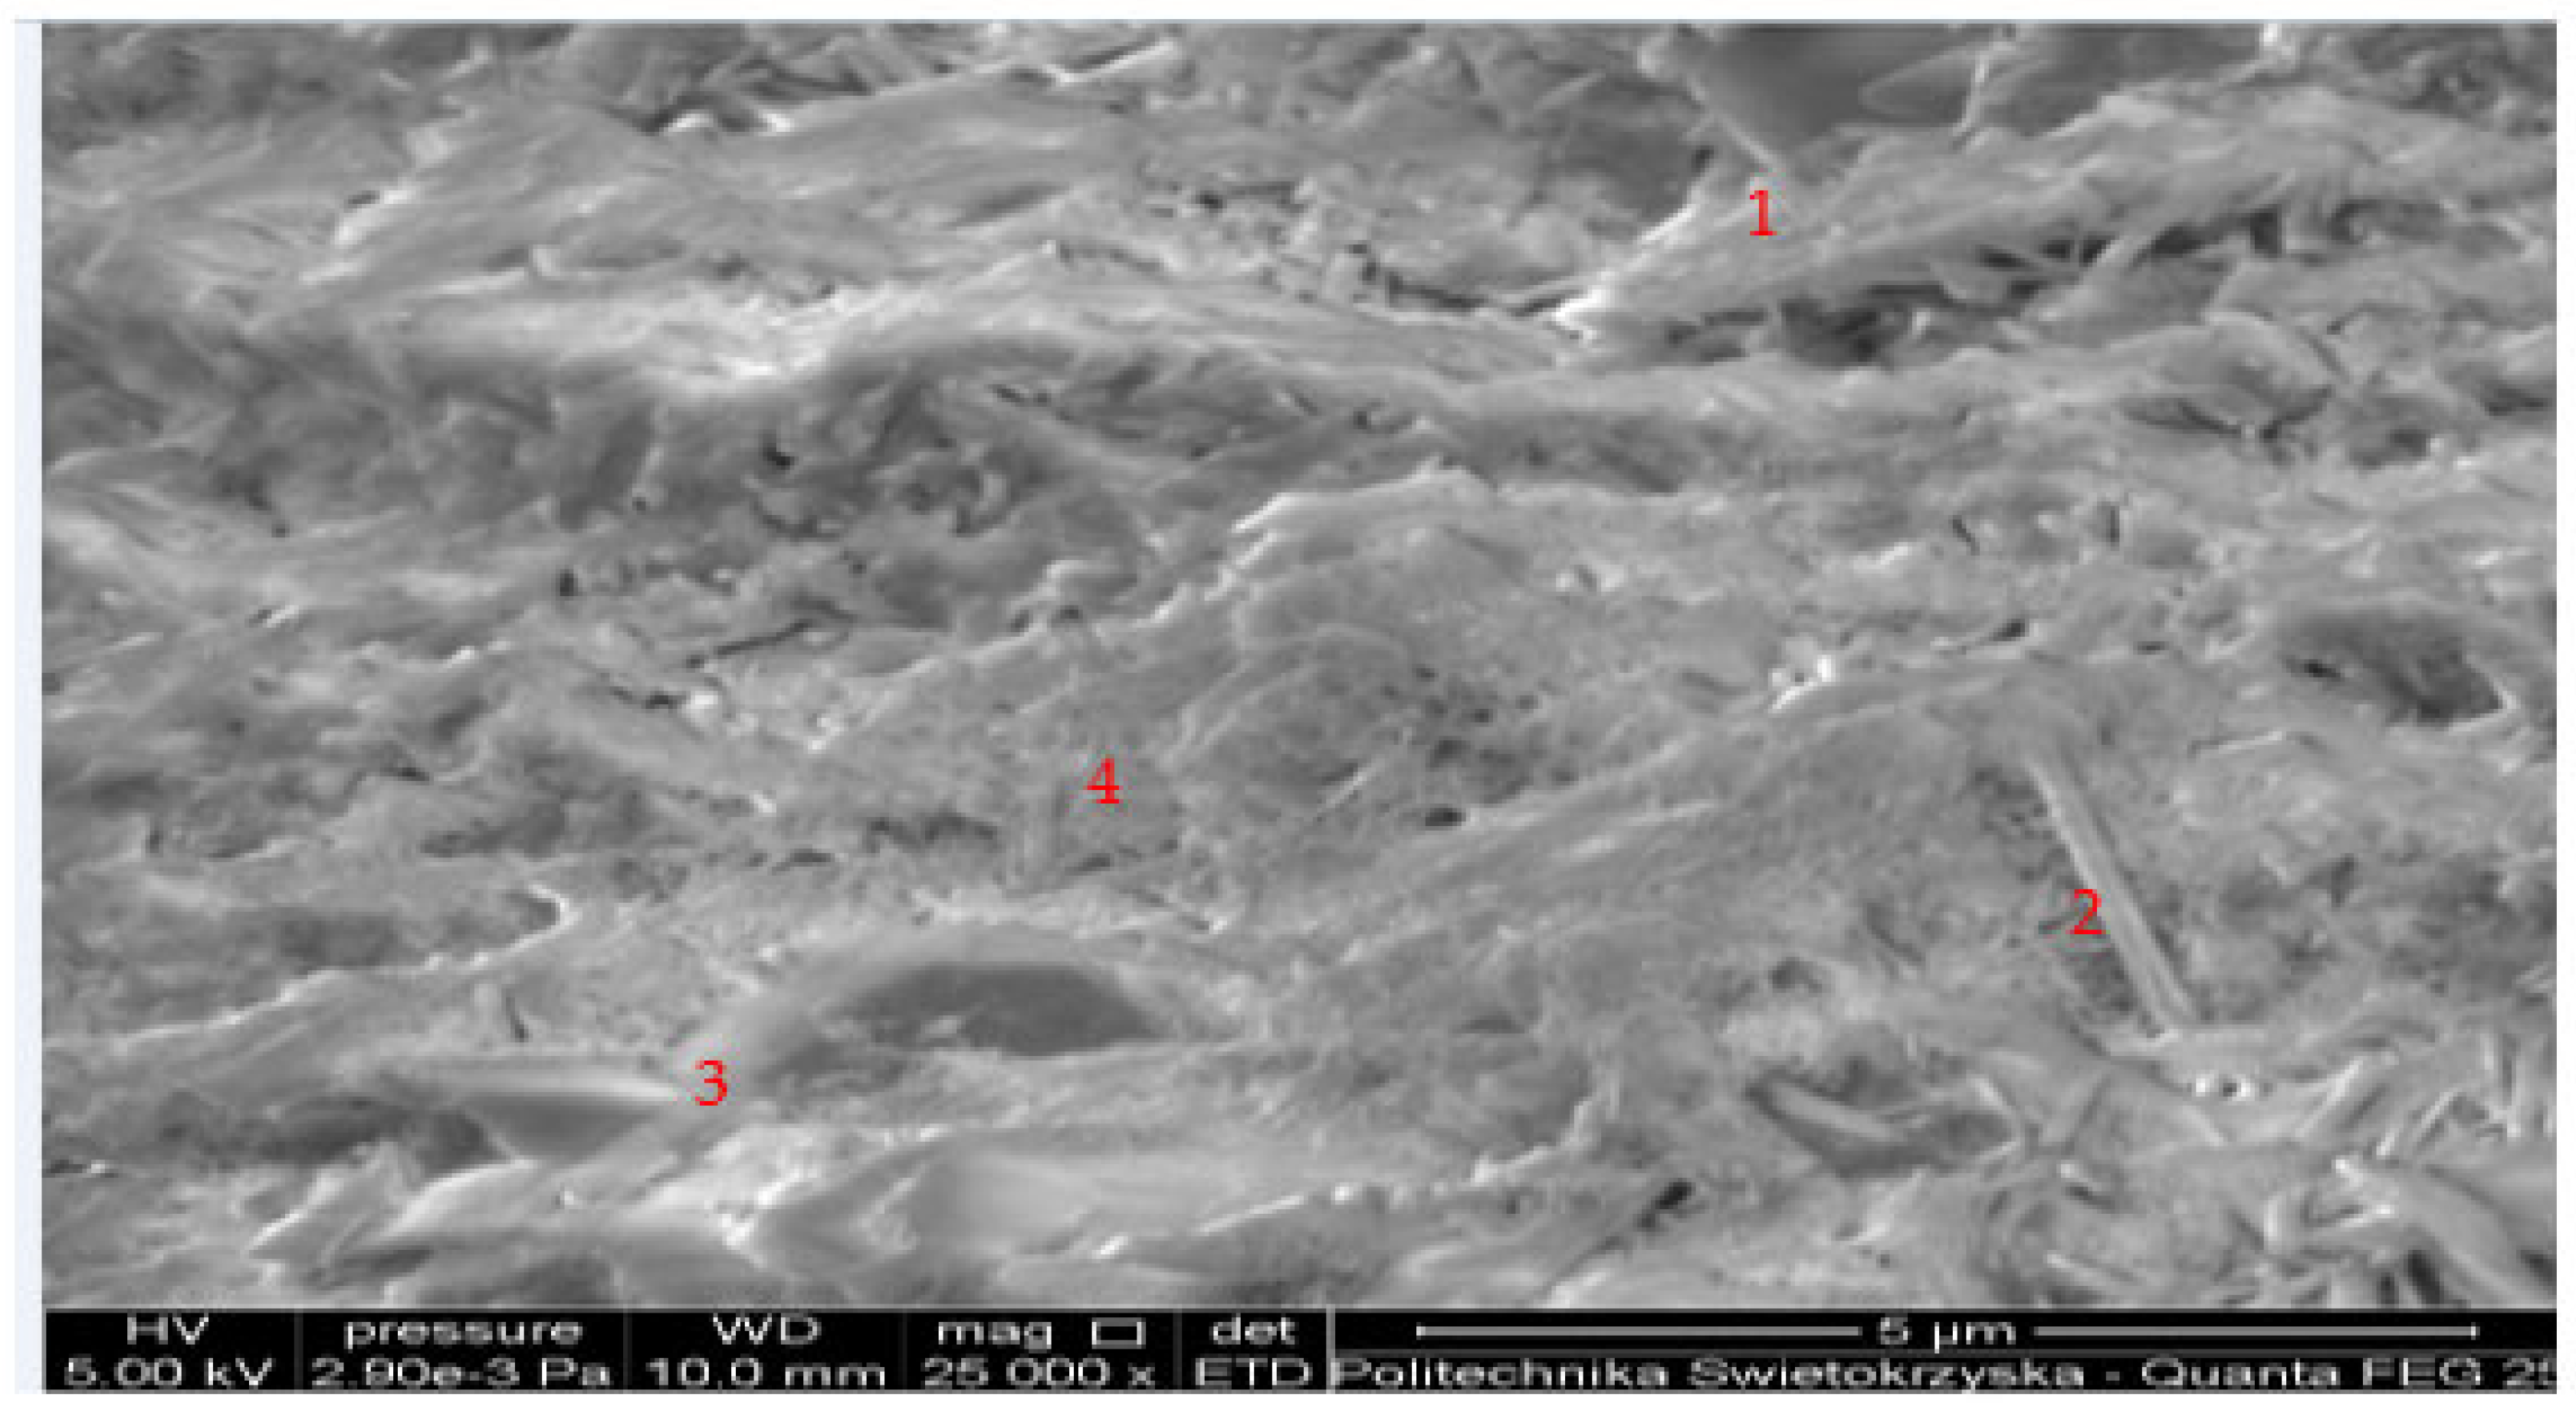
Figure 12.
Chemical composition analysis of areas 1-4 of sample 3U.
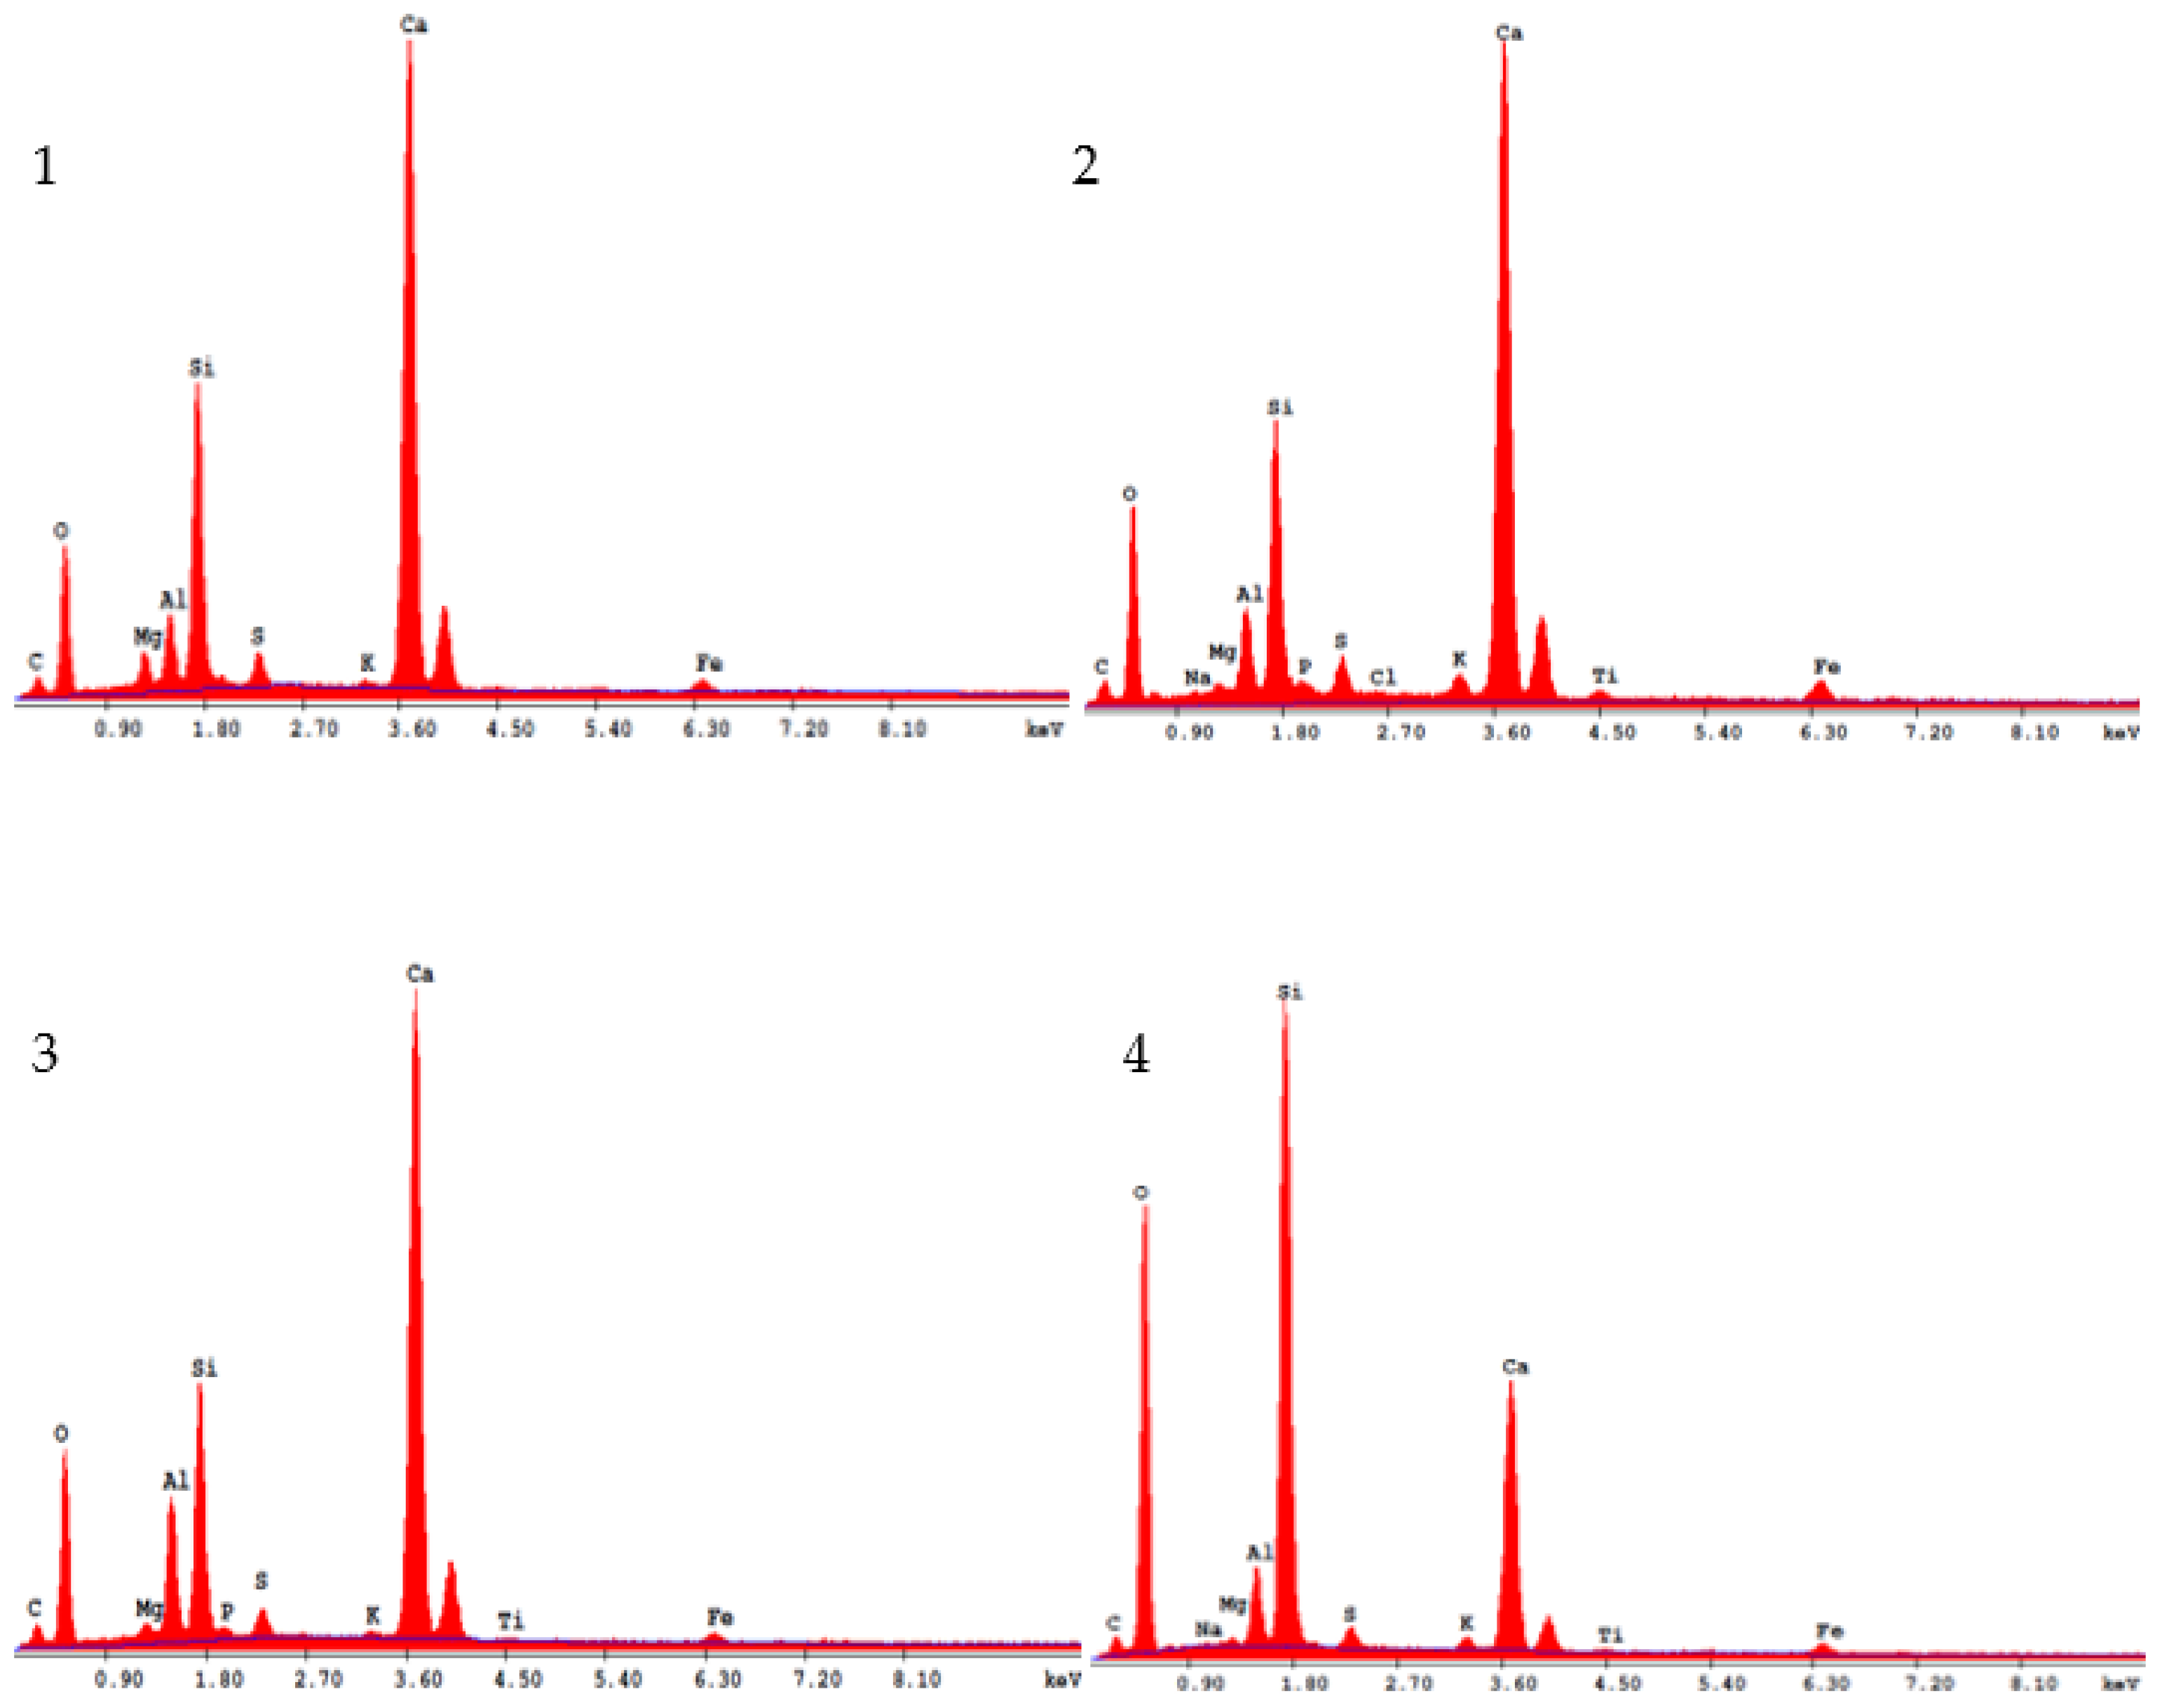
Table 1.
Basic information about the properties of cement [31].
Table 1.
Basic information about the properties of cement [31].
| No. | Name | Chemical composition, % | Specific surface area | fcm, MPa | |||||
| SiO2 | CaO | MgO | Fe2O3 | Al2O3 | cm2/g | R2 | R28 | ||
| 1 | CEM I 42,5R | 19,84 | 63,2 | 2,08 | 2,72 | 4,65 | 4086 | 32,0 | 53,0 |
Table 2.
Slump test results of the mortars tested.
| Series name | Spreading, [mm] |
| SW | 105 |
| 1U | 120 |
| 2U | 125 |
| 3U | 135 |
Table 3.
Bulk density results.
| Series name | Volumetric density, [g/cm3] |
| SW | 2067,4 |
| 1U | 2056,2 |
| 2U | 2013,3 |
| 3U | 1919,7 |
Table 4.
Setting times for the mortars tested.
| Series | Start of Winding, [min] | End of binding, [min] |
| SW | 203 | 323 |
| 1U | 223 | 428 |
| 2U | 230 | 493 |
| 3U | 236 | 518 |
Table 5.
Thermal conductivity of the tested mortars.
| Series name | λ [W/m⋅K] | Standard deviation, [W/m⋅K] |
| SW | 0,959 | 0,05 |
| U1 | 0,899 | 0,03 |
| U2 | 0,795 | 0,02 |
| U3 | 0,761 | 0,02 |
Table 7.
Calculation of tightness and porosity according to PN-76/B-06714, [35].
Table 7.
Calculation of tightness and porosity according to PN-76/B-06714, [35].
| Series | dry mass, [g] | mass in air, [g] | mass on the hydrostatic scale, [g] | V, [cm3] | ƍo, [g/cm3] | ƍ, [g/cm3] | S, [%] | P, [%] |
| SW | 529,84 | 558,29 | 318,6 | 239,69 | 2,07 | 2,16 | 95,8 | 4,23 |
| 2U | 481,24 | 536,57 | 277,88 | 258,69 | 1,88 | 2,11 | 89,3 | 10,72 |
| 3U | 441,62 | 533,04 | 283,75 | 249,29 | 1,73 | 1,94 | 89,0 | 11,03 |
Disclaimer/Publisher’s Note: The statements, opinions and data contained in all publications are solely those of the individual author(s) and contributor(s) and not of MDPI and/or the editor(s). MDPI and/or the editor(s) disclaim responsibility for any injury to people or property resulting from any ideas, methods, instructions or products referred to in the content. |
© 2025 by the authors. Licensee MDPI, Basel, Switzerland. This article is an open access article distributed under the terms and conditions of the Creative Commons Attribution (CC BY) license (http://creativecommons.org/licenses/by/4.0/).
Copyright: This open access article is published under a Creative Commons CC BY 4.0 license, which permit the free download, distribution, and reuse, provided that the author and preprint are cited in any reuse.


