
Submitted:
10 April 2025
Posted:
10 April 2025
You are already at the latest version
Abstract
Urbanization often negatively impacts pollinator abundance and richness; however, its effects on pollination components and plant reproductive success are highly variable. Previous research efforts have also shown geographic and taxonomical bias, with non-insect pollinated plant species in tropical cities underrepresented in the literature. Although bats represent the most persistent mammal group in urban ecosystems, studies addressing the effect of urbanization on chiropterophilous plants are scarce. Here, we addressed the impacts of urbanization on flowering phenology, quantitative and qualitative components of pollination, and reproductive success in the chiropterophilous tree Ceiba pentandra in two major tropical cities of Yucatan Peninsula. We found that urbanization has led to earlier flowering phenology; however, no effect of urbanization was detected in the quantitative and qualitative components of pollination. Finally, the effects of urbanization on the reproductive success of C. pentandra were mixed. While marginally negative effects of urbanization were found in fruit set, positive effects were found in seed germination. Thus, these positive effects may offset the negative impact on reproductive success. These findings suggest that urban pollinators can provide similar levels of pollination services and thus lead to comparable reproductive success in C. pentandra in the forests and cities.
Keywords:
bat pollination
; Ceiba pentandra
; flowering phenology
; pollination components
; reproductive success
; urbanization
1. Introduction
Urbanization is an extreme case of habitat transformation in which the original vegetation cover has been almost eliminated [1,2]. It is therefore one of the land use changes with the greatest impact on biodiversity, species interactions, and ecosystem services [3,4]. Cities now host ca. 50% of the world’s human population, with an increasing trend evident [5]. A fact of concern is that the most rapid rates of urbanization occur in the world’s most biodiverse regions (i.e., tropical areas) of the global south [6,7,8]. Consequently, urbanization in the tropics has a disproportionate impact on local biodiversity [9,10].
Many studies have found that urbanization has detrimental effects on plant and animal populations and communities, in which the main drivers include habitat loss and fragmentation, introduction of exotic species, heat stress, environmental pollution, and an elevated abundance of domestic predators [11,12,13]. Despite the generalized biodiversity loss due to urbanization, some species populations may persist in cities and provide important ecosystem services such as pollination [14,15,16]. Around 87.5% of seed plants rely on animals for sexual reproduction, a value that reaches 94% in the tropics [17]. Moreover, 75% of crop plant species rely to some extent on animal pollination [18]. Urban pollination has recently gained interest because this interaction is critical for the reproduction of plants in this novel ecosystem [16] and because urban outdoor agriculture can contribute to the food security of the local inhabitants, particularly in developing countries [19,20].
The prevailing environmental conditions in urban ecosystems are inhospitable for most pollinators and the fast rates at which urban drivers occur could prevent their adaptive response [16,21]. Habitat loss may affect pollen flow and deposition via modifications in pollinator foraging behavior [12]. Moreover, some pollutants may impair the health and behavior of plants [22], as well as that of their pollinator partners [16]. Artificial light at night also affects the pollinators’ visual perception of flowers and acts to increase predation risk which, as a result, may negatively impact the reproductive success of plants, particularly in those nocturnally-pollinated [23,24]. The heat island effect is a pervasive phenomenon in cities around the world. In addition to constituting a source of stress for plants and pollinators [22], it often leads to earlier blooming of plants, which could in turn desynchronize plant-pollinator interactions [25]. Pollinators that persist in cities often employ opportunistic strategies such as broad diets and can utilize exotic plants as food resources and/or use anthropogenic habitats for refuge and/or nesting sites [16,26]. Identification of such species and the resources they use, as well as the manner of use, is critical since it could allow the effective design of pollinator-friendly cities [26,27].
The effect of urbanization on pollinators and pollination services has been the subject of recent reviews e.g., [15,26,28,29]. However, most of these have focused on communities of insect pollinators, particularly bees e.g., [15,28,30]. The multi-taxa reviews available suggest that urbanization has an overall negative effect on different groups of pollinators [14,26,29]. However, these reviews also coincided in that there is a clear taxonomic bias, with bees overrepresented and bats poorly/unrepresented, as well as geographic bias since most studies were conducted in temperate cities [14,26,29]. Therefore, more studies in tropical cities, where pollination systems are more specialized and non-insect pollinators have a greater contribution to plant reproduction, are therefore urgently required [29,31]. On the other hand, there is no clear trend regarding the effect of urbanization on the different components of pollination and the consequences on plant reproductive success [29]. This lack of a consistent effect could be the result of the many forms in which these variables are measured [4,29]. For example, in the most recent meta-analysis on the topic, no effect of urbanization was detected for pollinator visitation rate or fruit set, while a negative effect was found for seed set [29]. The effects of urbanization on pollinator services should therefore be assessed in terms of several pollination components (e.g. visiting rate, pollen deposition) and different aspects of reproductive success (fruit & seed set) since these components could be affected differentially.
Bats pollinate more than 500 plant species in tropical and subtropical regions. Some of these species are dominant elements of plant communities or valuable crop plants [32,33]. The dependence of chiropterophilous plants on bats is high; i.e., it is estimated that fruit/seed set may drop 83% on average with the exclusion of bats [33]. Bats also represent the most diverse group of mammals remaining in urban ecosystems [13]. Phytophagous bats seem to thrive in urban ecosystems, mainly due to their facultative diet that can include the fruit and nectar of native and exotic plants and occasionally insects [13,34]. Bats can thus provide valuable pollination and seed dispersal services (some bat species provide both services) in urban ecosystems [32,35]. However, accurate assessment of pollination and other services provided by bats in urban ecosystems is rare and is often simply inferred from the observation of bat visits [35].
Here, we addressed the effects of urbanization on flowering phenology, pollination services and plant reproductive success in a chiropterophilous tree, Ceiba pentandra. The study was conducted in two major tropical cities of the Yucatan Peninsula. In this region, C. pentandra is native and commonly found in urban green areas. Given the complexity of the pollination process, we assessed the impact of urbanization on quantitative (visitation rate) and qualitative (pollen deposition) components of pollination as well as on different aspects of the reproductive success (fruit and seed set, as well as seed germination). Our specific research question was: What are the effects of urbanization on flowering phenology, pollination components and reproductive success in C. pentandra? Given the variety of stressors found in the city that may affect the activity of pollinators, we predicted a decreased visiting rate of pollinators and lower pollen load size, which could lead to reduced reproductive success. An earlier flower phenology in the city was also predicted given the warmer temperatures commonly found in these ecosystems [25].
2. Results
2.1. Flowering Phenology
At the population level, apart from Merida in 2022 (Figure 1A), flowering started 3-18 days earlier in the city than in the forest (Figure 1 B-D). Similarly, the population flowering peak occurred consistently earlier in the city than in the forest (Figure 1). With the sole exception of Merida in 2022 (Figure 1A), the flowering season lasted longer in the city than the forest (Figure 1 B-D). However, these differences in flowering duration between the city and forest were variable: 7 days in Cancun, 9 days in Merida in the year 2023, and 21 days in Cancun in the year 2022 (Figure 1). In Merida and Cancun, the population flowering season finished 15 and 18 days earlier, respectively, in the forest than in the city (Figure 1A&B). However, the opposite was true in 2023 (Figure 1C&D), in which the flowering season finished 27 and 30 days earlier in the city than in the forest in Merida and Cancun, respectively. The phenological overlap index (POI) between city and forest populations was 0.95 in Merida and 0.88 in Cancun during the year 2022 but was 0.61 in Merida and 0.68 in Cancun during the year 2023.
At the individual level, flowering onset also occurred significantly earlier in the city (day 32.16±1.33 [mean values±1SE]) than in the forest (day 45.45±1.61), regardless of site or year (Table 1). Flowering onset also varied significantly between sites (Merida: 40.22±1.16; Cancun: 36.23±1.92) and years (2022: 32.72±1.74; 2023: 43.43±1.27); however, there was no significant interaction between these factors and urbanization (Table 1). Significant variation in flowering duration was found between years (2022: 41.14±1.74 days; 2023: 33.53±1.27 days). Moreover, the interaction urbanization x year was significant for this variable (Table 1); i.e., flowering of the trees lasted longer in the city than in the forest in 2022. However, the opposite trend (i.e. longer duration in the forest than in the city) was found in 2023 (Figure 2A). Termination of flowering occurred significantly later in the forest (Julian day 81.49±1.46) than in the city (Julian day 70.45±1.44), and was also significantly variable between sites (Merida: 79.15±1.57; Cancun: 71.93±1.48) and years (2022: 73.86±1.64; 2023: 76.96±1.49) (Table 1). Finally, the interaction urbanization x year was significant in the year 2023 (Table 1), with differences in terms of flowering termination found between trees in the forest and city. However, this was not the case in the year 2022 (Figure 2B).
2.2. Floral Biology and Rewards
Regardless of habitat and site, the flowers opened early in the night (ca. 1900 h) and were found to contain some nectar at that time (Figure 3A&B). Pollen dehiscence occurred shortly (ca. 30 min) after anthesis and nectar production also peaked immediately after anthesis (Figure 3A&B). No significant differences were observed between city and forest or between sites in terms of the onset or peak of nectar production (Figure 3 A&B). Both nectar volume (Figure 3A&B) and concentration (Figure 1C&D) were greater early in the night and steadily decreased as the night progressed. The lowest nectar volume (Figure 3 A&B) and concentration (Figure 3 C&D) occurred during the morning of the following day (1000 -1100 h). Lower nectar volume was observed in the forest than in the city during the morning in both sites (Figure 3 A&C); however, these differences were more evident in Cancun than in Merida (Figure 3 B&D). Nectar concentration was similar between the forest and the city most of the time; however, flowers in the city trees produced slightly more dilute nectar from 0300 to 0700 h in Merida and Cancun (Figure 3 C-D). In both the forest and city, the flowers remained open and the stigmas were apparently receptive (bright and turgent) by 1100 h-1200 h, with no significant difference between Merida and Cancun. Regardless of habitat or site, corolla dehiscence occurred between 1200 and 1300 h.
3.3. Pollination Components
While pollinator visitation rate was unaffected by any of the sources of variation included in the model, pollen load size differed significantly between pollinator guilds and years (Table 2). However, although significant, the differences between factor levels were small. Specifically, pollen load size attributed to nocturnal visitors (362.66±6.74 grains·stigma) was only 1.03 times greater than that attributed to diurnal visitors (351.06±7.61 grains·stigma). Moreover, this same variable was only 1.02 times greater during the year 2022 (364.66±6.86 grains·stigma) than during 2023 (372.68±8.00 grains·stigma).
3.4. Reproductive Success
Fruit set was only marginally greater in the forest (24.65±1.39 %) than in the city (18.92±1.36 %), and was significantly greater (1.45 times) in nocturnally (25.71±1.41 %) than in diurnally (17.74±1.30 %) pollinated flowers (Table 2). The effect of the interaction urbanization x pollinator guild on fruit set was also significant (Table 1); i.e., while diurnally pollinated flowers presented a significant reduction in fruit set in the city relative to that of the forest, this was not true of the nocturnally pollinated flowers (Figure 3). Finally, fruit set was also 1.3 times greater in Cancun (25.87±1.85%) than in Merida (19.84±1.96%), and 1.82 times greater during the year 2022 (29.28±1.83%) than during 2023 (16.03±1.77%) (Table 2).
From all the sources of variation included in the model, only the effects of the year and the interaction of this variable with urbanization on the seed set were statistically significant (Table 1). Specifically, the seed set was 1.24 times greater during the year 2022 (88.46±0.93 %) than during 2023 (71.53±2.21%) (Figure 4). However, in the year 2022, the seed set was 1.07 times greater in the city than in the forest, but no difference between habitats was observed in 2023 (Figure 4).
Significant effects of urbanization, pollinator guild, and year were found on seed germination (Table 2). Specifically, seed germination was 1.70 times greater in the city (48.75±4.44) than in the forest (28.75±4.08). Furthermore, the germination of seeds by nocturnally pollinated flowers (43.75±1.36%) was 1.30 times greater than that of seeds sired by diurnally pollinated flowers (33.75±2.59%). Finally, seed germination was 1.24 times greater in the year 2022 (88.49±0.93%) than in 2023 (71.52±1.24%).
3. Discussion
This study investigated the effects of urbanization on flowering phenology, quantitative and qualitative components of the pollination process, and the reproductive success of the chiropterophilous tree (C. pentandra) in two major tropical cities of the Yucatan Peninsula and surrounding forest patches. According to the results, urbanization has led to earlier flowering phenology and the production of slightly higher quantities of more diluted nectar. On the other hand, no significant effect of urbanization on qualitative and quantitative components of pollination was detected. Finally, the effects of urbanization on the reproductive success of C. pentandra in the Yucatan Peninsula were mixed; i.e., while marginally negative effects of urbanization were found in fruit set, positive and significant effects were found in seed germination. The negative effects of urbanization on fruit set could therefore be outweighed by the positive effect found in seed germination. All these findings suggest that urban pollinators can maintain quantitatively and qualitatively similar pollination services and reproductive success of C. pentandra in forests and cities. This is a positive finding for urban forests, since the maintenance of pollinator services for native plant species is highly important for maintaining the sexual reproduction and genetic diversity of plant populations in urban ecosystems.
Flowering phenology (at population and individual levels) exhibited an earlier start in the cities relative to the forest patches under study (See Table 1 & Figure 1). The same patterns have been identified in many plant species in several cities around the world e.g., [25,36]. This trend is probably due to the warmer temperatures that are almost universally exhibited in urban areas, induced by the replacement of natural land cover by pavement, buildings, and other urban infrastructure (i.e., urban heat island effect; [37]). This could certainly have been the case in our system since the temperature in the cities was ca. 4 °C warmer than in the forest (city: 30.84±0.33 °C, forest: 26.66±0.32 °C). However, given the observational nature of this research, we cannot rule out the possibility that other environmental variables that are concomitantly modified by urbanization could also have influenced this result (e.g., water availability and/or humidity; [25,38]. A major concern when human-driven changes in flowering phenology occur is the desynchronization of plants with their pollinators, which may in turn negatively affect plant reproductive success [25]. Nevertheless, we did not detect significant negative consequences of the earlier flowering for pollination components or reproductive success in the urban populations of C. pentandra (Table 2). This could be because, although statistically different, the city and forest populations still exhibited an important overlap in their flowering phenologies at both the population (61 to 95%) and individual (66%) levels. This level of overlap, together with the high mobility of its major pollinator, the bat A. jamaiciencis (daily movements range from 10 > 30 km from the roots; [39,40], suggests the occurrence of pollen flow between the city and forest. Although other descriptors of flowering phenology (i.e., flowering duration and termination) also exhibit some differences between the city and the forest, these effects were spatially or temporally inconsistent.
In terms of flowering biology, the most important difference observed was that the trees in the city produced slightly higher quantities of slightly more diluted nectar. Previous work has also found greater nectar production in urban relative to non-urban plant populations due to greater water availability in the urban ecosystems [41,42]. Flowers of trees growing under conditions of high water availability may also have more diluted nectar since the nectar volume increases but not the amount of sugar. Water availability could therefore explain the greater production of more dilute nectar observed in the city in our system, since C. pentandra blooms during the dry season and is artificially irrigated in several urban green areas within the study area [43]. It should also be noted that differences in the volume and concentration of nectar were not only minor but also that these differences lasted for less than one-third of the full life span of the flowers. This is likely the reason why this difference is not associated with any important difference in any pollination component (Table 2).
Although urbanization is considered a major transformation of the habitat, we did not identify any effect of this process on the quantity (visitation rate) and quality (pollen load size) components of pollination. The major nocturnal pollinator of C. pentandra in the Yucatan Peninsula is A. jamaiciencis, a frugivore that may facultatively broaden its diet to include pollen, nectar, leaves, and even insects [44]. This bat species is also tolerant to a certain level of anthropogenic disturbance [45,46]. Similarly, Apidae bees (particularly the exotic Apis millefera) are the major diurnal visitors of C. pentandra in the Yucatan Peninsula [47] and also have some tolerance to urbanization. For instance, A. mellifera is one of the most abundant bee species in other Neotropical cities [48]. This tolerance of the main nocturnal and diurnal pollinators to urbanization, together with the high density of C. pentandra seen in the cities of the Yucatan Peninsula [43], could explain why pollinator visitation rates and pollen deposition were unaffected by urbanization in our study.
Although we found only a marginal negative effect of urbanization on fruit set, the significant interaction of urbanization x pollinator guild suggests that the reduction in fruit set attributable to diurnal visitors was the only factor significantly affected by urbanization (see Figure 4A). Since urbanization did not affect visitation rates or the pollen deposition of all visitors (Table 2), we can discard that the reduction of fruit set was due to negative effects of urbanization on these pollination components. One factor that could explain this result, but which remains to be explored, is that diurnal visitors move lower quantities of allogamous pollen in the city than in the forest. This is likely since some degree of self-incompatibility is common in Neotropical populations of C. pentandra [49,50] and movement across the warmer, inhospitable urban matrix could be less energetically profitable for bees than for bats, particularly when sufficient floral resources can be found in a single tree [49]. This likely leads to more geitonogamous crosses during the day in the flowers of urban trees and thus a lower fruit set, as seen in other plant species [51]. However, fruits of trees in the city exhibited similar seed set values to those from trees in the forest.
Interestingly, seeds from trees in the city presented significantly greater germination success than those from trees in the forest. We suggest that this was probably due to a reduction in pre-dispersal seed predation of C. pentandra by hemipterans (Dysdercus sp.) in the cities. This idea is supported by a previous study with Ceiba aesculifolia, in which the authors observed that forest disturbance reduced seed predation by Dysdercus sp. in another tropical dry forest of Mexico [52]. Although we observed considerably fewer Dysdercus sp. individuals predating seeds of C. pentandra in the city than in the forest, more systematic observations along with a formal analysis are required to test this hypothesis. However, beyond the mechanism underlying the differences, the fact that negative and positive effects on different pollination components were found suggests that the net effect of urbanization on reproductive success could be neutral.
In conclusion, urbanization has led to earlier flowering. However, despite this difference, the qualitative and quantitative components of pollination were unaffected by urbanization. While marginally negative effects of urbanization were identified in fruit set values attributable to diurnal visitors, a positive effect of the same process was seen in seed germination, which probably offsets the negative effects. This is a positive result since it suggests that urban pollinators in the study area are able to maintain the pollination services and sexual reproduction of the study species, which is native and of considerable cultural and ecological value to the region.
4. Materials and Methods
4.1. Study System
The study species (Ceiba pentandra) is an emergent tree with pantropical distribution [53]. Flowering occurs at the beginning of the year [54], with a brief and massive bloom [49]. The flowers exhibit nocturnal anthesis and are typically pollinated by bats (e.g., [55,56]), although diurnal pollinators such as bees also contribute to its reproductive success in the Yucatan Peninsula [47]. Ceiba pentandra produces large quantities of nectar (up to 10 L per tree) and the seeds are wind-dispersed [57]. In the Yucatan Peninsula, this tree species occurs in tropical dry forest areas with variable degrees of disturbance, as well as in urban green areas where it is a dominant tree species and is either planted or naturally recruited [43].
The study area comprised the two main cities (located 300 km apart) of the Yucatan Peninsula: Merida (21° 2'3.68" N, 89° 45'52.21" W; 10-14 m a.s.l) and Cancun (21°1'47.43" N, 87° 7'3.42" W; 8-10 m a.s.l.), as well as adjacent forested areas. The most characteristic tree species in forested areas are Lysiloma latisiliquum (Fabaceae), Piscidia piscipula (Fabaceae), and Bursera simaruba (Burseraceae) [56]. Similarly, in the urban area green areas, P. piscipula, B. simaruba, and Leucaena leucocephala (Fabaceae) are the dominant native tree species [43]. The weather in the study area is tropical subhumid with summer rains [58]. The distances between habitats (forest to city) were 21 km in Merida and 26 km in Cancun. In both sites, a random sample of 100 reproductive trees with accessible branches (up to 5 m in height from ground level) and at least 2 km apart was selected: 50 per habitat (forest and city), giving a total sample size of 200 trees. The study lasted for two consecutive flowering seasons, in the years 2022-2023 and 2023-2024. Hereafter, for simplicity, these two seasons are referred to only as 2022 and 2023, respectively.
4.2. Flowering Phenology
To describe floral phenology at the population and individual levels in the two habitats (city and the forest) of both sites (Merida and Cancun) over two reproductive seasons (2022 and 2023), for each selected tree, the whole crown was visually scanned using binoculars for the presence or absence of flowering buds and open flowers. These observations were conducted twice a week, from the first day of December until the end of the flowering season.
The floral phenology pattern at the population level in each site and year was analyzed graphically and the temporal overlap of the phenological curves was then compared between forest and city using a phenological overlap index (POI) based on the Morisita-Horn’s dissimilarity index, relative to the proportion of trees during the whole reproductive season [59]. The POI ranges from 0 to 1, with one denoting maximum overlap and zero signifying no overlap at all [59]. At the individual level, three phenological descriptors per individual were calculated: flowering onset, termination, and duration. Flowering onset and termination were expressed in Julian days, with December 1st as day number one. Flowering duration was expressed as the number of days for which a tree produced flowers. The effects of urbanization (forest vs. city), site (Merida vs. Cancun), and year (2022 vs. 2023) on the three phenological descriptors were assessed with linear mixed-effects models (three models in total, one per descriptor). In each model, the plant was included in the random part of the model to account for repeated measures. Only second-order interactions involving urbanization were included in the models.
4.3. Floral Biology and Rewards
A group of 40 flowers from two different trees per habitat and site (n= 40 flowers x 2 trees x 2 habitats x 2 sites= 320 flowers) were labeled and observed every two hours from the bud stage until flower wilting. For each flower, time to anthesis, pollen dehiscence, stigma receptivity, and corolla abscission were recorded. Stigma receptivity was determined by appearance (turgor, color, etc.) as well as stigma response after adding two drops of water [60]. For the same number, but a different group of flowers from the same inflorescence and tree, nectar volume and concentration were measured every hour from anthesis until nectar production stopped. Nectar volume was measured with a hypodermic syringe and nectar concentration was measured with a portable hand refractometer (Hanna instruments, HI96832, Washington D.C, USA). For logistical reasons, floral biology and rewards were measured only during the year 2023.
4.4. Pollinator Components
Quantitative (pollinator visitation rate) and qualitative (pollen load size) components of pollination were measured in the study species in the two habitats, sites, and years. To assess the pollination visitation rate, we used the approach outlined by Dzul-Cauich and Munguía-Rosas [23] in the same tree species and site. In short, nocturnal visitors in one inflorescence per tree with 10-34 flowers were video recorded with a Sony Handy Cam, using the night shot function (DCR-SR85, Beijing, China) and an independent infrared lamp (IRLamp6, Wildlife Engineering, Pennsylvania, USA) as a supplementary source of light. Video recordings began with anthesis and lasted for two hours. Since we were aware that diurnal visitors are effective pollinators of C. pentandra in the study area, the visitation rate of these visitors was also assessed using the same camera but with natural light. Diurnal filming began at sunrise (ca. 0600 h) and lasted for the same period as for nocturnal visitors. The videos were examined in slow motion and the number of visits as well as the feeding behavior was recorded. Visitors that contacted the reproductive organs of the flowers were considered effective pollinators. The same trees filmed during the night were filmed the following morning. In total, 272 and 288 inflorescences and trees were filmed in the forest and city, respectively.
Since two contrasting guilds of pollinators (diurnal vs. nocturnal) are involved in the sexual reproduction of C. pentandra in the Yucatan Peninsula, the qualitative component of pollination was also assessed for diurnal and nocturnal pollinators separately. For this purpose, two exclusion treatments were conducted: (i) Nocturnal pollination: flowers of accessible inflorescences were exposed only to nocturnal visitors and covered with mesh bags from sunrise (ca. 0600 h) until dehiscence of the corollas. (ii) Diurnal pollination: flowers were covered at the mature bud stage with mesh bags all night and uncovered the following morning (from 0600 h until corolla dehiscence) to be exposed only to diurnal visitors. Three flowers per inflorescence per treatment combination (n= 3 flowers x 50 trees x 2 sites x 2 habitats x 2 years= 1,200 flowers) were collected and fixed in a solution of formaldehyde: acetic acid: ethanol and transported to the laboratory. The flowers were dissected to extract the styles and then softened in 1 N KOH at 65 °C for 20 min, rinsed with distilled water, and stained for 20 min at 65 °C in aniline blue [60]. Finally, the stained styles were mounted individually on glass slides. For each style, the number of conspecific pollen grains on the stigma was quantified under a fluorescence microscope (Leica DM2500LED, Wetzlar, Germany).
The effects of urbanization (forest vs. city), pollinator guild (diurnal vs. nocturnal pollinators), site (Merida vs. Cancun), and year (2022 vs. 2023) on the pollinator visitation rate and pollen load size (two separate models) were assessed with generalized mixed-effects models with Poisson error distribution. To determine whether the effect of urbanization found for these two variables was contingent upon the pollinator guild, site, or year, the second interactions involving urbanization were included in both models. In each model, the plant was included in the random part of the model to account for spatial and temporal correlation.
2.5. Reproductive Success
To measure reproductive success due to the main pollinator guilds (diurnal vs. nocturnal) in the two habitats, sites, and years, a random sample of seven flowers per inflorescence, allocated to each of the two pollinator exclusion treatments described in section 2.4. (n= 7 flowers x 193 trees x 2 habitats x 2 sites x 2 years= 1,351 flowers per treatment), was selected. These tagged flowers were checked once a week until the flower either aborted or set fruit. The proportion of fruit produced in the sample was then used to calculate the fruit set. To assess the seed set, a group of 5–10 mature fruits per sampled tree was collected and opened to count the seeds. Since the mean number of ovules in the study population is known (314 ovules; [23]), the seed set value was obtained by dividing the number of seeds by the mean number of ovules. The total sample size was 578 fruits (321 in the forest and 257 in the city).
From the fruits collected, 50-100 apparently viable seeds per fruit were taken and the seeds from each treatment combination were then pooled. A sample of 50 seeds from each pool was randomly selected. These seeds were scarified with fine sandpaper (180–200 grit) and disinfected with a 1.5% solution of hypochlorite. The seeds were also sprayed with a fungicide (quaternary of ammonium compounds and glutaraldehyde; ANIBAC Cítrico, Promotora Técnico Industrial, Jiutepec, Mexico). Groups of five seeds from each treatment combination were placed in Petri dishes (n= 800 seeds in 160 dishes, 10 true replicates per treatment combination) with a disc of moist filter paper at the bottom. The seeds were kept in a growth chamber (Binder Inc., KBWF 720, Tuttlingen, Germany) at a constant temperature of 26 °C and a photoperiod of 12 h light and 12 h dark. Light was provided by high-pressure sodium lamps (PAR = 56.59 μmol · m2 · s− 1). Seed germination (radicle emergence) was then recorded every 48 h for 30 days.
The effects of urbanization, pollinator guild, site, and year, as well the second interaction involving the effects of urbanization on fruit set, seed set, and germination (three models in total), were assessed using generalized mixed-effect models with binomial error distribution. As with the previous models, the plant was included in the random part of each model to account for spatial and temporal correlation. In the case of germination, accumulated seed germination after 30 days was used as the response variable.
All analyses were conducted in R 4.0.3 [61]. The raw data is presented in the Appendix S1.
Supplementary Materials
The following supporting information can be downloaded at the website of this paper posted on Preprints.org, Appendix S1: Raw data.
Author Contributions
Conceptualization, H.D-C. and M.M-R.; methodology, H.D-C. and M.M-R. ; formal analysis, M.M-R.; ; resources, M.M-R.; data curation, H.D-C. and M.M-R.; writing—original draft preparation, H.D-C.; writing—review and editing, M.M-R.; supervision, M.M-R.; project administration, M.M-R. The two authors have read and agreed to the published version of the manuscript.
Funding
This research was funded by Cinvestav, funds to M.M-R, grant number 8285. Idea wild provided an equipment gran to H.D-C.
Data Availability Statement
All data used in this study are available as Supplementary Material (Appendix S1).
Acknowledgments
A group of enthusiastic students and lecturers from Universidad del Caribe, F Miss-Canché and J Yama helped with the fieldwork. K Stoner and C Ibarra-Cerdeña contributed valuable comments to an earlier version of the manuscript. K Macmillan revised the English.
Conflicts of Interest
The authors declare no conflicts of interest. The funders had no role in the design of the study; in the collection, analyses, or interpretation of data; in the writing of the manuscript; or in the decision to publish the results.
References
- Lemoine-Rodríguez, R.; Inostroza, L.; Zepp, H. The global homogenization of urban form. An assessment of 194 cities across time. Landsc. Urban Plan. 2020, 2004, 103949. [CrossRef]
- Richards, D. R.; Belcher, R. N. Global changes in urban vegetation cover. Remote Sens. 2019, 12, 23. [CrossRef]
- McDonald, R. I.; Kareiva, P.; Forman, R. T. T. The implications of current and future urbanization for global protected areas and biodiversity conservation. Biol. Conserv. 2008, 141, 1695–1703. [CrossRef]
- Teixido, A.L.; Kaminski, L.A.; Fuzessy, L.F.; Oliveira, P.C.; Souza, C.S.; Gomes, I.N.; Maruyama, P.K. Anthropogenic impacts on plant-animal mutualisms: A global synthesis for pollination and seed dispersal. Biol. Conserv. 2022, 266, 109461. [CrossRef]
- United Nations. World Urbanization Prospects. United Nations, N.Y., 2018, 125 p.
- Myers, N.; Mittermeier, R. A.; Mittermeier, C. G.; da Fonseca, G. A. B.; Kent, J. Biodiversity hotspots for conservation priorities. Nature. 2000, 403, 853–858. [CrossRef]
- Seto, K.C.; Güneralp, B.; Hutyra L,R. Global forecasts of urban expansion to 2030 and direct impacts on biodiversity and carbon pools. Proc. Natl. Acad. Sci. USA. 2012, 109, 16083–16088. [CrossRef]
- Van Klink, R.; Bowler, D.E.; Gongalsky, K.B.; Swengel, A.B.; Gentile, A.; Chase, J.M. Meta-analysis reveals declines in terrestrial but increases in freshwater insect abundances. Science. 2020, 368, 417–420. [CrossRef]
- Luck, G.W. A review of the relationships between human population density and biodiversity. Biol. Rev. 2007, 82, 607–645. [CrossRef]
- Tan, P.Y.; Zhang, J.; Masoudi, M.; Alemu, J.B.; Edwards, P.J.; Grêt-Regamey, A.; Richards, D.R.; Saunders, J.; Song, X.P.; Wong, L.W. A conceptual framework to untangle the concept of urban ecosystem services. Landsc. Urban Plan. 2020, 200, 103837. [CrossRef]
- Bernard, E.; de Lucena Damasceno, L.T.; de Frias, A.V.C.; Hintze, F. Assessing the Effects of Urbanization on Bats in Recife Area, Atlantic Forest of Brazil. In: Urban Bats: Biology, Ecology, and Human Dimensions; Ortega, J., Dixon, M.D., Eds.; Springer International Publishing: Cham, Switzerland, 2022; pp. 123–136.
- Harrison, T.; Winfree, R. Urban drivers of plant-pollinator interactions. Func. Ecol. 2015, 29, 879-888. [CrossRef]
- Russo, D.; Ancilloto, L. 2015. Sensitivity of bats to urbanization: a review. Mamm. Biol. 2015, 80, 205‒2012. [CrossRef]
- Silva, J.L.S.; Pontes de Oliveira, M.T.; Cruz-Neto, O.; Tabarelli-Lopes, A.V. Plant–pollinator interactions in urban ecosystems worldwide: A comprehensive review including research funding and policy actions. Ambio. 2020, 50, 884‒990. [CrossRef]
- Wenzel, A.; Grass, I.; Belavadi, V.V.; Tscharntke, T. How urbanization is driving pollinator diversity and pollination– A systematic review. Biol. Conserv. 2020, 241, 108321. [CrossRef]
- Youngsteadt, E.; Keighron, M. C. Urban pollination ecology. Annu. Rev. Ecol. Evol. Syst., 2023, 54, 21–42. [CrossRef]
- Ollerton, J.; Winfree, R.; Tarrant, S. How many flowering plants are pollinated by animals?. Oikos. 2011, 120, 321–326. [CrossRef]
- Delaplane, K.S. Crop Pollination by Bees, Volume 1: Evolution, Ecology, Conservation, and Management; CABI: Wallingford, UK, 2021; 141 pp.
- Orsini, F.; Kahane, R.; Nono-Womdim, R.; Gianquinto, G. Urban agriculture in the developing world: A review. Agron. Sustain. Dev. 2013, 33, 695–720. [CrossRef]
- Zezza, A.; Tasciotti, L. Urban agriculture, poverty, and food security: Empirical evidence from a sample of developing countries. Food Policy. 2010, 35, 265‒273. [CrossRef]
- Duchamp, J.E.; Swihart, R.K. Shifts in bat community structure related to evolved traits and features of human-altered landscapes. Landsc. Ecol. 2008, 23, 849‒860. [CrossRef]
- Lüttge, U.; Buckeridge, M. Trees: structure and function and the challenges of urbanization. Tree. 2023, 37, 9‒16. [CrossRef]
- Dzul-Cauich, H. F.; Munguía-Rosas, M. A. Negative effects of light pollution on pollinator visits are outweighed by positive effects on the reproductive success of a bat-pollinated tree. Sci. Nat. 2022, 109, 12. [CrossRef]
- Macgregor, C.J.; Evans, D.M.; Fox; Pocock, M.O. The dark side of street lighting: impacts on moths and evidence for the disruption of nocturnal pollen transport. Glob. Chang. Biol. 2017, 23, 697‒707. [CrossRef]
- Neil, K.; Wu, J. Effects of urbanization on plant flowering phenology: A review. Urban Ecosyst. 2006, 9, 243–257. [CrossRef]
- Silva, V. H. D.; Gomes, I. N.; Cardoso, J. C. F.; Bosenbecker, C.; Silva, J. L. S.; Cruz-Neto, O.; Oliveira, W.; Stewart, A. B.; Lopes, A. V.; Maruyama, P. K. Diverse urban pollinators and where to find them. Biol. Conserv. 2023, 281, 110036. [CrossRef]
- Baldock, K.R.C. Opportunities and threats for pollinator conservation in global towns and cities. Curr. Opin. Insect. Sci. 2020, 38, 63‒71. [CrossRef]
- Fenoglio, M.S.; Rossetti, M.R.; Videla, M. Negative effects of urbanization on terrestrial arthropod communities: a meta-analysis. Glob. Ecol. Biogeogr. 2020, 29, 1412– 1429. [CrossRef]
- Liang, H.; He, Y-D.; Theodorou, P.; Yang, C-F. The effects of urbanization on pollinators and pollination: A meta-analysis. Ecol. Lett. 2023, 26, 1629–1642. [CrossRef]
- Buchholz, S.; Egerer, M.H. Functional ecology of wild bees in cities: towards a better understanding of trait- urbanization relationships. Biodiv. Conserv. 2020, 29, 2779– 2801. [CrossRef]
- Maruyama, P. K.; Silva, J. L. S.; Gomes, I. N.; Bosenbecker, C.; Cruz-Neto, O.; Oliveira, W.; Cardoso, J. C. F.; Stewart, A. B.; Lopes, A. V. A global review of urban pollinators and implications for maintaining pollination services in tropical cities. Ecology of Tropical Cities: Natural and Social Sciences Applied to the Conservation of Urban Biodiversity. 2021. [CrossRef]
- Ramírez-Fráncel, L. A.; García-Herrera, L. V.; Losada-Prado, S.; Reinoso-Flores, G.; Sánchez-Hernández, A.; Estrada-Villegas, S.; Lim, B. K.; Guevara, G. Bats and their vital ecosystem services: A global review. Integr. Zool. 2022, 17, 2‒23. [CrossRef]
- Ratto, F.; Simmons, B. I.; Spake, R.; Zamora-Gutierrez, V.; MacDonald, M. A.; Merriman, J. C.; Tremlett, J. C.; Poppy, G. M.; Peh, K. S-H.; Dicks, L. V. Global importance of vertebrate pollinators for plant reproductive success: A meta-analysis. Front. Ecol. Environ. 2018, 16, 82–90. [CrossRef]
- Jung, K.; Threlfall, C.G. Urbanization and Its Effects on Bats—A Global Meta-Analysis. In: Bats in the Anthropocene: Conservation of Bats in a Changing World; Voigt, C.C., Kingston, T., Eds.; Springer: New York, NY. 2016; pp. 13–33. [CrossRef]
- Russo, D.; Coleman, J.L.; Ancillotto, L.; Korine, C. Ecosystem Services by Bats in Urban Areas. In: Urban Bats: Biology, Ecology, and Human Dimensions; Moretto, L., Coleman, J.L., Davy, C.M., Fenton, M.B., Korine, C., Patriquin, K.J., Eds.; Springer: New York, NY. 2022; pp. 167–180. [CrossRef]
- Lu, P.; Yu, Q.; Liu, J.; Lee, X. Advance of tree-flowering dates in response to urban climate change. Agric. For. Meteorol. 2006, 138, 120–131. [CrossRef]
- Baumann, P.R. Urban heat island lesson. Geocarto International. 2009, 24, 473–483. [CrossRef]
- Neil, K.; Wu, J.; Bang, C.; Faeth, S. Urbanization affects plant flowering phenology and pollinator community: effects of water availability and land cover. Ecol. Process. 2014, 3, 17. [CrossRef]
- Mendes, P.; Vieira, T.B.; Oprea, M.; Ditchfield, A.D. Long-distance movement of Artibeus lituratus (chiroptera: phyllostomidae) in the state of espírito santo, Brazil. Ecotropica. 2009, 15, 43–46.
- Morrison, D.W. Foraging ecology and energetics of the frugivorous bat Artibeus jamaicensis. Ecology. 1978, 59, 716‒723. [CrossRef]
- Biella, P.; Tommasi1, N.; Guzzetti, L.; Pioltelli, E.; Labra, M.; Galimberti, A. City climate and landscape structure shape pollinators, nectar and transported pollen along a gradient of urbanization. J. Appl. Ecol. 2022, 59, 1586–1595. [CrossRef]
- Villareal, A.G.; Freeman, C.E. Effects of temperature and water stress on some floral nectar characteristics in Ipomopsis longiflora (Polemoniaceae) under controlled conditions. Int. J. Plant Sci. 1990, 151, 5–9. [CrossRef]
- Ayuntamiento de Mérida. Estudio-diagnóstico del arbolado urbano en parques públicos de Mérida. Mérida, México. 2018. Available at: http://www.merida.gob.mx/sustentable/contenidos/doc/ArboladoUrbano_Parques.pdf. Last accessed: 16/03/2025.
- Ortega, J.; Castro-Arellano, I. Artibeus jamaicensis. Mammalian Species. 2001, 662, 1–9. [CrossRef]
- Ávila-Gómez A.S.; Moreno, C.; García-Morales, R.; Zuria, I., Sánchez-Rojas, G.; Briones-Salas, M. 2015. Deforestation thresholds for phyllostomid bat populations in tropical landscapes in the Huasteca region, Mexico. Trop. Conserv. Sci. 2015, 8, 646‒661. [CrossRef]
- Rodríguez-Durán, A.; Otero, W. Species richness and diversity of a West Indian bat assemblage in a fragmented ecosystem. Acta Chiropterol. 2011, 13, 439‒445. [CrossRef]
- Dzul-Cauich, H.F.; Stoner, K.; Ibarra-Cerdeña, C.N.; Munguía-Rosas, M.A. Living away from specialized pollinators: The pollination system of Ceiba pentandra in the Yucatan Peninsula. Ecol. Evol. 2025, 15, e70974. [CrossRef]
- Guimarães-Alves, S.; Gaglianone, M. C. Bee guilds’ responses to urbanization in neotropics: A case study. Diversity. 2021, 13, 365. [CrossRef]
- Gribel, R.; Gibbs, P. E.; Queiróz, A. L. Flowering phenology and pollination biology of Ceiba pentandra (Bombacaceae) in Central Amazonia. Journal of Tropical Ecology. 1999, 15, 247‒263. [CrossRef]
- Lobo, J. A.; Quesada, M.; Stoner, K. E. Effects of pollination by bats on the mating system of Ceiba pentandra (Bombacaceae) populations in two tropical life zones in Costa Rica. Am. J. Bot. 2005, 92, 370‒376. [CrossRef]
- Finer, M.S.; Morgan, M.T. Effects of natural rates of geitonogamy on fruit set in Asclepias speciosa (Apocynaceae): evidence favoring the plant's dilemma. Am. J. Bot. 2003, 90, 1746‒1750. [CrossRef]
- Herrerías-Diego, Y.; Quesada, M.; Stoner, K. E.; Lobo, J. A.; Hernández-Flores, Y.; Montoya, G. S. Effect of forest fragmentation on fruit and seed predation of the tropical dry forest tree Ceiba aesculifolia. Biol. Conserv, 2008, 141, 241−248. [CrossRef]
- Dick, C. W.; Bermingham, E.; Lemes, M. R.; Gribel, R. Extreme long-distance dispersal of the lowland tropical rainforest tree Ceiba pentandra L. (Malvaceae) in Africa and the Neotropics. Mol. Ecol. 2007, 16, 3039-3049. [CrossRef]
- Lobo, J. A.; Quesada, M.; Stoner, K. E.; Fuchs, E. J.; Herrerías-Diego, Y.; Rojas, J.; Saborio, G. Factors affecting phenological patterns of bombacaceous trees in seasonal forests in Costa Rica and Mexico. Am. J. Bot. 2003, 90, 1054-1063. [CrossRef]
- Elmqvist, T.; Cox, P. A.; Rainey, W. E.; Pierson, E. D. Restricted pollination on oceanic islands: pollination of Ceiba pentandra by flying foxes in Samoa. Biotropica. 1992, 24, 15−23. [CrossRef]
- Singaravelan, N.; Marimuthu, G. Nectar feeding and pollen carrying from Ceiba pentandra by pteropodid bats. J. Mamm. 2004, 85, 1‒7. [CrossRef]
- Pennington, T. D., Sarukhán, J. . Árboles tropicales de México: manual para la identificación de las principales especies. Mexico City; UNAM. 2005, 523 p.
- Islebe, G.A.; Sánchez-Sánchez, O.; Valdéz-Hernández, M.; Weissenberger, H. Distribution of Vegetation Types. In; Biodiversity and Conservation of the Yucatán Peninsula; Islebe, G.; Calmé, S.; León-Cortés, J.; Schmook, B., Eds.; Springer: Cham, Switzerland, 2015; pp. 39–53.
- Luna-Nieves, A.; González, E. J.; Cortés-Flores, J.; Ibarra-Manríquez, G.; Maldonado-Romo, A.; Meave, J. Interplay of environmental cues and wood density in the vegetative and reproductive phenology of seasonally dry tropical forest trees. Biotropica, 2022, 54, 500–514. [CrossRef]
- Dafni, A. Pollination Ecology: A Practical Approach; Oxford University Press: Oxford, UK, 1992; 250 pp.
- R Core Team. 2020. R: A language and environment for statistical computing. Vienna, Austria; R Foundation for Statistical Computing.
Figure 1.
Flowering phenology of Ceiba pentandra in two localities in the Yucatan Peninsula (Merida [A&C] and Cancun[B&D]) recorded over two consecutive flowering seasons (2022 [A-B] & 2023[C-D]). The lines show the number of flowering trees in two habitats: forest (in green) and city (gray). The horizontal axis shows the Julian day, in which December 1st= day 1.
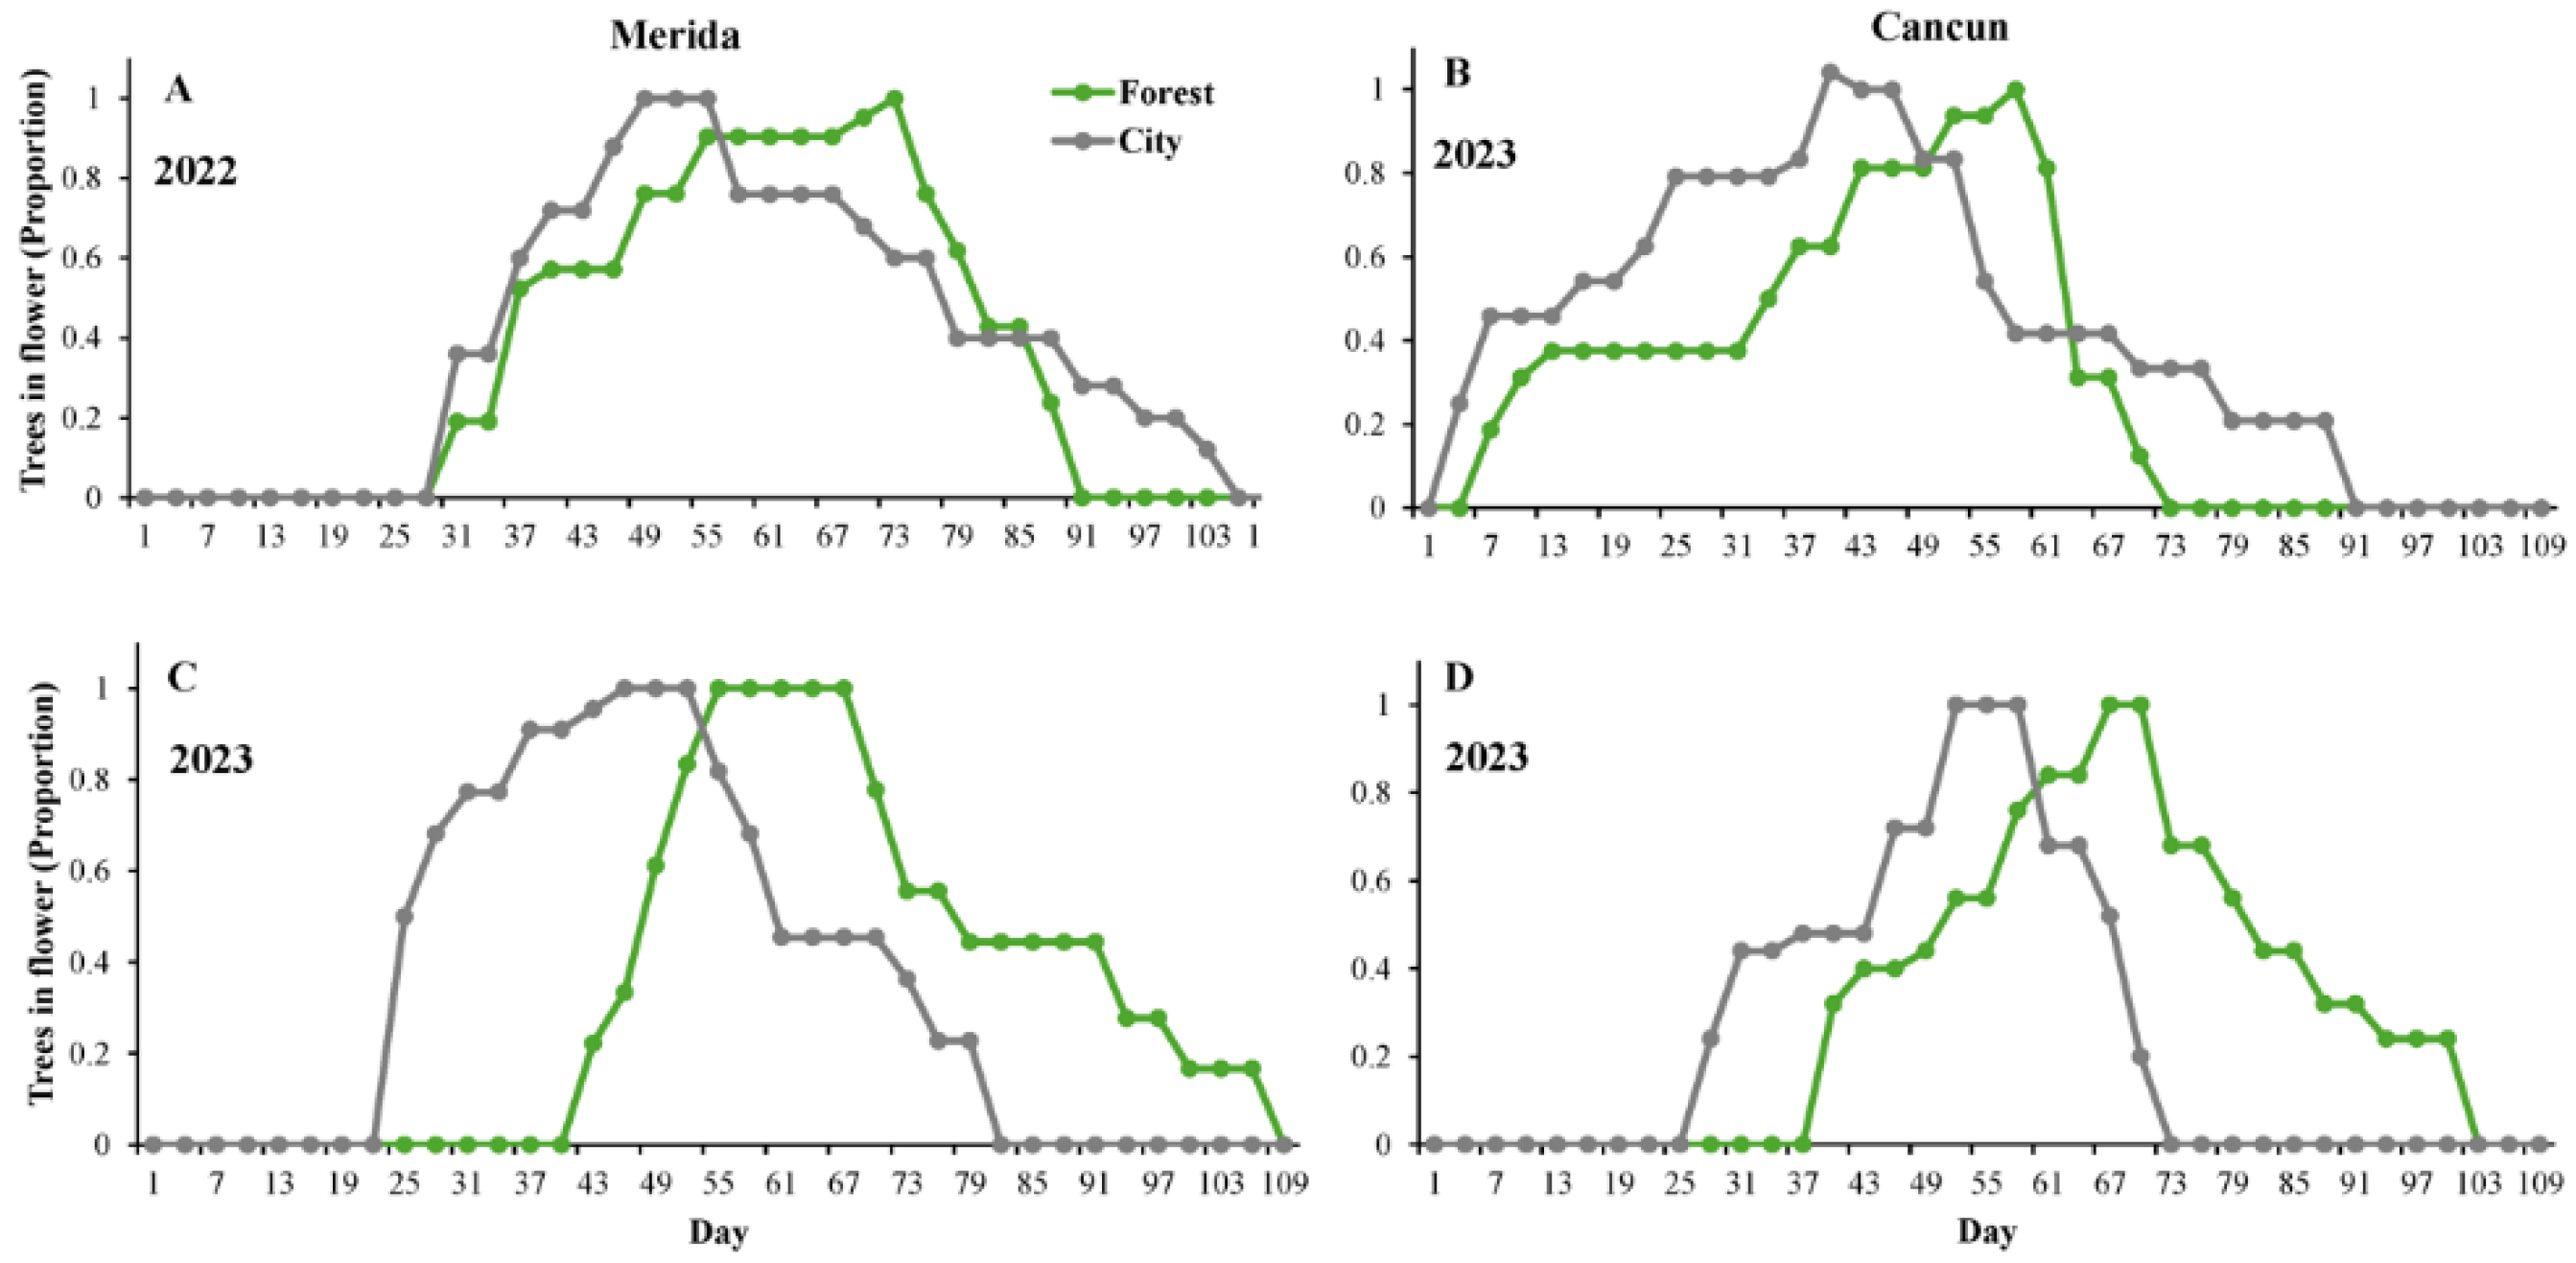
Figure 2.
Flowering duration (A) and date of flowering termination (B) in Ceiba pentandra in two contrasting habitats (forest and city) over two consecutive reproductive seasons (years 2022 and 2023). The bars denote mean values ± 1SE.
Figure 2.
Flowering duration (A) and date of flowering termination (B) in Ceiba pentandra in two contrasting habitats (forest and city) over two consecutive reproductive seasons (years 2022 and 2023). The bars denote mean values ± 1SE.
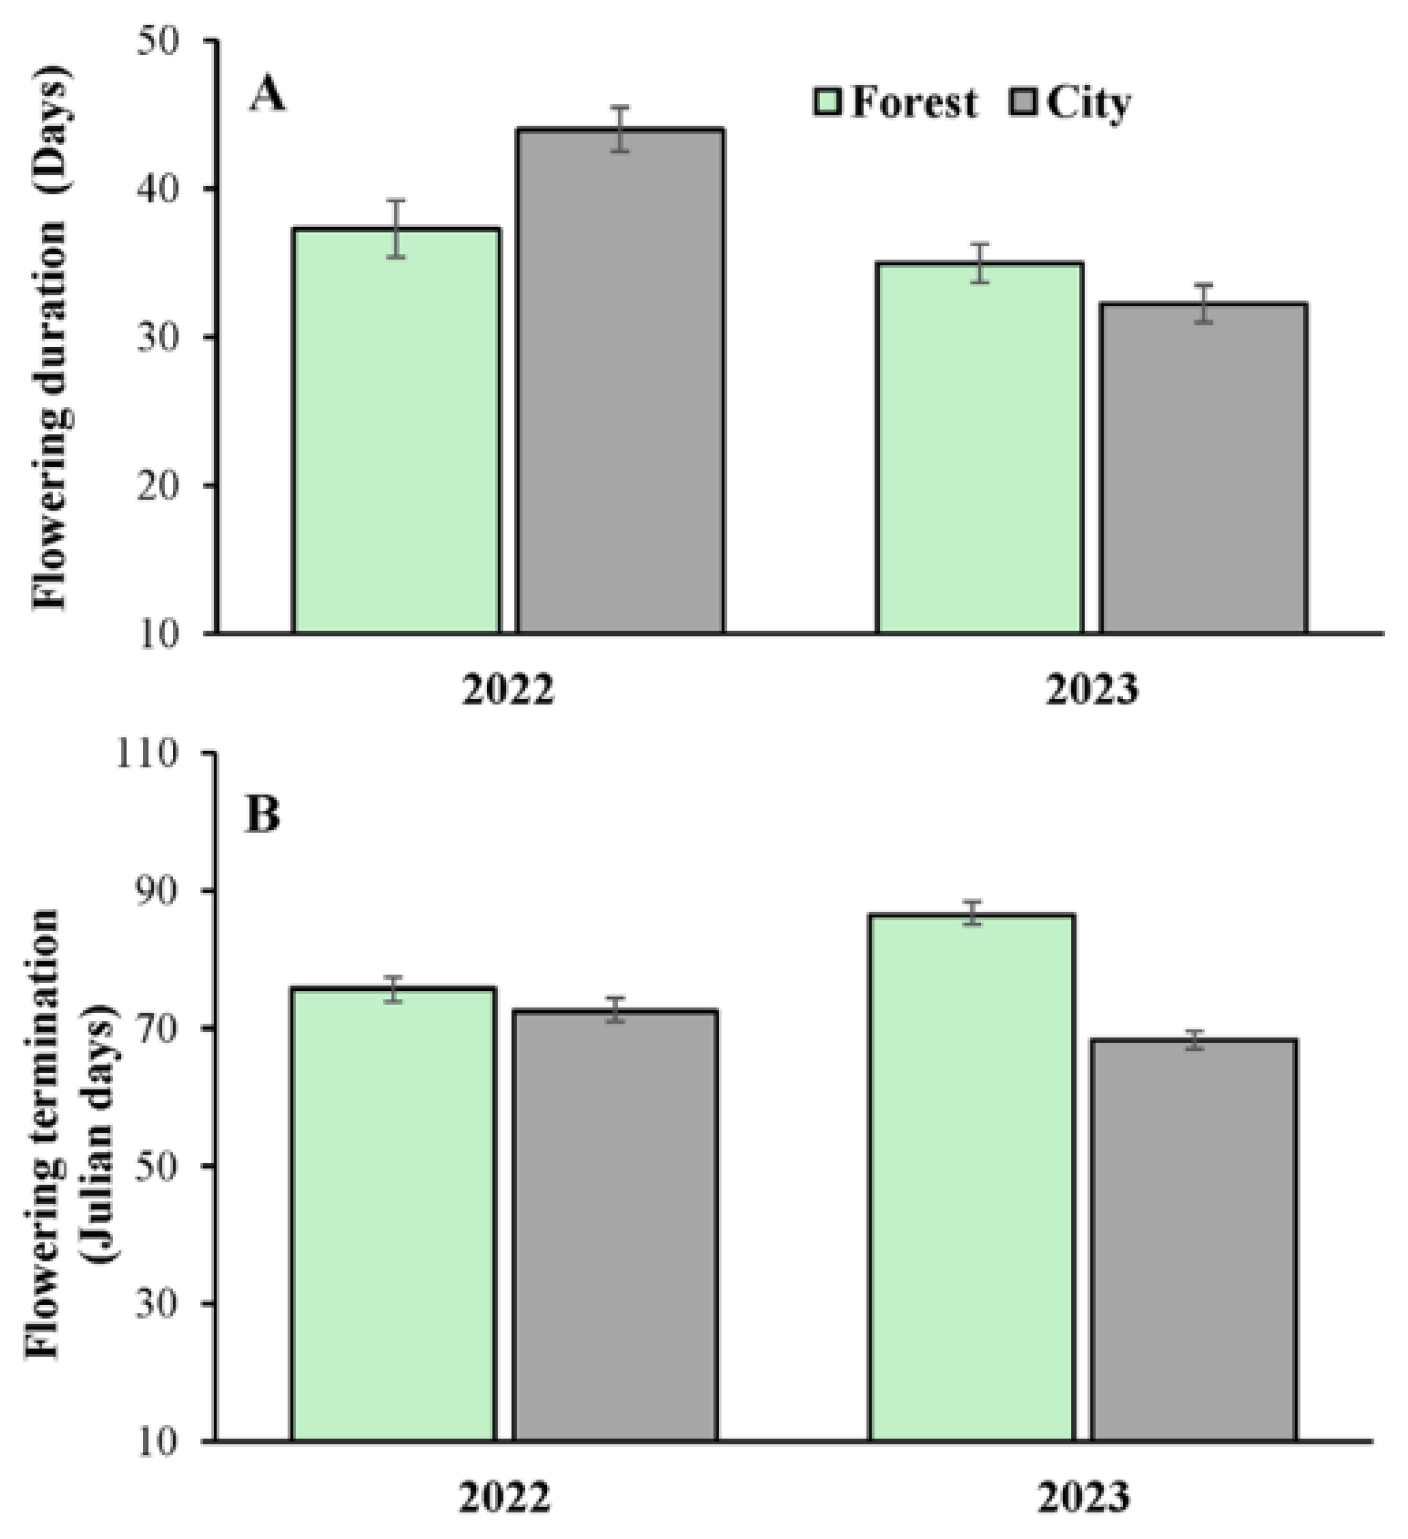
Figure 3.
Nectar production in flowers of Ceiba pentandra in two contrasting habitats (forest and city) in two sites in the Yucatan Peninsula: Merida (A) and Cancun (B). Values of nectar volume measured every hour are shown in the main axis while accumulated volume is shown in the secondary axis. Values of forest and city nectar concentration in Merida (C) and Cancun (D) are also shown. All data are mean values. When shown, error bars denote ± 1SE.
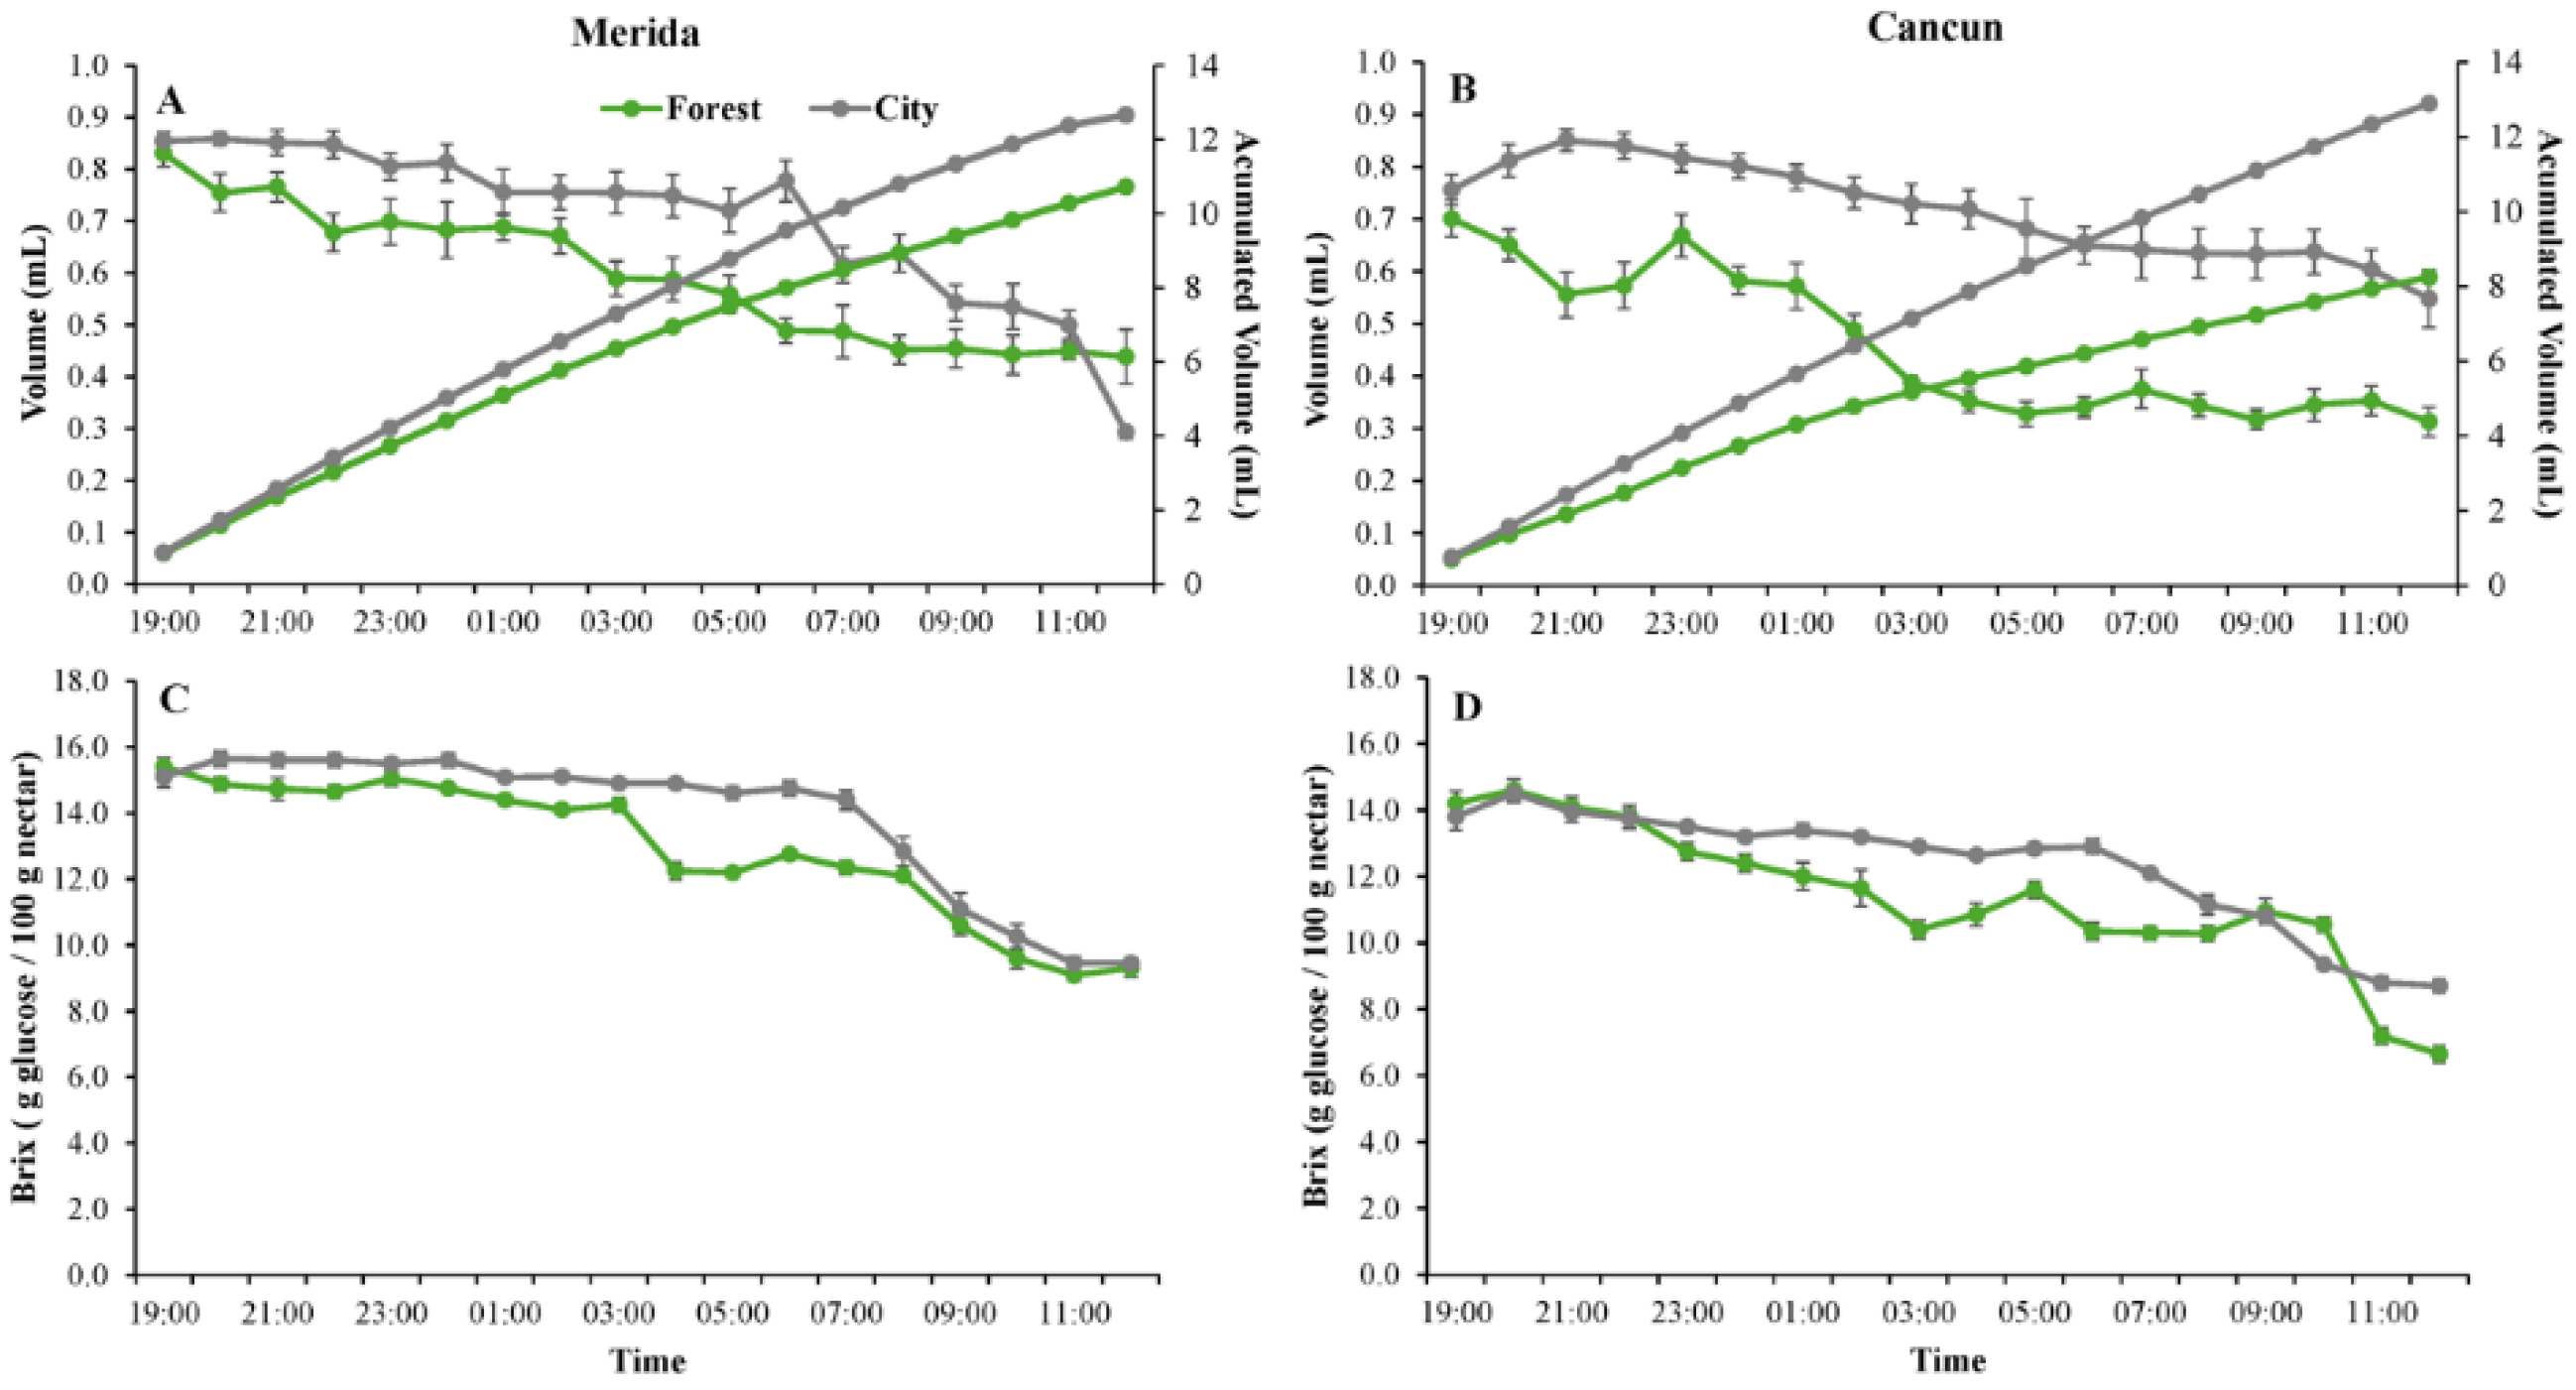
Figure 4.
(A) Fruit set of Ceiba pentandra attributed to diurnal (Diurnal) and nocturnal pollinators (Nocturnal) in two contrasting habitats (forest and city) in the Yucatan Peninsula. (B) Seed set of Ceiba pentandra in two contrasting habitats (forest and city) over two consecutive reproductive seasons (years 2022 and 2023). The bars show mean values ± 1SE. .
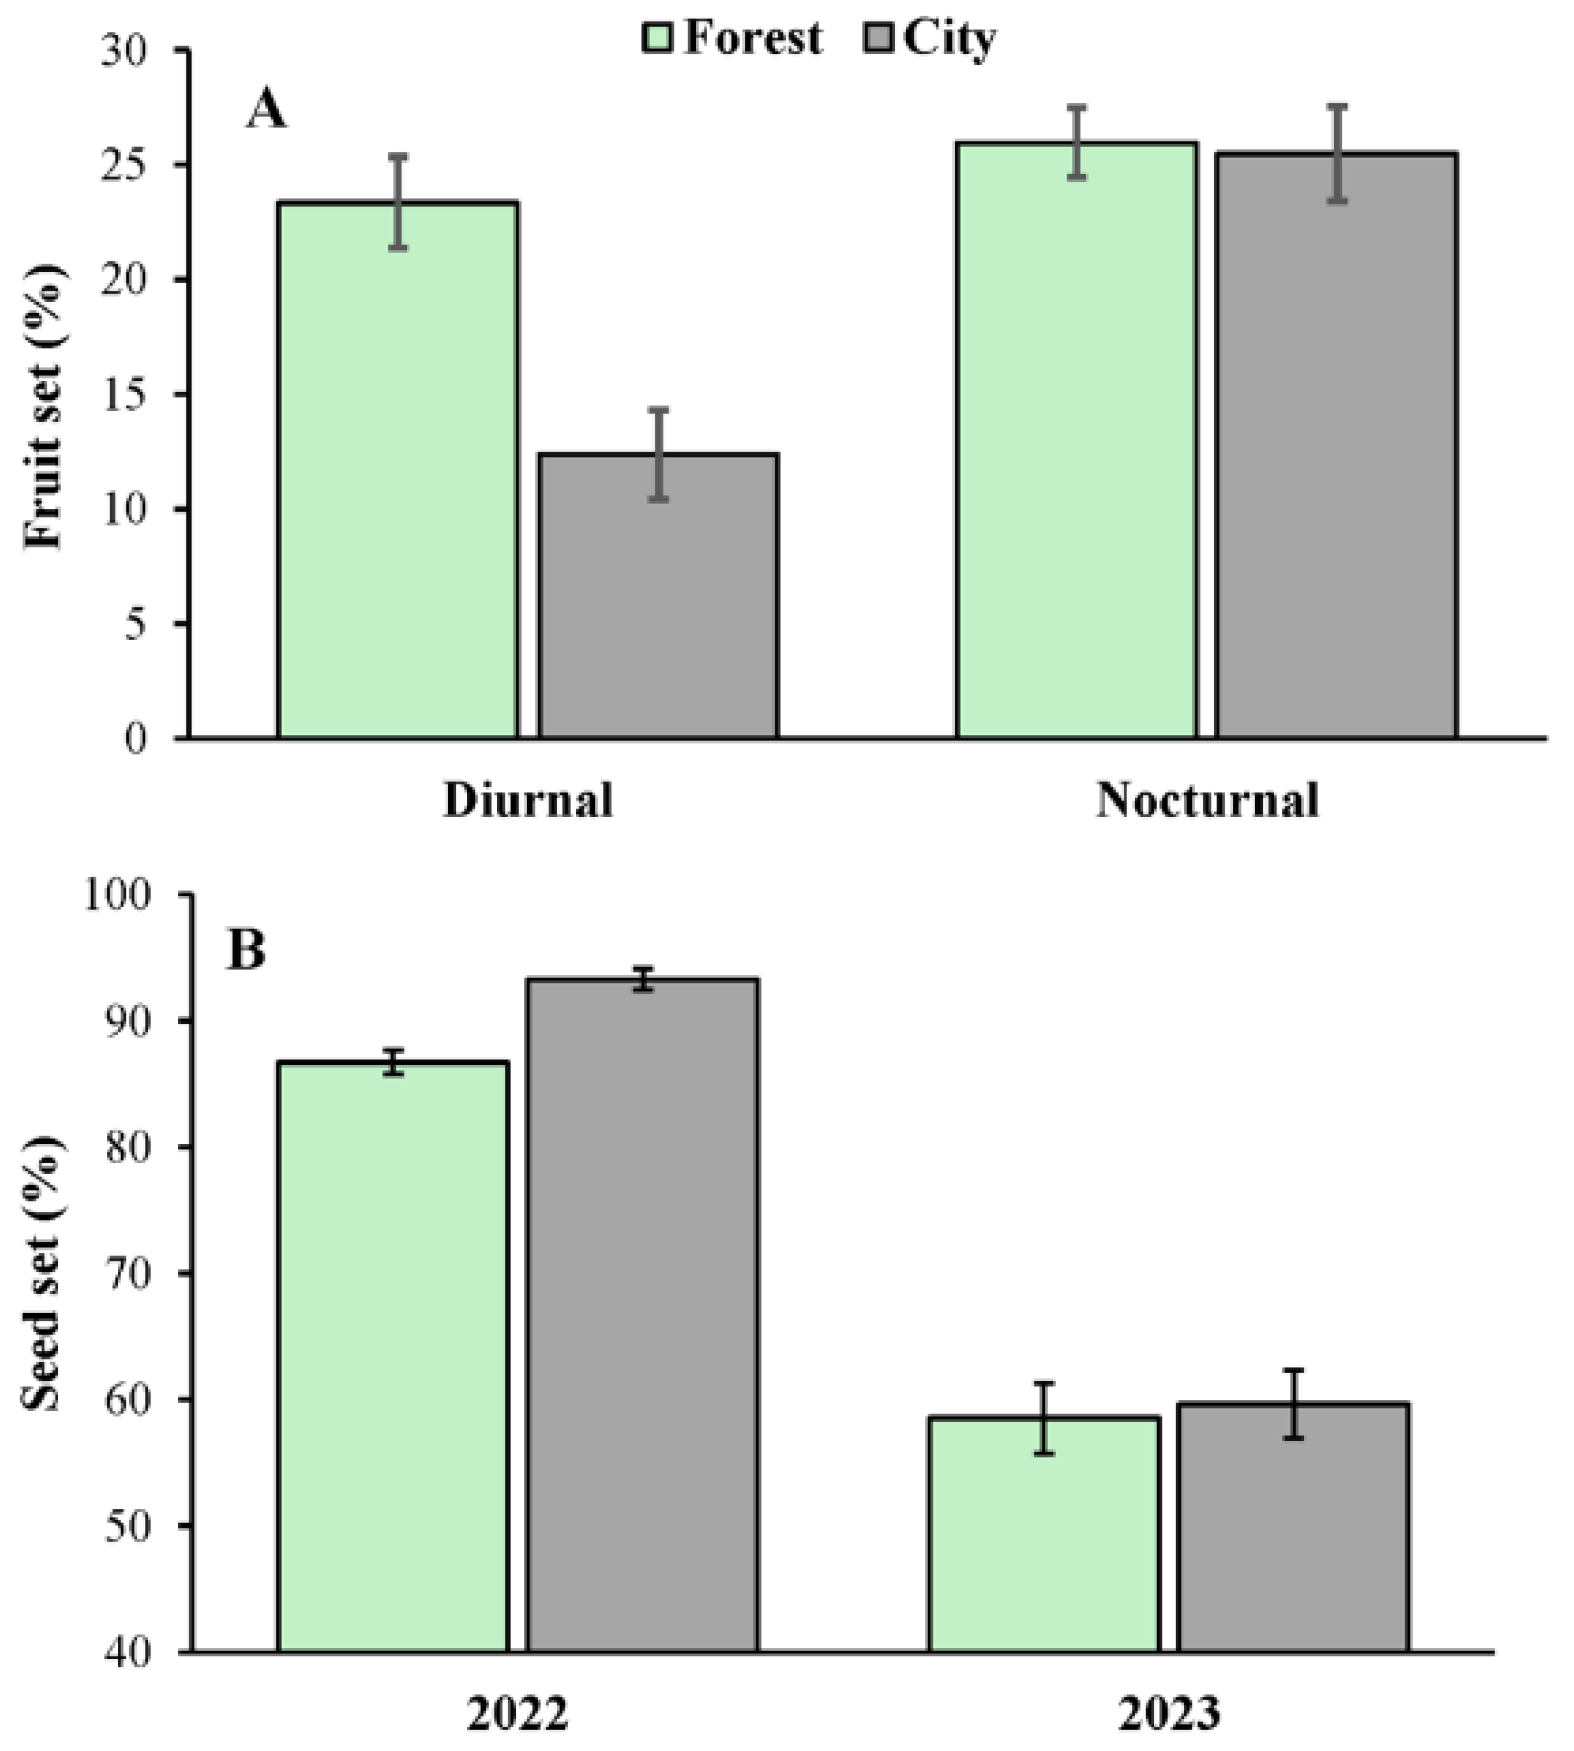

Table 1.
Results of statistical analyses to determine the effects of urbanization (forest vs. city), site (Merida vs. Cancun), and reproductive season (year 2022 vs. 2023) on three descriptors of Ceiba pentandra flowering phenology at the individual level in the Yucatan Peninsula: flowering onset (Onset), flowering duration (Duration) and flowering termination (Termination). All data are the result of a Wald Chi-square test with 1 degree of freedomThis is a table.
| Response | |||
| Source of variation | Onset | Duration | Termination |
| Urbanization | χ21=157.19** | χ21=1.59 | χ21=122.56** |
| Site | χ21=24.38** | χ21=3.84 | χ21=53.38** |
| Year | χ21=69.29** | χ21=24.27** | χ21=5.02* |
| Urbanization x Site | χ21=0.04 | χ21=0.01 | χ21=0.12 |
| Urbanization x Year | χ21=1.56 | χ21=10.75** | χ21=25.92** |
*P < 0.05 **P < 0.01.
Table 2.
Results of statistical analyses to determine the effects of urbanization (forest vs. city), pollinator guild (P. guild: diurnal vs. nocturnal), site (Merida vs. Cancun), and reproductive season (2022 vs. 2023) on quantitative (Visits: visitation rate) and qualitative (Pollen load) pollination components and reproductive success (fruit & seed set, as well as seed germination) of Ceiba pentandra in the Yucatan Peninsula. All data are the result of a Wald Chi-square test with 1 degree of freedom. .
| Response | |||||
| Source of variation | Visits | Pollen load | Fruit set | Seed set | Germination |
| Urbanization | χ21=0.06 | χ21=1.19 | χ21=3.83† | χ21=2.69 | χ21=4.76* |
| P. guild | χ21=0.46 | χ21=37.19** | χ21=16.22** | χ21=0.46 | χ21=4.23* |
| Site | χ21=0.01 | χ21=0.79 | χ21=8.95** | χ21=2.14 | χ21=3.12 |
| Year | χ21=0.06 | χ21=11.14** | χ21=34.79** | χ21=66.76** | χ21=5.46* |
| Urbanization x P. guild | χ21=0.95 | χ21= 2.36 | χ21=16.30** | χ21=0.04 | χ21=0.01 |
| Urbanization x Site | χ21=0.11 | χ21= 0.61 | χ21=0.19 | χ21=0.01 | χ21=0.05 |
| Urbanization x Year | χ21=1.06 | χ21= 2.02 | χ21=0.14 | χ21=15.59** | χ21=0.07 |
†P = 0.05; *P < 0.05; **P < 0.01.
Disclaimer/Publisher’s Note: The statements, opinions and data contained in all publications are solely those of the individual author(s) and contributor(s) and not of MDPI and/or the editor(s). MDPI and/or the editor(s) disclaim responsibility for any injury to people or property resulting from any ideas, methods, instructions or products referred to in the content. |
© 2025 by the authors. Licensee MDPI, Basel, Switzerland. This article is an open access article distributed under the terms and conditions of the Creative Commons Attribution (CC BY) license (http://creativecommons.org/licenses/by/4.0/).
Copyright: This open access article is published under a Creative Commons CC BY 4.0 license, which permit the free download, distribution, and reuse, provided that the author and preprint are cited in any reuse.


