
Submitted:
08 April 2025
Posted:
11 April 2025
You are already at the latest version
Abstract
The aim of this study was to determine, through meta-analysis, the effects of malic acid/malate supplementation on ruminal and blood parameters and diet digestibility in cattle. The effect of malic acid/malate addition was evaluated using the effect size (ES) method. Two sensitivity analyses were performed: subgroup analysis and meta-regression. The subgroups were defined as follows: “acid,” representing animals supplemented with malic acid, and “salt,” representing animals supplemented with malate. Diet-related covariates were included in the meta-regression analysis. Overall, malic acid (MAC) supplementation did not significantly affect rumen pH (ES = 0.310, P = 0.17), but subgroup analysis showed that malate increased pH (ES = 1.420, P < 0.01). MAC increased rumen propionate (ES = 0.560, P < 0.01) and total volatile fatty acids (VFAs; ES = 0.508, P = 0.03), while reducing the acetate-to-propionate ratio (P < 0.01). Starch and NDF intake were significant covariates affecting pH and VFA-related variables. MAC improved total-tract digestibility of dry matter (DM; ES = 0.547, P ≤ 0.05), crude protein (CP; ES = 0.422, P ≤ 0.05), and acid detergent fiber (ADF; ES = 0.635, P ≤ 0.05). It increased glucose levels (ES = 0.170, P = 0.05) and reduced NEFA (ES = -0.404, P = 0.03). In conclusion, MAC effects were influenced by its chemical form, improving rumen pH, CP, NDF, and ADF digestibility. MAC increased VFAs, particularly propionate, lowered the acetate-to-propionate ratio, raised blood glucose, and reduced NEFA. Diet-related covariates were important to explain the between-study heterogeneity.
Keywords:
blood metabolites
; dietary covariates
; meta-regression
; organic acid
; ruminal pH
; volatile fatty acids
1. Introduction
Feed additives have been used to improve ruminants productively for decades [1]. However, one of the most popular feed additives (ionophores) has faced restrictions due to the potential limited safety [2]. In this way, several additives are evaluated as ionophores replacers. Among these alternative additives, malic acid (MAC) highlights as an organic acid naturally found in animals and plants’ organisms.
Malic acid is a citric acid cycle intermediate, and its addition increases in vitro rumen lactate uptake, volatile fatty acids (VFA) production, and diet digestibility, reducing methane emission [3,4,5]. Besides, MAC increases in vivo VFA rumen concentration [6,7] through increased propionate and butyrate content [8]. In addition, animals fed MAC show higher rumen pH [9] and improved nutrient digestibility [10]. However, these effects have been not observed in all studies [7,11,12].
The diversity of results among studies may be linked to differences in MAC presentation (acid or salt) and potential interaction with the substrates, such as dietary starch level [5]. In this sense, meta-analysis could be used to allows the results of several experiments into a single effect estimate to determine the real effect of the MAC on the variables of interest in addition to determining and quantifying the influence of covariates on the meta-analyzed result.
Therefore, the objective of this study was to determine, through meta-analysis, the effects of supplementation with MAC on ruminal and blood parameters and digestibility of dietary fractions in cattle.
2. Materials and Methods
2.1. Database
The manuscripts search was carried out in the search engines “Web of Science”, “Science Direct”, and “Google Scholar”. The Boolean moderators used, alone or in combination, were: “organic acids”, “malic acid”, “malate”, and “bovine”. Searches based on title and abstract of articles, master’s dissertations, and PhD thesis. The PICO (population/problem, intervention/exposure, comparison, outcome) method was considered to build the database [13]. Population was cattle; intervention was supplementation with MAC acid or salt; control was cattle fed without MAC; and results were rumen parameters, nutrients digestibility, and blood parameters.
The studies needed to be original and show mean and dispersion for each variable. As the analysis requires the standard deviation associated with each variable, if these were not provided directly, they were calculated using the measures presented in the paper, such as standard error of the mean, coefficients of variation and others. Only studies that presented results for a control and treatment group (MAC supplementation) were considered. Independent experiments in the same study were included as a new comparison. Similarly, malate doses in the same trial were included as a new comparison. The following information was recorded from each trial: study reference, adaptation period, year, experimental design, MAC dose, forage to concentrate ratio, diet chemical composition, dry matter intake, animals breed, and initial body weight. Only studies reporting diet chemical composition or providing information to estimate it were included (Table 1). Rumen parameters, nutrient digestibility, and blood parameters results were recorded. The final database had 47 comparisons from 19 studies.
2.2. Statistical Analysis
The effect of supplementation was evaluated using the effect size method. The effect size was calculated as the difference between the treatment group (MAC acid or MAC Salt) and the control group divided by the pooled standard deviation of each trial. The average effect of MAC supplementation was calculated using the “DerSimonian and Laird” random effects model [14]. Heterogeneity across trials was checked using Cochran’s Q test, according to Higgins et al. [15].
Two analyses were performed to discuss the results: subgroup comparison and meta-regression. Subgroup analysis was performed by dividing the studies into two groups using MAC form: acid vs. salt. Meta-regression was used to explore the linear effects of covariates as variability sources. The following covariates were evaluated: NDF intake (g/kg BW), ADF intake (g/kg BW), starch intake (g/kg BW) and MAC intake (g/kg BW). It is important to point out that only those variables that had at least 10 comparisons and significant heterogeneity were subjected to meta-regression analysis [15]. Forest plots were used to present the average effect size and confidence interval. The “leave one out” analysis was used as a sensitivity test. All analyses were performed using the OpenMetaAnalyst statistical package.
3. Results
3.1. Rumen Parameters
MAC addition did not affect cattle rumen pH (Overall ES= 0.310, P = 0.17). In addition, subgroup analysis showed that MAC acid also had no effect (P = 0.12) on pH (Figure 1). However, MAC salt increased rumen pH (Subgroup ES= 1.420, P < 0.01). No effect of supplementation (P > 0.05) was observed for ammonia nitrogen (NH3N) (Table 2).
The heterogeneity between studies (I2) associated with these variables was significant, being 36.62 and 72.95% for NH3N and pH, respectively. Among the covariates tested in the meta-regression, NDF intake decreases (P ≤ 0.01) the ES of MAC supplementation for rumen pH and ammonia-N concentration (Table 3).
In general, MAC salt or acid had no effect (P > 0.05) on rumen acetate, butyrate, and lactate (Table 4).
Rumen propionate proportion (Overall ES= 0.560, P > 0.01) and total VFA concentration (Overall ES= 0.508, P = 0.03, Figure 2) were increased by MAC supplementation. Considering the subgroups, MAC acid increased (P = 0.02) rumen propionate, whereas MAC salt tended to increase (P = 0.08) in the same variable. MAC supplementation reduced the acetate to propionate ratio (Overall ES= -1,130, P > 0,01). The between studies heterogeneity was significant and greater than 65% for all variables related to VFAs and lactate in rumen. The meta-regression showed that the main covariates that affect the ES of MAC supplementation for acetate, propionate (Figure 3) and lactate were starch, starch, and NDF intake, respectively. Acetate to propionate ratio covariates were (P ≤ 0.05) NDF and starch intake. None of the covariates were useful in explaining the variation in MAC effect on butyrate proportion.
3.2. Digestibility
In general, MAC increased (P ≤ 0.05) macronutrient digestibility with ES of 0.547 for DM, 0.422 for CP, and 0.635 for ADF in total-tract apparent digestibility. However, MAC did not affect (P > 0.05) OM and NDF apparent digestibility. Dry matter digestibility increased (P ≤ 0.05) in animals fed MAC acid and was not affected (P > 0.05) by MAC salt. However, MAC acid had no effect (P > 0.05) and MAC salts increased (P ≤ 0.05) CP and NDF digestibility. The MAC acid tended (P = 0.08) to increase ADF and MAC salts increased (P = 0.03) ADF digestibility. Heterogeneity was significant (P < 0.05) for most variables related to digestibility, with the exception for CP and OM. The NDF intake tended to decrease the ES of MAC on DM digestibility. Starch intake was the main covariate explaining the variation in MAC’s effect on NDF digestibility.
3.3. Blood Parameters
There was an overall effect of MAC on blood glucose concentration (ES= 0.170, P = 0.05). In addition, MAC decreased blood non-esterified fatty acids (NEFA) (Overall ES= -0.404, P = 0.03). On the other hand, MAC showed no effect (P > 0.05) on blood ß-hydroxybutyrate and lactate. However, MAC acid decreased lactate in blood (Subgroup ES= -1.661, P > 0.01). Despite the significant heterogeneity for most of the blood parameters, the small number of studies was a limiting factor for carrying out the meta-regression analysis.
4. Discussion
4.1. Rumen Parameters
We hypothesized that true effects associated with malic acid supplementation, particularly on rumen pH, lactate uptake and propionate production, could be identified and better explored through meta-analysis. These primary effects would lead to secondary ones on the diet digestibility and on blood metabolites. Additionally, we expected that qualitative and quantitative covariates related to diet composition and MAC presentation would be useful to explain the between study variation. In this context, our hypotheses were at least partially confirmed. Significant effects were observed for some of the main variables where the interference from MAC supplementation was expected. Subgroup analysis indicated that the chemical form of the supplement may be decisive for the control of rumen acidity. Additionally, the meta-regression indicated that there are dietary covariates that significantly influence the effect size of MAC supplementation on some outcomes.
For rumen pH, the effects observed for the MAC presentation make sense if we consider the chemical nature of the supplements. In vitro studies indicate free malic acid and its disodium salt have similar effects, except for the reduction in pH caused by free malic acid [3]. The effect of acidic MAC observed in our study, although small (ES= -0.310) and not significant, indicates that its use negatively impacts rumen pH. On the other hand, the ES of 1,420 observed in the salt subgroup is considered large [16]. Effect sizes greater than 0.8 are considered large according to the Cohen scale. However, it is important to point out that the scale is subjective and the context in which it is being applied must be considered. Additionally, this ES indicates that the mean pH of the control group and the malate group are separated by 1.42 standard deviations. Considering a standard deviation of 0.18 for pH (average from studies in the database), supplementation with the salt form of MAC would imply an increase in pH of 0.26 units. One of the premises that led malic acid to be tested in ruminant diets was its ability, demonstrated in vitro, to increase lactate uptake [4]. The presence of this organic acid favors the growth of Selenomonas ruminantium, these bacteria uses lactate as a source of carbon and energy, which would imply maintaining rumen pH [5]. Additionally, MAC may act on pH through a second mechanism, which is the production of CO2 by S. ruminantium [9]. The I2 values indicated that 80.4% of variability occurred due to differences between studies. Values of I2 higher than 30% represent substantial heterogeneity, which may be investigated [15]. It was observed that NDF intake reduces the mean difference observed between treatments. It is possible that NDF intake ends up shadowing the effect of MAC on ruminal pH, as the presence of NDF implies longer rumination time and, consequently, greater buffering of ruminal pH [17].
Although there was an increase in rumen pH in animals supplemented MAC, it was not possible to confirm the effects of supplementation on lactate uptake in the rumen. Although the direction of the effect indicates a likely reduction (Overall ES= -0.113), especially when using the free acid (ES= -0.621), the result was not significant. The meta-regression analysis indicated that NDF intake decreases the ES, that is, in studies where NDF intake is higher, the effect MAC on lactate is smaller. High NDF intake implies low lactate levels in the rumen, impairing the growth of S. ruminantium and, consequently, the MAC effect. Additionally, for studies with high fiber intake, depending on the type and form of forage used, it is possible that MAC supplementation is occurring close to or above the limit at which its effect reaches a plateau. Malic acid can represent 2.2 to 4.5% of the dry matter of grasses and 2.9 to 7.5% of legumes, with this amount decreasing with the plant maturity [18]. Furthermore, preserved forages such as hay and silage have a lower content of this component. At this point, it is important to highlight that covariates such as fresh forage, dry forage and conserved forage intake as well as the forage:concentrate ratio were tested as continuous (meta-regression) or categorical (subgroup) covariates but were not significant (data not shown).
The effect size (0.508) obtained for total VFA concentration is considered moderate according to Cohen’s [16]. This is an expected response and occurred mainly due to the greater production of propionate, as there were no changes in the proportion of acetate and butyrate in the rumen. Concomitantly, the acetate:propionate ratio was higher for the control group, which confirms the higher proportion of propionate (Overall ES= 0.560) in the supplemented animals. If we consider an average standard deviation of 4.84 for the molar proportion of propionate, this ES may represent a difference of 2.71 percentage points between the means of animals supplemented or not with MAC. The higher propionate production occurs because S. ruminantium bacteria are able to use lactate as a carbon source provided that oxaloacetate precursors such as malate are present [19]. This acid can follow the reverse cycle of the succinate-propionate pathway and provide the oxaloacetate for lactate fermentation to propionate [5]. The heterogeneity values showed that there is high variability that is not associated with chance. The response indicated by the meta-regression seems in line with what is known about the mechanisms of action of MAC, since starch intake favors the growth of lactate-producing bacteria which, associated with malic acid, becomes a substrate for the production of VFAs by S. ruminantium [20].
The analysis of the NH3N indicated that supplementation with MAC, regardless of the form, results in negligible effect sizes (Overall ES= 0.079). This variable can be a marker of the amount of N available for synthesis and/or absorption in the rumen [21]. This N, when used to increase the microbial population in the rumen, would culminate in greater bacterial fermentation which, ultimately, could increase the digestibility of ruminant diet fractions. Did the meta-regression point out the NDF intake as a possible interfering factor in the effect of MAC over NH3N. Increased fiber intake stimulates an increase in cellulolytic bacterial populations, while those with proteolytic and amylolytic characteristics decrease [22]. Furthermore, the NDF intake can reduce the concentration of sugars in the rumen [23], which is one of the substrates for S. ruminantium, a malate-utilizing bacteria.
4.2. Digestibility
The results obtained for fiber and protein digestibility may be a secondary effect of MAC on the control of acidity in the rumen, since the drop in ruminal pH reduces the degradability of fibrous fractions and protein [21,24]. The association of this effect with pH would also explain why the effects on NDF, ADF and protein digestibility were only detected when the MAC salt (malate) was used, since the acid form was not shown to have an effect on rumen pH. Additionally, MAC has the ability to remove H2 from the rumen, stimulating an increase in the population of cellulolytic bacteria, which ends up impacting the total digestibility of fibrous fractions [25]. Furthermore, the effect observed on protein digestibility may have occurred due to the increase in the activity of proteolytic enzymes and/or a decrease in the duodenal pH necessary for effective proteolytic activity, promoted by malic acid [26,27]. The increase in DM digestibility due to supplementation with organic acid may occur due to an increase in enzymatic activity, increased secretions and association with the growth of beneficial bacterial populations [26]. On the other hand, MAC showed no effect on OM digestibility. As the variables are statistically independent, it occurred due to high variability and the smaller number of studies to carry out the meta-analysis for OM than DM digestibility. Despite the high heterogeneity, the meta-regression was not able to adequately explain the source of variation, with the exception of NDF digestibility. The analysis indicated that the intake of starch and also of protein (g/kg of BW) reduces the MAC ES on NDF digestibility. It is possible that starch intake reduces the MAC effect on NDF digestibility because the rapid fermentation of starch decreases rumen pH, creating a less favorable environment for cellulolytic bacteria that are responsible for fiber digestion [28].
4.3. Blood Parameters
Despite being considered small (ES=0.170), a significant effect on serum glucose level was detected due to MAC supplementation. Changes in this variable are related to the increase in propionate in the rumen and absorption by the epithelium, resulting in greater hepatic glucose synthesis [29]. Although our study observed greater protein digestibility for the supplemented group, plasma urea was not influenced by the supplementation with MAC. The concentration of urea N in plasma is used as an indicator to evaluate the protein status or protein nutrition of ruminants [30]. Despite the high heterogeneity for plasma urea, none of the covariates tested were adequate to explain the between studies variance. Animals supplemented with MAC also had lower levels of NEFA (ES= -0.404), which indicates less mobilization of body fat. This is an important answer because the level of NEFA in plasma correlates with the negative energy balance in early lactation cows, which allows this variable to be used as an indicator of energy balance [31]. It is important to point out that the small number of studies on most blood parameters may result in less precise estimates of the overall or subgroups effects and heterogeneity associated with these variables [15].
5. Conclusions
The effect of malic acid on pH was dependent on the chemical form, with positive effects being observed with the salt form of the product (malate). Supplementation did not affect lactate uptake in the rumen. Furthermore, malic acid increased the concentration of VFAs, especially propionate, resulting in a reduction in the acetate:propionate ratio. Digestibility of protein, NDF and ADF was improved with supplementation, indicating a stronger association with malate than free acid. Malic acid supplementation also resulted in an increase in glucose levels and a reduction in NEFA in the blood. Covariates such as NDF or starch intake were important in explaining the variability in effects observed in cattle supplemented with malic acid.
Author Contributions
Conceptualization, Leonardo Tombesi da Rocha and Julio Viégas.; methodology, Tiago Antonio Del Valle and Fernando Reimann Skonieski.; formal analysis, Tiago Antonio Del Valle.; investigation, Leonardo Tombesi da Rocha, Francine Basso and Paola Selau de Oliveira.; data curation, Stela Naetzold Pereira and Antonio Del Valle.; writing—original draft preparation, Leonardo Tombesi da Rocha.; writing—review and editing, Fernando Reimann Skonieski and Stela Naetzold Pereira.; visualization, Paola Selau de Oliveira and Francine Basso.; supervision, Julio Viégas.; project administration, Julio Viégas and Leonardo Tombesi da Rocha.
Funding
This research received no external funding.
Institutional Review Board Statement
Not applicable.
Informed Consent Statement
Not applicable.
Data Availability Statement
No new data were created or analyzed in this study. All data supporting the findings are publicly available in the original publications referenced in the manuscript.
Acknowledgments
The authors are grateful to the Federal University of Santa Maria (UFSM) and the Federal University of Technology – Paraná (UTFPR) for institutional support. We also acknowledge the Coordination for the Improvement of Higher Education Personnel (CAPES) for providing doctoral scholarships that contributed to the development of this study.
Conflicts of Interest
The authors declare no conflicts of interest.
References
- Duffield, T.F.; Merrill, J.K.; Bagg, R.N. Meta-analysis of the effects of monensin in beef cattle on feed efficiency, body weight gain, and dry matter intake. J. Anim. Sci. 2012, 90, 4583–4592. [Google Scholar] [CrossRef] [PubMed]
- European Union. Regulation (EC) No 124/2009. 2009. Available online: https://eur-lex.europa.eu/legal-content/EN/TXT/HTML/?uri=CELEX:32009R0124&from=EL.
- Martin, S.A.; Streeter, M.N. Effect of malate on in vitro mixed ruminal microorganism fermentation. J. Anim. Sci. 1995, 73, 2141–2145. [Google Scholar] [CrossRef] [PubMed]
- Carro, M.D.; Ranilla, M.J. Effect of the addition of malate on in vitro rumen fermentation of cereal grains. Br. J. Nutr. 2003, 89, 181–188. [Google Scholar] [CrossRef] [PubMed]
- Castillo, C.; Benedito, J.L.; Pereira, V.; Méndez, J.; Vazquez, P.; López-Alonso, M.; Hernández, J. Effects of malate supplementation on acid-base balance and productive performance in growing/finishing bull calves fed a high-grain diet. Arch. Anim. Nutr. 2007, 62, 70–81. [Google Scholar] [CrossRef]
- Kung, L.; Huber, J.T.; Krummrey, J.D.; Allison, L.; Cook, R.M. Influence of adding malic acid to dairy cattle rations on milk production, rumen volatile acids, digestibility, and nitrogen utilization. J. Dairy Sci. 1982, 65(7), 1170–1174. [Google Scholar] [CrossRef]
- Khampa, S.; Wanapat, M.; Wachirapakorn, C.; Nontaso, N.; Wattiaux, M.; Rowlison, P. Effect of levels of sodium DL-malate supplementation on ruminal fermentation efficiency of concentrates containing high levels of cassava chip in dairy steers. Anim. Biosci. 2006, 19, 368–375. [Google Scholar] [CrossRef]
- Liu, Q.; Wang, C.; Yang, W.; Dong, Q.; Dong, K.; Huang, Y.; He, D. Effects of malic acid on rumen fermentation, urinary excretion of purine derivatives and feed digestibility in steers. Animal 2009, 3, 32–39. [Google Scholar] [CrossRef] [PubMed]
- Martin, S.A.; Streeter, M.N.; Nisbet, D.J.; Hill, G.M.; Williams, S.E. Effects of DL-malate on ruminal metabolism and performance of cattle fed a high-concentrate diet. J. Anim. Sci. 1999, 77, 1008–1015. [Google Scholar] [CrossRef] [PubMed]
- El-Zaiat, H.M.; Kholif, A.E.; Mohamed, D.A.; Matloup, O.H.; Anele, U.Y.; Sallam, S.M.A. Enhancing lactational performance of Holstein dairy cows under commercial production: Malic acid as an option. J. Sci. Food Agric. 2019, 99, 885–892. [Google Scholar] [CrossRef] [PubMed]
- Castillo, C.; Benedito, J.L.; Pereira, V.; Vázquez, P.; López Alonso, M.; Méndez, J.; Hernández, J. Malic acid supplementation in growing/finishing feedlot bull calves: Influence of chemical form on blood acid–base balance and productive performance. Anim. Feed. Sci. Technol. 2007, 135, 222–235. [Google Scholar] [CrossRef]
- Carrasco, C.; Medel, P.; Fuentetaja, A.; Carro, M.D. Effect of malate form (acid or disodium/calcium salt) supplementation on performance, ruminal parameters and blood metabolites of feedlot cattle. Anim. Feed. Sci. Technol. 2012, 176, 140–149. [Google Scholar] [CrossRef]
- McGowan, J.; Sampson, M.; Salzwedel, D.M.; Cogo, E.; Foerster, V.; Lefebvre, C. PRESS peer review of electronic search strategies: 2015 guideline statement. J. Clin. Epidemiol. 2016, 75, 40–46. [Google Scholar] [CrossRef] [PubMed]
- DerSimonian, R.; Laird, N. Meta-analysis in clinical trials revisited. Contemp. Clin. Trials 2015, 45, 139–145. [Google Scholar] [CrossRef] [PubMed]
- Higgins, J. P., & Thompson, S. G. (2003). Measuring inconsistency in meta-analyses. BMJ, 327(7414), 557–560. [CrossRef]
- Cohen, J. (1988). Statistical power analysis for the behavioral sciences (2nd ed.). Lawrence Erlbaum Associates.
- Beauchemin, K. A. (2018). Invited review: Current perspectives on eating and rumination activity in dairy cows. Journal of Dairy Science, 101(6), 4762–4784. [CrossRef]
- Callaway, T. R., Martin, S. A., Wampler, J. L., Hill, N. S., & Hill, G. M. (1997). Malate content of forage varieties commonly fed to cattle. Journal of Dairy Science, 80(8), 1651–1655. [CrossRef]
- Evans, J. D., & Martin, S. A. (1997). Factors affecting lactate and malate utilization by Selenomonas ruminantium. Applied and Environmental Microbiology, 63(12), 4853–4858. [CrossRef]
- Callaway, T. R., & Martin, S. A. (1996). Effects of organic acid and monensin treatment on in vitro mixed ruminal microorganism fermentation of cracked corn. Journal of Animal Science, 74(8), 1982–1989. [CrossRef]
- Bach, A., Calsamiglia, S., & Stern, M. D. (2005). Nitrogen metabolism in the rumen. Journal of Dairy Science, 88, E9–E21. [CrossRef]
- Wanapat, M., Gunun, P., Anantasook, N., & Kang, S. (2014). Changes of rumen pH, fermentation and microbial population as influenced by different ratios of roughage (rice straw) to concentrate in dairy steers. The Journal of Agricultural Science, 152(4), 675–685. [CrossRef]
- Kozloski, G. V., Trevisan, L. M., Bonnecarrère, L. M., Härter, C. J., Fiorentini, G., Galvani, D. B., & Pires, C. C. (2006). Níveis de fibra em detergente neutro na dieta de cordeiros: Consumo, digestibilidade e fermentação ruminal. Arquivo Brasileiro de Medicina Veterinária e Zootecnia, 58(5), 893–900. [CrossRef]
- Dijkstra, J., Ellis, J. L., Kebreab, E., Strathe, A. B., López, S., France, J., & Bannink, A. (2012). Ruminal pH regulation and nutritional consequences of low pH. Animal Feed Science and Technology, 172(1–2), 22–33. [CrossRef]
- Morvan, B., Rieu-Lesme, F., Fonty, G., & Gouet, P. (1996). In vitro interactions between rumen H2-producing cellulolytic microorganisms and H2-utilizing acetogenic and sulfate-reducing bacteria. Anaerobe, 2(3), 175–180. [CrossRef]
- Papatsiros, V., Katsoulos, P., Koutoulis, K., Karatzia, M., Dedousi, A., & Christodoulopoulos, G. (2013). Alternatives to antibiotics for farm animals. CAB Reviews: Perspectives in Agriculture, Veterinary Science, Nutrition and Natural Resources, 8. [CrossRef]
- Øverland, M., Granli, T., Kjos, N. P., Fjetland, O., Steien, S. H., & Stokstad, M. (2000). Effect of dietary formates on growth performance, carcass traits, sensory quality, intestinal microflora, and stomach alterations in growing-finishing pigs. Journal of Animal Science, 78(7), 1875–1884. [CrossRef]
- Hua, D., Hendriks, W. H., Xiong, B., & Pellikaan, W. F. (2022). Starch and cellulose degradation in the rumen and applications of metagenomics on ruminal microorganisms. Animals, 12(21), 3020. [CrossRef]
- Zhang, J., Shi, H. T., Wang, Y. C., Li, S. L., Cao, Z. J., Yang, H. J., & Wang, Y. J. (2020). Carbohydrate and amino acid metabolism and oxidative status in Holstein heifers precision-fed diets with different forage to concentrate ratios. Animal, 14(11), 2315–2325. [CrossRef]
- Huntington, G. B., & Archibeque, S. L. (1999). Practical aspects of urea and ammonia metabolism in ruminants. In Proceedings of the American Society of Animal Science (pp. 1–11).
- Adewuyi, A. A., Gruys, E., & van Eerdenburg, F. J. C. M. (2005). Non esterified fatty acids (NEFA) in dairy cattle: A review. Veterinary Quarterly, 27(3), 117–126. [CrossRef]
- Sniffen, C. J., Ballard, C. S., Carter, M. P., Cotanch, K. W., Dann, H. M., Grant, R. J., Mandebvu, P., Suekawa, M., & Martin, S. A. (2006). Effects of malic acid on microbial efficiency and metabolism in continuous culture of rumen contents and on performance of mid-lactation dairy cows. Animal Feed Science and Technology, 127(1–2), 13–31. [CrossRef]
- Devant, M., Bach, A., & García, J. A. (2007). Effect of malate supplementation to dairy cows on rumen fermentation and milk production in early lactation. Journal of Applied Animal Research, 31(2), 169–172. [CrossRef]
- Foley, P. A., Kenny, D. A., Lovett, D. K., Callan, J. J., Boland, T. M., & O’Mara, F. P. (2009). Effect of dl-malic acid supplementation on feed intake, methane emissions, and performance of lactating dairy cows at pasture. Journal of Dairy Science, 92(7), 3258–3264. [CrossRef]
- Wang, c., Liu, Q., Yang, W. Z., Dong, Q., Yang, X. M., He, D. C., Dong, K. H., & Huang, Y. X. (2009). Effects of malic acid on feed intake, milk yield, milk components and metabolites in early lactation Holstein dairy cows. Livestock Science, 124(1–3), 182–188. [CrossRef]
- Hernández, J., Castillo, C., Méndez, J., Pereira, V., Vázquez, P., López Alonso, M., Vilariño, O., & Benedito, J. L. (2011). The influence of chemical form on the effects of supplementary malate on serum metabolites and enzymes in finishing bull calves. Livestock Science, 137(1–3), 260–263. [CrossRef]
- Vyas, D., Beauchemin, K. A., & Koenig, K. M. (2015). Using organic acids to control subacute ruminal acidosis and fermentation in feedlot cattle fed a high-grain diet. Journal of Animal Science, 93(8), 3950–3958.
- Malekkhahi, M., Tahmasbi, A. M., Naserian, A. A., Danesh-Mesgaran, M., Kleen, J. L., AlZahal, O., & Ghaffari, M. H. (2016). Effects of supplementation of active dried yeast and malate during sub-acute ruminal acidosis on rumen fermentation, microbial population, selected blood metabolites, and milk production in dairy cows. Animal Feed Science and Technology, 213, 29–43. [CrossRef]
Figure 1.
Forest plot of the effect of supplementation with malic acid or malate on the pH of cattle. When the diamond was presented to the left of the central line (standardized mean) without touching it, the effect was considered to be negative, favoring control. When presented to the right of the center line, the effect was considered positive, in favor of the supplement.
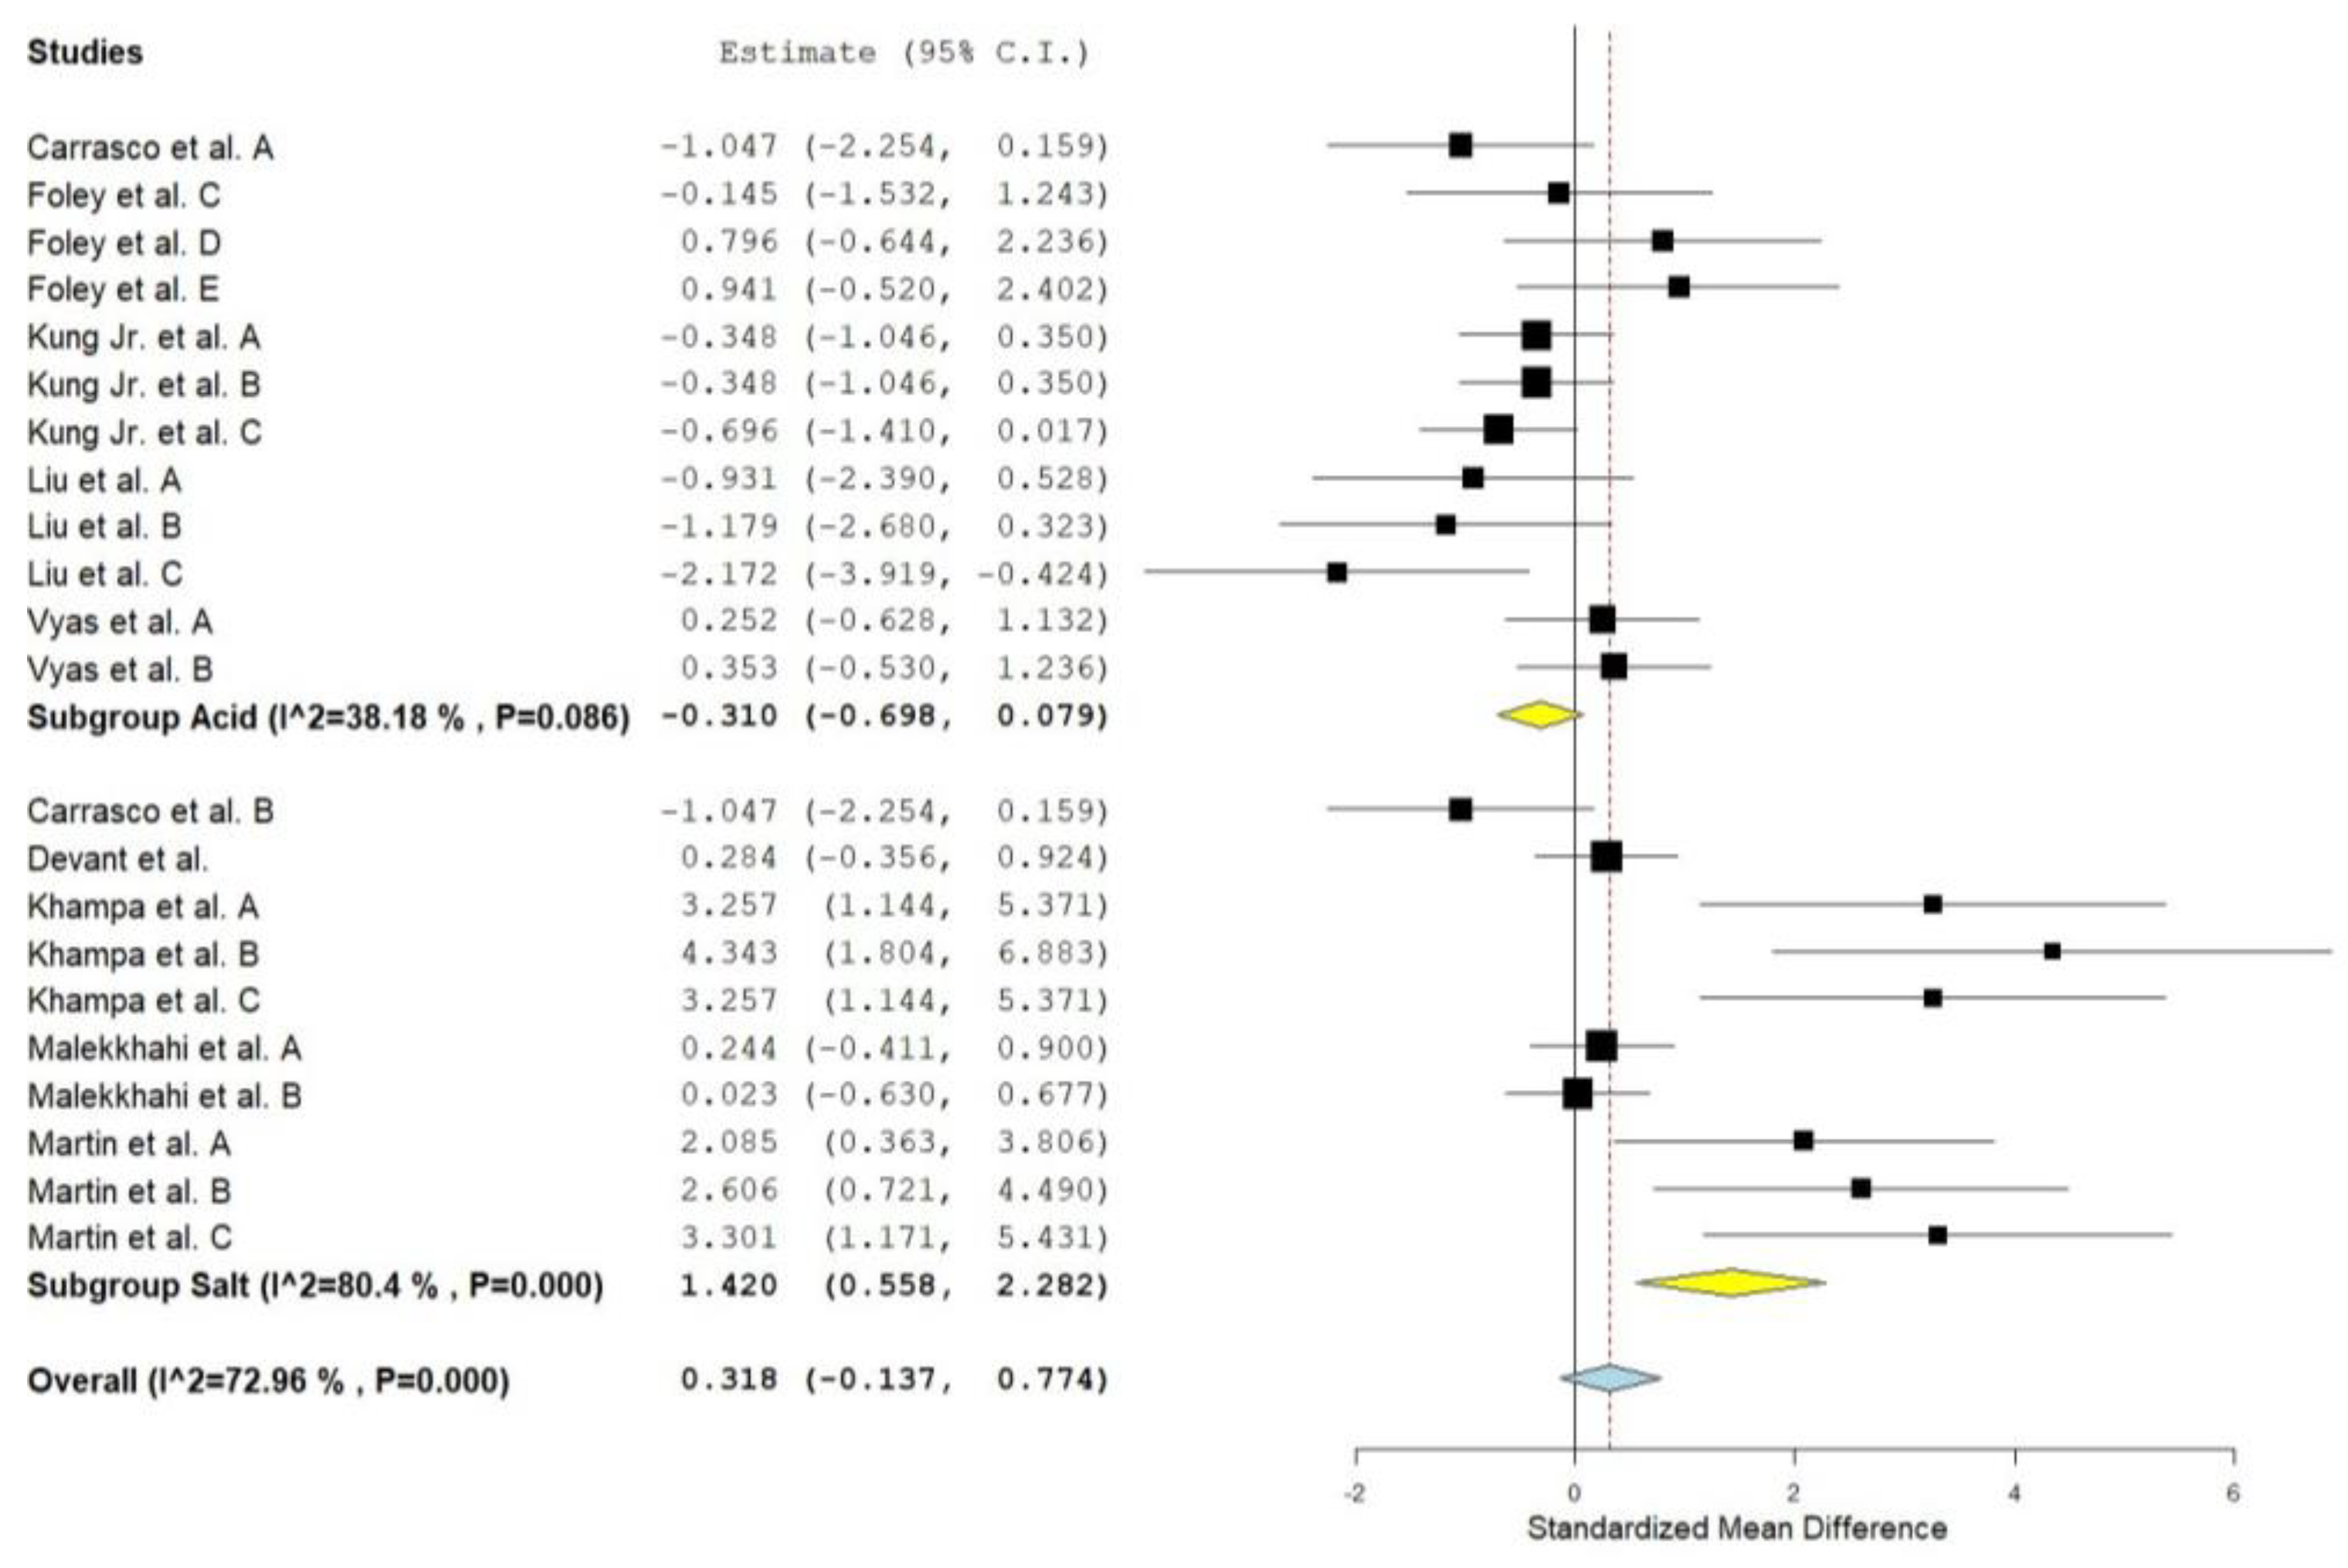
Figure 2.
Forest plot of the effect of supplementation with malic acid or malate on total volatile fatty acids in cattle. When the diamond was presented to the left of the central line (standardized mean) without touching it, the effect was considered to be negative, favoring control. When presented to the right of the center line, the effect was considered positive, in favor of the supplement.
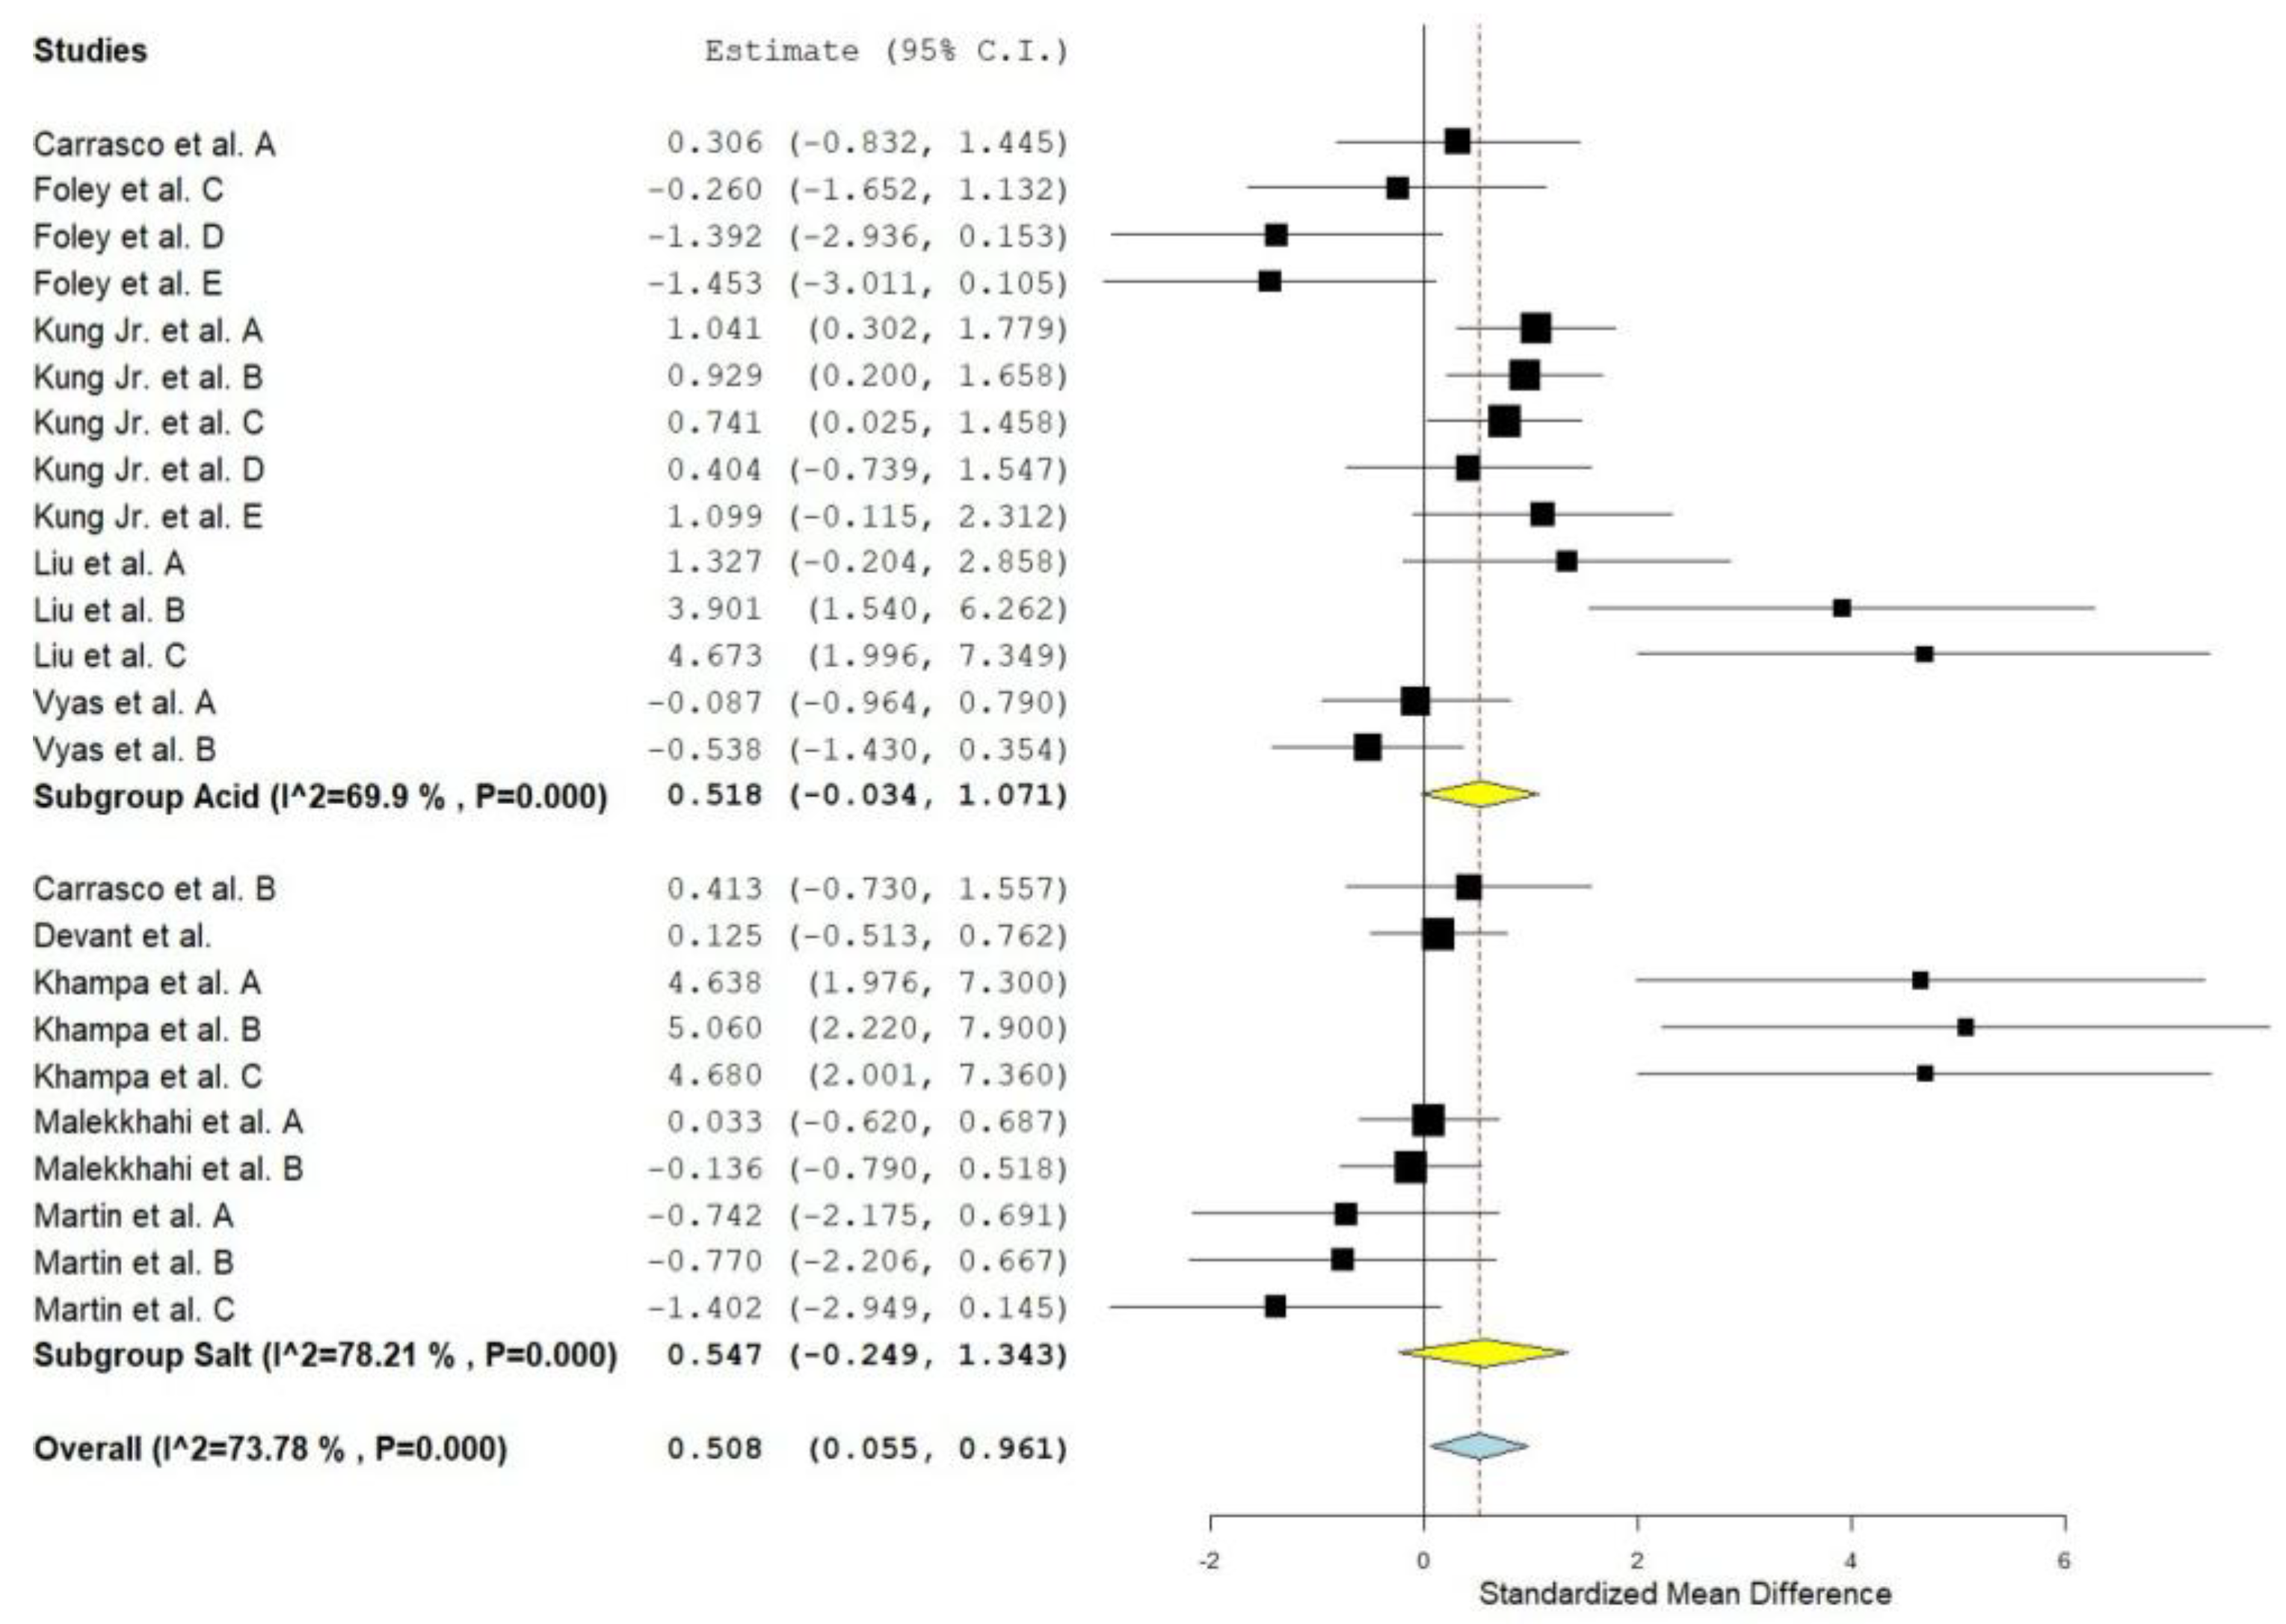
Figure 3.
Meta-regression of the effect of starch intake (g/kg BW) on the standardized mean difference of malate or malic acid supplementation on propionate in the rumen of cattle.
Figure 3.
Meta-regression of the effect of starch intake (g/kg BW) on the standardized mean difference of malate or malic acid supplementation on propionate in the rumen of cattle.
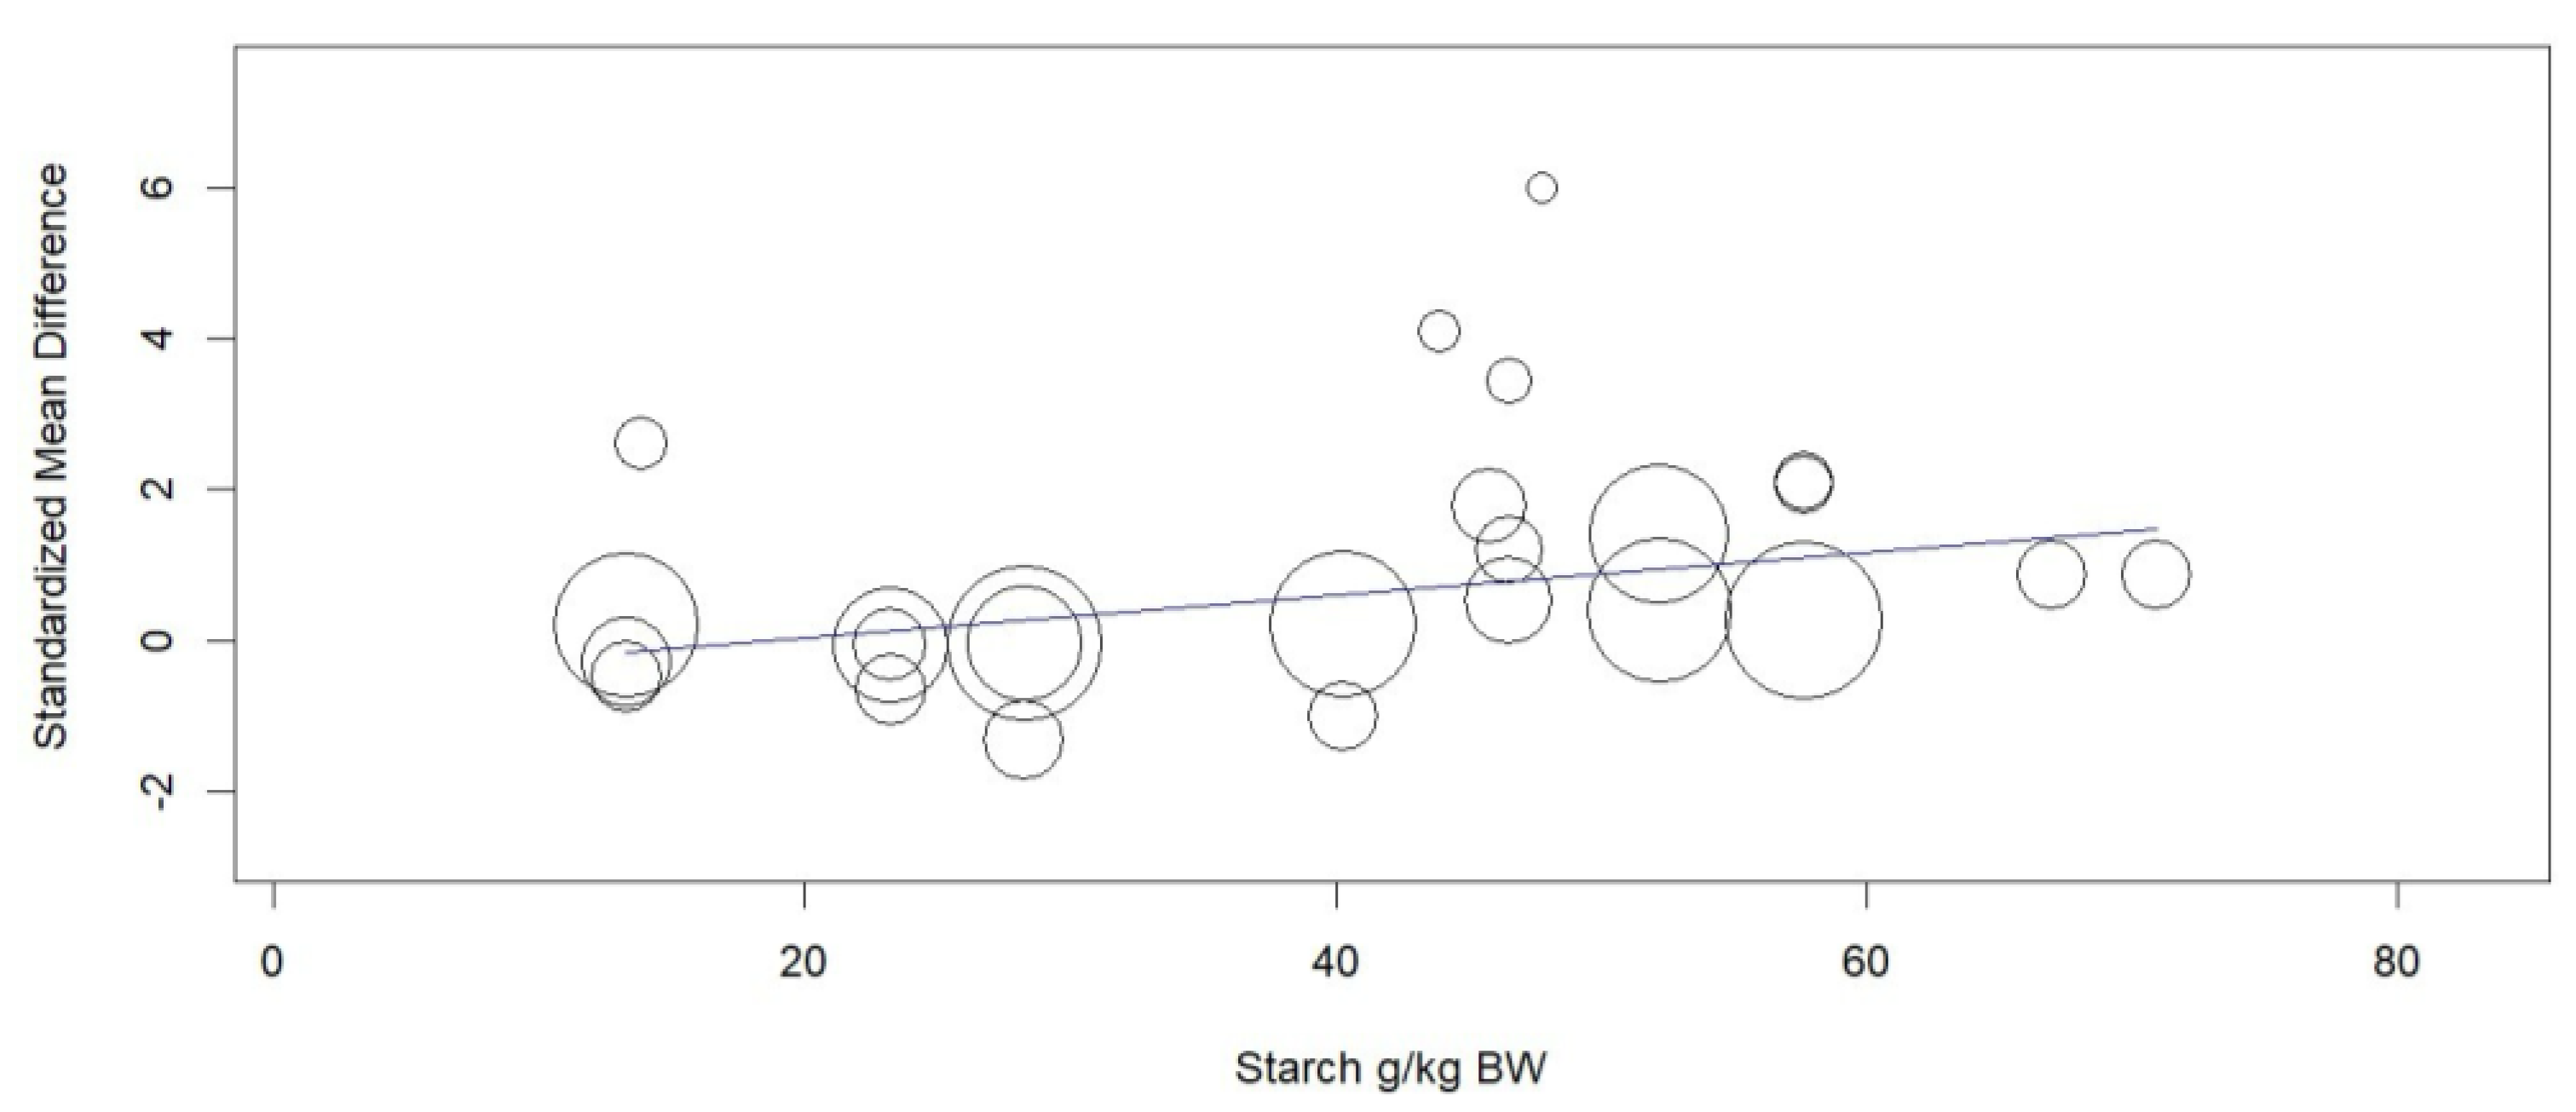

Table 1.
Chemical form, cereal and main forage, supplement dose and calculated composition of the total ration mixed in experiments with cattle supplemented with malic acid or malate.
Table 1.
Chemical form, cereal and main forage, supplement dose and calculated composition of the total ration mixed in experiments with cattle supplemented with malic acid or malate.
| Author | Form | Main Cereal | Main forrage | Dose (g/day) | CP (%) | NDF (%) | ADF (%) | Starch (%) | EE (%) |
|---|---|---|---|---|---|---|---|---|---|
| Kung Jr. et al. 1982 A | Acid | Corn | Corn silage | 70.00 | 11.18 | 24.71 | 13.95 | 35.77 | 1.99 |
| Kung Jr. et al. 1982 B | Acid | Corn | Corn silage | 105.00 | 11.18 | 24.71 | 13.95 | 35.77 | 1.99 |
| Kung Jr. et al. 1982 C | Acid | Corn | Corn silage | 140.00 | 11.18 | 24.71 | 13.95 | 35.77 | 1.99 |
| Kung Jr. et al. 1982 D | Acid | Corn | Corn silage | 42.00 | 8.76 | 25.54 | 13.76 | 46.78 | 2.77 |
| Kung Jr. et al. 1982 E | Acid | Corn | Corn silage | 84.00 | 8.76 | 25.54 | 13.76 | 46.78 | 2.77 |
| Martin et al. 1999 A | Saltt | Corn | Cottonseed hulls | 27.00 | 11.39 | 19.10 | 9.93 | 49.60 | 2.95 |
| Martin et al. 1999 B | Saltt | Corn | Cottonseed hulls | 54.00 | 11.39 | 19.10 | 9.93 | 49.60 | 2.95 |
| Martin et al. 1999 C | Saltt | Corn | Cottonseed hulls | 80.00 | 11.39 | 19.10 | 9.93 | 49.60 | 2.95 |
| Sniffen et al. 2006 | Saltt | Corn | Corn silage | 50.00 | 18.20 | 31.80 | 21.40 | 29.40 | 2.70 |
| Khampa et al. 2006 A | Saltt | Cassava | Rice straw | 9.00 | 8.61 | 41.14 | 23.86 | 34.90 | 3.51 |
| Khampa et al. 2006 B | Saltt | Cassava | Rice straw | 18.00 | 8.61 | 41.14 | 23.86 | 34.90 | 3.51 |
| Khampa et al. 2006 C | Saltt | Cassava | Rice straw | 27.00 | 8.61 | 41.14 | 23.86 | 34.90 | 3.51 |
| Devant et al. 2007 | Saltt | - | - | 84.00 | 14.31 | 32.84 | 16.93 | 30.16 | 3.16 |
| Foley et al. 2009 A | Acid | Barley | Silage | 34.00 | 15.60 | 23.10 | 13.80 | 28.10 | 2.50 |
| Foley et al. 2009 B | Acid | Barley | Silage | 65.40 | 15.60 | 23.10 | 13.80 | 28.10 | 2.50 |
| Foley et al. 2009 C | Acid | Barley | Silage | 32.38 | 15.57 | 23.09 | 13.82 | 28.12 | 2.47 |
| Foley et al. 2009 D | Acid | Barley | Silage | 64.85 | 15.57 | 23.09 | 13.82 | 28.12 | 2.47 |
| Foley et al. 2009 E | Acid | Barley | Silage | 98.25 | 15.57 | 23.09 | 13.82 | 28.12 | 2.47 |
| Wang et al. 2009 A | Acid | Corn | Corn silage | 70.00 | 16.50 | 42.40 | 27.10 | 31.70 | 1.50 |
| Wang et al. 2009 B | Acid | Corn | Corn silage | 140.00 | 16.50 | 42.40 | 27.10 | 31.70 | 1.50 |
| Wang et al. 2009 C | Acid | Corn | Corn silage | 210.00 | 16.50 | 42.40 | 27.10 | 31.70 | 1.50 |
| Liu et al. 2009 A | Acid | Corn | Corn straw | 70.20 | 8.29 | 55.82 | 21.85 | 14.78 | 1.72 |
| Liu et al. 2009 B | Acid | Corn | Corn straw | 140.40 | 8.29 | 55.82 | 21.85 | 14.78 | 1.72 |
| Liu et al. 2009 C | Acid | Corn | Corn straw | 210.60 | 8.29 | 55.82 | 21.85 | 14.78 | 1.72 |
| Hernández et al. 2011 A | Salt | Barley | Barley straw | 30.80 | 13.83 | 37.30 | 16.62 | 28.51 | 3.87 |
| Hernández et al. 2011 B | Acid | Barley | Barley straw | 26.80 | 13.83 | 37.30 | 16.62 | 28.51 | 3.87 |
| Hernández et al. 2011 C | Salt | Barley | Barley straw | 28.40 | 13.83 | 37.30 | 16.62 | 28.51 | 3.87 |
| Carrasco et al. 2012 A | Acid | Barley | Barley straw | 9.38 | 16.61 | 21.59 | 8.35 | 37.04 | 9.76 |
| Carrasco et al. 2012 B | Salt | Barley | Barley straw | 9.12 | 16.61 | 21.59 | 8.35 | 37.04 | 9.76 |
| Vyas et al. 2015 A | Acid | Barley | Barley silage | 89.00 | 9.74 | 16.86 | 6.57 | 45.32 | 1.57 |
| Vyas et al. 2015 B | Acid | Barley | Barley silage | 177.00 | 9.74 | 16.86 | 6.57 | 45.32 | 1.57 |
| Malekkhahi et al. 2016 A | Salt | Corn | Corn silage | 80.00 | 17.69 | 27.64 | 16.66 | 29.90 | 2.23 |
| Malekkhahi et al. 2016 B | Salt | Corn | Corn silage | 80.00 | 20.93 | 32.50 | 18.25 | 45.53 | 2.74 |
| El-Zaiat et al. 2019 | Acid | Corn | Corn silage | 30.00 | 17.16 | 32.29 | 19.06 | 36.70 | 5.60 |
CP, crude protein; NDF, neutral detergent fiber; ADF, acid detergent fiber; EE, Ether extract; Capital letters indicate different experiments/comparisons within a study.
Table 2.
Summary of meta-analysis (effect size) of malate or malic acid supplementation on ruminal parameters of cattle.
Table 2.
Summary of meta-analysis (effect size) of malate or malic acid supplementation on ruminal parameters of cattle.
| Variable | Form | n | ES(CI) | ES p-value | I2 | Het p-value |
|---|---|---|---|---|---|---|
| pH | Salt | 11 | 1.420 (0.558; 2.282) | 0.00 | 80.40 | <0.01 |
| Acid | 12 | -0.310 (-0.698; 0.079) | 0.12 | 38.18 | 0.09 | |
| Overall | 23 | 0.310 (-0.137; 0.774) | 0.17 | 72.95 | <0.01 | |
| Acetate | Salt | 11 | -0.592 (-1.381; 0.196) | 0.14 | 72.26 | <0.01 |
| Acid | 14 | 0.167 (-0.386; 0.720) | 0.55 | 78.08 | <0.01 | |
| Overall | 25 | -0.120 (-0.584; 0.345) | 0.61 | 76.34 | <0.01 | |
| Butyrate | Salt | 11 | -0.356 (-1.040; 0.328) | 0.31 | 72.84 | <0.01 |
| Acid | 14 | -0.058 (-0.717; 0.601) | 0.86 | 78.39 | <0.01 | |
| Overall | 25 | -0.178 (-0.653; 0.297) | 0.46 | 76.69 | <0.01 | |
| Propionate | Salt | 11 | 0.756 (-0.075; 1.588) | 0.08 | 80.10 | <0.01 |
| Acid | 14 | 0.472 (0.066; 0.879) | 0.02 | 48.17 | 0.02 | |
| Overall | 25 | 0.560 (0.160; 0.959) | 0.01 | 67.31 | <0.01 | |
| Lactate | Salt | 6 | 0.337 (-0.517; 1.191) | 0.44 | 67.60 | 0.01 |
| Acid | 6 | -0.621 (-1.512; 0.270) | 0.17 | 74.94 | <0.01 | |
| Overall | 12 | -0.113 (-0.711; 0.485) | 0.71 | 70.76 | <0.01 | |
| ACT:PRP | Salt | 9 | -1.327 (-2.683; 0.030) | 0.06 | 82.04 | <0.01 |
| Acid | 6 | -1.109 (-2.470; 0.252) | 0.11 | 83.70 | <0.01 | |
| Overall | 15 | -1.130 (-2.028; -0.232) | 0.01 | 81.68 | <0.01 | |
| NH3N | Salt | 8 | 0.161 (-0.170; 0.492) | 0.34 | 0.99 | 0.42 |
| Acid | 12 | -0.089 (-0.560; 0.381) | 0.71 | 47.12 | 0.04 | |
| Overall | 20 | 0.079 (-0.227; 0.385) | 0.61 | 36.62 | 0.05 | |
| Total VFA | Salt | 11 | 0.547 (-0.249; 1.343) | 0.18 | 78.21 | <0.01 |
| Acid | 14 | 0.518 (-0.034; 1.071) | 0.07 | 69.90 | <0.01 | |
| Overall | 25 | 0.508 (0.055; 0.961) | 0.03 | 73.78 | <0.01 |
N = number of comparisons; ES = effect size; CI = confidence interval; VFA = volatile fatty acids; NH3N = ammonia nitrogen; ACT:PRP = acetate:propionate ratio.
Table 3.
Summary of meta-analysis (effect size) of malate or malic acid supplementation on blood parameters and diet digestibility of cattle.
Table 3.
Summary of meta-analysis (effect size) of malate or malic acid supplementation on blood parameters and diet digestibility of cattle.
| Trait | Form | Std | ES(CI) | p-value | I2 | Het p-value |
|---|---|---|---|---|---|---|
| Blood parameters | ||||||
| Glucose | Salt | 7 | 0.163 (-0.132; 0.457) | 0.28 | 0.00 | 0.88 |
| Acid | 9 | 0.173 (-0.034; 0.379) | 0.10 | 0.49 | 0.43 | |
| Overall | 16 | 0.170 (0.002; 0.338) | 0.05 | 0.00 | 0.78 | |
| Urea | Salt | 7 | 0.028 (-0.385; 0.441) | 0.89 | 45.12 | 0.11 |
| Acid | 8 | -0.109 (-0.413; 0.194) | 0.48 | 53.35 | 0.04 | |
| Overall | 15 | -0.033 (-0.279; 0.212) | 0.79 | 47.24 | 0.03 | |
| Lactate | Salt | 7 | -0.060 (-0.956; 0.836) | 0.90 | 82.63 | <0.01 |
| Acid | 2 | -1.661 (-2.690; -0.361) | 0.01 | 57.23 | 0.13 | |
| Overall | 9 | -0.490 (-1.316; 0.337) | 0.25 | 83.31 | <0.01 | |
| NEFA | Salt | 2 | -0.024 (-0.597; 0.550) | 0.94 | 0.00 | 0.94 |
| Acid | 7 | -0.626 (-1.065; -0.187) | 0.01 | 0.00 | 0.47 | |
| Overall | 9 | -0.404 (-0.759; -0.049) | 0.03 | 3.56 | 0.40 | |
| ß-hidroxibutirato | Salt | 2 | 0.532 (-0.769; 1.832) | 0.42 | 78.81 | 0.03 |
| Acid | 7 | -0.260 (-1.172; 0.652) | 0.58 | 75.68 | 0.01 | |
| Overall | 9 | -0.018 (-0.742; 0.706) | 0.96 | 75.20 | <0.01 | |
| Digestibility | ||||||
| Dry matter | Salt | 5 | -0.084 (-0.575; 0.407) | 0.74 | 0.00 | 0.95 |
| Acid | 8 | 0.940 (0.229; 1.651) | 0.01 | 73.01 | 0.01 | |
| Overall | 13 | 0.547 (0.027; 1.067) | 0.04 | 78.74 | <0.01 | |
| Organic matter | Salt | 4 | 0.056 (-0.435; 0.546) | 0.82 | 0.00 | 0.99 |
| Acid | 5 | 0.694 (-0.217; 1.604) | 0.14 | 53.15 | 0.07 | |
| Overall | 9 | 0.308 (-0.148; 0.764) | 0.19 | 21.24 | 0.25 | |
| Protein | Salt | 5 | 1.168 (0.217; 2.118) | 0.02 | 52.70 | 0.10 |
| Acid | 8 | 0.215 (-0.197; 0.627) | 0.31 | 0.00 | 0.97 | |
| Overall | 13 | 0.422 (0.099; 0.745) | 0.01 | 0.00 | 0.47 | |
| NDF | Salt | 5 | 1.537 (0.277; 2.797) | 0.02 | 77.39 | 0.00 |
| Acid | 6 | -0.085 (-0.576; 0.406) | 0.73 | 0.00 | 0.94 | |
| Overall | 11 | 0.699 (-0.007; 1.406) | 0.05 | 67.29 | 0.01 | |
| ADF | Salt | 4 | 0.547 (0.042; 1.051) | 0.03 | 0.00 | 0.45 |
| Acid | 8 | 0.654 (-0.078; 1.387) | 0.08 | 60.62 | 0.01 | |
| Overall | 12 | 0.635 (0.148; 1.121) | 0.01 | 46.49 | 0.03 |
N number of comparisons; ES effect size; CI confidence interval; NEFA non esterified fatty acids; NDF neutral detergent fiber; ADF acids detergent fiber.
Table 4.
Meta-regression of the effect of supplementation with malic acid or malate on ruminal and blood parameters and digestibility of dietary fractions determined with cattle.
Table 4.
Meta-regression of the effect of supplementation with malic acid or malate on ruminal and blood parameters and digestibility of dietary fractions determined with cattle.
| Variables | Covariables, g/kg BW | |||
|---|---|---|---|---|
| NDF | ADF | Starch | Organic acid | |
| Rumen parameters | ||||
| pH | 2.063 -0.051x* | 0.908 -0.142 | 0.584 -0.004x | 0.343+ 0.548x |
| Acetate | 0.126 -0.008x | 0.464 -0.173x | -1.726 +0.039x** | -0.455+ 2.690x |
| Butyrate | -1.475 +0.038x | -1.155 +0.252x | -0.649 +0.009x | -1.121 +7.116x |
| Propionate | 0.239 +0.009x | 0.357 +0.055x | -0.518+0.028x** | 0.871 -2.894x |
| Lactate | 1.250 -0.041x* | 0.684 -0.242x | -1.462 +0.031xT | -0.547 +3.758x |
| Acetate:propionate | 1.887 -0.118x* | 3.057 -1.463x** | -7.483 +0.156x** | -3.000 +10.725x |
| NH3N | 1.337 -0.033x** | 0.854 -0.176x | -0.032 +0.002x | 0.262 -1.384x |
| Total VFA | -0.034 +0.019x | 0.632-0.013x | -1.033+0.042x* | 1.258 -5.318x |
| Blood parameters | ||||
| Urea | -0.074 +0.001x | -0.053 +0.005x | 0.370 -0.007x | 0.007 -0.190x |
| Digestibility | ||||
| Dry matter | -0.374 +0.023xT | 0.418 +0.021x | 0.673 -0.004x | 1.067 -6.511x |
| Protein | 0.613 -0.004x | 0.336 +0.016x | 0.483 -0.002x | 0.560 -1.665x |
| NDF | 0.135 +0.013x | 1.309 -0.171xT | 1.375 -0.025x* | 1.530 -13.733xT |
| ADF | 0.550 -0.002x | 0.695 -0.039x | 1.167 -0.016x | 0.795 -3.606x |
N number of comparisons; ES effect size; CI confidence interval; NEFA non esterified fatty acids; NDF neutral detergent fiber; ADF acids detergent fiber. *P<0.05; **P<0.01; T Tendency; NDF neutral detergent fiber; ADF acid detergent fiber; VFA volatile fatty acids.
Disclaimer/Publisher’s Note: The statements, opinions and data contained in all publications are solely those of the individual author(s) and contributor(s) and not of MDPI and/or the editor(s). MDPI and/or the editor(s) disclaim responsibility for any injury to people or property resulting from any ideas, methods, instructions or products referred to in the content. |
© 2025 by the authors. Licensee MDPI, Basel, Switzerland. This article is an open access article distributed under the terms and conditions of the Creative Commons Attribution (CC BY) license (http://creativecommons.org/licenses/by/4.0/).
Copyright: This open access article is published under a Creative Commons CC BY 4.0 license, which permit the free download, distribution, and reuse, provided that the author and preprint are cited in any reuse.


