
Submitted:
29 November 2024
Posted:
02 December 2024
You are already at the latest version
Abstract
This study aimed to evaluate the effects of Saccharomyces cerevisiae cell wall extract supplementation on the metabolic health of Holstein dairy cows during the transitional period, focusing on fat and protein metabolism, inflammatory status, and the interrelationships among key blood parameters. Using Principal Component Analysis (PCA) and Factor Analysis (FA), the study provided a novel approach to simplifying and understanding the complex metabolic changes occurring during this critical period. The experiment involved 26 multiparous Holstein cows randomly assigned to control and treatment groups, with blood samples collected at four sampling times: 21 and 7 days before calving, and 7 and 21 days after calving in two separate farms. The results showed that S. cerevisiae supplementation led to early and mid-term improvements in glucose metabolism, inflammatory responses, and fat metabolism, as indicated by changes in key blood parameters such as NEFA, BHBA, and SAA. However, these effects were not observed in 3rd and 4th sampling times, with no significant differences between the treatment and control groups. The findings suggest that S. cerevisiae supplementation offers potential benefits during the early transitional period 21 and 7 days before calving. This study's novel statistical approach not only enhances our understanding of the complex metabolic processes during the transitional period associated with S. cerevisiae supplementation but also provides simplicity, making these complex relationships easier to comprehend potentially improving dairy cow’s health.
Keywords:
Saccharomyces cerevisiae
; dairy cows
; transitional period factor analysis
1. Introduction
The transitional period in dairy cows involves complex metabolic changes that may be further influenced by Saccharomyces cerevisiae cell wall extract supplementation. This study aims to use principal component analysis (PCA) and factor analysis (FA) to evaluate the effects of S. cerevisiae supplementation on metabolic changes in dairy cows during this critical period, thereby simplifying and generalizing the possible impact of S. cerevisiae supplementation on dairy cow metabolism and enhancing understanding of probiotic intervention's role in metabolic regulation.
The transitional period is critical in dairy cattle farming, encompassing the three weeks before and after calving [1]. During this time, the nutritional demands for milk production surge, requiring cows to rapidly adjust their nutritional intake and physiological adaptability which can be associated with postpartum metabolic diseases [2,3,4]. During the transitional period, dry matter intake can decrease by up to 40%, despite a significant rise in nutritional requirements. Cows need up to three times more glucose and twice as many amino acids during this phase, as the production of 1 kg of milk requires approximately 72 g of glucose [2,5]. To meet the increased energy demands, adipose tissue releases non-esterified fatty acids (NEFA), and the liver produces ketone bodies such as beta-hydroxybutyrate (BHB). Additionally, hypocalcemia during this period contributes to immunosuppression [6]. The intricate nature of metabolic diseases in the postpartum period, alongside the negative energy balance (NEB) and immunosuppression, complicates the comprehension of the interrelationships among metabolic parameters in dairy cows during the transitional period [7].
It has been reported that yeast cell extracts of S. Cerevisiae supplementation can enhance the overall metabolic state and reduce unfavorable metabolites such as aflatoxins during the transitional period [8,9]. This improvement is attributed to better gastrointestinal health, achieved by regulating and harmonizing the gastrointestinal flora, thereby protecting against infectious diseases [10,11]. The highly diverse and dynamic nature of the gastrointestinal tract microflora in dairy cows [12], the multifaceted effects of S. Cerevisiae supplementation on various physiological processes [13], the influence of differing environmental conditions on S. Cerevisiae supplementation efficacy [14], and the variability in research findings regarding S. Cerevisiae supplementation impact on the metabolic condition of ruminants [15,16] collectively contribute to the complexity of comprehending the effects of S. Cerevisiae supplementation on the overall metabolic condition of dairy cows, particularly during the transitional period.
Given the complex nature of metabolic diseases and the disruption of normal metabolism during the transitional period, S. Cerevisiae supplementation may enhance the overall metabolic condition of dairy cows through multifaceted pathways. Factor analysis is a robust statistical method that effectively accounts for dependencies among variables [17,18] and the analysis and its related procedures are accessible in various statistical software packages, including SAS [19]. The objective of this study is to employ factor analysis to simplify the evaluation of the possible effects of S. Cerevisiae supplementation on Holstein dairy cows' metabolism during the transitional period. We hypothesize that S. Cerevisiae supplementation can improve fat and protein metabolism, and inflammatory status of dairy cows during the transitional period.
2. Materials and Methods
2.1. Compliance with Ethical Standards
All cows involved in this experiment were managed following the technical regulations and guidelines set forth by Shiraz University's Committee of Animal Ethics in Iran. The study protocols received approval from the Ethics Committee of Shiraz University (IACUC no: 4687/63). Furthermore, we adhered to the recommendations of the European Council Directive (86/609/EC) of November 24, 1986, concerning the standards for the protection of animals used in experimental procedures.
2.2. Animal Husbandry, Housing and Diet Consideration
Holstein dairy cows from two dairy farms were included in this study: Farm 1 (housing 1000 Holstein cows, located in Khorasan-Razavi province, northeast Iran) and Farm 2 (housing 1200 Holstein cows, located in Fars province, south-central Iran) during the winter months, ensuring coordination based on their milk production in the previous lactation and calving dates. The cows were housed in well-ventilated free-stall barns with sand bedding. Each pen featured two rows of free stalls, sprinklers over the feed bunk, and fans above the feed bunk and stalls. Close-up cows were housed in separate pens with two rows of stalls in naturally ventilated, sand-bedded free-stall barns. Upon detecting signs of calving, the cows were promptly transferred to straw-bedded loose housing pens. After parturition, the cows were moved to a designated area for the experiment, where they were closely monitored for any signs of disease or calving-related abnormalities. Subsequently, they were relocated to the fresh cow pen. The cows were fed a formulated total mixed ration (TMR) tailored to their nutritional needs and following NRC 2001 standards. The TMR was provided twice daily, at 9 a.m. and 7 p.m., with leftovers removed and replaced and pushed up every 4 hours. The diet primarily comprised corn silage, grass silage along with concentrates and supplements. The postpartum diet was designed to meet or exceed the NRC 2001 nutritional requirements for lactating Holstein cows weighing 650 kg and producing 45 kg of 3.5% fat-corrected milk.
2.3. Experimental Design and Supplementation
The cows were randomly allocated to experimental groups at the beginning of the dry-off period (60 days before the expected calving date). Twenty-six multiparous (3-5 lactation) Holstein cows with an initial body weight averaging 652.5 Kg ± 42.3 (mean ± SD), a body condition score of 3.5 ±0.25 (mean ± SD), and an average milk production of 38.7 Kg/day ± 6.4 Kg/day (mean ± SD) in the preceding lactation were chosen for a 49-day trial involving 4 sampling times in 2 groups, each consisting of 13 cows. Twenty cows among a larger group of 40 cows from farm 1 were randomly allocated into two different groups; control diet (n = 10) and treatment (n = 10) diet (yeast cell extract of S. cerevisiae supplementation and control diet) and 26 cows among a larger group of 50 from farm 2 were randomly allocated in two different groups of cows receiving control (n = 13) and treatment (n = 13) diet (comparison in mean lactation number, body weight, BCS and milk production among groups was conducted and the difference was not statistically significant). The inclusion criteria for the selected healthy cows in both farms were as follows: they had a consistent history of pregnancy synchronization timing, produced roughly the same quantity of milk in the previous lactation, maintained a similar body condition score at dry-off, had a comparable length of the dry off period and similar timing of movement to the dry-off pen and similar calving ease. Furthermore, all the animals underwent a comprehensive physical and clinical examination at drying off and immediately after calving to confirm the absence of any underlying diseases or health-compromising conditions. These criteria were implemented to ensure a consistent and healthy baseline for all the cows allocated to this study in both farms. At the end of the study, cows in each farm ultimately reduced to the mentioned sample size due to the absence of synchronization in calving times and the presence of calving-related complications, ketosis, as well as other disorders, including mastitis, increased locomotion score, excessive body condition loss, sell and death due to abnormal reason. Consequently, 12 cows in two groups of (n = 6, control) and (n = 6, treatment) from farm one and 14 cows in two groups of (n = 7, control) and (n = 7, treatment) from farm two remained in the study. A systematic overview of the study design is illustrated in Figure 1.
The yeast cell extract (ROBIOSYN, Pharmed Daroo BIOTECH Company, Shiraz, Iran) that was employed as the supplementary component was 25 grams per day for each animal mixed with water using a ruminal tube based on the manufacturer’s recommended dosage started 7 days before the first sampling time. Meanwhile, the control group persisted with the basal diet.
2.4. Blood Sampling and Blood Parameter Analysis
The first (21 ± 2 before calving; i.e. ST1) and second (7 ± 2 before calving; i.e. ST2) sampling times were at 3 weeks and 1 week before calving and subsequently, postpartum blood samples were taken one (7 ± 2 after calving; i.e. ST3) and 3 (21 ± 2 after calving; i.e. ST4) weeks after calving. Samples were taken by the study personnel who were unaware of the randomized grouping of the animals, ensuring the blinding approach during sampling. All the samples were taken from the jugular vein before the morning feeding at 9 a.m., using an 18-gauge, 1-inch long needle, and deposited into plain evacuated tubes. Subsequently, the tubes were cooled down on ice and centrifuged at 1,200 × g for 15 minutes at four °C to separate the plasma. Then the separated plasma was further divided into micro centrifuge tubes and preserved at -32 °C. The laboratory analysis was conducted by another study personnel who was unaware of the randomized grouping of the samples taken from the animals, ensuring the blinding condition throughout the study. Serum biochemical parameters were included blood urea nitrogen (BUN) was measured using an enzymatic method by Man company kit (Tehran, Iran) (assay range: 30-11,000 mg/L, sensitivity: 30mg/L, intra-assay: CV<11.19% and inter-assay: CV<1.56%. Non-esterified fatty acid (NEFA) was measured using a commercial ELISA kit (Zellbio GmbH kit, Germany, ZBFFA96A). Beta-hydroxy butyric acid (BHBA) was measured using a commercial ELISA kit (Zellbio GmbH kit, Germany, ZB -11497-H9648). Glucose, Calcium, triglyceride, cholesterol, and albumin were measured through established techniques and the use of commercial kits (Pars Azmoon Co., Tehran, Iran). Serum amyloid A (SAA) was measured in serum using Hangzhou Eastbiopharm Co., Ltd., (Hangzhou, USA, CK-E90546).
2.5. Statistical Analysis
All of the blood parameters in the data set were transformed to the same scale as PCA and FA are sensitive methods to scale differences. Standardization of the data was not applicable due to the pressure that needs all the averages to be equal to zero and the standard deviation equal to one, as a result, this method makes comparing the average of each group together impossible. Since PCA and FA are data reduction methods, there is a need to retain an appropriate number of factors based on the trade-off between simplicity (retaining as few as possible factors) and completeness (explanation of most of the variation in the data). The Kaiser’s rule recommends retaining only factors with eigenvalues λ exceeding unity [20,21,22,23]. Bartlett’s test of sphericity was performed to check the assumption of factor analysis that the data is not an identity matrix and is appropriate for FA [24]. Measurement of sample size adequacy was performed based on Howard’s suggestions [23]. Principal component analysis was performed using proc Principal of SAS version 9.3 (SAS/STAT®, SAS Inst. Inc., Cary, NC) to calculate the eigenvalues and proportion of the variation explained by each principal component for each sampling time separately using 9 different variables. Factor analysis was performed for each sampling time separately and factors with the eigenvalues ≥1 were retained to be used for variable reduction. In addition to Kiser’s method [20], VSP analysis [25] was performed by plotting the eigenvalues to rule out the noticeable successive reduction of the eigenvalues called “elbow”, to retain the factors before that matched the results comparing to Kiser’s method [20]. Orthogonal factor rotation using the varimax method was performed to increase the variance of the factor loadings to clarify variables loading on each factor [26]. A cut-off of 0.30 was employed for the factor loadings to retain the factors based on Costello and Osborne’s recommendation [27]. Factor scores (estimates of the underlying factor values for each observation) of the retained factors calculated for each cow were treated as a new variable and analyzed using a univariate linear model. Four regression models were built for each sampling time using a proc mixed of SAS and the factor scores served as the independent variable while treatments (control Vs. probiotic) and farm (Farm1 Vs. Farm2) served as the constant independent variables while the interaction of farm and treatment had remained in the model only when the P value ≥ 0.1. Residual distribution for each analysis was evaluated for normality and homoscedasticity of the data. According to the Pearson residual method, all the residuals are presented in the normal distribution. P-value ≤ 0.05 was considered significant and trends were declared at 0.05 < P ≤ 0.10.
3. Results
3.1. First Sampling Time (21 ± 2 d Before Calving)
Eigenvalues and proportion of the variance explained by 3 retained principal components among 9 total principal components (PCs) for the analysis of 1st sampling are presented in Table 1 and illustrated in part 1 of Figure 2. The computed eigenvalues for 3 retained PCs were ≥ 1 and the cumulative variance explained by these factors was 62.98%. The first principal component accounted for 33.34% of the total variation among 9 principal components. The amount of variation explained by other retained factors (2nd and 3rd factor) are presented in part 1 of Figure 1. Factor pattern coefficients of the rotated factors are presented in Table 2 and summarized in part 2 of Figure 2. Only parameters with coefficients│≥0.30│were used to summarize the factors and ordered according to their factor loading given in Table 3. Animals in the treatment group tend to (P = 0.08) have a lower estimate (mean -0.20 ± 0.10 AU) for the 1st factor compared to the control group (mean 0.06± 0.10 AU), where farm 1 (mean -0.97 ± 0.11 AU) had a higher (P < 0.05) estimate for the 1st factor compared to farm 2 (mean=0.83 ± 0.10 AU). Treatment affected the 2nd factor (P = 0.01) being higher for the treatment group (mean 0.42 ± 0.23 AU) compared to the control group (mean -0.42 ± 0.23 AU), where the effect of the farm on 2nd factor was not significant (P = 0.98). The effect of treatment and farm was not significant for the 3rd factor. Average estimates with corresponding standard errors of the compared factors are presented in Table 4 and summarized in part 3 of Figure 2.
3.2. Second Sampling Time (7± 2 d Before Calving)
Eigenvalues and proportion of the variance explained by 2 retained principal components among 9 total PCs in the analysis of 2nd sampling time are presented in Table 1 and summarized in part 1 of Figure 2. The computed eigenvalues for 2 retained factors were ≥ 1 and the cumulative variance explained by these factors was 64.66%. The 1st and 2nd PCs accounted for 48.94% and 15.73% of the total variation among 9 principal components respectively. Factor pattern coefficients of the rotated factors are presented in Table 2 and summarized in part 2 of Figure 2. Only parameters with coefficients│≥0.30│were used to summarize the factors and ordered according to their accounted factor loading given in Table 3. The treatment group tended to (P = 0.06) have a lower estimate (mean -0.23 ± 0.11 AU) for the 1st factor compared to the control group (mean= 0.09 ± 0.11 AU), while farm 1 (mean= -0.95 ± 0.12 AU) had a lower (P < 0.05) estimate for the 1st factor comparing to farm 2 (mean=0.81 ± 0.11 AU). Treatment affected (P = 0.01) the 2nd factor being lower for the treatment group (mean -0.49 ± 0.25 AU) compared to the control group (mean 0.49 ± 0.25 AU), while the effect of the farm on 2nd factor was not significant (P = 0.79). Average estimates with corresponding standard errors of the compared factors are presented in Table 4 summarized in part 3 of Figure 2.
3.3. Third Sampling Time (7 ± 2 d After Calving)
Eigenvalues and proportion of the variance explained by 3 retained principal components among 9 total PCs in the analysis at 3rd sampling time are presented in Table 1 and summarized in part 1 of Figure 2. The computed eigenvalues for 3 retained factors were ≥ 1 and the cumulative variance explained by these factors was 75.41%. The first principal component accounted for 45.30% of the total variation among 9 principal components. The amount of variation explained by other retained factors (2nd and 3rd factor) are presented in part 1 of Figure 1. Factor pattern coefficients of the rotated factors are presented in Table 2 and summarized in part 2 of Figure 2. Only parameters with coefficients│≥0.30│were used to summarize the factors and ordered according to their factor loading given in Table 3. The effect of treatment and farm for the 1st and 2nd factors was not significant (Table 4.). However, treatment tends to (P = 0.06) affect the 3rd factor being higher for the treatment group (mean 0.35 ± 0.24 AU) compared to the control group (mean -0.31 ± 0.24 AU).
3.4. Fourth Sampling Time (21 ± 2 d After Calving)
Eigenvalues and proportion of the variance explained by 3 retained principal components among 9 total PCs in the analysis of 4th sampling time are presented in Table 1 and summarized in part 1 of Figure 2. The computed eigenvalues for 3 retained factors were ≥ 1 and the cumulative variance explained by these factors was 73.88%. The 1st principal component accounted for 34.55% of the total variation among 9 principal components. The amount of variation explained by other retained factors (2nd and 3rd factor) are presented in part 1 of Figure 1. Factor pattern coefficients of the rotated factors are presented in Table 2 and summarized in part 2 of Figure 2. Only parameters with coefficients │≥ 0.30│were used to summarize the factors and ordered according to their accounted factor loading given in Table 3. Treatment did not affect the 3 retained factors in the 4th sampling time while the farm had an effect (P < 0.05) on the 1st factor being higher in farm 1 (mean 0.53 ± 0.25 AU) compared to farm 2 (mean -0.46 ± 0.23 AU). Furthermore, the farm had an effect (P < 0.05) on the 2nd factor being lower in farm 1 (mean= -0.79 ± 0.19 AU) compared to farm 2 (mean= 0.68 ± 0.17 AU).
4. Discussion
The first three PCs together explained 62.98% of the total variance at ST1. This indicates that a substantial portion of the variation for the measured blood parameters is captured by these three PCs, with the remaining 37.02% of the variance accounting for six other components that were not retained. Given that PCA identified meaningful components, factor analysis can further elucidate latent factors that explain the observed patterns in the data, particularly among the experimental groups. Factor loadings illustrate the strength of the correlation between each variable and the identified factors. The 1st PC accounted for 33.34% of the variability among all components at the 1st sampling time, with Factor 1, attributed to this PC, showing high loadings for NEFA, Albumin, BUN, and BHBA, likely reflecting lipid and protein metabolism. This suggests that variables associated with lipid and protein metabolism at 1st sampling time predominantly define metabolic changes compared to other variables among measured blood parameters. NEFA serves as a biomarker associated with energy restriction [28] and the inflammatory response [29,30] due to energy deficiency [31]. Although changes in BHBA are less pronounced than in NEFA, elevated serum BHBA levels can still be observed during dry periods [31]. Variables with high loadings on the same factor tend to be correlated [32], meaning that they exhibit similar patterns of variation as captured by the factor. Thus, when Factor 1 increases or decreases, the values of NEFA, Albumin, BUN, and BHBA also tend to rise or fall together. NEFA and BHBA are closely linked to lipid metabolism and energy balance [33], whereas Albumin and BUN [34] reflect protein metabolism and nutritional status. Additionally, Albumin has been reported as an indicator of inflammation associated with fat mobilization [35]. A linear relationship between BUN and NEFA has been noted in dairy cattle, although this relationship was observed in early lactation [36]. Consistent with studies showing that yeast supplementation can enhance fat metabolism in ruminants [16], protect the liver [37,38], and associate with lower BUN concentrations [39] possibly due to improved nitrogen utilization and fermentation by ruminal bacteria [40], a trend towards a lower Factor 1 score in the treatment group compared to the control group was observed in this study. Since Factor 1 is influenced by NEFA, Albumin, BUN, and BHBA, this suggests that probiotic supplementation may be altering lipid and protein metabolism, although the effect is not strong enough to be conclusive. The second PC accounted for 17.77% of the variability among all components at ST1. Factor 2, associated with this PC, exhibited high loadings for glucose and SAA levels. This factor is likely related to glucose metabolism and inflammatory response. Glucose is involved in numerous biological processes [41] and plays a critical role in lactogenesis after calving [42]. SAA is produced by the liver in response to pro-inflammatory cytokines such as IL-6 and TNFα [43]. Structurally, SAA functions as an apolipoprotein, aiding in the uptake and removal of cholesterol from inflammatory sites [44,45]. Additionally, SAA has direct effects on immune cells, including monocytes and neutrophils [46]. An increase in glucose and urea nitrogen concentration associated with the supplementation of S. Cerevisiae in transition cows has been reported [46] previously. Although an elevation of SAA due to S. Cerevisiae supplementation during the transitional period in dairy cows was initially unexpected [4, similar findings have been documented by others [47,48]. In this study, animals supplemented with S. Cerevisiae exhibited a higher estimate for Factor 2 compared to the control group, indicating that S. Cerevisiae supplementation significantly affects glucose and SAA levels. This suggests that probiotics may enhance glucose metabolism and potentially increase inflammation, as reflected by higher SAA levels. Components of S. Cerevisiae, such as β-glucans, mannans, and chitin [49], can activate immune cell receptors [48], leading to the production of pro-inflammatory cytokines that stimulate the liver to produce acute-phase proteins, including SAA [47,48]. We speculate that this increase typically represents beneficial immune modulation rather than a harmful inflammatory response. Understanding the mechanisms and monitoring the outcomes can help in leveraging the benefits of S. Cerevisiae while managing any transient increases in inflammatory markers, which warrants further investigation. The 3rd PC accounted for 11.87% of the variability among all components at ST1. Factor 3, associated with this PC, is primarily driven by triglyceride levels, likely reflecting triglyceride metabolism or storage. While some studies have reported favorable effects of S. Cerevisiae supplementation on the metabolic status of dairy cows [50,51], others have suggested no impact on metabolic functions, such as triglyceride alteration [52]. In this study, although the effects of S. Cerevisiae supplementation on factors associated with the metabolic function of dairy cows were observed, probiotic supplementation did not affect factor 3, which had the highest loading of triglycerides. The lack of significant difference in factor 3 among the control and treatment groups suggests that cows at 21 days prepartum were not experiencing a pronounced negative energy balance, and therefore, no effect of supplementation was recorded on this factor. Consistent with previous studies that found no difference in triglyceride concentration due to S. Cerevisiae supplementation, potential improvements in energy metabolism associated with S. Cerevisiae supplementation have been suggested [52].
In ST2, the 1st PC accounted for 48.94% of the variability among all components, and factor 1 that is associated with this PC was influenced primarily by BUN, Glucose, NEFA, and BHBA. This factor might be indicative of metabolic processes related to protein and energy metabolism, possibly reflecting the importance of fat and protein metabolism 7 days before calving. NEFA and BHBA are the biomarkers associated with energy metabolism during dry periods [28,31]. Moreover, the inclusion of glucose in factor 1 in the 2nd sampling time indicates the importance of the energy metabolism associated with lipids and protein metabolism [43]. In ST2, factor 1 continues to reflect aspects of metabolic stress, with a strong focus on BUN, Glucose, NEFA, and BHBA. The tendency towards a lower F1 estimate in the S. cerevisiae-supplemented group compared to the control group suggests a potential impact of S. Cerevisiae supplementation on the metabolic processes associated with this factor. Assessing the factor loading shift between ST1 and ST2 might be useful for understanding the temporal dynamics of metabolic responses in the pre-parturient period from 21 days to 7 days before calving. In ST1 and ST2, there is a high similarity in the variables with high loadings on the 1st factor (NEFA, Albumin, BUN, BHBA). Surprisingly, the results of the comparison of factor 1 among the treatment and control groups in ST2 and ST1 were approximately similar. This might be due to the high similarities among the variables with high loading on factor 1 at both sampling times (NEFA, Albumin, BUN, BHBA). This could indicate an improvement in protein and energy metabolism at 21 and 7 days before calving associated with S. Cerevisiae supplementation. In concordance with these results, it has been reported that S. Cerevisiae supplementation tended to increase serum glucose and urea N concentration [48], as well as increased concentration of propionate and ammonia [53,54] possibly due to increased ruminal dry matter and protein digestibility [54,55]. In ST2, the 2nd PC accounted for 15.73% of the variability among all components, and factor 2 as the associated factor with this PC is characterized by high loadings for Triglycerides and SAA. This factor might be related to lipid metabolism and inflammation. The positive relationship of Triglycerides and SAA in ST2 suggests an inflammatory response possibly linked to lipid metabolism [44,45]. In St2, factor2 shows a shift towards lipid metabolism and inflammation, due to the higher loading of Triglycerides and SAA on this factor. The treatment group has a lower factor 2 estimate compared to the control group, suggesting that S. Cerevisiae supplementation affects the factors related to SAA and Triglyceride levels. In concordance with this finding, a reduction in SAA associated with S. Cerevisiae has been reported in the last week of prepartum [47]. Anti-inflammatory properties of S. Cerevisiae supplementation have been recorded in rats [56]. This could indicate a reduction in inflammation and a potential improvement in lipid metabolism in the treatment group. It’s noteworthy to mention that in contrast to ST2, in ST1, the underlying factor resembling the effect of SAA was increased compared to the control group. To further explore this observation, it has been reported that S. Cerevisiae supplementation has both stimulatory and inhibitory effects on immune response [57,58,59,60]. However, it is questionable whether an increase or decrease in SAA as a result of S. Cerevisiae supplementation is desirable. Increased concentration of SAA might be an indicator of metabolic and infectious disease in dairy cattle [61] before the onset of clinical disease [62]. However, we recorded an increase in SAA concentration in ST1, it should not be associated with clinical conditions associated with metabolic or infectious problems as the animals in this experiment were fully examined for any disease-associated condition and did not further develop any metabolic or disease condition. We speculate this increase was mostly associated with the initial activation of the immune response associated with supplementation of S. Cerevisiae [47,48]. It has been reported that SAA may act as a negative feedback loop and down-regulate cytokine-induced inflammation [63,64]. Therefore, it can be speculated that suppression of inflammation as evidenced by the reduction of SAA because of S. Cerevisiae supplementation in ST2 which is 7 days before calving may inhibit metabolic adaptation to the increased nutrient requirements for lactation [65].
In ST3, the 1st PC accounted for 45.30% of the variability among all components and the factor 1 associated with this PC appears to be influenced primarily by Albumin, Triglyceride, Cholesterol, and BHBA, suggesting a factor related to lipid metabolism and protein levels. In this sampling time, F1 continues to represent aspects of lipid metabolism and protein levels, with the addition of calcium with a significant positive loading indicating an association of calcium with overall metabolic health and energy balance a week after parturition. However, this study was not designed to explore the effect of change in calcium concentration on lipid metabolism-related indicators, the addition of calcium as a loading variable on factor 1 indicates the relationship between calcium and lipid metabolism after calving. Although the association of calcium and lipid metabolism has received less attention in postpartum dairy cows, some early research showed that cows experiencing clinical hypocalcemia were 9 times more likely to develop ketosis compared to non-hypokalemic cows [66]. The relationship between calcium metabolism and plasma NEFA concentration in dairy cows has been reported previously [67] with the explanation that lipolysis may increase calcium depletion because calcium-sensing receptor agonists decrease basal lipolysis [68]. There was no difference in F1 estimates comparing the treatment and control group suggesting that S. Cerevisiae supplementation does not have an impact on the underlying metabolic processes associated with this factor at ST3. Several results have been reported highlighting that S. Cerevisiae supplementation with different doses did not affect NEFA and BHBA concentration after calving [48,69,70] indicating that, S. Cerevisiae supplementation may independently improve dietary energy utilization or absorption [70,71] which may or may not be associated with a change in dry matter intake.
In ST3, the 2nd PC accounted for 17.45% of the variability among all components, and F2 as the factor associated with this PC is characterized by high loadings for BUN, NEFA, and SAA, indicating a factor related to inflammatory response, fat, and protein metabolism. In ST3, F2 maintains its association with inflammatory response and lipid metabolism, now strongly linked to BUN. Elevation in SAA concentration is in line with the fact that SAA increases postpartum in dairy cows [72], due to an inflammatory process related to calving [73]. This can be accompanied with an increase in BUN concentration in early lactation [74,75] due to increase in feed intake or a change in the diet [76]. Furthermore, the positive loading of NEFA at this time may explain the connection of lipid mobilization and its related inflammatory process. The inflammatory effect of NEFA during the transitional period [77] and its effect on SAA elevation [78] have been reported previously. However, it is noteworthy to mention that a significant relationship between lipid and inflammatory-related parameters post-partum might be associated with fat mobilization and general postpartum inflammation that happens after calving at the same window of time. There was no statistically significant difference in F2 estimates comparing the probiotic and control groups indicating that probiotic supplementation does not significantly affect inflammation lipid and protein metabolism at ST3. Zawroski et al. (2014) found that S. Cerevisiae supplementation decreases SAA concentration at the time of calving [47]. Furthermore, in line with our results, the same study did not find significant differences comparing the supplemented group and the control group 14 days after calving which is closer to the 3rd sampling time in this study. This suggests that the lack of S. Cerevisiae supplementation on factor 3 at ST3 may be due to differences in methodology and sampling times which is in line with other reports [79]. In the ST3, the 3rd PC accounted for 12.66% of the variability among all components, and factor 3 as the associated factor with this PC is mainly driven by Glucose, suggesting a factor related to glucose metabolism. There is a tendency towards a higher F3 score in the probiotic group compared to the control group. In line with the observation in ST1, it seems that S. Cerevisiae supplementation might have a potential positive impact of probiotic supplementation on glucose metabolism [46] as reported previously.
In ST4, the 1st PC accounted for 34.55% of the variability among all components, and factor 1 as the associated factor with this PC is influenced primarily by Albumin, Glucose, and SAA, suggesting a factor related to overall protein and glucose metabolism as well as inflammatory response. However, S. Cerevisiae supplementation did not affect the first factor. In this sampling time, the 2nd PC accounted for 24.48% of the variability of the data, and factor 2 as the associated factor with this PC is characterized by high loadings for BUN and Cholesterol, indicating a factor related to protein and lipid metabolism. In ST4, Cholesterol and BUN showed a high loading on the 2nd factor, with no significant differences comparing the cows supplemented with S. Cerevisiae and the control group, suggesting that probiotic effects on these parameters had diminished over time. The lack of effect of S. Cerevisiae supplementation on the 1st and 2nd factor at the 4th sampling time may be because of sampling time as reported previously [47,79].
In ST4, the 3rd PC accounted for 14.66% of the variability of the data and Triglyceride, NEFA, and BHBA had a high loading on the factor attributed to this PC. It can be suggested that this factor is related to lipid metabolism and S. Cerevisiae supplementation did not affect this factor.
In this study, a significant proportion of the variability at the first, second, and third sampling times was explained by the first PC, primarily related to fat and protein metabolism. This highlights the importance of these metabolites during the transitional period. Additionally, S. cerevisiae supplementation showed a tendency to reduce the estimates associated with factors related to these PCs, indicating a promising impact of S. Cerevisiae supplementation during this period. In the first and second sampling times, which occurred before parturition, the second PC accounted for more than 15% of the variability, with high loadings of SAA, underscoring the significance of inflammatory processes during this time. Although S. Cerevisiae did not reduce the inflammation-related factor at ST1, it demonstrated the potential to decrease estimates related to inflammatory processes and fat metabolism, as indicated by the high loading of triglycerides on this factor. Initially, S. cerevisiae supplementation impacted factors associated with glucose metabolism and inflammatory responses. It also showed effects on metabolic stress and inflammation, with trends toward improvement in the supplemented group. However, over time, the differences between the groups diminished. By the final sampling, no factors showed significant differences. Thus, S. Cerevisiae supplementation exhibited potential benefits in reducing metabolic stress and inflammation before calving, with these effects stabilizing over time. In this study, our objective was to assess the multifaceted effects of Saccharomyces cerevisiae supplementation during the complex transition period of dairy cows. We employed advanced statistical methods to generalize and simplify the interpretation of these effects. Principal component analysis and factor analysis were utilized to effectively condense the data, allowing the overall results to be represented in a single, comprehensive Figure (Figure 2). This approach represents a novel aspect of our research. We acknowledge certain limitations, such as the inability to include additional blood parameters due to differences in units of measurement, particularly for enzymes that cannot be readily converted. Despite these constraints, this study introduces a novel method to streamline the analysis and presentation of complex metabolic data.
5. Conclusions
S. Cerevisiae supplementation had varying impacts on different metabolic factors over time. Early and mid-term responses showed significant and trending improvements in glucose metabolism, inflammatory responses, and metabolic stress. However, by the final sampling, the effects had stabilized, with no significant differences between groups. These findings highlight the dynamic nature of metabolic responses to probiotics and suggest the initial benefits of S. Cerevisiae supplementation before calving. These findings suggest that while there are potential benefits of probiotic supplementation on lipid metabolism, protein metabolism, and inflammatory response, the effects may require sustained supplementation and larger sample sizes to fully understand and achieve statistical significance.
Author Contributions
Ahmadreza Mirzaei; methodology, formal analysis, writing original draft preparation, writing review and editing, Behnam Asadi; writing review and editing, data curation, project administration, Ahmad Mousavi; formal analysis, data curation, Ali Hajimohammadi; investigation, methodology, supervision, Saeed Nazifi; investigation, methodology, supervision, Seyed Amin Razavi; investigation, project administration. All authors have read and agreed to the published version of the manuscript.
Funding
This research received no external funding.
Data Availability Statement
The data of the current study are available according to a reasonable request.
Acknowledgments
The authors of this paper would like to express their sincere gratitude to the farm personnel at Mazaree Nemone for their valuable contributions. Additionally, we extend our heartfelt thanks to Dr. Seyed Omid Naghibi for his valubale support throughout this project.
Conflicts of Interest
The authors declare no conflicts of interest.
References
- Lopreiato, V.; Mezzetti, M.; Cattaneo, L.; Ferronato, G.; Minuti, A.; Trevisi, E. Role of Nutraceuticals during the Transition Period of Dairy Cows: A Review. J. Anim. Sci. Biotechnol. 2020, 11, 96. [Google Scholar] [CrossRef] [PubMed]
- Mezzetti, M.; Cattaneo, L.; Passamonti, M.M.; Lopreiato, V.; Minuti, A.; Trevisi, E. The Transition Period Updated: A Review of the New Insights into the Adaptation of Dairy Cows to the New Lactation. Dairy. 2021, 2, 617–636. [Google Scholar] [CrossRef]
- Caixeta, L.S.; Omontese, B.O. Monitoring and Improving the Metabolic Health of Dairy Cows during the Transition Period. Animals. 2021, 11, 352. [Google Scholar] [CrossRef] [PubMed]
- Pascottini, O.B.; Leroy, J.L.M.R.; Opsomer, G. Metabolic Stress in the Transition Period of Dairy Cows: Focusing on the Prepartum Period. Animals. 2020, 10, 1419. [Google Scholar] [CrossRef]
- Kronfeld, D.S. Major Metabolic Determinants of Milk Volume, Mammary Efficiency, and Spontaneous Ketosis in Dairy Cows. J. Dairy Sci. 1982. [Google Scholar] [CrossRef]
- Horst, E.A.; Kvidera, S.K.; Baumgard, L.H. Invited Review: The Influence of Immune Activation on Transition Cow Health and Performance—A Critical Evaluation of Traditional Dogmas. J. Dairy Sci. 2021, 104, 8380–8410. [Google Scholar] [CrossRef]
- Tufarelli, V.; et al. The Most Important Metabolic Diseases in Dairy Cattle during the Transition Period. Animals. 2024, 14, 816. [Google Scholar] [CrossRef]
- Razavi, S.A.; Pourjafar, M.; Hajimohammadi, A.; Valizadeh, R.; Naserian, A.A.; Laven, R.; Mueller, K.R. Effects of Dietary Supplementation of Bentonite and Saccharomyces cerevisiae Cell Wall on Acute-Phase Protein and Liver Function in High-Producing Dairy Cows during Transition Period. Trop. Anim. Health Prod. 2019, 51, 1225–1237. [Google Scholar] [CrossRef]
- Mirzaei, A.; Hajimohammadi, A.; Badiei, K.; Pourjafar, M.; Naserian, A.A.; Razavi, S.A. Effect of Dietary Supplementation of Bentonite and Yeast Cell Wall on Serum Endotoxin, Inflammatory Parameters, Serum and Milk Aflatoxin in High-Producing Dairy Cows during the Transition Period. Comp. Clin. Pathol. 2020, 29, 433–440. [Google Scholar] [CrossRef]
- Liong, M.T. Probiotics: A Critical Review of Their Potential Role as Antihypertensives, Immune Modulators, Hypocholesterolemics, and Perimenopausal Treatments. Nutr. Rev. 2007, 65, 316–328. [Google Scholar] [CrossRef]
- Mirzaei, A.; Razavi, S.A.; Babazadeh, D.; Laven, R.; Saeed, M. Roles of Probiotics in Farm Animals: A Review. Farm Anim. Health Nutr. 2022, 1, 17–25. [Google Scholar] [CrossRef]
- Pitta, D.W.; Kumar, S.; Vecchiarelli, B.; Shirley, D.J.; Bittinger, K.; Baker, L.D.; Thomsen, N. Temporal Dynamics in the Ruminal Microbiome of Dairy Cows during the Transition Period. J. Anim. Sci. 2014, 92, 4014–4022. [Google Scholar] [CrossRef] [PubMed]
- Plaza-Diaz, J.; Ruiz-Ojeda, F.J.; Gil-Campos, M.; Gil, A. Mechanisms of Action of Probiotics. Adv. Nutr. 2019, 10, S49–S66. [Google Scholar] [CrossRef] [PubMed]
- Fiocco, D.; Longo, A.; Arena, M.P.; Russo, P.; Spano, G.; Capozzi, V. How Probiotics Face Food Stress: They Get by with a Little Help. Crit. Rev. Food Sci. Nutr. 2020, 60, 1552–1580. [Google Scholar] [CrossRef]
- Mostafa, T.H.; Elsayed, F.A.; Ahmed, M.A.; Elkholany, M.A. Effect of Using Some Feed Additives (TW-Probiotics) in Dairy Cow Rations on Production and Reproductive Performance. Egypt. J. Anim. Prod. 2014, 51, 1–11. [Google Scholar]
- Kazemi, S.; Hajimohammadi, A.; Mirzaei, A.; Nazifi, S. Effects of Probiotic and Yeast Extract Supplementation on Oxidative Stress, Inflammatory Response, and Growth in Weaning Saanen Kids. Trop. Anim. Health Prod. 2023, 55, 282. [Google Scholar] [CrossRef]
- Lawley, D.N.; Maxwell, A.E. Factor Analysis as a Statistical Method. J. R. Stat. Soc. Ser. D Stat. 1962, 12, 209–229. [Google Scholar] [CrossRef]
- Linder, A.; Berchtold, W. Statistische Methoden III. UTB 1189, Birkhäuser Verlag, Basel. 1982.
- SAS Institute. SAS Certified Specialist Prep Guide: Base Programming Using SAS 9.4. SAS Institute. 2019.
- Kaiser, H.F. An Index of Factorial Simplicity. Psychometrika. 1974, 39, 31–36. [Google Scholar] [CrossRef]
- Fabrigar, L.R.; Wegener, D.T. Understanding Statistics: Exploratory Factor Analysis; Oxford University Press: New York, NY, 2012. [Google Scholar]
- Kline, P. An Easy Guide to Factor Analysis; Routledge: New York, NY, 2014. [Google Scholar]
- Howard, M.C. A Review of Exploratory Factor Analysis Decisions and Overview of Current Practices: What We Are Doing and How Can We Improve? Int. J. Hum.-Comput. Interact. 2016, 32, 51–62. [Google Scholar] [CrossRef]
- Tobias, S.; Carlson, J.E. Brief Report: Bartlett’s Test of Sphericity and Chance Findings in Factor Analysis. Multivar. Behav. Res. 1969, 4, 375–377. [Google Scholar] [CrossRef]
- Zoski, K.W.; Jurs, S. An Objective Counterpart to the Visual Scree Test for Factor Analysis: The Standard Error Scree. Educ. Psychol. Meas. 1996, 56, 443–451. [Google Scholar] [CrossRef]
- Kaiser, H.F. The Varimax Criterion for Analytic Rotation in Factor Analysis. Psychometrika. 1958, 23, 187–200. [Google Scholar] [CrossRef]
- Costello, A.B.; Osborne, J. Best Practices in Exploratory Factor Analysis: Four Recommendations for Getting the Most from Your Analysis. Pract. Assess. Res. Eval. 2005, 10, 1–9. [Google Scholar]
- Putman, A.K.; Brown, J.L.; Gandy, J.C.; Wisnieski, L.; Sordillo, L.M. Changes in Biomarkers of Nutrient Metabolism, Inflammation, and Oxidative Stress in Dairy Cows during the Transition into the Early Dry Period. J. Dairy Sci. 2018, 101, 9350–9359. [Google Scholar] [CrossRef]
- Kushibiki, S.; Hodate, K.; Shingu, H.; Obara, Y.; Touno, E.; Shinoda, M.; Yokomizo, Y. Metabolic and Lactational Responses during Recombinant Bovine Tumor Necrosis Factor-α Treatment in Lactating Cows. J. Dairy Sci. 2003, 86, 819–827. [Google Scholar] [CrossRef]
- Friggens, N.C.; Andersen, J.B.; Larsen, T.; Aaes, O.; Dewhurst, R.J. Priming the Dairy Cow for Lactation: A Review of Dry Cow Feeding Strategies. Anim. Res. 2004, 53, 453–473. [Google Scholar] [CrossRef]
- Pascottini, O.B.; Leroy, J.L.; Opsomer, G. Metabolic Stress in the Transition Period of Dairy Cows: Focusing on the Prepartum Period. Animals. 2020, 10, 1419. [Google Scholar] [CrossRef]
- Cattell, R.B. The Scree Test for the Number of Factors. Multivar. Behav. Res. 1966, 1, 245–276. [Google Scholar] [CrossRef]
- Deng, Q.; Liu, G.; Liu, L.; Zhang, Y.; Yin, L.; Shi, X.; Li, X. BHBA Influences Bovine Hepatic Lipid Metabolism via AMPK Signaling Pathway. J. Cell. Biochem. 2015, 116, 1070–1079. [Google Scholar] [CrossRef]
- Puppel, K.; Kuczyńska, B. Metabolic Profiles of Cow's Blood: A Review. J. Sci. Food Agric. 2016, 96, 4321–4328. [Google Scholar] [CrossRef]
- Trevisi, E.; Zecconi, A.; Bertoni, G.; Piccinini, R. Blood and Milk Immune and Inflammatory Profiles in Periparturient Dairy Cows Showing a Different Liver Activity Index. J. Dairy Res. 2010, 77, 310–317. [Google Scholar] [CrossRef] [PubMed]
- Rastani, R.R.; Lobos, N.E.; Aguerre, M.J.; Grummer, R.R.; Wattiaux, M.A. Relationships between Blood Urea Nitrogen and Energy Balance or Measures of Tissue Mobilization in Holstein Cows during the Periparturient Period. Prof. Anim. Sci. 2006, 22, 382–385. [Google Scholar] [CrossRef]
- Kumprechtová, D.; Illek, J.; Julien, C.; Homolka, P.; Jančík, F.; Auclair, E. Effect of Live Yeast (Saccharomyces cerevisiae) Supplementation on Rumen Fermentation and Metabolic Profile of Dairy Cows in Early Lactation. J. Anim. Physiol. Anim. Nutr. 2019, 103, 447–455. [Google Scholar] [CrossRef]
- Burdick Sanchez, N.C.; Broadway, P.R.; Carroll, J.A. Influence of Yeast Products on Modulating Metabolism and Immunity in Cattle and Swine. Animals. 2021, 11, 371. [Google Scholar] [CrossRef] [PubMed]
- Razavi, S.A.; Pourjafar, M.; Hajimohammadi, A.; Valizadeh, R.; Naserian, A.A.; Laven, R.; Mueller, K.R. Effects of Dietary Supplementation of Bentonite and Yeast Cell Wall on Serum Blood Urea Nitrogen, Triglyceride, Alkaline Phosphatase, and Calcium in High-Producing Dairy Cattle during the Transition Period. Comp. Clin. Pathol. 2018, 28, 419–425. [Google Scholar] [CrossRef]
- Sun, X.; Wang, Y.; Wang, E.; Zhang, S.; Wang, Q.; Zhang, Y.; Li, S. Effects of Saccharomyces cerevisiae Culture on Ruminal Fermentation, Blood Metabolism, and Performance of High-Yield Dairy Cows. Animals. 2021, 11, 2401. [Google Scholar] [CrossRef]
- Goff, J.P.; Horst, R.L. Physiological Changes at Parturition and Their Relationship to Metabolic Disorders. J. Dairy Sci. 1997, 80, 1260–1268. [Google Scholar] [CrossRef]
- Bell, A.W.; Bauman, D.E. Adaptations of Glucose Metabolism during Pregnancy and Lactation. J. Mamm. Gland Biol. Neoplasia 1997, 2, 265–278. [Google Scholar] [CrossRef]
- Uhlar, C.M.; Whitehead, A.S. Serum Amyloid A, the Major Vertebrate Acute-Phase Reactant. Eur. J. Biochem. 1999, 265, 501–523. [Google Scholar] [CrossRef]
- Coetzee, G.A.; Strachan, A.F.; Westhuyzen, D.R.; Hoppe, H.C.; Jeenah, M.S.; DeBeer, F.C. Serum Amyloid A Containing Human High-Density Lipoprotein 3. J. Biol. Chem. 1986, 261, 9644. [Google Scholar] [CrossRef]
- Shephard, E.G.; DeBeer, F.C.; DeBeer, M.C.; Jeenah, M.S.; Coetzee, G.A.; Van der Westhuyzen, D.R. Neutrophil Association and Degradation of Normal and Acute-Phase High-Density Lipoprotein-3. Biochem. J. 1987, 248, 919–926. [Google Scholar] [CrossRef] [PubMed]
- Badolato, R.; Wang, J.M.; Murphy, W.J.; Lloyd, A.R.; Michiel, D.F.; Bausserman, L.L. Serum Amyloid A Is a Chemoattractant—Induction of Migration, Adhesion, and Tissue Infiltration of Monocytes and Polymorphonuclear Leukocytes. J. Exp. Med. 1994, 180, 203–209. [Google Scholar] [CrossRef] [PubMed]
- Zaworski, E.M.; Shriver-Munsch, C.M.; Fadden, N.A.; Sanchez, W.K.; Yoon, I.; Bobe, G. Effects of Feeding Various Dosages of Saccharomyces cerevisiae Fermentation Product in Transition Dairy Cows. J. Dairy Sci. 2014, 97, 3081–3098. [Google Scholar] [CrossRef] [PubMed]
- Sivinski, S.E.; Meier, K.E.; Mamedova, L.K.; Saylor, B.A.; Shaffer, J.E.; Sauls-Hiesterman, J.A.; Bradford, B.J. Effect of Saccharomyces cerevisiae Fermentation Product on Oxidative Status, Inflammation, and Immune Response in Transition Dairy Cattle. J. Dairy Sci. 2022, 105, 8850–8865. [Google Scholar] [CrossRef]
- Moran, C.A. Functional Components of the Cell Wall of Saccharomyces cerevisiae: Applications for Yeast Glucan and Mannan. 2004.
- Kumprechtová, D.; Illek, J.; Julien, C.; Homolka, P.; Jančík, F.; Auclair, E. Effect of Live Yeast (Saccharomyces cerevisiae) Supplementation on Rumen Fermentation and Metabolic Profile of Dairy Cows in Early Lactation. J. Anim. Physiol. Anim. Nutr. 2019, 103, 447–455. [Google Scholar] [CrossRef]
- Burdick Sanchez, N.C.; Broadway, P.R.; Carroll, J.A. Influence of Yeast Products on Modulating Metabolism and Immunity in Cattle and Swine. Animals. 2021, 11, 371. [Google Scholar] [CrossRef]
- Sun, X.; Wang, Y.; Wang, E.; Zhang, S.; Wang, Q.; Zhang, Y.; Li, S. Effects of Saccharomyces cerevisiae Culture on Ruminal Fermentation, Blood Metabolism, and Performance of High-Yield Dairy Cows. Animals. 2021, 11, 2401. [Google Scholar] [CrossRef]
- Erasmus, L.J.; Robinson, P.H.; Ahmadi, A.; Hinders, R.; Garrett, J.E. Influence of Prepartum and Postpartum Supplementation of a Yeast Culture and Monensin, or Both, on Ruminal Fermentation and Performance of Multiparous Dairy Cows. Anim. Feed Sci. Technol. 2005, 122, 219–239. [Google Scholar] [CrossRef]
- Miller-Webster, T.; Hoover, W.H.; Holt, M.; Nocek, J.E. Influence of Yeast Culture on Ruminal Microbial Metabolism in Continuous Culture. J. Dairy Sci. 2014, 85, 2009–2014. [Google Scholar] [CrossRef]
- Yoon, I.K.; Stern, M.D. Effects of Saccharomyces cerevisiae and Aspergillus oryzae Cultures on Ruminal Fermentation in Dairy Cows. J. Dairy Sci. 1996, 79, 411–417. [Google Scholar] [CrossRef]
- Evans, M.; Reeves, S.; Robinson, L.E. A Dried Yeast Fermentate Prevents and Reduces Inflammation in Two Separate Experimental Immune Models. Evid. Based Complement. Alternat. Med. 2012, 973041. [Google Scholar] [CrossRef] [PubMed]
- Jensen, G.S.; Hart, A.N.; Schauss, A.G. An Anti-Inflammatory Immunogen from Yeast Culture Induces Activation and Alters Chemokine Receptor Expression on Human Natural Killer Cells and B Lymphocytes In Vitro. Nutr. Res. 2007, 27, 327–335. [Google Scholar] [CrossRef] [PubMed]
- Jensen, G.S.; Patterson, K.M.; Barnes, J.; Schauss, A.G.; Beaman, R.; Reeves, S.G.; Robinson, L.E. A Double-Blind Placebo-Controlled, Randomized Pilot Study: Consumption of a High Metabolite Immunogen from Yeast Culture Has Beneficial Effects on Erythrocyte Health and Mucosal Immune Protection in Healthy Subjects. Open Nutr. J. 2008, 2, 68–75. [Google Scholar] [CrossRef]
- Jensen, G.S.; Patterson, K.M.; Yoon, I. Nutritional Yeast Culture Has Specific Anti-Microbial Properties without Affecting Healthy Flora. Preliminary Results. J. Anim. Feed Sci. 2008, 17, 247–252. [Google Scholar] [CrossRef]
- Jensen, G.S.; Patterson, K.M.; Yoon, I. Yeast Culture Has Anti-Inflammatory Effects and Specifically Activates NK Cells. Comp. Immunol. Microbiol. Infect. Dis. 2008, 31, 487–500. [Google Scholar] [CrossRef]
- Ametaj, B.N.; Hosseini, A.; Odhiambo, J.F.; Iqbal, S.; Sharma, S.; Deng, Q.; Lam, T.H.; Farooq, U.; Zebeli, Q.; Dunn, S.M. Application of Acute Phase Proteins for Monitoring Inflammatory States in Cattle. In Acute Phase Proteins as Early Non-Specific Biomarkers of Human and Veterinary Diseases; Veas, F., Ed.; InTech: Rijeka, Croatia, 2011; Chapter 13. Accessed Oct. 24, 2013. http://www.intechopen.com/articles/show/title/application-of-acute-phase-proteins-for-monitoring-inflammatory-states-in-cattle. [Google Scholar]
- Sabedra, D.; Ramsing, E.M.; Shriver-Munsch, C.M.; Males, J.R.; Sanchez, W.K.; Yoon, I.; Bobe, G. Haptoglobin Is a Potential Early Indicator of Postpartal Diseases. J. Dairy Sci. 2012, 95 (Suppl. 2), 513, (Abstr.). [Google Scholar]
- Shainkin-Kestenbaum, R.; Berlyne, G.; Zimlichman, S.; Sorin, H.R.; Nyska, M.; Danon, A. Acute Phase Protein, Serum Amyloid A, Inhibits IL-1- and TNF-Induced Fever and Hypothalamic PGE2 in Mice. Scand. J. Immunol. 1991, 34, 179–183. [Google Scholar] [CrossRef]
- Arredouani, M.S.; Kasran, A.; Vanoirbeek, J.A.; Berger, F.G.; Baumann, H.; Ceuppens, J.L. Haptoglobin Dampens Endotoxin-Induced Inflammatory Effects Both In Vitro and In Vivo. Immunology. 2005, 114, 263–271. [Google Scholar] [CrossRef]
- Farney, J.K.; Mamedova, L.K.; Coetzee, J.F.; KuKanich, B.; Sordillo, L.M.; Stoakes, S.K.; Minton, J.E.; Hollis, L.C.; Bradford, B.J. Anti-Inflammatory Salicylate Treatment Alters the Metabolic Adaptations to Lactation in Dairy Cattle. Am. J. Physiol. Regul. Integr. Comp. Physiol. 2013, 305, R110–R117. [Google Scholar] [CrossRef]
- Curtis, C.R.; Erb, H.N.; Sniffen, C.J.; Smith, R.D.; Powers, P.A.; Smith, M.C.; White, M.E.; Hillman, R.B.; Pearson, E.J. Association of Parturient Hypocalcemia with Eight Periparturient Disorders in Holstein Cows. J. Am. Vet. Med. Assoc. 1983, 183, 559–561. [Google Scholar] [CrossRef]
- Chamberlin, W.G.; Middleton, J.R.; Spain, J.N.; Johnson, G.C.; Ellersieck, M.R.; Pithua, P. Subclinical Hypocalcemia, Plasma Biochemical Parameters, Lipid Metabolism, Postpartum Disease, and Fertility in Postparturient Dairy Cows. J. Dairy Sci. 2013, 96, 7001–7013. [Google Scholar] [CrossRef] [PubMed]
- Cifuentes, M.; Rojas, C.V. Antilipolytic Effect of Calcium-Sensing Receptor in Human Adipocytes. Mol. Cell. Biochem. 2008, 319, 17–21. [Google Scholar] [CrossRef] [PubMed]
- Ramsing, E.M.; Davidson, J.A.; French, P.D.; Yoon, I.; Keller, M.; Peters-Fleckenstein, H. Effect of Yeast Culture on Peripartum Intake and Milk Production of Primiparous and Multiparous Holstein Cows. Prof. Anim. Sci. 2009, 25, 487–495. [Google Scholar] [CrossRef]
- Robinson, P.H.; Garrett, J.E. Effect of Yeast Culture (Saccharomyces cerevisiae) on Adaptation of Cows to Postpartum Diets and on Lactational Performance. J. Anim. Sci. 1999, 77, 988–999. [Google Scholar] [CrossRef]
- Dann, H.M.; Drackley, J.K.; McCoy, G.C.; Hutjens, M.F.; Garrett, J.E. Effects of Yeast Culture (Saccharomyces cerevisiae) on Prepartum Intake and Postpartum Intake and Milk Production of Jersey Cows. J. Dairy Sci. 2000, 83, 123–127. [Google Scholar] [CrossRef]
- Tóthová, C.S.; Nagy, O.; Seidel, H.; Konvičná, J.; Farkašová, Z.; Kováč, G. Acute Phase Proteins and Variables of Protein Metabolism in Dairy Cows during the Pre-and Postpartal Period. Acta Vet. Brno. 2008, 77, 51–57. [Google Scholar] [CrossRef]
- Knoblock, C.E.; Shi, W.; Yoon, I.; Oba, M. Effects of Supplementing a Saccharomyces cerevisiae Fermentation Product during the Periparturient Period on the Immune Response of Dairy Cows Fed Fresh Diets Differing in Starch Content. J. Dairy Sci. 2019, 102, 6199–6209. [Google Scholar] [CrossRef]
- Peterson, R.G.; Waldern, D.E. Repeatabilities of Serum Constituents in Holstein–Friesians Affected by Feeding, Age, Lactation, and Pregnancy. J. Dairy Sci. 1981, 64, 822–831. [Google Scholar] [CrossRef]
- Seifi, H.A.; Gorji-Dooz, M.; Mohri, M.; Dalir-Naghadeh, B.; Farzaneh, N. Variations of Energy-Related Biochemical Metabolites during Transition Period in Dairy Cows. Comp. Clin. Pathol. 2007, 16, 253–258. [Google Scholar] [CrossRef]
- Bauchart, D. Lipid Absorption and Transport in Ruminants. J. Dairy Sci. 1993, 76, 3864–3881. [Google Scholar] [CrossRef]
- Contreras, G.A.; Sordillo, L.M. Lipid Mobilization and Inflammatory Responses during the Transition Period of Dairy Cows. Comp. Immunol. Microbiol. Infect. Dis. 2011, 34, 281–289. [Google Scholar] [CrossRef] [PubMed]
- El-Deeb, W.M.; El-Bahr, S.M. Biomarkers of Ketosis in Dairy Cows at Postparturient Period: Acute Phase Proteins and Pro-Inflammatory Cytokines. Vet. Arhiv. 2017, 87, 431–440. [Google Scholar] [CrossRef]
- Knoblock, C.E.; Shi, W.; Yoon, I.; Oba, M. Effects of Supplementing a Saccharomyces cerevisiae Fermentation Product during the Periparturient Period on the Immune Response of Dairy Cows Fed Fresh Diets Differing in Starch Content. J. Dairy Sci. 2019, 102, 6199–6209. [Google Scholar] [CrossRef] [PubMed]
Figure 1.
Schematic overview of the study design. Cows were enrolled at dry-off (-60 days before the expected calving time) at each farm in two groups (Control: basal diet, Treatment: basal diet + daily supplementation of 25 grams of Saccharomyces cerevisiae cell wall throughout the experiment starting 7 days before the first sampling time at day -28). Sampling was conducted for both groups at each farm at 21 ± 2 days before calving; i.e. 1st sampling time, 7 ± 2 days before calving; i.e. 2nd sampling time, before calving and subsequently, postpartum blood samples were taken at 7 ± 2 days after calving; i.e. 3rd sampling time and 21 ± 2 days after calving; i.e. 4th sampling time.
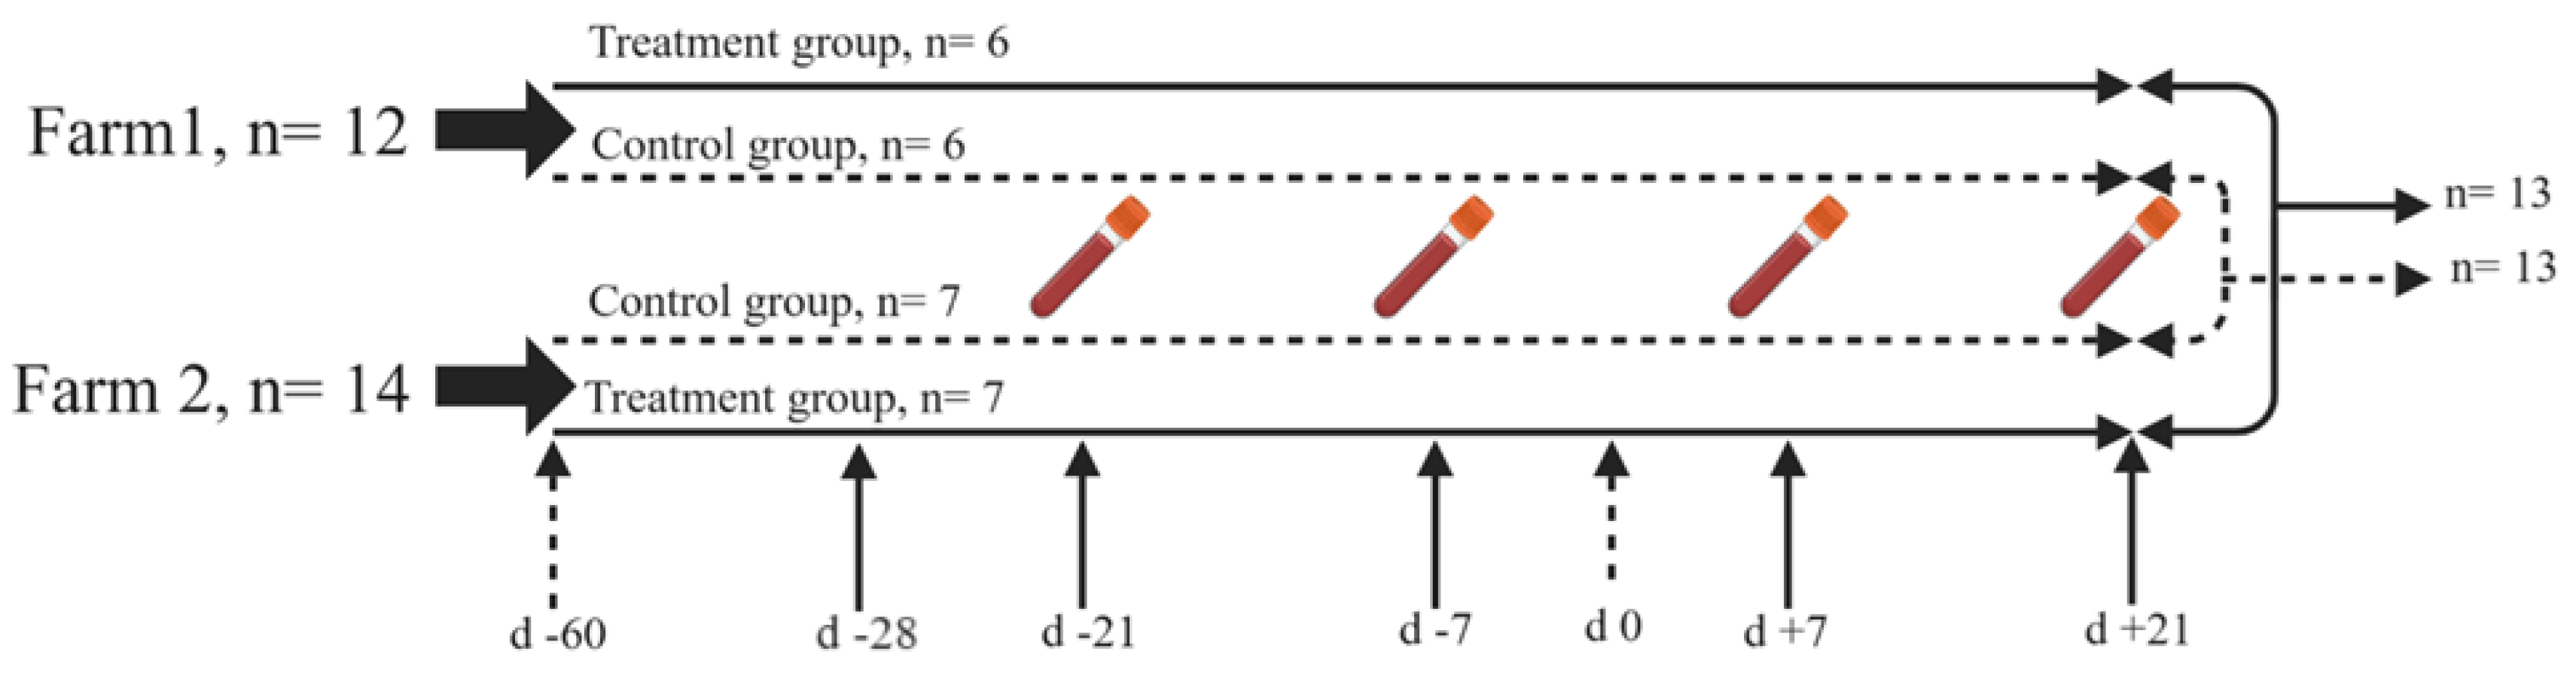
Figure 2.
The proportion of the variance explained by the retained principal components at 1st (21 ± 2 days before calving; i.e. ST1), 2nd (7 ± 2 before calving; i.e. ST2), 3rd (7 ± 2 after calving; i.e. ST3) and 4th sampling times (21 ± 2 after calving; i.e. ST4) have been presented in Part 1. Factor pattern coefficients for rotated factors in each sampling time and variables with loading (correlation>30) on each factor (presented with an asterisk) have been presented in Part 2. Comparison of the retained factor for each sampling time among treatments (solid = control group and plaid = S. Cerevisiae supplemented group) has been presented in Part 3 (** refers to P ≤ 0.05 and ͦ refers to 0.05 < P ≤ 0.10).
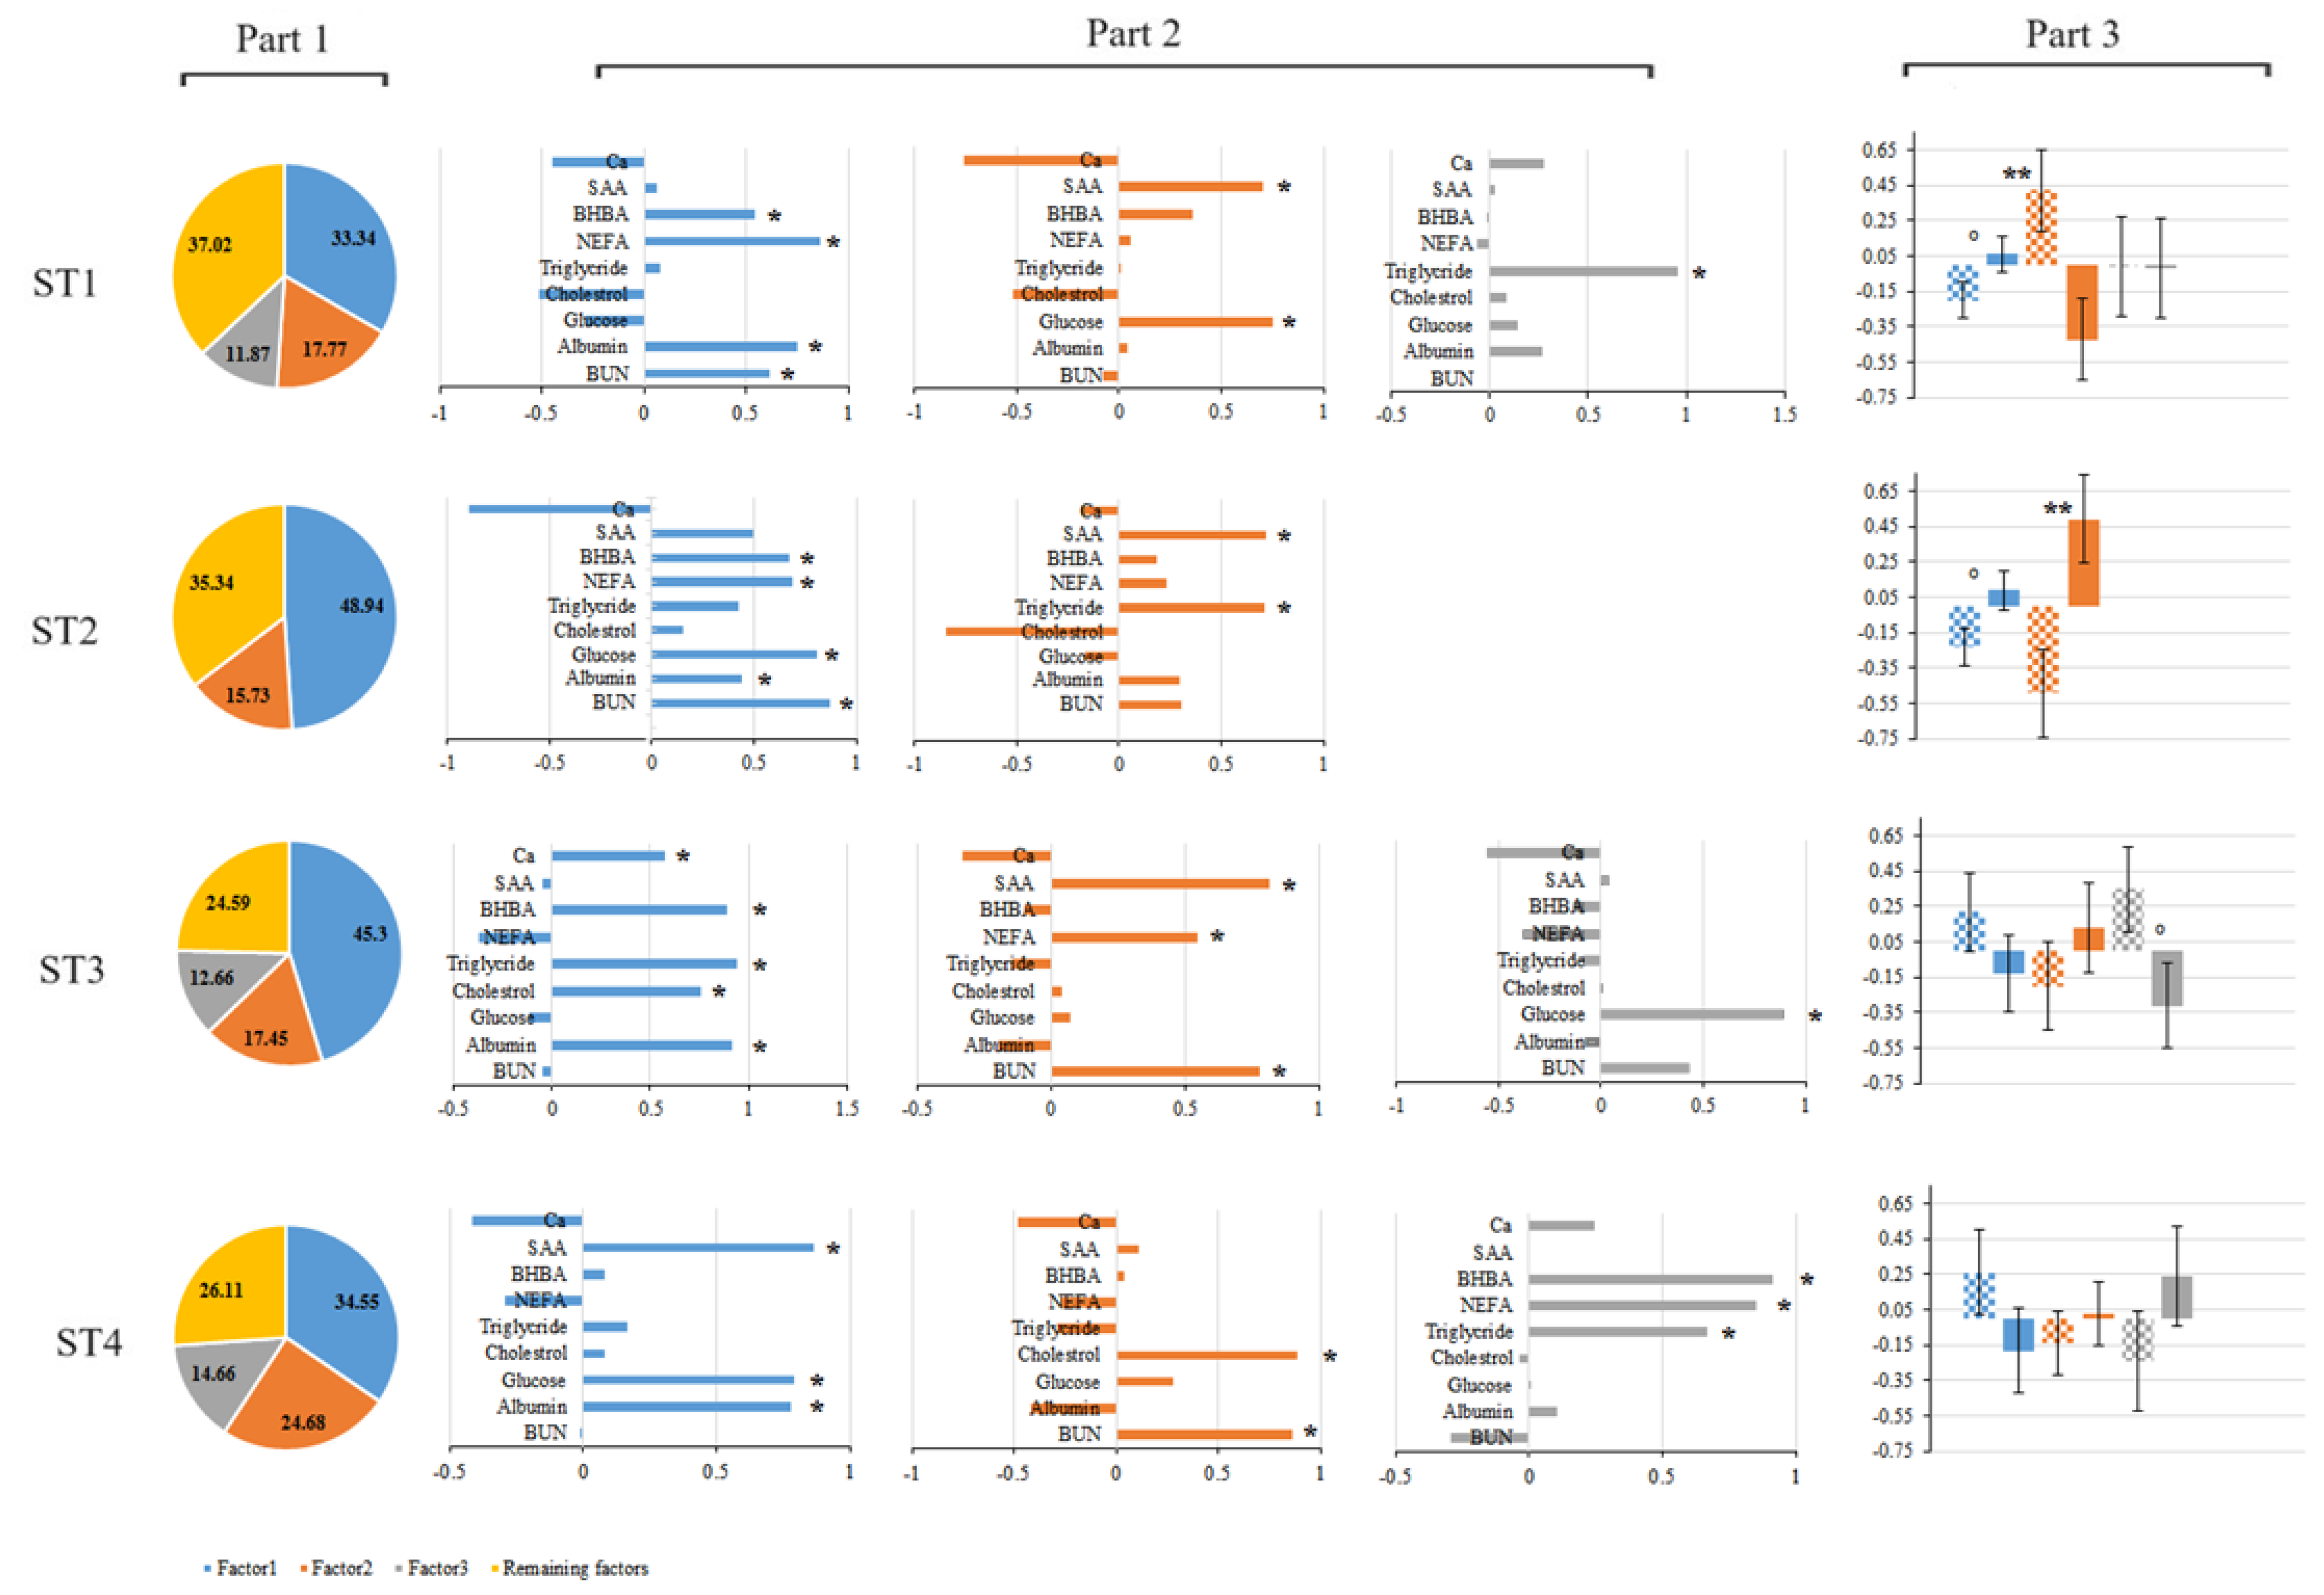

Table 1.
Eigenvalues and proportion of the variance explained by the retained principal components at 1st (21 ± 2 days before calving; i.e. ST1), 2nd (7 ± 2 before calving; i.e. ST2), 3rd (7 ± 2 after calving; i.e. ST3) and 4th sampling times (21 ± 2 after calving; i.e. ST4).
Table 1.
Eigenvalues and proportion of the variance explained by the retained principal components at 1st (21 ± 2 days before calving; i.e. ST1), 2nd (7 ± 2 before calving; i.e. ST2), 3rd (7 ± 2 after calving; i.e. ST3) and 4th sampling times (21 ± 2 after calving; i.e. ST4).
| PCs1 | ST1 | ST2 | ST3 | ST4 | ||||
|---|---|---|---|---|---|---|---|---|
| Eigenvalue | Proportion | Eigenvalue | Proportion | Eigenvalue | Proportion | Eigenvalue | Proportion | |
| 1 | 3.00 | 33.34% | 4.40 | 48.94% | 4.08 | 45.30% | 3.11 | 34.55% |
| 2 | 1.59 | 17.77% | 1.42 | 15.73% | 1.57 | 17.45% | 2.22 | 24.68% |
| 3 | 1.067 | 11.87% | 1.14 | 12.66% | 1.32 | 14.66% | ||
| CPV2 | 62.98% | 64.66% | 75.41% | 73.88% | ||||
1: Principal components, 2: Cumulative proportion of variance explained by retained principal components.
Table 2.
Factor pattern coefficients for rotated factors1 estimated in first (21 ± 2 days before calving; i.e. ST1), second (7 ± 2 before calving; i.e. ST2), 3rd (7 ± 2 after calving; i.e. ST3) and 4th sampling times (21 ± 2 after calving; i.e. ST4).
Table 2.
Factor pattern coefficients for rotated factors1 estimated in first (21 ± 2 days before calving; i.e. ST1), second (7 ± 2 before calving; i.e. ST2), 3rd (7 ± 2 after calving; i.e. ST3) and 4th sampling times (21 ± 2 after calving; i.e. ST4).
| ST1 | ST2 | ST3 | ST4 | |||||||||||||||
|---|---|---|---|---|---|---|---|---|---|---|---|---|---|---|---|---|---|---|
| Variables | F 1 | F 2 | F 3 | F 1 | F 2 | F 1 | F 2 | F3 | F 1 | F 2 | F 3 | |||||||
| BUN2 | 0.61 | -0.08 | -0.01 | 0.87 | 0.29 | -0.04 | 0.77 | 0.43 | -0.01 | 0.86 | -0.29 | |||||||
| Albumin | 0.75 | 0.04 | 0.26 | 0.44 | 0.29 | 0.91 | -0.19 | -0.08 | 0.78 | 0.41 | 0.11 | |||||||
| Glucose | -0.29 | 0.75 | 0.14 | 0.80 | -0.16 | -0.11 | 0.07 | 0.89 | 0.79 | 0.28 | 0.01 | |||||||
| Cholesterol | -0.51 | -0.51 | 0.08 | 0.15 | -0.84 | 0.75 | 0.04 | 0.01 | 0.08 | 0.89 | -0.03 | |||||||
| Triglyceride | 0.08 | 0.01 | 0.95 | 0.42 | 0.70 | 0.94 | -0.14 | -0.08 | 0.16 | -0.28 | 0.66 | |||||||
| NEFA3 | 0.87 | 0.06 | -0.06 | 0.68 | 0.23 | -0.36 | 0.54 | -0.38 | -0.29 | -0.27 | 0.85 | |||||||
| BHBA4 | 0.54 | 0.36 | -0.01 | 0.67 | 0.18 | 0.88 | -0.09 | -0.13 | 0.08 | 0.04 | 0.91 | |||||||
| SAA5 | 0.06 | 0.70 | 0.03 | 0.49 | 0.72 | -0.04 | 0.81 | 0.03 | 0.86 | 0.10 | -0.01 | |||||||
| Ca6 | -0.45 | -0.76 | 0.27 | -0.89 | -0.18 | 0.57 | -0.32 | -0.55 | -0.41 | -0.47 | 0.24 | |||||||
1: Variables with loading (correlation>30) on each factor have been retained for factor summarization presented in Table 3, 2: Blood urea nitrogen, 3: Non-esterified fatty acid, 4: Beta hydroxy butyric acid, 5: Serum amyloid A, 6: Calcium, 7: Factor.
Table 3.
Summary of the variables arranged according to the highest loading1 on each factor at 1st (21 ± 2 days before calving; i.e. ST1), 2nd (7 ± 2 before calving; i.e. ST2), 3rd (7 ± 2 after calving; i.e. ST3) and 4th sampling times (21 ± 2 after calving; i.e. ST4).
Table 3.
Summary of the variables arranged according to the highest loading1 on each factor at 1st (21 ± 2 days before calving; i.e. ST1), 2nd (7 ± 2 before calving; i.e. ST2), 3rd (7 ± 2 after calving; i.e. ST3) and 4th sampling times (21 ± 2 after calving; i.e. ST4).
| Factors | ST2 1 | ST2 | ST3 | ST4 |
|---|---|---|---|---|
| F 1 | NEFA3, Albumin, BUN4, BHBA5 | BUN, Glucose, NEFA, BHBA, Albumin | Triglyceride, Albumin, BHBA, Cholesterol, Ca7 | SAA, Glucose, Albumin |
| F 2 | Glucose, SAA6 | SAA, NEFA | SAA, BUN, NEFA | Cholesterol, BUN |
| F 3 | Triglyceride | . | Glucose | BHBA, NEFA, Triglyceride |
1: Variables with loading (correlation>30) on each factor have been retained, 2: Sampling time, 3:Non-esterified fatty acid, 4: Blood urea nitrogen, 5: Beta hydroxybutyric acid, 6: Serum amyloid A, 7: Calcium,.
Table 4.
Average estimates with corresponding standard errors of the factors1 comparing treatments (S. Cerevisiae and Control), farms (farm1 and farm2), and interaction of treatment and farm for each factor at 1st (21 ± 2 days before calving; i.e. ST1), 2nd (7 ± 2 before calving; i.e. ST2), 3rd (7 ± 2 after calving; i.e. ST3) and 4th sampling times (21 ± 2 after calving; i.e. ST4).
| Treatments | Farms | T×F9 | ||||||||||
| S. Cerevisiae | Control | P value | Farm 1 | Farm 2 | P value | P value | ||||||
| ST2 1 | ||||||||||||
| F1 (NEFA3, Alb4, BUN5, BHBA6) | -0.20 ± 0.10 | 0.06± 0.10 | 0.08 | -0.97 ± 0.11 | 0.83 ± 0.10 | < 0.05 | 0.17 | |||||
| F2 (Glucose, SAA7) | 0.42 ± 0.23 | -0.42 ± 0.23 | 0.01 | 0.004 ±0.23 | -0.003 ± 0.22 | 0.98 | 0.01 | |||||
| F3 (Triglyceride) | -0.009 ± 0.28 | -0.02 ± 0.28 | 0.97 | -0.20 ± 0.29 | 0.17 ± 0.27 | 0.37 | 0.57 | |||||
| ST2 | ||||||||||||
| F1 (BUN, Glucose, NEFA, BHBA, Alb) | -0.23 ± 0.11 | 0.09 ± 0.11 | 0.06 | -0.95 ± 0.12 | 0.81 ± 0.11 | < 0.05 | 0.64 | |||||
| F2 (SAA, Triglyceride) | -0.49 ± 0.25 | 0.49 ± 0.25 | 0.01 | -0.05 ± 0.26 | 0.04 ± 0.24 | 0.79 | 0.54 | |||||
| ST3 | ||||||||||||
| F1 (TAG, Alb, BHBA, Chol, Ca8) | 0.22 ± 0.22 | -0.13 ± 0.22 | 0.26 | 0.65 ± 0.23 | -0.56 ± 0.21 | < 0.05 | 0.61 | |||||
| F2 (SAA, BUN, NEFA) | -0.20 ± 0.25 | 0.13 ± 0.25 | 0.37 | -0.46 ± 0.26 | 0.39 ± 0.24 | 0.02 | 0.52 | |||||
| F3 (Glucose) | 0.35 ± 0.24 | -0.31 ± 0.24 | 0.06 | 0.28 ± 0.25 | -0.24 ± 0.23 | 0.14 | 0.31 | |||||
| ST4 | ||||||||||||
| F1 (SAA, Glucose, Alb) | 0.26 ± 0.24 | -0.18 ± 0.24 | 0.20 | 0.53 ± 0.25 | -0.46 ± 0.23 | < 0.05 | 0.38 | |||||
| F2 (Cholesterol, BUN) | -0.14 ± 0.18 | 0.03 ± 0.18 | 0.48 | -0.79 ± 0.19 | 0.68 ± 0.17 | < 0.05 | 0.24 | |||||
| F3 (BHBA, NEFA, Triglyceride) | -0.24 ± 0.28 | 0.24 ± 0.28 | 0.24 | -0.006 ± 0.3 | 0.005 ± 0.27 | 0.97 | 0.51 | |||||
1: Variables with loading (correlation>30) on each factor have been retained, 2: Sampling time,3: Non-esterified fatty acid 4: Albumin, 5: Blood urea nitrogen, 6: Beta hydroxybutyric acid, 7: Serum amyloid A, 8: Calcium,9: Interaction of treatment and farm.
Disclaimer/Publisher’s Note: The statements, opinions and data contained in all publications are solely those of the individual author(s) and contributor(s) and not of MDPI and/or the editor(s). MDPI and/or the editor(s) disclaim responsibility for any injury to people or property resulting from any ideas, methods, instructions or products referred to in the content. |
© 2024 by the authors. Licensee MDPI, Basel, Switzerland. This article is an open access article distributed under the terms and conditions of the Creative Commons Attribution (CC BY) license (http://creativecommons.org/licenses/by/4.0/).
Copyright: This open access article is published under a Creative Commons CC BY 4.0 license, which permit the free download, distribution, and reuse, provided that the author and preprint are cited in any reuse.


