
Submitted:
05 December 2024
Posted:
05 December 2024
You are already at the latest version
Abstract
Genetic selection of dairy cattle has dramatically increased milk yield of dairy cows, but its influences on the chemical composition of milk, especially during early lactation, are not well characterized. A continuous selective breeding practice in Minnesota generated unselected Holsteins (UH) that represent US Holsteins in the early 1960s and contemporary Holsteins (CH) that produced much more milk and experienced greater negative energy balance than the UH cows. In this study, milk samples were collected weekly in the first 9 weeks of lactation from CH and UH cows (n = 12/genotype), and their metabolite profiles were defined by macronutrient analysis, liquid chromatography-mass spectrometry (LC-MS) analysis, multivariate analysis, structural elucidation, and quantitative analysis. The CH milk contained more triacylglycerols (TAGs) than the UH milk. Lipidomic profiling showed that the CH milk had more TAGs with at least two preformed fatty acid moieties while the UH milk had more TAGs with at least two de novo synthesized fatty acid moieties. Subsequent quantitative fatty acid analysis determined that the increase in preformed fatty acids in CH milk was responsible for different TAG profiles between the two genotypes. Moreover, the analysis of short-chain carboxylic acids in milk showed that episodes of transient and persistent ketosis were more frequent in CH than in UH cows. Interestingly, CH milk contained less free carnitine and short-chain acylcarnitines in the UH milk indicating the greater utilization of mobilized lipids increased the utilization of carnitine. These observations warrant further mechanistic investigations on the metabolic consequences of genetic selection on dairy cows.
Keywords:
carnitine
; fatty acids
; genetic selection
; lipidomics
; milk
; triacylglycerol
1. Introduction
Genetic selection, together with improved management of non-genetic factors in dairy farming, has transformed the phenotypic and genotypic characteristics of the Holstein cow, especially since the mid-1960s, leading to dramatic increases in milk yield as well as other traits [1,2,3]. Compared to extensive investigations that examined the influences of non-genetic factors, including health, nutrition, and husbandry on milk components [4,5,6,7], the impacts of long-term genetic selection were rarely explored due to limited availability of experimental models. Moreover, the existing comparisons on this topic through historical records are often confounded by the non-genetic factors [6,8]. In 1964, as part of a regional research effort on genetic selection, Dr. Charles Young initiated a breeding project at the University of Minnesota, that produced a static, unselected Holstein (UH) genotype and a contemporary Holsteins (CH) genotype that continually reflected changes in US selection practices [9,10,11,12]. The milk yield of UH cows has remained largely unchanged and thereof represents the status of the US Holstein population in the early 1960s. In contrast, the milk yield of CH cows is on par with the current US Holsteins and the difference between multiparous UH and CH cows in milk yield has already surpassed 4,500 kg/305 d lactation [3,12]. Many features of UH and CH cows, including reproduction, endocrine, metabolic health, have been compared [9,10,11,12]. Although an initial evaluation of the fatty acids in milk from UH and CH cows has been reported [13], a more comprehensive evaluation of their milk lipids during the dynamic transition period is warranted.
Dairy products from cow milk play a significant role in human nutrition [14,15]. Lipid content is a major determinator of the value and nutritional properties of cow milk. As the dominant lipid species, triacylglycerols (TAGs) in milk contain both de novo fatty acids that are synthesized from short-chain carboxylic acids (mainly acetate and 3-hydroxybutyric acid) within the mammary gland and preformed fatty acids that are absorbed from the blood stream [6]. Preformed fatty acids originate from multiple sources, including dietary lipids, lipogenesis in the liver and adipose tissue, and rumen fermentation, such as odd-chain (C15 and C17) fatty acids produced by rumen microbes [16]. Because of the structural diversity of milk fatty acids (more than 400) and the availability of 3 hydroxyl groups in the glycerol backbone of TAGs for the esterification reaction with fatty acids, milk fat is more complex than many other natural fats [6,17]. Examining the composition of milk fatty acids and the factors that affect the contribution of individual fatty acids to fat synthesis continues to be a topic of interest in dairy research [18,19,20]. For example, associations between genetic polymorphisms and presence of predominant milk fatty acids could help develop breeding programs designed to alter the fatty acid content of milk [21]
Lipidomics has become a robust and versatile platform for phenotyping milk samples from different species, physiological status, and physical conditions [19,22,23,24]. In this study, the comprehensive liquid chromatography-mass spectrometry (LC-MS)-based lipidomic analysis, covering individual TAGs, fatty acids, and short-chain carboxylic acids, was conducted to compare milk samples from UH and CH cows in the first 9 weeks of lactation. Since these lipid metabolites in milk are the products of many essential metabolic processes, differences between UH and CH cows are expected to reveal the consequences of genetic and metabolic alterations from 60 years of selection.
2. Materials and Methods
Chemicals and reagents. LC-MS-grade water, acetonitrile (ACN), and isopropanol (IPA) were purchased from Thermo Fisher Scientific (Houston, TX); 2-hydrazinoquinoline (HQ) and triphenylphosphine (TPP) from Alfa Aesar (Ward Hill, MA); 2,2’-dipyridyl disulfide (DPDS) from MP Biomedicals (Santa Ana, CA); n-butanol, short-chain carboxylic acids, carnitine and acylcarnitines from Sigma-Aldrich (St. Louis, MO); fatty acid standards from Nu-Chek-Prep (Elysian, MN); 1,2-13C2-palmitic acid from CDN Isotopes (Pointe-Claire, QC, Canada).
Animals, experimental design, and sample collection. Multiparous UH and CH cows (n = 12/genotype) were housed together for at least 5 weeks prior to parturition and fed the same pre- and postpartum diets throughout the study. Diets were formulated as TMR designed to meet the nutritional needs of contemporary Holsteins [25] and cows were fed once daily. Cows were milked at approximately 12-h intervals and daily milk yields determined from recorded milk weights. Milk samples for nutrient and lipidomic analyses were collected at every Tuesday night milking during the first 9 weeks of lactation with aliquots either stored at -80°C until subsequent processing for metabolite analysis or preserved with dichromate and submitted (Minnesota Dairy Herd Improvement Association Laboratory; Zumbrota, MN) for determination of macronutrient (protein, lactose, and fat) content using infrared spectroscopy. Energy balance of the cows was determined according to NRC (2001) [25] as described by Carriquiry et al. (2009) [26]. Animals were observed daily for health abnormalities and treated when warranted. Animal care and experimental procedures were approved by the University of Minnesota Institutional Animal Care and Use Committee (1207B17664, approval date 07-18-2012).
LC-MS analysis of milk lipids. To solubilize the neutral lipids, whole milk was vortexed at room temperature for 5 sec before 5 µL of this homogenized milk was mixed with 245 µL of n-butanol and vortexed for another 5 sec. This vortexed mixture was centrifuged at 18,000×g for 10 min to remove proteins and precipitates. The supernatant was transferred to a HPLC vial for the LC-MS analysis. To conduct the LC-MS analysis, 5 µL of aliquot of the supernatant was injected in to an Acquity ultra-performance liquid chromatography (UPLC) system (Waters, Milford, MA) and components separated by a BEH C8 column (Waters) using a mobile phase gradient, A: H2O:ACN=60:40 (v/v) containing 0.1% formic acid (v/v) and 10 mM ammonium acetate and B: IPA:H2O=90:10 (v/v) containing 0.1% formic acid (v/v) and 10 mM ammonium acetate. The UPLC eluant was introduced into a Xevo-G2-S quadrupole time-of-flight mass spectrometer (QTOFMS, Waters) for accurate mass measurement and ion counting. Capillary voltage and cone voltage for electrospray ionization were set at 3 kV and 30 V for positive-mode detection, respectively. Source temperature and desolvation temperature were set at 120°C and 350°C, respectively. Nitrogen was used as the cone gas (50 L/h) and the desolvation gas (600 L/h) and argon as collision gas. For accurate mass measurement, the mass spectrometer was calibrated with sodium formate solution with mass-to-charge ratio (m/z) of 50–1000 and monitored by the intermittent injection of the lock mass leucine enkephalin ([M + H]+ = m/z 556.2771 and ([M − H]− = m/z 554.2615) in real time. Mass chromatograms and mass spectral data were acquired and processed by MassLynxTM software (Waters) in centroided format. Additional structural information was obtained from tandem MS (MSMS) fragmentation with collision energies ranging from 15 to 40 eV [27].
LC-MS analysis of milk fatty acids. Milk lipids were hydrolyzed to release free fatty acid using a modified alkaline hydrolysis method [28]. Briefly, 5 µL of milk sample was mixed with 200 µL of methanol containing 200 µM 1,2-13C2-palmitic acid as the internal standard, and then hydrolyzed by adding 35 µL of 40% potassium hydroxide (w/v). The mixture was incubated at 60 °C for 30 min and then neutralized by 60 µL of 2.5 M HCl and 200 µL of phosphate buffer (75 mM, pH=7). After a 10-min centrifugation at 18,000 × g, the supernatant containing free fatty acids was collected and further derivatized for LC-MS analysis. To derivatize free fatty acids, 2 µL of sample or fatty acid standard was mixed with 100 µL of freshly prepared master reaction solution containing 1 mM DPDS, 1 mM TPP, and 1 mM HQ in ACN. The mixture was incubated at 60 °C for 30 min and chilled on ice for 10 min. The reaction was terminated by mixing with 100 µL of H2O. After a 10-min centrifugation at 18,000×g, the supernatant was transferred into an HPLC vial. For LC-MS analysis, 5 µL of HQ-derivatized sample was injected into an Acquity ultra-performance liquid chromatography (UPLC) system (Waters, Milford, MA) and separated by a BEH C18 column (Waters) using a gradient ranging from water to 95% aqueous ACN containing 0.1% formic acid over a 10-min run.
LC-MS analysis of milk short-chain carboxylic acids. Milk samples were derivatized by HQ, without hydrolysis, for the LC-MS analysis of short-chain carboxylic acids [29]. The derivatization procedure, LC gradient, and the MS parameters are the same as the ones used for the LC-MS analysis of free fatty acids, except the mobile phase, which contained A: H2O containing 0.05% acetic acid (v/v) and 2 mM ammonium acetate and B: H2O:ACN=5:95 (v/v) containing 0.05% acetic acid (v/v) and 2 mM ammonium acetate.
Marker identification through multivariate data analysis. Chromatographic and spectral data from LC-MS analysis of milk samples were visualized in 2-D plots using MZmine software [30], and deconvoluted by MarkerLynxTM software (Waters). A multivariate data matrix containing information on sample identity, ion identity [retention time (RT) and m/z], and ion abundance was generated through centroiding, deisotoping, filtering, peak recognition, and integration. The intensity of each ion was calculated by normalizing the single ion counts (SIC) versus the total ion counts (TIC) in the whole chromatogram. The processed data matrix was further exported into SIMCA-P+TM software (Umetrics, Kinnelon, NJ), transformed by Pareto scaling and analyzed by principal components analysis (PCA) and orthogonal partial least squares-discriminant analysis (OPLS-DA). Major latent variables in the data matrix were described in a scores scatter plot of defined multivariate model. Potential metabolite markers of genetic selection for high milk yield were identified by analyzing ions contributing to the separation of sample groups in an S-loadings plot of OPLS-DA model. After Z score transformation, the concentrations or relative abundances of identified metabolite markers in examined samples were presented in the heat maps generated by the R program (http://www.R-project.org), and correlations among these metabolite markers defined by hierarchical clustering analysis (HCA).
Marker characterization and quantification. The chemical identities of metabolite markers were determined by accurate mass measurement, elemental composition analysis, database search, MSMS fragmentation, and comparisons with authentic standards if available. Database searches were performed using Human Metabolome Database (HMDB), Kyoto Encyclopedia of Genes and Genomes (KEGG), and Lipid Maps databases. Individual metabolite concentrations were determined by calculating the ratio between the peak area of metabolite and the peak area of internal standard and fitting with a standard curve using QuanLynxTM software (Waters).
Statistical analysis. Cows were blocked (1 per genotype) by actual calving date (< 21 d interval within any block). Effects of genotype, week of lactation and their interactions on milk yield and component concentration profiles were analyzed by repeated measures using PRO MIXED procedure of SAS with week of lactation as the repeated effect. Experimental values are reported as mean ± standard error of the mean (SEM) and considered to differ when P < 0.05.
3. Results
Milk yield, milk macronutrient content, and energy balance of the cows. During weeks 1 to 9 of lactation, CH cows produced more milk than UH cows (Figure 1A). This difference in milk yield is consistent with the status of postpartum energy balance in two genetic lines, i.e., the energy balance at week 1, 2, 3, 4, 5, 6, 7, 8 and 9 of lactation was -4.47, -2.71, -0.68, 1.28, 1.16, 1.36, 2.93, 2.05 and 3.98 Mcal net energy of per day (NEL/d), respectively, for UH cows, while -14.8, -11.8, -8.76, -6.95, -6.29, -5.92, -4.17, -4.55, and -2.33 Mcal NEL/d, respectively, for CH cows. Among the macronutrients in milk, the concentrations of lactose and protein were comparable between UH and CH milk (Figure 1B-C). In contrast, CH milk contained more fat than UH milk (Figure 1D). Therefore, genotype and energy status affected the fat and lipid content of cow milk more than its lactose or protein contents. Time-dependent alterations in milk yield, lactose, protein, and fat occurred in UH and CH cows (Figure 1A-D). Moreover, a genotype-time interaction was observed for milk fat content as the difference between UH and CH milk fat in week 1 gradually decreased during the first 9 weeks of lactation (Figure 1D).
TAGs in UH and CH milk. The LC-MS-based lipidomic analysis of UH and CH milk detected hundreds of TAG species with different molecular weights, unsaturation levels, and abundances (Figure 2). As exemplified by the MSMS spectrum of T12 [TAG (4:0, 16:0, 18:1)] in the insert of Figure 2, the fatty acid composition of 50 major TAG species were determined based on the product ions from MSMS fragmentation (Table 1). The composition of milk lipids was defined by a PCA model, in which the distribution patterns of weekly samples reflect the differences between UH and CH milk and the kinetics of their compositional changes during the first 9 weeks of lactation (Figure 3A). As indicated by the distances between weekly CH and UH means in the model, the differences between UH and CH in the first three weeks of lactation were much greater than the differences at week 9 of lactation (Figure 3A). Moreover, the distances between week 1 and week 9 in the model indicate that the composition of CH milk underwent more dramatic changes than that of UH milk (Figure 3A). The TAG markers positively associated with CH or UH milk were identified in the loadings S-plot of an OPLS-DA model (Figure 3B and Table 1). Interestingly, all identified TAG markers of UH cows contain at least two fatty acids with their aliphatic tails no longer than 16 (≤ 16) carbons (Figure 3C-E and Table 1), while all identified TAG markers of CH cows contain at least two fatty acids with their aliphatic tails no shorter than 16 (≥ 16) carbons (Figure 3F-H and Table 1). Furthermore, the relative abundances of these markers became more comparable between two genotypes at week 9 of lactation (Figure 3C-H), which is consistent with the pattern of sample distribution in the PCA model (Figure 3A). In addition to genotype-dependent differences in the relative abundances and fatty acid composition of milk TAGs, time (week of lactation) and genotype-time interactions also impacted the relative abundance of these identified TAG markers (Figure 3C-H).
Fatty acid compositions of UH and CH milk. To further characterize the genotype-dependent difference in the fatty acid composition of milk TAGs, the concentrations of fatty acids in hydrolyzed milk were determined by the LC-MS analysis of their hydrazide derivatives formed by the reactions with 2-hydrazinoquinoline (HQ), as shown by the MSMS spectrum of myristic acid (Figure 4A). Using this method, 27 fatty acids with aliphatic chains ranging from 4 to 22 carbons (C4-C22) in milk were detected and quantified (Figure 4B and Table S1). The results from calculating the average concentrations of individual fatty acids in all 9 weeks of lactation showed that CH milk had higher concentrations of C16-18 fatty acids, except conjugated linoleic acid (CLA) and γ-linolenic acid (GLA), than UH milk (Figure 4C-D and Figure S1G-K), while the concentrations of C4-14 fatty acids were comparable between these genotypes (Figure 4C and Figure S1A-F). The average concentrations of docosapentaenoic acid (DPA) and docosahexaenoic acid (DHA), two ω-3 fatty acids, were lower in CH milk than that in UH milk, even though the concentration of α-linolenic acid (ALA), their precursor, was greater in CH milk (Figure 4D). The total fatty acid concentration was greater in CH milk than in UH milk (Figure S2L), which is consistent with the fat contents in these milk samples (Figure 1D). Interestingly, when these fatty acid concentrations were converted to their relative abundance (%) in the total sum of measured fatty acids, several of the C8 to C14 fatty acids, including caprylic acid (C8:0), lauric acid (C12:0), and myristic acid (C14:0), had greater relative abundances in UH than in CH milk (Figure S1A-F) while the abundances of most C16 to C18 fatty acids, except palmitoleic acid (C16:1) and linoleic acid (C18:2), were comparable between UH and CH milk (Figure S1G-L). The ratio of preformed versus de novo FA, defined by (C17-C22)/(C4-C14), was relatively stable in UH milk but gradually decreased in CH milk (Figure 4E). Moreover, the ratio of saturated fatty acids (SFA) versus unsaturated fatty acids (UFA) were impacted by time and a genotype-time interaction, but not by genotype alone (Figure 4F).
Short-chain carboxylic acids in UH and CH milk. Short-chain carboxylic acids are precursors in de novo fatty acid synthesis as well as metabolites in fatty acid oxidation and transport. Their profiles in UH and CH milk during the first 9 weeks of lactation were defined by LC-MS analysis and multivariate modeling. The distribution of weekly UH and CH samples in the scores plot of a PCA model revealed genotype-dependent differences and time-dependent changes in short-chain carboxylic acids, especially during the first 3 weeks of lactation (Figure 5A). Further analysis of the short-chain carboxylic acids contributing to the genotype-dependent separation in the loading S-plot of the OPLS-DA model identified butyric acid, propionic acid, 3-hydroxybutyric acid and 2-ketoglutaric acid as markers that were positively associated with CH milk and carnitine, acetylcarnitine, propionylcarnitine, isobutyrylcarnitine, isovalerylcarnitine, pyroglutamic acid and lactic acid as markers that were positively associated with UH milk (Figure 5B).
There was an interaction between genotype and time on concentrations of 3-hydroxybutyric acid (Figure 5C), carnitine (Figure 5D) and butyric acid (Figure S3A). These interactions were mainly due to the occurrence of transient (N = 4 cows) and persistent (N = 2 cows) subclinical ketosis (milk 3-hydroxybutyric acid > 100 µM) in individual CH cows (Figure S2). Removing the 2 cows with persistent subclinical ketosis from the analysis (data not shown) eliminated the genotype-time interaction on the concentration of 3-hydroxybutyric acid, carnitine and butyric acid but did not alter the effects of genotype or week on carnitine. Removing these 2 cows also did not alter the effects of genotype or time on the concentrations of any of the 4 carnitine metabolites (Figure 5D-H). The UH milk consistently contained more of these carnitine metabolites than CH milk. Concentrations of these carnitine metabolites decreased from week 1 through 4 in milk from UH and CH cows and remained relatively stable thereafter (Figure 5D-H). Concentrations of lactic acid, the other marker we identified as positively associated with UH milk, were greater in UH than in CH milk (Figure S3B).
Clustering analysis of UH and CH milk lipidomes. The hierarchical clustering analysis based on the relative abundances of identified TAGs, FAs, and short-chain carboxylic acids during the first 9 weeks of lactation produced a heat map with 4 major clusters (Figure 6). Cluster A contains metabolites that were more abundant in UH milk and that also gradually decreased in both CH and UH milk during the first 9 weeks of lactation. Cluster A included carnitines and PUFAs. Clusters B and C contain the metabolites that were more abundant in CH milk. These clusters were mainly comprised of preformed fatty acids, the TAGs with at least two preformed fatty acids, and free SCFAs from rumen fermentation. Cluster D contains the metabolites that were more abundant in UH milk and did not decrease as lactation progressed, including de novo fatty acids, TAGs with at least two de novo fatty acids, and lactic acid.
4. Discussion
Continuous selection efforts for greater milk yield have led to significant changes in the genome and metabolic system of dairy cattle as well as the milk they produce [1,3,12,13]. Milk synthesis utilizes end products from anabolic and catabolic metabolism in multiple organs and tissues of dairy cows, including mammary gland, liver, adipose, and rumen. Therefore, alterations in these metabolic processes are expected to impact the volume of milk produced by a cow as well as its compositional profile. The results from this lipidomic study on genetic selection match this expectation since dramatic changes in milk lipid composition were observed in UH and CH cows during the transition across parturition and early lactation, which is the most dynamic interval of metabolic alterations for a cow. Moreover, the magnitude of compositional changes was greater in CH than in UH milk, reflecting the consequences of genetic selection. The primary drivers of these time-dependent changes and genotype-dependent differences are likely associated with differences in energy status and metabolic adaptations in CH and UH cows. The observed differences between UH and CH cows in TAGs, fatty acids, carnitines and other short-chain carboxylic acids are discussed based on their potential causes and significances as follows.
TAGs and fatty acids: The Minnesota breeding program was designed to increase milk yield by the CH cows while maintaining a relatively static milk yield by the UH cows [9]. Besides this difference in milk yield between the UH and CH cows [12,13], the differences in major milk components, especially TAGs, were also observed in the current study. As the most abundant and energy-intensive constituent in milk, the TAGs in early-lactation milk can reflect the metabolic alterations associated with negative energy balance in this transition period [31]. In the current study, this association is reflected by the fact that the CH cows experienced a more negative energy balance and had a greater increase in milk TAGs during early lactation than the UH cows. Moreover, early lactation milk underwent time-dependent changes in TAG profile due to the compositional changes in their fatty acids, especially in CH milk. Interestingly, by week 9 of lactation, the TAG profile and fatty acid composition of CH and UH milk became much more comparable, indicating similar metabolic status between them after the transition phase.
Among the fatty acids in milk TAGs, C4-C14 fatty acids mainly originate from de novo fatty acid synthesis in the mammary gland, C17-C22 fatty acids from preformed fatty acids in blood lipids, and C16 fatty acids from both sources [6,7]. A prominent observation on milk fatty acids in the current study is the greater concentrations of preformed fatty acids in CH milk than those in UH milk (Figure 4C), especially during the first 6 weeks of lactation (Figure S1I-K). This phenomenon can be attributed to the prolonged interval of negative energy balance for greater milk yield in CH cows, which led to more mobilization of preformed fatty acids from other tissues and organs. In contrast, the concentrations of de novo fatty acids were much more comparable between CH and UH milk (Figure S1A-F), making preformed fatty acids, not de novo fatty acids, as the main contributors to the different TAG profiles between UH and CH milk. This altered balance between preformed and de novo fatty acids decreased the relative abundances of de novo fatty acids in CH milk (Figure 4E, Figure S1), even though the absolute concentrations of de novo fatty acids were still largely comparable between UH and CH milk (Figure S1).
Transition cows experience physiological challenges posed by calving, the onset of lactation, and the associated interval of negative energy balance [31]. Significant adjustments in body metabolism are required to accommodate the immediate postpartum increase in metabolic demand for milk production while the cow slowly increases her feed intake from the reduction that occurs prior to calving. The greater elevation of preformed fatty acids in CH milk are consistent with the CH cows having a greater metabolic demand than UH cows to mobilize fatty acids from body tissue to meet their greater energy needs and greater demand for substrates for milk TAG synthesis. Although fatty acids from tissue lipolysis generally provide a minor proportion of the fatty acids used for milk lipid biosynthesis, during negative energy balance mobilized fatty acids provide the majority of the fatty acids for milk lipid biosynthesis [7]. Indeed, in a separate study on blood lipids, we observed that the concentrations of plasma non-esterified fatty acids (NEFA) in CH cows were greater than those in UH cows through week 7 of lactation (data not shown). Further characterization of plasma lipid profiles will likely provide additional insights on the relationships between blood lipids and milk TAGs in UH and CH cows.
Carnitines and other short-chain carboxylic acids: Carnitine is a facilitator for the transfer of long-chain fatty acids into the mitochondria for β-oxidation as well as for the transport of short and medium chain fatty acids from peroxisomes to mitochondria [32,33]. The presence of carnitine and acylcarnitines in cow milk have been reported previously [34,35,36]. The current study defined their kinetic profile in the early-lactation milk of UH and CH cow, showing that their concentrations in both UH and CH milk decreased dramatically in early lactation, and at the same time, UH milk consistently had more carnitine metabolites than CH milk (Figure 5D-H). Since carnitine is only synthesized in the kidney, liver and brain, but in the mammary gland [33], the carnitine content of UH and CH milk depend on the biosynthesis in these organs as well as active uptake from the circulation. Therefore, reduced biosynthesis, decreased uptake into mammary gland, and increased utilization could jointly or individually contribute to the decreased carnitine content in early postpartum UH and CH milk. In fact, postpartum decreases in milk carnitine have been documented [35,37] and attributed to periparturient alterations in hepatic synthesis of carnitine [37,38]. As for the reduced concentrations of carnitines in CH milk relative to UH milk, this difference between UH and CH cows could also be attributed to differential impacts of these factors in carnitine metabolism. For example, the more severe and longer interval of negative energy balance experienced by the CH cows most likely increased the use of carnitine for the metabolism and transport of mobilized NEFA, leading to reduced carnitine concentrations in CH milk.
Short-chain fatty acids and ketone bodies are both end products of fatty acid oxidation and substrates for fatty acid synthesis. In mammary epithelial cells, acetic acid and 3-hydroxybutyric acid are used for de novo synthesis of fatty acids [7]. Our results indicated greater increases of 3-hydroxybutyrate and butyric acid in CH milk. More specifically, dramatic elevation of 3-hydroxybutyrate occurred in half of the CH cows during the first 5 weeks of lactation, indicating transient or persistent subclinical ketosis. Interestingly, total carnitine concentrations in milk have been reported to be greater in ketotic cows than normal cows [35]. In contrast, the 2 CH cows with persistent subclinical ketosis in the current study had the lowest milk carnitine concentrations (data not shown) of the CH cows. Further investigations might be needed to define the reasons for this discrepancy.
5. Conclusions
Genetic selection for greater milk yield significantly affected the composition of milk TAGs and short-chain carboxylic acids in early lactation. These compositional differences were diminished by week 9 of lactation, indicating that they were mostly induced by metabolic alterations associated with the magnitude and duration of insufficient energy (and nutrients) during the transition into lactation. In this lipidome-focused evaluation, the largest compositional changes were detected in milk TAGs and were mainly attributed to increased incorporation of preformed fatty acids in CH milk. This is consistent with the need to mobilize larger quantities of tissue fat for energy expenditure and milk production in CH cows. In addition, a greater postpartum reduction in CH milk carnitines was identified as the most prominent change in short-chain carboxylic acids, implying potential benefits of feeding supplemental carnitine for milk production. As a metabotyping investigation, this study did not evaluate the underlying mechanisms responsible for these metabolic events. Nevertheless, the new phenotypic information we generated on the impact of genetic selection on milk TAGs, fatty acids, and short-chain carboxylic acids provides a foundation for further investigation.
Supplementary Materials
The following supporting information can be downloaded at the website of this paper posted on Preprints.org. Table S1. Identification of fatty acids in LC-MS analysis. Figure S1. Kinetics of fatty acids in UH and CH milk during the first 9 weeks of lactation. Figure S2. Identification of ketoic milk samples from UH and CH cows. Figure S3. Different distribution of short-chain carboxylic acids in CH and UH milk.
Author Contributions
Authors contributed as follows; “Conceptualization, W.J.W., C.C. and B.A.C.; methodology, W.J.W., C.C. and B.A.C..; validation, W.J.W., C.C. and B.A.C.; formal analysis, F.D., W.J.W. and R.U..; investigation, W.J.W. and B.A.C.; resources, C.C. and B.A.C.; data curation, W.J.W. and C.C.; writing—original draft preparation, F.D.; writing—review and editing, C.C. and B.A.C.; visualization, F.D., W.J.W., R.S. and C.C.; supervision, C.C. and B.A.C.; project administration, B.A.C.; funding acquisition, C.C. and B.A.C. All authors have read and agreed to the published version of the manuscript.
Funding
This research was funded in part by USDA-National Institute of Food and Agriculture, grant number 2014-67015-21606 and the Minnesota Agricultural Experiment Station, St. Paul, project number 16-083 and 18-125.
Data Availability Statement
The data presented in this study are available in the main article and the supplementary materials.
Acknowledgments
The authors appreciate the excellent animal care and courteous assistance provided throughout the study by Nate McDonald and staff at the University of Minnesota, Dairy Research and Teaching Facility, St. Paul, MN..
Conflicts of Interest
The authors declare no conflicts of interest. The funders had no role in the design of the study; in the collection, analyses, or interpretation of data; in the writing of the manuscript; or in the decision to publish the results.
References
- Cole, J.B.; VanRaden, P.M.; O'Connell, J.R.; Van Tassell, C.P.; Sonstegard, T.S.; Schnabel, R.D.; Taylor, J.F.; Wiggans, G.R. Distribution and location of genetic effects for dairy traits. J Dairy Sci 2009, 92. [Google Scholar] [CrossRef]
- Egger-Danner, C.; Cole, J.B.; Pryce, J.E.; Gengler, N.; Heringstad, B.; Bradley, A.; Stock, K.F. Invited review: overview of new traits and phenotyping strategies in dairy cattle with a focus on functional traits. Animal : an international journal of animal bioscience 2015, 9, 191–207. [Google Scholar] [CrossRef]
- Ma, L.; Sonstegard, T.S.; Cole, J.B.; VanTassell, C.P.; Wiggans, G.R.; Crooker, B.A.; Tan, C.; Prakapenka, D.; Liu, G.E.; Da, Y. Genome changes due to artificial selection in U.S. Holstein cattle. BMC Genomics 2019, 20, 128. [Google Scholar] [CrossRef] [PubMed]
- Palmquist, D.L.; Denise Beaulieu, A.; Barbano, D.M. Feed and Animal Factors Influencing Milk Fat Composition1. Journal of Dairy Science 1993, 76, 1753–1771. [Google Scholar] [CrossRef]
- Bauman, D.E.; Griinari, J.M. Regulation and nutritional manipulation of milk fat. Low-fat milk syndrome. Advances in experimental medicine and biology 2000, 480, 209–216. [Google Scholar] [CrossRef] [PubMed]
- Jensen, R.G. The Composition of Bovine Milk Lipids: January 1995 to December 2000. Journal of Dairy Science 2002, 85, 295–350. [Google Scholar] [CrossRef] [PubMed]
- Bauman, D.E.; Griinari, J.M. Nutritional regulation of milk fat synthesis. Annual review of nutrition 2003, 23, 203–227. [Google Scholar] [CrossRef]
- Capper, J.L.; Cady, R.A.; Bauman, D.E. The environmental impact of dairy production: 1944 compared with 2007. Journal of Animal Science 2009, 87, 2160–2167. [Google Scholar] [CrossRef] [PubMed]
- Young, C.W. Review of Regional Project NC-2. Journal of Dairy Science 1977, 60, 493–498. [Google Scholar] [CrossRef]
- Hansen, L.B. Consequences of selection for milk yield from a geneticist's viewpoint. J Dairy Sci 2000, 83, 1145–1150. [Google Scholar] [CrossRef] [PubMed]
- Kelm, S.C.; Freeman, A.E. Direct and correlated responses to selection for milk yield: results and conclusions of regional project NC-2, "improvement of dairy cattle through breeding, with emphasis on selection". NC-2 Technical Committee. J Dairy Sci 2000, 83, 2721–2732. [Google Scholar] [CrossRef] [PubMed]
- Weber, W.J.; Wallace, C.R.; Hansen, L.B.; Chester-Jones, H.; Crooker, B.A. Effects of genetic selection for milk yield on somatotropin, insulin-like growth factor-I, and placental lactogen in Holstein cows. J Dairy Sci 2007, 90, 3314–3325. [Google Scholar] [CrossRef] [PubMed]
- Kay, J.K.; Weber, W.J.; Moore, C.E.; Bauman, D.E.; Hansen, L.B.; Chester-Jones, H.; Crooker, B.A.; Baumgard, L.H. Effects of week of lactation and genetic selection for milk yield on milk fatty acid composition in Holstein cows. J Dairy Sci 2005, 88, 3886–3893. [Google Scholar] [CrossRef] [PubMed]
- Parodi, P.W. Milk fat in human nutrition. Aust J Dairy Technol 2004, 59, 3–59. [Google Scholar]
- Haug, A.; Hostmark, A.T.; Harstad, O.M. Bovine milk in human nutrition--a review. Lipids in health and disease 2007, 6, 25. [Google Scholar] [CrossRef]
- Jenkins, B.; West, J.A.; Koulman, A. A review of odd-chain fatty acid metabolism and the role of pentadecanoic Acid (c15:0) and heptadecanoic Acid (c17:0) in health and disease. Molecules (Basel, Switzerland) 2015, 20, 2425–2444. [Google Scholar] [CrossRef]
- Lindmark Månsson, H. Fatty acids in bovine milk fat. Food & Nutrition Research 2008, 52, 1821. [Google Scholar] [CrossRef]
- Bauman, D.E.; Harvatine, K.J.; Lock, A.L. Nutrigenomics, rumen-derived bioactive fatty acids, and the regulation of milk fat synthesis. Annual review of nutrition 2011, 31, 299–319. [Google Scholar] [CrossRef] [PubMed]
- Liu, Z.; Li, C.; Pryce, J.; Rochfort, S. Comprehensive Characterization of Bovine Milk Lipids: Triglycerides. ACS Omega 2020, 5, 12573–12582. [Google Scholar] [CrossRef]
- Pires, J.A.A.; Larsen, T.; Leroux, C. Milk metabolites and fatty acids as noninvasive biomarkers of metabolic status and energy balance in early-lactation cows. Journal of Dairy Science 2022, 105, 201–220. [Google Scholar] [CrossRef] [PubMed]
- Knutsen, T.M.; Olsen, H.G.; Ketto, I.A.; Sundsaasen, K.K.; Kohler, A.; Tafintseva, V.; Svendsen, M.; Kent, M.P.; Lien, S. Genetic variants associated with two major bovine milk fatty acids offer opportunities to breed for altered milk fat composition. Genetics, selection, evolution : GSE 2022, 54, 35. [Google Scholar] [CrossRef] [PubMed]
- Liu, Z.; Rochfort, S.; Cocks, B. Milk lipidomics: What we know and what we don't. Progress in lipid research 2018, 71, 70–85. [Google Scholar] [CrossRef]
- Yao, Y.; Zhao, G.; Xiang, J.; Zou, X.; Jin, Q.; Wang, X. Lipid composition and structural characteristics of bovine, caprine and human milk fat globules. International Dairy Journal 2016, 56, 64–73. [Google Scholar] [CrossRef]
- Tian, H.; Zheng, N.; Wang, W.; Cheng, J.; Li, S.; Zhang, Y.; Wang, J. Integrated Metabolomics Study of the Milk of Heat-stressed Lactating Dairy Cows. Scientific Reports 2016, 6, 24208. [Google Scholar] [CrossRef] [PubMed]
- National Research Council (U. S.). Subcommittee on Dairy Cattle Nutrition. Nutrient requirements of dairy cattle, 7th rev. ed.; National Academy Press: Washington, D.C, 2001. [Google Scholar]
- Carriquiry, M.; Weber, W.J.; Dahlen, C.R.; Lamb, G.C.; Baumgard, L.H.; Crooker, B.A. Production response of multiparous Holstein cows treated with bovine somatotropin and fed diets enriched with n-3 or n-6 fatty acids<sup>1</sup>. Journal of Dairy Science 2009, 92, 4852–4864. [Google Scholar] [CrossRef]
- Wang, L.; Urriola, P.E.; Luo, Z.H.; Rambo, Z.J.; Wilson, M.E.; Torrison, J.L.; Shurson, G.C.; Chen, C. Metabolomics revealed diurnal heat stress and zinc supplementation-induced changes in amino acid, lipid, and microbial metabolism. Physiological reports 2016, 4. [Google Scholar] [CrossRef] [PubMed]
- Li, X.; Franke, A.A. Improved LC-MS method for the determination of fatty acids in red blood cells by LC-orbitrap MS. Analytical chemistry 2011, 83, 3192–3198. [Google Scholar] [CrossRef]
- Lu, Y.W.; Yao, D.; Chen, C. 2-Hydrazinoquinoline as a novel derivatization agent for LC-MS-Based metabolomic investigation of streptozotocin-elicited ketoacidosis. Faseb J 2013, 27. [Google Scholar] [CrossRef]
- Katajamaa, M.; Miettinen, J.; Orešič, M. MZmine: toolbox for processing and visualization of mass spectrometry based molecular profile data. Bioinformatics 2006, 22, 634–636. [Google Scholar] [CrossRef] [PubMed]
- Baumgard, L.H.; Collier, R.J.; Bauman, D.E. A 100-Year Review: Regulation of nutrient partitioning to support lactation. J Dairy Sci 2017, 100, 10353–10366. [Google Scholar] [CrossRef] [PubMed]
- Rebouche, C.J.; Seim, H. Carnitine metabolism and its regulation in microorganisms and mammals. Annual review of nutrition 1998, 18, 39–61. [Google Scholar] [CrossRef] [PubMed]
- Vaz, F.M.; Wanders, R.J. Carnitine biosynthesis in mammals. The Biochemical journal 2002, 361, 417–429. [Google Scholar] [CrossRef] [PubMed]
- Snoswell, A.M.; Linzell, J.L. Carnitine secretion into milk of ruminants. Journal of Dairy Research 1975, 42, 371–380. [Google Scholar] [CrossRef]
- Erfle, J.D.; Fisher, L.J.; Sauer, F. Carnitine and Acetylcarnitine in the Milk of Normal and Ketotic Cows1. Journal of Dairy Science 1970, 53, 486–489. [Google Scholar] [CrossRef]
- Penn, D.; Dolderer, M.; Schmidt-Sommerfeld, E. Carnitine concentrations in the milk of different species and infant formulas. Biology of the neonate 1987, 52, 70–79. [Google Scholar] [CrossRef]
- Schlegel, G.; Keller, J.; Hirche, F.; Geissler, S.; Schwarz, F.J.; Ringseis, R.; Stangl, G.I.; Eder, K. Expression of genes involved in hepatic carnitine synthesis and uptake in dairy cows in the transition period and at different stages of lactation. BMC veterinary research 2012, 8, 28. [Google Scholar] [CrossRef] [PubMed]
- Carlson, D.B.; McFadden, J.W.; D'Angelo, A.; Woodworth, J.C.; Drackley, J.K. Dietary L-carnitine affects periparturient nutrient metabolism and lactation in multiparous cows. J Dairy Sci 2007, 90, 3422–3441. [Google Scholar] [CrossRef] [PubMed]
Figure 1.
Yields and macronutrient contents of UH and CH milk in the first 9 week of lactation. UH and CH cows (n=12/genotype) were fed the same diets throughout the study. A. Milk yield. B. Total protein content. C. Lactose content. D. Total fat content. The symbols of #, ∗, ^, and ##, ∗∗, ^^ indicate 0.01<P≤ 0.05 and P ≤ 0.01 for statistical difference by genotype, time (week), and genotype-time interaction, respectively.
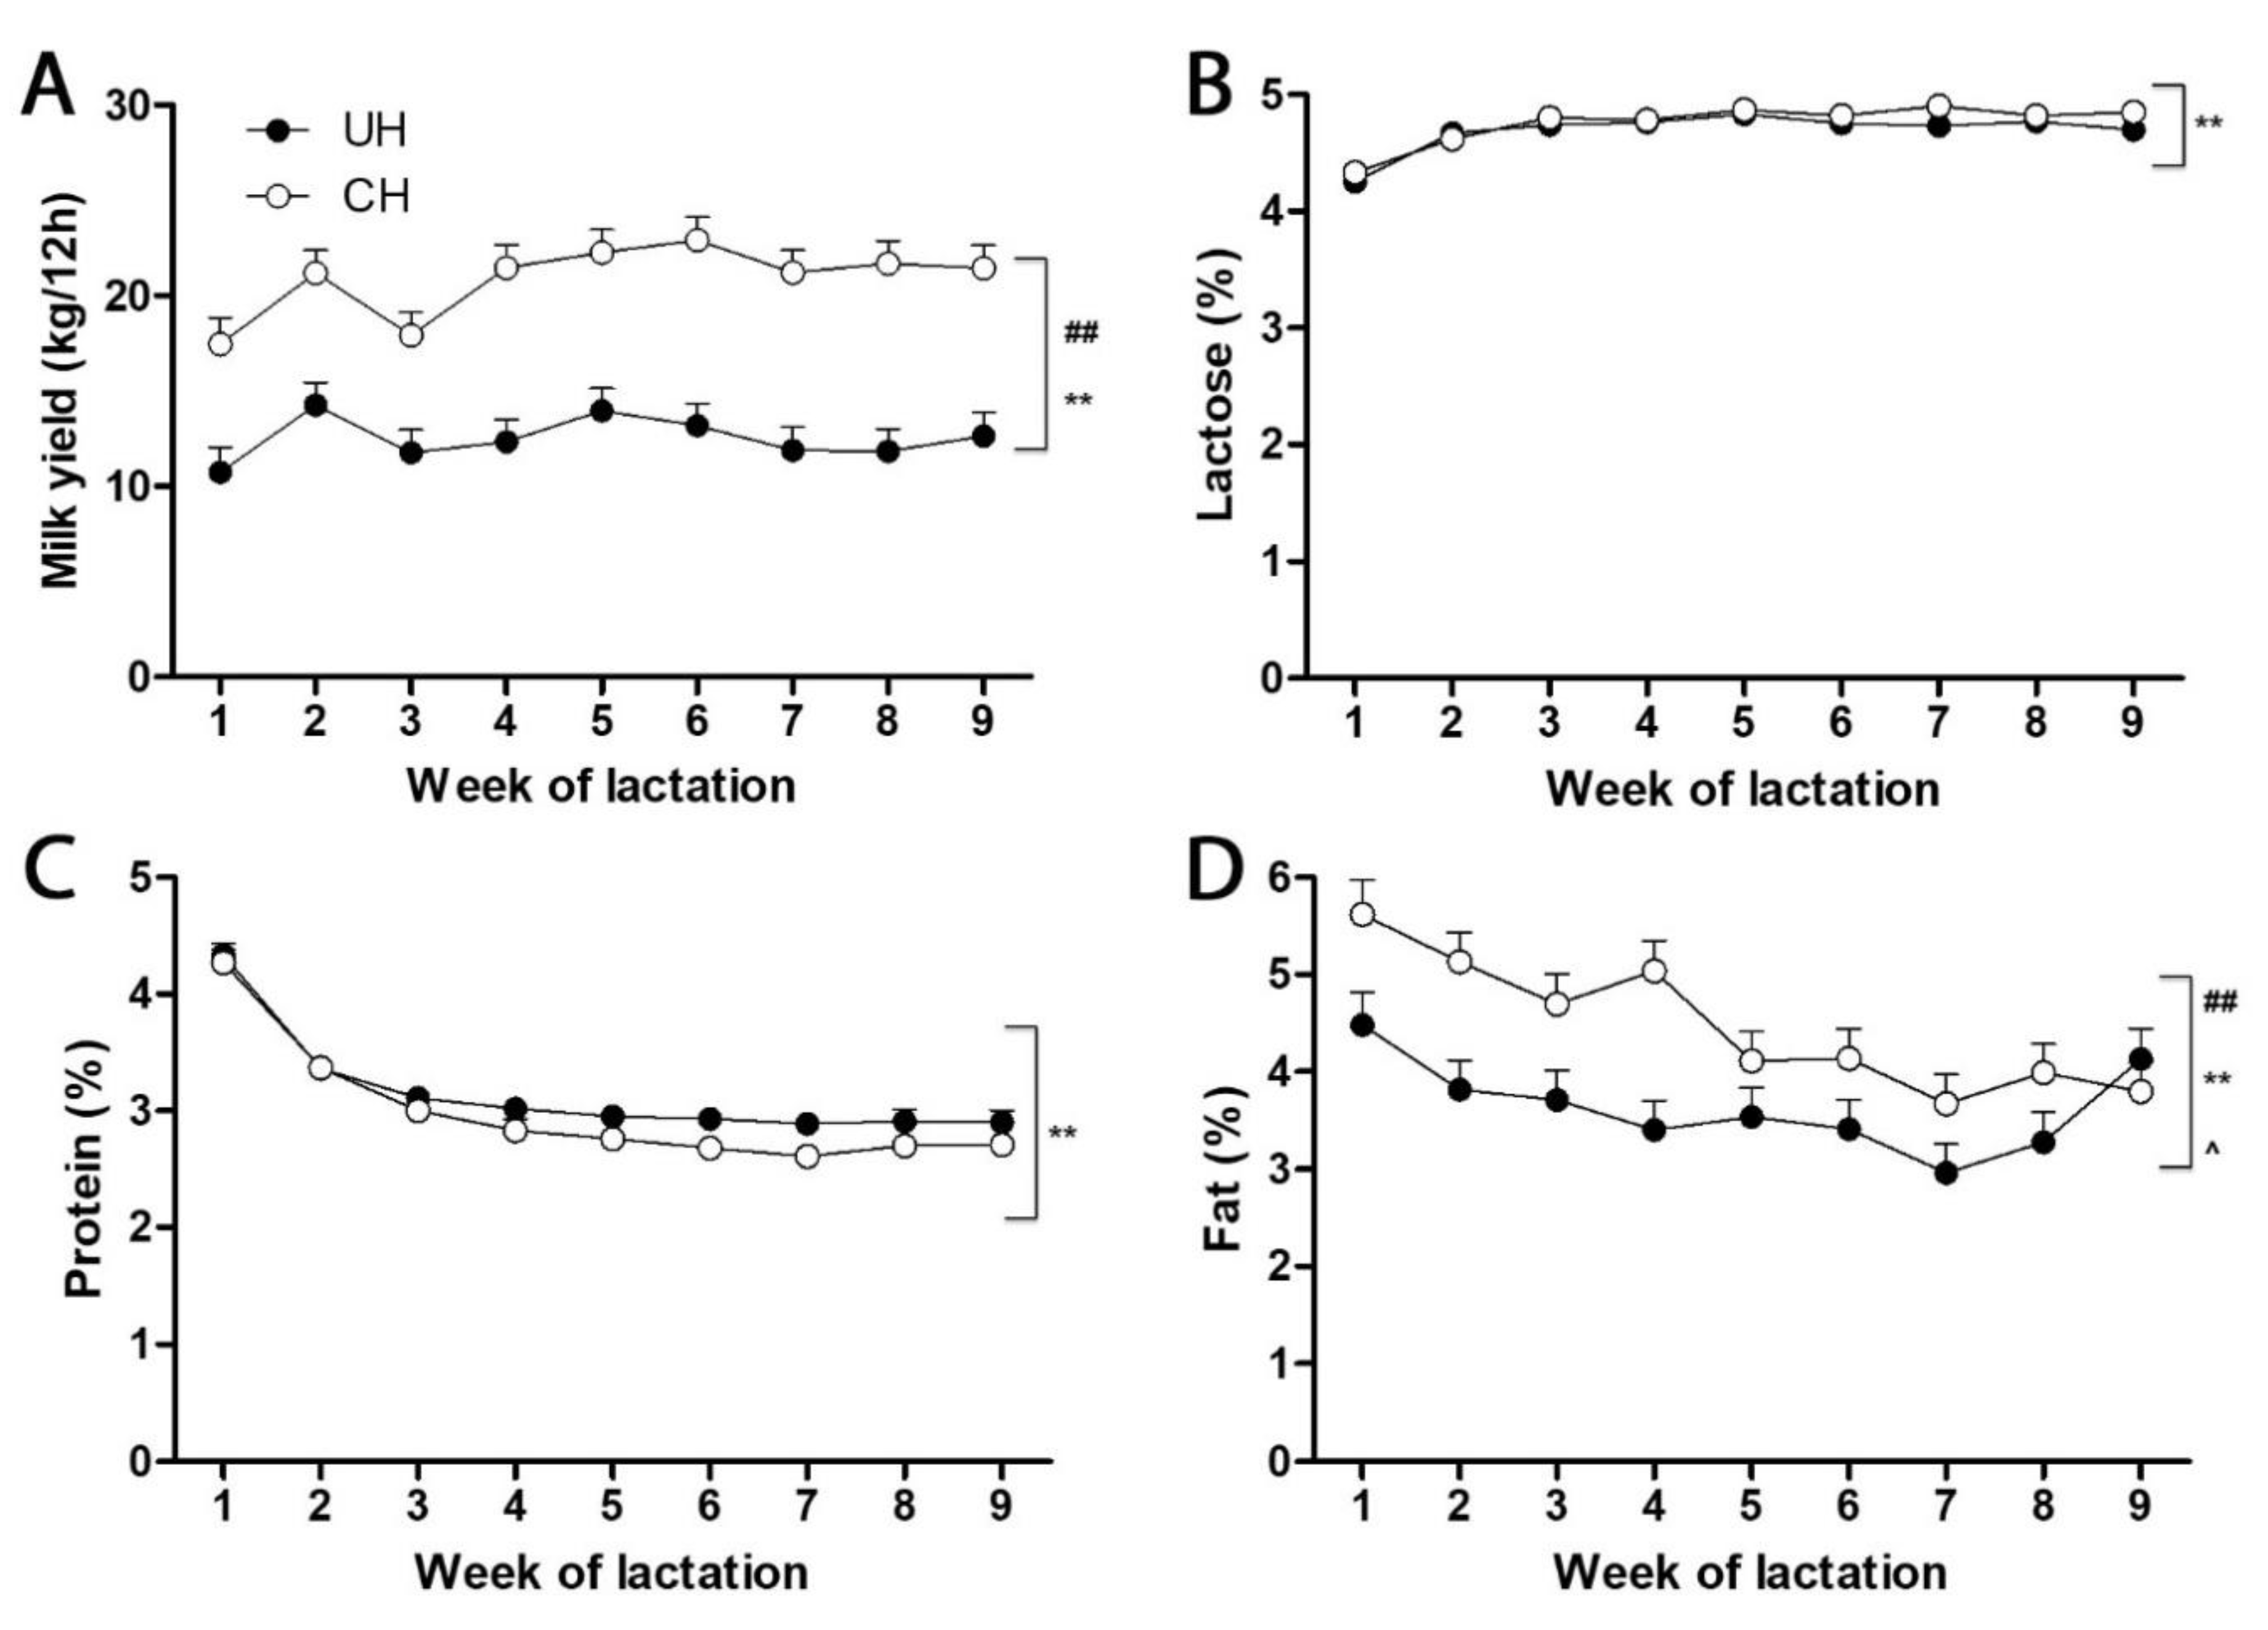
Figure 2.
Annotations of major TAG species of cow milk in a representative 2-D plot of the milk lipidome. The data from high-resolution LC-MS analysis of milk lipids were deconvoluted to a 2-D plot, in which individual milk lipids are visualized by their retention time in LC run (x-axis), mass over charge ratio (m/z) values (y-axis), and signal intensities (darkness). Major milk TAGs, detected in the forms of ammonium and sodium adducts, are labeled (T1, etc.) under their bands in the plot. Identities of these TAGs are summarized in Table 1. The TAG markers that are positively correlated with CH or UH are labeled red or green, respectively. Fatty acid moieties in individual TAGs were determined by MSMS fragmentation, as illustrated by the fragmentogram of T12 (the insert).
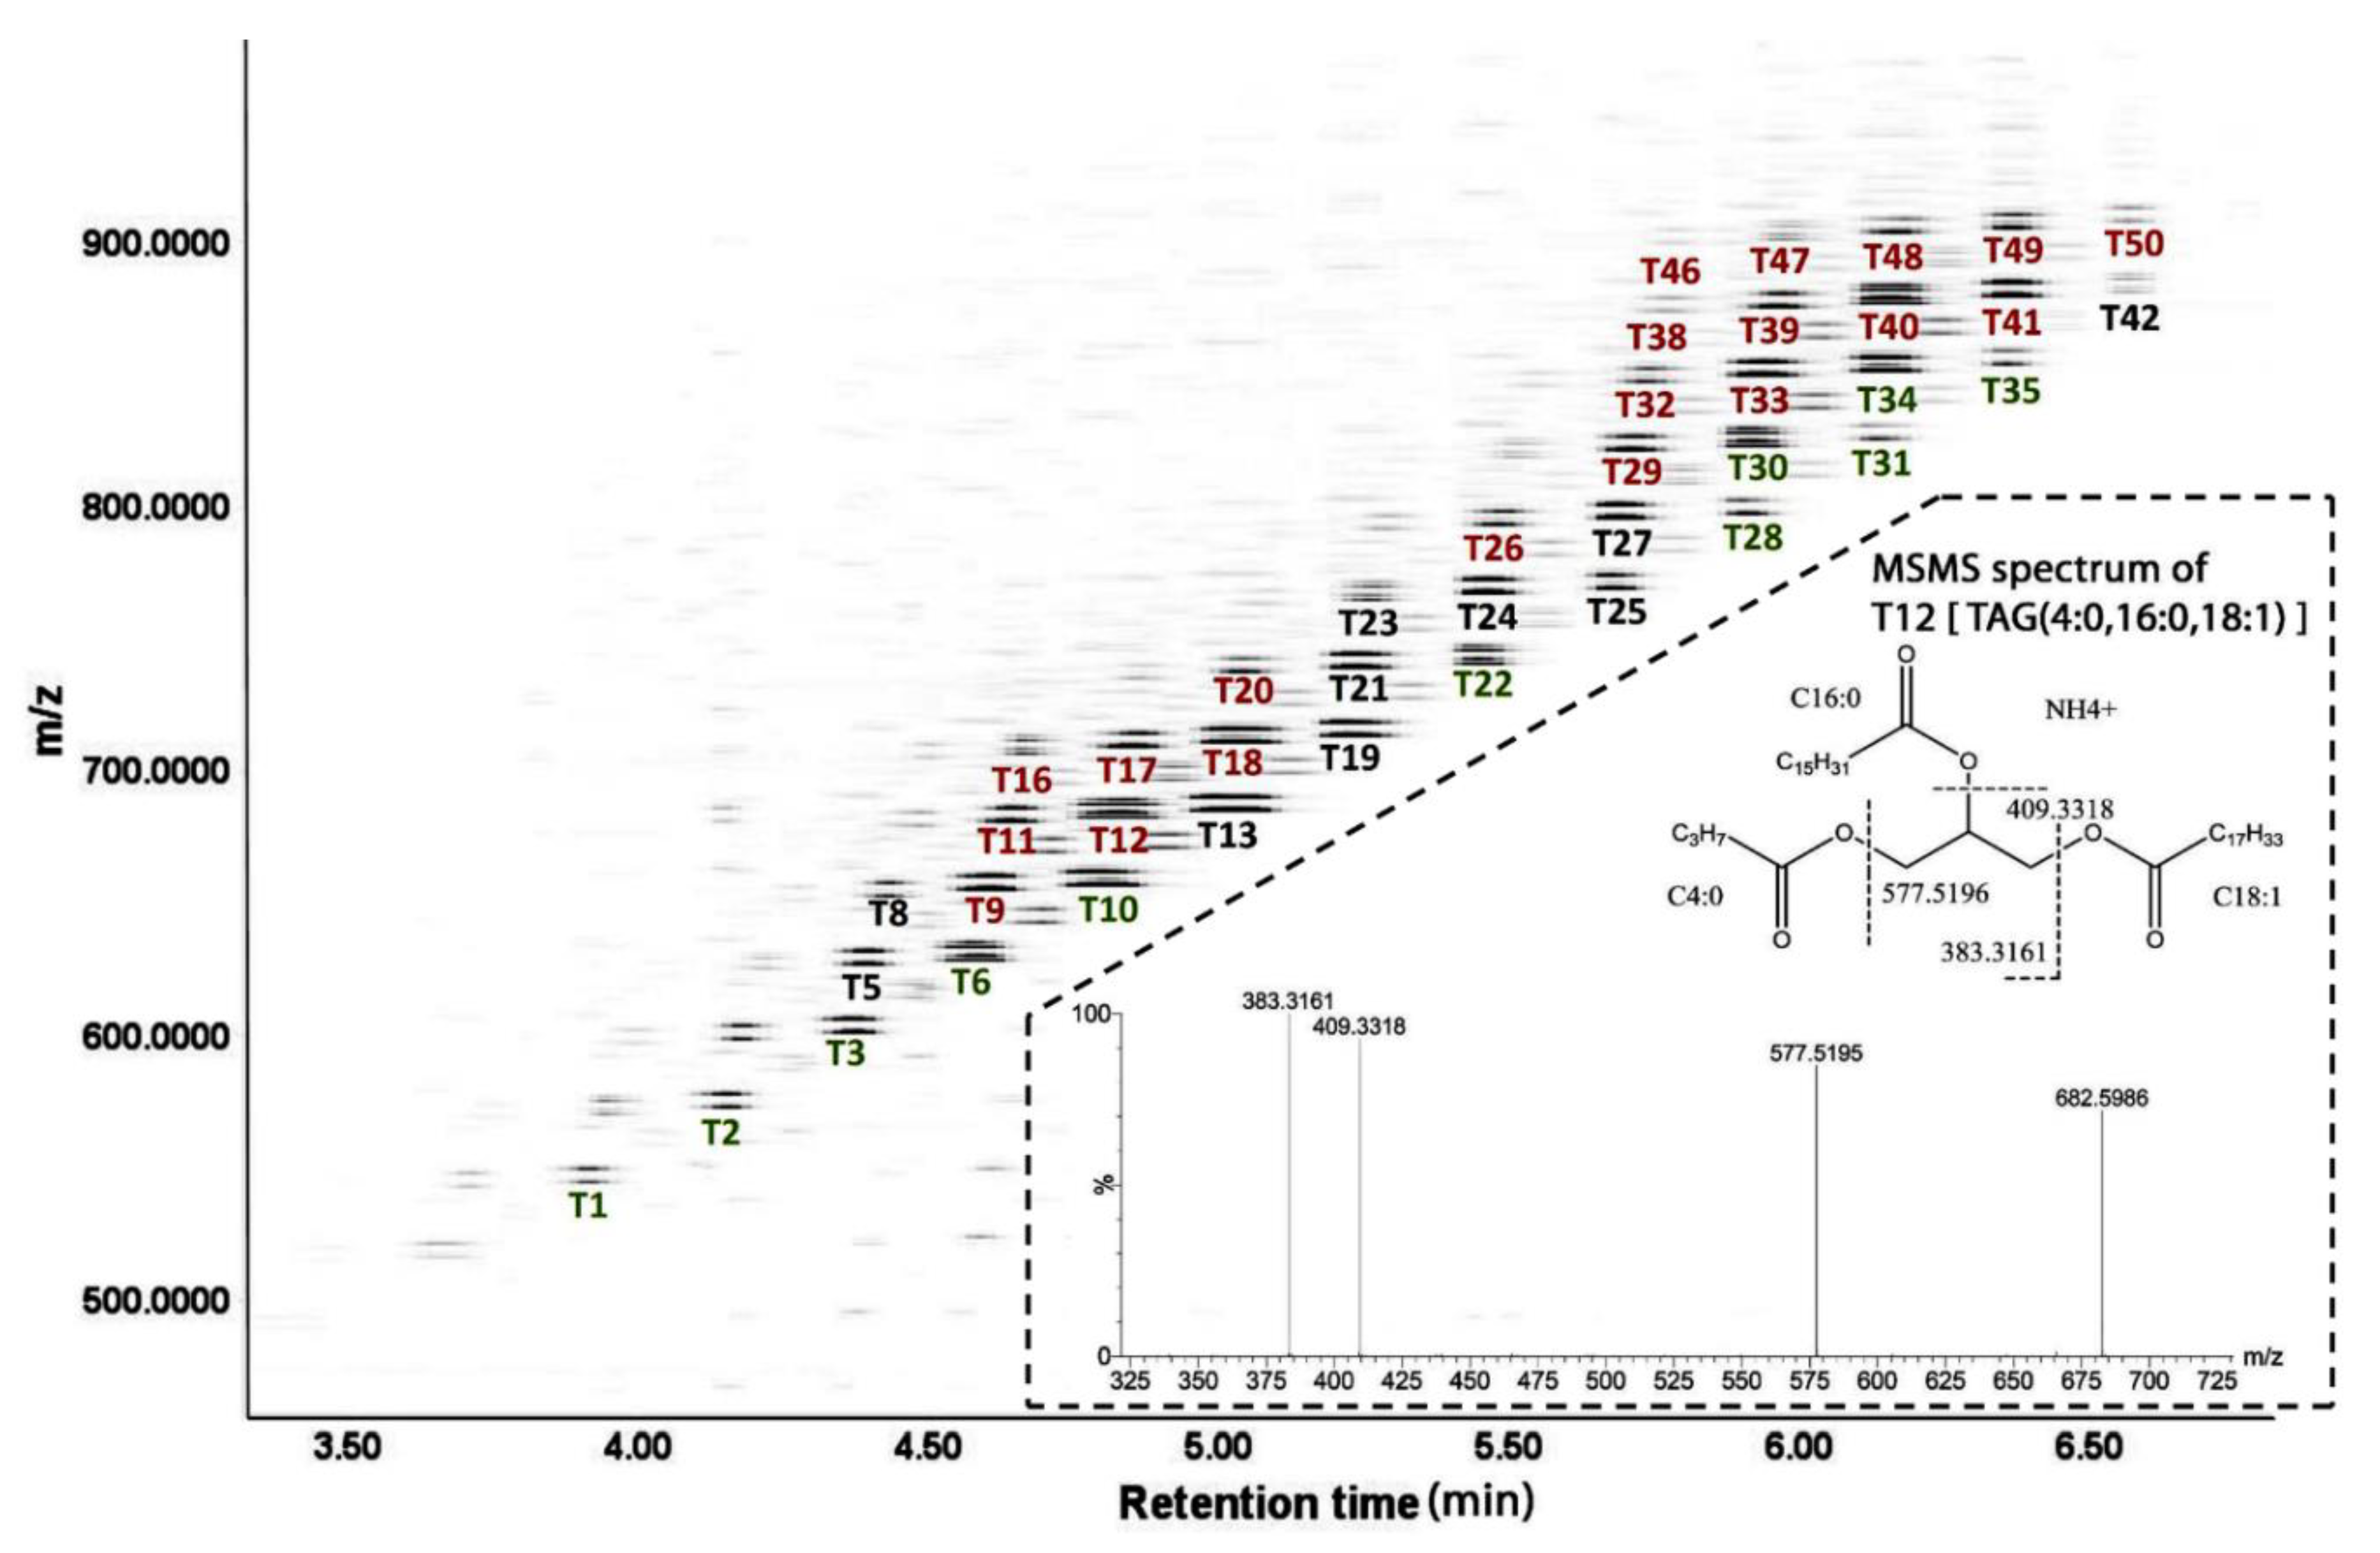
Figure 3.
Effects of genetic selection and week of lactation on TAG composition in CH and UH milk. Lipid profiles of CH and UH milk in the first 9 weeks of lactation were compared by the LC-MS analysis and multivariate modeling. The relative abundances of individual TAGs in milk are expressed as the ratios between their ion counts and the total ion counts of milk samples recorded by the MS detector. A. The score plot of a PCA model on TAGs in CH and UH milk samples in the first 9 weeks of lactation. The t[1] and t[2] values represent the weekly scores for CH or UH samples in the principal components 1 and 2 of the model, respectively. Each data point is the mean of 12 milk samples from UH or CH cows. The number beside each data point indicates the week of lactation. B. The loadings S-plot of an OPLS-DA model comparing UH and CH samples. The TAG markers highly associated with UH or CH are labeled (T1, etc.) and identified in Table 1. C-E. Representative TAGs with higher relative abundances in UH: T3, T6, and T10. F-H. Representative TAGs with higher relative abundances in CH: T33, T39, and T47. The symbols of #, ∗, ^, and ##, ∗∗, ^^ indicate 0.01<P≤ 0.05 and P ≤ 0.01 for statistical difference by genotype, time (week), and genotype-time interaction, respectively.
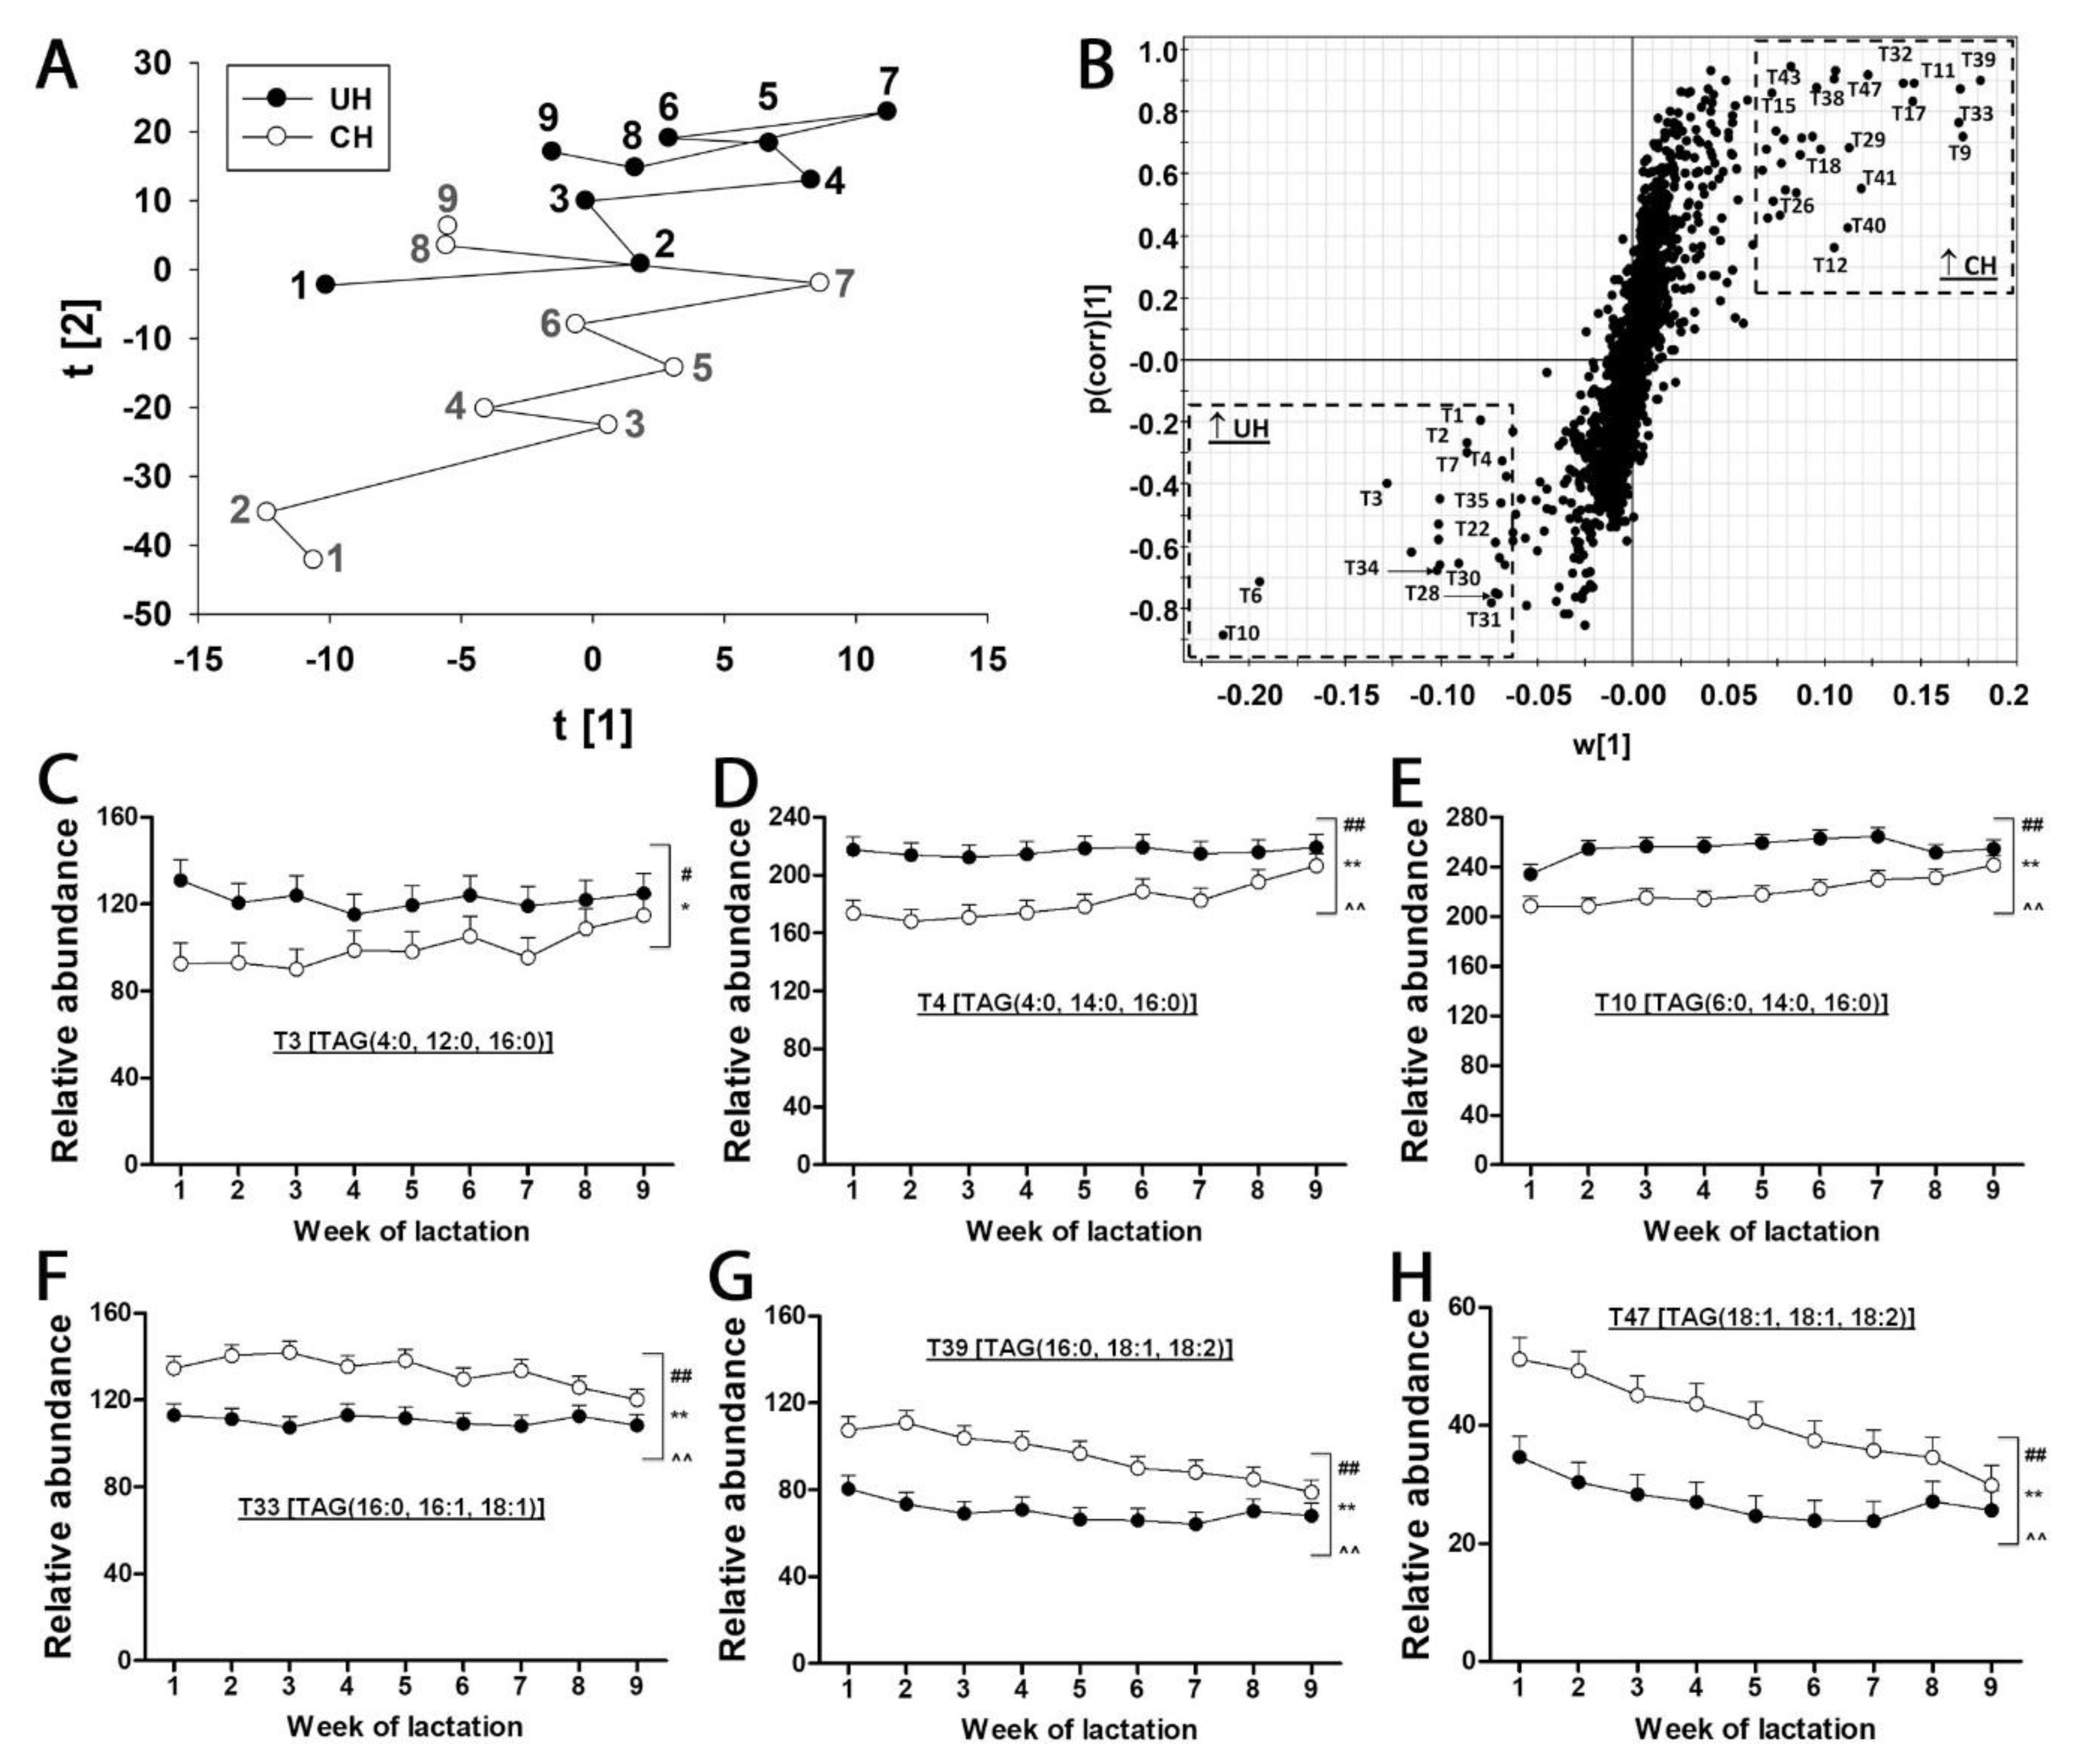
Figure 4.
Effect of genetic selection and week of lactation on fatty acid composition in CH and UH milk. Effects of genetic selection and week of lactation on fatty acid composition of CH and UH milk. After acid hydrolysis, fatty acids in milk were derivatized by HQ to facilitate their detection in LC-MS analysis. A. Representative MSMS fragmentogram of myristic acid-HQ derivative. Myristic acid-HQ derivative was formed by the reaction between myristic acid and HQ, and its structure was determined by the MSMS fragmentation. B. Representative chromatograph of major milk fatty acids. The scale of y-axis in the inserted chromatograph for low-abundance fatty acids is 2.5% of the scale for the chromatograph of the C4-C18 fatty acids. C. Average concentrations of individual C4:0-C18:2 fatty acids in all UH and CH milk collected from the first 9 weeks of lactation. D. Average concentrations of individual C18:3-C22:6 fatty acids in all UH and CH milk collected from the first 9 weeks of lactation. E. The ratio of total preformed fatty acids (C17-C22) versus total de novo fatty acids (C4-C14). F. The ratio of total saturated FAs versus total unsaturated FAs. The symbols of #, ∗, ^, and ##, ∗∗, ^^ indicate 0.01<P≤ 0.05 and P ≤ 0.01 for statistical difference by genotype, time (week), and genotype-time interaction, respectively.
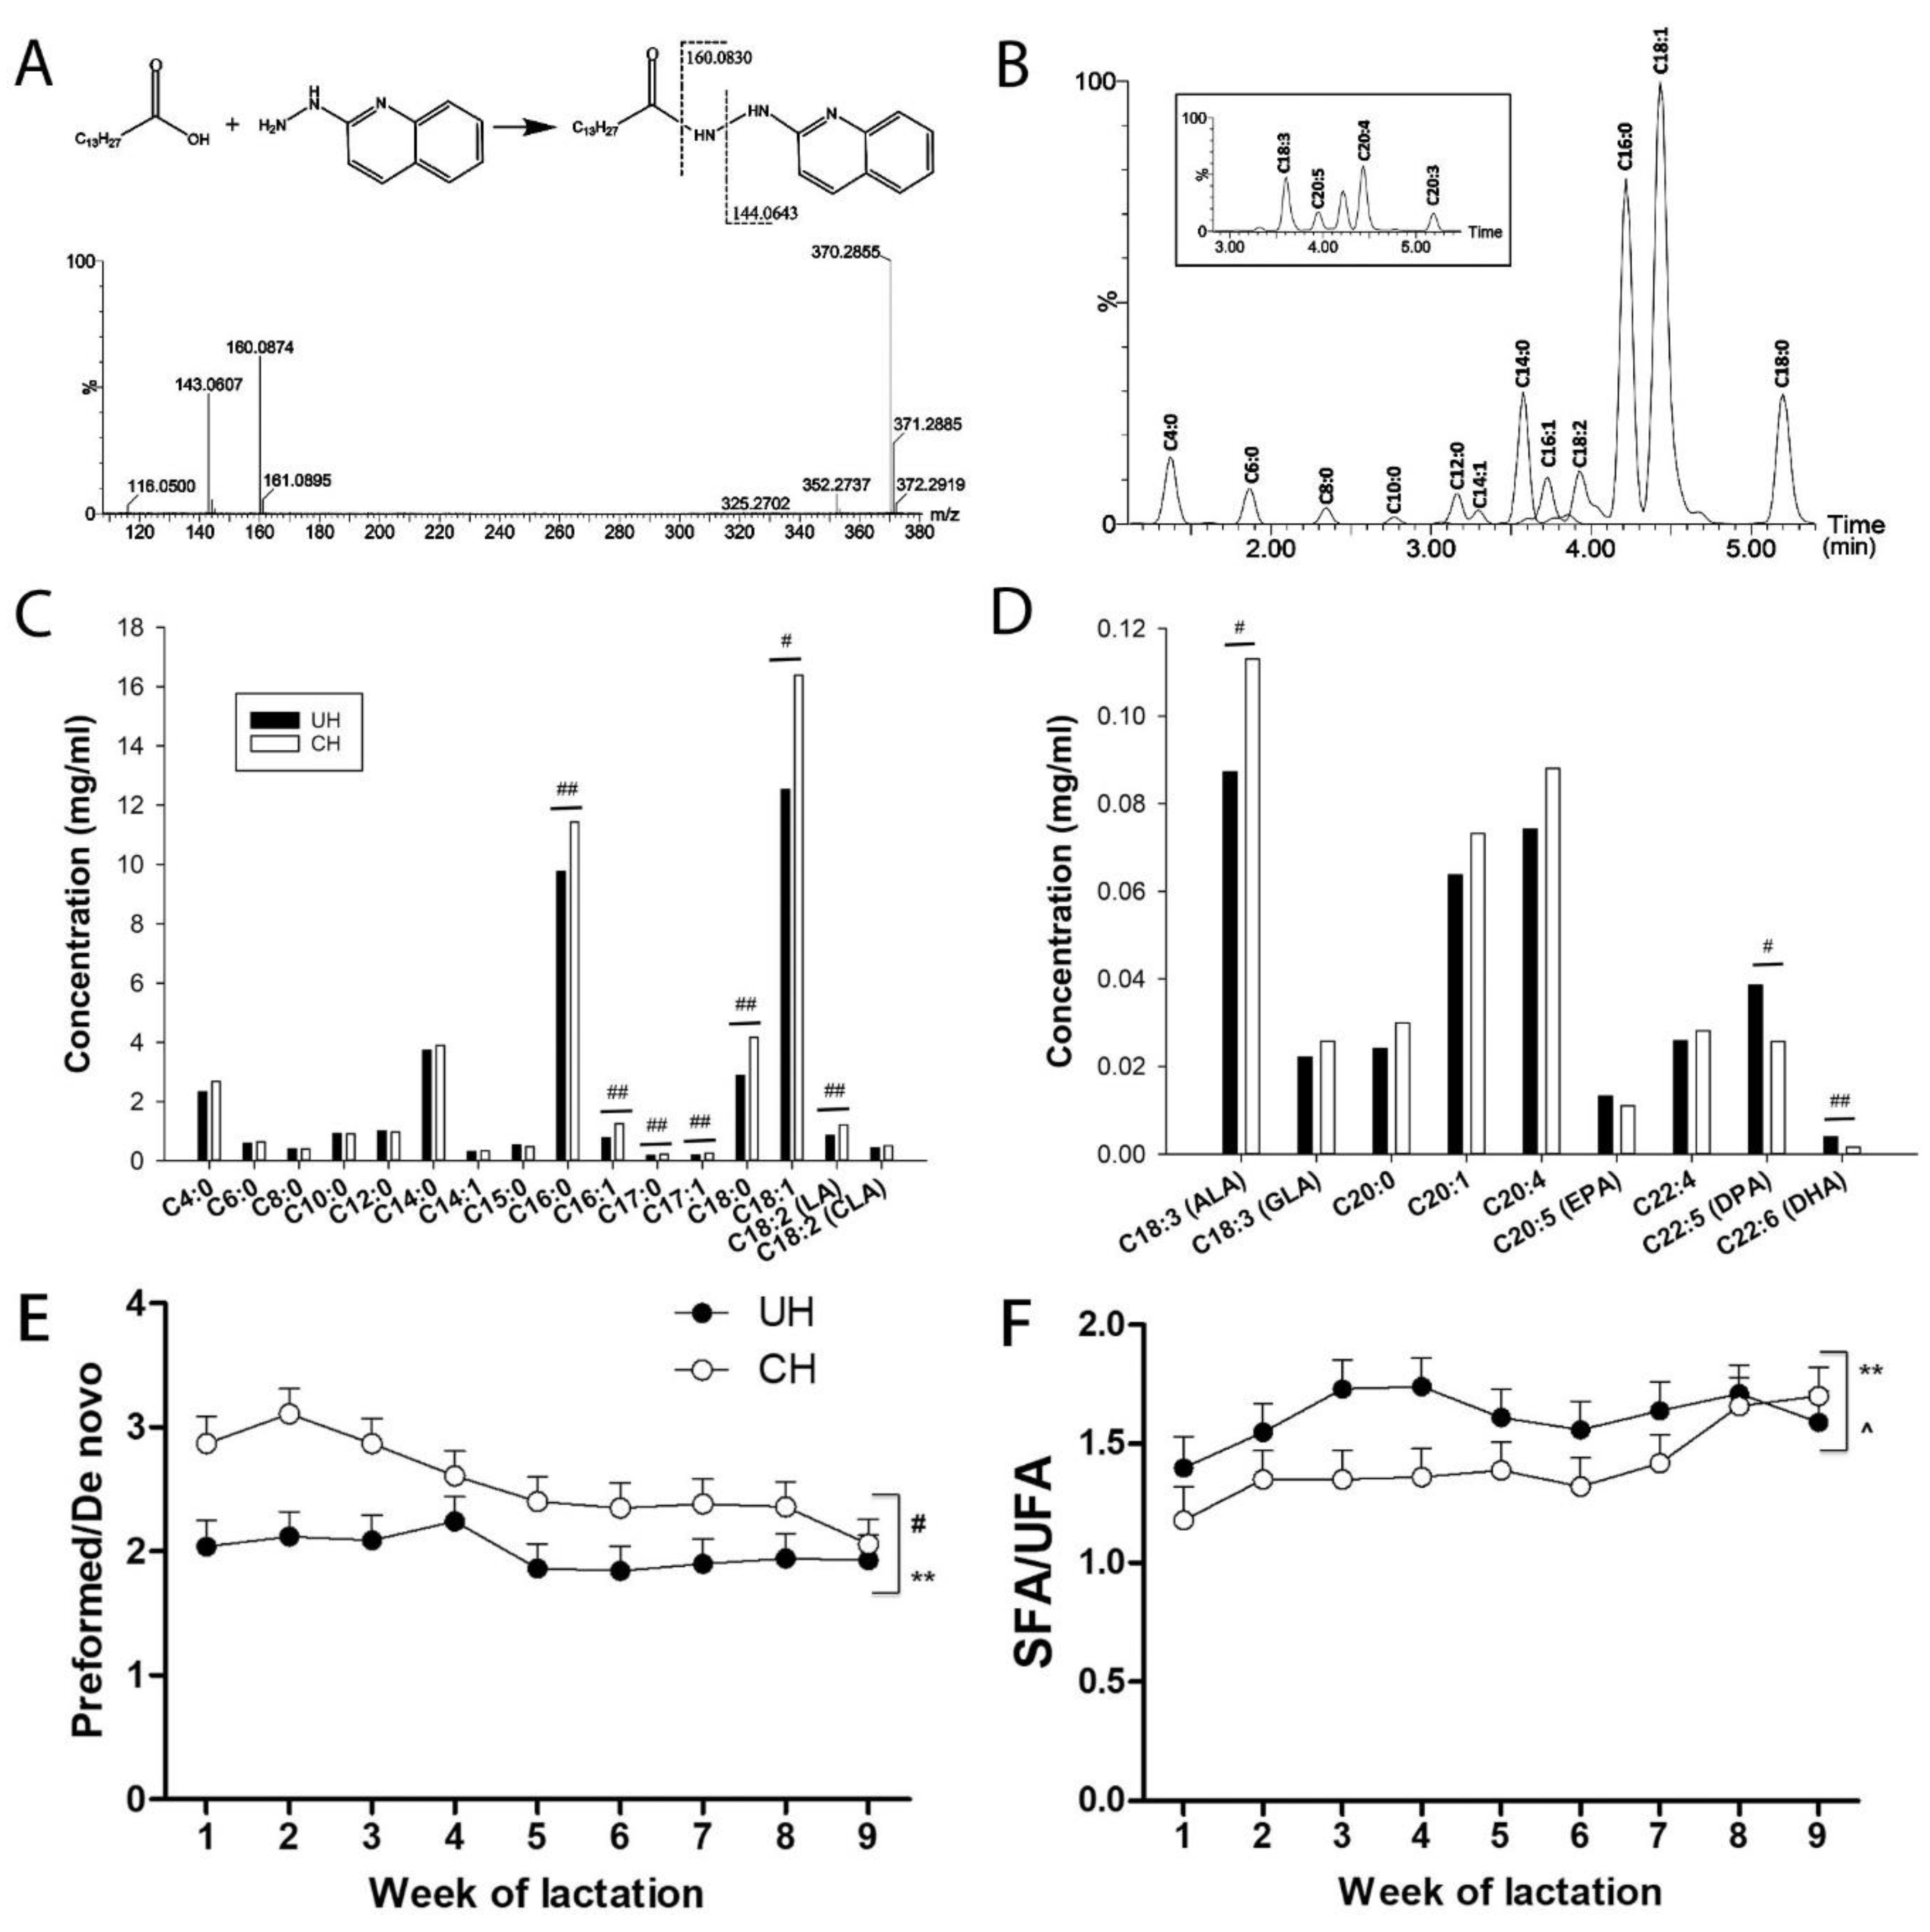
Figure 5.
Effect of genetic selection and week of lactation on short-chain carboxylic acid composition in CH and UH milk. Short-chain carboxylic acid profiles in CH and UH milk in the first 9 weeks of lactation were compared by the LC-MS analysis and multivariate modeling. Concentrations of short-chain carboxylic acid markers in CH and UH milk were quantified. A. The score plot of a PCA model on short-chain carboxylic acids in CH and UH milk samples in the first 9 weeks of lactation. The t[1] and t[2] values represent the scores of CH or UH sample in the principal components 1 and 2 of the model, respectively. Each data point is the mean of 12 milk samples from UH or CH cows. The number beside each data point is the week of lactation. B. The loading S-plot of short-chain carboxylic acids detected by LC-MS analysis. The identified short-chain carboxylic acid markers in UH or milk CH are labeled. C-H. Weekly concentration profiles of 3-Hydroxybutyric acid, Carnitine, Acetylcarnitine, Propionylcarnitine, Isobutylcarnitine and Isovalerylcarnitine, respectively. The symbols of #, ∗, ^, and ##, ∗∗, ^^ indicate 0.01<P≤ 0.05 and P ≤ 0.01 for statistical difference by genotype, time (week), and genotype-time interaction, respectively.
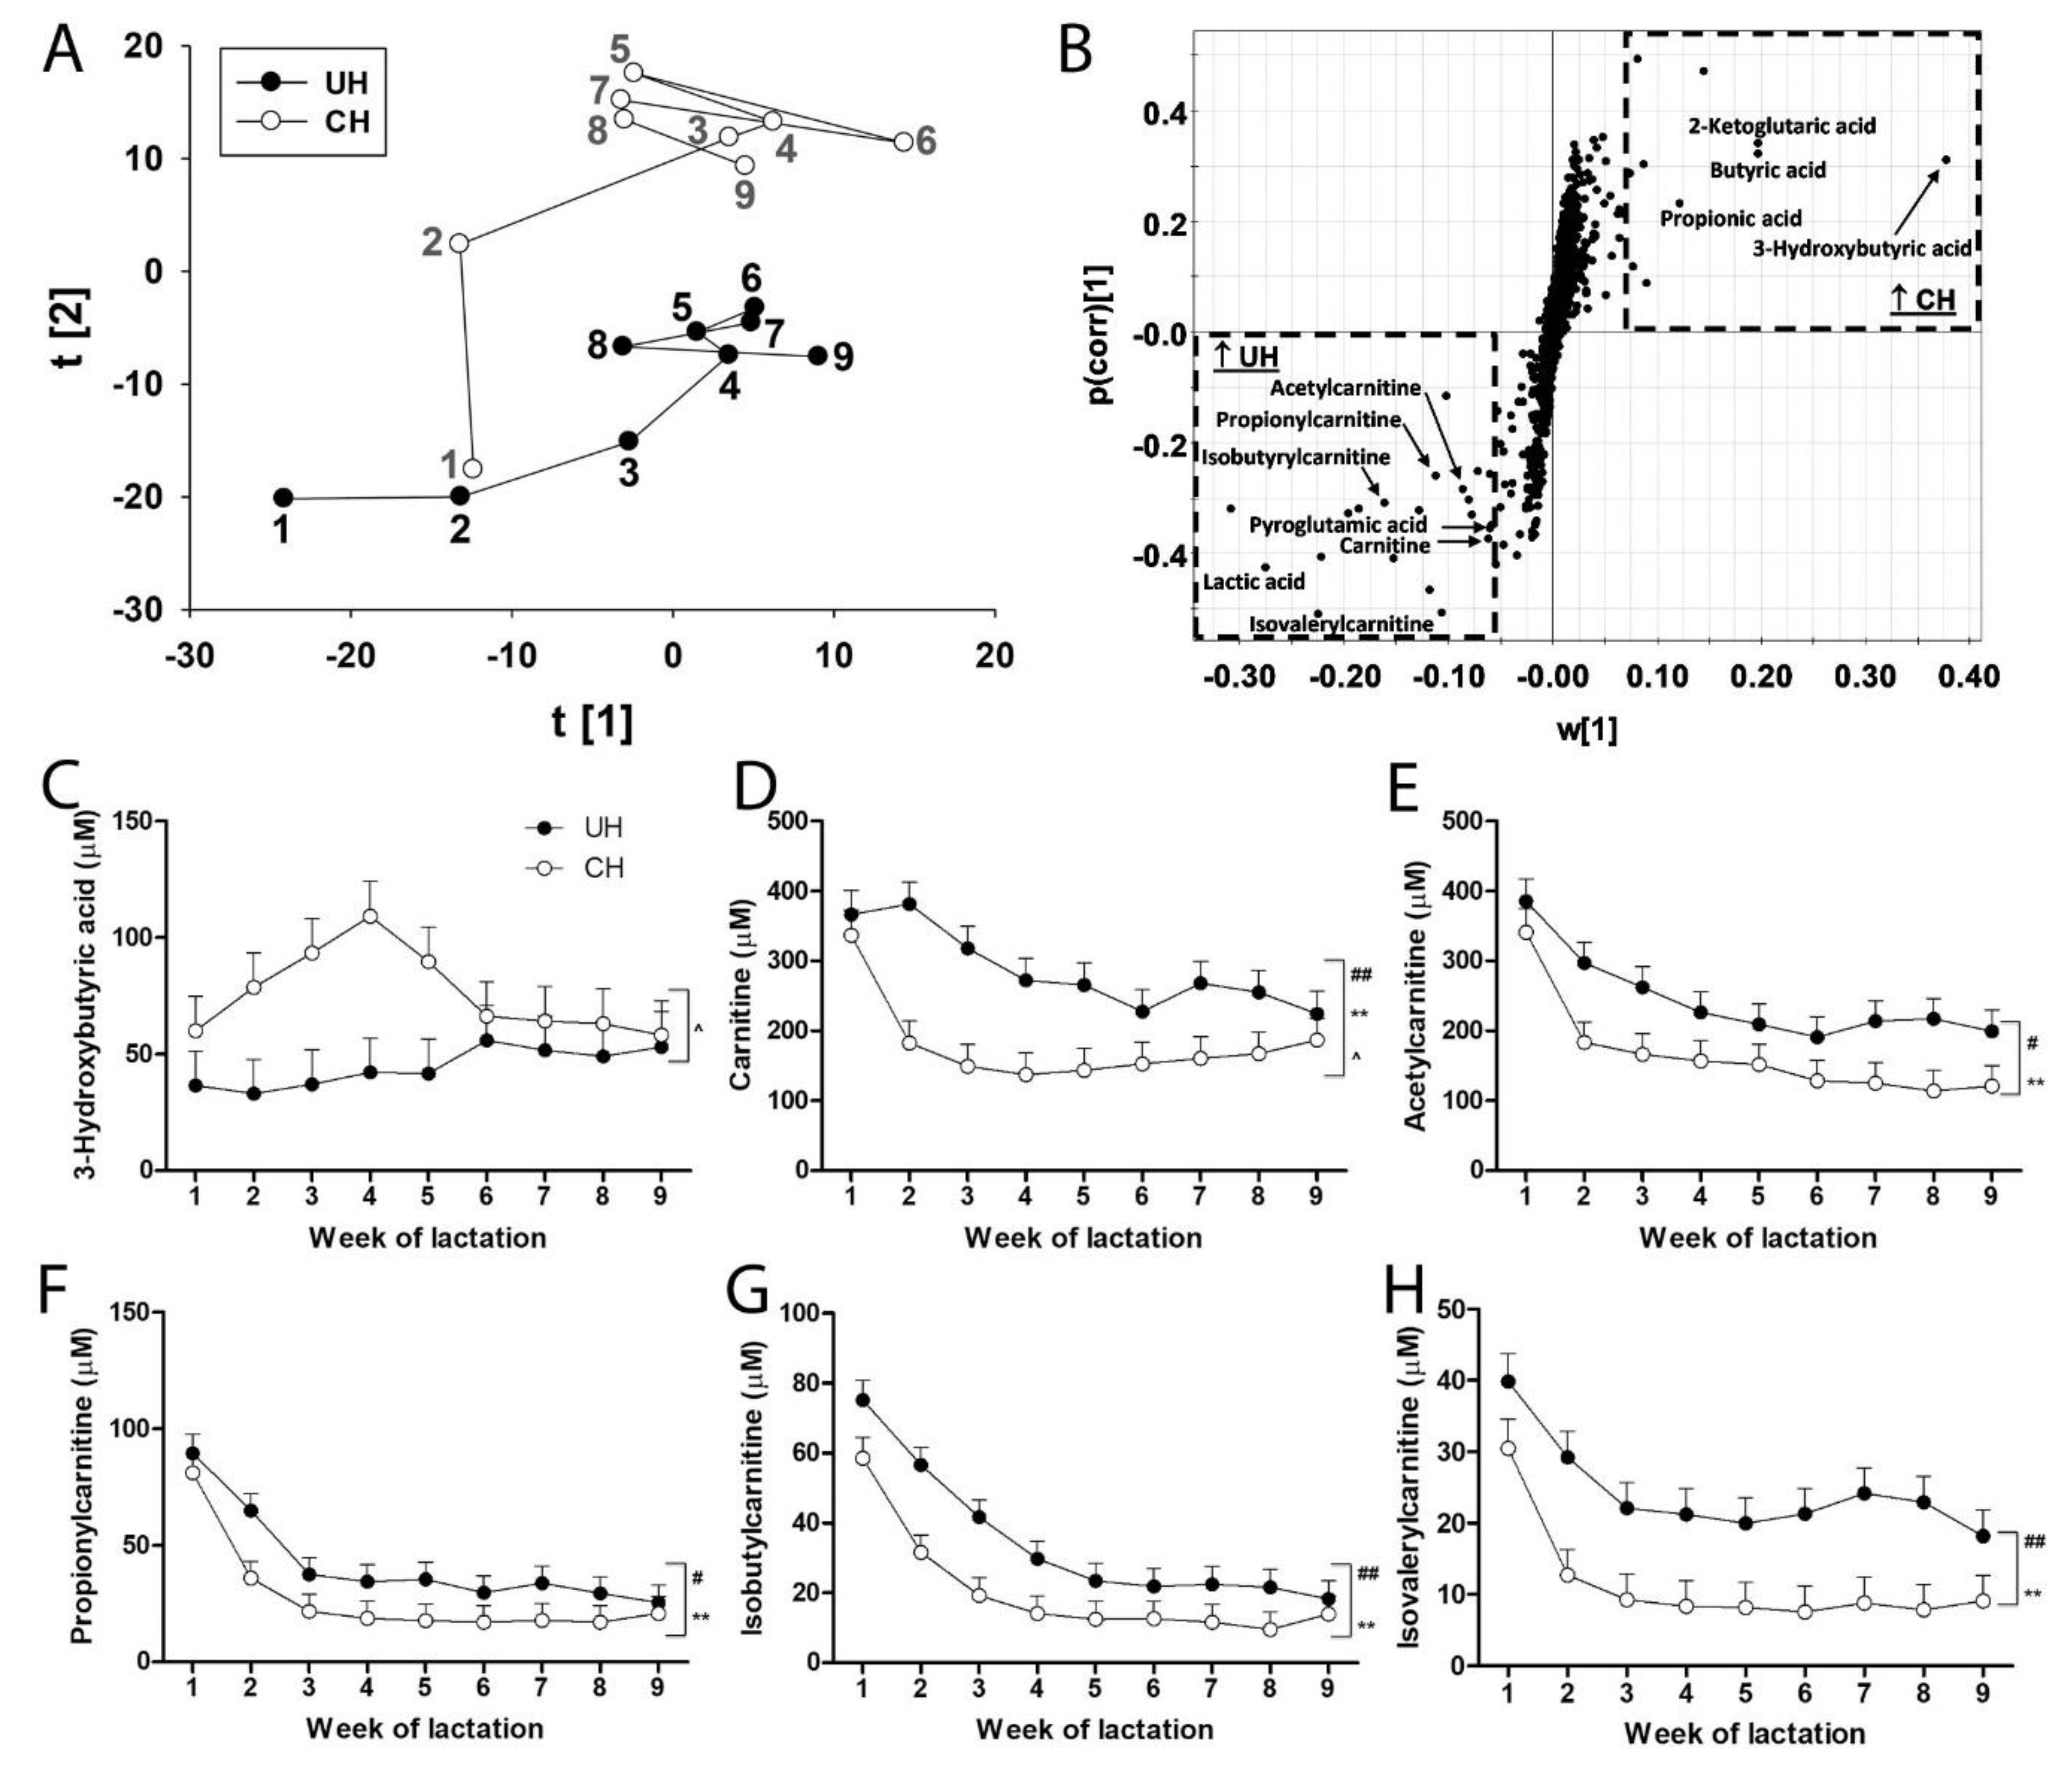
Figure 6.
Heat map of TAGs, FAs and short-chain carboxylic acids in UH and CH milk. Lipid metabolites are grouped by hierarchical clustering analysis. The relative abundances of TAGs and the concentrations of fatty acids and short-chain carboxylic acids in UH and CH milk collected from the first 9 weeks of lactation were compared by its Z scores and are presented according to inlaid color keys.
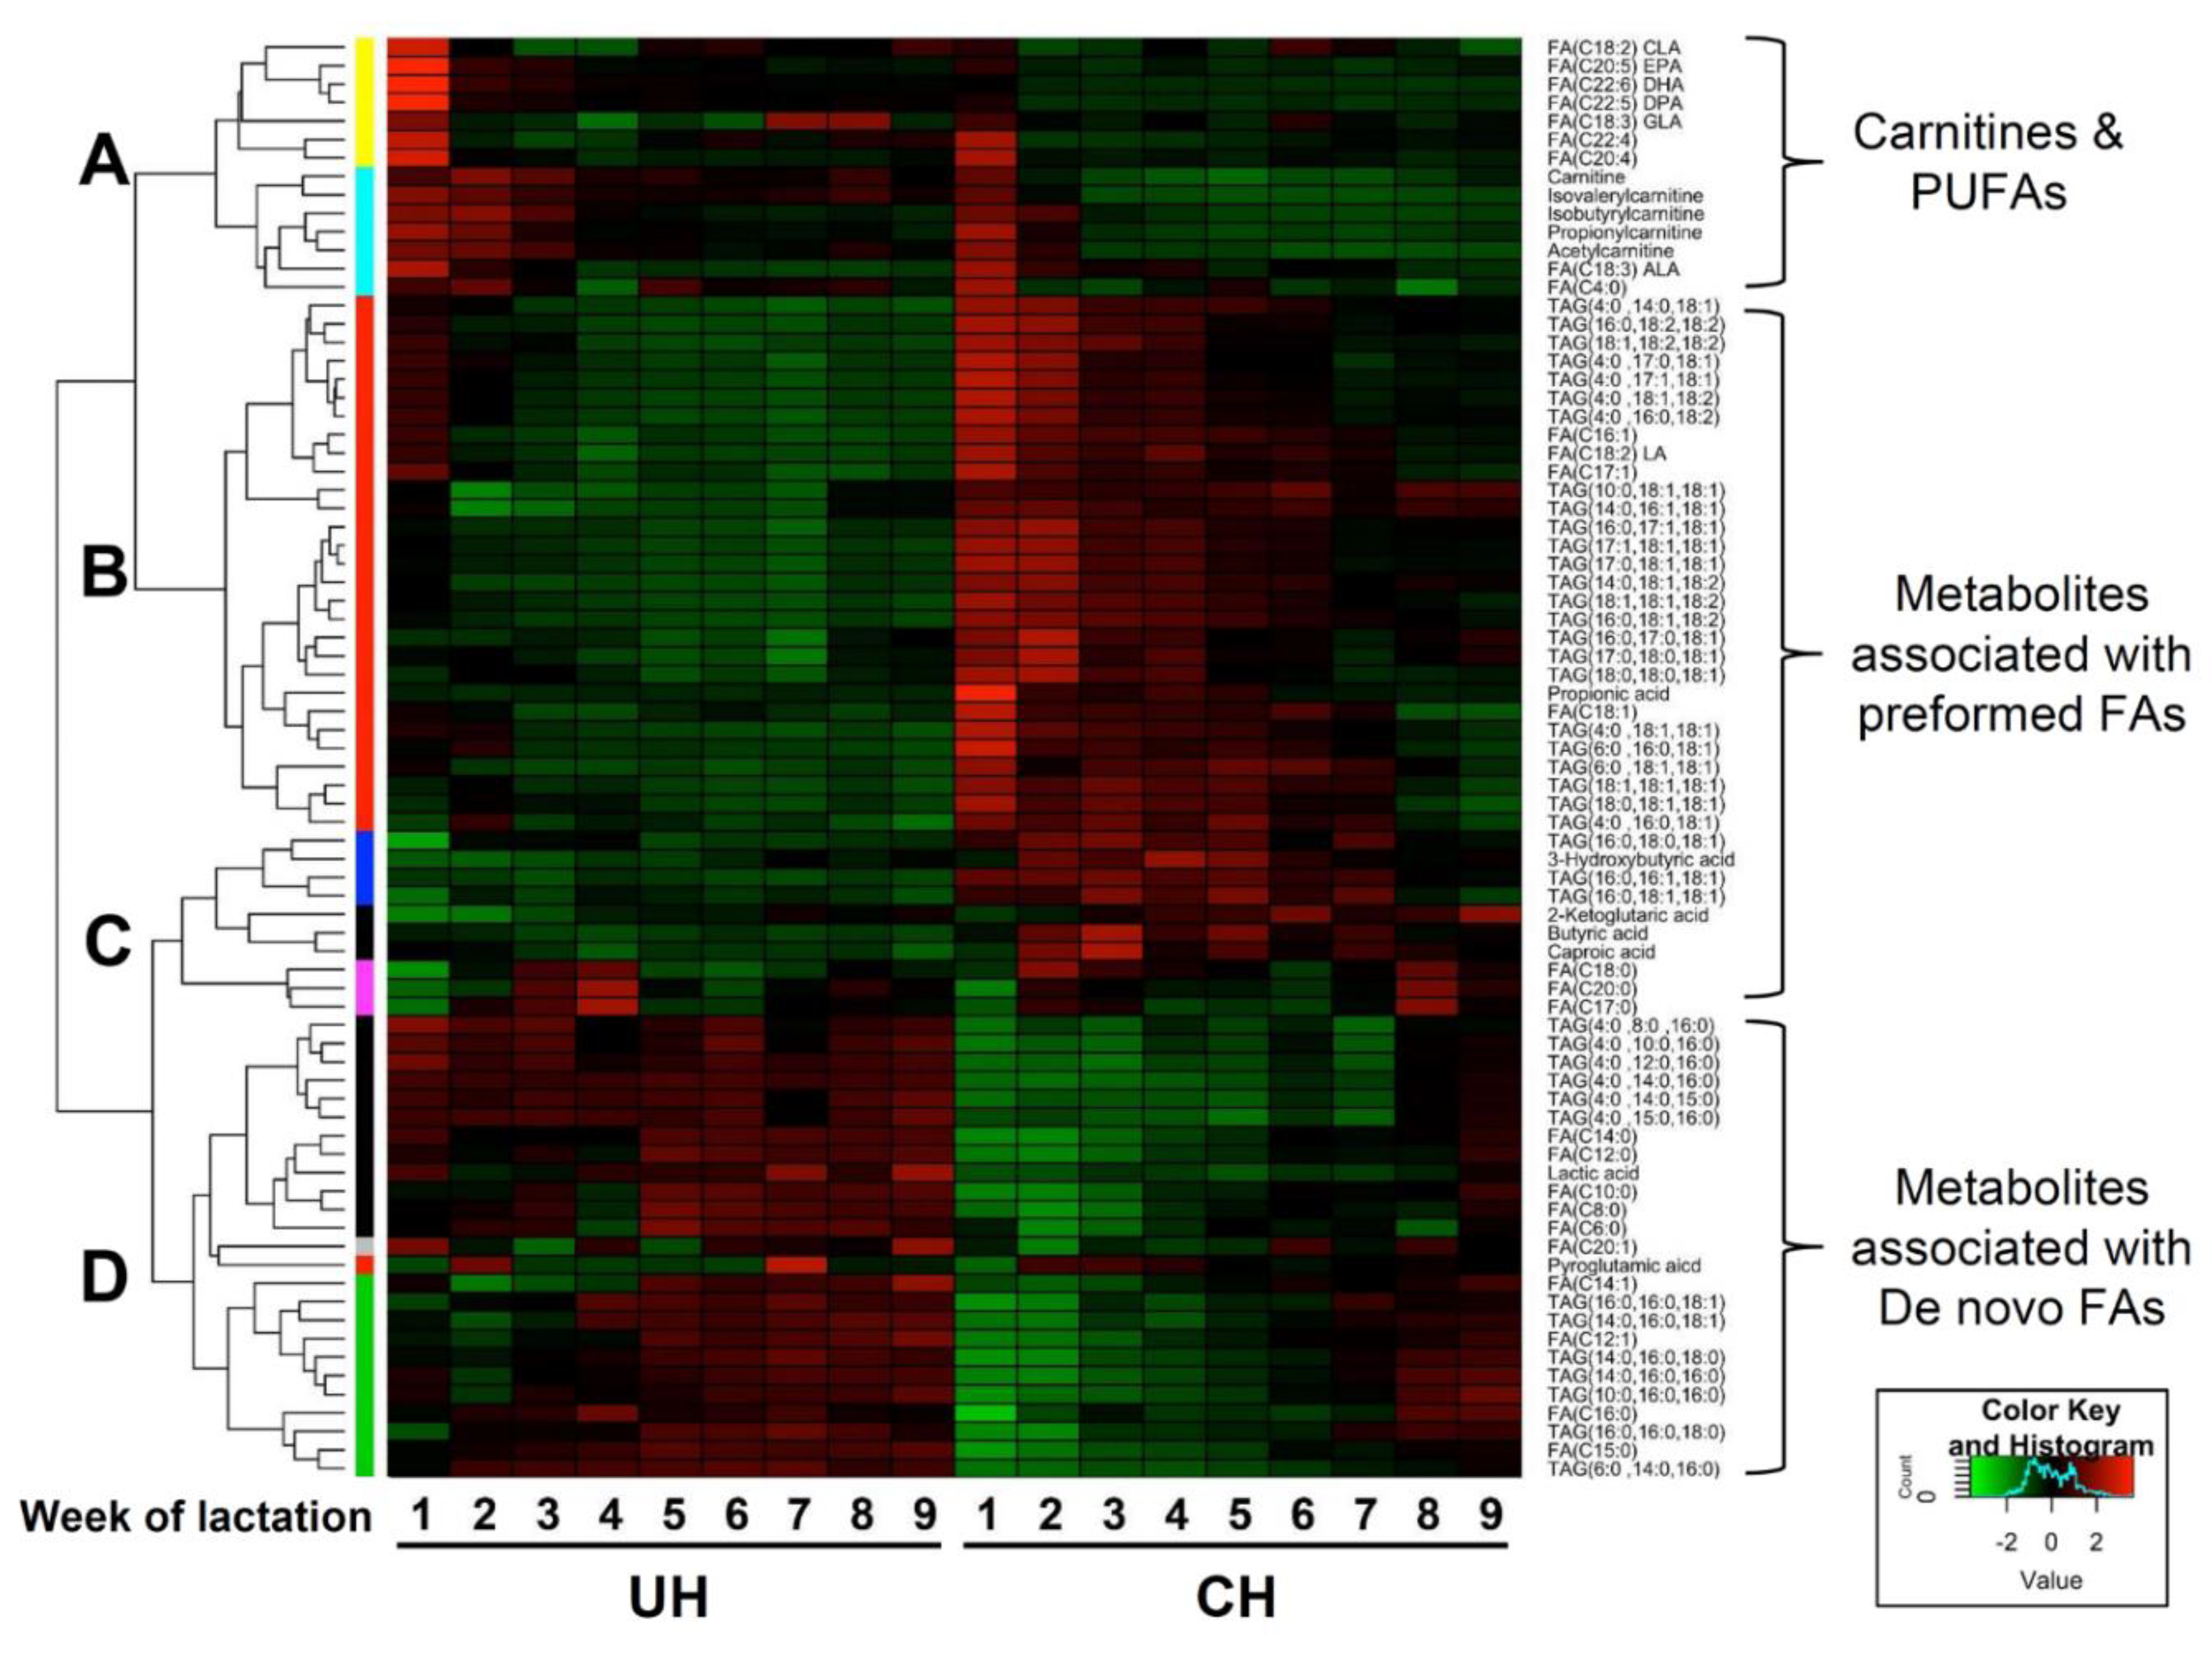

Table 1.
Major TAG species identified in milk from multiparous unselected (UH) and contemporary (CH) cows and their relative distribution between these genotypes.
Table 1.
Major TAG species identified in milk from multiparous unselected (UH) and contemporary (CH) cows and their relative distribution between these genotypes.
| ID | m/z of [M+NH4]+ a | FA compositionb | Positive correlationc | ID | m/z of [M+NH4]+ | FA composition | Positive correlation |
| T1 | 544.4577 | TAG(4:0, 8:0, 16:0) | UH | T26 | 792.7081 | TAG(10:0, 18:1, 18:1) | CH |
| T2 | 572.4890 | TAG(4:0, 10:0, 16:0) | UH | T27 | 794.7238 | TAG(10:0, 18:0, 18:1) | |
| T3 | 600.5203 | TAG(4:0, 12:0, 16:0) | UH | T28 | 796.7394 | TAG(14:0, 16:0, 16:0) | UH |
| T4 | 614.5360 | TAG(4:0, 14:0, 15:0) | UH | T29 | 820.7394 | TAG(14:0, 16:1, 18:1) | CH |
| T5 | 626.5360 | TAG(4:0, 14:0, 16:1) | T30 | 822.7551 | TAG(14:0, 16:0, 18:1) | UH | |
| T6 | 628.5516 | TAG(4:0, 14:0, 16:0) | UH | T31 | 824.7707 | TAG(14:0, 16:0, 18:0) | UH |
| T7 | 642.5673 | TAG(4:0, 15:0, 16:0) | UH | T32 | 846.7551 | TAG(14:0, 18:1, 18:2) | CH |
| T8 | 652.5516 | TAG(4:0, 14:0, 18:2) | T33 | 848.7707 | TAG(16:0, 16:1, 18:1) | CH | |
| T9 | 654.5673 | TAG(4:0, 14:0, 18:1) | CH | T34 | 850.7864 | TAG(16:0, 16:0, 18:1) | UH |
| T10 | 656.5829 | TAG(6:0, 14:0, 16:0) | UH | T35 | 852.8020 | TAG(16:0, 16:0, 18:0) | UH |
| T11 | 680.5829 | TAG(4:0, 16:0, 18:2) | CH | T36 | 862.7864 | TAG(16:0, 17:1, 18:1) | |
| T12 | 682.5986 | TAG(4:0, 16:0, 18:1) | CH | T37 | 864.8020 | TAG(16:0, 17:0, 18:1) | |
| T13 | 684.6142 | TAG(4:0, 16:0, 18:0) | T38 | 872.7707 | TAG(16:0, 18:2, 18:2) | CH | |
| T14 | 694.5986 | TAG(4:0,17:1, 18:1) | T39 | 874.7864 | TAG(16:0, 18:1, 18:2) | CH | |
| T15 | 696.6142 | TAG(4:0, 17:0, 18:1) | CH | T40 | 876.8020 | TAG(16:0, 18:1, 18:1) | CH |
| T16 | 706.5986 | TAG(4:0, 18:1, 18:2) | T41 | 878.8177 | TAG(16:0, 18:0, 18:1) | CH | |
| T17 | 708.6142 | TAG(4:0, 18:1, 18:1) | CH | T42 | 880.8333 | TAG(16:0, 18:0, 18:0) | |
| T18 | 710.6299 | TAG(6:0, 16:0, 18:1) | UH | T43 | 888.8020 | TAG(17:1, 18:1, 18:1) | CH |
| T19 | 712.6455 | TAG(6:0, 16:0, 18:0) | T44 | 890.8177 | TAG(17:0, 18:1, 18:1) | ||
| T20 | 736.6455 | TAG(6:0, 18:1, 18:1) | T45 | 892.8333 | TAG(17:0, 18:0, 18:1) | ||
| T21 | 738.6612 | TAG(6:0, 18:0, 18:1) | T46 | 898.7864 | TAG(18:1, 18:2, 18:2) | ||
| T22 | 740.6768 | TAG(10:0, 16:0, 16:0) | UH | T47 | 900.8020 | TAG(18:1, 18:1, 18:2) | CH |
| T23 | 762.6612 | TAG(8:0, 18:1, 18:1) | T48 | 902.8177 | TAG(18:1, 18:1, 18:1) | ||
| T24 | 764.6768 | TAG(8:0, 18:0, 18:1) | T49 | 904.8333 | TAG(18:0,18:1,18:1) | ||
| T25 | 766.6925 | TAG(12:0, 16:0, 16:0) | T50 | 906.8490 | TAG(18:0, 18:0, 18:1) |
a The mass over charge (m/z) ratios of TAG ammonium adducts ([M+NH4]+) from high-resolution MS analysis were used for elemental composition analysis. b The fatty acid compositions of individual TAGs were determined by MSMS fragmentation. c Individual TAGs positively correlated with UH or CH milk were identified in the S-plot of OPLS-DA model (Figure 3B) and then confirmed by the statistical comparisons on UH and CH (P≤ 0.05).
Disclaimer/Publisher’s Note: The statements, opinions and data contained in all publications are solely those of the individual author(s) and contributor(s) and not of MDPI and/or the editor(s). MDPI and/or the editor(s) disclaim responsibility for any injury to people or property resulting from any ideas, methods, instructions or products referred to in the content. |
© 2024 by the authors. Licensee MDPI, Basel, Switzerland. This article is an open access article distributed under the terms and conditions of the Creative Commons Attribution (CC BY) license (http://creativecommons.org/licenses/by/4.0/).
Copyright: This open access article is published under a Creative Commons CC BY 4.0 license, which permit the free download, distribution, and reuse, provided that the author and preprint are cited in any reuse.


