
Submitted:
07 April 2025
Posted:
07 April 2025
You are already at the latest version
Abstract
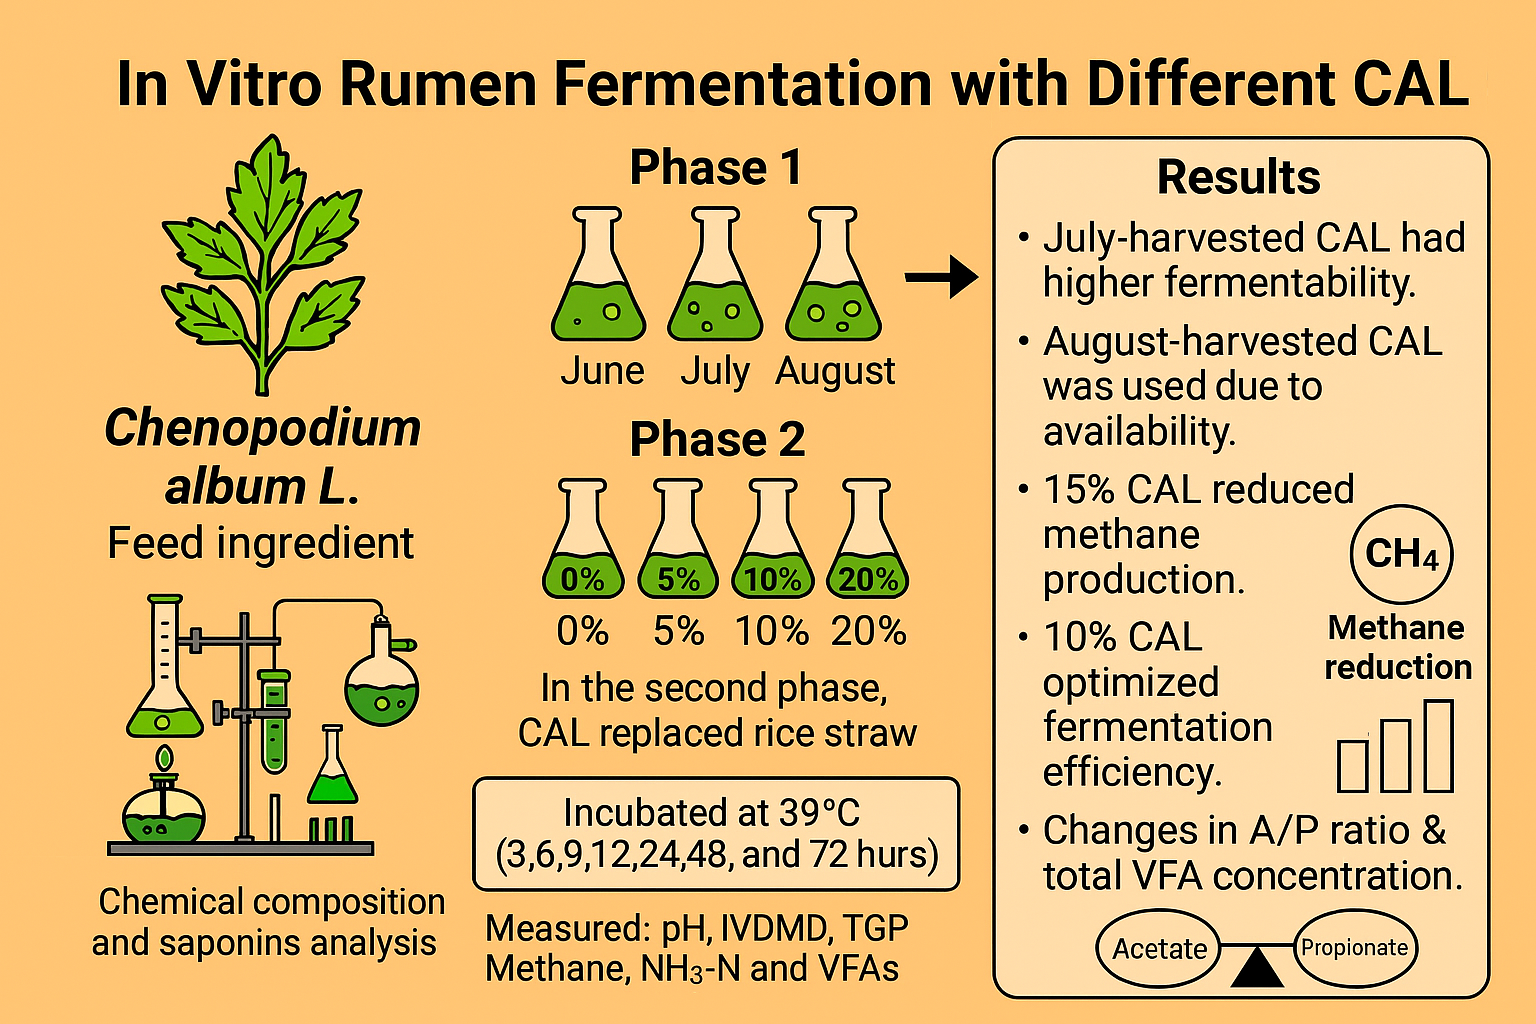
This study investigated the feasibility of incorporating Chenopodium album L (CAL) into ruminant feed ingredients by evaluating the effects of harvest time and substitution levels on in vitro rumen fermentation. In the first phase, a sole-substrate experiment was conducted using CAL harvested from June to August, analyzing its chemical composition and total saponin content. The impact of harvest time on fermentation parameters was assessed with CAL as the sole substrate. The second phase involved a mixed-substrate experiment using an early-fattening Hanwoo diet (30% rice straw and 70% concentrate), where increasing proportions of CAL (Control: 0%, T1: 5%, T2: 10%, T3: 15%, and T4: 20%) replaced rice straw. Seasonal variations in CAL composition influenced fermentation characteristics, with July-harvested CAL exhibiting higher fermentability, while August-harvested CAL had lower fermentability. However, August-harvested CAL was selected for the second experiment due to its greater availability. We hypothesized that saponins in CAL contribute to methane reduction. Supplementation with 15% of CAL significantly reduced methane production per gram of digested substrate (p < 0.05), likely due to differences in crude protein (CP), neutral detergent fiber (NDF), acid detergent fiber (ADF), and saponin content. However, despite having the lowest fiber content, T4 (20% CAL) exhibited the lowest in vitro dry matter digestibility (IVDMD), suggesting that factors such as saponins, CAL’s chemical composition, or microbial shifts may have hindered digestibility. Fermentation characteristics further revealed that the acetate-to-propionate (A/P) ratio decreased with increasing CAL levels, with T4 showing the lowest ratio (1.55 at 72 hours), confirming a shift toward propionate-based fermentation. Notably, T2 (10% CAL) optimized fermentation efficiency, producing the highest total volatile fatty acid (VFA) concentration at 24 hours (98.28 mM). These findings highlight the potential of CAL as a functional feed ingredient, with moderate substitution levels (10–15%) enhancing fermentation efficiency while reducing methane production.
Keywords:
Chenopodium album
; saponins
; Hanwoo
; rumen fermentation
; methane production
; substitution level
1. Introduction
Like any agricultural activity, cattle farming can have both positive and negative impacts on environmental sustainability. The environmental sustainability of cattle farming depends on several factors, including land use, water use, greenhouse gas (GHG) emissions, waste management, biodiversity conservation, antibiotic use, and social and economic impacts [1].
Emission of GHGs, such as carbon dioxide (CO2) and methane (CH4), ranks among the most important global environmental issues [2]. Ruminant livestock contributes approximately 15% to 20% of the total anthropogenic emissions of CH4 [3]. Not only does CH4 produced from the enteric fermentation of ruminants contribute to environmental problems but it is also associated with reduced retention, use, and loss of energy. Typically, 6% to 8% but up to 12% of the gross energy (GE) in animal feed is converted to CH4 during microbial digestion in the rumen [4]. Therefore, it is desirable to reduce CH4 production from ruminants to lower GHGs and to improve the utilization of digested energy.
In developed countries with intensive livestock production systems, feed costs account for approximately 50-70% of total production expenses [5].
In Korea, limited pasture areas, unfavorable soil and climate conditions, and high production costs create significant challenges for beef and dairy cattle farmers. The reliance on imported roughage, which is both costly and often in limited supply, places a financial burden on producers [6]. This situation is particularly challenging in countries like Korea and Japan, where beef cattle are raised for extended periods (e.g., up to 30 months). Consequently, there is increasing interest in reducing roughage feeding or finding cost-effective alternatives that maintain rumen health and productivity [6,7].
Considering these challenges, the exploration of alternative feed resources, such as Chenopodium album, has become crucial.
Chenopodium album L (CAL), a native plant of Western Asia, belongs to the genus Chenopodium that is distributed worldwide and contains about 250 species [8], with 15 species found in South Korea [5]. It is commonly found throughout the world, particularly in India, North America, and parts of Europe [10]. It is known by various names, such as lamb’s quarter, melde, goosefoot, fat hen, and pigweed [11].
It is consumed as food in North India and has historically been used in Europe where its seeds are mixed with common grains for bread production [12]. CAL is a common annual herb found in disturbed areas, salt marshes, and dry habitats worldwide, including Korea [13].
It has also been reported to grow naturally as a weed in the fields of wheat, barley, mustard, gram, and other crops [14,15]. Traditionally, CAL has been used as a medicinal plant in South Korea [9]. It is effective in preventing hypertension, cerebral hemorrhage, and stroke, so its leaves were dried and used as a medicinal herb, and the powder made by burning the hay was used for various purposes such as relieving pain such as toothache and sore throat, preventing gastrointestinal diseases, preventing diarrhea, and treating asthma and insect bites [16,17]. The green leaves of CAL are very nutritious and rich in essential amino acids, calcium, vitamins A and C [18]. They are also a good source of fiber and iron content [19] that is higher than that found in spinach and cabbage but lower than in amaranth leaves [20].
It is rich in proteins (ranging from 3.7% to 32.95%) with a high concentration of essential amino acids, such as lysine, leucine, and isoleucine [21]. Its antioxidant, anti-inflammatory, antifungal, antiviral, anticancer, and antidiabetic properties have been documented [22,23,24,25,26]. CAL has been found to contain the phenolic amide flavonoid [27] and is hypotensive in activity [10]. It has saponin [28], cinnamic acid amide [29], alkaloid chenoalbicin [30], apocarotenoids [31], phenols, and lignans [32].
Previous studies suggest that saponins have the potential to both increase the digestibility of nutrients and reduce methane emissions in ruminants [33].
For instance, saponin supplementation in diets for sheep increased the digestibility of organic matter (OM), neutral detergent fiber (NDF), and acid detergent fiber (ADF) by 9.6%, 27.9%, and 38%, respectively [34]. Even though CAL has a negative impact on crop yields [35], some countries including Mongolia use this plant as forage or silage in animal feed [36] due to its high protein and bioactive compound content [37]. CAL could be the cheapest and most readily available source of proteins, vitamins, minerals, fibers, and essential amino acids, especially for animal feed [38,39]. Although most research on CAL has focused on its pharmacological properties [37], its effects on rumen fermentation and its potential as an animal feed ingredient has received little attention.
Therefore, this study aims to evaluate the feasibility of Chenopodium album L (CAL) as a functional feed ingredient by examining the effects of harvest time and CAL substitution levels on in vitro rumen fermentation. The first objective is to assess how seasonal variations in CAL composition influence fermentation parameters when used as a sole substrate. The second objective is to investigate the impact of replacing rice straw with CAL at different levels (5%, 10%, 15%, and 20%) in an early-fattening Hanwoo diet (30% roughage and 70% concentrate) on rumen fermentation characteristics, methane production, and nutrient digestibility. We hypothesize that CAL, particularly its nutrient composition and saponin content, can enhance fermentation efficiency and reduce methane production in ruminants.
2. Materials and Methods
2.1. Experimental Design, Feed Preparation, and In Vitro Fermentation Procedure
We investigated the feasibility of incorporating Chenopodium album (CAL) into ruminant diets by evaluating the effects of harvest time and substitution levels on in vitro rumen fermentation. CAL was harvested at 30-day intervals between June to August from an agricultural field in Anseong, South Korea (37°0'46.745''N 127°17'28.218''E). Seasonal variations in its chemical composition and total saponin content were analyzed. To evaluate fermentation characteristics, we conducted a two-stage in vitro batch culture experiment. In the first stage, we examined the impact of harvest time on fermentation parameters using CAL as a sole substrate. The second stage investigated the effects of replacing rice straw with increasing levels of CAL (0%, 5%, 10%, 15%, and 20%) in an early-fattening Hanwoo diet (30% rice straw and 70% concentrate, DM basis). August-harvested CAL, selected for its greater availability, was used as the rice straw substitute. The concentrate in the diet consisted of cornflakes (54.34%), corn gluten meal (5.08%), soybean meal (8.82%), wheat (6.51%), wheat bran (3.92%), palm kernel meal (6.55%), soybean hulls (6.51%), lupin flakes (6.51%), along with limestone (0.77%), salt (0.37%), baking soda (0.37%), and Grobic-DC feed additive (0.25%). Test feed samples were prepared by drying fresh CAL at 60°C in a drying oven (VISION, Daejeon, Korea) for 48 hours, grinding the dried CAL with a hammer mill (Micro-whisk mill, Culatti, Switzerland) through a 1.5 mm sieve, and storing the powder in a –30°C freezer (Gudero plus, Ilsinbio, Korea) until further use. Rumen fluids were collected from three Hanwoo steers with cannulas at a farm affiliated with Chungnam National University, with the approval of the Animal Experiment Ethics Committee (approval number: 202304A-CNU-2005). The rumen fluids collected 30 minutes before the morning feed were stored in a 2-litre thermos bottle, filtered through four layers of cheesecloth, and diluted 1:4 (v/v) with McDougall’s buffer [40]. The diluted rumen fluid was dissolved with oxygen (O2)-free carbon dioxide (CO2) to make the fluid completely anaerobic and used as an inoculum for the rumen. To a 120 mL serum bottle, 60 mL of buffered rumen fluid and 1% test feeds were added, sealed with a butyl rubber stopper and aluminum cap, then cultured in a 39°C incubator (HST-103M, Han Baek ST Co., Ltd., Korea) for 0, 3, 6, 9, 12, 24, 48, and 72 hours (Figure 1). Following incubation, we analyzed the pH, in vitro dry matter digestibility (IVDMD), total gas production (TGP), methane production (CH4), ammonia-nitrogen production (NH3-N), and volatile fatty acids (VFAs).
2.2. Chemical Analysis and In Vitro Fermentation Measurements
Standard methods were used to analyze moisture, crude protein (CP), ether extract (EE), crude fiber (CF), and crude ash (CA) [41]. Neutral detergent fiber (NDF) and acid detergent fiber (ADF) were analyzed according to Van Soest et al. [42]. The method by Le Bot et al. was used to measure saponin content [43]. The chemical compositions of experimental feeds and treatments used for in vitro batch culture experiment are presented in Table 1. We used a water displacement method, based on a method by Beuvink et al., to measure the TGP at each incubation time [44]. For CH4 analysis, we collected 4 mL of gas from the culture medium at specific incubation times. For the supernatant, we opened the serum bottle and extracted 10 mL of the culture media. We centrifuged the extracted media at 3,000×g for 10 minutes using a centrifuge (Hanil Science, Gimpo, Korea) and collected the supernatant for further analysis. We measured the pH of the supernatant using a pH meter (Mettler, Columbus, USA) and then stored the supernatant in a -30°C deep freezer (IlshinBioBase, Dongducheon, Korea) for further analysis. Following centrifugation, we filtered the sediment and the remaining culture liquid into a glass crucible (FOSS, Hillerød, Denmark) and dried it at 105°C for 4 hours in a drying oven (VISION, Gimpo, Korea) before IVDMD was measured. A mixture of 2 mL of the sample with 0.8 mL of 50% sulfuric acid (H2SO4) and 2 mL of ethyl ether was used to analyze VFA production. We centrifuged the mixture at 3,000 rpm for 10 minutes, transferred the supernatant to a capillary column (CP-Wax 58 FFAP CB, 50 m × 0.53 mm, film thickness = 2 µm) and analyzed it with gas chromatography (Shimadzu, Kyoto, Japan) [45]. Gas chromatography, equipped with a thermal conductivity detector and a Hayesep Q packed column (Porapak-Q, 1.8 m × 2 mm i.d., 80/100 mesh size), was used to determine CH4 concentration (Shimadzu, Kyoto, Japan). For NH3-N concentration analysis, the sample was mixed with phenol color reagent (phenol 50 g, sodium nitroferricyanide dihydrate 0.25 g, and 1 L of distilled water) and alkali hypochlorite reagent (NaOH 25 g, sodium hypochlorite 16.8 mL, and 1 L of distilled water). After incubating the sample at 37°C for 15 minutes to allow color to develop, we diluted the mixture with 8 mL of distilled water. The absorbance was measured at 630 nm using a spectrophotometer (Thermo Scientific, Waltham, Massachusetts, USA) [46].
2.3. Statistical Analysis
The SAS® software (Version 9.4, SAS Institute Inc., Cary, NC, USA) was used to analyze all data. The General Linear Model (GLM) procedure was used to evaluate the effects of treatment on in vitro rumen fermentation parameters at different incubation times. Tukey’s multiple comparison test was applied to determine significant differences between treatment means, at a significant level of p < 0.05. Data are presented as a means with their corresponding standard error of the mean (SEM). Superscripts (a, b, c) indicate statistically significant differences among treatments for the same incubation time [47].
3. Results
3.1. Chemical Compositions and Saponin Content of Chenopodium album L. at Different Times of Harvest
The chemical composition of CAL is presented in Table 2. Although, CAL harvested in July and August had similar levels of CP (12.749%-13.24%) and EE (1.96%–2.18%), the CP content of CAL harvested in June was statistically higher (p < 0.05). As the maturity of the CAL herb increased, the composition of CF, ADF, and NDF in CAL increased significantly (p < 0.05). In contrast, the CP content significantly decreased (p < 0.05).
The saponin content of CAL increased progressively as the plant matured, ranging from 6.60% in June to 7.05% in August (Table 3). Although this trend suggests a gradual accumulation of saponins over time, it is important to note that statistical analysis cannot be conducted on these results. An external research center analyzed the saponin data without replication or statistical analysis.
3.2. Evaluation of the Effect of Harvest Time of Chenopodium album L. on In Vitro Rumen Fermentation
In Table 4, the pH levels of culture media with CAL harvested in July and August continuously decreased to 12 hours of incubation. No significant differences were observed between the treatments at 3 and 9 hours of incubation. At 6 and 12 hours, the pH in July and August was lower than June (p < 0.05). After 24 hours, the pH was lower in July compared to June and August (p < 0.05). At 48 hours, the pH in July was the lowest among the treatments (p < 0.05), and at 72 hours, the pH in June was significantly higher than July and August (p < 0.05). In Table 4, IVDMD of culture media with CAL harvested in June was higher, and lower in August than that observed in July at all incubation times (p < 0.05). The IVDMD was negatively correlated with NDF and ADF content. In general, with advanced CAL plant maturity, there is an increase in the main features – DM, NDF, and ADF content along with a decrease in CP content [48], [49] and forage digestibility [50], [51].
In Table 4, there are distinct temporal variations in NH₃-N concentration across the three harvest treatments. The NH₃-N levels increased from 0 hours to 6 hours, then declined between 9 hours and 12 hours, followed by an increase from 24 hours onward. During the early fermentation phase (3 hours, 6 hours, and 9 hours), no significant differences were observed among the harvest treatments. However, at 12 hours, the culture media with CAL harvested in July reported the highest significant NH₃-N concentration, while that harvested in June and August reported significantly lower values (p < 0.05). At 24 hours, NH₃-N concentrations in June and August treatments were significantly higher than that in July (p < 0.05). After this point, NH₃-N levels increased sharply with the highest values observed in June, followed by July. The culture media with CAL harvested in August had the lowest concentrations at 48 hours and 72 hours (p < 0.05).
In Table 5, TGP was expressed per gram of dry matter incubated, while CH₄ production was calculated per gram of digested substrate. TGP of culture media with CAL harvested in August was significantly lower than that of other harvest treatments 48 hours and 72 hours following incubation (p < 0.05). At 6 hours and 9 hours, there were no significant differences among harvest treatments, but from 12 hours to 72 hours, TGP in July was significantly higher than that in June and August (p < 0.05).
In Table 5, CH4 production of culture media with CAL harvested in June was significantly lower than in the other harvest treatments at all incubation times (p < 0.05). CH4 production was the highest in August between 6 and 24 hours of incubation (p < 0.05). CAL harvested in July exhibited higher CH4 production than the other treatments at 3, 48, and 72 hours (p < 0.05).
In Table 6, the total VFA concentration was significantly higher in June and July treatments compared to that in August at 0, 3, 6, 24, and 48 hours of incubation (p < 0.05). At 9 hours, the VFA concentration of culture media with CAL harvested in June was the lowest, while the VFA concentration was the highest in August (p < 0.05). Following 12 and 72 hours of incubation, the highest total VFA concentration was observed in July (p < 0.05), indicating greater microbial fermentation activity. Acetate concentration was significantly higher in June at 3, 9, 24, and 72 hours (p < 0.05), while no significant differences were observed among harvest treatments at 6 and 12 hours. Propionate concentration did not differ significantly among the harvest groups from 0 to 6 hours. However, for the harvest in July, propionate concentrations exhibited significantly higher values at 9, 12, and 24 hours (p < 0.05). In the June and August harvest, propionate concentration was the highest at 48 hours (p < 0.05). The increase in total VFA production in June and July suggest enhanced microbial fermentation due to the increased availability of soluble carbohydrates in younger plants. The higher propionate levels in July suggest more efficient fiber fermentation, which aligns with the increase in total VFA production. Despite higher NDF and ADF, the fermentation process may have favored propionate-producing pathways, such as the succinate-propionate pathway. This shift could be due to differences in fiber composition (e.g., more fermentable hemicellulose) rather than microbial population changes. At 3, 9, 24, and 72 hours, acetate was higher in June than in July due to the higher water-soluble carbohydrate content in younger plants, which promotes acetate-producing microbial fermentation, whereas increased fiber content in July favored propionate production. Butyrate concentration was significantly higher in harvests in July and August at 0, 3, 12, and 72 hours (p < 0.05). The highest butyrate concentration was observed at 9 hours in the culture media with CAL harvested in July, while significantly higher values were obtained at 24 to 48 hours in harvests in August (p < 0.05). Acetate to propionate ratio ranged from 3.02 to 3.66. Between 3 to 6 and 12 to 24 hours and at 72 hours, a significantly lower acetate-to-propionate ratio was observed in July than that observed in harvests in June and August (p < 0.05). This suggests a shift toward propionate fermentation.
3.3. Effect of Chenopodium album L. Substitution Levels on In Vitro Rumen Fermentation in Early Fattening Hanwoo
The results of the in vitro sole-substrate experiment indicate that CAL harvested in July exhibits optimal quality characteristics for in vitro rumen fermentation. Its lower fiber content, compared to the August harvest, suggests enhanced fermentation efficiency and nutrient availability. However, despite its superior nutritional profile, the July harvest was not available in sufficient quantities for use as a roughage substituting experiment. Therefore, CAL harvested in August was selected to ensure an adequate supply for experimental evaluation. Furthermore, the saponin content increased as the plant matured, reaching 7.047% in the August harvest compared to 6.619% in July and 6.597% in June (Table 3).
In Table 7, the pH values varied significantly among different CAL substitution level groups and incubation times. The pH was higher in treatments at early incubation time compared to that of the control. Although the control showed the highest value, pH significantly declined by 12 hours across all treatments, indicating greater acid production from microbial fermentation in the CAL-substituted diet groups. At 24 hours, T4 had the lowest pH, while at 48 hours, T1, T2 and T3 recorded the lowest pH values, suggesting a prolonged fermentation process that is likely due to increased organic acid production. No significant differences were observed among treatments by 72 hours, indicating pH stability with prolonged incubation.
IVDMD varied significantly among treatments over time. At 3 hours, T1 exhibited the highest digestibility (28.94%), while T4 showed the lowest (14.71%). This trend continued at 6 hours where T1 was not significantly different from T2 and T3, suggesting enhanced microbial activity with partial CAL substitution. Digestibility was highest in control and T3 by 9 hours, indicating the rapid degradation of more fermentable components. At 12 and 24 hours, digestibility was significantly higher in T2 and T3 compared to that of other substitution treatments, suggesting improved fermentation efficiency. By 48 and 72 hours, digestibility remained high across all treatments with the highest values observed in T2 at 48 hours. IVDMD was the lowest in T4 compared to other treatments among incubation time (p < 0.05).
NH₃-N concentration followed a dynamic pattern across incubation times. At 0 hours, initial NH₃-N levels were highest in T3, suggesting a high proportion of rapidly degradable protein. By 3 hours, T1 and T3 showed significantly increased NH₃-N concentrations (p < 0.05), indicating rapid protein breakdown. At 6 hours, the NH₃-N concentration was the highest in T4, suggesting continued deamination of dietary proteins. By 9 hours, NH₃-N was the lowest in T2 (p < 0.05), implying a slow release of ammonia or increase in the assimilation of microbial nitrogen. At 12 hours, NH3-N was the highest in control but the lowest in T4 (p < 0.05). At 24 hours, NH₃-N was highest in T3, followed by T4, indicating prolonged protein degradation. By 48 and 72 hours, NH₃-N increased sharply across all treatments, with the highest values in the control, T3, and T4, suggesting extensive protein breakdown and reduced microbial nitrogen utilization at later incubation times. In the in vitro experiments with either the CAL sole substrate or the diet supplemented with varied proportions of CAL, NH₃-N concentrations initially increased from 0 to 3 hours, decreased between 6 and 9 hours, and then increased again after 12 hours. These fluctuations can be attributed to key factors influencing rumen fermentation dynamics. In the early phase (0–3 hours), rapid protein degradation and high microbial activity lead to increased NH₃-N levels. Subsequently, NH₃-N is reduced with microbial growth and nitrogen assimilation as microbes incorporate ammonia into their biomass. After 12 hours, microbial turnover, increased degradation of complex substrates, and reduced efficiency of microbial protein synthesis contribute to high NH₃-N concentrations.
In Table 8, TGP was expressed per gram of dry matter incubated, while CH₄ production was calculated per gram of digested substrate. TGP and CH₄ production varied significantly among different CAL substitution levels and incubation times (p < 0.05). At 3 hours, T4 exhibited the highest TGP (p < 0.05), suggesting rapid fermentation of readily available carbohydrates. However, at 6 hours, T1 had the highest TGP, while by 12 hours, TGP was significantly lower in T3 and T4 compared to the other treatments, indicating a reduced fermentation rate at higher CAL substitution levels. At 24 hours, the control and T1 showed the highest TGP (p < 0.05), but by 72 hours, all treatments exhibited similar values, suggesting fermentation stabilization over time.
For CH₄ production, T1 and T3 exhibited the lowest CH₄ output at 3 hours (p < 0.05). T3 consistently showed the lowest CH₄ production at 6, 9, 24, and 72 hours (p < 0.05), while at 12 hours, T2 had significantly lower CH₄ production. CH₄ production was highest in the control at 48 and 72 hours, whereas the T4 showed the highest CH₄ production at all incubation times.
In Table 9, at 0 hours, all substitution levels had similar VFA concentrations, except in T3, which was significantly lower than in the control (p < 0.05). By 3 hours, VFA production peaked in T4 and the control, while other treatments remained similar. At 9 hours, T2 and T4 had the highest VFA concentrations, indicating an increased fermentation rate. By 12 hours, the control had the highest total VFA (63.47 mM), but T3 and T4 showed comparable levels, suggesting no adverse effects at higher proportions of CAL substitution. At 24 hours, T2 had significantly higher total VFA (98.28 mM) than other treatments (p < 0.05), indicating that 10% CAL supplementation in the diet optimizes fermentation by providing an ideal nutrient balance. By 48 hours, T4 had the highest total VFA (p < 0.05), while it was lower in control, T1, and T3. At 72 hours, the T4 (109.05 mM) had a significantly higher VFA concentration than the control (102.91 mM), suggesting that high CAL levels support prolonged fermentation. These trends indicate that CAL, particularly at 10% to 20% supplementation, provides fermentable substrates that sustain microbial activity.
At 0 hours, acetate levels were comparable, though slightly lower in T4 (58.69%) than in control (59.50%). By 3 hours, T4 showed higher acetate (60.04%) than the control (58.89%). At 9 hours, acetate was significantly higher in T2, T3, and T4 (p < 0.05) with T1 and T2 peaking at 12 hours (~59%), suggesting that moderate level of supplementation (5%-10%) promotes acetate production. Since acetate levels declined over time, and higher CAL substitution (15%-20%) shifted fermentation toward propionate, this suggests that a potential increase in fermentable carbohydrate proportion with increasing CAL supplementation could have contributed to this shift (Table 1). This change in fermentation pattern may reflect the higher crude protein content in the diet, which could support propionate production by favoring certain microbial pathways. T1 and T4 had slightly higher propionate levels (16.30% and 16.19%) than control (15.93%). Propionate increased significantly over time, peaking in T4 at 6 hours (25.14%) and 9 hours (25.13%). At 24 hours, T3 and T4 had significantly higher propionate than the control (p < 0.05). By 48 and 72 hours, T4 maintained the highest propionate concentration, supporting a sustained shift toward more efficient fermentation. Propionate is a major glucose precursor, which enhances energy efficiency and potentially reduces methane production due to lower hydrogen availability for methanogenesis.
The control had the highest A/P ratio (3.76), indicating an acetate-dominant fermentation. The A/P ratios for T1 (3.64) and T4 (3.69) were slightly lower. The ratio declined significantly over time, with T3 (3.12) and T4 (3.06) at 3 hours. By 12 hours, T1 had the highest A/P ratio (2.44), while the control was significantly lower (2.31). By 48 and 72 hours, T4 had the lowest A/P ratio (1.55), confirming a shift toward propionate fermentation, which is often associated with reduced methane production and improved energy efficiency. Although IVDMD was reduced in T4, TGP was also lower in T4. Interestingly, CH4 ml/g DMD was the highest in T4, indicating that despite a reduction in IVDMD, methane production per unit of digestible dry matter was greater in T4 compared to other treatments. Total VFA concentration remained unaffected, suggesting that the reduction in methane production was likely due to a shift in fermentation patterns rather than a change in overall fermentation activity.
4. Discussion
4.1. Chemical Compositions and Saponin Content of Chenopodium album at Different Times of Harvest
As the maturity of the CAL herb increased, the composition of CF, ADF, and NDF in CAL increased significantly (p < 0.05). In contrast, the CP content significantly decreased (p < 0.05). The chemical composition of forage is critical in influencing its nutritive value, with protein and fiber concentrations serving as key indicators of feed quality [52]. Adedapo et al. [53] and Han et al. [9] reported CP levels of 26.44% and 28.72%, respectively, in CAL leaves, which are higher than the values obtained in our study. Singh et al. [54] and Odhav et al. [55] reported CP content of 3.7% and 5.0%, respectively, in CAL, which are lower than the values observed in our current study. Peiretti et al. [56] observed that the CP content of Chenopodium quinoa ranged from 9.35% at the budding stage to 15.1% at the grain stage, while the NDF content ranged from 40.8% at the mid-vegetative stage to 53.4% at the grain stage. These data align with the results of our study. Afolayan et al. [57] reported that the CP content of the vegetables they examined ranged from 13.25% to 26.44%, with the highest CP content observed in CAL and the lowest in Sonchus asper. The protein content in these wild species was observed to be comparable to or higher than that of exotic vegetables, such as lettuce, cabbage, and spinach [57]. Similar findings have been reported in Nigeria and the Coruh Valley where the protein content of wild vegetables ranged between 3.5% and 32.5% [58,59]. With its high crude protein content, CAL could serve as an affordable protein source for livestock.
Saponin synthesis in plants is influenced by both intrinsic and external factors, including physiological stage, cutting time, and environmental conditions, such as soil type and climate [60]. The progressive increase in saponin content, observed in our study, may be partially attributed to the rise in average temperatures during the experimental period that were 28.1°C in June, 30.2°C in July, and 31.3°C in August [61]. Saponin content was generally lower in early spring and mid-autumn [62]. The growth stage of plants also plays a crucial role with saponin levels typically peaking at the blooming stage and declining during the grain stage. For instance, alfalfa’s saponin content ranges from 0.1% to 2.5% [63] depending on the variety and is the highest when harvested in late summer [62]. Similarly, Chenopodium quinoa, a closely related species, often exhibits high saponin levels with certain varieties exceeding 10% [64]. In contrast, commonly used forage crops such as alfalfa and soybeans have significantly lower saponin content, averaging 4.0% and 1.4%, respectively [65]. The relatively high saponin content in CAL highlights its potential as a forage crop with bioactive properties. However, caution is warranted as excessive saponin intake can lead to antinutritional effects, including reduced feed palatability and potential toxicity in livestock. The lethal dose of saponins varies widely, ranging from 25 to 3,000 mg/kg body weight, depending on the animal species and the chemical structure of the saponins [65]. Future studies should evaluate the optimal supplementation levels of CAL in animal feeds to maximize its benefits while minimizing potential risks.
4.2. Evaluation of the Effect of Harvest Time of Chenopodium album on In Vitro Rumen Fermentation
The lower pH in July and August compared to June suggests that the higher fiber content in these harvests led to more intense fermentation and acid production over time, while the higher water-soluble carbohydrate content in June likely buffered the pH and slowed acidification in the earlier stages of fermentation.
The IVDMD was negatively correlated with NDF, ADF content, and maturity, indicating that as fiber content and plant maturity increased, the digestibility of the dry matter decreased. Balde et al. [66] performed in vivo experiments using four mature stages of fresh alfalfa and found that effective degradation of dry matter reduced with increasing plant maturity. Yu et al. [67] reported that alfalfa hay harvested at the early budding and late budding stages had higher IVDMD and NDF digestibility than when the alfalfa hay was harvested at the early flowering stage [67]. The IVDMD in CAL was compared to that of common forages such as rice straw and timothy hay. Rice straw has low digestibility (37.2%) [68], due to its high fiber content and silica [69], making it less suitable for high-yield animals. Timothy hay has a moderate IVDMD (52.2%) depending on its fiber composition [70]. The IVDMD of culture media with CAL harvested in June and July (72.14–82.62%) was higher than those of both rice straw and timothy hay, indicating superior fermentability and nutrient availability.
Similar trends in NH₃-N accumulation over time have been reported in studies on the ruminal degradation of protein-rich forages [71]. NH₃-N serves as an indicator of protein degradation in the rumen where microbial deamination of dietary proteins releases ammonia that can be utilized for microbial protein synthesis or absorbed into the bloodstream [72]. Increased fiber content and low soluble protein fractions as the plant matures may suggest reduced protein degradation that leads to lower NH₃-N concentrations in the rumen mix with CAL harvested in August [71]. Higher NH₃-N levels in June and July indicate rapid breakdown of protein, possibly due to greater CP availability in young plants. This observation is consistent with previous findings on forage maturity and nitrogen release [73].
TGP is an indicator of the efficiency of microbial fermentation. Higher TGP of CAL harvest in July suggests greater availability of fermentable carbohydrates compared to CAL harvests in June and August. Fermentable carbohydrates may have resulted in enhanced microbial activity, leading to increased VFA production in July. Furthermore, a positive relationship between total gas volume and VFA production was observed 12 to 72 hours following incubation. This finding aligns with results reported by Muck et al. [74] and Blümmel et al. [75], who also noted that high gas production corresponds to increased fermentation and VFA production.
Johnson et al. [76] reported that extensive fermentation of fiber carbohydrates is associated with increased hydrogen production, leading to greater methane formation. Additionally, as plants mature, methane production may increase during extended incubation periods due to a potential decline in the rate of in vitro gas production [77].
Over time, VFA production peaked between 48 and 72 hours with the most efficient fermentation seen in July, followed by June. The slowest fermentation rate was observed in August; however, the higher total VFA concentration at 9 hours suggests that certain fiber-degrading microbes were more active in the August treatment, leading to increased VFA production at this specific time. These results are generally consistent with previous findings on forage fermentation dynamics in cattle [78].
Topps et al. [78] previously reported that butyrate proportions remain relatively stable with advanced forage maturity, which is consistent with the trends observed in this study. Lower acetate-to-propionate ratios are associated with increased energy efficiency and are favorable for high beef production [73]. Increased propionate fermentation is considered more energy efficient than elevated acetate fermentation [79] as increased propionate production enhances the utilization of acetate at the tissue level and improves nitrogen retention [80]. In the present experiment, TGP, IVDMD, and total VFA production were low at later stages of plant maturity (August). This decline in fermentation efficiency was likely due to a decrease in nutritional value, in particular, an increase in the fiber content, as previously reported in similar studies [81].
In the experiment using CAL as the sole substrate, there was minimal variation in saponin concentrations across treatments in each serum bottle. Significant differences in CP and fiber content were observed, which may be related to the lower digestibility of CAL harvested in August. Despite the higher saponin content in the August harvest, no significant effect of saponins on methane production was observed. In fact, methane production was higher in August compared to June and July, suggesting that factors other than saponin content, such as CP and fiber composition, may influence fermentation and methane production.
4.3. Effect of Chenopodium album Substitution Levels on In Vitro Rumen Fermentation in Early Fattening Hanwoo
Saponins are known to influence rumen fermentation by reducing methane production and altering microbial populations, potentially improving protein utilization [82]. However, excessive saponin intake may have antinutritional effects, such as reducing feed intake or impairing microbial activity [83]. The moderate increase in saponin content in August could offer some functional benefits in rumen fermentation. Although the August harvest of CAL may not provide the same optimal nutritional profile as the July harvest, its inclusion provides a practical assessment of CAL’s potential as a viable feed substitute by considering variations in chemical composition across different harvest periods.
IVDMD results showed that moderate CAL levels (T1, T2 and T3) improved digestibility, but high substitution (T4) consistently had lower digestibility, suggesting that at higher inclusion levels (20%), factors such as secondary metabolites like saponins could limit microbial access to nutrients.
NDF and ADF decreased with increasing CAL substitution, which suggests improved digestibility. Lower fiber content in CAL suggests an improvement in digestibility parameters compared to traditional forages like rice straw [84,85]. The observed decrease in NDF and ADF with higher CAL substitution illustrates enhanced nutrient availability for the microbes within the rumen environment, subsequently improving fermentation efficiency [86]. This complementarity of feed substitutes like CAL illustrates their function as viable alternatives to traditional feeds.
The pH dynamics during fermentation signify meaningful alterations in microbial activity and fermentation patterns. A significant drop in pH across treatments indicates robust organic acid production, primarily attributed to the activity of fermentative bacteria [87].
TGP was highest in T4 at 3 hours, reflecting rapid fermentation of soluble carbohydrates. By 12 hours, T3 and T4 had the lower TGP, suggesting a slower fermentation rate at higher CAL substitutions.
Treatments with higher saponin content corresponded to variations in TGP rates, where high proportions of CAL reflected rapid fermentation initially, but later stages showed a tapering in gas output [86]. This slower rate of fermentation in high CAL groups could be corroborated by the inhibitory effects of excess saponins on fiber-degrading bacteria and methanogens, leading to shifts in the dynamics of microbial populations [86].
Regarding NH₃-N levels, early fermentation phases exhibited higher concentrations compared to controls, suggesting efficient protein breakdown [88]. Nevertheless, as fermentation continued, NH₃-N levels declined, likely due to enhanced microbial assimilation of nitrogen [89]. This shift underscores the importance of moderation in utilizing saponin-rich feeds for optimizing rumen functionality while avoiding excess protein degradation that leads to ammonia accumulation, an undesirable outcome in ruminant nutrition [90].
T3 (15% CAL) consistently had the lowest CH₄ production, supporting the shift toward more efficient propionate fermentation. T4 had higher CH₄ per g DMD, despite a reduction in IVDMD.
T2 (10% CAL) had the highest total VFA at 24h, showing optimal fermentation. Higher CAL substitution (T4) shifted fermentation toward propionate production, reducing the A/P ratio over time.
Saponins have been widely studied for their influence on rumen fermentation, particularly regarding their ability to mitigate methane production and alter microbial populations. Saponins reduce methane emissions through their interactions with rumen protozoa and methanogenic bacteria, often leading to a more favorable fermentation profile that emphasizes propionate production over methane [91,92]. The inclusion of saponins can therefore enhance protein utilization by redirecting available energy from methane production towards microbial growth, which has important implications for ruminant nutrition [93]. However, the effects of saponins can be dose-dependent; excessive saponin intake may inhibit microbial activity, leading to negative outcomes such as reduced feed intake and impaired fermentation dynamics [91].
The evidence suggests that incorporating moderate levels of CAL (10-15%) optimizes digestibility, fermentation efficiency, and microbial nitrogen utilization while simultaneously minimizing methane emissions [94]. However, exceeding this threshold (20% or more) could result in counterproductive fermentation dynamics, net increases in methane production, and decreases in microbial efficacy due to saponin toxicity. Thus, future studies might focus on elucidating the balancing act between saponin intake levels and subsequent fermentative outcomes to optimize the use of such plant secondary metabolites in ruminant diets.
5. Conclusions
The findings of this study provide compelling evidence that the harvest time and proportional substitution of Chenopodium album (CAL) in ruminant diets substantially affect rumen fermentation processes, methane production, and overall nutrient digestibility. Specifically, the August-harvested CAL was characterized by elevated saponin levels and increased structural carbohydrate content, which correlated with reduced digestibility and a compromise in total fermentation efficiency. Despite the suboptimal nutritional profile observed with the August harvest, its greater availability justified its selection for dietary substitution, allowing for practical applications in ruminant feeding strategies.
The assessment of CAL substitution levels revealed that elevating CAL inclusion in the diet was associated with a notable decrease in methane production (p < 0.05), with the 15% CAL substitution (T3) achieving the most pronounced reduction. The treatments involving low-level substitutions (T1 and T2, with 5% and 10% CAL, respectively) maximized fermentation efficiency, leading to the highest total volatile fatty acid (VFA) concentrations at the 24-hour mark. Notably, the decreasing acetate-to-propionate ratio with increasing levels of CAL underscores a metabolic shift towards more energetically favorable propionate production, thereby enhancing the conversion efficiency of dietary energy for microbial growth.
In conclusion, substituting up to 15% CAL in ruminant diets can markedly augment rumen fermentation efficiency while simultaneously mitigating methane emissions. However, higher substitutions (up to 20% CAL) may still confer advantages concerning prolonged fermentation dynamics, albeit with lower digestibility. These findings advocate for further research to investigate the long-term impacts of CAL dietary inclusion on animal performance, nutrient absorption, and overall health in vivo. Comprehensive evaluations incorporating various animal production systems and nutritional strategies will be critical to optimizing the use of CAL as a functional feed component in ruminant nutrition.
Author Contributions
Conceptualization: Chang-Hyun Kim, Narantuya Batburged, data curation: Narantuya Batburged, formal analysis: Narantuya Batburged, Hye-An Lee, Soo-Yeon Jung, In-Ki Kang, Da-Hyun Choi, methodology: Sang-Yoon Kim, Hye-An Lee, Soo-Yeon Jung, software: Narantuya Batburged, Sang-Yoon Kim, In-Ki Kang, validation: Chang-Hyun Kim, Gui-Seck Bae, Gurbazar Damdinsuren, Investigation: Chang-Hyun Kim, Narantuya Batburged, writing - original draft: Narantuya Batburged, Writing - Narantuya Batburged. All authors have read and agreed to the published version of the manuscript.
Funding
This study was conducted with the support of the Korea International Cooperation Agency (KOICA) and Hankyong National University (HKNU) as part of the “Capacity Building for Higher Education through the Industry-Academia Cooperation Project at the Mongolian University of Life Sciences” (Project period: 2022–2026). This work was also supported by the Korea Institute of Planning and Evaluation for Technology in Food, Agriculture and Forestry (IPET) through the Agriculture and Food Convergence Technologies Program for Research Manpower Development, funded by the Ministry of Agriculture, Food and Rural Affairs (MAFRA) (RS-2024-00400922).
Institutional Review Board Statement
Animal ethics number is 202304A-CNU-005, issued by Chungnam National University.
Informed Consent Statement
Not applicable.
Data Availability Statement
The raw data supporting the conclusions of this article will be made available by the authors on request.
Acknowledgments
The authors would like to thank KOICA, HKNU, IPET, and MAFRA for their support.
Conflicts of Interest
No potential conflict of interest relevant to this article was reported.
Abbreviations
The following abbreviations are used in this manuscript:
| CAL | Chenopodium Album L |
| CP | Crude Protein |
| NDF | Neutral Detergent Fiber |
| ADF | Acid Detergent Fiber |
| IVDMD | In Vitro Dry Matter Digestibility |
| A/P | Acetate to Propionate |
| VFA | Volatile Fatty Acid |
| GHG | Green House Gas |
| CO2 | Carbon dioxide |
| CH4 | Methane |
| GE | Gross Energy |
| OM | Organic Matter |
| DM | Dry matter |
| O2 | Oxygen |
| TGP | Total Gas Production |
| NH3-N | Ammonia-Nitrogen |
| EE | Ether Extract |
| CF | Crude Fiber |
| CA | Crude Ash |
| USA | United States America |
| SAS | Statistical Analysis System |
| GLM | General Linear Model |
| SEM | Standard Error of the Mean |
| CNU | Chungnam National University |
| IPET | Korea Institute of Planning and Evaluation for Technology in Food, Agriculture, and Forestry |
| MAFRA | Ministry of Agriculture, Food and Rural Affairs, Korea |
| KOICA | Korea International Cooperation Agency |
| HKNU | Hankyong National University |
References
- Tullo, E.; Finzi, A.; Guarino, M. Review: Environmental Impact of Livestock Farming and Precision Livestock Farming as a Mitigation Strategy. Sci. Total Environ. 2019, 650, 2751–2760. [Google Scholar] [CrossRef] [PubMed]
- Joos, F.; Prentice, I.C.; Sitch, S.; Meyer, R.; Hooss, G.; Plattner, G.-K.; Gerber, S.; Hasselmann, K. Global Warming Feedbacks on Terrestrial Carbon Uptake under the Intergovernmental Panel on Climate Change (IPCC) Emission Scenarios. Glob. Biogeochem. Cycles 2001, 15, 891–907. [Google Scholar] [CrossRef]
- Moss, A.R.; Jouany, J.-P.; Newbold, J. Methane Production by Ruminants: Its Contribution to Global Warming. Ann Zootech 2000, 49, 231–253. [Google Scholar] [CrossRef]
- Qin, Z.; Johnson, D.W.; Johnson, R.T. Cooperative Versus Competitive Efforts and Problem Solving. Rev. Educ. Res. 1995, 65, 129–143. [Google Scholar] [CrossRef]
- Coulter, J.K. World Agriculture: Towards 2015/2030. An FAO Perspective. Edited by J. Bruinsma. Rome: FAO and London: Earthscan (2003), Pp. 432,£ 35.00 Paperback. ISBN 92-5-104835-5. Exp. Agric. 2004, 40, 269. [Google Scholar] [CrossRef]
- Hur, S.N.; Lim, K.B.; Kim, D.A. Sustainable Roughage Production in Korea-Review. Asian-Australas. J. Anim. Sci. 1999, 12, 445–448. [Google Scholar] [CrossRef]
- Jeon, S.; Jeong, S.; Lee, M.; Seo, J.; Kam, D.K.; Kim, J.H.; Park, J.; Seo, S. Effects of Reducing Inclusion Rate of Roughages by Changing Roughage Sources and Concentrate Types on Intake, Growth, Rumen Fermentation Characteristics, and Blood Parameters of Hanwoo Growing Cattle (Bos Taurus Coreanae). Asian-Australas. J. Anim. Sci. 2019, 32, 1705–1714. [Google Scholar] [CrossRef] [PubMed]
- Risi, J.; Galwey, N.W.; Coaker, T.H. In Advances in Applied Biololgy. Chenopodium Grains Andes Inca Crops Mod. Agric. Acad. Landon 1984, 145–216. [Google Scholar]
- Han, K.-S.; Jung, T.-H.; Shin, K.-O. Studies on the General Analysis and Antioxidant Component Analysis of Chenopodium Album Var. Centrorubrum and Biochemical Analysis of Blood of Mice Administered C. Album. Korean J. Food Sci. Technol. 2019, 51, 492–498. [Google Scholar]
- Gohara, A.A.; Elmazar, M.M.A. Isolation of Hypotensive Flavonoids from Chenopodium Species Growing in Egypt. Phytother. Res. Int. J. Devoted Med. Sci. Res. Plants Plant Prod. 1997, 11, 564–567. [Google Scholar]
- Choudhary, S.P.; Sharma, D.K. Bioactive Constituents, Phytochemical and Pharmacological Properties of Chenopodium Album: A Miracle Weed. Int J Pharmacogn 2014, 1, 545–552. [Google Scholar]
- Carlsson, R.; Hanczakowski, P.; Partap, T.; Mathew, K.S.; Atul, K.V.R. Chenopodium Album in India, a Food Crop for the Production of Leaf Protein Concentrates. In Proceedings of the Proceedings of the International Conference of Leaf Protein Research, August 1985; pp. 22–24. [Google Scholar]
- Choo, Y.-S.; Song, S.-D. Ecophysiological Characteristics of Chenopodiaceous Plants-An Approach through Inorganic and Organic Solutes. Korean J. Ecol. 2000, 23, 397–406. [Google Scholar]
- Khurana, S.C.; Malik, Y.S.; Pandita, M.L. Herbicidal Control of Weeds in Potato Cv. Kufri Badshah. 1986. [Google Scholar]
- Bhattacharjee, S.K. Handbook of Medicinal Plants. No Title 1998. [Google Scholar]
- Arora, S.; Itankar, P. Extraction, Isolation and Identification of Flavonoid from Chenopodium Album Aerial Parts. J. Tradit. Complement. Med. 2018, 8, 476–482. [Google Scholar] [CrossRef]
- Chon, S.-U.; Heo, B.-G.; Park, Y.-S.; Kim, D.-K.; Gorinstein, S. Total Phenolics Level, Antioxidant Activities and Cytotoxicity of Young Sprouts of Some Traditional Korean Salad Plants. Plant Foods Hum. Nutr. 2009, 64, 25–31. [Google Scholar] [CrossRef] [PubMed]
- Liu, Y.; Ma, T.; Chen, D.; Zhang, N.; Si, B.; Deng, K.; Tu, Y.; Diao, Q. Effects of Tea Saponin Supplementation on Nutrient Digestibility, Methanogenesis, and Ruminal Microbial Flora in Dorper Crossbred Ewe. Animals 2019, 9. [Google Scholar] [CrossRef]
- Hristov, A.N.; McAllister, T.A.; Van Herk, F.H.; Cheng, K.-J.; Newbold, C.J.; Cheeke, P.R. Effect of Yucca Schidigera on Ruminal Fermentation and Nutrient Digestion in Heifers1. J. Anim. Sci. 1999, 77, 2554–2563. [Google Scholar] [CrossRef]
- Yadav, S.K.; Sehgal, S. In Vitro and in Vivo Availability of Iron from Bathua (Chenopodium Album) and Spinach (Spinacia Oleracia) Leaves. J. Food Sci. Technol. -Mysore- 2002, 39, 42–46. [Google Scholar]
- Wallace, R.J.; Arthaud, L.; Newbold, C.J. Influence of Yucca Shidigera Extract on Ruminal Ammonia Concentrations and Ruminal Microorganisms. Appl. Environ. Microbiol. 1994, 60, 1762–1767. [Google Scholar] [CrossRef]
- Kim, P.-N.; Jeong, C.-S. Anti-Gastritis and Anti-Oxidant Effects of Chenopodium Album Linne Fractions and Betaine. Biomol. Ther. 2010, 18, 433–441. [Google Scholar] [CrossRef]
- Dai, Y.; Ye, W.C.; Wang, Z.T.; Matsuda, H.; Kubo, M.; But, P.P.H. Antipruritic and Antinociceptive Effects of Chenopodium Album L. in Mice. J. Ethnopharmacol. 2002, 81, 245–250. [Google Scholar] [CrossRef] [PubMed]
- Khoobchandani, M.; Ojeswi, B.K.; Sharma, B.; Srivastava, M.M. Chenopodium Album Prevents Progression of Cell Growth and Enhances Cell Toxicity in Human Breast Cancer Cell Lines. Oxid. Med. Cell. Longev. 2009, 2, 160–165. [Google Scholar] [CrossRef]
- Kim, P.; Jeong, C.-S. Effects of Chenopodium Album Linne on Gastritis and Gastric Cancer Cell Growth. Biomol. Ther. 2011, 19, 487–492. [Google Scholar] [CrossRef]
- Graf, B.L.; Poulev, A.; Kuhn, P.; Grace, M.H.; Lila, M.A.; Raskin, I. Quinoa Seeds Leach Phytoecdysteroids and Other Compounds with Anti-Diabetic Properties. Food Chem. 2014, 163, 178–185. [Google Scholar] [CrossRef]
- Horio, T.; Yoshida, K.; Kikuchi, H.; Kawabata, J.; Mizutani, J. A Phenolic Amide from Roots of Chenopodium Album. Phytochemistry 1993, 33, 807–808. [Google Scholar] [CrossRef]
- Lavaud, C.; Voutquenne, L.; Bal, P.; Pouny, I. Saponins from Chenopodium Album. Fitoterapia 2000, 71, 338–340. [Google Scholar] [CrossRef]
- Cutillo, F.; D’Abrosca, B.; DellaGreca, M.; Di Marino, C.; Golino, A.; Previtera, L.; Zarrelli, A. Cinnamic Acid Amides from Chenopodium Album: Effects on Seeds Germination and Plant Growth. Phytochemistry 2003, 64, 1381–1387. [Google Scholar] [CrossRef]
- Cutillo, F.; D’Abrosca, B.; DellaGreca, M.; Zarrelli, A. Chenoalbicin, a Novel Cinnamic Acid Amide Alkaloid from Chenopodium Album. Chem. Biodivers. 2004, 1, 1579–1583. [Google Scholar] [CrossRef]
- DellaGreca, M.; Di Marino, C.; Zarrelli, A.; D’Abrosca, B. Isolation and Phytotoxicity of Apocarotenoids from Chenopodium a Lbum. J. Nat. Prod. 2004, 67, 1492–1495. [Google Scholar] [CrossRef]
- Cutillo, F.; DellaGreca, M.; Gionti, M.; Previtera, L.; Zarrelli, A. Phenols and Lignans from Chenopodium Album. Phytochem. Anal. Int. J. Plant Chem. Biochem. Tech. 2006, 17, 344–349. [Google Scholar] [CrossRef] [PubMed]
- Goel, G.; Makkar, H.P.S. Methane Mitigation from Ruminants Using Tannins and Saponins. Trop. Anim. Health Prod. 2012, 44, 729–739. [Google Scholar] [CrossRef] [PubMed]
- Dębski; Bogdan i Comparison of Antioxidant Potential and Mineral Composition of Quinoa and Lamb’s Quarters Weed ( Chenopodium Album ). Probl. Hig. Epidemiol. 2018, 99, 88–93.
- Tang, W.; Guo, H.; Yin, J.; Ding, X.; Xu, X.; Wang, T.; Yang, C.; Xiong, W.; Zhong, S.; Tao, Q. Germination Ecology of Chenopodium Album L. and Implications for Weed Management. PloS One 2022, 17, e0276176. [Google Scholar] [CrossRef] [PubMed]
- Damdinsuren, G. The issue of feed preparation of some species for undesirable plants. Ph.D Dissertation, Mongolian University of Life Sciences, Ulaanbaatar, Mongolia, 2016. [Google Scholar]
- Poonia, A.; Upadhayay, A. Chenopodium Album Linn: Review of Nutritive Value and Biological Properties. J. Food Sci. Technol. 2015, 52, 3977–3985. [Google Scholar] [CrossRef]
- Prakash, D.; Pal, M. Chenopodium: Seed Protein, Fractionation and Amino Acid Composition. Int. J. Food Sci. Nutr. 1998, 49, 271–275. [Google Scholar] [CrossRef]
- Bhargava, A.; Shukla, S.; Ohri, D. Genetic Variability and Heritability of Selected Traits during Different Cuttings of Vegetable Chenopodium. INDIAN J. Genet. PLANT Breed. 2003, 63, 359–360. [Google Scholar]
- McDougall, E.I. Studies on Ruminant Saliva. 1. The Composition and Output of Sheep’s Saliva. Biochem. J. 1948, 43, 99. [Google Scholar] [CrossRef]
- AOAC. Official Methods of Analysis of AOAC INTERNATIONAL, 21st Ed. ed; AOAC International: Washington, DC, 2019. [Google Scholar]
- Van Soest, P.J.; Robertson, J.B.; Lewis, B.A. Methods for Dietary Fiber, Neutral Detergent Fiber, and Nonstarch Polysaccharides in Relation to Animal Nutrition. J. Dairy Sci. 1991, 74, 3583–3597. [Google Scholar] [CrossRef]
- Le Bot, M.; Thibault, J.; Pottier, Q.; Boisard, S.; Guilet, D. An Accurate, Cost-Effective and Simple Colorimetric Method for the Quantification of Total Triterpenoid and Steroidal Saponins from Plant Materials. Food Chem. 2022, 383, 132597. [Google Scholar] [CrossRef]
- Beuvink, J.M.W.; Spoelstra, S.F. Interactions between Substrate, Fermentation End-Products, Buffering Systems and Gas Production upon Fermentation of Different Carbohydrates by Mixed Rumen Microorganisms in Vitro. Appl. Microbiol. Biotechnol. 1992, 37, 505–509. [Google Scholar] [CrossRef]
- Kim, S.Y.; Lee, J.H.; Song, J.Y.; Bae, G.S.; Lee, M.H.; Jung, S.Y.; Kim, E.J. Effects of Energy Feed Sources on Hanwoo Rumen Fermentation Characteristics and Microbial Amino Acids Composition in Vitro. Ann Anim Res Sci 2022, 33, 94–104. [Google Scholar] [CrossRef]
- Chaney, A.L.; Marbach, E.P. Modified Reagents for Determination of Urea and Ammonia. Clin. Chem. 1962, 8, 130–132. [Google Scholar] [CrossRef]
- SAS, S. V9. 4 User’s Guide. SAS Inst. Inc Cary NC 2013. [Google Scholar]
- Fan, W.; Yuan, L.; Qu, X. CFD Simulation of Hydrodynamic Behaviors and Aerobic Sludge Granulation in a Stirred Tank with Lower Ratio of Height to Diameter. Biochem. Eng. J. 2018, 137, 78–94. [Google Scholar] [CrossRef]
- Sikora, M.C.; Hatfield, R.D.; Kalscheur, K.F. Fermentation and Chemical Composition of High-Moisture Lucerne Leaf and Stem Silages Harvested at Different Stages of Development Using a Leaf Stripper. Grass Forage Sci. 2019, 74, 254–263. [Google Scholar] [CrossRef]
- Palmonari, A.; Fustini, M.; Canestrari, G.; Grilli, E.; Formigoni, A. Influence of Maturity on Alfalfa Hay Nutritional Fractions and Indigestible Fiber Content. J. Dairy Sci. 2014, 97, 7729–7734. [Google Scholar] [CrossRef]
- Yari, M.; Valizadeh, R.; Naserian, A.A.; Jonker, A.; Azarfar, A.; Yu, P. Effects of Including Alfalfa Hay Cut in the Afternoon or Morning at Three Stages of Maturity in High Concentrate Rations on Dairy Cows Performance, Diet Digestibility and Feeding Behavior. Anim. Feed Sci. Technol. 2014, 192, 62–72. [Google Scholar] [CrossRef]
- Ebeid, H.M.; Kholif, A.E.; El-Bordeny, N.; Chrenkova, M.; Mlynekova, Z.; Hansen, H.H. Nutritive Value of Quinoa (Chenopodium Quinoa) as a Feed for Ruminants: In Sacco Degradability and in Vitro Gas Production. Environ. Sci. Pollut. Res. 2022, 29, 35241–35252. [Google Scholar] [CrossRef]
- Adedapo, A.; Jimoh, F.; Afolayan, A. Comparison of the Nutritive Value and Biological Activities of the Acetone, Methanol and Water Extracts of the Leaves of Bidens Pilosa and Chenopodium Album. Acta Pol. Pharm. 2011, 68, 83–92. [Google Scholar]
- Singh, L.; Yadav, N.; Kumar, A.R.; Gupta, A.K.; Chacko, J.; Parvin, K.; Tripathi, U. Preparation of Value Added Products from Dehydrated Bathua Leaves (Chenopodium Album Linn.). 2007. [Google Scholar]
- Odhav, B.; Beekrum, S.; Akula, U.S.; Baijnath, H. Preliminary Assessment of Nutritional Value of Traditional Leafy Vegetables in KwaZulu-Natal, South Africa. J. Food Compos. Anal. 2007, 20, 430–435. [Google Scholar] [CrossRef]
- Peiretti, P.G.; Gai, F.; Tassone, S. Fatty Acid Profile and Nutritive Value of Quinoa (Chenopodium Quinoa Willd.) Seeds and Plants at Different Growth Stages. Anim. Feed Sci. Technol. 2013, 183, 56–61. [Google Scholar] [CrossRef]
- Afolayan, A.J.; Jimoh, F.O. Nutritional Quality of Some Wild Leafy Vegetables in South Africa. Int. J. Food Sci. Nutr. 2009, 60, 424–431. [Google Scholar] [CrossRef]
- YILDIRIM, E.; DURSUN, A.; TURAN, M. Determination of the Nutrition Contents of the Wild Plants Used as Vegetables in Upper Coruh Valley. Turk. J. Bot. 2001, 25, 367–371. [Google Scholar]
- Oguntona, C.R.; Razaq, M.A.; Akintola, T.T. Pattern of Dietary Intake and Consumption of Street Foods among Nigerian Students. Nutr. Health 1998, 12, 247–256. [Google Scholar] [CrossRef] [PubMed]
- Szakiel, A.; Pączkowski, C.; Henry, M. Influence of Environmental Abiotic Factors on the Content of Saponins in Plants. Phytochem. Rev. 2011, 10, 471–491. [Google Scholar] [CrossRef]
- Anseong Climate.
- Pecetti, L.; Tava, A.; Romani, M.; Benedetto, M.G.D.; Corsi, P. Variety and Environment Effects on the Dynamics of Saponins in Lucerne (Medicago Sativa L.). Eur. J. Agron. 2006, 25, 187–192. [Google Scholar] [CrossRef]
- Sylwia, G.; Leszczynski, B.; Wieslaw, O. Effect of Low and High-Saponin Lines of Alfalfa on Pea Aphid. J. Insect Physiol. 2006, 52, 737–743. [Google Scholar] [CrossRef]
- Budan, A.; Tessier, N.; Saunier, M.; Gillmann, L.; Hamelin, J.; Chicoteau, P.; Richomme, P.; Guilet, D. Effect of Several Saponin Containing Plant Extracts on Rumen Fermentation in Vitro, Tetrahymena Pyriformis and Sheep Erythrocytes. J. Food Agric. Environ. 2013, 11, 576–582. [Google Scholar]
- Oakenfull, D. Saponins in Food—A Review. Food Chem. 1981, 7, 19–40. [Google Scholar] [CrossRef]
- Balde, A.T.; Vandersall, J.H.; Erdman, R.A.; Reeves, J.B.; Glenn, B.P. Effect of Stage of Maturity of Alfalfa and Orchardgrass on in Situ Dry Matter and Crude Protein Degradability and Amino Acid Composition. Anim. Feed Sci. Technol. 1993, 44, 29–43. [Google Scholar] [CrossRef]
- Yu, P.; Christensen, D.A.; McKinnon, J.J.; Markert, J.D. Effect of Variety and Maturity Stage on Chemical Composition, Carbohydrate and Protein Subfractions, in Vitro Rumen Degradability and Energy Values of Timothy and Alfalfa. Can. J. Anim. Sci. 2003, 83, 279–290. [Google Scholar] [CrossRef]
- Tang, S.X.; Tayo, G.O.; Tan, Z.L.; Sun, Z.H.; Wang, M.; Ren, G.P.; Han, X.F. Use of In Vitro Gas Production Technique to Investigate Interactions between Rice Straw, Wheat Straw, Maize Stover and Alfalfa or Clover. Asian-Australas J Anim Sci 2008, 21, 1278–1285. [Google Scholar] [CrossRef]
- Soest, P.J.V. Rice Straw, the Role of Silica and Treatments to Improve Quality. Anim. Feed Sci. Technol. 2006, 130, 137–171. [Google Scholar] [CrossRef]
- Mir, P.S.; Mir, Z.; Broersma, K.; Bittman, S.; Hall, J.W. Prediction of Nutrient Composition and in Vitro Dry Matter Digestibility from Physical Characteristics of Forages. Anim. Feed Sci. Technol. 1995, 55, 275–285. [Google Scholar] [CrossRef]
- Van Soest, P.J. Nutritional Ecology of the Ruminant, 2nd ed.; Cornell University Press, 1994; ISBN 978-0-8014-2772-5. [Google Scholar]
- McDonald, P.; Greenhalgh, J.F.D.; Morgan, C.A.; Greenhalgh, J.F.D.; Morgan, C.A.; Edwards, R.; Sinclair, L.; Wilkinson, R. Animal Nutrition, 7th ed.; 2010; ISBN 978-1-4082-0427-6. [Google Scholar]
- Adams, D.C.; Cochran, R.C.; Currie, P.O. Forage Maturity Effects on Rumen Fermentation, Fluid Flow, and Intake in Grazing Steers. Rangel. Ecol. Manag. Range Manag. Arch. 1987, 40, 404–408. [Google Scholar] [CrossRef]
- Muck, R.E.; Filya, I.; Contreras-Govea, F.E. Inoculant Effects on Alfalfa Silage: In Vitro Gas and Volatile Fatty Acid Production. J. Dairy Sci. 2007, 90, 5115–5125. [Google Scholar] [CrossRef]
- Blümmel, M.; Makkar, H.P.S.; Becker, K. In Vitro Gas Production: A Technique Revisited. J. Anim. Physiol. Anim. Nutr. 1997, 77, 24–34. [Google Scholar] [CrossRef]
- Johnson, K.A.; Johnson, D.E. Methane Emissions from Cattle. J. Anim. Sci. 1995, 73, 2483–2492. [Google Scholar] [CrossRef]
- Wilman, D.; Foulkes, G.R.; Givens, D.I. The Rate and Extent of Cell-Wall Degradation in Vitro for 40 Silages Varying in Composition and Digestibility. Anim. Feed Sci. Technol. 1996, 63, 111–122. [Google Scholar] [CrossRef]
- Topps, J.H.; Reed, W.D.C.; Elliott, R.C. The Effect of Season and of Supplementary Feeding on the Rumen Contents of African Cattle Grazing Subtropical Herbage:II. pH Values and Concentration and Proportions of Volatile Fatty Acids. J. Agric. Sci. 1965, 64, 397–402. [Google Scholar] [CrossRef]
- Hungate, R.E. The Rumen and Its Microbes; Elsevier, 2013; ISBN 1-4832-6362-2. [Google Scholar]
- Eskeland, B.; Pfander, W.H.; Preston, R.L. Intravenous Energy Infusion in Lambs: Effects on Nitrogen Retentin, Plasma Free Amino Acids and Plasma Urea Nitrogen. Br. J. Nutr. 1974, 31, 201–211. [Google Scholar] [CrossRef]
- Abbasi, D.; Rouzbehan, Y.; Rezaei, J. Effect of Harvest Date and Nitrogen Fertilization Rate on the Nutritive Value of Amaranth Forage (Amaranthus Hypochondriacus). Anim. Feed Sci. Technol. 2012, 171, 6–13. [Google Scholar] [CrossRef]
- Patra, A.K.; Saxena, J. The Effect and Mode of Action of Saponins on the Microbial Populations and Fermentation in the Rumen and Ruminant Production. Nutr. Res. Rev. 2009, 22, 204–219. [Google Scholar] [CrossRef]
- Wina, E.; Muetzel, S.; Becker, K. The Impact of Saponins or Saponin-Containing Plant Materials on Ruminant ProductionA Review. J. Agric. Food Chem. 2005, 53, 8093–8105. [Google Scholar] [CrossRef]
- Wang, X.; Song, J.; Liu, Z.; Zhang, G.; Zhang, Y. Fermentation Quality and Microbial Community of Corn Stover or Rice Straw Silage Mixed With Soybean Curd Residue. Animals 2022, 12, 919. [Google Scholar] [CrossRef] [PubMed]
- Gunun, P.; Gunun, N.; Khejornsart, P.; Ouppamong, T.; Cherdthong, A.; Wanapat, M.; Sirilaophaisan, S.; Yuangklang, C.; Polyorach, S.; Kenchaiwong, W.; et al. Effects Of Antidesma Thwaitesianum Muell. Arg. Pomace as a Source of Plant Secondary Compounds on Digestibility, Rumen Environment, Hematology, and Milk Production in Dairy Cows. Anim. Sci. J. 2018, 90, 372–381. [Google Scholar] [CrossRef]
- Belanche, A.; Pinloche, E.; Preskett, D.; Newbold, C.J. Effects and Mode of Action of Chitosan and Ivy Fruit Saponins on the Microbiome, Fermentation and Methanogenesis in the Rumen Simulation Technique. Fems Microbiol. Ecol. 2015, fiv160. [Google Scholar] [CrossRef] [PubMed]
- Li, M.; Zi, X.; Zhou, H.; Lv, R.; Tang, J.; Cai, Y. Silage Fermentation and Ruminal Degradation of Cassava Foliage Prepared With Microbial Additive. Amb Express 2019, 9. [Google Scholar] [CrossRef]
- Pk, M. Effect of Individual vs. Combined Supplementation of Tamarind Seed Husk and Soapnut on Methane Production, Feed Fermentation and Protozoal Population in Vitro. Approaches Poult. Dairy Vet. Sci. 2019, 6. [Google Scholar] [CrossRef]
- Ampapon, T.; Phesatcha, K.; Wanapat, M. Effects of Phytonutrients on Ruminal Fermentation, Digestibility, and Microorganisms in Swamp Buffaloes. Animals 2019, 9, 671. [Google Scholar] [CrossRef] [PubMed]
- Shokryzadan, P.; Rajion, M.A.; Goh, Y.M.; Ishak, I.; Ramlee, M.F.; Jahromi, M.F.; Ebrahimi, M. Mangosteen Peel Can Reduce Methane Production and Rumen Biohydrogenation in Vitro. South Afr. J. Anim. Sci. 2016, 46, 419. [Google Scholar] [CrossRef]
- Yuliana, P.; Laconi, E.B.; Jayanegara, A.; Achmadi, S.S.; Samsudin, A.A. Effect of Napier Grass Supplemented With Gliricidia Sepium, Sapindus Rarak or Hibiscus Rosa-Sinensis on in Vitro Rumen Fermentation Profiles and Methanogenesis. J. Indones. Trop. Anim. Agric. 2019, 44, 167. [Google Scholar] [CrossRef]
- Wu, H.; Meng, Q.; Zhou, Z.; Yu, Z. Ferric Citrate, Nitrate, Saponin and Their Combinations Affect in Vitro Ruminal Fermentation, Production of Sulphide and Methane and Abundance of Select Microbial Populations. J. Appl. Microbiol. 2019, 127, 150–158. [Google Scholar] [CrossRef] [PubMed]
- Kholif, A.E. A Review of Effect of Saponins on Ruminal Fermentation, Health and Performance of Ruminants. Vet. Sci. 2023, 10. [Google Scholar] [CrossRef]
- Hundal, J.S.; Wadhwa, M.; Bakshi, M.P.S. Effect of Herbal Feed Additives Containing Saponins on Rumen Fermentation Pattern. Indian J. Anim. Sci. 2020, 90, 237–243. [Google Scholar] [CrossRef]
Figure 1.
Procedure of in vitro batch culture experiment.
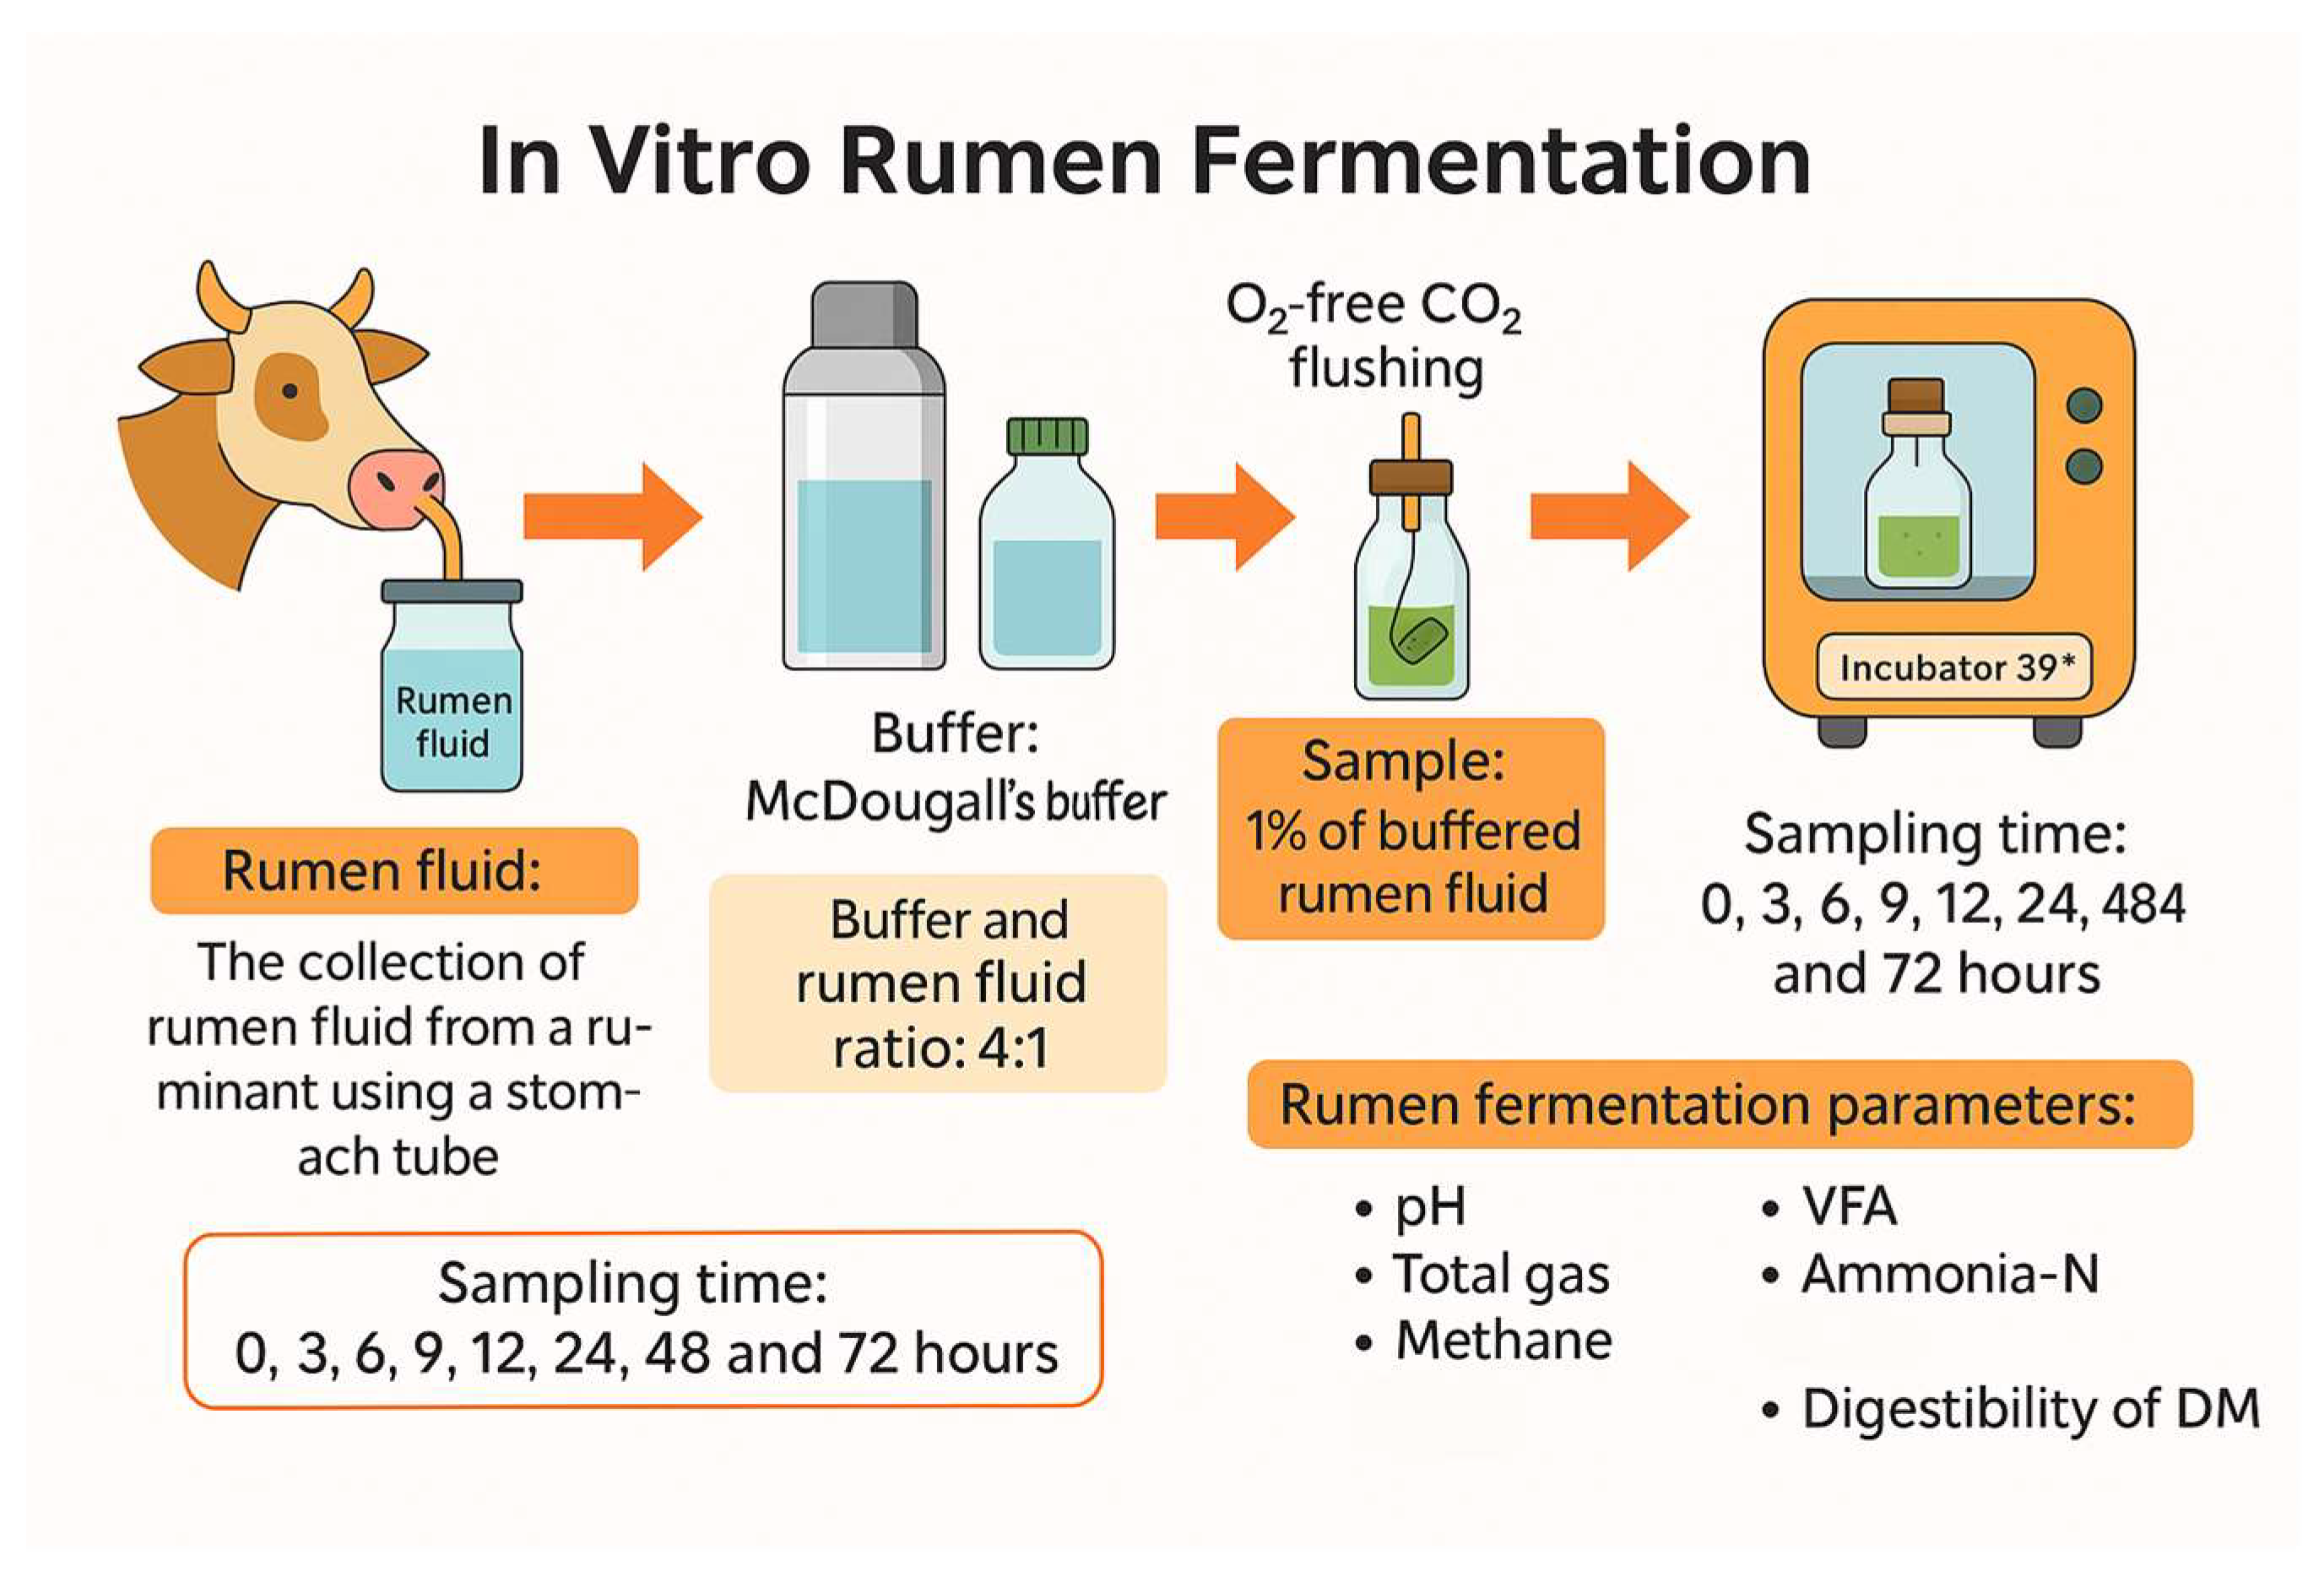

Table 1.
Chemical composition of individual feed ingredients and treatment diets for the second in vitro batch culture experiment.
Table 1.
Chemical composition of individual feed ingredients and treatment diets for the second in vitro batch culture experiment.
| Treatment/Feed | Ingredients (%) | Chemical compositions (% DM) | |||||||
|---|---|---|---|---|---|---|---|---|---|
| Rice straw | CAL | Concentrate | Dry matter | Crude protein | Ether extract | Crude ash | NDF1 | ADF2 | |
| Control (C) | 30 | 0 | 70 | 99.53 | 13.96 | 6.20 | 6.65 | 41.80 | 21.92 |
| T1 | 25 | 5 | 70 | 99.52 | 14.40 | 6.21 | 6.50 | 40.83 | 21.25 |
| T2 | 20 | 10 | 70 | 99.51 | 14.83 | 6.23 | 6.34 | 39.87 | 20.59 |
| T3 | 15 | 15 | 70 | 99.50 | 15.26 | 6.25 | 6.19 | 38.90 | 19.92 |
| T4 | 10 | 20 | 70 | 99.50 | 15.69 | 6.27 | 6.03 | 37.93 | 19.25 |
| Rice straw | 99.70 | 3.87 | 1.82 | 7.50 | 73.34 | 47.22 | |||
| CAL (August) | 99.55 | 12.49 | 2.18 | 4.57 | 54.01 | 33.87 | |||
| Concentrate | 99.45 | 18.29 | 8.07 | 6.29 | 28.28 | 11.08 | |||
1Neutral detergent acid; 2Acid detergent acid.
Table 2.
Chemical compositions of Chenopodium album.
| Harvested time | Moisture (%) | Crude protein | Ether extract | Crude ash | Crude fiber | NDF1 | ADF2 |
|---|---|---|---|---|---|---|---|
| (% DM) | |||||||
| June | 80.83a | 18.73a | 4.92a | 4.57a | 17.36c | 43.04c | 21.69c |
| July | 79.52b | 13.24b | 1.96b | 3.71b | 18.78b | 43.95b | 27.53b |
| August | 62.50c | 12.49b | 2.18b | 4.40a | 26.09a | 54.01a | 33.87a |
| SEM3 | 0.360 | 0.360 | 0.130 | 0.130 | 0.240 | 0.220 | 0.210 |
| p-value | <.0001 | <.0001 | <.0001 | 0.0072 | <.0001 | <.0001 | <.0001 |
1Neutral detergent acid; 2Acid detergent acid; 3Standard Error of the Means.
Table 3.
Saponin content of Chenopodium album and second experimental diets.
| Harvest time | Saponins (%) |
|---|---|
| June | 6.597 |
| July | 6.619 |
| August | 7.047 |
| Treatment1 | |
| Control | 0.00 |
| T1 | 0.21 |
| T2 | 0.42 |
| T3 | 0.63 |
| T4 | 0.85 |
1Substitution levels of Chenopodium album harvested in August by percentage: Control (0), T1 (5), T2 (10), T3 (15), and T4 (20).
Table 4.
Effect of Chenopodium album sole substrates on pH, in vitro dry matter digestibility (IVDMD), and ammonia-Nitrogen (NH₃-N) concentration.
Table 4.
Effect of Chenopodium album sole substrates on pH, in vitro dry matter digestibility (IVDMD), and ammonia-Nitrogen (NH₃-N) concentration.
| Incubation time (h) | Treatments1 | SEM2 | p-value | ||
|---|---|---|---|---|---|
| June | July | August | |||
| pH | |||||
| 0 | 7.01a | 7.01a | 6.99b | 0.005 | 0.0370 |
| 3 | 6.77 | 6.77 | 6.79 | 0.008 | 0.1850 |
| 6 | 6.83a | 6.73b | 6.71b | 0.014 | 0.0021 |
| 9 | 6.69 | 6.68 | 6.70 | 0.006 | 0.0095 |
| 12 | 6.72a | 6.67b | 6.65b | 0.011 | 0.0102 |
| 24 | 6.65b | 6.63b | 6.67a | 0.004 | 0.0027 |
| 48 | 6.70b | 6.65c | 6.75a | 0.006 | <.0001 |
| 72 | 6.78a | 6.71b | 6.74b | 0.011 | 0.0083 |
| IVDMD (%) | |||||
| 3 | 38.09a | 37.31b | 31.92c | 0.055 | <.0001 |
| 6 | 41.06a | 38.82b | 30.87c | 0.160 | <.0001 |
| 9 | 46.50a | 41.76b | 35.76c | 0.181 | <.0001 |
| 12 | 55.32a | 45.93b | 40.49c | 0.916 | <.0001 |
| 24 | 72.87a | 68.48b | 52.35c | 0.157 | <.0001 |
| 48 | 77.64a | 73.59b | 62.00c | 0.186 | <.0001 |
| 72 | 82.62a | 72.14b | 60.99c | 0.209 | <.0001 |
| NH3-N (mg/100mL) | |||||
| 0 | 2.47a | 1.57c | 1.83b | 0.058 | <.0001 |
| 3 | 3.8 | 3.7 | 3.53 | 0.090 | 0.1890 |
| 6 | 3.4 | 3.47 | 3.27 | 0.079 | 0.2690 |
| 9 | 2.8 | 2.6 | 2.9 | 0.094 | 0.1517 |
| 12 | 2.40b | 2.60a | 2.23b | 0.050 | 0.0066 |
| 24 | 4.70a | 3.56b | 4.96a | 0.250 | 0.0153 |
| 48 | 11.00a | 11.00a | 8.97b | 0.366 | 0.0115 |
| 72 | 17.50a | 15.30b | 14.10c | 0.111 | <.0001 |
1Sole substrates of Chenopodium album by harvested time: June, July, and August; 2Standard Error of the Means.
Table 5.
Effect of Chenopodium album sole substrates on in vitro total gas (TGP) and methane (CH4) production.
Table 5.
Effect of Chenopodium album sole substrates on in vitro total gas (TGP) and methane (CH4) production.
| Incubation time (h) | Treatments1 | SEM2 | p-value | ||
|---|---|---|---|---|---|
| June | July | August | |||
| TGP (mL/g DM) | |||||
| 3 | 10.59b | 12.22a | 10.22b | 0.321 | 0.0098 |
| 6 | 18.96 | 19.96 | 19.46 | 0.415 | 0.3025 |
| 9 | 24.13 | 22.18 | 21.34 | 0.925 | 0.1711 |
| 12 | 40.06b | 43.89a | 42.11ab | 0.643 | 0.0161 |
| 24 | 79.91b | 91.68a | 75.78b | 1.490 | 0.0007 |
| 48 | 104.44b | 122.60a | 81.24c | 1.668 | <.0001 |
| 72 | 119.74b | 136.52a | 107.17c | 1.518 | <.0001 |
| CH4, (mL/g DMD) | |||||
| 3 | 0.61c | 1.00a | 0.88b | 0.009 | <.0001 |
| 6 | 1.35c | 2.03b | 2.93a | 0.076 | <.0001 |
| 9 | 2.33c | 3.01b | 3.97a | 0.074 | <.0001 |
| 12 | 5.46c | 6.54b | 8.04a | 0.154 | <.0001 |
| 24 | 12.33c | 15.88b | 18.31a | 0.285 | <.0001 |
| 48 | 16.64c | 24.84a | 19.04b | 0.112 | <.0001 |
| 72 | 23.49b | 29.57a | 26.53ab | 1.074 | 0.0202 |
1Sole substrates of Chenopodium album by harvested time: June, July, and August; 2Standard Error of the Means.
Table 6.
Effect of Chenopodium album sole substrates on in vitro volatile fatty acids (VFAs) production.
Table 6.
Effect of Chenopodium album sole substrates on in vitro volatile fatty acids (VFAs) production.
| Incubation time (h) | Treatment1 | SEM2 | p-value | ||
|---|---|---|---|---|---|
| June | July | August | |||
| Total VFA (mM) | |||||
| 0 | 33.01a | 33.16a | 32.20b | 0.089 | 0.0006 |
| 3 | 41.89a | 41.58ab | 41.19b | 0.129 | 0.0242 |
| 6 | 39.14a | 39.10a | 37.65b | 0.394 | 0.0414 |
| 9 | 38.77c | 43.29b | 44.28a | 0.261 | <.0001 |
| 12 | 52.46b | 60.66a | 53.10b | 0.215 | <.0001 |
| 24 | 75.06a | 73.57a | 67.55b | 0.449 | <.0001 |
| 48 | 99.28a | 99.67a | 86.93b | 0.262 | <.0001 |
| 72 | 102.65b | 103.87a | 94.82c | 0.239 | <.0001 |
| Acetate (%) | |||||
| 0 | 61.21a | 60.93a | 60.32b | 0.088 | 0.0010 |
| 3 | 62.92a | 61.45b | 61.80b | 0.146 | 0.0009 |
| 6 | 61.99 | 61.00 | 62.17 | 0.391 | 0.1527 |
| 9 | 63.74a | 62.66b | 62.24c | 0.061 | <.0001 |
| 12 | 65.15 | 65.01 | 64.86 | 0.116 | 0.2669 |
| 24 | 67.35a | 65.70b | 66.18b | 0.245 | 0.0080 |
| 48 | 66.58a | 66.50a | 65.18b | 0.097 | <.0001 |
| 72 | 66.75a | 65.87b | 65.89b | 0.073 | 0.0002 |
| Propionate (%) | |||||
| 0 | 17.69 | 17.80 | 18.14 | 0.049 | 0.0016 |
| 3 | 19.25 | 20.24 | 19.76 | 0.103 | 0.0015 |
| 6 | 18.97 | 20.18 | 18.47 | 0.151 | 0.0005 |
| 9 | 18.67b | 19.37a | 18.12c | 0.129 | 0.0014 |
| 12 | 19.31b | 19.77a | 19.27b | 0.081 | 0.0079 |
| 24 | 18.84b | 20.10a | 18.29b | 0.264 | 0.0073 |
| 48 | 18.81a | 18.52b | 18.94a | 0.078 | 0.0241 |
| 72 | 18.53a | 18.59a | 17.98b | 0.099 | 0.0090 |
| Iso-butyrate (%) | |||||
| 0 | 3.36b | 3.37b | 3.45a | 0.012 | 0.0027 |
| 3 | 2.75b | 2.77ab | 2.79a | 0.010 | 0.1106 |
| 6 | 2.96 | 2.97 | 3.05 | 0.031 | 0.1557 |
| 9 | 2.92a | 2.71b | 2.42c | 0.020 | <.0001 |
| 12 | 2.26a | 2.00b | 2.24a | 0.020 | 0.0001 |
| 24 | 1.76b | 1.81b | 1.94a | 0.014 | 0.0002 |
| 48 | 1.78b | 1.71c | 1.89a | 0.003 | <.0001 |
| 72 | 1.88a | 1.81b | 1.89a | 0.014 | 0.0142 |
| Butyrate (%) | |||||
| 0 | 11.32b | 11.50a | 11.55a | 0.025 | 0.0013 |
| 3 | 9.85b | 10.21a | 10.29a | 0.030 | <.0001 |
| 6 | 10.36 | 10.07 | 10.42 | 0.172 | 0.3739 |
| 9 | 9.16b | 9.94a | 9.19b | 0.104 | 0.0029 |
| 12 | 8.79b | 9.02a | 9.10a | 0.057 | 0.0201 |
| 24 | 8.04c | 8.30b | 9.02a | 0.043 | <.0001 |
| 48 | 8.32c | 8.93b | 9.51a | 0.101 | 0.0005 |
| 72 | 8.14b | 9.22a | 9.31a | 0.045 | <.0001 |
| Iso-valerate (%) | |||||
| 0 | 3.57b | 3.58b | 3.65a | 0.008 | 0.0011 |
| 3 | 2.97 | 3.00 | 3.01 | 0.014 | 0.1394 |
| 6 | 3.19 | 3.15 | 3.24 | 0.043 | 0.4181 |
| 9 | 3.01a | 2.89b | 2.54c | 0.024 | <.0001 |
| 12 | 2.40a | 2.21b | 2.40a | 0.009 | <.0001 |
| 24 | 2.13b | 2.11b | 2.49a | 0.028 | 0.0001 |
| 48 | 2.59b | 2.49c | 2.66a | 0.016 | 0.0008 |
| 72 | 2.88a | 2.80b | 2.92a | 0.016 | 0.0023 |
| Valerate (%) | |||||
| 0 | 2.86b | 2.83c | 2.89a | 0.005 | 0.0003 |
| 3 | 2.3 | 2.34 | 2.35 | 0.015 | 0.1207 |
| 6 | 2.54 | 2.54 | 2.65 | 0.035 | 0.0989 |
| 9 | 2.48a | 2.42b | 2.19c | 0.015 | <.0001 |
| 12 | 2.08b | 1.95c | 2.13a | 0.006 | <.0001 |
| 24 | 1.92b | 1.96b | 2.10a | 0.022 | 0.0027 |
| 48 | 1.83b | 1.83b | 1.97a | 0.006 | <.0001 |
| 72 | 1.87b | 1.90b | 1.98a | 0.011 | 0.0011 |
| A: P3 ratio | |||||
| 0 | 3.46a | 3.42a | 3.33b | 0.014 | 0.0014 |
| 3 | 3.27a | 3.04c | 3.13b | 0.023 | 0.0011 |
| 6 | 3.27a | 3.02b | 3.37a | 0.047 | 0.0051 |
| 9 | 3.41b | 3.24b | 3.24b | 0.019 | 0.0009 |
| 12 | 3.38a | 3.29b | 3.37a | 0.019 | 0.0345 |
| 24 | 3.58a | 3.27b | 3.62a | 0.063 | 0.015 |
| 48 | 3.54a | 3.59a | 3.44b | 0.018 | 0.0034 |
| 72 | 3.60ab | 3.54b | 3.66a | 0.022 | 0.0213 |
1Sole substrates of Chenopodium album by harvested time: June, July, and August; 2Standard Error of the Means; 3Acetate to Propionate ratio.
Table 7.
Effect of Chenopodium album substitution levels on pH, in vitro dry matter digestibility (IVDMD), and ammonia-Nitrogen (NH₃-N) concentration.
Table 7.
Effect of Chenopodium album substitution levels on pH, in vitro dry matter digestibility (IVDMD), and ammonia-Nitrogen (NH₃-N) concentration.
| Incubation times (h) | Treatment1 | SEM2 | p-value | ||||
|---|---|---|---|---|---|---|---|
| Control | T1 | T2 | T3 | T4 | |||
| pH | |||||||
| 3 | 6.76b | 6.78b | 6.83a | 6.82a | 6.83a | 0.010 | 0.0006 |
| 6 | 6.75c | 7.04a | 6.85b | 6.86b | 6.81bc | 0.024 | <.0001 |
| 9 | 6.67d | 6.69c | 6.74b | 6.83a | 6.72bc | 0.014 | 0.0002 |
| 12 | 6.74a | 6.63b | 6.58c | 6.59c | 6.57c | 0.009 | <.0001 |
| 24 | 6.55a | 6.53a | 6.54a | 6.53a | 6.48b | 0.013 | 0.0184 |
| 48 | 6.54a | 6.48d | 6.50c | 6.50c | 6.53b | 0.009 | <.0001 |
| 72 | 6.45 | 6.48 | 6.47 | 6.46 | 6.46 | 0.014 | 0.4068 |
| IVDMD (%) | |||||||
| 3 | 24.27bc | 28.94a | 23.57c | 25.85b | 14.71d | 0.613 | <.0001 |
| 6 | 33.42b | 37.13a | 34.57ab | 35.46ab | 27.90c | 0.938 | 0.0004 |
| 9 | 47.89a | 43.39bc | 44.74b | 48.50a | 42.03c | 0.605 | <.0001 |
| 12 | 51.38b | 54.28a | 55.67a | 54.61a | 44.43c | 0.756 | <.0001 |
| 24 | 64.26b | 65.46ab | 67.16a | 67.29a | 59.62c | 0.740 | 0.0001 |
| 48 | 76.11b | 76.70b | 78.12a | 76.54b | 71.06c | 0.382 | <.0001 |
| 72 | 80.22a | 80.90a | 80.20a | 80.89a | 73.66b | 0.480 | <.0001 |
| NH3-N (mg/100mL) | |||||||
| 0 | 1.57c | 1.51c | 1.75b | 1.95a | 1.52c | 0.048 | 0.0003 |
| 3 | 1.77c | 2.97a | 2.14b | 2.88a | 2.37b | 0.086 | <.0001 |
| 6 | 1.18c | 1.60b | 1.55b | 1.72ab | 1.86a | 0.073 | 0.0008 |
| 9 | 1.43a | 1.26b | 0.83d | 1.18b | 1.01c | 0.040 | <.0001 |
| 12 | 1.77a | 1.57c | 1.69ab | 1.66b | 1.43d | 0.024 | <.0001 |
| 24 | 1.75d | 1.88c | 1.91c | 2.45a | 2.26b | 0.038 | <.0001 |
| 48 | 7.76a | 6.09b | 7.97a | 7.55a | 7.71a | 0.150 | <.0001 |
| 72 | 14.87a | 13.91a | 9.50c | 11.29b | 14.95a | 0.415 | <.0001 |
1Substitution levels of Chenopodium album harvested in August by percentage: Control (0), T1 (5), T2 (10), T3 (15), and T4 (20); 2Standard Error of the Means.
Table 8.
Effect of Chenopodium album substitution levels on in vitro total gas (TGP) and methane (CH4) production.
Table 8.
Effect of Chenopodium album substitution levels on in vitro total gas (TGP) and methane (CH4) production.
| Incubation times (h) | Treatments1 | SEM2 | p-value | ||||
|---|---|---|---|---|---|---|---|
| Control | T1 | T2 | T3 | T4 | |||
| TGP (mL/g DM) | |||||||
| 3 | 19.14b | 18.95b | 19.27b | 19.52b | 20.22a | 0.204 | 0.0109 |
| 6 | 37.86b | 40.06a | 37.50bc | 35.44d | 35.88cd | 0.565 | 0.0013 |
| 9 | 46.57c | 50.88a | 48.92ab | 47.04bc | 50.29a | 0.674 | 0.0036 |
| 12 | 74.57a | 75.34a | 76.01a | 71.56b | 68.88b | 0.954 | 0.0017 |
| 24 | 113.33a | 113.53a | 108.38b | 107.88b | 108.82b | 0.646 | 0.0001 |
| 48 | 138.27ab | 140.32a | 137.17b | 136.30b | 136.10b | 0.761 | 0.0162 |
| 72 | 148.95a | 149.58a | 147.86ab | 146.29b | 148.05ab | 0.646 | 0.041 |
| CH4 (mL/g DMD) | |||||||
| 3 | 2.48b | 1.97c | 2.44b | 2.13bc | 3.34a | 0.141 | 0.0004 |
| 6 | 6.99b | 7.24b | 7.15b | 5.52c | 8.84a | 0.168 | <.0001 |
| 9 | 7.53d | 8.54b | 8.09c | 7.42d | 9.13a | 0.090 | <.0001 |
| 12 | 14.33b | 14.93b | 13.42c | 14.69b | 16.28a | 0.277 | 0.0004 |
| 24 | 36.09b | 35.11b | 33.05c | 32.10c | 38.63a | 0.495 | <.0001 |
| 48 | 55.84a | 54.11ab | 54.69ab | 52.70b | 55.63a | 0.720 | 0.0659 |
| 72 | 63.86a | 65.09a | 60.46bc | 59.23c | 62.67ab | 0.945 | 0.0077 |
1Substitution levels of Chenopodium album harvested in August by percentage: Control (0), T1 (5), T2 (10), T3 (15), and T4 (20); 2 Standard Error of the Means.
Table 9.
Effect of Chenopodium album Substitution levels on in vitro volatile fatty acids (VFAs) production.
Table 9.
Effect of Chenopodium album Substitution levels on in vitro volatile fatty acids (VFAs) production.
| Incubation times (h) | Treatment1 | SEM2 | p-value | ||||||||||
|---|---|---|---|---|---|---|---|---|---|---|---|---|---|
| Control | T1 | T2 | T3 | T4 | |||||||||
| Total VFA (mM) | |||||||||||||
| 0 | 20.52a | 20.86a | 20.29ab | 19.46b | 20.67a | 0.270 | 0.0336 | ||||||
| 3 | 34.08a | 32.37b | 32.14b | 31.85b | 33.92a | 0.455 | 0.0147 | ||||||
| 6 | 40.88c | 46.44ab | 42.35bc | 42.34bc | 50.35a | 1.343 | 0.0031 | ||||||
| 9 | 46.67c | 51.39ab | 52.38a | 47.79bc | 52.68a | 1.346 | 0.0293 | ||||||
| 12 | 63.47a | 56.75b | 59.33ab | 62.20a | 62.32a | 1.336 | 0.0301 | ||||||
| 24 | 88.52b | 85.60b | 98.28a | 86.66b | 82.66b | 3.075 | 0.0413 | ||||||
| 48 | 81.20c | 78.77c | 85.72b | 78.86c | 91.35a | 1.003 | <.0001 | ||||||
| 72 | 102.91b | 100.86b | 104.04ab | 100.17b | 109.05a | 1.776 | 0.0364 | ||||||
| Acetate (%) | |||||||||||||
| 0 | 59.50a | 59.39a | 59.38a | 59.31a | 58.69b | 0.126 | 0.0076 | ||||||
| 3 | 58.89d | 58.93d | 59.23c | 59.66b | 60.04a | 0.096 | <.0001 | ||||||
| 6 | 57.13ab | 56.65ab | 57.72a | 57.62a | 56.37b | 0.346 | 0.0786 | ||||||
| 9 | 56.50c | 57.68bc | 59.27ab | 59.41a | 58.35ab | 0.540 | 0.0182 | ||||||
| 12 | 58.04c | 59.05a | 59.12a | 58.71ab | 58.46bc | 0.153 | 0.0029 | ||||||
| 24 | 58.53a | 58.33a | 58.25ab | 57.40c | 57.52bc | 0.240 | 0.024 | ||||||
| 48 | 55.61bc | 56.26a | 55.98ab | 55.82abc | 55.45c | 0.165 | 0.0436 | ||||||
| 72 | 54.41a | 54.18ab | 53.90b | 52.58c | 52.30c | 0.154 | <.0001 | ||||||
| Propionate (%) | |||||||||||||
| 0 | 15.93b | 16.30a' | 16.00b | 15.86b | 16.19a | 0.060 | 0.002 | ||||||
| 3 | 20.31a | 19.74b | 19.54b | 19.40b | 19.62b | 0.125 | 0.004 | ||||||
| 6 | 23.60b | 24.36ab | 23.57b | 23.78b | 25.14a | 0.291 | 0.0149 | ||||||
| 9 | 24.73ab | 24.83ab | 24.40bc | 24.25c | 25.13a | 0.138 | 0.008 | ||||||
| 12 | 25.39a | 24.25c | 24.51bc | 25.08ab | 25.06ab | 0.233 | 0.035 | ||||||
| 24 | 25.76c | 25.62c | 26.36b | 27.21a | 27.51a | 0.168 | <.0001 | ||||||
| 48 | 27.75b | 26.85c | 27.90b | 27.73b | 29.54a | 0.227 | 0.0001 | ||||||
| 72 | 31.65b | 32.02b | 32.34b | 32.52ab | 33.46a | 0.326 | 0.027 | ||||||
| Iso-butyrate (%) | |||||||||||||
| 0 | 5.13b | 5.15b | 5.11b | 5.29a | 5.17b | 0.027 | 0.0057 | ||||||
| 3 | 3.33bc | 3.45ab | 3.46a | 3.47a | 3.29c | 0.041 | 0.0283 | ||||||
| 6 | 2.86a | 2.59b | 2.76ab | 2.75ab | 2.38c | 0.058 | 0.0012 | ||||||
| 9 | 2.57a | 2.32b | 2.27b | 2.35b | 2.27b | 0.058 | 0.0225 | ||||||
| 12 | 1.98b | 2.15a | 2.03b | 2.01b | 2.04b | 0.027 | 0.0134 | ||||||
| 24 | 1.55c | 1.67a | 1.46d | 1.61b | 1.61b | 0.013 | <.0001 | ||||||
| 48 | 1.87a | 1.92a | 1.80b | 1.92a | 1.67c | 0.023 | <.0001 | ||||||
| 72 | 1.62ab | 1.65a | 1.62ab | 1.68a | 1.57b | 0.019 | 0.0278 | ||||||
| Butyrate (%) | |||||||||||||
| 0 | 9.97bc | 10.34ab | 9.59c | 10.14b | 10.65a | 0.147 | 0.0051 | ||||||
| 3 | 11.07a | 11.07a | 11.03ab | 10.87bc | 10.84c | 0.058 | 0.0421 | ||||||
| 6 | 10.73ab | 10.58ab | 10.47b | 10.40b | 10.98a | 0.146 | 0.1074 | ||||||
| 9 | 10.97a | 10.22ab | 9.56b | 9.28b | 9.69b | 0.305 | 0.0209 | ||||||
| 12 | 10.22a | 9.96c | 9.78d | 9.78d | 10.09b | 0.027 | <.0001 | ||||||
| 24 | 10.26a | 10.21a | 10.01b | 9.90c | 9.69d | 0.030 | <.0001 | ||||||
| 48 | 9.81a | 9.93a | 9.73a | 9.39b | 8.94c | 0.066 | <.0001 | ||||||
| 72 | 8.04a | 7.89b | 7.49d | 7.58c | 7.59c | 0.020 | <.0001 | ||||||
| Isovalerate (%) | |||||||||||||
| 0 | 5.06c | 5.13bc | 5.05c | 5.22a | 5.17ab | 0.030 | 0.0092 | ||||||
| 3 | 3.55c | 3.72ab | 3.76a | 3.68b | 3.55c | 0.016 | <.0001 | ||||||
| 6 | 3.15a | 2.95c | 3.06b | 3.08ab | 2.84d | 0.026 | <.0001 | ||||||
| 9 | 2.92a | 2.61b | 2.54b | 2.57b | 2.51b | 0.085 | 0.0397 | ||||||
| 12 | 2.36bc | 2.46a | 2.35c | 2.29d | 2.39d | 0.011 | <.0001 | ||||||
| 24 | 1.98b | 2.07a | 1.90c | 2.01b | 2.01b | 0.013 | <.0001 | ||||||
| 48 | 2.63c | 2.71a | 2.48d | 2.67b | 2.32e | 0.012 | <.0001 | ||||||
| 72 | 2.36c | 2.36c | 2.39b | 2.42a | 2.32d | 0.007 | <.0001 | ||||||
| Valerate (%) | |||||||||||||
| 0 | 3.99d | 4.03c | 4.01cd | 4.16a | 4.07b | 0.009 | <.0001 | ||||||
| 3 | 2.71c | 2.85ab | 2.89a | 2.84b | 2.71c | 0.014 | <.0001 | ||||||
| 6 | 2.48a | 2.35b | 2.43a | 2.44a | 2.06c | 0.018 | <.0001 | ||||||
| 9 | 1.88b | 2.11a | 2.07a | 2.11a | 2.05ab | 0.056 | 0.0754 | ||||||
| 12 | 2.00d | 2.23a | 2.07c | 2.00d | 2.11b | 0.011 | <.0001 | ||||||
| 24 | 1.79d | 2.00a | 1.87c | 1.92b | 2.03a | 0.013 | <.0001 | ||||||
| 48 | 2.30c | 2.49a | 2.35b | 2.49a | 2.11d | 0.006 | <.0001 | ||||||
| 72 | 2.07c | 2.08c | 2.10c | 2.57a | 2.26b | 0.030 | <.0001 | ||||||
| A/P3 ratio | |||||||||||||
| 0 | 3.76a | 3.64c | 3.71ab | 3.71ab | 3.69b | 0.017 | 0.0064 | ||||||
| 3 | 2.90e | 2.99d | 3.03c | 3.12a | 3.06b | 0.010 | <.0001 | ||||||
| 6 | 2.42ab | 2.36b | 2.45a | 2.42ab | 2.47a | 0.025 | 0.0752 | ||||||
| 9 | 2.29b | 2.31b | 2.39ab | 2.42ab | 2.79a | 0.129 | 0.1094 | ||||||
| 12 | 2.31c | 2.44a | 2.42ab | 2.31c | 2.36bc | 0.021 | 0.0036 | ||||||
| 24 | 2.27a | 2.26a | 2.21a | 2.11b | 2.08b | 0.022 | 0.0002 | ||||||
| 48 | 2.00b | 2.07a | 2.01ab | 2.01ab | 1.87c | 0.020 | 0.0006 | ||||||
| 72 | 1.72a | 1.69a | 1.66a | 1.65a | 1.55b | 0.028 | 0.0169 | ||||||
1Substitution levels of Chenopodium album harvested in August by percentage: Control (0), T1 (5), T2 (10), T3 (15), and T4 (20); 2 Standard Error of the Means; 3Acetate to Propionate ratio.
Disclaimer/Publisher’s Note: The statements, opinions and data contained in all publications are solely those of the individual author(s) and contributor(s) and not of MDPI and/or the editor(s). MDPI and/or the editor(s) disclaim responsibility for any injury to people or property resulting from any ideas, methods, instructions or products referred to in the content. |
© 2025 by the authors. Licensee MDPI, Basel, Switzerland. This article is an open access article distributed under the terms and conditions of the Creative Commons Attribution (CC BY) license (http://creativecommons.org/licenses/by/4.0/).
Copyright: This open access article is published under a Creative Commons CC BY 4.0 license, which permit the free download, distribution, and reuse, provided that the author and preprint are cited in any reuse.


