
Submitted:
09 September 2024
Posted:
09 September 2024
You are already at the latest version
Abstract
Turmeric starch (TS) has gained significant attention due to its potential health benefits, this study intended to investigate the dose-dependent effects of TS on colonic fermentation in rats. Four experimental diets containing different levels of TS (5%, 10%, and 20% w/w) were formulated and fed to male Fischer 344 rats for two weeks and compared with rats fed 0% TS diet (TS0). The results showed that increasing doses of TS resulted in reduced body weight gain and lower visceral tissue weights compared to the TS0 group. These effects may be attributed to the high content of resistant starch in TS, which contributed to lower caloric intake. Colonic fermentation analysis revealed that higher doses of TS resulted in increased short chain fatty acids (SCFA) production, specifically increased cecal acetate content and decreased cecal pH dose-dependently. Notably, beneficial bacteria from the family Oscillospiraceae, genus Lachnospiraceae NK4A136 group, and Ruminococcus spp. were enriched in the TS-fed groups, further supporting its beneficial effects on gut microbiota and SCFA production. Furthermore, these results suggest that TS may have beneficial effects on colonic fermentation in rats.
Keywords:
acetate
; gut microbiota
; turmeric starch
; visceral fat
1. Introduction
Turmeric (Curcuma aromatica S.), a well-known spice, has been extensively studied for its potential health benefits. The primary active compound in turmeric is curcumin, which has anti-inflammatory, antioxidant, and anticancer properties [1]. However, in addition to curcumin, turmeric contains starch. While turmeric starch (TS) has received less attention compared to curcumin, emerging evidence suggests it may also have beneficial effects on health, particularly in the context of colonic fermentation [2,3] and it has been reported TS is a B-type starch which possesses higher resistant starch (RS) content [4]. Specifically, TS is known for its substantial phosphorus content (~5000 ppm), similar to potato starch [5]. Consequently, research has indicated a negative relationship between phosphorus content and starch digestibility when subjected to enzyme-mediated hydrolysis after gelatinization [6].
Dietary fiber-rich diets modulate energy metabolism through the breakdown by gut bacteria, leading to the production of short chain fatty acids (SCFA) [7] and increasing the colonic alkaline phosphatase (ALP) activity [8]. SCFA influences satiety, energy expenditure, adipogenesis, and glucose metabolism, all of which play a role in body weight regulation [9]. Previous studies have shown that the enzyme-resistant fraction derived from spent turmeric exhibits similar fermentation potential to other types of resistant starch, leading to significant increases in SCFAs in vitro [10]. Additionally, the consumption of whole turmeric powder has been associated with a decrease in body weight gain, reduce energy intake and reduction in the accumulation of visceral fat in rats. Moreover, it has been reported lower serum triglyceride and lower hepatic total lipid levels in rats [2]. In addition, a study discovered that hydrothermally treated depigmented turmeric powder effectively boosts cecal fermentation in rats. This enhancement is attributed to the combined effects of fiber and resistant starch (RS), resulting in increased concentrations of acetate and butyrate [5]. The inclusion of spent turmeric powder at a concentration of 10% has been shown to inhibit intestinal lipid absorption and reduce overall energy intake [3].
These findings suggest the potential of turmeric and its byproducts to positively impact fermentation processes, lipid metabolism, and energy metabolism, highlighting their possible role in promoting health and preventing metabolic disorders. Understanding the dose-dependent effects of TS on colonic fermentation in animal models can provide valuable insights into its potential as a functional ingredient. The objective of this study is to investigate the dose-dependent effects of TS on colonic fermentation and physiological effects in rats.
2. Materials and Methods
2.1. Turmeric Starch and Experimental Diet
Turmeric was supplied by Okinawaukondo Co. Ltd., (Okinawa, Japan). Starch from dry turmeric slices was recovered using a method that has been applied to several starchy crops [11]. Dried turmeric slices were ground into fine particles using a laboratory scale grinder (FM-1, Osaka Chemical Co., Ltd., Osaka, Japan) and suspended in water. The suspension was mixed in a laboratory scale blender (JMM-1020, Yamazen Corporation, Osaka, Japan) for 60 seconds, followed by filtration using a nylon mesh cloth. The filtered starch milk was wet sieved using a set of standard sieves (350, 75, and 50 µm). The sieve passing fraction was allowed to sediment for 2 h, the upper layer of water was removed and the wet starch was washed with ethanol (70%, v/v) to remove the pigments, and the suspension was filtered through a glass filter (26G2, Asahi Glass Co. Ltd.) with the aid of vacuum filtration. This filtration process was repeated multiple times until the color was completely removed from the starch. Finally, the isolated starch was dried for 24 hours under ambient conditions.
The proximate composition of TS (Table 1) was determined according to the AOAC methods as follows: moisture (AOAC 925.10), crude protein (AOAC 920.87), crude lipids (AOAC 2002.02), and ash (AOAC 923.03). RS content was quantified using the Megazyme Resistant Starch Assay Kit (Megazyme, Wicklow, Ireland) according to the manufacturer’s instructions. The energy contents in the TS and the experimental diets were calculated as previously described [12]. Phosphate content in the TS was determined using an inductively coupled plasma atomic emission spectrophotometer (ICPS-8100, Shimadzu Co. Ltd., Kyoto, Japan). Samples for ICPS-8100 were prepared as previously described [11]. All chemicals used were of analytical grade. Four experimental diets, 0% w/w TS (TS0), 5% w/w TS (TS5), 10% w/w TS (TS10), and 20% w/w TS (TS20) formulated based on the AIN-93G diet guidelines by Oriental Yeast Co., Ltd., (Tokyo, Japan) (Table 2).
2.2. Experimental Design
The animal experiment was conducted according to the guidelines of “Guide for the Care and Use of Laboratory Animals” and all the procedures were approved by the Animal Care and Experiment Committee of Obihiro University of Agriculture and Veterinary Medicine (License No.:22-159). The rat strain, Fischer 344 was chosen as the experimental animal model in this study, as it has been previously used in nutrition and dietary research (Han et al., 2020b). A total of 28 male Fischer 344 rats (7 weeks old) were purchased from Charles River Laboratories Japan Inc. (Yokohama, Japan). Each rat was individually housed in plastic cages under controlled environmental conditions (temperature of 23 ± 1°C; 60 ± 5% relative humidity; a 12 h light/dark cycle). Prior to the start of the experiment, the rats were acclimatized for seven days on a standard rodent diet (CE-2, CLEA Japan, Inc., Tokyo, Japan). After acclimatization rats were randomly assigned to four similar body weight groups (180 ± 1 g) and fed one of the four experimental diets (≃25 g) with free access to ad libitum water (≃150 mL).
Weekly body weight gain and daily feed intake were measured. During the last two days of the experimental period, fecal pellets were collected and stored at −30℃ for the analysis of fecal starch content. After the experimental period of two weeks, the final body weight was measured and the rats were anesthetized by inhalation of isoflurane and euthanized by cervical dislocation assuring the minimal level of suffering. The cecum, liver, epididymal, and perirenal adipose tissues were excised and weighed. A portion of the cecal content (≃1 g) was diluted (×5) in distilled water for pH measurement [13], while the rest was stored at −80℃.
2.3. Cecal Organic Acid Analysis
The cecal organic acid content in the rats was determined using HPLC (LC-10AD, Shimadzu, Kyoto, Japan). The supernatant obtained by centrifugation of the cecum content suspension at 12,000 × g, for 15 min at 4°C was ultrafiltered using a TORAST-H ultrafilter (Shimadzu GLC, Kyoto, Japan) by centrifugation at 12,000 × g for 10 min at 4℃, followed by further filtration using a cellulose acetate membrane filter (0.45 µm, Toyo Roshi Kaisha Ltd. Tokyo, Japan) and used in HPLC. Analytical specifications were followed according to [14].
2.4. Analysis of Cecal Mucin Content
2.5. Analysis of Cecal Immunoglobulin A (IgA) Content
The IgA levels in the rat cecal contents were determined using a rat IgA ELISA quantitation kit (Bethyl Laboratories, Montgomery, TX, USA) according to the manufacturer’s instructions.
2.6. Analysis of Cecal Ammonia-Nitrogen Content
Aliquot from the cecal homogenate (0.1 M phosphate buffer, pH 5.5) was used to determine the ammonia nitrogen concentration using a commercially available kit (FUJIFILM Wako Pure Chemical Corporation, Osaka, Japan) according to the manufacturer’s instructions.
2.7. Fecal Starch Content
The starch content in the previously mentioned feces (section 2.2) was measured using the Megazyme Resistant Starch Assay Kit (Megazyme) according to the manufacturer’s instructions. The starch excretion rate was calculated by the following equations:
Starch excretion rate = (FS/SI) x 100, where FS is the amount of fecal starch content over the last 2 days and SI is the amount of starch intake over the last 2 days of the experimental period.
2.8. Cecal Bacterial DNA Extraction, Next-Generation Sequencing, and Analysis of Microbiota
Cecal bacterial DNA was extracted using the repeated bead beating plus column method as previously described [14]. The extracted DNA was then purified using the QIAamp Fast DNA stool mini kit (Qiagen, Valencia, CA, USA) following the manufacturer’s instructions. The concentration and purity of the extracted DNA were measured using a NanoDrop 2000c Spectrophotometer (Thermo Fisher Scientific, Tokyo, Japan). Finally, the concentration of the extracted and purified DNA was adjusted to 5 ng/µL using Tris-EDTA buffer (pH ~ 8.0). Paired-end sequencing of 16S rRNA gene amplicons were performed using the Illumina MiSeq system (Illumina, San Diego, CA, USA) as previously described (Nagata et al., 2020). The retrieved raw 16S rRNA gene sequences were analyzed using the Quantitative Insight Into Microbial Ecology (QIIME2) version 2023.2 [17]. The generated biome table was normalized using an equal subsampling size of 33960 sequences. The weighted UniFrac distance metric was employed for determining the β-diversity and a principal coordinate analysis (PCoA) plot was generated using R Studio (version 2023.3.1).
2.9. Analysis of Alkaline Phosphatase Activity
The colon mucosa and fecal samples were homogenized with 10 mM Tris-buffered saline (pH 7.3) containing 1% Triton X-100 (Sigma-Aldrich, Tokyo, Japan). The homogenate was centrifuged at 7000 × g at 4°C for 15 min [18]. The supernatant was used as an enzyme-enriched extract. ALP activity was measured using a Lab Assay ALP kit (BioAssay Systems, Hayward, CA, USA) and protein concentration was determined using a Bio-Rad protein Assay kit (Bio-Rad Laboratories, Hercules, CA, USA) according to the manufacturer’s instructions.
2.10. Statistical Analysis
All zoometric and biochemical data are presented as mean ± SE. Significant differences among the four groups were determined by one-way ANOVA followed by Dunnett’s post hoc test. Correlations between the parameters were assessed using Pearson’s correlation analysis. Statistical difference in microbial data was analyzed using the non-parametric Kruskal-Wallis H test followed by the Bonferroni correction. Association between microbial abundance and biochemical data was tested using Spearman correlations analysis. All statistical analysis was performed using SPSS software (version 29.0.0.0 (241)). A p-value less than 0.05 was considered statistically significant.
3. Results
3.1. Zoometric Parameters
The zoometric parameters are provided in Table 3. Upon completion of the experimental period, feed intake, body weight gain, and final body weight were not significantly different in the TS-fed groups compared to the TS0 group. However, the TS-fed groups showed significantly lower (p < 0.001) perirenal and epididymal adipose tissue weights in a dose-dependent manner compared to the TS0 group, while the TS20 group possessed the lowest perirenal and epididymal adipose tissue weights (Table 3). The fecal dry matter content and starch excretion were significantly higher (p < 0.01) in the TS-fed groups compared to the TS0 group with the TS20 group exhibiting the highest fecal dry matter content and highest starch excretion rate.
3.2. Cecal Parameters in Rats
Cecal acetate content was significantly increased in a dose-dependent manner in the TS-fed groups compared to the TS0 group (p < 0.05). The propionate and butyrate contents did not show significant differences among the diet groups. Furthermore, cecal lactate content was significantly higher (p < 0.05) in the TS10 and TS20 groups compared to the TS0 group. Conversely, cecal succinate content was significantly lower in the TS10 and TS20 groups when compared to the TS0 group (Table 4). The cecal pH was significantly decreased (p < 0.05) dose-dependently compared to the TS0 group. Cecal tissue and cecal digesta weights were significantly increased dose-dependently (p < 0.05), indicating an increase in the cecal size in TS-fed groups compared to the TS0 group (Table 4).
3.3. Cecal Mucin, IgA, and Ammonia Nitrogen
Cecal mucin content (Figure 1) was significantly increased (p < 0.001) in a dose-dependent manner in TS-fed groups compared to the TS0 group. The cecal IgA level (Figure 1) was significantly higher (p < 0.05) in the TS5 and TS20 groups compared to the TS0 group. Additionally, the IgA level in TS10 group was comparatively higher (p= 0.10) than that in the TS0 group. Cecal ammonia nitrogen content (Figure 1) did not show a significant difference among the diet groups. However, TS20 group showed a comparatively low (p = 0.08) cecal ammonia nitrogen content.
3.4. Microbial Diversity and Abundance
Alpha diversity at the feature level was determined using the Shannon and Chao1 indices. The Shannon (Figure 2A) and Chao1 indices (Figure 2B) were not significantly different among the diet groups. The PCoA plot revealed a clear differentiation in the microbial composition between the TS0 group and other TS groups (Figure 2C). The PCoA plot implied that the TS diet had a significant impact on the gut microbial composition in the rats, indicating its influential role in shaping the microbial community.
Figure 2D shows the relative abundance at the phylum level. When compared to the TS0 group, the abundance of the phyla Firmicutes, Bacteroidetes, Verrucomicrobia, Proteobacteria, and Actinobacteria did not show significant differences among the groups. However, the phylum Deferribacteres was significantly higher (p < 0.05) in the TS10 and TS20 groups compared to the TS0 group.
The Box and whisker plots obtained at the genus level (Figure 3) further highlighted the distinct cluster formation between the TS-fed groups and the TS0 group. In comparison to the TS0 group, the relative abundances of Lachnospiraceae NK4A136 group, Clostridia vadinBB60 group, Oscillibacter, and Oscillospiraceae uncultured were significantly higher (p < 0.05) in the TS10 and TS20 groups, while showing a comparatively higher relative (p = 0.14, p = 0.32, p = 0.14, and p = 0.41 respectively) abundance in the TS5 group. Genera Turicibacter and Parasutterella showed significantly higher (p < 0.05) relative abundance in the TS5 and TS20 groups, with a relatively higher (p = 0.07 and p = 0.26 respectively) abundance in the TS10 group compared to the TS0 group. In addition, the relative abundance of genus Ruminococcus was higher in the TS-fed groups, with a significantly higher abundance (p < 0.05) observed in the TS10 group than in the TS0 group.
3.5. Intestinal Alkaline Phosphatase Activity
Remarkably, intestinal ALP levels vary along the longitudinal axis of the intestine. In this study, the duodenum showed significantly higher (p < 0.05) ALP activity only in the TS5 group compared to the TS0 group. In the jejunum, ALP activity was significantly lower (p < 0.01) in the TS10, and TS20 groups compared to the TS0 group. Similarly, in the ileum mucosa, ALP activity was significantly lower (p < 0.05) in all TS groups compared to the TS0 group. However, the ALP activity of the cecum and colon mucosa was not affected by TS (Table 5).
4. Discussion
In recent years, dietary interventions have gained significant attention in influencing their body composition and overall health. Among these, diets supplemented with RS have shown significant results in reducing caloric intake and improving metabolic outputs. RS is a type of dietary fiber, that resists digestion in the small intestine and reaches the colon, where it undertakes fermentation by gut microbiota. This unique property of RS not only contributes to lower caloric density but also facilitate numerous health benefits, including improved gut health and reduced fat accumulation.
In this study, four TS-fed groups showed different effects on physiological parameters. Final body weight, weight gain, and feed intake were not significantly different from the TS0 group. This suggests that TS supplementation does not significantly affect overall growth or appetite. A notable finding is a significant decrease in visceral fat mass in all TS-fed groups, which can be attributed to the increasing RS content in the diet (RS content/100 g diet: TS5, 3.09; TS10, 6.18; TS20, 12.4). This increase in RS likely reduced the energy density of the diet [19]. This energy dilution effect of the diet likely contributed to the reduced accumulation of visceral fat in rats [20], as evidenced by the positive correlation between caloric intake and visceral fat mass (r = 0.78, p < 0.01) [3]. Furthermore, starch excretion increased significantly and remarkably by 23.0% in the TS20 group in a dose-dependent manner. This massive increase in unabsorbed starch directly correlates with increasing dietary RS [21]. The TS20 group produced more than three times as much dry feces as the control group. This significant increase in fecal content is consistent with the known effects of RS, which can increase fecal bulk through fermentation by gut microbiota and undigested starch. Similarly, this study showed a positive correlation between fecal dry weight and starch excretion (r = 0.96, p < 0.001). In addition, a significant increase could be observed in cecal digesta mass in TS-fed groups. It is likely that the substantial amount of RS contributed to the increase in cecal digesta volume and promoted microbial fermentation processes.
In addition to energy dilution, microbial fermentation of RS produces important SCFAs. These SCFAs have well-documented profound anti-obesity and anti-diabetic effects, regulating body weight and fat accumulation through the modulation of energy intake and expenditure [22]. Acetate, the most prevalent SCFA, may impact appetite regulation through a central homeostatic mechanism [23]. Although cecal acetate content increased significantly in a dose-dependent manner in this study, no significant correlation was found between feed intake and individual or total SCFA content. Interestingly, in this study propionate and butyrate content were not significant among diet groups, contrasting with a previous study [5] where hydrothermally treated depigmented turmeric powder fed rats showed significantly higher propionate and butyrate content compared to the control group. Succinate is used to synthesize propionate via the succinate pathway [24]. In this study, lowered cecal succinate contents were observed in the TS-fed groups, which might indicate that succinate is further metabolized to propionate. Notably, cecal lactate content was significantly increased in TS-fed groups compared to the TS0 group. Lactate is produced from rapidly fermentable indigestible saccharides [25] and can be converted into any major SCFA. The elevated lactate levels suggest that TS might have become a rapidly fermentable substrate in the gut environment.
The production of SCFAs not only influences the metabolic process but also has a significant effect on cecal pH. The cecal pH is critical for maintaining a microbial balance and a slightly acidic environment is ideal for the fermentation process [26]. In this study, a significant decrease could be observed in the cecal pH of the TS-fed groups dose-dependently. This may be due to the increase in the production of organic acids in a dose-dependent manner, that inversely impacted cecal pH levels [27]. Notably, cecal pH showed a negative correlation with total SCFA (r = -0.86, p < 0.001) as well as individual SCFA contents (acetate, r = -0.84, p < 0.001; propionate, r = -0.56, p < 0.01; butyrate, r = -0.47; p < 0.05).
Other than SCFAs, mucin, IgA, and ammonia nitrogen contents are also vital for a healthy intestinal environment. Mucin forms a protective barrier in the intestine, preventing harmful substances from reaching the intestinal cells [28]. High RS content in the diet increases the bulk due to escape digestion in the small intestine and physically stimulating the intestinal tract to enhance mucin secretion [14]. This can be attributed to the increase in cecal mucin content dose-dependently. Furthermore, SCFA can stimulate mucin excretion by goblet cells by influencing the expression of the mucin gene [29]. The findings of this study support this relationship, revealing positive correlations between cecal mucin content with the cecal acetate (r = 0.82; p < 0.01) and propionate (r = 0.69, p < 0.01) contents.
As the main component of mucosal immunity, IgA is an antibody that binds to pathogens and neutralizes them, thereby protecting intestinal epithelium invasion. The mutual interaction of mucin and IgA creates a cohesive immune barrier in the mucus layer, thereby preventing inflammations. For example, disruptions of mucin and IgA production could contribute to the development of gastrointestinal disorders [30]. Furthermore, IgA plays an important role in regulating the gut microbial composition of the gut, promoting bacterial symbiosis, and maintaining intestinal homeostasis [31]. A previous study reported [32] that acetate stimulates IgA secretion through GPR43-mediated (G protein-coupled receptor) mechanisms in dendritic cells, which then promote B cell differentiation and IgA production. This study also showed a positive correlation between cecal IgA contents and the cecal acetate (r = 0.78; p < 0.01).
Ammonia is produced in the intestinal lumen by two primary mechanisms, the degradation of amino acids and the hydrolysis of urea. Amino acids are derived from dietary protein or host cell turnover and this process is facilitated by bacterial enzymes while urea is broken down by the enzymatic action of ureases [33]. Increased cecal ammonia nitrogen levels can have negative impacts on intestinal health and function, such as reducing the thickness of the cecal mucosa and muscle membrane, negatively altering the gut microbiota, and reducing growth performance [34]. This study showed slightly lower cecal ammonia nitrogen contents in the TS-fed groups, which may be attributed to less amino acid fermentation by gut microbiota potentially contributing to lower ammonia nitrogen levels [35].
The gut microbiota plays a pivotal role in mediating many of the observed effects of dietary interventions, including the fermentation of RS and the production of SCFAs, while also influencing obesity or lean phenotypes, with reduced bacterial diversity being associated with obesity [36]. In this study, alpha diversity at the feature level did not differ significantly among the diet groups. This suggests that the overall diversity and distribution of the microbial community remained relatively consistent across the different doses of TS. Furthermore, this can also suggest that the TS diet did not negatively affect the gut microbial community in the rats. However, the PCoA plot revealed a distinct separation in the microbial composition between the TS0 and other TS groups. Notably, the Lachnospiraceae NK4A136 group, which belongs to the Lachnospiraceae family, emerged as the key player in the cecal microbiota of TS-fed groups. The Lachnospiraceae NK4A136 group is characterized by its anaerobic and spore-forming properties, enabling it to ferment complex polysaccharides into SCFA efficiently [37]. In this study, Lachnospiraceae NK4A136 group showed a positive correlation with total SCFA (r = 0.62, p < 0.001) and acetate content (r = 0.58, p < 0.01). Further highlighting their potential to modulate the gut microbiota, a higher relative abundance of the Lachnospiraceae NK4A136 group was reported to reduce the relative abundance of harmful microorganisms [38].
Ruminococcus spp., a prominent member of the gut microbiota, plays a vital role in colonic fermentation by efficiently breaking down complex carbohydrates, including dietary fiber and plant polysaccharides that are typically resistant to digestion by the host [39]. In this study, genus Ruminococcus exhibited a positive correlation with total SCFA (r = 0.46, p < 0.05) as well as acetate (r = 0.48, p < 0.01), propionate (r = 0.46, p < 0.05), and lactate (r = 0.53, p < 0.01). Colidextribacter, Oscillibacter, and Oscilospiraceae uncultured belong to the family Oscillospiraceae which can ferment complex sugar into SCFAs [40]. Further, a previous study has reported that Oscillibacter spp. could enhance the acetate production [41] where, this study also showed a positive correlation with cecal acetate content (r = 0.67, p < 0.001) could be observed. Genus Colidextribacter (r = 0.54, p < 0.01) and Oscilospiraceae uncultured (r = 0.64, p < 0.001) also showed a positive correlation with cecal acetate content.
Elevated abundance of genus Parasutterella has been associated with increased levels of acetate and propionate [42]. This study also exhibited a positive correlation with cecal acetate content (r = 0.42, p < 0.05). However, it did not show a significant correlation with propionate content. In addition, another SCFA producing bacteria Clostridia vadinBB60 group showed a higher positive correlation with cecal acetate content (r = 0.72, p < 0.001) [43]. Genus Turicibacter showed a strong positive correlation with cecal lactate content (r = 0.72, p < 0.001) and a previous study has identified lactate as the primary fermentative product [44] and this study similarly supports this finding. Consequently, the presence of these bacteria in the TS-fed groups might have played a pivotal role in the fermentation of RS and subsequent production of SCFAs, mainly acetate.
While this study observed significant changes in microbial composition and SCFA production, the effect of the TS diet on ALP activity in the intestine was observed. ALP is an enzyme that is widely distributed in various tissues, including the intestine, liver, kidney, and bone [45]. Intestinal ALP plays a critical role in maintaining intestinal health by multiple mechanisms. Intestinal ALP improves the intestinal barrier function by regulating the expression of tight junction protein. Additionally, intestinal ALP dephosphorylates lipopolysaccharides of gram-negative bacteria [46]. Together, these actions contribute to the maintenance of a healthy gut microbiome and intestinal integrity [47]. A previous study reported that fermentable non-digestible carbohydrates increased colonic ALP activity [18]. However, the effects of specific compounds on ALP activity may vary. For instance, this study did not observe a positive effect of TS on colonic ALP activity and changes in small intestinal ALP activity are currently unclear. These results suggest that the precise mechanisms by which dietary factors influence ALP activity need to be further investigated.
5. Conclusions
In conclusion, this study demonstrates that TS consumption, especially high in RS, exerts anti-obesity effects by reducing visceral fat mass and promoting beneficial changes in gut microbiota composition. Increasing the dose of TS diet resulted in lower caloric intake, increased fecal dry weight, and decreased visceral fat mass and body weight, indicating improved energy metabolism. The production of SCFA, in particular, increased acetate production in a dose-dependent manner, and it was positively correlated with mucin and IgA levels, suggesting their involvement in maintaining gut health and immune function. The enrichment of beneficial bacteria such as the Lachnospiraceae NK4A136 group, Ruminococcus spp., and Oscillospiraceae uncultured further supported the beneficial effects of the TS diet on gut microbiota and SCFA production. Furthermore, while TS20 showed the most significant effects, it also resulted in potentially excessive starch excretion. TS5 and TS10 demonstrated many of the same benefits as TS20. Based on the current data, TS5 or TS10 might represent a more balanced approach, providing significant health benefits while minimizing nutrient loss through starch excretion.
Author Contributions
Conceptualization, K.H.H., M.F., R.N., and E.M.A.C.E.; methodology, K.H.H., R.N., and E.M.A.C.E.; software, E.M.A.C.E., R.N., and R. I.; validation, K.H.H., M.F., and R.N.; formal analysis, R.I., E.M.A.C.E., and R.N.; investigation, E.M.A.C.E., R.I., R.N., K.S., K.H.H., and M.F.; resources, K.S., R.N., and K.H.H.; data curation, E.M.A.C.E., R.I., and R.N.; writing—original draft preparation, E.M.A.C.E.; writing—review and editing, K.H.H., and R.N.; visualization, E.M.A.C.E., and R.I.; supervision, K.H.H., K.S., and R.N.; project administration, K.H.H.; funding acquisition, K.H.H. All authors have read and agreed to the published version of the manuscript.
Funding
This research was supported by a grant-in-aid for scientific research (C) from the Japan Society for the Promotion of Science (No.21K05482).
Institutional Review Board Statement
The animal study protocol was approved by the Animal Care and Experiment Committee of Obihiro University of Agriculture and Veterinary Medicine (License No.:22-159).
Data Availability Statement
Dataset available on request from the authors.
Acknowledgments
We are very grateful to Toshinori Nakahodo from Okinawaukondo Co. Ltd. for providing turmeric. The authors would like to acknowledge Naoki Fukuma at Obihiro University of Agriculture and Veterinary Medicine for facilitating the use of his resources. This work was supported by the station for management of common equipment, Obihiro University.
Conflicts of Interest
The authors declare no conflicts of interest.
References
- Kocaadam, B.; Şanlier, N. Curcumin, an active component of turmeric (Curcuma longa), and its effects on health. Crit. Rev. Food Sci. Nutr. 2017, 57, 2889–2895. [Google Scholar] [CrossRef] [PubMed]
- Lee, C.H.; Kim, A.Y.; Pyun, C.W.; Fukushima, M.; Han, K.H. Turmeric (Curcuma longa) whole powder reduces accumulation of visceral fat mass and increases hepatic oxidative stress in rats fed a high-fat diet. Food Sci. Biotechnol. 2014, 23, 261–267. [Google Scholar] [CrossRef]
- Han, K.H.; Lee, C.H.; Kinoshita, M.; Oh, C.H.; Shimada, K.; Fukushima, M. Spent turmeric reduces fat mass in rats fed a high-fat diet. Food Funct. 2016, 7, 1814–1824. [Google Scholar] [CrossRef] [PubMed]
- Hung, P.V.; Vo, T.N.D. Structure, physicochemical characteristics, and functional properties of starches isolated from yellow (Curcuma longa) and black (Curcuma caesia) turmeric rhizomes. Starch/Stärke 2016, 69, 1600285. [CrossRef]
- Han, K.H.; Jibiki, T.; Fukushima, M. Effect of hydrothermal treatment of depigmented turmeric (Curcuma longa L.) on cecal fermentation in rats. Starch/Stärke 2020 72, 1900221. [CrossRef]
- Noda, T.; Takigawa, S.; Matsuura-Endo, C.; Suzuki, T.; Hashimoto, N.; Kottearachchi, N.S.; Yamauchi, H.; Zaidul, I.S.M. Factors affecting the digestibility of raw and gelatinized potato starches. Food Chem. 2008, 110, 465–470. [Google Scholar] [CrossRef]
- Makki, K.; Deehan, E.C.; Walter, J.; Bäckhed, F. The impact of dietary fiber on gut microbiota in host health and disease. Cell Host Microbe 2018, 23, 705–715. [Google Scholar] [CrossRef]
- Okazaki, Y.; Katayama, T. Consumption of non-digestible oligosaccharides elevates colonic alkaline phosphatase activity by up-regulating the expression of IAP-I, with increased mucins and microbial fermentation in rats fed a high-fat diet. Br. J. Nutr. 2018, 121, 146–154. [Google Scholar] [CrossRef]
- Barber, M.T.; Kabisch, S.; Pfeiffer, H.F.A.; Weickert, O.M. The health benefits of dietary fibre. Nutrients 2020, 12, 3209. [Google Scholar] [CrossRef]
- Han, K.H.; Azuma, S.; Fukushima, M. In vitro fermentation of spent turmeric powder with a mixed culture of pig fecal bacteria. Food Funct. 2014, 5, 2446–2452. [Google Scholar] [CrossRef]
- Pelpolage, S.; Nakata, K.; Shinbayashi, Y.; Murayama, D.; Tani, M.; Yamauchi, H.; Koaze, H. Comparison of pasting and thermal properties of starches isolated from four processing type potato varieties cultivated in two locations in Hokkaido. Food Sci. Technol. Res. 2016, 22, 687–693. [Google Scholar] [CrossRef]
- Ranhotra, G.S.; Gelroth, J.A.; Glaser, B.K. Energy value of resistant starch. J. Food Sci. 1996, 61, 453–455. [Google Scholar] [CrossRef]
- Kilua, A.; Han, K.H.; Fukushima, M. Effect of polyphenols isolated from purple sweet potato (Ipomoea batatas cv. Ayamurasaki) on the microbiota and the biomarker of colonic fermentation in rats fed with cellulose or inulin. Food Funct. 2020, 11, 10182–10192. [Google Scholar] [CrossRef]
- Pelpolage, S.W.; Goto, Y.; Nagata, R.; Fukuma, N.; Furuta, T.; Mizu, M.; Han, K.H.; Fukushima, M. Colonic fermentation of water soluble fiber fraction extracted from sugarcane (Sacchurum officinarum L.) bagasse in murine models. Food Chem. 2019, 292, 336–345. [Google Scholar] [CrossRef]
- Bovee-Oudenhoven, I.M.; Termont, D.S.; Heidt, P.J.; Van, D.R. Increasing the intestinal resistance of rats to the invasive pathogen Salmonella enteritidis: additive effects of dietary lactulose and calcium. Gut 1997, 40, 497–504. [Google Scholar] [CrossRef]
- Crowther, R.S.; Wetmore, R.F. Fluorometric assay of O-linked glycoproteins by reaction with 2-cyanoacetamide. Anal. Biochem. 1987, 163, 170–174. [Google Scholar] [CrossRef]
- Caporaso, J.G.; Kuczynski, J.; Stombaugh, J.; Bittinger, K.; Bushman, F.D.; Costello, E.K.; Fierer, N.; Pena, A.G.; Goodrich, J.K.; Gordon, J.I.; et al. QIIME allows analysis of high-throughput community sequencing data. Nat. Methods 2010, 7, 335–336. [Google Scholar] [CrossRef]
- Okazaki, Y.; Katayama, T. The effects of different high-fat (lard, soybean oil, corn oil or olive oil) diets supplemented with fructo-oligosaccharides on colonic alkaline phosphatase activity in rats. Eur. J. Nutr. 2020, 60, 89–99. [Google Scholar] [CrossRef]
- Higgings, A.J. Resistant starch and energy balance: impact on weight loss and maintenance. Crit. Rev. Food Sci. Nutr. 2014, 54, 1158–1166. [Google Scholar] [CrossRef]
- Harazaki, T.; Inoue, S.; Imai, C.; Mochizuki, K.; Goda, T. Resistant starch improves insulin resistance and reduces adipose tissue weight and CD11c expression in rat OLETF adipose tissue. Nutrition 2014, 30, 590–595. [Google Scholar] [CrossRef]
- Kishida, T.; Nogami, H.; Himeno, S.; Ebihara, K. Heat moisture treatment of high amylose cornstarch increases its resistant starch content but not its physiologic effects in rats. J. Nutr. 2001, 131, 2716–2721. [Google Scholar] [CrossRef]
- May, K.S.; Hartigh, L.J.D. Gut microbial-derived short chain fatty acids: impact on adipose tissue physiology. Nutrients 2023, 15, 272. [Google Scholar] [CrossRef]
- Frost, G.; Sleeth, M.L.; Sahuri-Arisoylu, M.; Lizarbe, B.; Cerdan, S.; Brody, L.; Anastasovska, J.; Ghourab, S.; Hankir, M.; Zhang, S.; et al. The short-chain fatty acid acetate reduces appetite via a central homeostatic mechanism. Nat. Commun. 2014, 5, 3611. [Google Scholar] [CrossRef]
- Koh, A.; Vadder, D.F.; Datchary, K.P.; Backhed, F. From dietary fiber to host physiology: short-chain fatty acids as key bacterial metabolites. Cell 2016, 165, 1332–1345. [Google Scholar] [CrossRef]
- Macfarlane, S.; Macfarlane, T.G. Regulation of short-chain fatty acid production. Proc. Nutr. Soc. 2003, 62, 67–72. [Google Scholar] [CrossRef]
- Firrman, J.; Liu, L.; Mahalak, K.; Tanes, C.; Bittinger, K.; Tu, V.; Bobokalonov, J.; Mattei, L.; Zhang, H.; Abbeele, V.P. The impact of environmental pH on the gut microbiota community structure and short chain fatty acid production. FEMS Microbiol. Ecol. 2022, 98, fiac038. [Google Scholar] [CrossRef]
- Carboni, A.D.; Weisstaub, A.; Ferrero, C.; Zuleta, A.; Puppo, M.C. Impact of lentil-wheat bread on calcium metabolism, cecal and serum parameters in growing Wistar rats. Food Biosci. 2022, 48, 101805. [Google Scholar] [CrossRef]
- Malairaj, S.; Veeraperumal, S.; Yao, W.; Subramanian, M.; Tan, K.; Zhong, S.; Cheong, K.L. Porphyran from Porphyra haitanensis enhances intestinal barrier function and regulates gut microbiota composition. Mar. Drugs 2023, 21, 265. [Google Scholar] [CrossRef]
- Ragavan, M.L.; Hemalatha, S. The functional roles of short chain fatty acids as postbiotics in human gut: future perspectives. Food Sci. Biotechnol. 2024, 33, 275–285. [Google Scholar] [CrossRef]
- Haroun, E.; Kumar, P.A.; Saba, L.; Kassab, J.; Ghimire, K.; Dutta, D.; Lim, S.H. Intestinal barrier functions in hematologic and oncologic diseases. J. Transl. Med. 2023, 21, 233. [Google Scholar] [CrossRef]
- Nakajima, A.; Vogelzang, A.; Maruya, M.; Miyajima, M.; Murata, M.; Son, A.; Kuwahara, T.; Tsuruyama, T.; Yamada, S.; Matsuura, M.; et al. IgA regulates the composition and metabolic function of gut microbiota by promoting symbiosis between bacteria. J. Exp. Med. 2018, 215, 2019–2034. [Google Scholar] [CrossRef]
- Wu, W.; Sun, M.; Chen, F.; Cao, A.T.; Liu, H.; Zhao, Y.; Huang, X.; Xiao, Y.; Yao, S.; Zhao, Q.; et al. Microbiota metabolite short-chain fatty acid acetate promotes intestinal IgA response to microbiota which is mediated by GPR43. Mucosal Immunol. 2017, 10, 946–956. [Google Scholar] [CrossRef]
- Wrong, M.O.; Vince, A. Urea and ammonia metabolism in the human large intestine. Proc. Nutr. Soc. 1984, 43, 77–86. [Google Scholar] [CrossRef]
- Cui, J.; Yang, X.; Wang, F.; Liu, S.; Han, S.; Chen, B. Effects of ammonia on growth performance, lipid metabolism and cecal microbial community of rabbits. PLoS One 2021, 16, e0252065. [Google Scholar] [CrossRef]
- Oliphant, K.; Allen-Vercoe, E. Macronutrient metabolism by the human gut microbiome: major fermentation by-products and their impact on host health. Microbiome 2019, 7, 91. [Google Scholar] [CrossRef]
- Wei, B.; Zhang, B.; Du, A.-Q.; Zhou, Z.-Y.; Lu, D.-Z.; Zhu, Z.-H.; Ke, S.-Z.; Wang, S.-J.; Yu, Y.-L.; Chen, J.-W.; et al. Saccharina japonica fucan suppresses high fat diet-induced obesity and enriches fucoidan-degrading gut bacteria. Carbohydr. Polym. 2022, 290, 119411. [Google Scholar] [CrossRef]
- Wu, M.-R.; Chou, T.-S.; Huang, C.-Y.; Hsiao, J.-K. A potential probiotic- Lachnospiraceae NK4A136 group: Evidence from the restoration of the dietary pattern from a high-fat diet. Research Square 2020, (submitted).
- Lu, C.-L.; Li, H.-X.; Zhu, X.-Y.; Luo, Z.-S.; Rao, S.- Q.; Yang, Z.-Q. Regulatory effect of intracellular polysaccharides from Antrodia cinnamomea on the intestinal microbiota of mice with antibiotic-associated diarrhea. Qual. Assur. Saf. Crops Foods 2022, 14, 124–134. [Google Scholar] [CrossRef]
- Jandhyala, S.M.; Talukdar, R.; Subramanyam, C.; Vuyyuru, H.; Sasikala, M.; Reddy, D.N. Role of the normal gut microbiota. World J. Gastroenterol. 2015, 21, 8787. [Google Scholar] [CrossRef]
- Gophna, U.; Konikoff, T.; Nielsen, H.B. Oscillospira and related bacteria–From metagenomic species to metabolic features. Environ. Microbiol. 2017, 19, 835–841. [Google Scholar] [CrossRef]
- Lin, C.; Cai, X.; Zhang, J.; Wang, W.; Sheng, Q.; Hua, H.; Zhou, X. Role of gut microbiota in the development and treatment of colorectal cancer. Digestion 2019, 100, 72–78. [Google Scholar] [CrossRef]
- Sun, S.; Yang, Y.; Lin, X.; Chen, P.; Ye, L.; Zeng, L.; Ye, Q.; Yang, X.; Ceng, J.; Shan, J.; et al. Qiweibaizhu decoction treats diarrheal juvenile rats by modulating the gut microbiota, short-chain fatty acids, and the mucus barrier. J. Evidence-Based Complementary Altern. Med. 2021, 8873294. [Google Scholar] [CrossRef]
- Fan, Y.; Ju, T.; Bhardwaj, T.; Korver, D.R.; Willing, B.P. Week-old chicks with high Bacteroides abundance have increased short-chain fatty acids and reduced markers of gut inflammation. Microbiol. Spectrum 2023, 11, e03616–22. [Google Scholar] [CrossRef]
- Bosshard, P.P.; Zbinden, R.; Altwegg, M. Turicibacter sanguinis gen. nov., sp. nov., a novel anaerobic, Gram-positive bacterium. Int. J. Syst. Evol. Microbiol. 2002, 52, 1263–1266. [Google Scholar] [CrossRef] [PubMed]
- Goseki-Sone, M.; Orimo, H.; Iimura, T.; Miyazaki, H.; Oda, K.; Shibata, H.; Yanagishita, M.; Takagi, Y.; Watanabe, H.; Shimada, T.; et al. Expression of the mutant (1735T-DEL) tissue-nonspecific alkaline phosphatase gene from hypophosphatasia patients. J. Bone. Miner. Res. 1998, 13, 1827–1834. [Google Scholar] [CrossRef] [PubMed]
- Santos, G.M.; Ismael, S.; Morais, J.; Araújo, J.R.; Faria, A.; Calhau, C.; Marques, C. Intestinal alkaline phosphatase: a review of this enzyme role in the intestinal barrier function. Microorganisms 2022, 10, 746. [Google Scholar] [CrossRef] [PubMed]
- Ghosh, S.S.; Wang, J.; Yannie, J.P.; Ghosh, S. Intestinal barrier dysfunction, LPS translocation, and disease development. J. Endocr. Soc. 2020, 4, bvz039. [Google Scholar] [CrossRef]
Figure 1.
Bar plot: cecal mucin, IgA, and ammonia-nitrogen content. Data are expressed as mean ± SE (TS0, TS5, TS10, and TS20, n = 7). The statistical analysis was performed by one-way ANOVA followed by Dunnett’s post hoc test (*p < 0.01, **p < 0.001).
Figure 1.
Bar plot: cecal mucin, IgA, and ammonia-nitrogen content. Data are expressed as mean ± SE (TS0, TS5, TS10, and TS20, n = 7). The statistical analysis was performed by one-way ANOVA followed by Dunnett’s post hoc test (*p < 0.01, **p < 0.001).
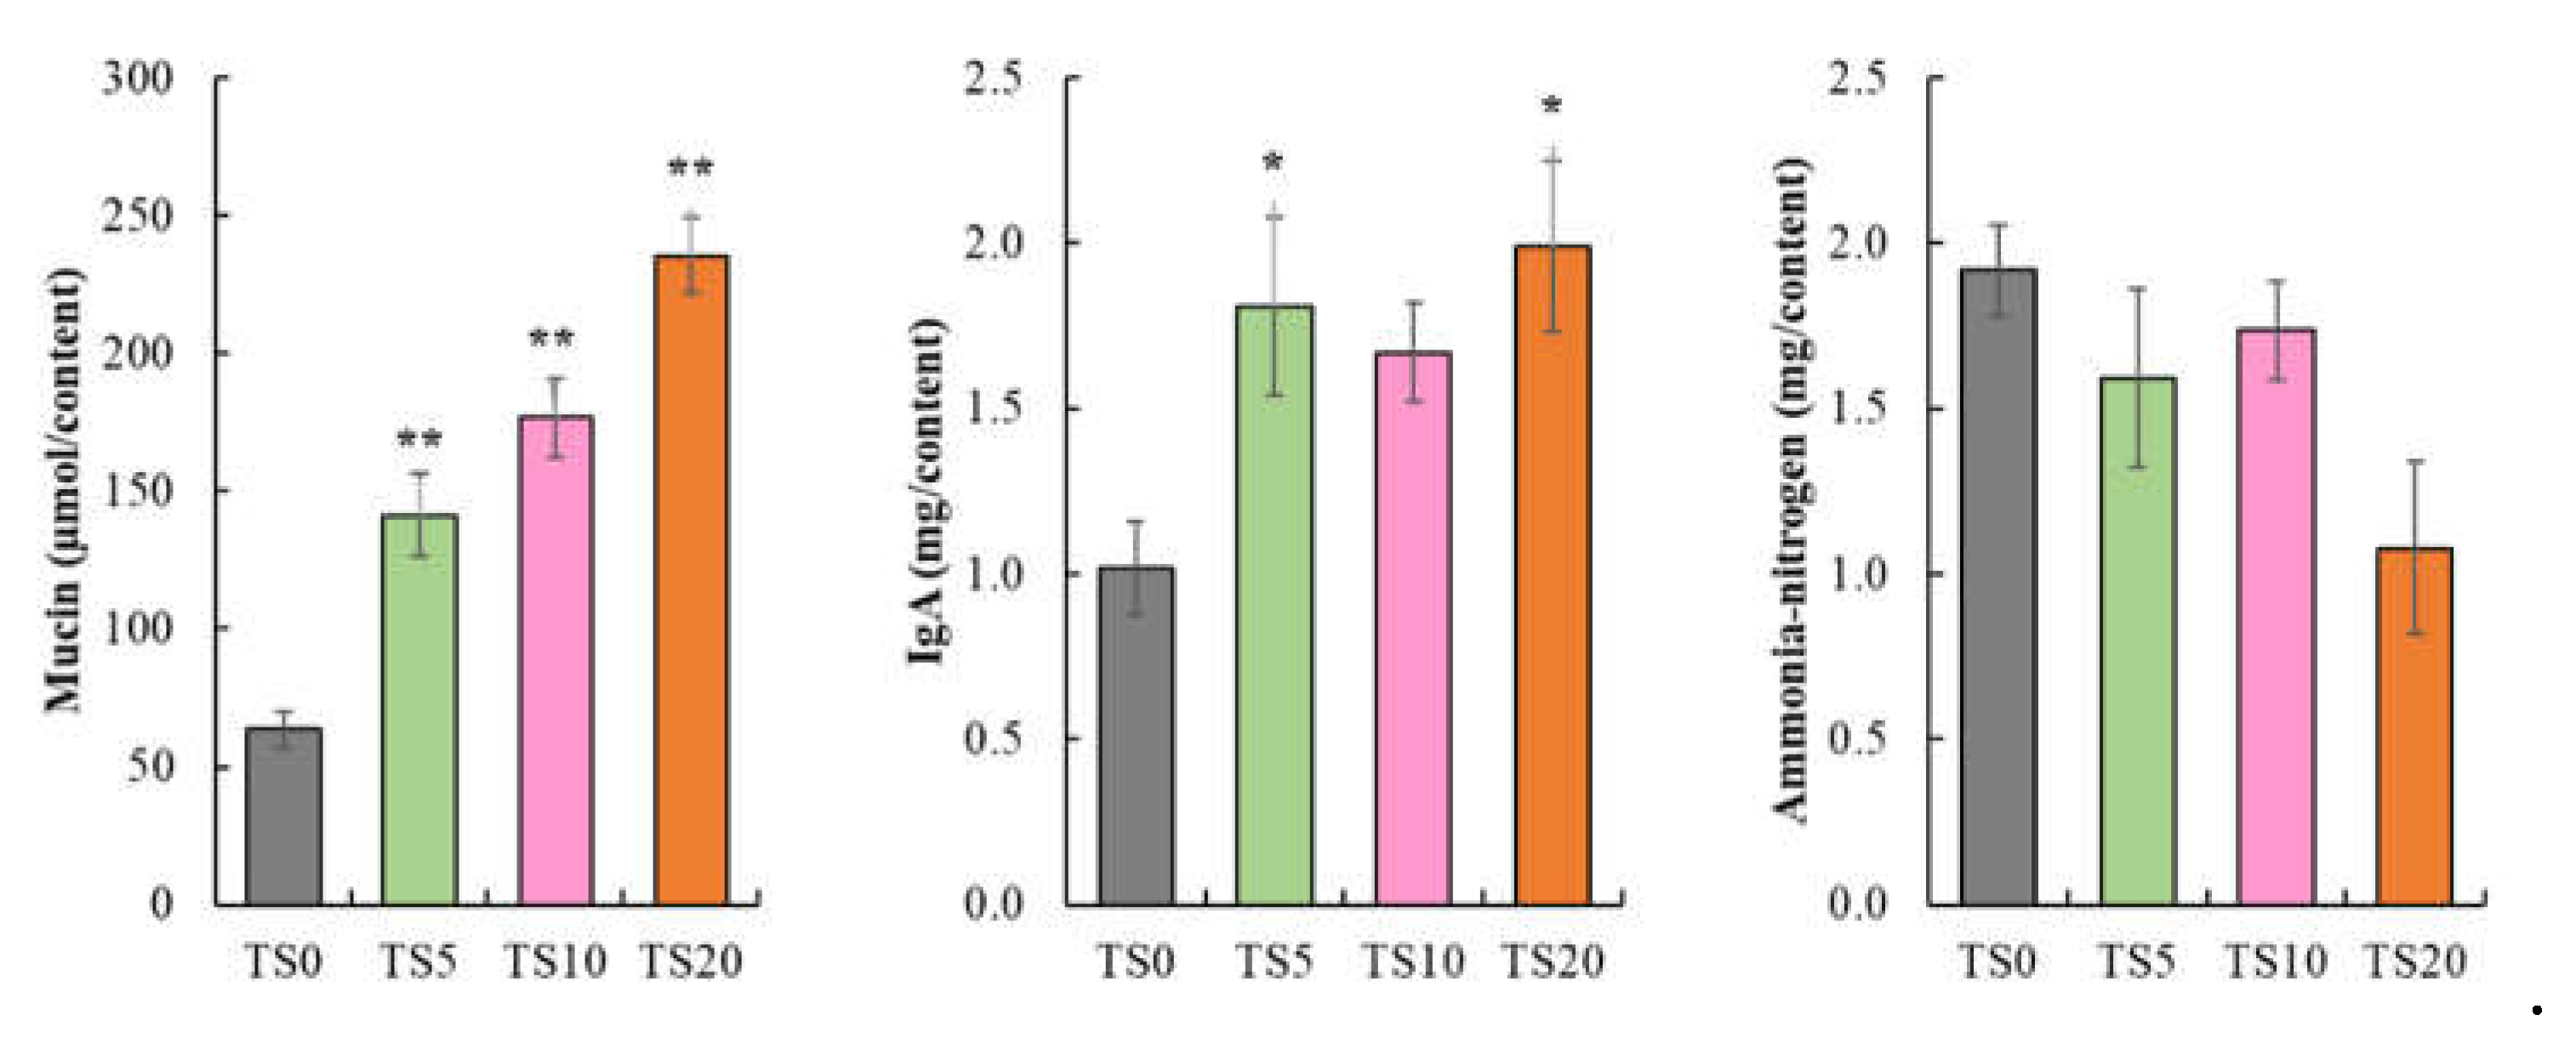
Figure 2.
Box and whisker plot: (A) Shannon and (B) Chao1 indices and (C) Principle Coordinate Analysis (PCoA) plot for the β-diversity and (D) bar chart for the relative abundance at the phylum level. For (A) and (B) microbial data at the feature levels, were analyzed using the non-parametric Kruskal-Wallis H test followed by the Bonferroni correction. In box and whisker plot, the box shows medians/quartiles, and whiskers extend to the most extreme value within 1.5 interquartile ranges (*p < 0.05, **p < 0.01). β-diversity was determined by the weighted UniFrac distance metric in QIIME2. TS0, 0% turmeric starch; TS5, 5% turmeric starch; TS10, 10% turmeric starch; TS20, 20% turmeric starch; n = 7.
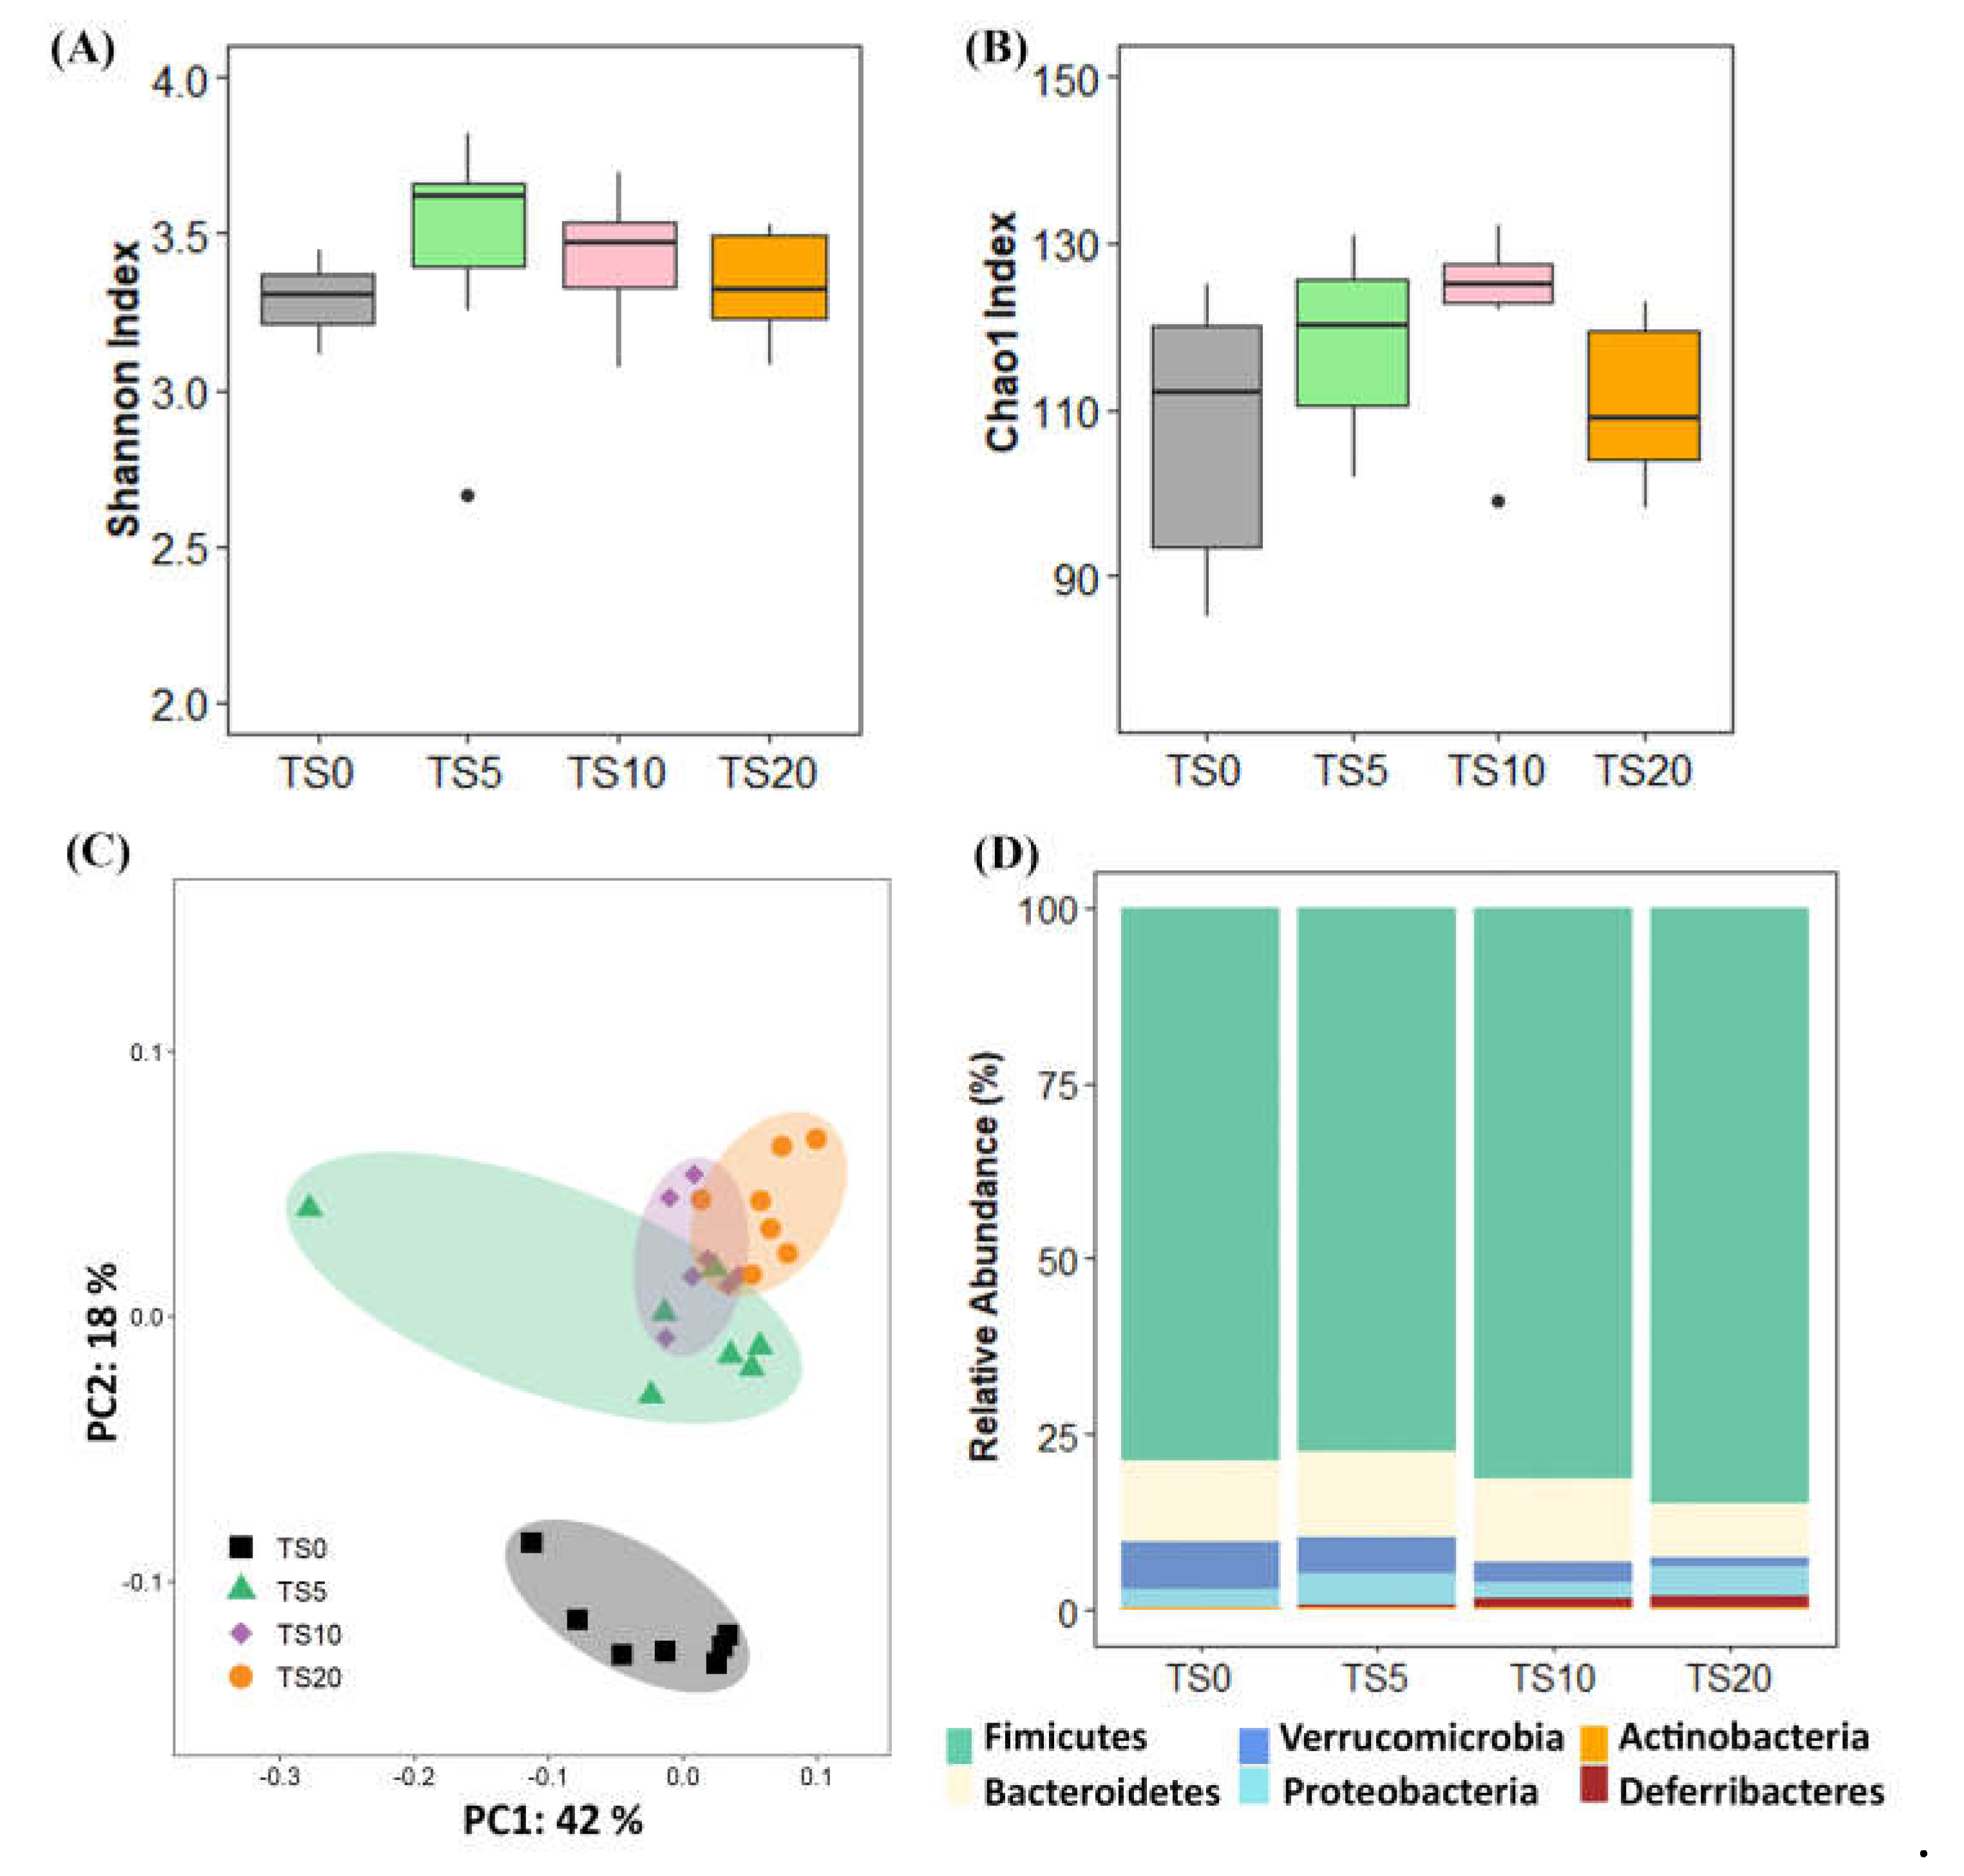
Figure 3.
Box and whisker plot: relative abundance of selected microbial genera in cecal digesta of rats fed TS0, TS5, TS10, and TS20 diets for the 2 weeks. Data were analyzed using the non-parametric Kruskal-Wallis H test followed by the Bonferroni correction. In the box and whisker plot box show medians/quartiles, whiskers extend to the most extreme value within 1.5 interquartile ranges (*p < 0.05, **p < 0.01). TS0, 0% turmeric starch; TS5, 5% turmeric starch; TS10, 10% turmeric starch; TS20, 20% turmeric starch; n = 7.
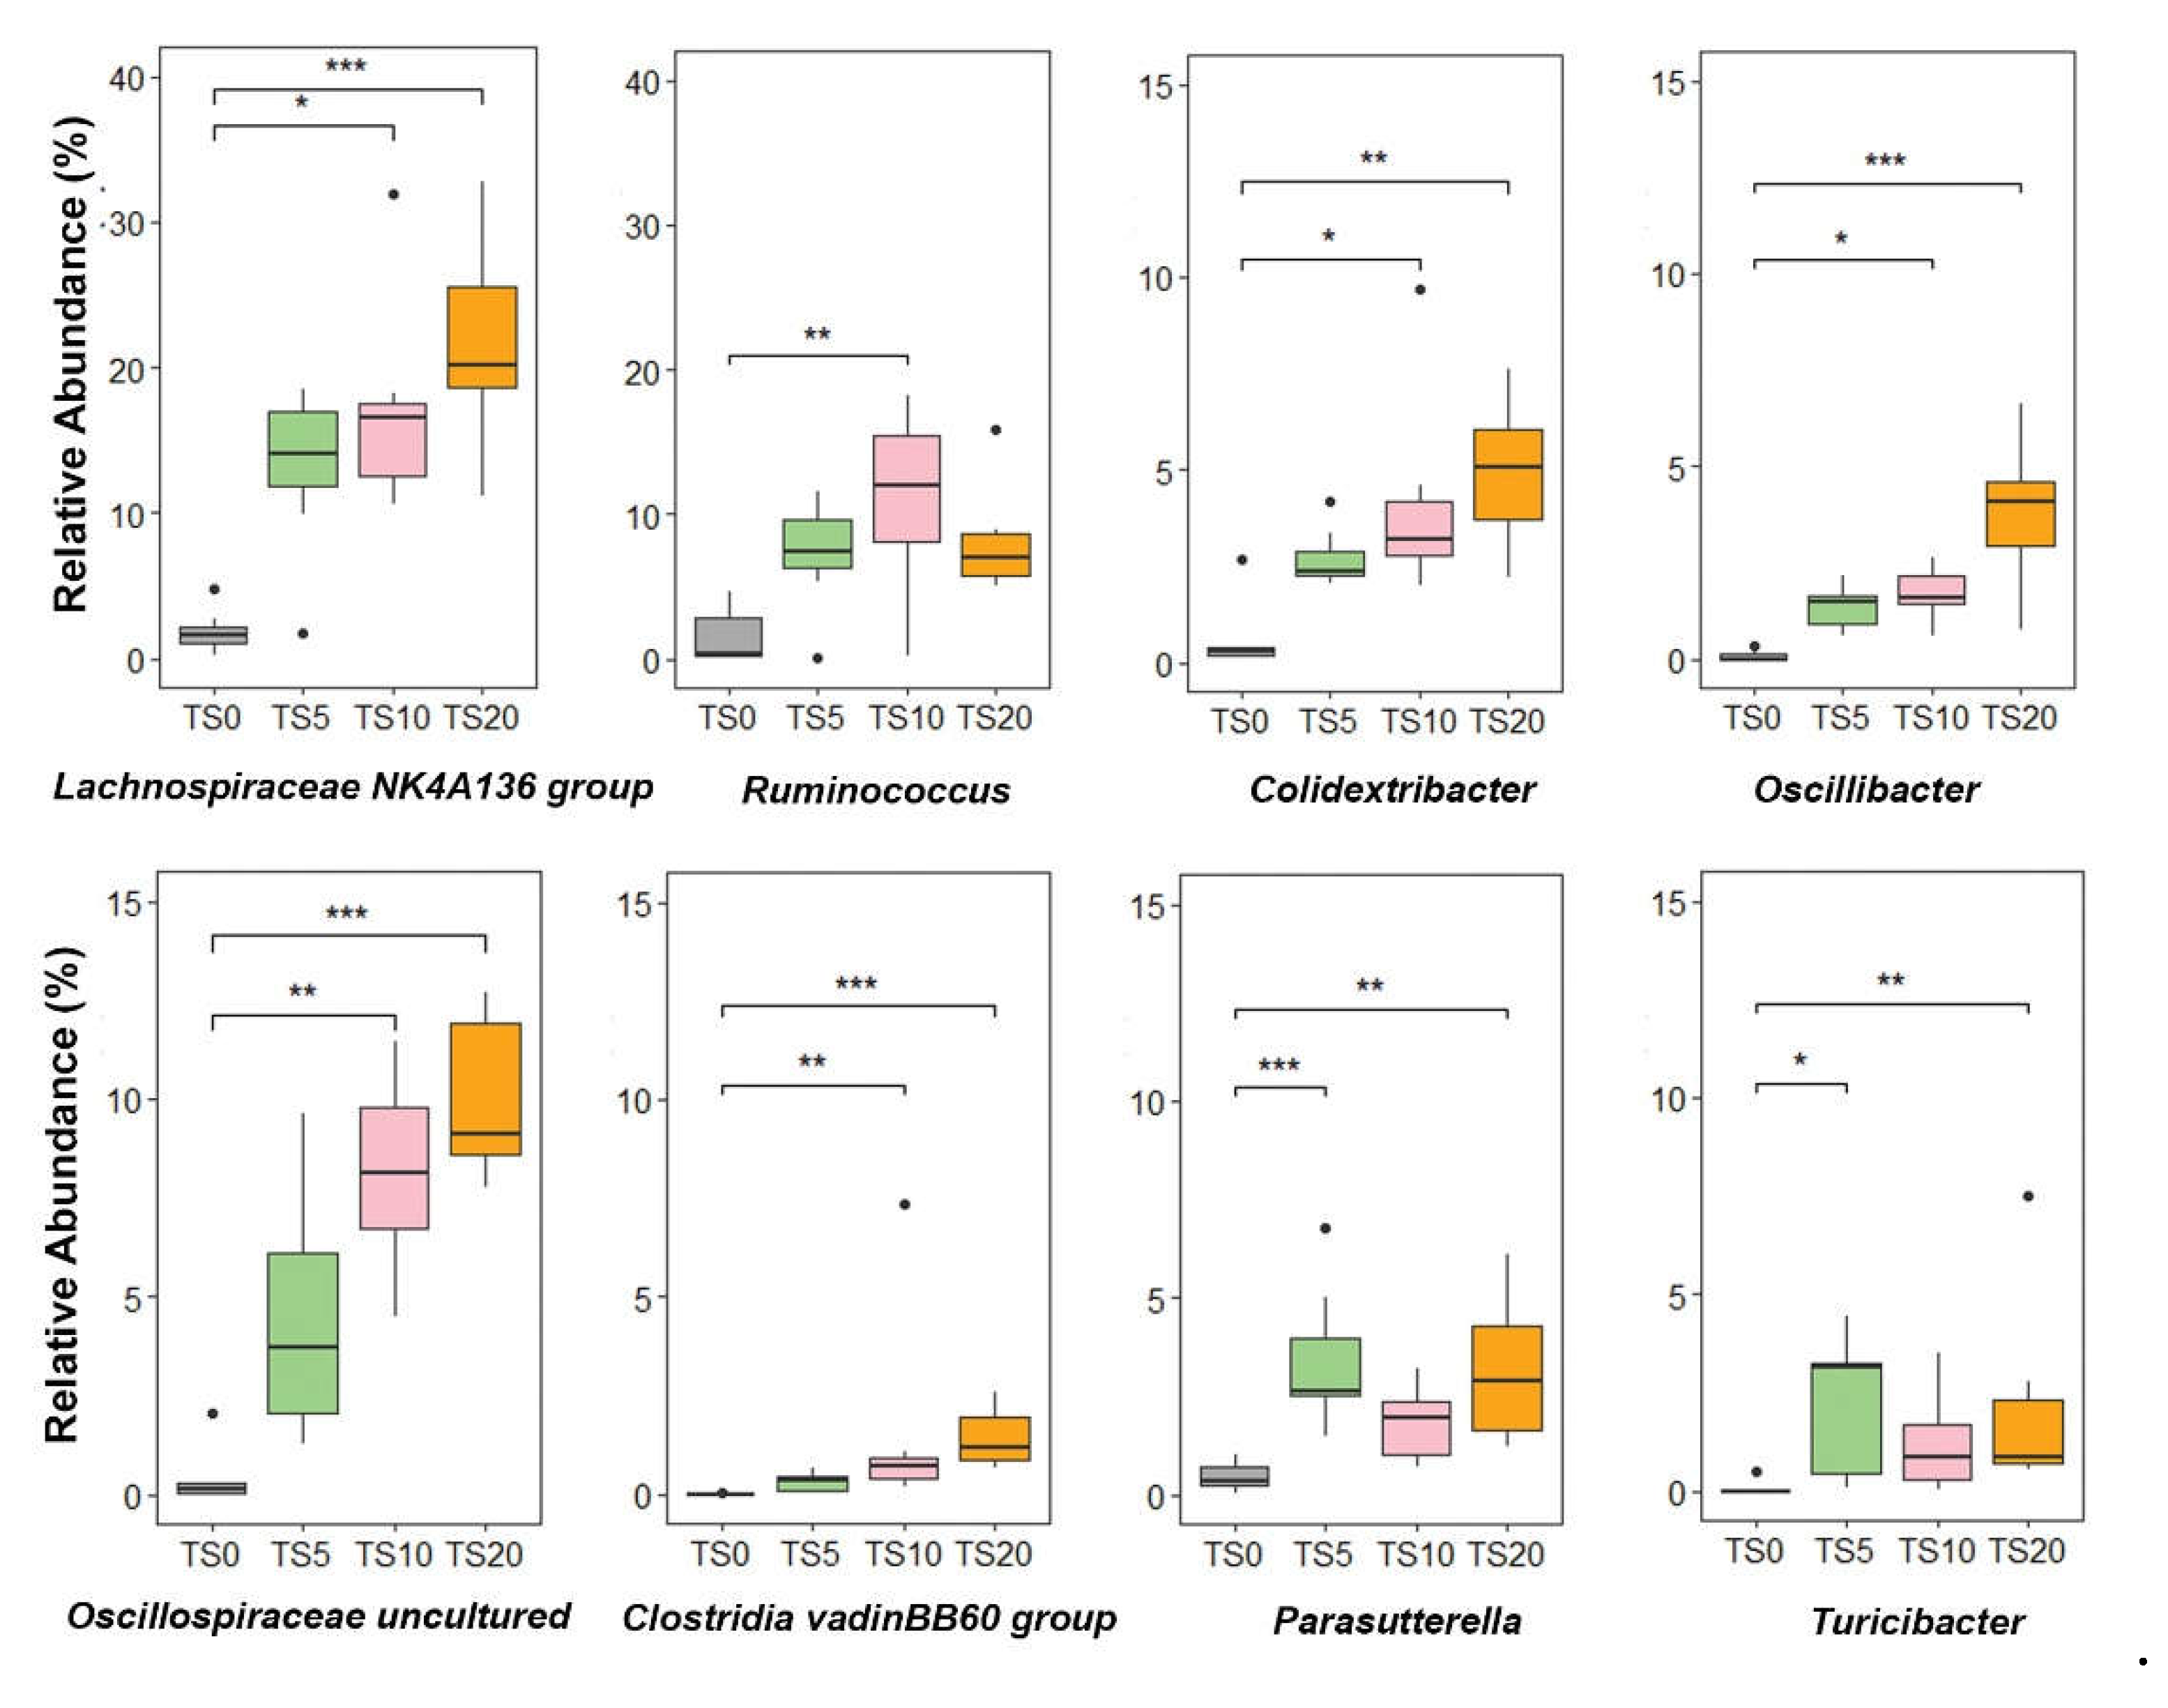

Table 1.
Composition of crude turmeric starch.
| Component | g per 100 g |
|---|---|
| Moisture | 9.74 |
| Protein | 1.43 |
| Lipid | 0.25 |
| Ash | 1.27 |
| Total starch | 68.8 |
| Resistant starch | 61.8 |
| Digestible starch | 6.96 |
| Phosphorus (ppm) | 4972 |
| Energy (kcal per 100 g) | 233.57 |
Table 2.
Composition of the experimental diets.
| Ingredients (g per kg diet) | TS0 | TS5 | TS10 | TS20 |
|---|---|---|---|---|
| Casein | 200 | 200 | 200 | 200 |
| L-Cystine | 3 | 3 | 3 | 3 |
| Soybean oil | 70 | 70 | 70 | 70 |
| Mineral mix (AIN-93G-MX) | 35 | 35 | 35 | 35 |
| Vitamin mix (AIN-93VX) | 10 | 10 | 10 | 10 |
| Choline bitartrate | 2.5 | 2.5 | 2.5 | 2.5 |
| Sucrose | 100 | 100 | 100 | 100 |
| 3-Butylhydroquinone | 0.014 | 0.014 | 0.014 | 0.014 |
| Cellulose | 50 | 50 | 50 | 50 |
| Alpha-cornstarch | 129.5 | 129.5 | 129.5 | 129.5 |
| Cornstarch | 400 | 350 | 300 | 200 |
| Turmeric starch | 0 | 50 | 100 | 200 |
| Energy (kcal per kg diet) | 3804 | 3730 | 3657 | 3509 |
TS0, 0% turmeric starch; TS5, 5% turmeric starch; TS10, 10% turmeric starch; TS20, 20%, turmeric starch.
Table 3.
Zoometric parameters of rats.
| TS0 | TS5 | TS10 | TS20 | |||||||||
|---|---|---|---|---|---|---|---|---|---|---|---|---|
| Final body weight (g) | 240 | ± | 5 | 229 | ± | 2 | 232 | ± | 3 | 233 | ± | 5 |
| Body weight gain (g/2 wk) | 58.8 | ± | 2.1 | 48.4 | ± | 1.9 | 51.9 | ± | 1.9 | 52.4 | ± | 6.6 |
| Feed intake (g/2 wk) | 202 | ± | 3 | 193 | ± | 2 | 199 | ± | 2 | 200 | ± | 4 |
| Perirenal + epididymal fat (g) | 7.82 | ± | 0.89 | 5.32 | ± | 0.25*** | 5.56 | ± | 0.23*** | 4.84 | ± | 0.24*** |
| Dry feces (g/2 d) | 2.08 | ± | 0.06 | 3.62 | ± | 0.23*** | 4.72 | ± | 0.14*** | 6.94 | ± | 0.35*** |
| Starch excretion (%) | 0.04 | ± | 0.00 | 4.28 | ± | 0.56** | 8.95 | ± | 0.23*** | 23.0 | ± | 1.4*** |
Data are expressed as mean ± SE (TS0, TS5, TS10, and TS20, n = 7). The statistical analysis was performed by one-way ANOVA followed by Dunnett’s post hoc test (*p < 0.05, **p < 0.01, ***p < 0.001).
Table 4.
Cecal parameters.
| TS0 | TS5 | TS10 | TS20 | |||||||||
|---|---|---|---|---|---|---|---|---|---|---|---|---|
| Organic acid (µmol/content) | ||||||||||||
| Acetate | 258 | ± | 20 | 408 | ± | 60* | 451 | ± | 37** | 545 | ± | 27*** |
| Propionate | 35.7 | ± | 5.7 | 40.2 | ± | 5.0 | 41.5 | ± | 3.6 | 46.9 | ± | 4.1 |
| n-Butyrate | 21.3 | ± | 5.2 | 27.7 | ± | 4.4 | 28.5 | ± | 6.6 | 27.1 | ± | 5.3 |
| Total-SCFA | 315 | ± | 28 | 476 | ± | 67* | 521 | ± | 41** | 619 | ± | 32*** |
| Succinate | 25.0 | ± | 9.4 | 7.86 | ± | 2.07 | 4.67 | ± | 2.04* | 5.62 | ± | 1.84* |
| Lactate | 2.41 | ± | 1.63 | 11.8 | ± | 3.0 | 13.6 | ± | 367* | 12.9 | ± | 2.2* |
| Cecal pH | 7.77 | ± | 0.04 | 7.40 | ± | 0.09* | 7.25 | ± | 0.05*** | 7.12 | ± | 0.05*** |
| Cecal tissue (g) | 0.68 | ± | 0.01 | 0.93 | ± | 0.07** | 1.07 | ± | 0.07*** | 1.11 | ± | 0.04*** |
| Cecal digesta (g) | 2.41 | ± | 0.25 | 3.54 | ± | 0.39* | 3.70 | ± | 0.28* | 4.71 | ± | 0.22*** |
Data are expressed as mean ± SE (TS0, TS5, TS10, and TS20, n = 7). The statistical analysis was performed by one-way ANOVA followed by Dunnett’s post hoc test (*p < 0.05, **p < 0.01, ***p < 0.001).
Table 5.
Intestinal ALP activity (unit/mg protein).
| TS0 | TS5 | TS10 | TS20 | |||||||||
| Duodenum | 301 | ± | 56 | 1168 | ± | 195* | 831 | ± | 180 | 900 | ± | 279 |
| Jejunum | 155 | ± | 14 | 119 | ± | 30 | 75.3 | ± | 28.4*** | 100 | ± | 23** |
| Ileum | 127 | ± | 15 | 76.3 | ± | 8.1* | 73.1 | ± | 12.3* | 61.7 | ± | 12.8** |
| Cecum | 37.7 | ± | 4.4 | 39.2 | ± | 4.6 | 37.1 | ± | 4.8 | 48.0 | ± | 5.6 |
| Colon | 51.3 | ± | 8.4 | 55.9 | ± | 21.9 | 51.1 | ± | 9.1 | 11.9 | ± | 3.0 |
Data are expressed as mean ± SE (TS0, TS5, TS10, and TS20, n = 7). The statistical analysis was performed by one-way ANOVA followed by Dunnett’s post hoc test (*p < 0.05, **p < 0.01, ***p < 0.01).
Disclaimer/Publisher’s Note: The statements, opinions and data contained in all publications are solely those of the individual author(s) and contributor(s) and not of MDPI and/or the editor(s). MDPI and/or the editor(s) disclaim responsibility for any injury to people or property resulting from any ideas, methods, instructions or products referred to in the content. |
© 2024 by the authors. Licensee MDPI, Basel, Switzerland. This article is an open access article distributed under the terms and conditions of the Creative Commons Attribution (CC BY) license (http://creativecommons.org/licenses/by/4.0/).
Copyright: This open access article is published under a Creative Commons CC BY 4.0 license, which permit the free download, distribution, and reuse, provided that the author and preprint are cited in any reuse.


