
Submitted:
02 April 2025
Posted:
03 April 2025
You are already at the latest version
Abstract
This paper analyzes the process of energy transition from traditional solid fuel heating to an air-to-air (A2A) heat pump-based heating system. Special emphasis was placed on the implementation of new technologies for improved management of energy systems aiming to elevate both comfort levels and energy efficiency. This paper explores the use of open-source Home Assistant software as an integration platform for home automation, designed to manage smart home devices while preserving local control, user privacy and increasing cybersecurity. The proposed hardware platform includes a Raspberry Pi with appropriate IoT modules, providing a flexible and economically viable solution for household needs.
Keywords:
energy transition
; Internet of Things
; Thermal Comfort
; heat pump
; smart home
; Home Assistant
; Raspberry Pi
1. Introduction
The energy transition is one of the major challenges facing modern society. This transition entails a shift from traditional energy sources, such as fossil fuels, to renewable and cleaner sources that reduce negative environmental impacts. The goal is to reduce greenhouse gas emissions, increase energy efficiency and achieve sustainability. In this context, the Republic of Croatia, as a member of the European Union, sets high goals for the development of green and digital energy policy by 2030 [1].
One of the key elements of Croatia’s energy strategy is aimed at decarbonizing the construction sector and encouraging green investments. According to data, heating accounts for 40% of total energy consumption in Europe [2], indicating an urgent need to optimize heating systems. Studies indicate that a considerable portion of energy usage results from the unnecessary overheating of indoor spaces, where the air temperature exceeds the intended design range of 22 to 24 °C. Addressing this overheating issue has the potential to reduce energy consumption by as much as 15% [3].
Accordingly, heat pumps with the application of new technologies of the fourth industrial revolution (Industry 4.0, 4IR) [4] are becoming important elements of the energy transition, providing efficient heating solutions and maintaining comfort. However, the introduction of new technologies alone is not enough; effective management is also necessary. Internet of Things (IoT) technology is playing an increasingly important role, enabling devices to connect to each other and exchange data over the internet. This connectivity enables monitoring, forecasting, and optimization of energy consumption, thereby increasing efficiency and reducing overall costs.
Otherwise, one of the main challenges is the fragmented smart device market, where manufacturers often offer closed systems. This opens the door to independent free, open-source solutions such as openHAB [5,6] and Home Assistant [7] that can integrate different smart devices from different ecosystems and can significantly contribute to reducing energy consumption by optimizing the operation of devices in real time and adapting consumption and comfort to the needs of the user.
2. Objectives
This research aims to address the energy transition and optimize the Air-Air (A2A) heat pump used in heating and air conditioning systems in southern Croatia by leveraging IoT technology, with a focus on smart home solutions. The goal is to determine how to improve the heating of a family house in an efficient and economically acceptable way with the help of automation of the central system for the control of smart home devices. This paper analyzes Home Assistant (HA), a free and open-source home automation software, designed to be an integration platform independent of the Internet of Things (IoT) ecosystem and a smart home hub for controlling smart home devices, with a focus on local control, privacy and cybersecurity. The hardware platform is Raspberry Pi (RPi) [8] and associated IoT-based modules. The task of the server (HA) is to collect data through various sensors and manage the operation of the heat pump in order to reduce energy consumption by optimizing the operation of the device in real time and adjusting the consumption to the needs of the user.
3. Background
For the house built in Zadar, in the Republic of Croatia, an energy transition of the heating system from the basic heating method, wood heating from a fireplace-stove to heating with a heat pump was made as an environmentally acceptable heating method and at the same time financially affordable, while the quality of living in the currents is not impaired.
The house in which the transition was made is divided into two zones, Figure 1, the first zone consists of the living room and kitchen, while the second zone is the rooms, toilet and bathroom. The previous situation on the site had a wood-burning stove with a nominal power of 8 kW, located in the central part of the house, which enabled relatively good heat distribution in the first zone, while the temperatures in the second zone were maintained in acceptable comfort settings if necessary to heat the rooms through electric convectors.
The existing system was replaced with two A2A heat pumps, each covering half of the house. Electric convectors were retained, to which smart sockets were added (Zigbee2Mqtt).
4. IoT
The Internet of Things (IoT) is a new paradigm that has changed the traditional way of life to a high-tech lifestyle. Smart city, smart homes, pollution control, energy saving, smart transportation, smart industries are such transformations due to IoT [9].
The term smart home implies a set of integrated network devices that automate various functions within the home. These internet-connected devices can be managed and automated from different locations. The central place where all smart home devices connect is the server. The server can be accessed through various hardware clients such as cell phone, tablet, laptop, computer.
Home automation became widely available to people when industry made it possible to apply sensors and actuators at home. The first devices of this type appeared in 1975 under the name X10 through Pico Electronics and commercially available in 1978. Initially with limited computer availability, the systems used a non-centralized architecture based on a sensor-controller-actuator configuration that provided limited capabilities. Today’s technology allows us to use a centralized client-server architecture through wireless communication [10].
Such an architecture allows other devices to be managed through a central system. The core of such a system is a server with the associated operating system and services, which serves as a central control unit. The services on the server can be accessed via the client applications of a smartphone, tablet or computer. Smart devices connect wired or wirelessly to the server via communication protocols such as Wi-Fi, Bluetooth, BLE, ZigBee, Ethernet, Thread, Metter.
The Internet of Things (IoT) plays a significant role in optimizing the operation of heat pumps, providing numerous benefits in terms of efficiency, energy savings, and user comfort. And all based on real-time data monitoring and analysis.
Some of the key benefits of this approach are:
Smart management: IoT enables the creation of smart homes and buildings in which heating and cooling systems automatically adapt to external conditions and user habits.
Optimization of operation: Sensors installed in different parts of the building can collect data on temperature, humidity and air quality. Based on this data, machine learning algorithms can optimize the operation of the heat pump and other systems to ensure maximum comfort with minimal energy consumption.
Demand forecasting: IoT systems can predict future heating or cooling needs based on historical data and weather forecasts. This makes it possible to proactively manage the system and avoid unnecessary costs.
Integration with other systems: Heat pumps can be integrated with other systems in the home, such as solar panels and batteries. In this way, an energy self-sufficient system can be created that will further reduce dependence on the public grid.
Remote monitoring and management: Users can monitor energy consumption and manage their heating system via a mobile app, even when they are not at home.
Some of the key challenges of this approach are:
- Cost: Investing in IoT systems and heat pumps can be significant, but it pays off in the long run due to savings on energy bills;
- Security: As more devices connect to the internet, so does the risk of a cyberattack. Therefore, it is important to ensure that IoT systems are well protected;
- Standardization and fragmentation: There are still no universal standards for IoT devices and communication protocols, which makes it difficult for different systems to interconnect and market fragmentation through the closure of devices from individual manufacturers into their own ecosystems.
5. Smart Home Topology
The smart home system consists of smart devices such as a temperature, pressure, relative humidity, air quality and smart socket that are connected to the Gateway via WiFi, Zigbee and Bluetooth protocols. The usual commercial way of connecting IoT is based on the Gateway, Device, Router, and Cloud, Figure 2. In this architecture, the cloud is the storage space on the internet. The gateway connects IoT devices through its own network (Zigbee, Bluetooth, WiFi). Management and monitoring of the device takes place through the application and can be performed via mobile phone, tablet or computer. Communication between the Gateway and the Cloud is facilitated through a WiFi network, where the cloud is a server on the Internet. Such solutions are suitable for quickly creating your own smart home heat. However, they entail some disadvantages including:
- Certain devices require their own gateways and their own monitoring applications that make up their own ecosystem. This results in an increase in the number of gateways and management applications, which can heighten the risk of network interference, complicate management efforts, and ultimately lead to system dysfunction;
- High dependence on a stable Internet connection, potential security risks when transmitting data over the Internet, and the possibility of interception of communications by unauthorized persons. In addition, centralized data processing in the cloud can lead to data availability issues in the event of sudden server or network outages;
- Data privacy issues, where all collected data is stored on remote servers, increasing the risk of unauthorized access. Also, there is a possibility that the data may be used for marketing purposes without the user’s knowledge.
To avoid these shortcomings, an internal server solution can be employed as an integration platform independent of the ecosystem, Figure 3. The system consists of a Home Assistant server built on Raspberry hardware (RPi 5). Home Assistant is a complete solution consisting of Linux server and services for monitoring, management, and data storage.
The smart home system was applied to a family house with a net floor area of 106 m2 shown in Figure 1, smart items were placed around the rooms of the house. The system is intended for home heating, which is based on the operation of an air-to-air (A2A) heat pump. For the purpose of satisfying the thermal load of the building, two heat pumps A2A with a total heat output of 9 kW [11] and electric convector heaters (ECH) with a total power of 4 kW were installed. The HA system, located in the central part of the house, acts as the brain of the entire smart home. Devices for measuring current, voltage, electricity consumption are located in the distribution cabinet (SDRS, Smart Din Rail Switch). Indoor temperature sensors ti,1-ti,7 are strategically placed in different rooms to enable precise measurement and regulation of temperature in every part of the house.
External temperature sensors to,HP1 and to,HP2, located on the outdoor units of the heat pumps, allow the system to adjust the operation of the heating cranes depending on the external conditions.
Sensors to,1 and to,2 installed outside the home, provide additional information about weather conditions, which is useful for predicting heating needs. Smart sockets are placed in the rooms for the purpose of possible additional heating of the space. Based on this data, the system intelligently manages the operation of heat pumps and smart sockets, adjusting the room temperature according to presets or user needs, all with the aim of achieving optimal comfort and maximum energy efficiency.
6. Climatological Days
Climatological data presented (Figure 5) collected at the nearest measuring station of the Zadar building [12], Republic of Croatia (Southern Croatia) indicate extremely favorable climatic conditions for efficient operation of heat pumps during the winter months
According to the measured and collected values of outdoor temperature and relative humidity during 2024 at the site of the building (In situ), shown in Figure 6 and Figure 7, it was determined that the outdoor temperature did not fall below 2 °C, while the relative humidity rarely exceeds 80%, which shows that the outdoor temperature is mostly within the limits of the average values of the nearest climatological station.
These climatological data are important for the reason that when the outside temperature is low and the humidity is high, a layer of ice can form on the external heat exchanger of the heat pump. Following this, the heating crane is required to undergo a defrost cycle to melt the ice, resulting in a reduction of its efficiency [13]. Favorable climatological conditions at the site of the building enable continuous operation of the heat pump without the need to enter the defrosting phase, which ensures the efficiency of the system and the optimal coefficient of performance (COP), further increasing the energy efficiency of heating.
7. Energy Analysis
In order to optimize the operation of the new system and plan future energy investments, a calculation of heat losses of transmission and ventilation was carried out using an analytical model of heat load in accordance with the HRN EN 12831 standard, which provides guidelines for calculating energy needs for heating and cooling, taking into account the specifics of climatic locations. The calculation is based on the static and dynamic parameters of the structure. Static parameters included geometry, and thermal characteristics of building materials. Details on the thermal properties of the material are given in Table 1.
Dynamic parameters include meteorological and comfort parameters that affect the total energy load of the facility. In this study, simulations of two models were made and compared with the results of measurements. Model 1 represents a reference scenario for a cold winter, with the outdoor design temperature set at -4 °C, all indoor temperatures standardized at 20 °C, according to the ordinance. In Model 2, the external design temperature is set to the value of the average lowest outdoor temperature of the nearest reference station and is 7.5 °C [12]. The energy output values of the model are compared with the data collected by on-site measurements via the HA system, where the internal personalized temperature settings range from 21-19 °C, which corresponds to an average indoor temperature of 20 °C. To calculate the required heating energy for individual models, data on heating degree days of 1600 for the area of southern Croatia prescribed by the ordinance [14] were used.
The thermo-technical characteristics of the building and the heating pump shown which were used in the models are detailed in Table 2 and Table 3. The results of the model simulation and the measured values of the object are presented in Table 4.
The results obtained from different models presented in Table 4 provide a complete picture of the energy performance of the building in different conditions and indicate the self-sufficiency of heat energy obtained from the heat pump for heating purposes. According to the calculation of the annual consumption of thermal energy per square meter, Model 1 and Model 2 can be drilled into energy class C, while the measured values turn the building into a more favorable energy class B [14].
8. Automation and Process Control
Home Assistant provides exceptional flexibility in the automation of IoT devices. It allows you to create custom automations through an intuitive visual editor, Figure 8a or using YAML configuration files for more advanced users [15]. Integration of different devices into HA is easy thanks to extensive support for existing integrations and the ability to add new ones through the Home Assistant Community Store (HACS). This module facilitates the straightforward management and installation of additional third-party integrations and components. For example, Figure 8 shows how HA can be used to control a heat pump through integration for Toshiba air conditioners [16]. The Home Assistant uses sensor data to automate the operation of the heat pump. Automation includes:
- Time Management: Automatically turns on and off at predefined time intervals;
- Maintaining the set temperature: the current room temperature is compared with the preset desired temperature and the device is activated as needed to maintain the desired temperature;
- Flexibility: The system allows adjustment of the temperature and operating time settings according to the individual needs of the user
By integrating additional sensors into smart homes, it represents a significant step towards improving comfort and energy efficiency. For example, the Thermal Comfort [17] sensor for HA, Figure 9a provides valuable information on key parameters such as absolute humidity, dew point, heat index, and subjective heat perception. Together with information from other sensors, such as presence detection, meteorological measurements, and air quality sensors, Figure 9b [18], this technology allows heating and cooling systems to automatically and adapt to current conditions. This reduces the possibility of inconveniences such as dry air or excessive humidity. Through this approach, smart homes not only become more functional with a focus on a personalized experience that ensures maximum comfort with minimal energy consumption. The future of smart homes lies in further automation, which will enable even better adaptation of user needs.
9. IoT Security
One of the main challenges of IoT is the risk of cyberattack. Cybersecurity in the analyzed system is strengthened by the integration of Zigbee and BLE networks, which enable reliable and encrypted communication between connected devices. These protocols use AES-128 encryption, to protect data transmission, making it significantly more difficult to intercept and manipulate information. In addition, the SSL protocol, which is implemented for secure access to the Home Assistant (HA) outside the home network, further strengthens data protection through the use of RSA Public-key cryptography. Communication takes place through the NGINX Home Assistant SSL proxy, which provides an additional layer of protection against potential attacks. Two-factor authentication (2FA), integrated into the system, provides additional security by requiring multiple user identification, which reduces the risk of unauthorized access and enables system stability with a high level of protection of sensitive data.
10. Measurement Results
The analysis of the data collected by the Home Assistant for the heating period, shown in Figure 10, gives us an insight into the electrical power of the heat pump. The peak values on the graph indicate the moments of maximum electrical power of the heat pump, which is necessary to quickly reach the desired temperature in the room.
In Figure 11, the electricity consumed per day is shown. On the graphs we can see the maximum values of energy consumption in the period of the lowest ambient temperatures, which did not exceed 20 kWh/day. Monthly consumption is shown in Figure 12, from which we can see that the total electricity consumption for the heating period was 771 kWh, which is significantly less than the projected project values (Table 4). However, the consumption itself does not correspond to a sufficiently important parameter of the heat pump, which is to achieve comfort in the room. The success of achieving comfort in the building can be seen in Figure 13, Figure 14 and Figure 15.
Figure 13a shows the average daily values of the outdoor temperature (to) and the temperature in the living room (t1) during the heating period, while Figure 13b shows the corresponding relative humidity values. These graphs clearly show us the efficiency of heat pump automation and we can conclude whether the temperature and humidity in the living room are maintained within the desired and recommended comfort limits (21 °C, 40-60%) for the entire heating period.
Figure 14 shows the living room temperature ti,1 and the ambient temperature, that, for the heating time period. Figure 15 is collected relative humidity of indor and out door enviroment for the captured period of time.
For a better insight into the operation behavior of heat pumps at different temperatures and loads, we can use the collected data measurements on smaller record steps such as the second, because the data collection system allows us to do so. Figure 16 shows a sample of the average daily electricity consumption profile of a heat pump. From the picture we can see that at the beginning of work, the crane turns on at maximum load in order to reach the desired temperature as quickly as possible. However, after a relatively short time, the load is significantly reduced to approx. 30% of the nominal value, which indicates a quick adaptation of the heat pump to the actual heating requirements.
The automation of the heating system is based on a strategy of discontinuous operation, where heat pumps are activated when temperatures drop below 18.5 °C and turn off daily at 23:00. Analysis of the measured results shows that the average load on the heat pump is 40% for the heating period. Given that the heat pump works at a time when daily temperatures are higher, with the average daily temperature in the heating period being 9.9 °C in the time from 7 to 23h, it results in an increase in COP.
Analyses for the period 2020–2024 show that electricity produced at night in Croatia mostly comes from sources with a higher share of fossil fuels, resulting in higher greenhouse gas emissions (CO2eq/kWh) whose values are collected through the HA sensor (formerly known as “CO2 Signal”) shown in Figure 17. The sensor queries the Electricity Maps API for the CO2 intensity of a specific region. Data can be collected for your home by using the latitude/longitude or a country code [19].
To reduce the overall environmental footprint and increase the COP, the operation of the system is adapted to the daily heating needs, thus prioritizing sustainability and energy efficiency over lower electricity costs. This approach allows for a more efficient use of resources while reducing the negative impact on the environment.
Heating a house with a wood stove can affects the concentration of PM2.5 particles (particles with a diameter of less than 2.5 micrometers) in the air. Long-term exposure to these particles can cause health problems [20]. Particulate emissions depend on the type of wood, humidity, burning method and type of stove/fireplace. For the purposes of the work, the values of PM2.5 particles [18] were measured in a room heated using an A2A heat pump and a fireplace wood stove. The results of the measurements are shown in Figure 19, where the left part of the graph compares the values of particles in the air when heated with a heat pump, while the right part represents wood heating. It is evident that the concentration of particles resulting from wood heating has surpassed the allowable limit of 15 μg/m3 [21], further supporting the need for an energy transition.
11. Conclusions
The energy transition represents a key step towards a sustainable future, enabling the transition from traditional, fossil fuels to renewable and cleaner energy sources. This contributes to the reduction of greenhouse gas emissions and negative environmental impacts, and increases energy efficiency and sustainability. In order for such systems to function effectively, it is crucial to ensure that they are properly managed and monitored through networked physical devices connected through the Internet.
This paper shows that the open-source Home Assistant software represents a local, flexible and secure solution for the integration and management of smart home devices, including systems such as an air-to-air heat pump. Home Assistant allows devices from different closed ecosystems to be connected, thus overcoming the limitations of individual manufacturers and providing a centralized platform for monitoring and optimization.
By applying the proposed system based on the Raspberry Pi platform, it is possible to optimize energy consumption, increase user security and privacy, and contribute to reducing environmental impact, which confirms the importance of such integrated solutions in the context of the global energy transition.
12. List of Signs
The following signs used in this manuscript:
| And | area, m2 |
| V | Volume, m3 |
| Energy, Wh | |
| Power, W | |
| Power, W/m2 | |
| U | U-value, W/m2K |
| PM | Particle Matter, μg/m3 |
| R | R-value, m2K/W |
| HR | Relative Humidity, % |
| a | Annual, a |
| p | Pressure, Pa |
| t | Temperature, °C |
Indexes
| e | Electric |
| h | Heating |
| i | Indoor |
| o | Outdoor |
| eq | Equivalent |
Author Contributions
Data collection, Ivica Glavan; Methodology, Ivica Glavan; Formal analysis, Ivica Glavan, Ivan Gospić; Software, Ivica Glavan; Supervision, Ivica Glavan; Validation: Ivica Glavan; Ivan Gospić, Igor Poljak; Visualization: Ivica Glavan; Writing—original draft, Ivica Glavan; Writing—review & editing, Ivica Glavan, Ivan Gospić, Igor Poljak. All authors have read and agreed to the published version of the manuscript.
Funding
The research presented in the manuscript did not receive any external funding.
Abbreviations
| 4IR | Industry 4.0 |
| AES | Advanced Encryption Standard |
| A2A | Air to Air |
| COP | Coefficient of Performance |
| ECH | Electric Convector Heater |
| HA | Home Assistant |
| HDD | Heating Degree Day |
| HP | Heat Pump |
| HVAC | Heating Ventilation and Air Conditioning |
| IoT | Interne of Things |
| MQTT | Message Queuing Telemetry Transport |
| RPi | Raspberry Pi |
| SDRS | Smart Din Rail Switch |
| SSL | Security Socket Layer |
References
- “Croatia 2030,” Hrvatska2030.hr. [Online]. Available: https://hrvatska2030.hr (accessed on 5 December 2024).
- European Parliament. Directive 2010/31/EU of the European Parliament and of the Council of 19 May 2010 on the energy performance of buildings (recast). Off J Eur Union 2010, 18(6), 2010. [Google Scholar]
- Wang, J.; Qv, D.; Ni, L.; Fan, J.; Kong, W. Matching-design for inverter air-source heat pump system based on heating load characteristics of civil buildings. Energy and Buildings 2022, 260, 111952. [Google Scholar] [CrossRef]
- Bai, C.; Dallasega, P.; Orzes, G.; Sarkis, J. Industry 4.0 technologies assessment: A sustainability perspective. Int. J. Prod. Econ. 2020, 229, 107776. [Google Scholar] [CrossRef]
- Borissova, D.I.; Danev, V.K.; Rashevski, M.B.; Garvanov, I.G.; Yoshinov, R.D.; Garvanova, M.Z. Using IoT for Automated Heating of a Smart Home by Means of OpenHAB. IFAC PapersOnLine 2022, 55(11), 90–95. [Google Scholar] [CrossRef]
- “OpenHAB,” Openhab.org. [Online]. Available: https://www.openhab.org/ (accessed on 6 December 2024).
- Home Assistant, Home Assistant, Home Assistant. [Online]. Available: https://www.home-assistant.io/ (accessed on 6 December 2024).
- Raspberrypi.com. [Online]. Available: https://www.raspberrypi.com/products/raspberry-pi-5/ (accessed on 6 December 2024).
- Marco Carvalho, Building Smart Home Automation Solutions with Home Assistant Configure, integrate, and manage hardware and software systems. Packt Publishing, 2023.
- Kumar; et al. Internet of Things is a revolutionary approach for future technology enhancement: a review. J Big Data 2019, 6, 111. [Google Scholar] [CrossRef]
- “TOSHIBA Klimaanlagen - Toshiba Klima,” Toshiba-aircondition.com. [Online]. Available: https://www.toshiba-aircondition.com (accessed on 6 December 2024).
- “KI Expert plus,” Knauf. [Online]. Available: https://knauf.com/hr-HR/knauf-insulation/aplikacije-i-tools (accessed on 16 February 2025).
- Hui Huang: Heat Pumps for Cold Climate Heating Variable Volume Ratio Two-stage Vapor Compression Air Source Heat Pump Technology and Applications. CRC Press, 2020.
- “Ordinance on Energy Audit of Buildings and Energy Certification, Official Gazette 88/2017, “ Narodne-novine.nn.hr. [Online]. Available: https://narodne-novine.nn.hr/clanci/sluzbeni/2017_09_88_2093.html (accessed on 12 December 2024).
- “The Official YAML Web Site,” Yaml.org. [Online]. Available: https://yaml.org/ (accessed on 6 December 2024).
- “Toshiba AC integration“. Available: https://github.com/h4de5/home-assistant-toshiba_ac (accessed on 8 October 2024).
- “Thermal Comfort sensor for HA”. https://github.com/dolezsa/thermal_comfort/ (accessed on 7 February 2025).
- AirGradient, “AirGradient Air Quality Monitors,” Airgradient.com. [Online]. Available: https://www.airgradient.com/ (accessed on 7 February 2025).
- “ElectricityMaps,” Electricitymaps.com. [Online]. Available: https://app.electricitymaps.com (accessed on 7 February 2025).
- Chakraborty, R.; Heydon, J.; Mayfield, M.; Mihaylova, L. Indoor air pollution from residential stoves: Examining the flooding of particulate matter into homes during real-world use. Atmosphere (Basel) 2020, 11(12), 1326. [Google Scholar] [CrossRef]
- “WHO global air quality guidelines: particulate matter (PM2.5 and PM10), ozone, nitrogen dioxide, sulfur dioxide and carbon monoxide,” Who.int, 22-Sep-2021. [Online]. Available: https://www.who.int/publications/i/item/9789240034228 (accessed on 15 February 2025).
Figure 1.
IoT placement on the floor plan of the house.
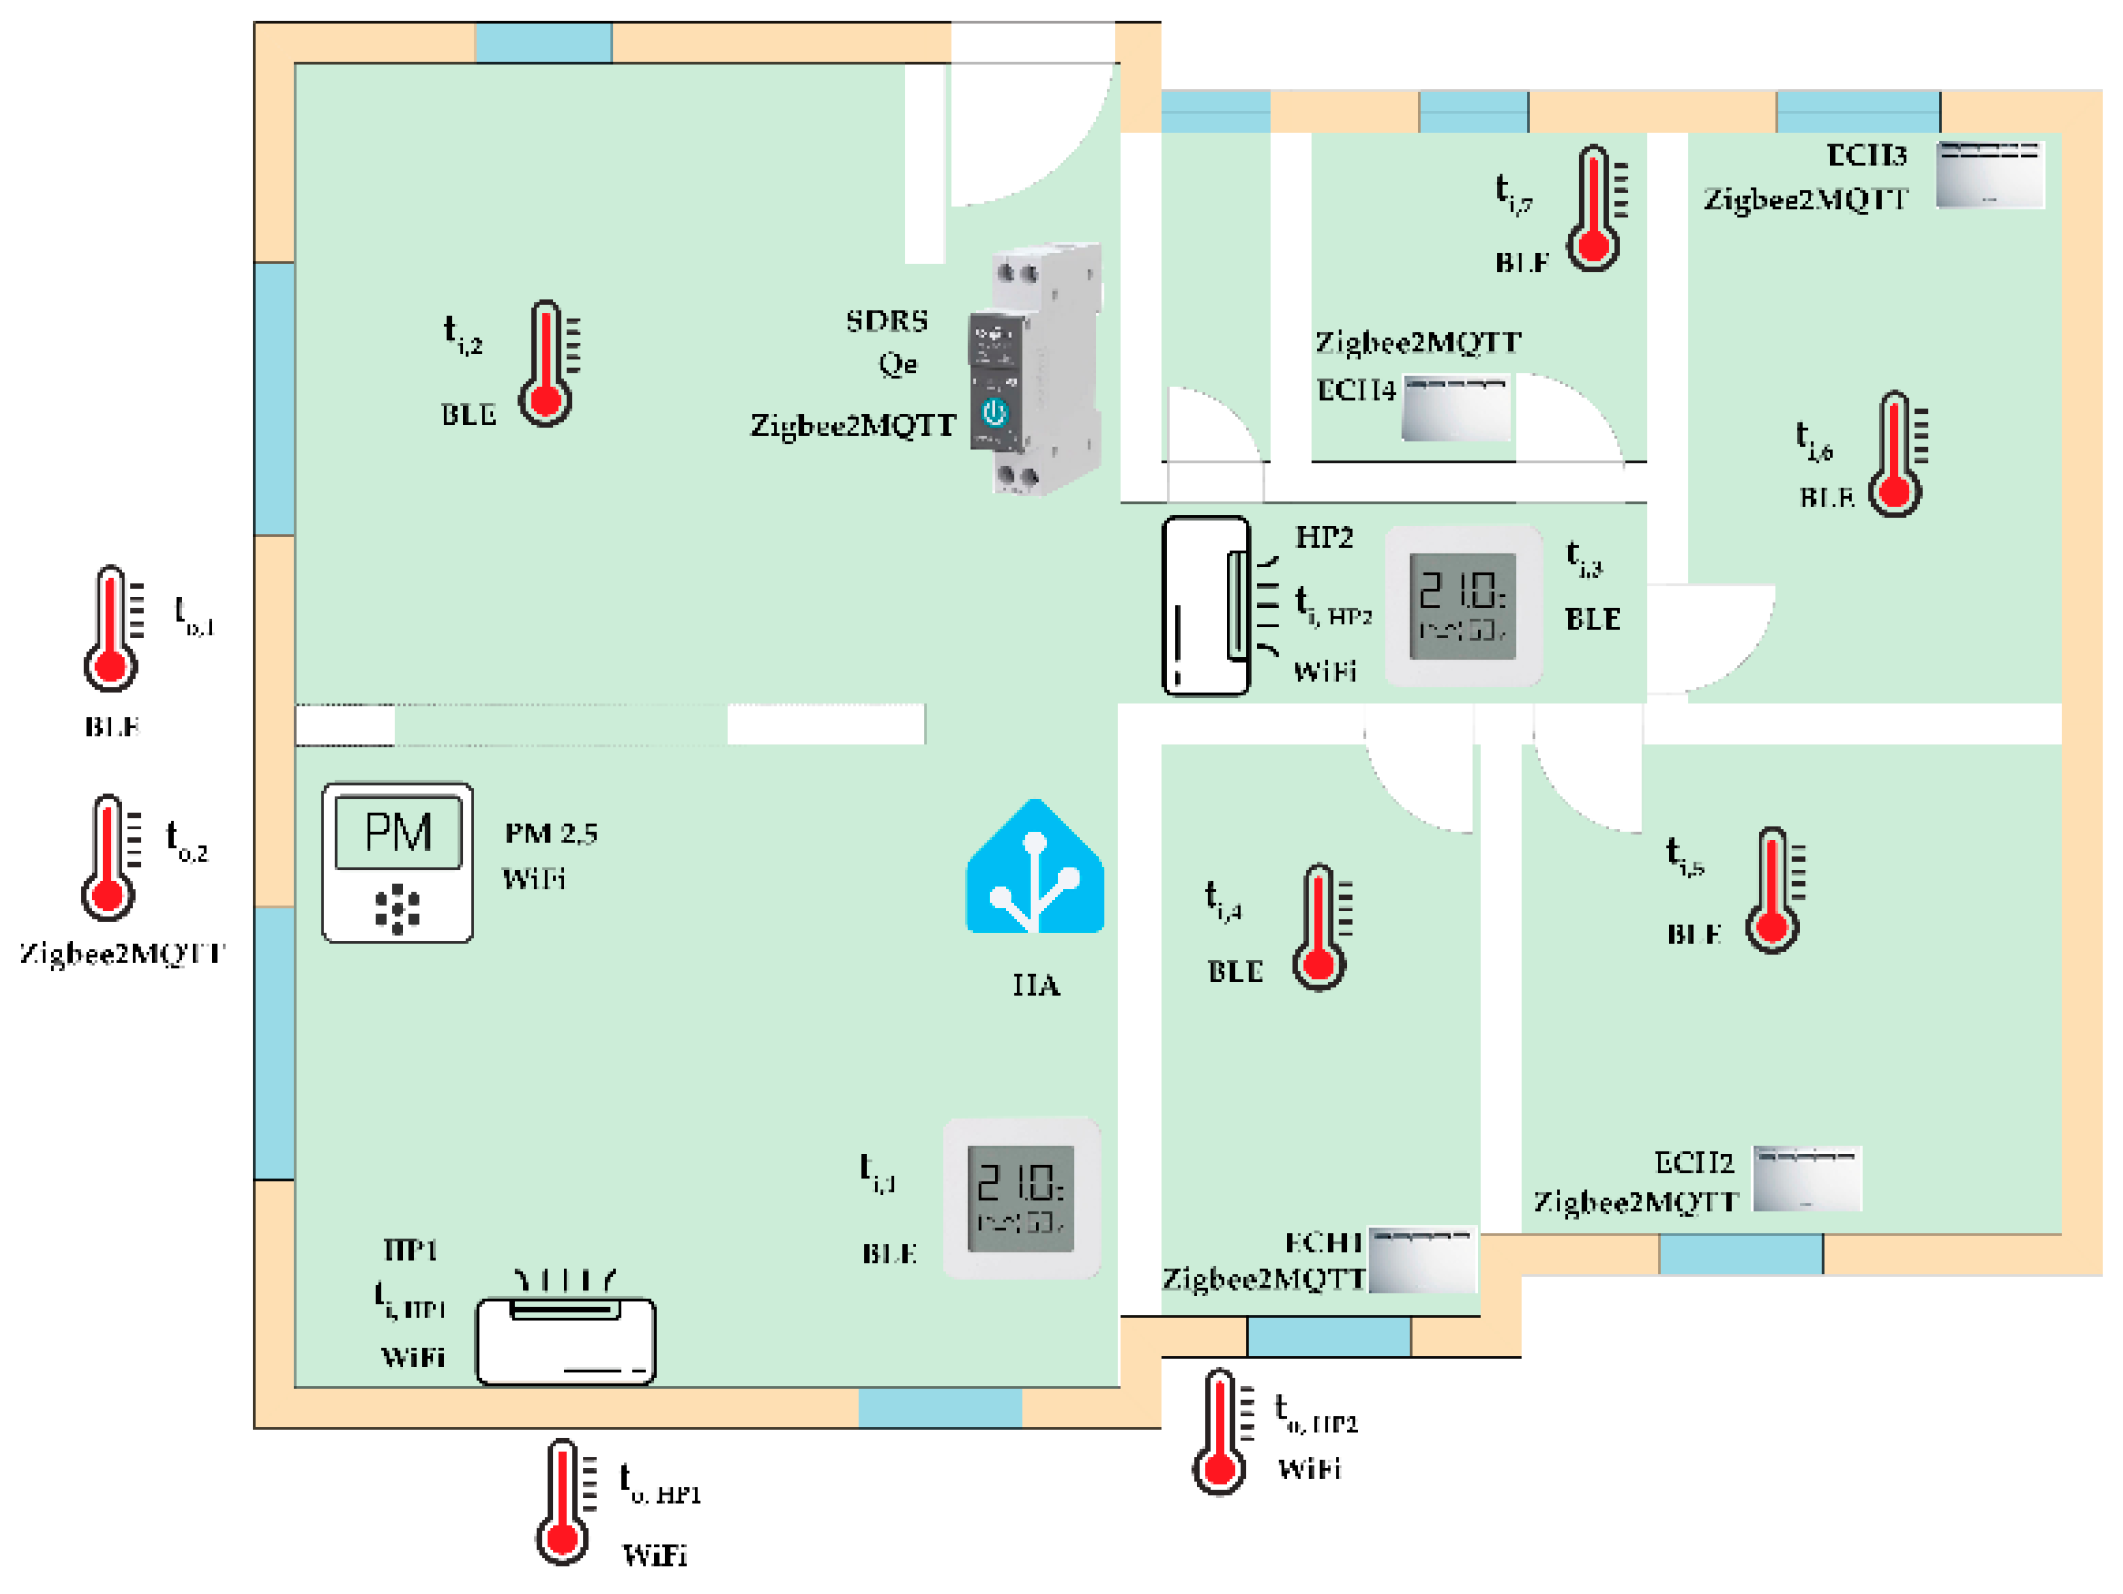
Figure 2.
Configuration IoT smart homes.
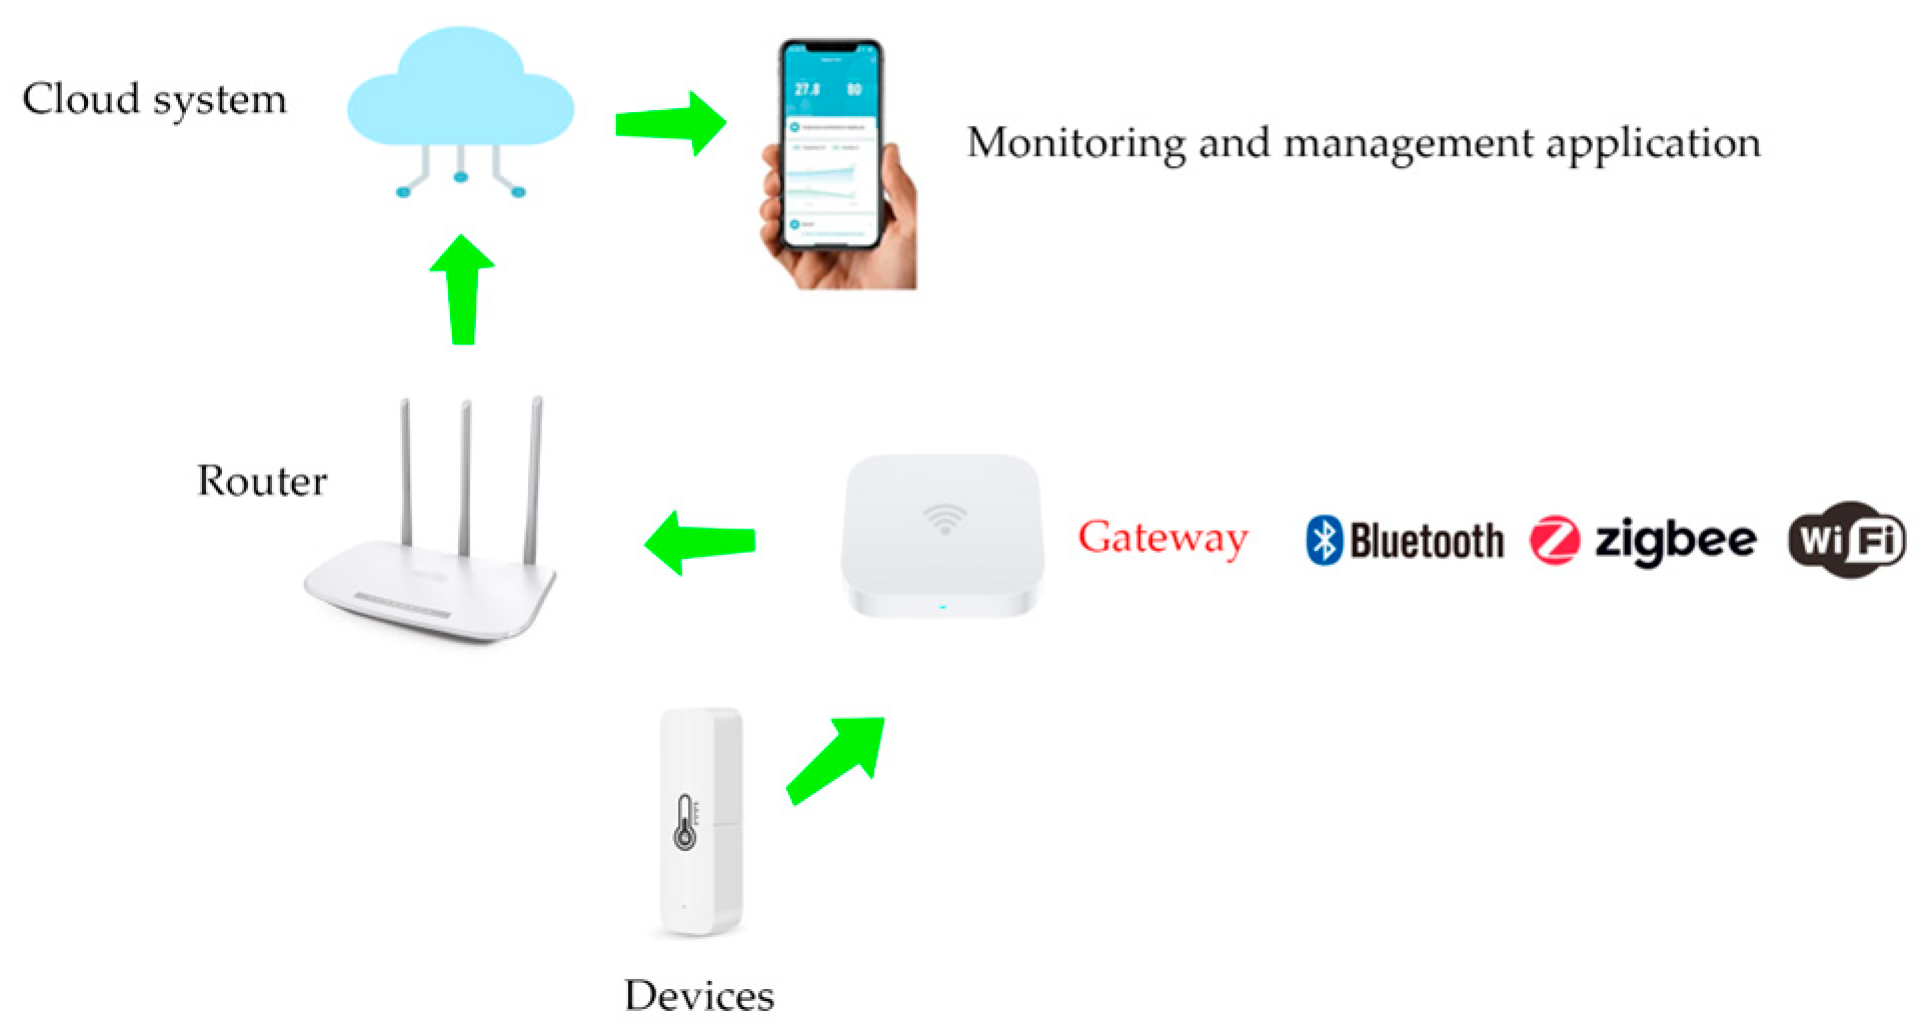
Figure 3.
Configuration Home heating IoT network.
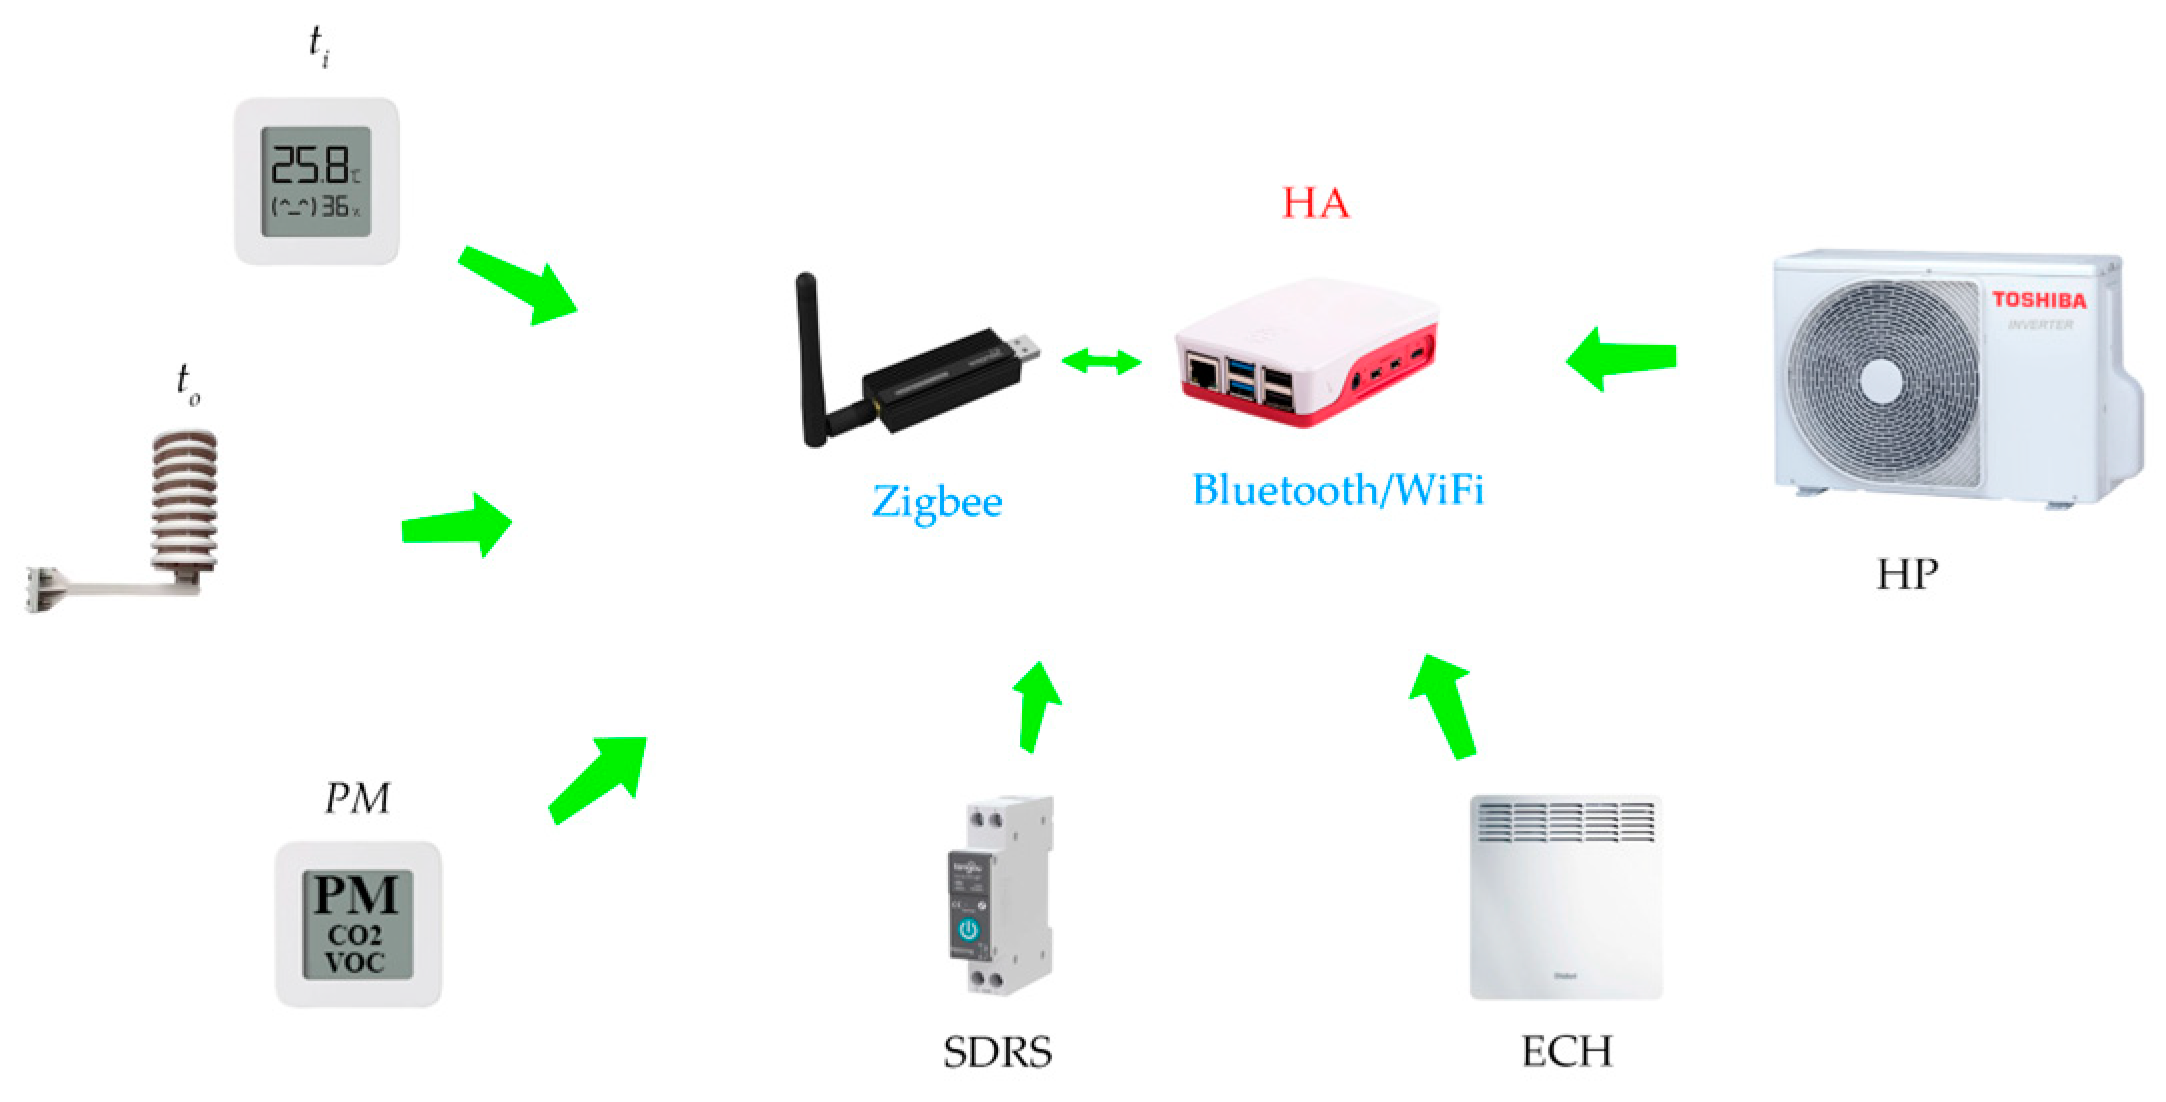
Figure 4.
One-day sample of measured temperatures, to,1, to,HP1, ti,1.
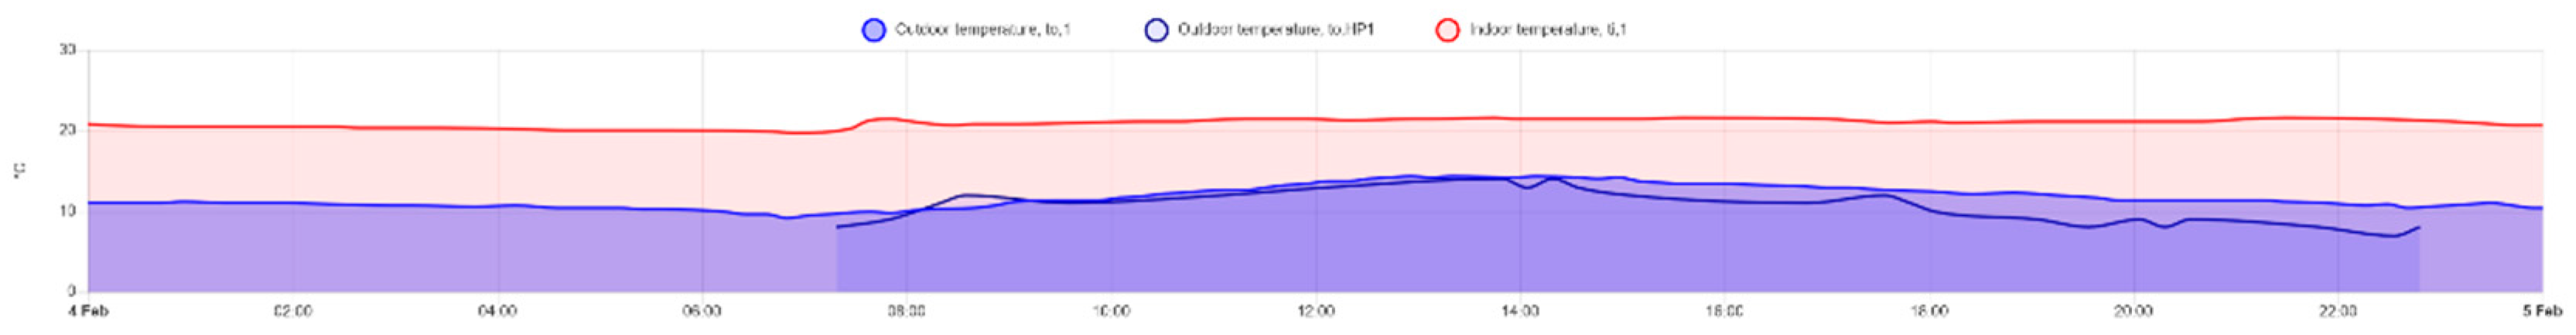
Figure 5.
Climatological data for the reference station Zadar, Croatia.
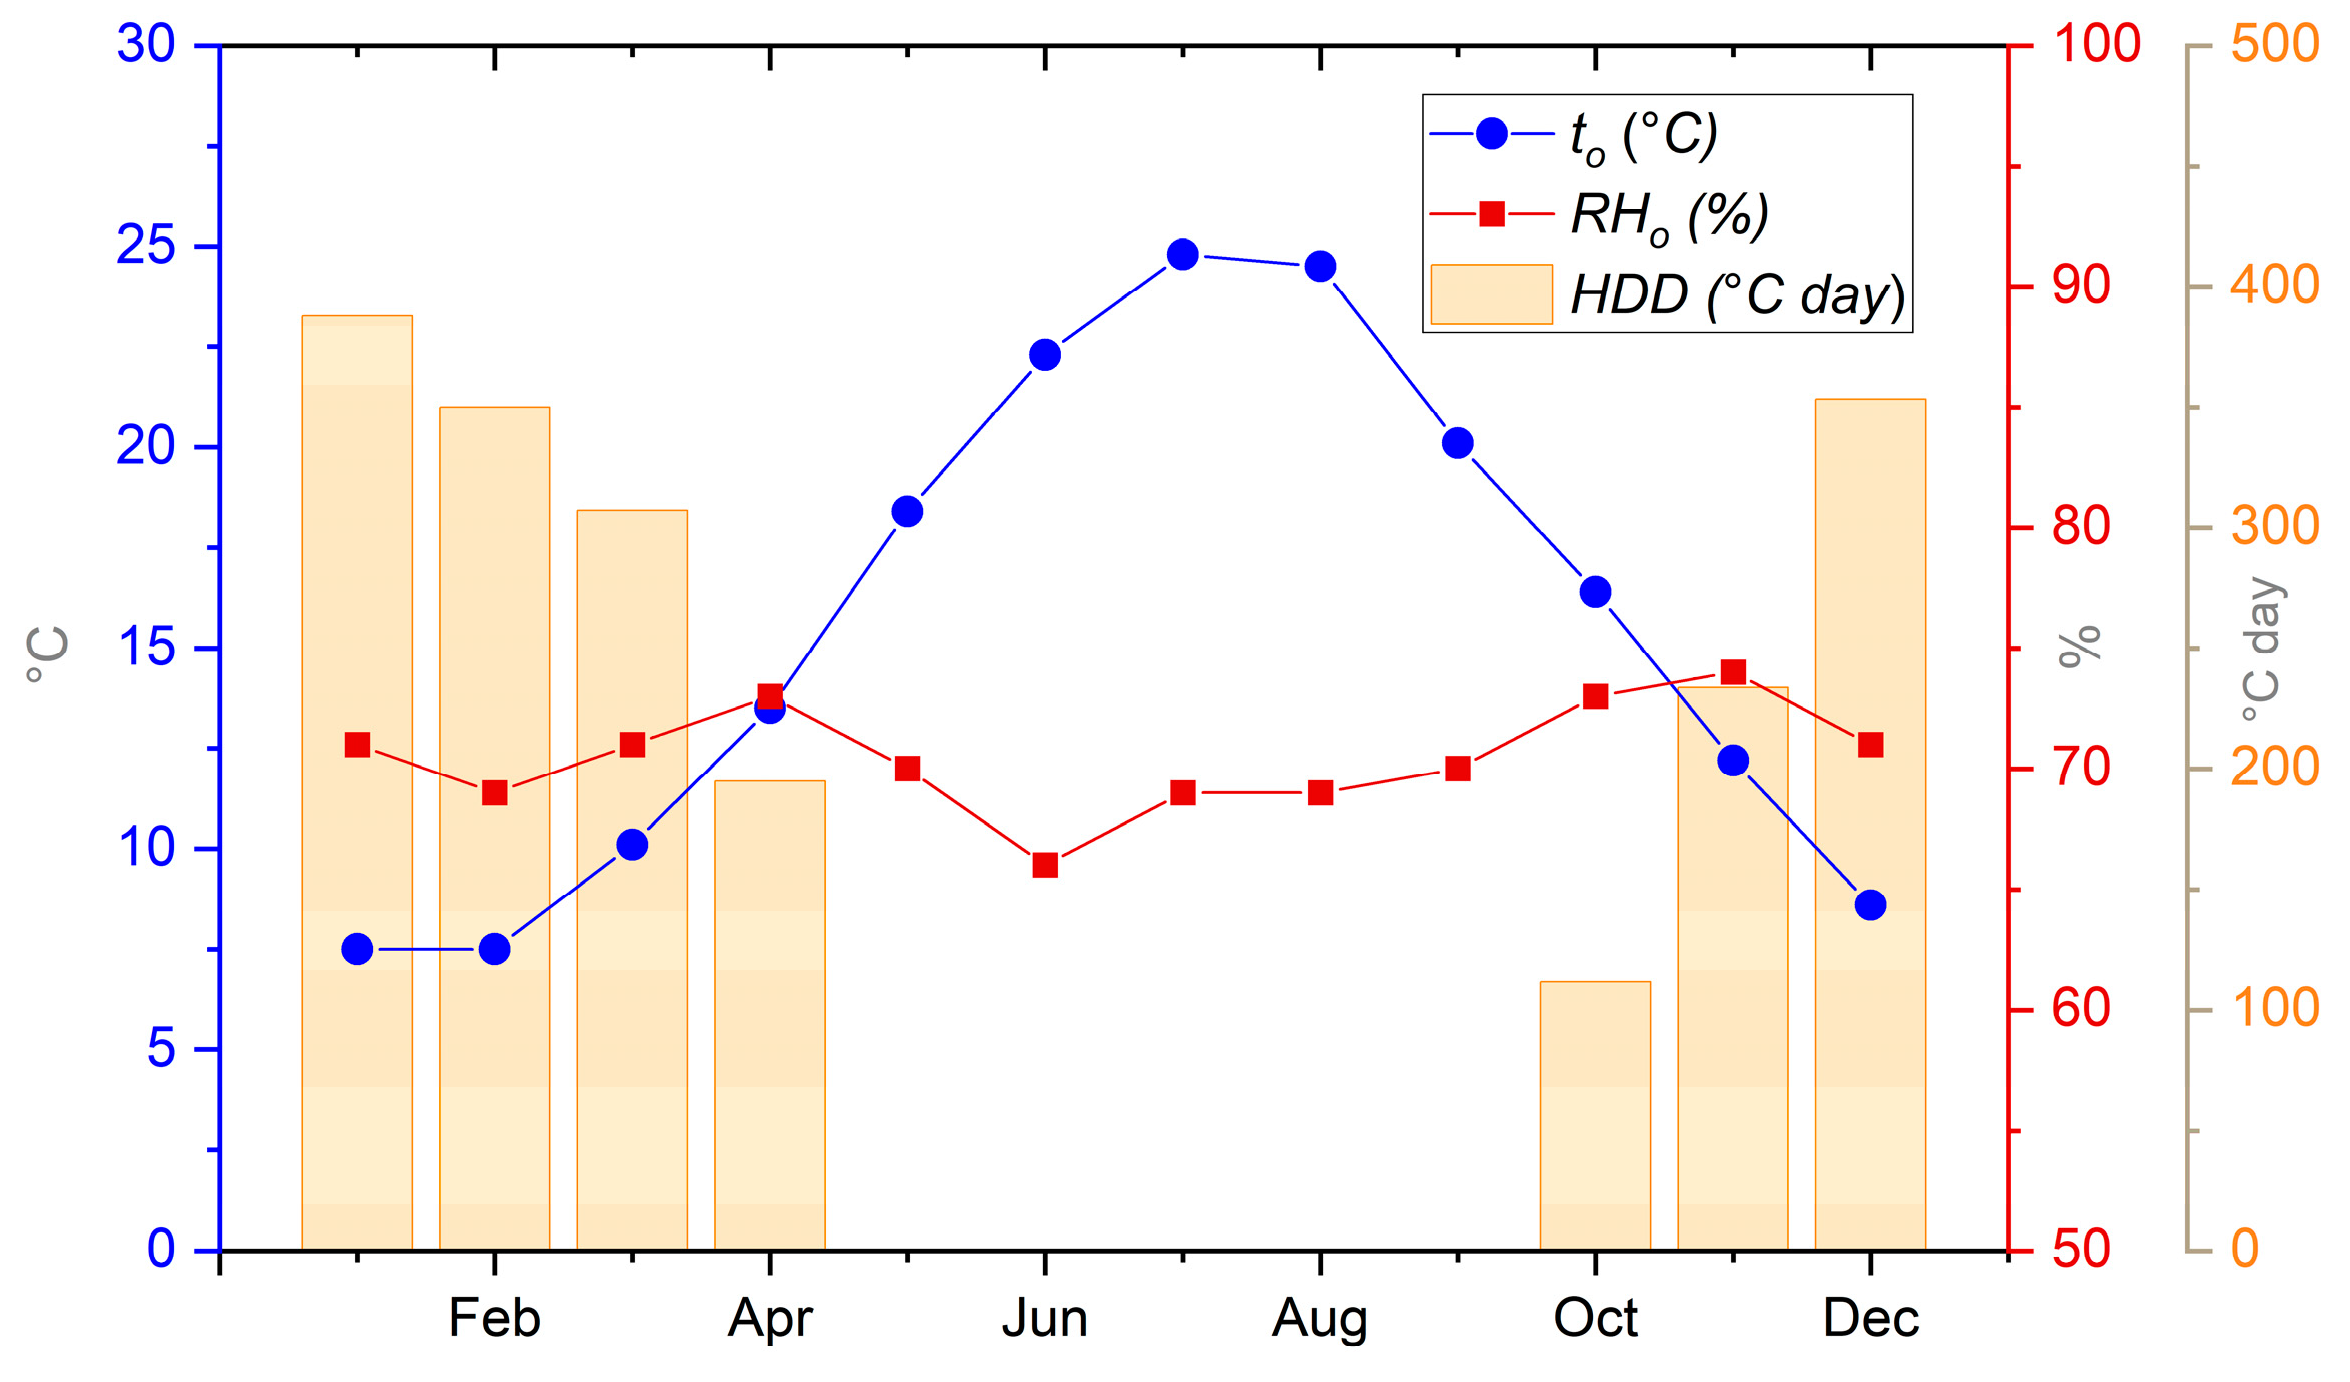
Figure 6.
Collected Outdoor temperature, In situ, to,1.
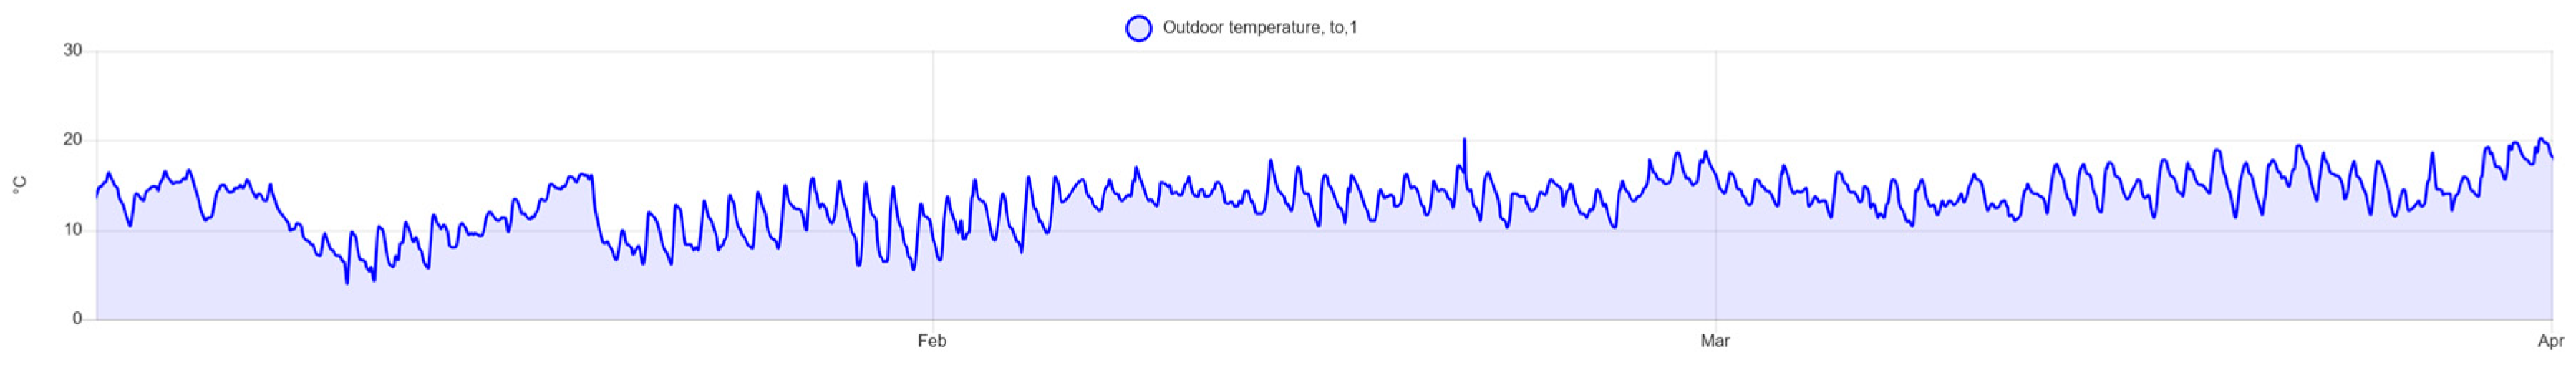
Figure 7.
Collected Outdoor Relative Humidity, In situ, RHo,1.
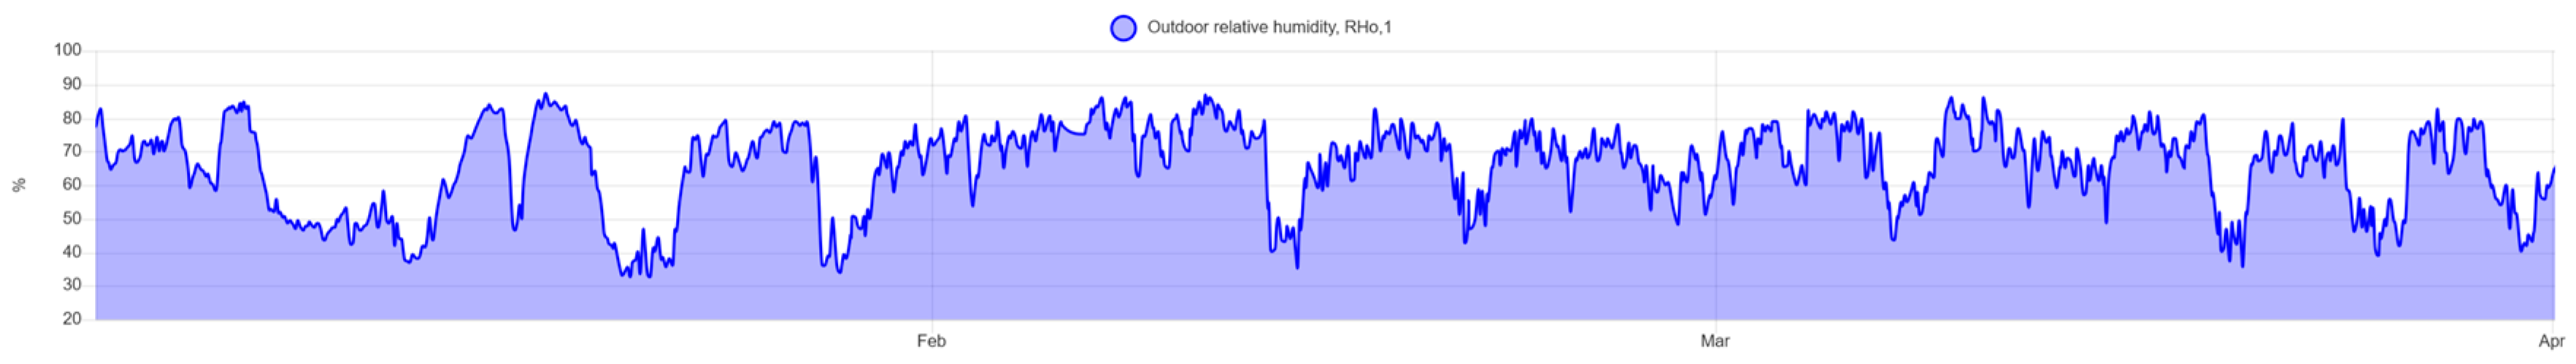
Figure 8.
(a) An example of creating an automation script through a visual editor; (b) Heat pump operation control via Toshiba AC integration into HA.
Figure 8.
(a) An example of creating an automation script through a visual editor; (b) Heat pump operation control via Toshiba AC integration into HA.
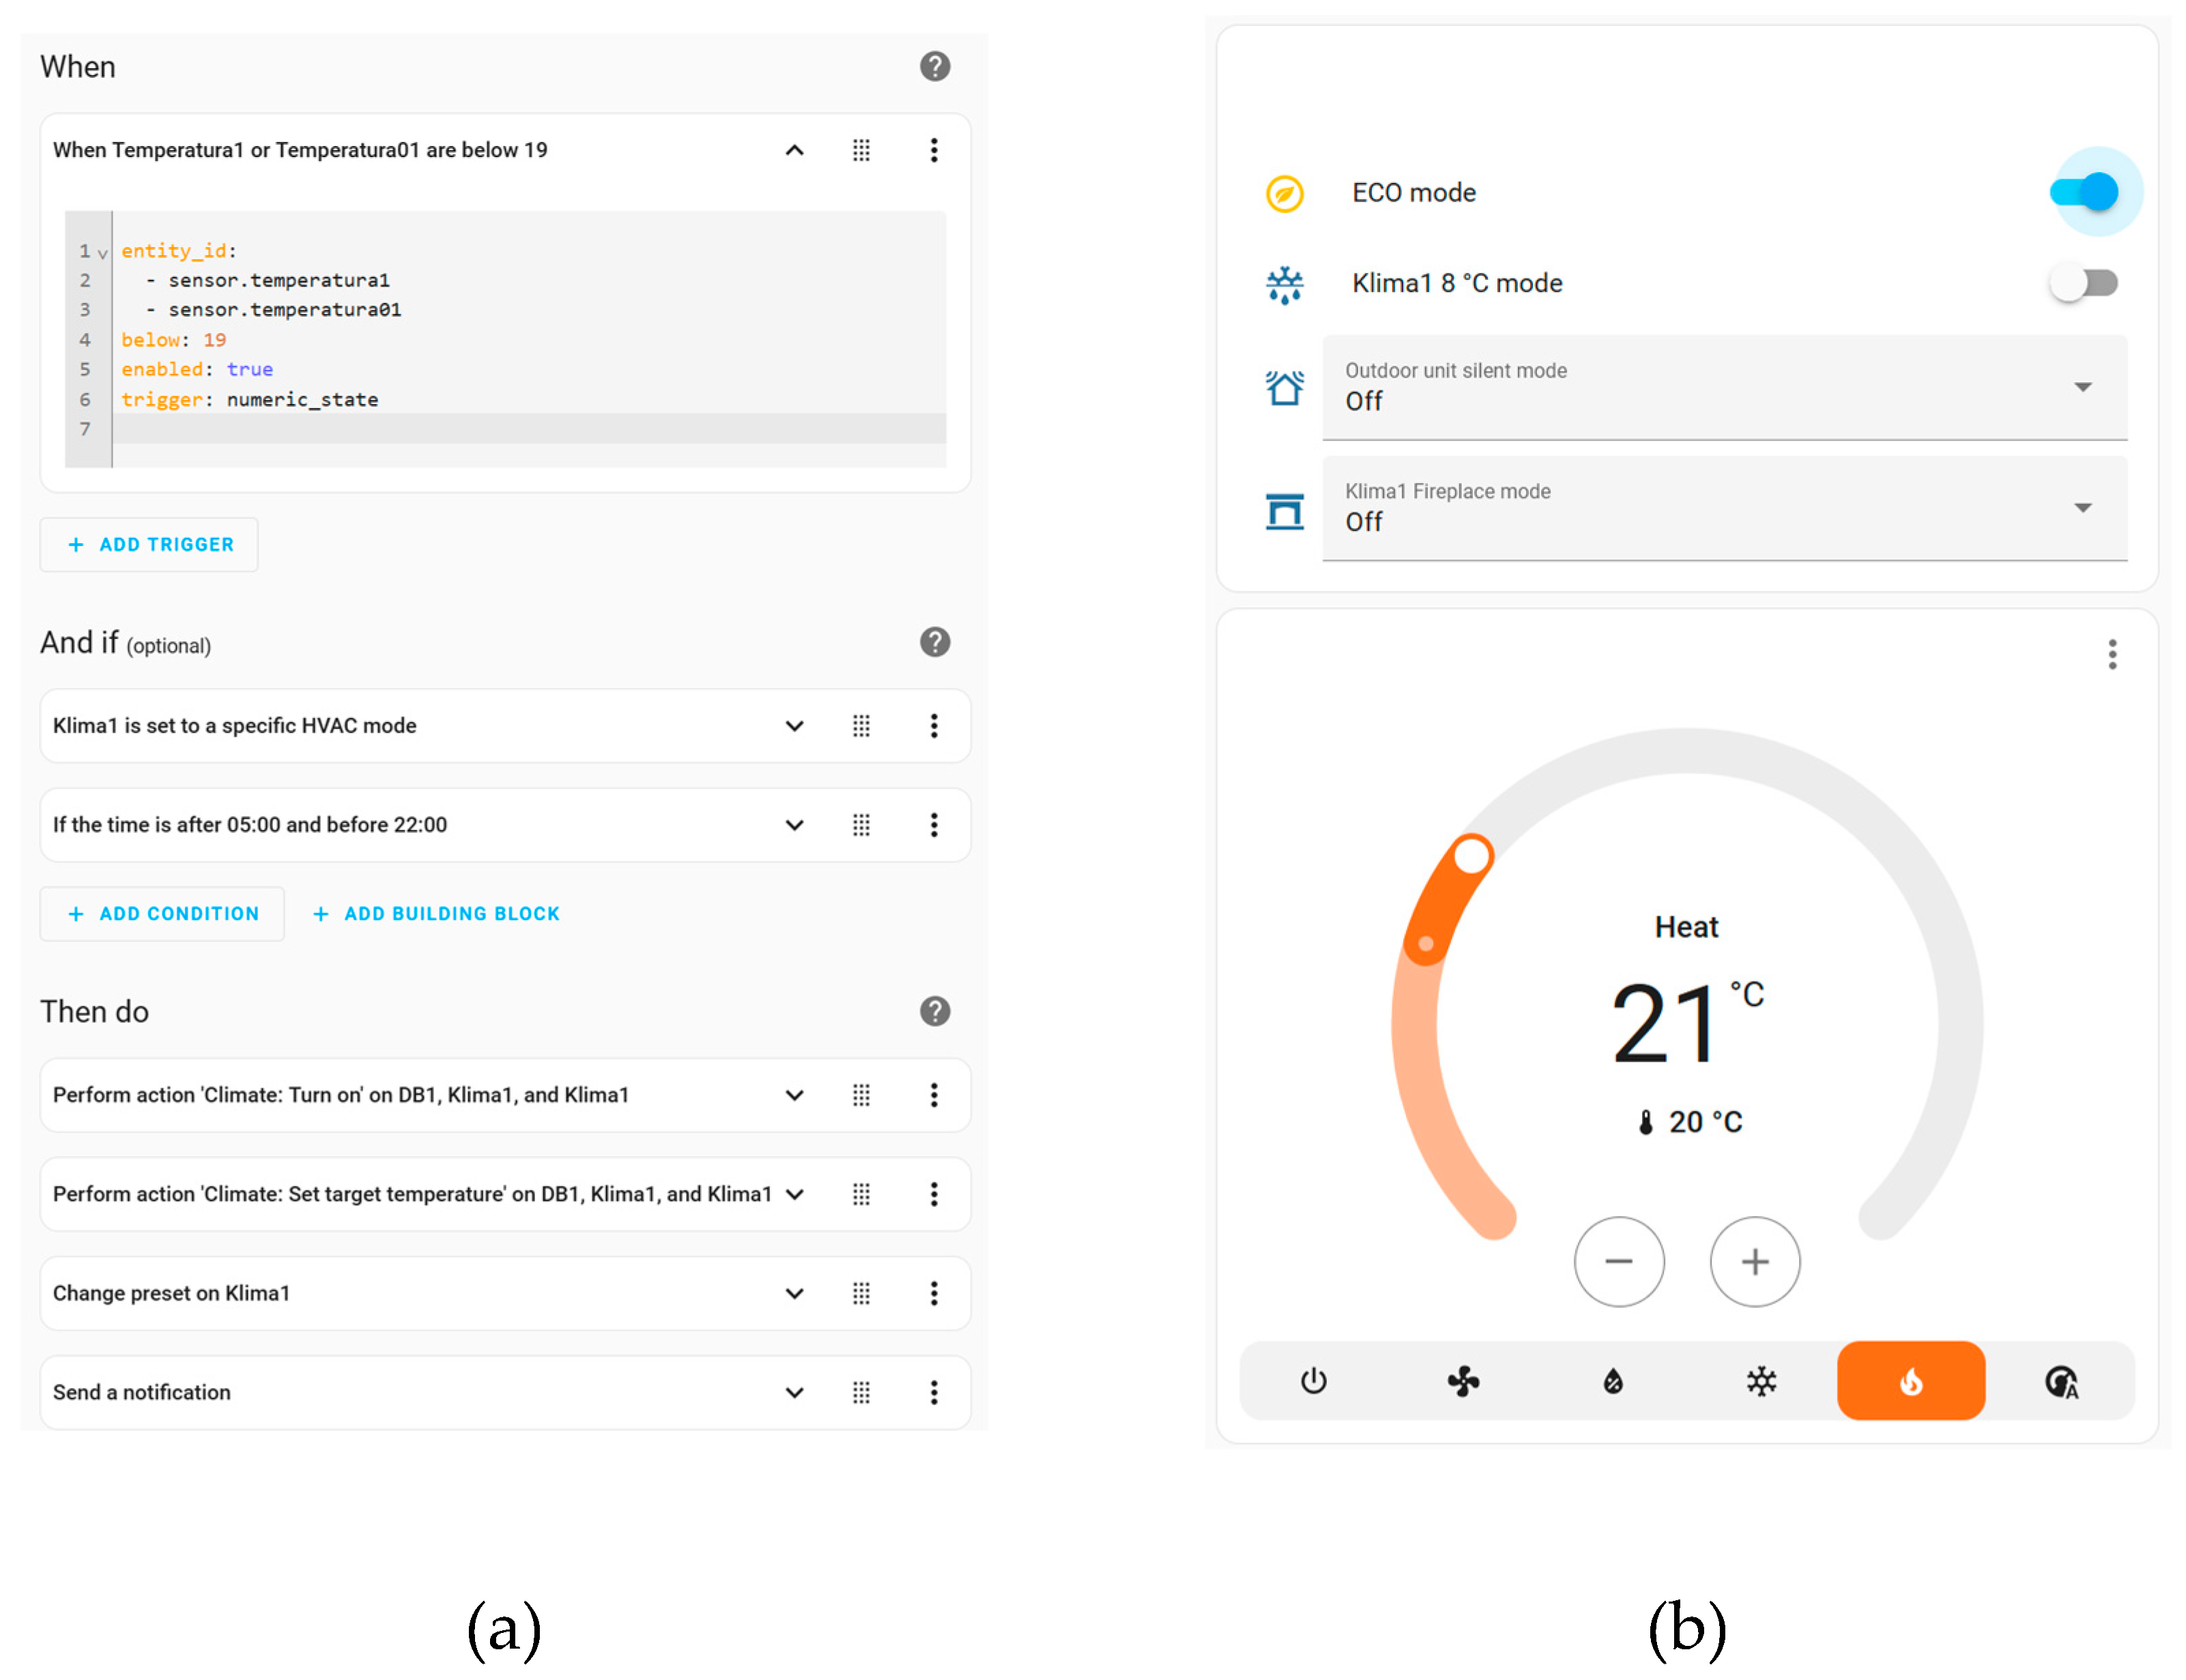
Figure 9.
(a) Thermal Comfort sensor; (b) Air Quality Sensor, Air Gradient.
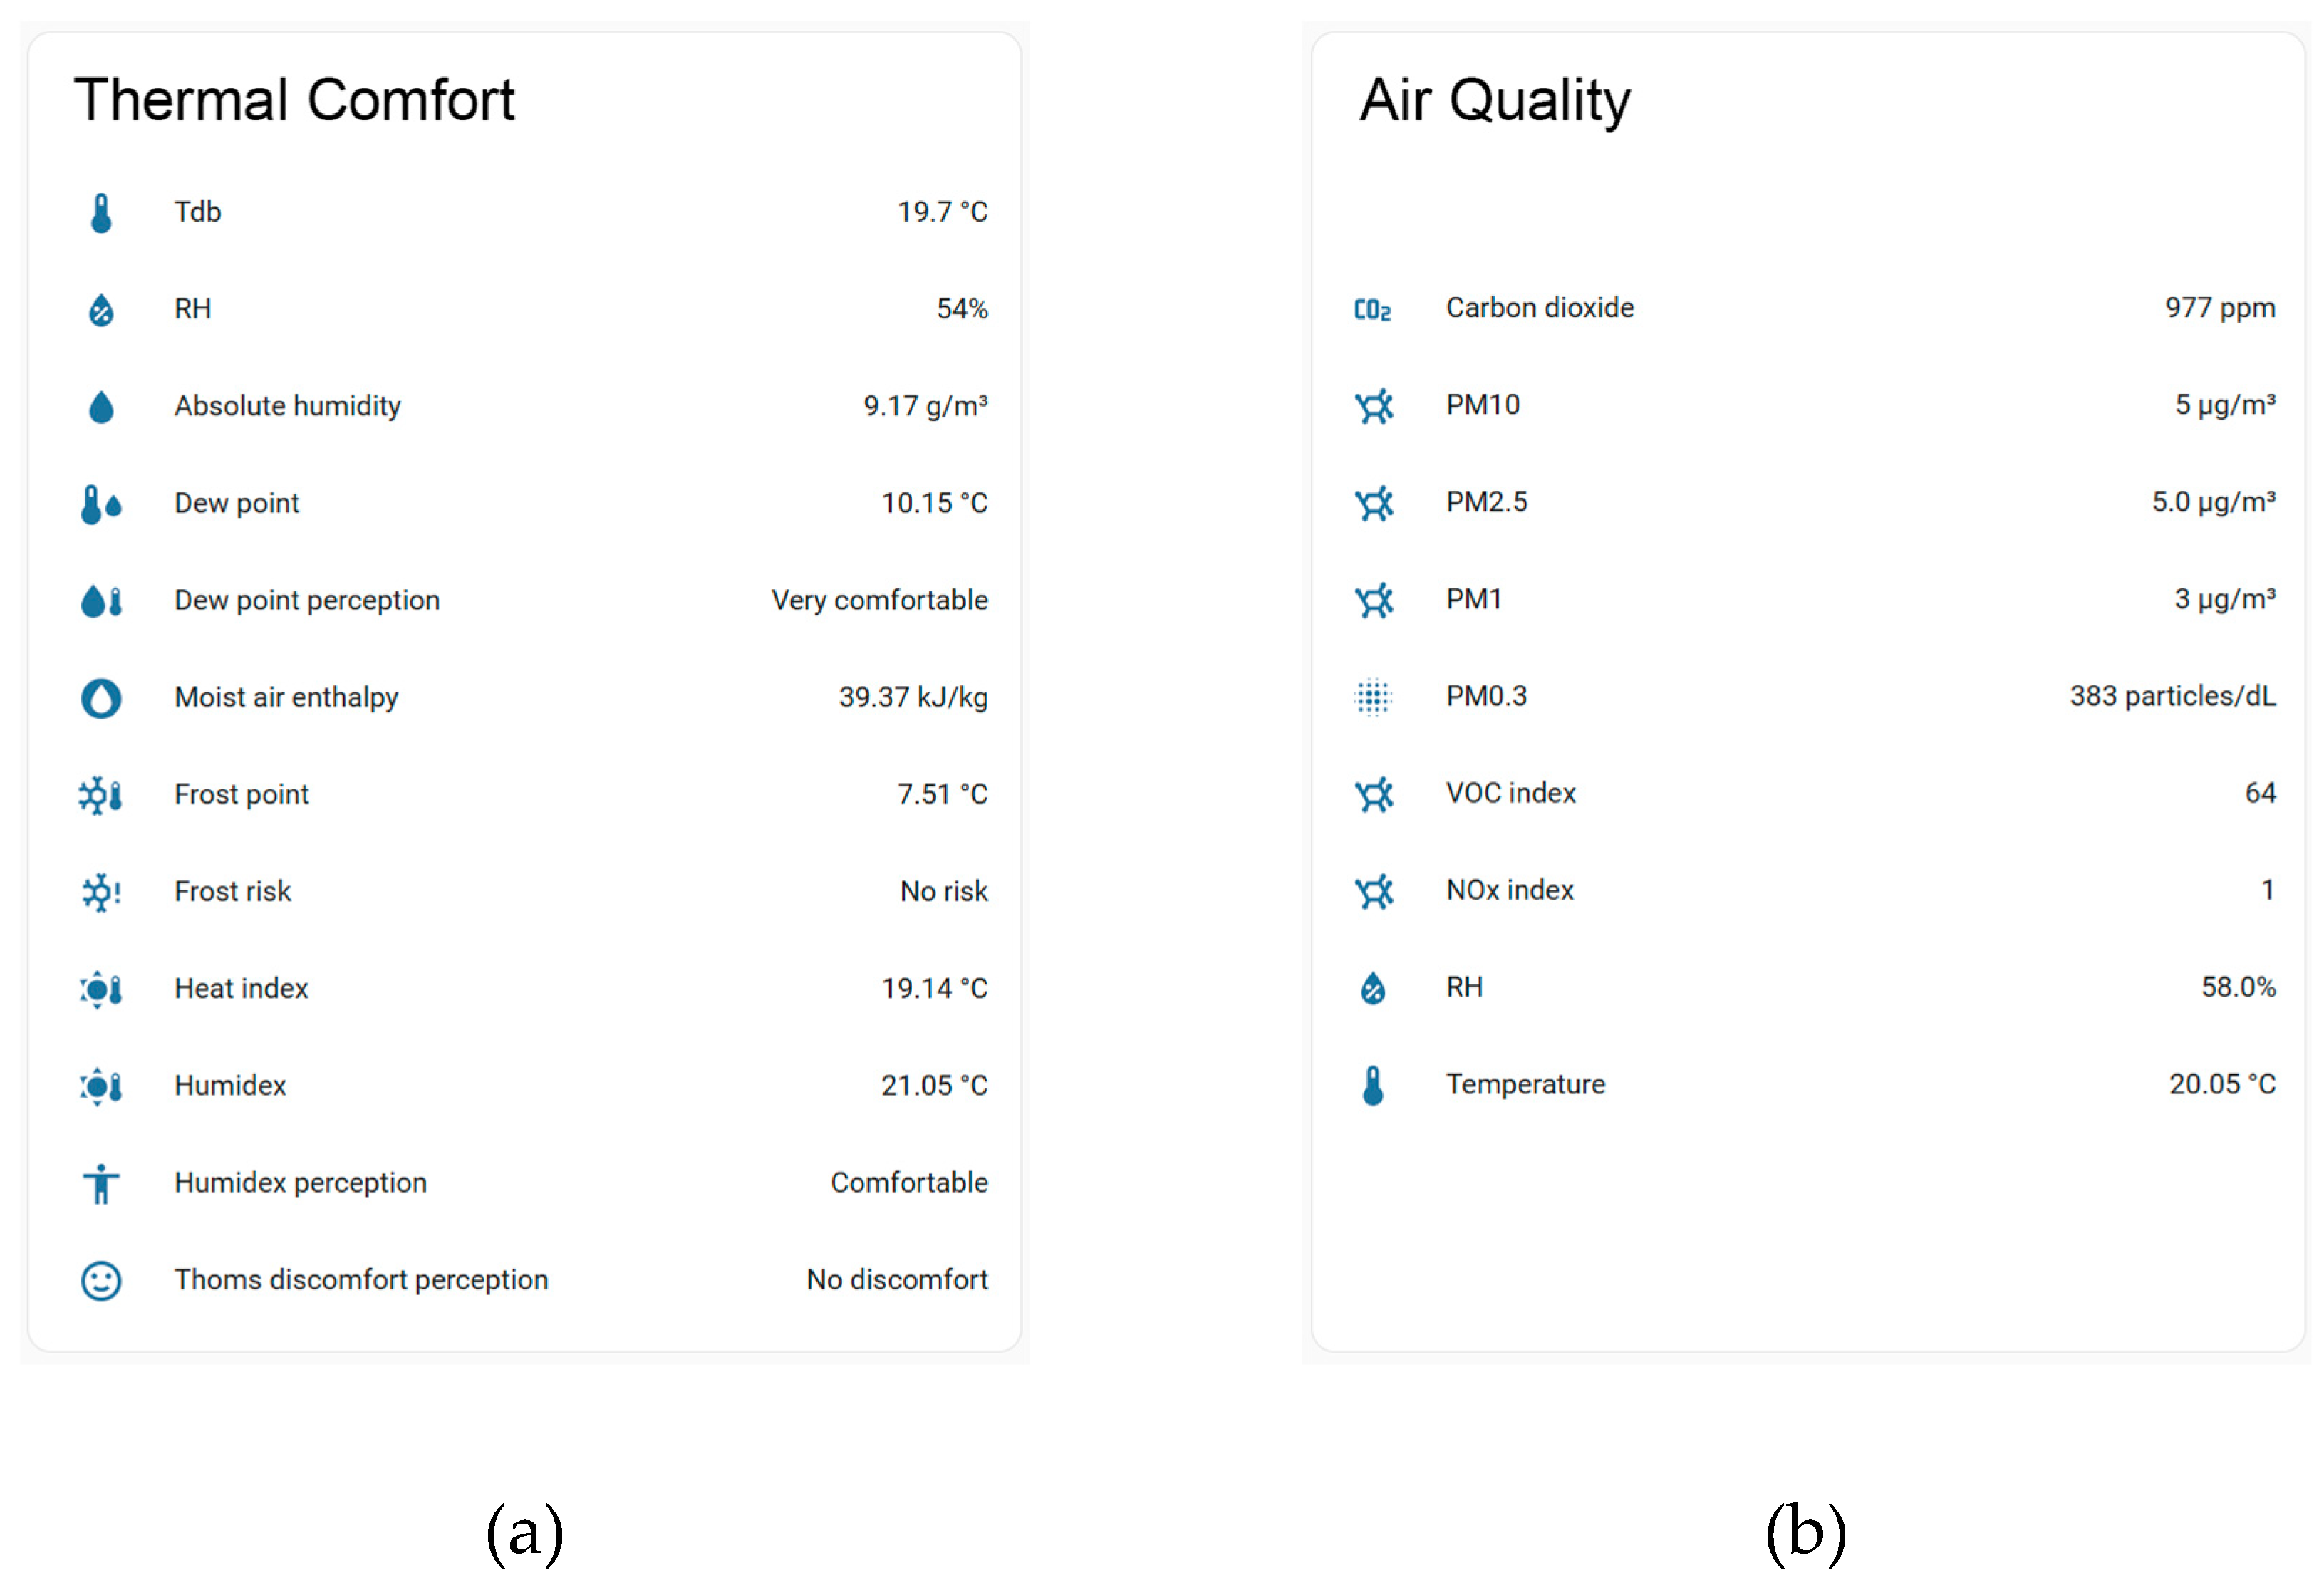
Figure 10.
Electric power, W.
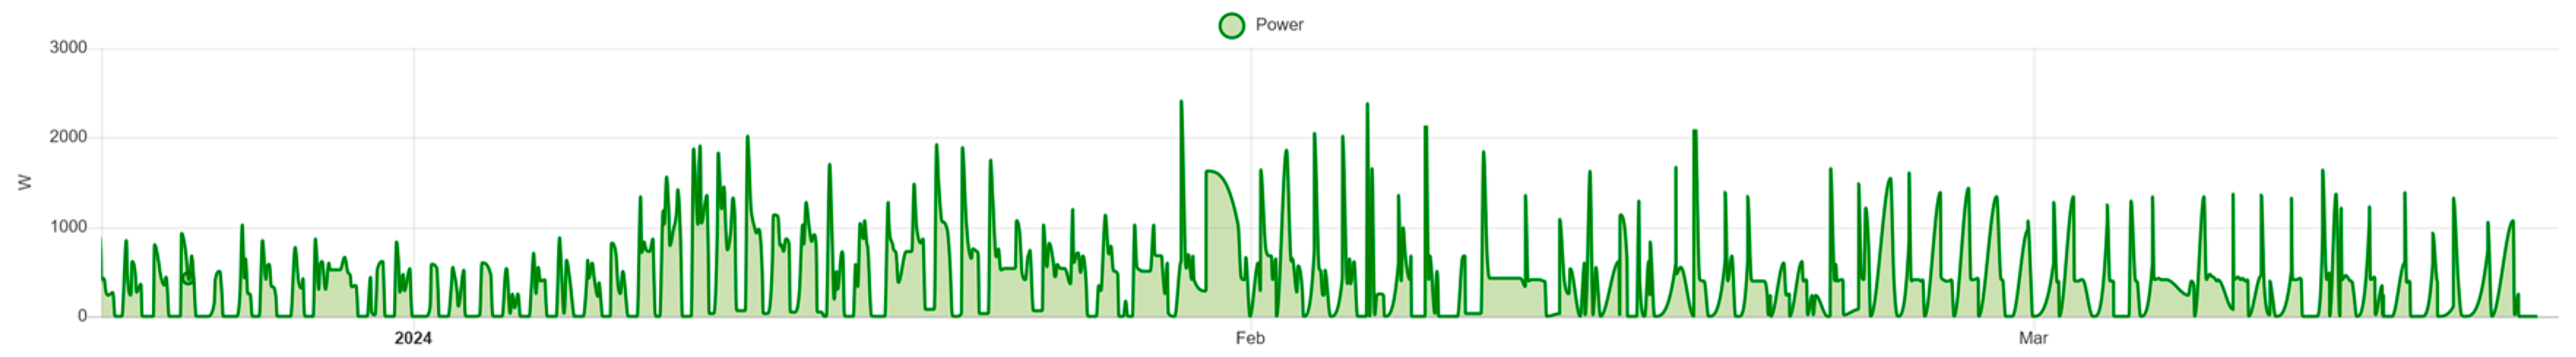
Figure 11.
Consumption electrical energy, Daily, kWh.

Figure 12.
Consumption electrical energy, Monthly, kWh.

Figure 13.
(a) Average monthly outdoor and indoor temperatures to,1 and ti,1; (b) Average monthly outdoor and indoor relative humidity RHo,1 and RHi,1.
Figure 13.
(a) Average monthly outdoor and indoor temperatures to,1 and ti,1; (b) Average monthly outdoor and indoor relative humidity RHo,1 and RHi,1.
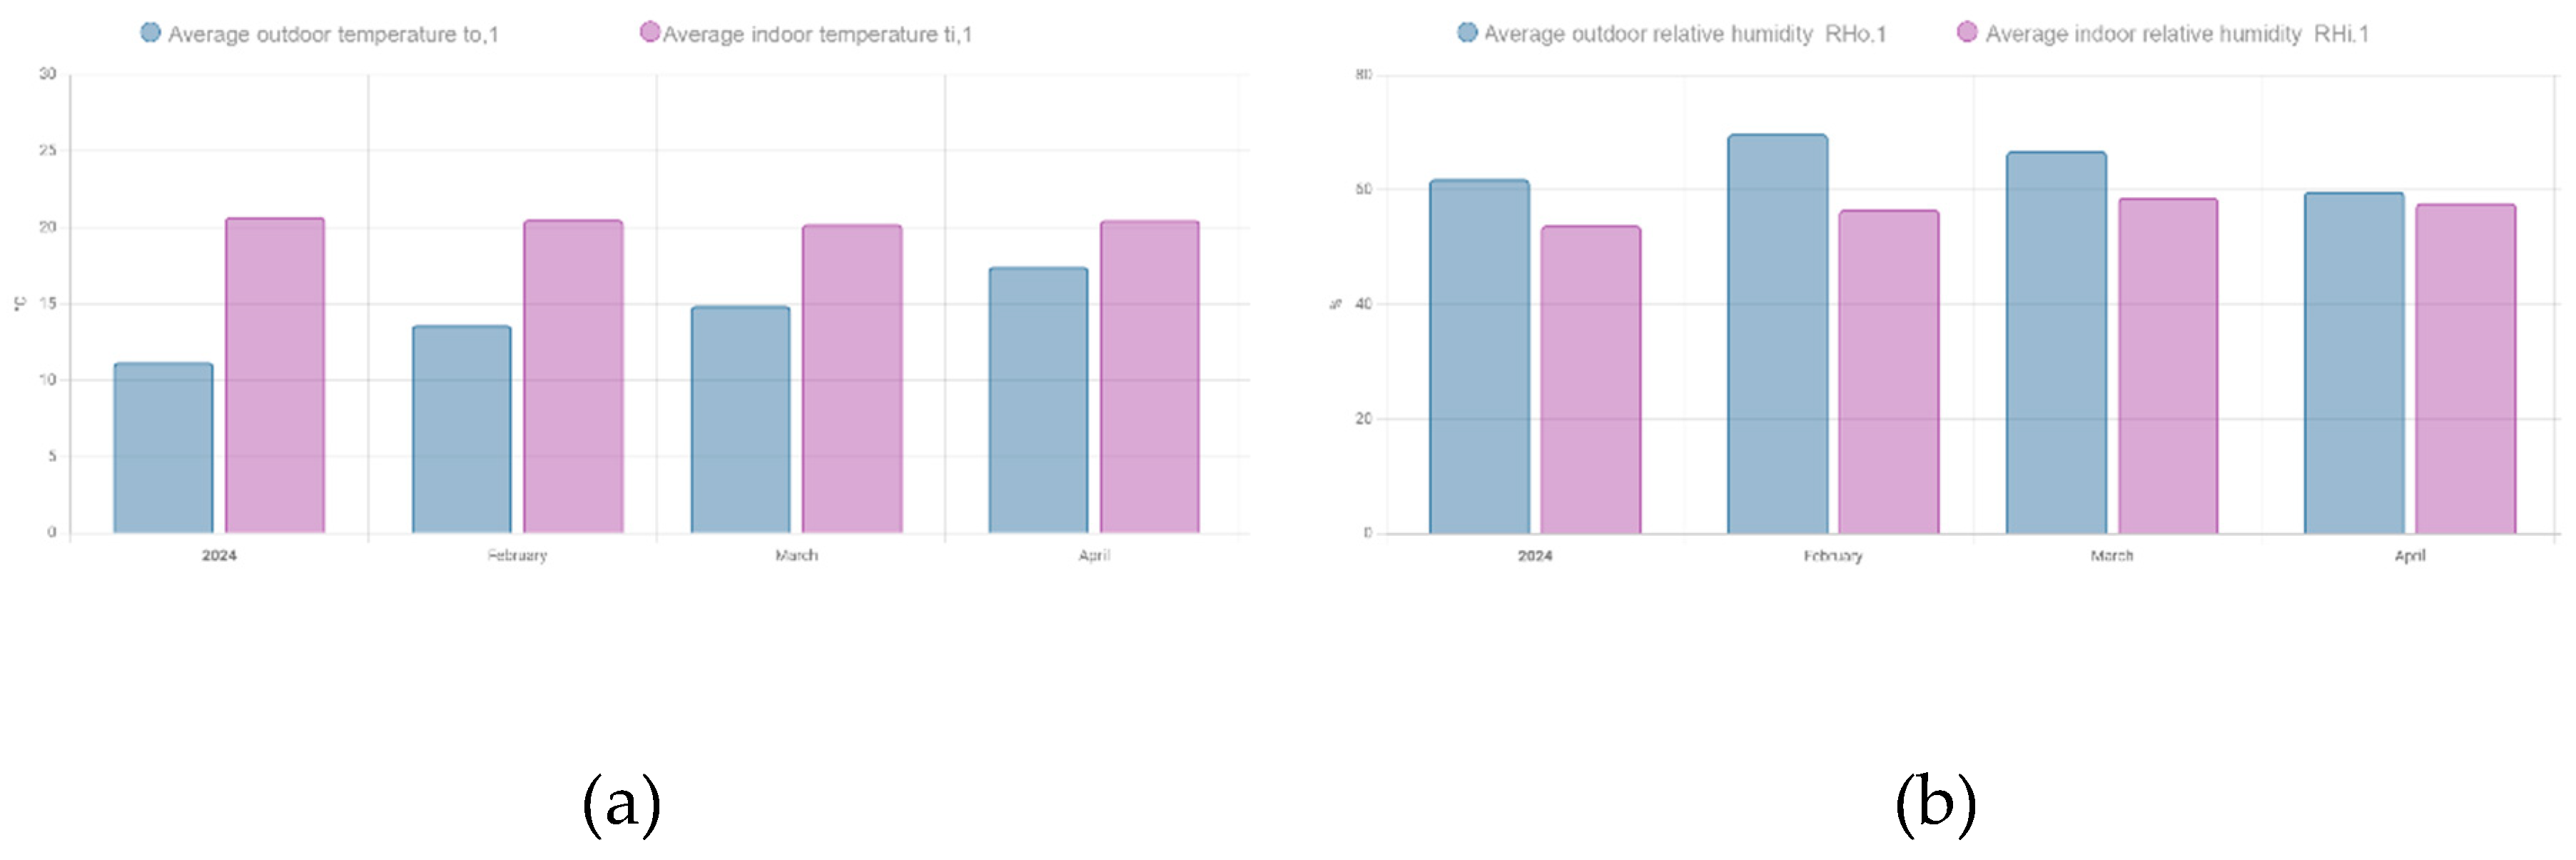
Figure 14.
Collected temperature to, and ti,1.
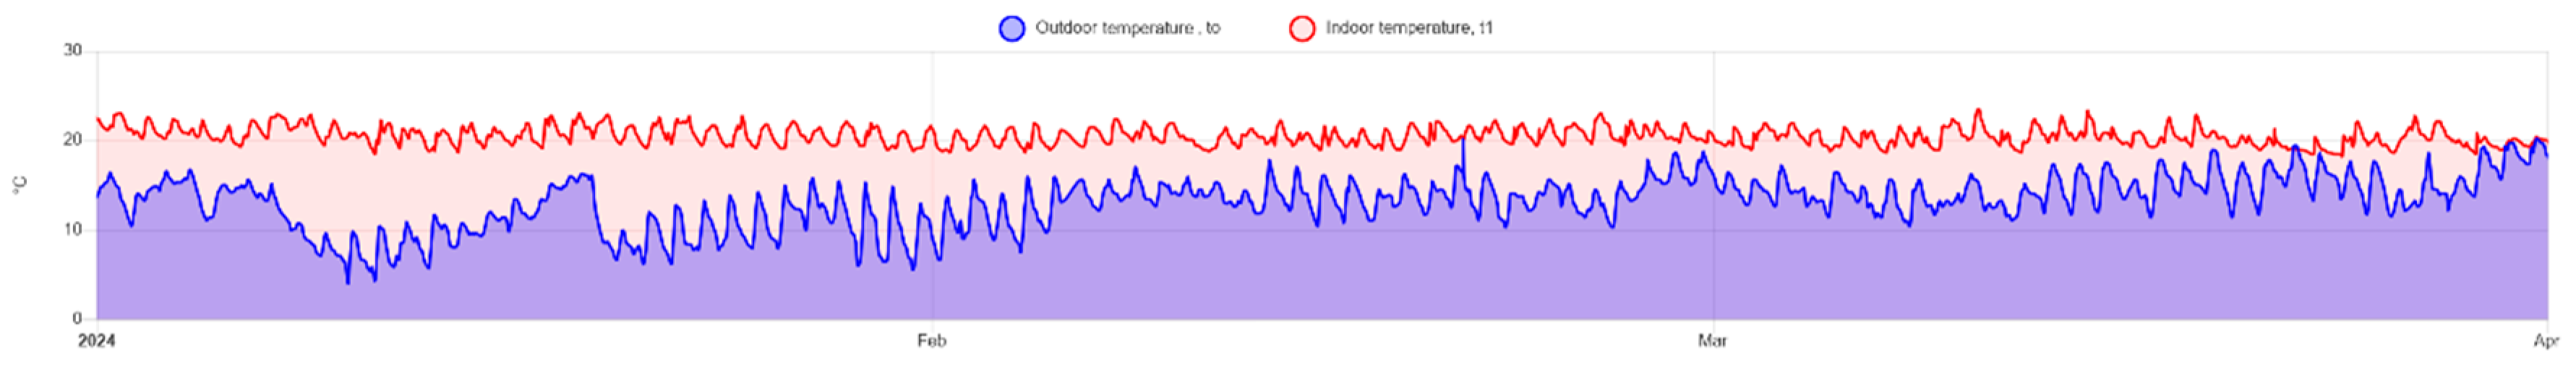
Figure 15.
Collected relative humidity HRo,1 and HRi,1.
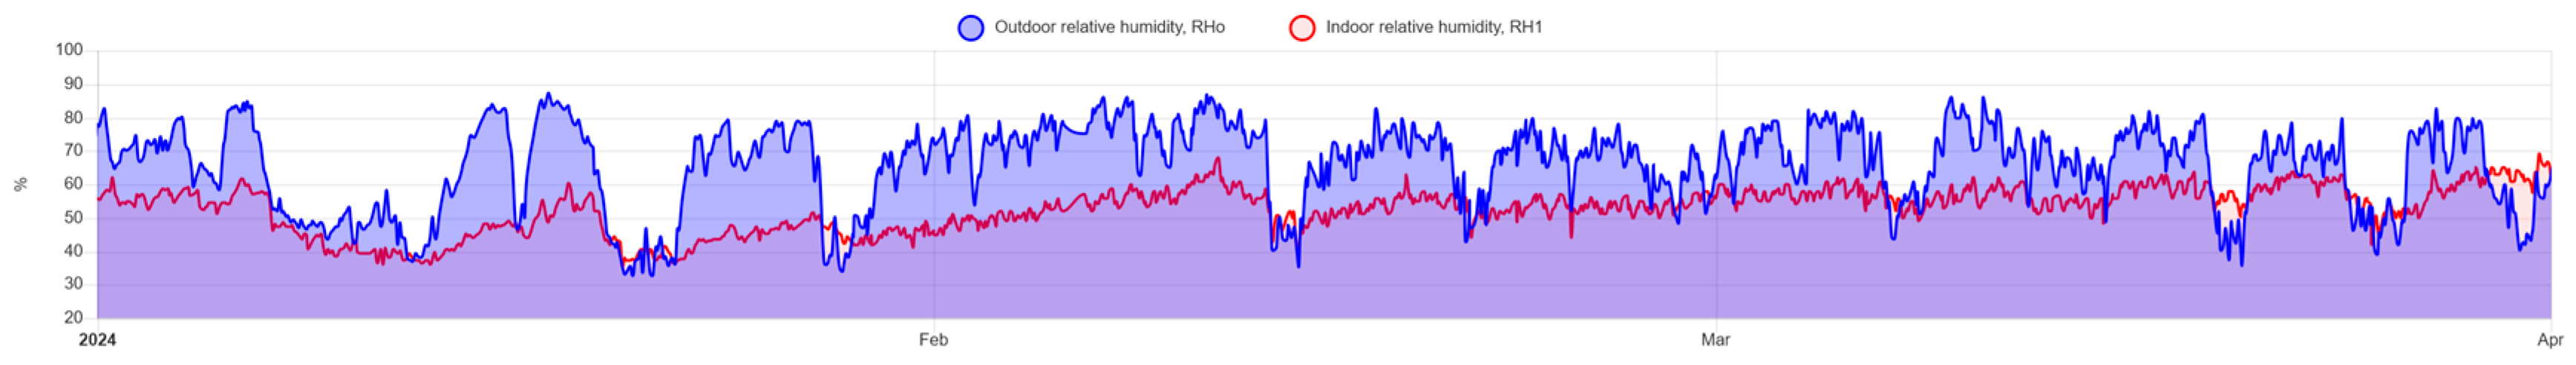
Figure 16.
Collected sample electric power, and temperature, to,1 and ti,1.
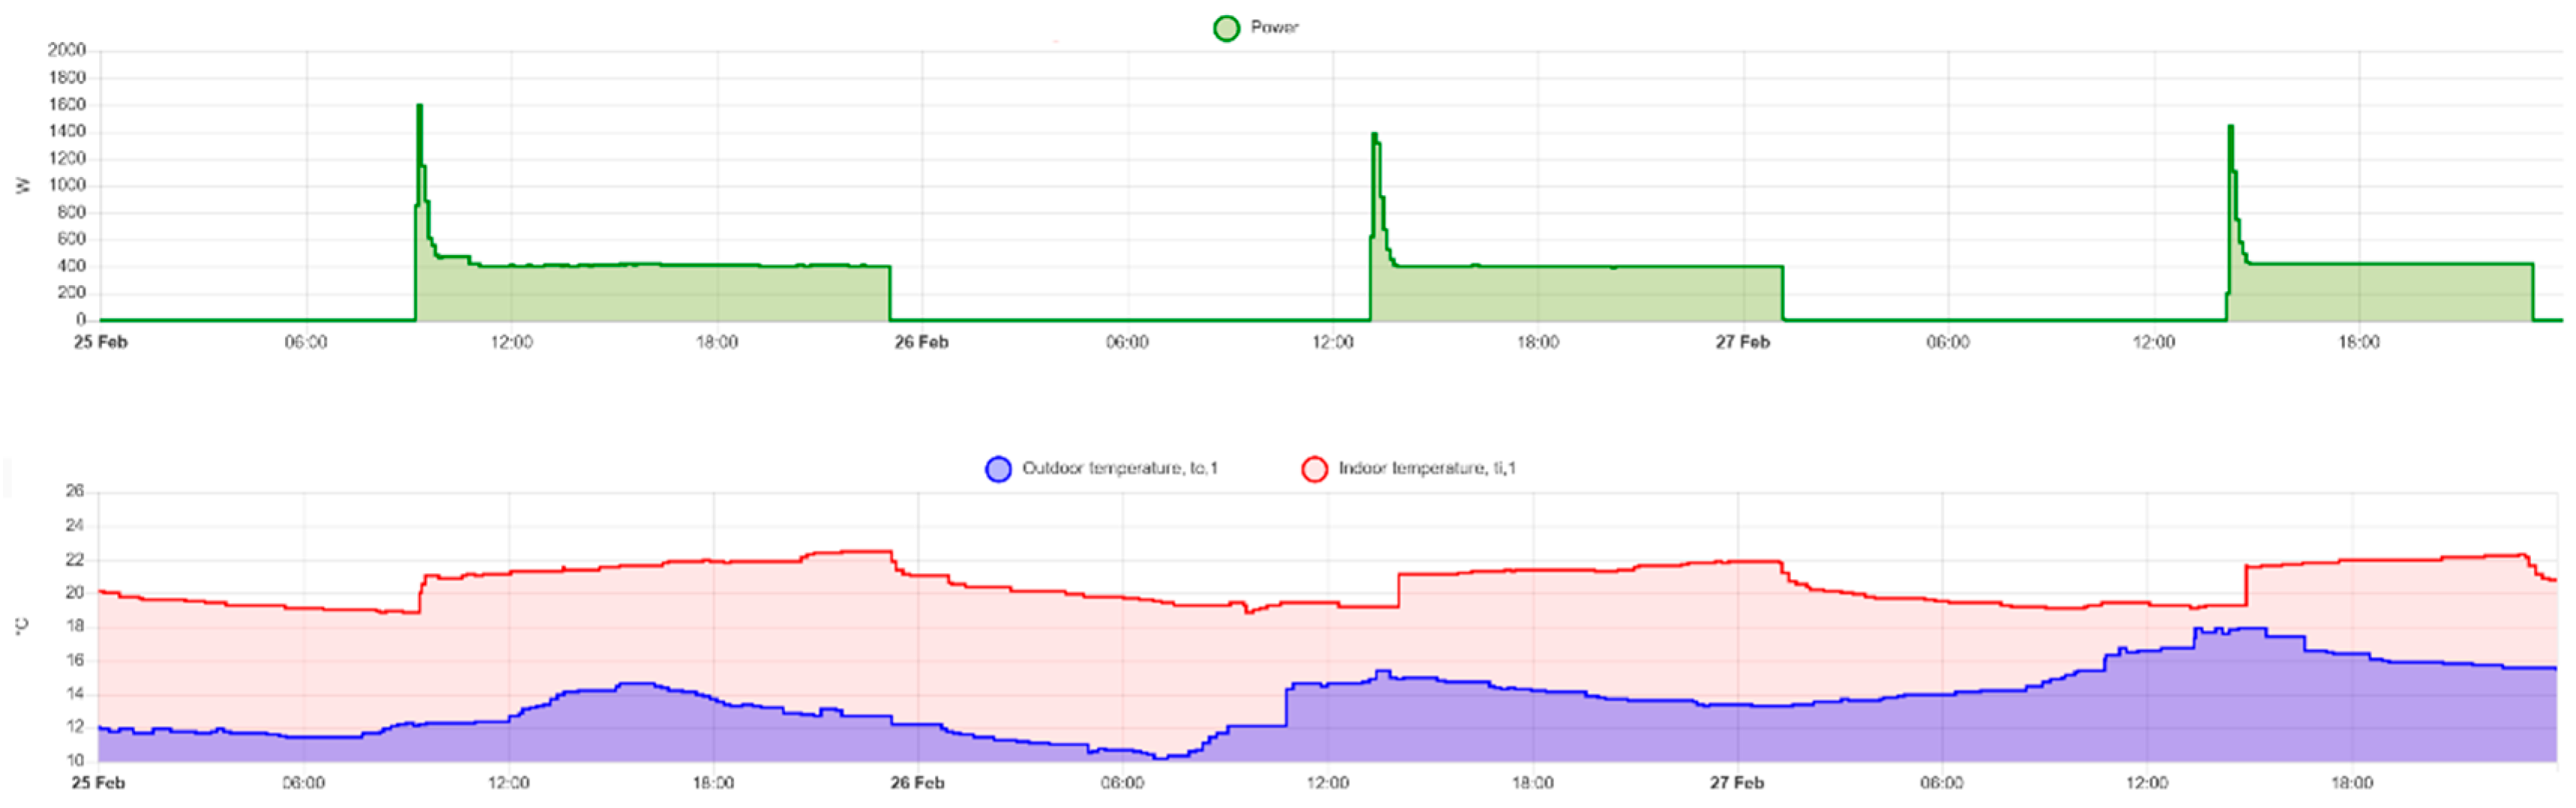
Figure 17.
Collected sample CO2 intensity, gCO2eq/kWh.
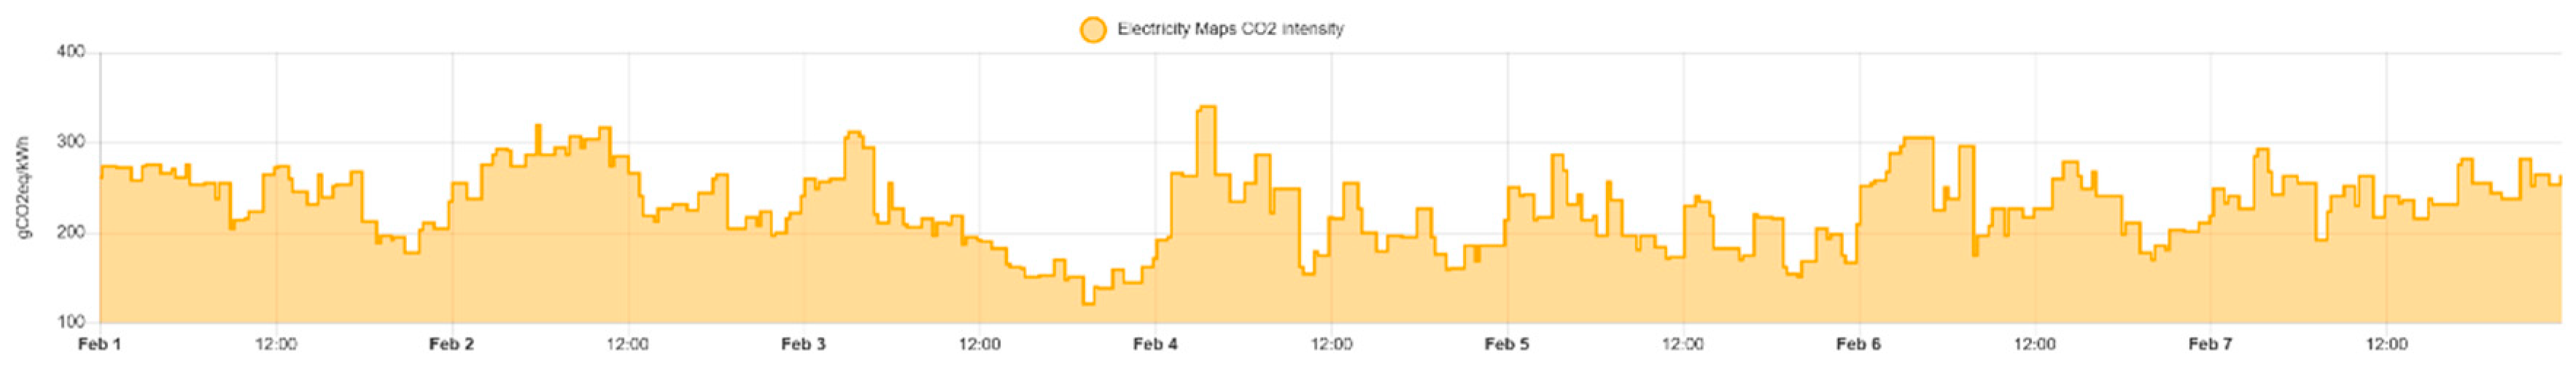
Figure 18.
Collected PM 2.5 sample in a space heated by a heat pump (11-17h) and a wood stove (17-23h).
Figure 18.
Collected PM 2.5 sample in a space heated by a heat pump (11-17h) and a wood stove (17-23h).
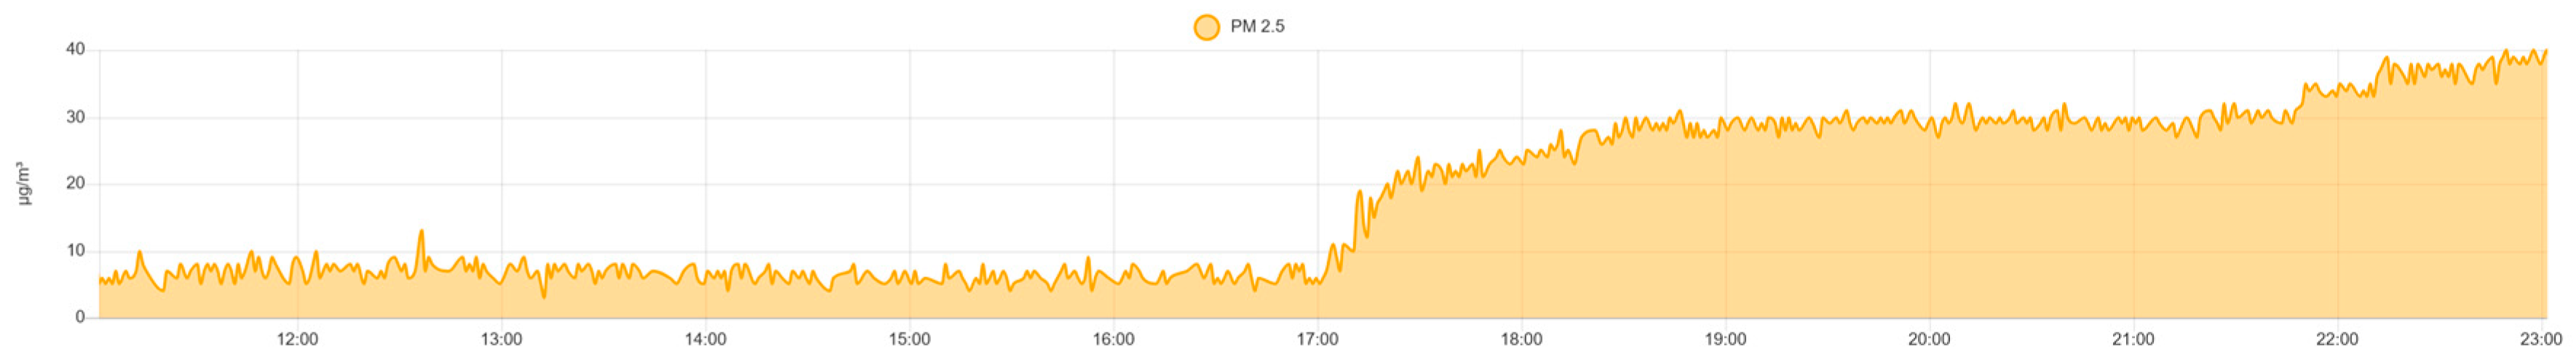

Table 1.
Thermal characteristics of the building.
| Name | U-Factor | R-Factor |
|---|---|---|
| Symbol | U | R |
| Units | W/m2K | m2K/W |
| Windows | 1.20 | 0.83 |
| Exterior doors | 4.00 | 0.25 |
| Wall | 0.45 | 2.20 |
| Floor | 0.41 | 2.40 |
| Roof | 0.33 | 3.00 |
Table 2.
Thermo-technical characteristics of the residence.
| Mark | Units | Model 1 | Model 2 | |
|---|---|---|---|---|
| Area | A | m2 | 106 | 106 |
| Volume | V | m3 | 378 | 378 |
| Outdoor design temperature | to | °C | -4 | 7.5 |
| Indoor design temperature. | ti | °C | 20 | 20 |
| Heat loss | W | 4,830 | 2,465 | |
| Heat loss per square meter | W/m2 | 46 | 23.5 |
Table 3.
Technical characteristics of the heat pump [11].
Table 3.
Technical characteristics of the heat pump [11].
| Mark | Units | ||
|---|---|---|---|
| Type | HP1 | - | Toshiba, Seya, RAS-18J2KVG |
| Power | kW | 1.6 | |
| Heating | kW | 5.4 | |
| Coefficient of performance | COP1 | - | 3.38 |
| Seasonal Coefficient of performance | SCOP1 | - | 4 |
| Type | HP2 | - | Toshiba, Seya, RAS-B13J2KVG |
| Coefficient of performance | COP2 | - | 3.72 |
| Seasonal Coefficient of performance | SCOP2 | - | 4 |
Table 4.
Summary of energy quantities of models.
| Mark | Units | Model1 | Model2 | Measured | |
|---|---|---|---|---|---|
| Seasonal Coefficient of performance | SCOP | - | 4 | 4 | 4.2 |
| Annual electrician energy consumption | Qe | kWh a | 1,932 | 1,578 | 771 |
| Annual heating energy consumption | Qh | kWh a | 7,730 | 6,310 | 3,238 |
| Annual heating energy consumption per square meter | Qh,A | kWh/m2 a | 73.1 | 59.7 | 30.6 |
| Annual electric energy consumption per square meter | Qe,A | kWh/m2 a | 18.3 | 14.9 | 7.3 |
| Energy class | - | - | C | C | B |
Disclaimer/Publisher’s Note: The statements, opinions and data contained in all publications are solely those of the individual author(s) and contributor(s) and not of MDPI and/or the editor(s). MDPI and/or the editor(s) disclaim responsibility for any injury to people or property resulting from any ideas, methods, instructions or products referred to in the content. |
© 2025 by the authors. Licensee MDPI, Basel, Switzerland. This article is an open access article distributed under the terms and conditions of the Creative Commons Attribution (CC BY) license (http://creativecommons.org/licenses/by/4.0/).
Copyright: This open access article is published under a Creative Commons CC BY 4.0 license, which permit the free download, distribution, and reuse, provided that the author and preprint are cited in any reuse.


