
Submitted:
31 March 2025
Posted:
03 April 2025
You are already at the latest version
Abstract
Every organism exhibits slight differences in DNA sequences among individuals of the same species, making each one unique. These variations, known as genetic variants, can influence phenotypic traits or susceptibility to diseases. Some genetic variations may provide advantages, such as resistance to pathogens, while others can have detrimental effects, leading to disease. Genome-wide association studies (GWAS) identify associations between single-nucleotide polymorphisms (SNPs) and phenotypic traits, helping to uncover genetic variants that contribute to specific phenotypic expressions. Several statistical models have been developed to enhance the power of GWAS in detecting true genetic associations while minimizing false positives and false negatives. In this study, we compared the power of single-locus and multi-locus statistical models and investigated how varying window sizes around quantitative trait nucleotides (QTNs) affect model performance, using genotypic data from maize (Zea mays L.) and a simulated phenotype. Our results revealed clear differences among models: the General Linear Model (GLM) exhibited severe p-value inflation and excessive false positives, while the Multiple Loci Mixed Model (MLMM) identified the most true QTNs (7/20) while controlling Type I error and false discovery rates. BLINK proved computationally efficient, detecting six true QTNs and outperforming other multi-locus models in runtime. Notably, increasing the window size from 1,000 to 10,000 bp had minimal impact on power, highlighting that method selection—not window size—is critical for accuracy. Thus, MLMM and BLINK offer an optimal balance of statistical rigor and efficiency for maize GWAS, providing actionable insights to enhance trait-marker association studies.
Keywords:
GWAS
; statistical methods
; single and multi-locus models
; quantitative traits
; power comparison
Introduction
Genetic variation is fundamental to the diversity observed within species, influencing traits such as morphology, development, disease susceptibility, and environmental adaptation. These variations result from differences in DNA sequences among individuals, known as genetic variants, which can have beneficial, neutral, or detrimental effects (Witte et al., 2014; Tan et al., 2015; Dlugosch et al., 2016). Understanding how genetic variation contributes to phenotypic traits is a key objective in genetics and evolutionary biology, with significant implications for agriculture, medicine, and conservation. A powerful approach to studying these relationships is GWAS, which identifies statistical associations between genetic variants, particularly SNPs, and observable traits.
Identifying genes associated with specific traits has broad applications, including disease management and the conservation of agriculturally important characteristics (Lambert et al., 2012; Sahito et al., 2024). However, a major challenge in GWAS is the risk of false discoveries, which can arise due to population structure, kinship and other confounding factors (Price et al., 2010). Addressing these issues requires statistical models that effectively account for these confounders while maintaining statistical power.
Over the years, various statistical methods have been developed for GWAS, ranging from simple single-locus models to more advanced multi-locus approaches. Early methods, such as the t-test, chi-square, and F statistics, treated SNPs as fixed effects to identify associations between genotypes and phenotypes (Spielman et al., 1993; Allison, 1997). However, these simple models often led to high false discovery rates because they did not account for population structure. A significant improvement came with the introduction of GLMs, which incorporate covariates like principal component analysis (PCA) to adjust for population structure and reduce false positives (Pritchard et al., 2000; Price et al., 2006). However, relying solely on population structure adjustments can still lead to either insufficient control of false positives or a reduction in statistical power due to familial relatedness (Yu et al., 2005).
To address these limitations, mixed linear models (MLMs) were introduced, incorporating both population structure and kinship matrices. The inclusion of kinship matrices as random effects accounts for varying degrees of relatedness among individuals, while population structure covariates help control type I and type II error rates (Yu et al., 2005). Further refinements, such as the Compressed MLM (CMLM), group individuals based on kinship to reduce computational burden and improve statistical efficiency (Zhang et al., 2010).
Beyond single-locus models, newer multi-locus GWAS methods have been developed to improve power and computational efficiency. Methods such as MLMM, FarmCPU, and BLINK address the limitations of mixed linear models by testing multiple markers simultaneously while controlling for confounding effects (Segura et al., 2012; Liu et al., 2016; Huang et al., 2019). MLMM enhances association testing by incorporating multiple loci into a linear mixed model rather than analyzing markers individually. By including markers as covariates stepwise, it accounts for confounding between genetic markers and kinship, enhancing statistical power and accuracy (Segura et al., 2012). FarmCPU implements an iterative approach that alternates between fixed- and random-effect models to select significant SNPs while reducing false positives and false negatives (Liu et al., 2016). Unlike traditional MLMs, it does not rely on a fixed kinship matrix, which improves computational efficiency. BLINK further refines this approach by replacing FarmCPU’s marker binning step with a BIC-based optimization, allowing for faster computations without compromising accuracy (Huang et al., 2019). These advancements make multi-locus GWAS models particularly useful for analyzing large genomic datasets.
The objective of this study is to evaluate the performance of different statistical models used in GWAS by comparing their power to detect true genetic associations while minimizing false positives and false negatives. Since the effectiveness of these models could be influenced by the window size around a QTN, we also aim to investigate how varying the window size affects model performance. By using genotypic data from maize and a simulated phenotype, we assess the strengths and limitations of both single-locus and multi-locus GWAS models, providing insights into their suitability for different genetic architectures.
Material and Methods
GWAS Analysis
In this study, we utilized the SNP dataset from Cook et al. (2012), focusing on maize kernel composition. This dataset comprises 282 inbred lines, each characterized by approximately 56,000 SNP markers distributed across the maize genome. Genotypic data were obtained using the Illumina MaizeSNP50 BeadChip and accessed via the Panzea project (Panzea project, 2025). Phenotypic data were simulated to achieve a heritability of 75%, incorporating 20 true QTNs. To assess the association between genetic loci and the traits of interest, we employed the Genome Association and Prediction Integrated Tool (GAPIT) version 3 (Wang & Zhang, 2021). This software integrates multiple models to enhance the power and accuracy of genome-wide association studies (GWAS) .
The GWAS models implemented include both single-locus and multi-locus approaches. For single-locus analyses, we utilized GLM, Mixed Linear Model (MLM), Compressed Mixed Linear Model (CMLM), and Settlement of MLM Under Progressively Exclusive Relationship (SUPER). The multi-locus methods applied were MLMM, Fixed and Random Model Circulating Probability Unification (FarmCPU), and Bayesian-information and Linkage-disequilibrium Iteratively Nested Keyway (BLINK) . Principal component analysis was used to control for population structure.
Models Evaluation
Quantil-Quantil (Q-Q) plots provide a concise visual summary of the distribution of observed test statistics in GWAS, effectively revealing p-value inflation (McCarthy et al., 2008). Model performances were evaluated by examining the Q-Q plots to assess the rates of false positives and false negatives. Additionally, models were assessed based on the number of simulated QTNs detected within the simulated dataset. Visualization tools such as Manhattan plots, Q–Q plots, and power comparison plots were generated using the GAPIT package in R software to interpret the results (R Core Team 2022). Prior to analysis, genotype data were converted from the Haplotype Map (HapMap) format to numerical format.
Simulation Experiments
To evaluate the power and Type I error rates of various single-locus and multi-locus GWAS methods, we conducted a simulation study. We assigned twenty true QT and simulated phenotypic data with a heritability of 75%. The simulation was replicated 30 times, and the seven GWAS methods were applied to analyze the data. For validation, any detected QTN located within 1 or 10 kilobase (kb) of an assigned QTN was considered a true positive.
Results
Model Comparison: Manhattan plots, Q-Q Plots & True Associations
Combined GWAS analyses across all GAPIT models identified a total of 17 QTNs. From these results, we were interested in evaluating the QTNs that were co-detected across the models, particularly focusing on those that most accurately identified the true QTNs among the 20 established in the simulation. In this regard, we found that among the detected QTNs, only two were co-detected by all models, located on chromosomes 1 and 2, and they corresponded to true QTNs. Furthermore, MLMM and BLINK detected the highest number of QTNs—with seven and six true QTNs, respectively—while MLM and CMLM detected the fewest, with only two markers identified (Figure 1).
In our analysis (Figure 2), the Q-Q plots for the simulated phenotype illustrate that GLM and SUPER exhibit the highest inflation of p-values, while the mixed models MLM and CMLM mitigate this inflation to a greater extent—albeit still less effectively than multi-locus approaches. Notably, BLINK emerged as the most powerful method for detecting positive associations, followed closely by FarmCPU and MLMM. Among the single-locus methods, GLM demonstrated the lowest performance, with SUPER trailing, whereas MLM and CMLM produced comparable results.
Simulation Experiments
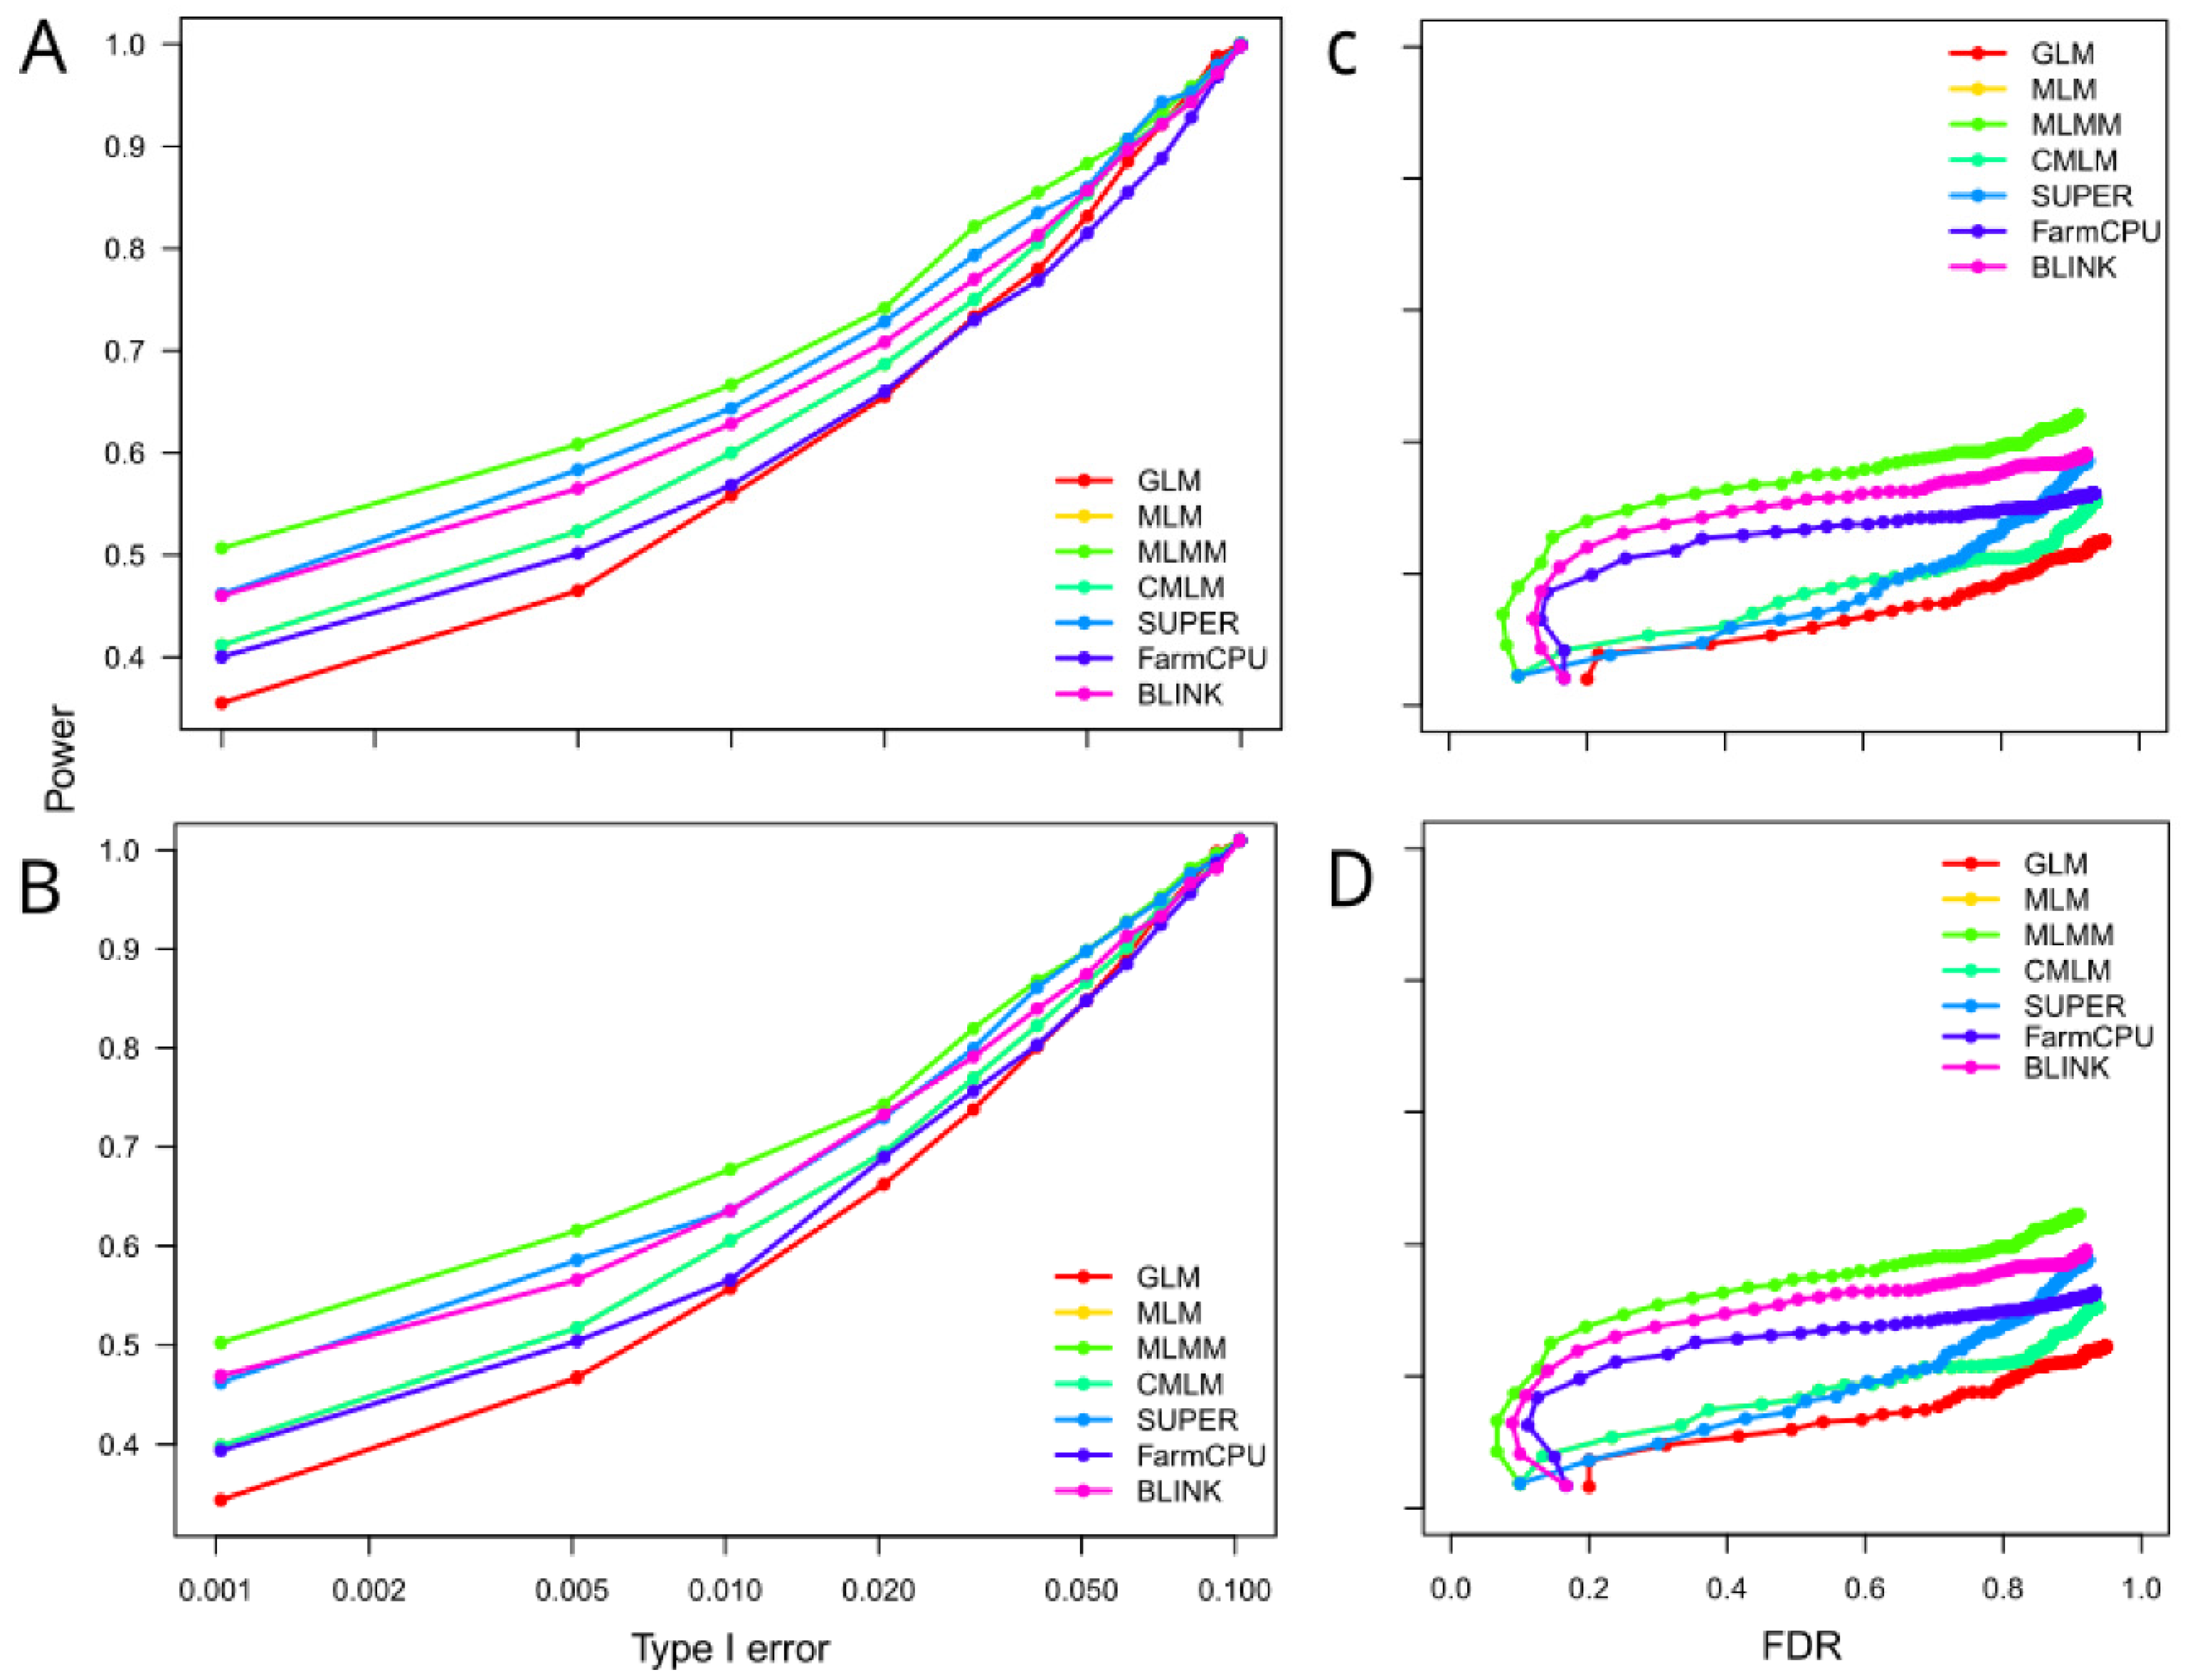
The relationship between statistical power and error control, Type I and False discovery rate (FDR), was evaluated using ROC curves, with higher AUC values indicating superior performance. As shown in Figure 3 (A, B), the power of the methods while controlling Type I error varied across models. Notably, MLMM exhibited the highest power, whereas GLM demonstrated the lowest performance. When evaluating the control of false positives, MLMM and GLM remained the most and least powerful models. MLM and CMLM performed the same, window size didn’t affect the power of the models. MLM, CMLM, and SUPER showed power levels that were lower than those of the multi-locus methods but still higher than GLM when controlling for FDR. Moreover, the power increased slightly among models when the window size was increased to 10,000 compared to 1,000 but the ranking was maintained while controlling type I error or FDR.
Discussion
This study aimed to compare the performance of seven single- and multi-locus GWAS models in detecting marker-trait associations in a maize population using simulated quantitative traits. Our results demonstrate significant differences in model efficacy, with the GLM showing the poorest performance, as evidenced by a substantial deviation in Q-Q plots and an elevated number of false positives in Manhattan plots. These findings align with previous studies in humans, wheat, goats, and Arabidopsis, reinforcing the conclusion that GLM is ill-suited for mapping complex quantitative traits (Zhang et al., 2010; Cebeci et al., 2023; Sandhu et al., 2024). The inflated false discovery rate in GLM likely stems from its failure to account for relatedness among individuals, a limitation not fully addressed by population structure parameters alone (Zhang et al., 2010).
The MLMM emerged as the top-performing method, detecting the highest number of true QTNs while maintaining stringent control of both Type I error and false discovery rates. This superior performance highlights MLMM’s advantage in balancing detection power with statistical rigor, attributable to its combined use of kinship correction and multi-marker testing (Segura et al., 2012). Other multi-locus approaches, including BLINK and FarmCPU, also showed strong performance, though marginally less than MLMM. Notably, BLINK stood out as a high-performing alternative, detecting six true QTNs while achieving superior computational efficiency. BLINK’s innovative use of the Bayesian Information Criterion for marker selection enables it to retain high accuracy while drastically reducing runtime compared to other multi-locus methods (Huang et al., 2019). This unique combination of statistical power and computational speed positions BLINK as an ideal choice for large-scale genomic studies, particularly those constrained by resource limitations.
Among single-locus methods, mixed models (MLM and CMLM) showed comparable performance in QTN detection, with both identifying the same number of true QTNs. While CMLM was specifically designed to improve computational efficiency through kinship compression (Zhang et al., 2010), our results suggest that this optimization did not diminish detection power relative to standard MLM. Notably, CMLM remains advantageous for large-scale studies due to its compressed kinship approach, which reduces memory demands and accelerates processing (Wang & Zhang, 2021). The similar detection rates between MLM and CMLM in our study may reflect the specific simulated genetic architecture or population structure, underscoring the need for context-driven method selection.
These findings proved robust across different window sizes, with only marginal power improvements observed when increasing the window size from 1,000 to 10,000 bp. This consistency underscores that methodological choice—rather than minor adjustments to window size—is the primary determinant of detection accuracy. For maize genetic studies and breeding programs, our results strongly support prioritizing multi-locus methods, with MLMM recommended for maximal detection power and BLINK favored for resource-intensive studies requiring efficiency. Future research should explore the performance of these models across diverse genetic architectures and larger populations to optimize their application in plant genomics and breeding.
References
- Allison, D. B. (1997). Transmission-disequilibrium tests for quantitative traits. American Journal of Human Genetics, 60(3), 676–690. PMID: 9042929.
- Cebeci, Z., Bayraktar, M., & Gökçe, G. (2023). Comparison of the statistical methods for genome-wide association studies on simulated quantitative traits of domesticated goats (Capra hircus L.). Small Ruminant Research, 227. [CrossRef]
- Cook, J. P., McMullen, M. D., Holland, J. B., Tian, F., Bradbury, P., Ross-Ibarra, J., Buckler, E. S., & Flint-Garcia, S. A. (2012). Genetic architecture of maize kernel composition in the nested association mapping and inbred association panels. Plant Physiology, 158(2), 824–834. [CrossRef]
- Dlugosch, K. M., Anderson, S. R., Braasch, J., Cang, F. A., & Gillette, H. D. (2016). The devil is in the details. In S. C. H. Barrett, R. I. Colautti, K. M. Dlugosch, & L. H. Rieseberg (Eds.), Invasion genetics (Chapter 14). [CrossRef]
- Huang, M., Liu, X., Zhou, Y., Summers, R. M., & Zhang, Z. (2019). BLINK: A package for the next level of genome-wide association studies with both individuals and markers in the millions. GigaScience, 8(2), giy154. [CrossRef]
- Lambert, J. C., Ibrahim-Verbaas, C. A., Harold, D., Naj, A. C., Sims, R., Bellenguez, C., Jun, G., DeStefano, A. L., Bis, J. C., Beecham, G. W., Grenier-Boley, B., Russo, G., Thornton-Wells, T. A., Jones, N., Smith, A. V., Chouraki, V., Thomas, C., Ikram, M. A., Zelenika, D., … Seshadri, S. (2013). Meta-analysis of 74,046 individuals identifies 11 new susceptibility loci for Alzheimer’s disease. Nature Genetics, 45, 1452–1458. [CrossRef]
- Liu, X., Huang, M., Fan, B., Buckler, E. S., & Zhang, Z. (2016). Iterative usage of fixed and random effect models for powerful and efficient genome-wide association studies. PLOS Genetics, 12, e1005767. [CrossRef]
- McCarthy, M. I., Abecasis, G. R., Cardon, L. R., Goldstein, D. B., Little, J., Ioannidis, J. P. A., & Hirschhorn, J. N. (2008). Genome-wide association studies for complex traits: Consensus, uncertainty, and challenges. Nature Reviews Genetics, 9(5), 356–369. [CrossRef]
- Panzea Project. (2025, March 24). Genotype data. Retrieved from https://cbsusrv04.tc.cornell.edu/users/panzea/download.aspx?filegroupid=7.
- Pritchard, J. K., Stephens, M., Rosenberg, N. A., & Donnelly, P. (2000). Association mapping in structured populations. American Journal of Human Genetics, 67(1), 170–181. [CrossRef]
- Price, A. L., Patterson, N. J., Plenge, R. M., Weinblatt, M. E., Shadick, N. A., & Reich, D. (2006). Principal components analysis corrects for stratification in genome-wide association studies. Nature Genetics, 38(8), 904–909. [CrossRef]
- Price, A. L., Zaitlen, N. A., Reich, D., & Patterson, N. (2010). New approaches to population stratification in genome-wide association studies. Nature Reviews Genetics, 11(7), 459–463. [CrossRef]
- R Core Team (2022). R: A language and environment for statistical computing. R Foundation for Statistical Computing, Vienna, Austria. URL https://www.R-project.org/.Sahito, J. H., Zhang, H., Gishkori, Z. G. N., Ma, C., Wang, Z., Ding, D., Zhang, X., & Tang, J. (2024). Advancements and prospects of genome-wide association studies (GWAS) in maize. International Journal of Molecular Sciences, 25(3), 1918. [CrossRef]
- Sandhu, K. S., Burke, A. B., Merrick, L. F., Pumphrey, M. O., & Carter, A. H. (2024). Comparing performances of different statistical models and multiple threshold methods in a nested association mapping population of wheat. Frontiers in Plant Science, 15. [CrossRef]
- Segura, V., Vilhjálmsson, B. J., Platt, A., Korte, A., Seren, Ü., Long, Q., & Nordborg, M. (2012). An efficient multi-locus mixed-model approach for genome-wide association studies in structured populations. Nature Genetics, 44(7), 825–830. [CrossRef]
- Spielman, R. S., McGinnis, R. E., & Ewens, W. J. (1993). Transmission test for linkage disequilibrium: The insulin gene region and insulin-dependent diabetes mellitus (IDDM). American Journal of Human Genetics, 52(3), 506–516. https://europepmc.org/articles/PMC1682161.
- Tan, A., Abecasis, G. R., & Kang, H. M. (2015). Unified representation of genetic variants. Bioinformatics, 31(13), 2202–2204. [CrossRef]
- Wang, J., & Zhang, Z. (2021). GAPIT Version 3: Boosting power and accuracy for genomic association and prediction. Genomics, Proteomics & Bioinformatics, 19(4), 629–640. [CrossRef]
- Witte, J. S., Visscher, P. M., & Wray, N. R. (2014). The contribution of genetic variants to disease depends on the ruler. Nature Reviews Genetics, 15(11), 765–776. [CrossRef]
- Yu, J., Pressoir, G., Briggs, W. H., Bi, I. V., Yamasaki, M., Doebley, J. F., … Buckler, E. S. (2005). A unified mixed-model method for association mapping that accounts for multiple levels of relatedness. Nature Genetics, 38, 203–208. [CrossRef]
- Zhang, Z., Ersoz, E., Lai, C.-Q., Todhunter, R. J., Tiwari, H. K., Gore, M. A., Bradbury, P. J., Yu, J., Arnett, D. K., Ordovas, J. M., & Buckler, E. S. (2010). Mixed linear model approach adapted for genome-wide association studies. Nature Genetics, 42, 355–360. [CrossRef]
Figure 1.
Manhattan plots of GWAS results: significant SNP markers in maize (Zea mays) associated with a simulated phenotype. Significant SNP markers detected by GLM, MLM, CMLM, SUPER, FarmCPU, BLINK, and MLMM GAPIT models are shown. The dotted line indicates a Bonferroni-corrected p-value threshold of 9.79 × 10⁻⁷ (-log10(p) = 6.0). Asterisks indicate significant SNP markers.
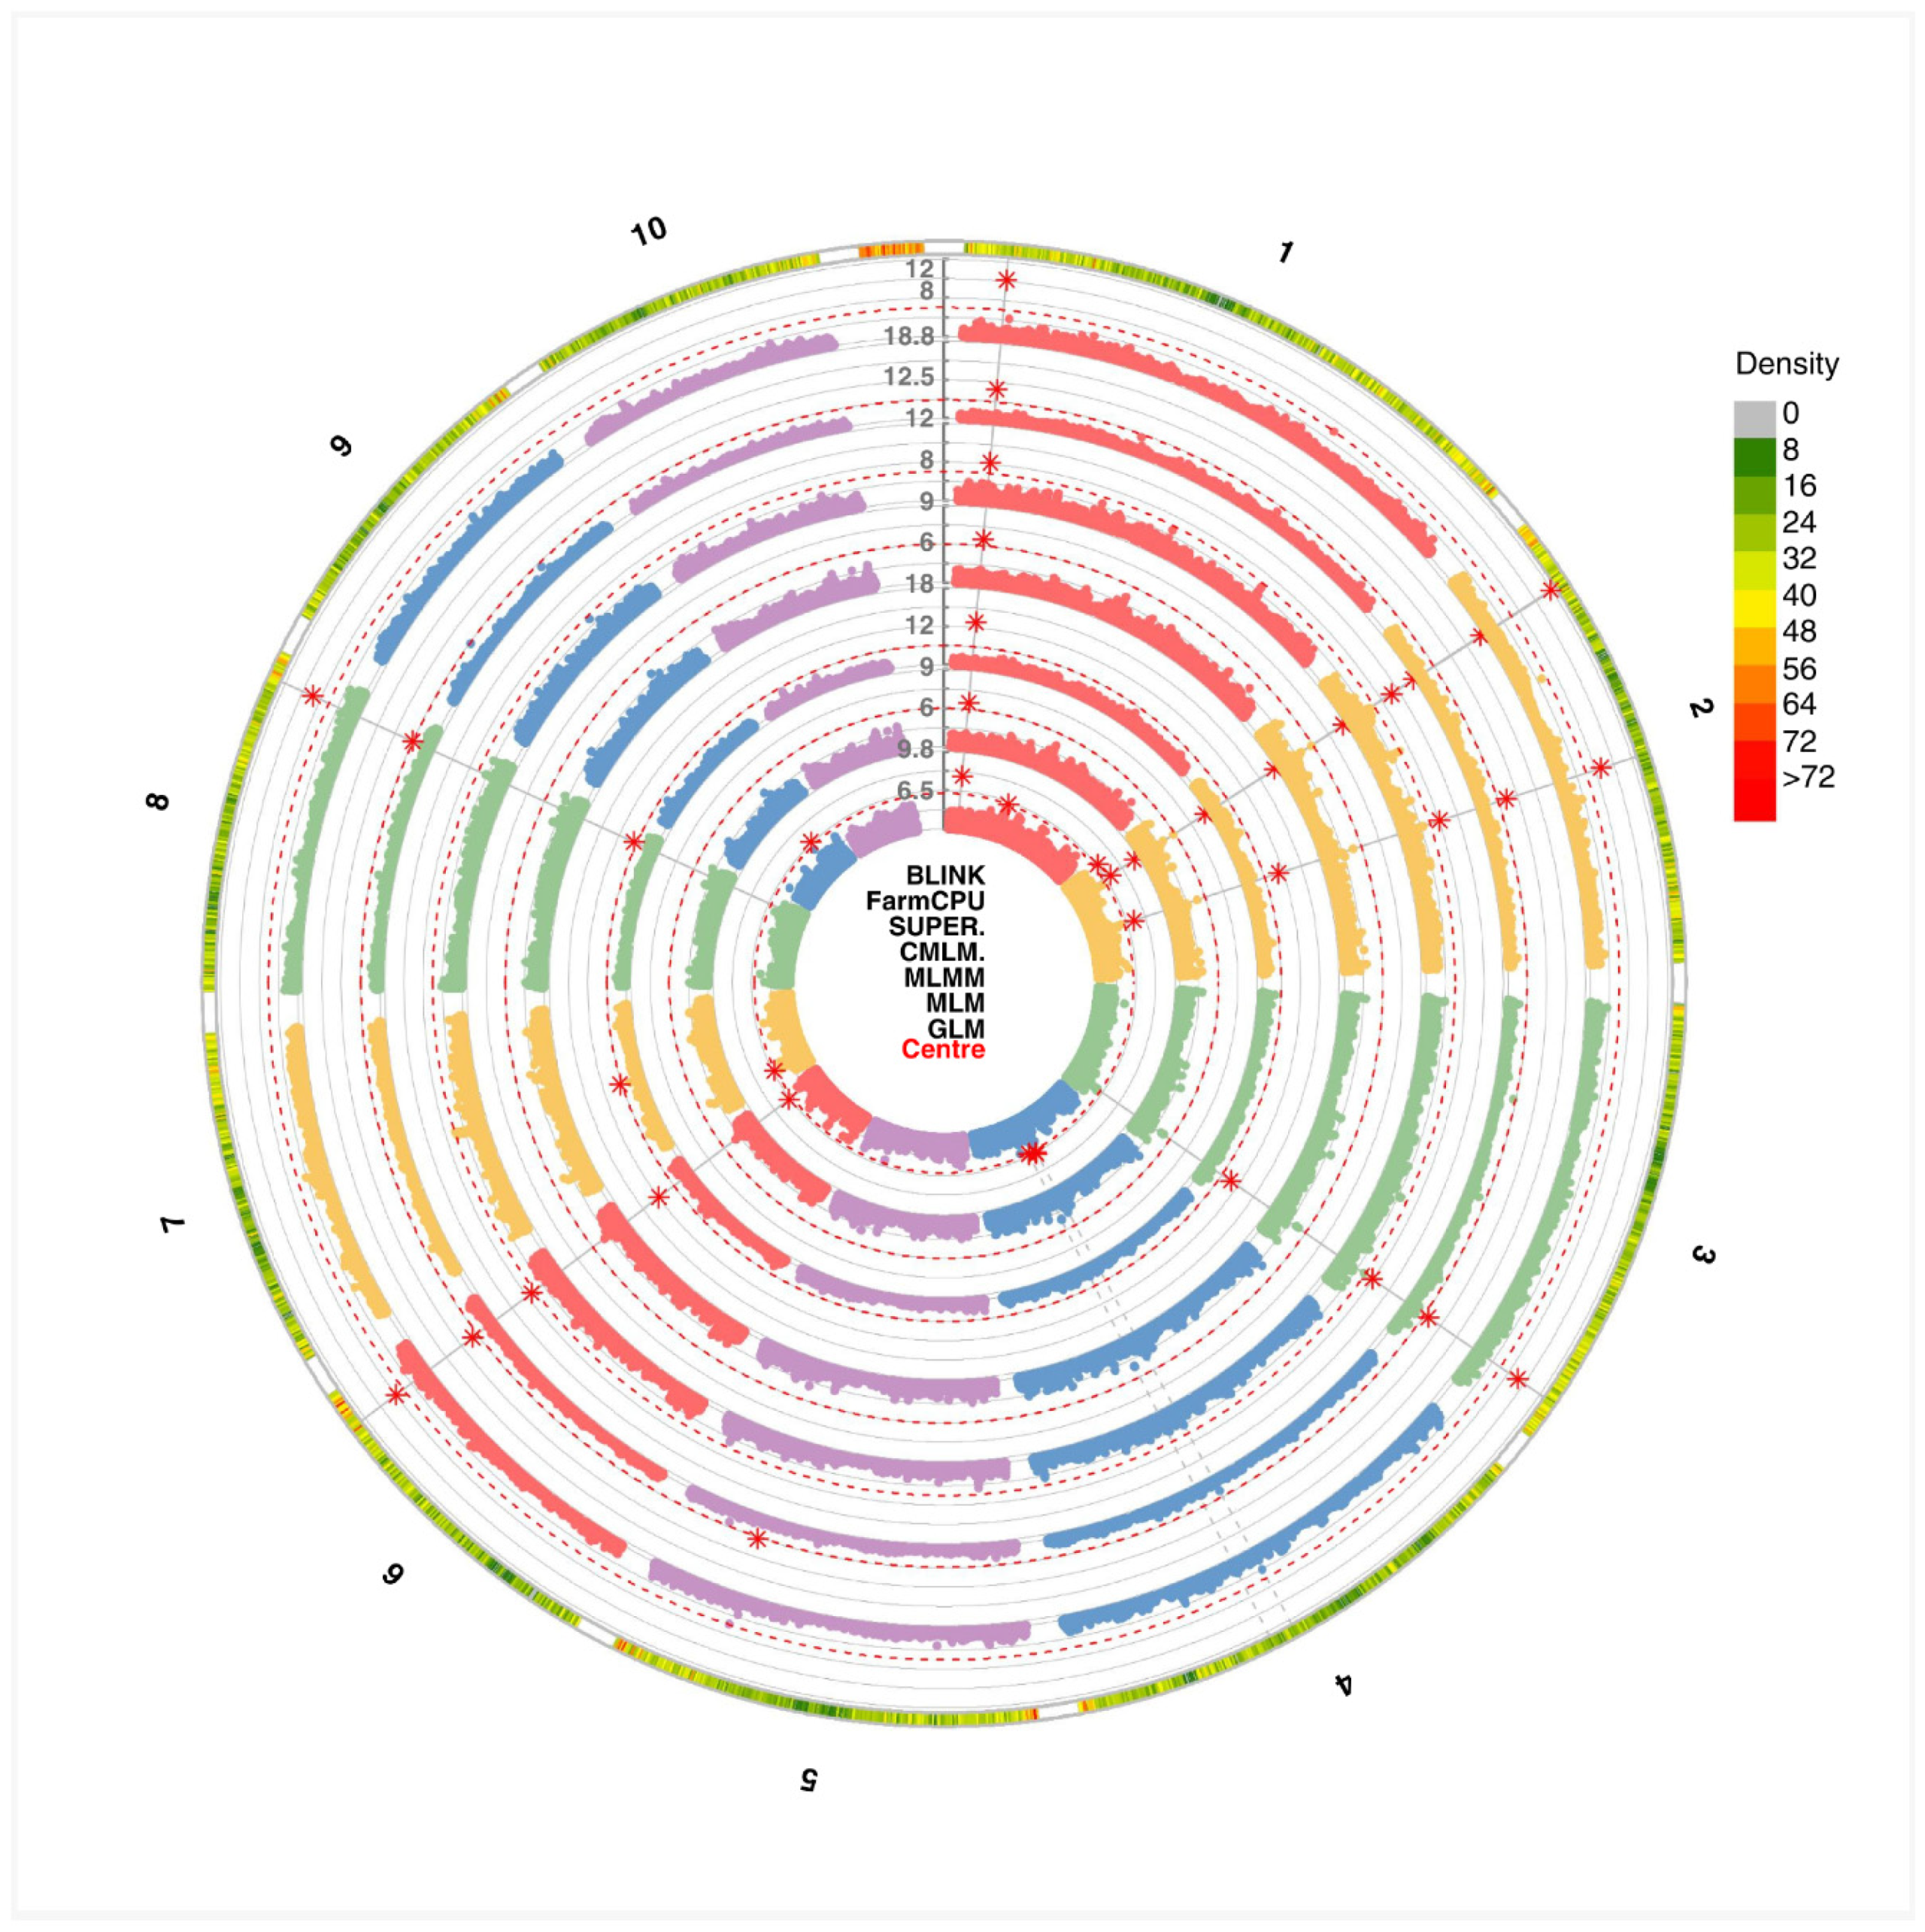
Figure 2.
Comparison of Q-Q plots for seven different GWAS models, namely, GLM, MLM, CMLM, SUPER, MLMM, FarmCPU, and BLINK for SNP markers in maize (Zea mays) associated with a simulated phenotype.
Figure 2.
Comparison of Q-Q plots for seven different GWAS models, namely, GLM, MLM, CMLM, SUPER, MLMM, FarmCPU, and BLINK for SNP markers in maize (Zea mays) associated with a simulated phenotype.
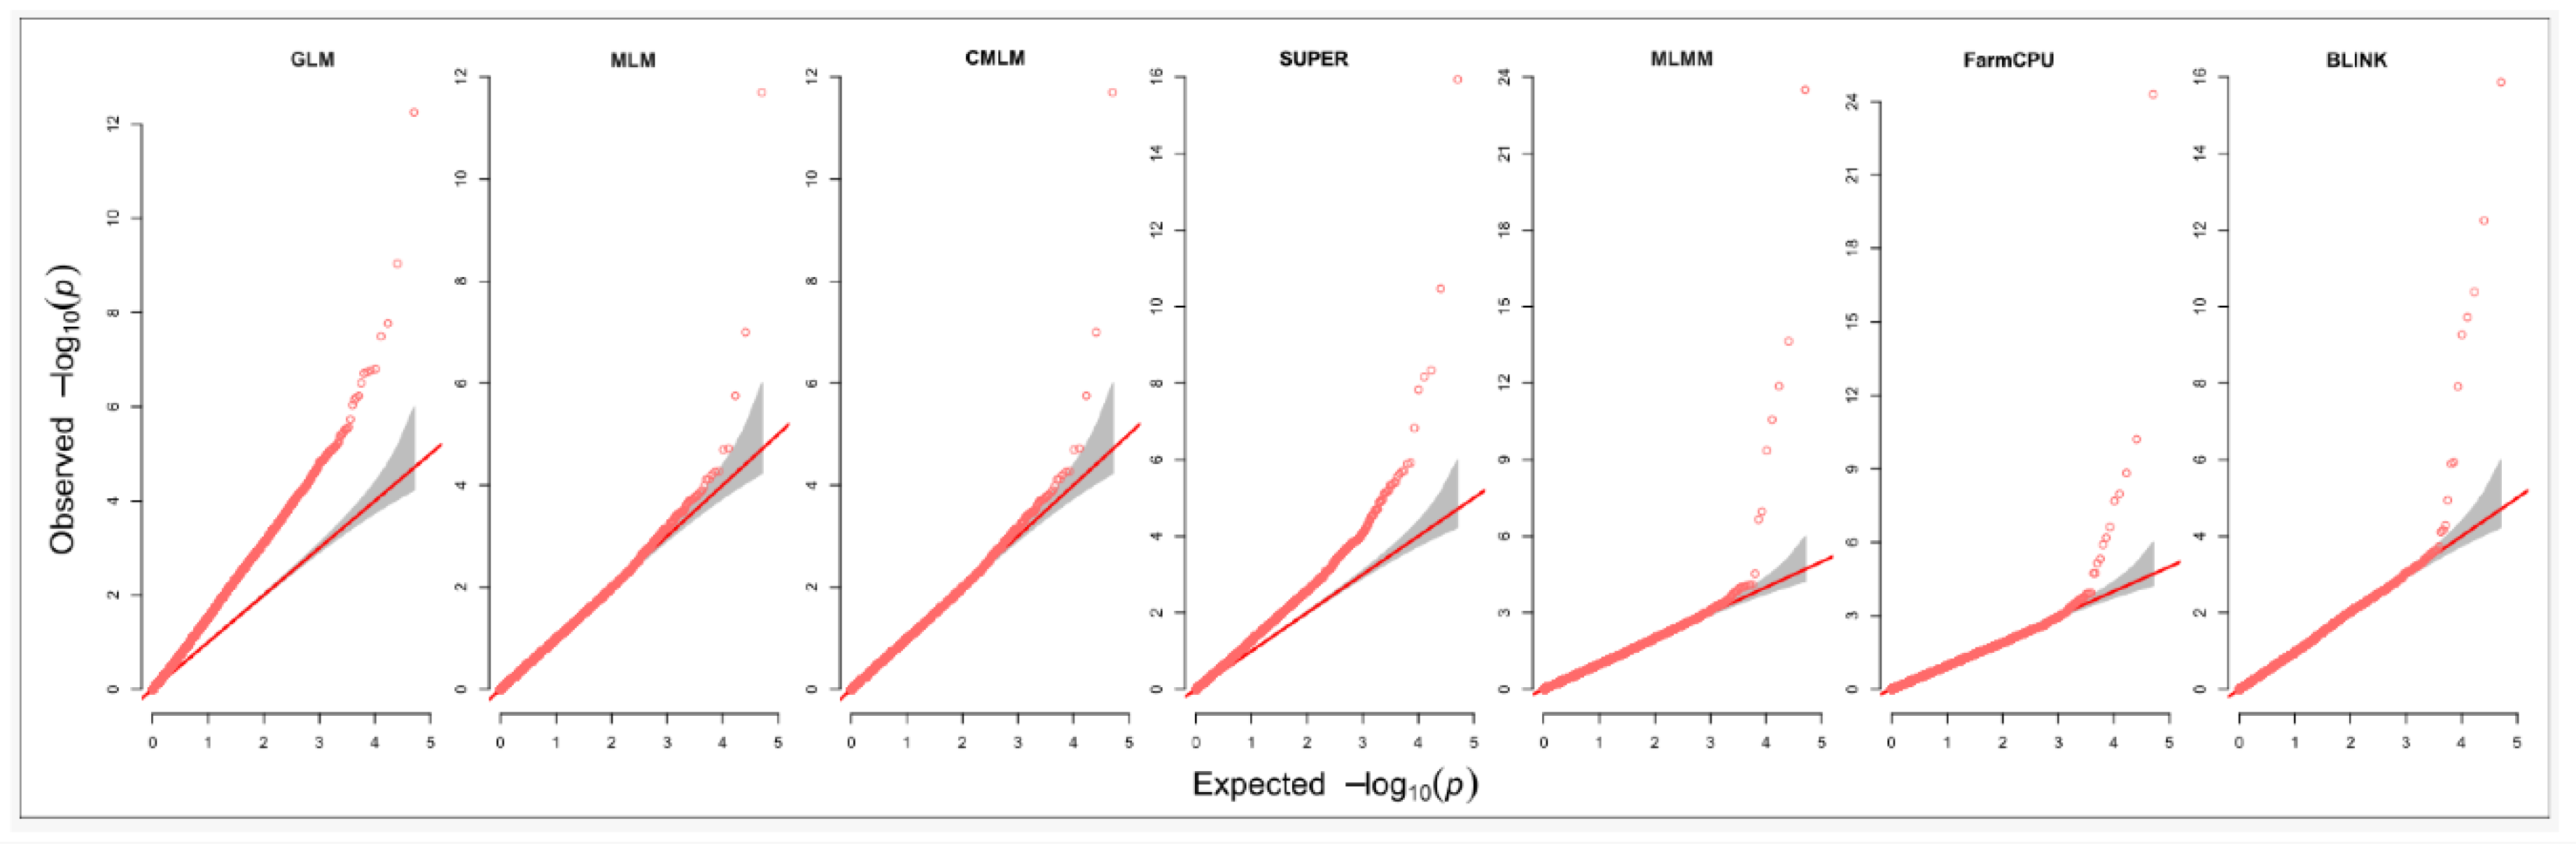
Figure 3.
Power of the methods against Type I error and FDR for (A-C) window size 1 kb and (B-D) window size 10 kb.
Figure 3.
Power of the methods against Type I error and FDR for (A-C) window size 1 kb and (B-D) window size 10 kb.
Disclaimer/Publisher’s Note: The statements, opinions and data contained in all publications are solely those of the individual author(s) and contributor(s) and not of MDPI and/or the editor(s). MDPI and/or the editor(s) disclaim responsibility for any injury to people or property resulting from any ideas, methods, instructions or products referred to in the content. |
© 2025 by the authors. Licensee MDPI, Basel, Switzerland. This article is an open access article distributed under the terms and conditions of the Creative Commons Attribution (CC BY) license (http://creativecommons.org/licenses/by/4.0/).
Copyright: This open access article is published under a Creative Commons CC BY 4.0 license, which permit the free download, distribution, and reuse, provided that the author and preprint are cited in any reuse.


