
Submitted:
28 March 2025
Posted:
31 March 2025
You are already at the latest version
Abstract
This study explores the potential of ultrasound-assisted extraction (UAE) for efficiently recovering bioactive compounds, particularly rutin, from the often-overlooked leaves of Capparis spinosa. By fine-tuning important extraction parameters such as ultrasound power, temperature, and ethanol concentration, the research achieved maximum yields of total phenolic content and rutin, establishing these leaves as a sustainable and valuable source of phytochemicals for applications in functional foods, nutraceuticals, and pharmaceuticals. High-performance liquid chromatography (HPLC) analysis revealed a high rutin content (15.51 mg/g DW), accompanied by considerable amounts of quercetin-3-glucoside and catechin. In vitro assays revealed the extract's strong antioxidative properties, effectively safeguarding Caco-2 and Hep G2 cells against oxidative stress and significantly lowering reactive oxygen species levels. Additionally, the extract enhanced the expression of vital antioxidative enzymes and demonstrated no toxicity at the tested concentrations, confirming its safety for dietary supplement use. These findings underscore the extract’s strong safety profile and notable bioefficacy, reinforcing its suitability for incorporation into health-oriented formulations such as functional foods, dietary supplements, or nutraceutical products. Beyond demonstrating biological relevance, this research also advances the sustainable valorization of Capparis spinosa leaf biomass—an underutilized resource with high phytochemical potential—while contributing to the development of innovative, plant-based strategies for disease prevention and overall health enhancement.
Keywords:
Capparis spinosa
; ultrasound-assisted extraction
; rutin content
; antioxidative properties
; reactive oxygen species
; Caco-2 cells
; Hep G2 cells
1. Introduction
The rising interest in natural, plant-based compounds highlights a growing consumer understanding of the relationship between diet and health, resulting in driving demand for products that offer more than just basic sustenance. Consequently, the incorporation of herbal extracts and bioactive phytochemicals into food, nutraceutical, and pharmaceutical products has gained significant attention from both industry and academia. Incorporation of herbal-based ingredients into functional food formulations has become a strategic approach to harness the synergistic benefits of nutrition and targeted bioactive compounds.
The shift in dietary preferences has generated a numerous research focused on the therapeutic potential of various plant-derived compounds. Among the various herbal sources of bioactive compounds being investigated, Capparis spinosa, commonly known as the caper bush, has emerged as a promising candidate due to its rich phytochemical profile and documented health benefits. Capparis spinosa L. (C. spinosa) is one of the most popular edible herbs in Capparidaceae family [1]. The caper bush is a resilient, high-value crop renowned for its ability to thrive in harsh, arid environments and adapt to climate change challenges [2]. Caper bushes are found abundantly in the wild, particularly in the Mediterranean basin, as well as parts of Asia, Africa, and the Middle East, contributing to its long-standing culinary and traditional medicinal applications in these regions [3].
The diverse phytochemicals found in capers, such as flavonoids, phenolic acids, and glucosinolates, have demonstrated antioxidant, anti-inflammatory, antimicrobial, and neuroprotective properties. Studies indicate that caper and its bioactive compounds may help manage metabolic conditions like diabetes and hyperlipidemia, while also exhibiting anticancer, hepatoprotective, and cardioprotective effects. It is used to treat various human ailments including inflammation, gastro-intestinal problems, anemia, liver dysfunction, rheumatism, as well as being used as an antispasmodic analgesic; antihaemorrhoidal; aperient; diuretic; expectorant, etc. [4,5,6]. One of the dominant compounds in caper, the flavonoid rutin, has been shown to exhibit potent antioxidant activity, scavenging free radicals and mitigating oxidative stress, which is key contributors to cancer development, one of the most prevalent illnesses today. This positions Capparis spinosa as a promising candidate for further research and development as a plant-based therapeutic or functional food ingredient.
By focusing on the mature leaves of Capparis spinosa, which are often overlooked in favor of the more commercially valuable flower buds, or fruit, this study contributes to the efficient and sustainable utilization of plant resources [3,7]. Unlocking the full potential of underutilized Capparis spinosa leaves can contribute to the valorization of this plant and also enhance the overall sustainability and economic viability of Capparis spinosa cultivation and processing, given its important socio-economic roles in arid regions.
Accordingly, comprehensive investigations have focused on the optimization of bioactive compound extraction from Capparis spinosa, particularly focused on enhancing the recovery of valuable compounds like rutin. Modern techniques, such as those utilizing ultrasound, are being developed to intensify the extraction process. Compared to conventional methods, ultrasound-assisted extraction (UAE) offers simplified procedures, improved efficiency, and versatility. The cavitation phenomenon in UAE enables high yields of desired components while minimizing interfering substances, resulting in highly active extracts even at low doses [8,9,10]. These advancements in extraction technology hold significant potential for the development of novel, plant-based interventions in the growing field of integrative and sustainable diet and healthcare solutions, particularly for applications in cancer prevention, management, and treatment.
Accordingly, the present research aims to fill a critical knowledge gap by focusing on the UAE, characterization, and optimization of bioactive compounds, particularly rutin, from the underutilized leaves of Capparis spinosa. By adopting a systematic approach, this study seeks to develop efficient extraction protocols and evaluate the biological activities of the leaf extracts. Increased utilization of Capparis spinosa leaves not only enhances the economic viability of the plant's cultivation and processing but also reduces waste, supporting more sustainable agricultural practices. Furthermore, by exploring the biological activities of these extracts, particularly their potential to reduce oxidative stress, which is related to the progression of many common noncommunicable diseases, this research opens the door to innovative health solutions. The bioactive compounds recovered from Capparis spinosa leaves can be incorporated into functional foods, nutraceuticals, and pharmaceutical products, providing new opportunities for value-added utilization of this versatile plant.
2. Material and Methods
2.1. Chemicals
Folin-Ciocalteau reagent, 2,2-diphenyl-1-picrylhydrazyl radical (DPPH•), Trolox (6-hydroxy-2,5,7,8-tetramethylchroman-2-carboxylic acid), and gallic acid were sourced from Sigma-Aldrich GmbH (Taufkirchen, Germany). Ethanol (96% v/v) and methanol (95% v/v) were provided by Zorka Pharma (Šabac, Serbia). All other chemicals were of analytical grade, and water was purified using a Milli-Q system from Millipore (Bedford, MA, USA).
2.2. Plant Material
In this study, the material of investigation was caper leaves. The leaves were collected from the western mountains of Libya, near the town of Jadu and Nafusa Mountains in the Jabal al Gharbi District (geographical coordinates: 31° 56' 59.99" N, 12° 00' 60.00" E). After collection, the leaves were washed with purified water to remove any external contamination. The washed leaves were then air-dried for 7 days in the dark. Once dried, the leaves were crushed into a fine powder using a blender A100 (Ika, Germany). To ensure a standard particle size, the obtained plant material was sieved through a 0.5 mm metal sieve. The sieved powder was then stored hermetically in sealed plastic bags until used for further analysis or experimentation.
2.3. Extraction Protocol
2.3.1. Ultrasound-Assisted Extraction (UAE)
In all experiments, 10.0 g of capers leaves were mixed with 100 mL of 70% ethanol in a 250 mL flask. The use of 70% ethanol was selected based on preliminary screening of various ethanol concentrations for optimal extraction efficiency. UAE was carried out in a sonication water bath (Transsonic TI-H 15, Elma Schmidbauer GmbH, Germany) operating at a fixed frequency of 45 kHz. The ultrasonic power was varied between 30 and 90% corresponding to 60 to 180 W/L, with extraction temperatures ranging from 40 °C to 80 °C, and extraction times between 40 and 80 minutes. All parameters—ultrasonic power, temperature, and time—were controlled via the instrument panel. The flasks were consistently placed at the same distance from the transducer, with no additional agitation applied. Based on the study by Boudries et al. (2019), the extraction time was standardized to 60 minutes.
2.3.2. Experimental Design
In this study, a Box-Behnken Design (BBD) was employed to optimize the extraction of bioactive compounds from Capparis spinosa using UAE. The experimental design consisted of 15 experiments with three variables at three levels (-1, 0, and 1), and three replicates at the central point. The independent variables—ultrasonic power (30-90%), extraction temperature (40-80°C), and extraction time (40-80 minutes)—were investigated to determine optimal extraction conditions. Response Surface Methodology (RSM) was applied to analyze the effects of these variables on the extraction process, and the analysis was performed using Design-Expert v11 software (Stat-Ease Inc., Minneapolis, MN, USA). The independent variables were coded to range from -1 to 1 for the normalization.
The study aimed to optimize the yield of polyphenolic compounds and antioxidant activity. The second-order polynomial model was used to evaluate the influence of each variable on the responses (Equation (1):
where Y is the response variable, Xi and Xj are independent variables and βi, βii, and βij are the regression coefficients for intercept, linear, quadratic and interception terms, respectively. Regression coefficients were obtained to describe relationship between the responses and the independent variables.
2.4. Spectrophotometric Analysis
2.4.1. Total Phenolic Content
The total phenolic content (TPC) was determined using the spectrophotometric method described by Platzer, Kiese, Herfellner, Schweiggert-Weisz, & Eisner (2021) with some modifications. Absorbance was measured at 750 nm using a spectrophotometer (Specord M40, Carl Zeiss, Jena, Germany). Gallic acid was used as the standard to construct the calibration curve, and TPC was expressed as gallic acid equivalents (GAE) in mg GAE/g of Capparis spinosa.
2.4.2. Total Flavonoids Content
Total flavonoid content (TFC) was determined using a colorimetric method based on Dewanto et al. (2002) with modifications. The extract was mixed with sodium nitrite, aluminum chloride, and sodium hydroxide, and absorbance was measured at 510 nm using a spectrophotometer. Catechin was used for the calibration curve, and TFC was expressed as catechin equivalents (CE) (mg CE/g of caper leaves).
2.4.3. Antioxidant Capacity
The extracts' free radical scavenging potential was determined using the DPPH assay. This method involves monitoring the reduction of the DPPH• radical, which changes from a deep purple color to yellow upon reaction with antioxidants. The antioxidant activity was quantified and expressed in terms of micromoles of Trolox equivalents per gram of dry weight (µmol TE/g DW).
2.5. Chromatographic Analysis
2.5.1. Phenolic Profile Determination by HPLC
Phenolic compounds in the obtained extracts were analyzed using HPLC (Agilent 1200 series) with an Eclipse XDB-C18 column (4.6 × 50 mm, 1.8 μm) and a diode array detector (DAD) [11,12]. Chromatographic separation used a linear gradient of methanol (solvent A) and 1% formic acid in water (solvent B) with a flow rate of 1 mL/min at 30 °C. Detection was performed at 280 nm, 330 nm, and 350 nm, with spectra recorded from 190–400 nm. The method was validated for linearity, LOD, LOQ, precision, and accuracy. Phenolic compounds were identified by comparing retention times and spectra with standards, and quantified using an external standard method. Compounds without available standards were expressed as equivalents of similar phenolics.
2.6. Cell Culture Experiments Evaluating Extracts Caper Obtained Under Optimal Conditions
2.6.1. Cell Culture Selection and Culture Conditions
Caco-2 human colorectal adenocarcinoma cells (ATCC® HTB37™, Manassas, VA, USA) and Hep G2 human liver cancer cells (ATCC® HB-8065™) were cultured in Dulbecco’s Modified Eagle’s Medium (DMEM) with high glucose, supplemented with 10% fetal bovine serum (FBS). The cultures were maintained at 37°C in a humidified atmosphere containing 5% CO2. For all experiments, the extract was sterile filtered and diluted in cell culture media, with concentrations expressed as v/v percentages [13].
2.6.2. Cytotoxicity
Cell viability following exposure to the extract was assessed using the PrestoBlue™ reagent (Invitrogen™, Carlsbad, CA, USA). Hep G2 cells (5,000 per well) and Caco-2 cells (10,000 per well) were seeded in 96-well plates and allowed to adhere overnight. After 24 hours of exposure to the designated extract concentrations, PrestoBlue™ was added to each well and incubated for 30 minutes. Fluorescence was measured at an excitation/emission wavelength of 535/595 nm using the Infinite F200 spectrophotometer (Tecan Group Ltd., Zürich, Switzerland). Each concentration was tested in five parallels and the experiment was repeated three times.
2.6.3. Protective Effect Against Induced Oxidative Stress
The protective effect of the extract against induced oxidative stress was assessed using the 2ʹ,7ʹ-Dichlorofluorescin Diacetate (DCF-DA) assay [14]. Caco-2 (10,000 cells per well) and Hep G2 (5,000 cells per well) were seeded in black, clear-bottom 96-well plates and allowed to adhere for 24 hours. Cells were treated with the extract for 24 hours, then washed with phosphate-buffered saline (PBS), and exposed to DCFH-DA at a final concentration of 50 μM along with freshly prepared tert-butyl hydroperoxide (t-BOOH, 250 μM in PBS). After 30 minutes of incubation at room temperature, the increase in fluorescence was measured at an excitation/emission wavelength of 485/535 nm using the Infinite F200 spectrophotometer (Tecan Group Ltd., Zürich, Switzerland). The increase in fluorescence was expressed as relative fluorescence, with the untreated control sample set as 1.
2.6.4. Expression of Genes Related to Oxidative Stress
Caco-2 and Hep G2 cells were exposed to the extract for 24 hours. RNA was isolated using Qiazol Lysis reagent (Qiagen, Hilden, Germany) according to the manufacturer’s instructions. Reverse transcription of 1 µg of RNA was performed using the cDNA Archive kit (Applied Biosystems, Foster City, CA, USA). Quantitative RT-PCR was conducted on a QuantStudio® 3 Real-Time PCR System (Thermo Fisher Scientific, Waltham, MA, USA) using SYBR Green master mix and 40 ng of cDNA template. The following primer sequences were selected from PrimerBank (Spandidos A., 2010): superoxide dismutase 1 (SOD1; 48762945c1), catalase (CAT; 260436906c3), and glutathione reductase (GR; 305410788c1). 18S rRNA was used as an internal control. RT-PCR reaction conditions were set at 50°C for 2 minutes, 95°C for 10 minutes, followed by 40 cycles of 95°C for 15 seconds and 60°C for 1 minute. The results were analyzed using the ΔCt algorithm and presented as fold-change relative to untreated cells.
2.7. Statistical Analysis
Analysis of variance (ANOVA) was employed to evaluate statistical significance at a confidence level of p ≤ 0.05. To determine the regression model's goodness of fit, ANOVA was performed with a significance level of p < 0.05, and model adequacy was assessed using the coefficient of determination (R²), coefficient of variance (CV), and p-values for the model, along with lack-of-fit tests, using Design-Expert v11 software (Stat-Ease Inc., Minneapolis, MN, USA). All results are expressed as mean ± standard deviation, based on at least three independent experiments.
3. Results and Discussion
The bioactive compounds and chemical profiles of various parts of the Capparis genus—including fruits, flower buds, shoots, and roots—offer significant potential for exploration. However, innovative extraction methods, particularly for C. spinosa leaves, remain largely unexplored [2]. As demand for plant-based extracts grows, developing efficient extraction technologies that enhance yield of bioactive compoundsis crucial. Additionally, the rising interest in polyphenol-rich products for their health benefits highlights the need for better commercial extraction and analysis methods. Accordingly, this study discourses how to overcome this gap by optimizing UAE technique to enhance the recovery of bioactive compounds from C. spinosa leaves.
3.1. Impact of Different Parameters on Extraction of Phenolics and Antioxidant Activity of the Extracts
The extraction of phenolic compounds and the assessment of antioxidant activity from the leaves of Capparis spinosa are influenced by various parameters. Table 1 presents the results obtained under various extraction conditions, including the phenolic content and antioxidant activity associated with each specific extraction condition.
The effect of ethanol concentration on polyphenol extraction showed some interesting results. Using a lower ethanol concentration (30%) with higher ultrasound power (90%) gave the highest TPC and antioxidant activity. For example, at 50°C with 30% ethanol and 90% ultrasound power, the TPC reached 23.14 mg GAE/g, and antioxidant activity was 20.61 mg TE/g in the DPPH test. This suggests that phenolic compounds play a key role in the antioxidant capacity of the extracts. On the other hand, higher ethanol concentrations (like 70%) resulted in lower yields of phenolic compounds and flavonoids, probably because more polar compounds were less soluble and harder to extract. For example, at 80°C with 70% ethanol, the TPC dropped to 18.75 mg GAE/g. With 70% ethanol, 80°C, and 30% ultrasound power, high total flavonoid content (101.38 mg GAE/g) and rutin content (14.74 mg/g) were seen. However, very high or low ethanol concentrations didn’t significantly improve TPC or antioxidant activity, suggesting that a balance in solvent polarity is important for the best polyphenol extraction. Moderate ethanol concentrations (50–70%) were better for getting higher yields of TPC and rutin. The highest rutin content (14.78 mg/g) was achieved at 80°C with 50% ethanol and 60% ultrasound power. DPPH scavenging activity remained fairly consistent across conditions (around 20–21.8 mg TE/g), showing that antioxidant properties remained strong throughout. The highest DPPH activity (21.87 mg TE/g) occurred at 65°C, 50% ethanol, and 60% ultrasound power, which also matched the highest TPC value, indicating a strong link between extracted polyphenols and antioxidant activity.
Higher extraction temperatures, especially around 80°C, generally led to higher TPC yields, with the highest TPC (23.14 mg GAE/g) found at 80°C, 30% ethanol, and 30% ultrasound power. This could be due to better solvent diffusion and cell wall breakdown at higher temperatures, which helps release more phenolics. The results also showed that moderate temperatures (50°C to 65°C) tended to boost both TPC and antioxidant activity. For example, at 65°C with 50% ethanol, the TPC was 22.25 mg GAE/g, indicating that moderate temperatures helped dissolve phenolic compounds without breaking them down, unlike at higher temperatures (80°C), where TPC dropped to 20.08 mg GAE/g. However, the total flavonoid content (TFC) didn’t follow the same pattern. At higher temperatures (80°C), TFC values decreased. Moderate temperatures, especially between 50°C and 65°C, resulted in higher TFC values. The highest TFC (132.14 mg GAE/g) was seen at 65°C, suggesting that certain polyphenolic compounds may be better extracted at lower thermal conditions, possibly because high temperatures can cause thermal degradation or transformation of heat-sensitive compounds. For example, at 50°C with 30% ethanol, the TFC was highest, indicating that this temperature range is ideal for extracting flavonoids without degrading them.
Ultrasound power plays a vital role in enhancing extraction efficiency by breaking down plant cell walls and improving solvent penetration. As shown in Table 1, increasing ultrasound power leads to higher yields of phenolics and flavonoids. Increasing ultrasound power from 30% to 90% significantly enhances both TPC and TFC. The highest values for both TPC (23.1436 mg GAE/g) and TFC were achieved at 50°C, 30% ethanol, and 90% ultrasound power. Conversely, lower ultrasound power (60%) produced significantly lower phenolic and flavonoid yields. For example, at 80°C with 30% ethanol, TPC decreased to 20.08 mg GAE/g. The data also highlights that ultrasound power, especially at moderate temperatures, significantly increases rutin yield. At 50°C with 30% ethanol, rutin concentration was 10.034 mg/g with 30% ultrasound power, but increased to 14.15 mg/g when ultrasound power was raised to 90%, suggesting that ultrasound-assisted extraction is effective way in maximizing the extraction efficiency of rutin.
3.2. Parameters Optimization
The experimental data presented in Table 1, coupled with the regression analysis (Table 2), provides a clear understanding of the relationships between these factors and how they influence extraction efficiency. The regression analysis of bioactive compound extraction from Capparis spinosa using UAE revealed several significant linear, interaction, and quadratic effects. The response variables analyzed include total phenolics (TP), total flavonoids (TF), antioxidant activity (DPPH test) and rutin content. Regression coefficients and model diagnostics such as the coefficient of determination (R²) and coefficient of variance (CV) are presented in Table 2, illustrating how extraction conditions impact the yield and quality of these compounds.
For total phenolic content, the model was found to be significant, with temperature (β1) and ethanol concentration (β2) identified as the primary drivers (p=0.0249 and p=0.0078, respectively). The observed significant interaction between temperature and ethanol concentration (β12, p=0.0225) indicates that these two factors work together to enhance phenolic extraction. In contrast, ultrasound power (β3) showed a borderline effect (p = 0.0875), and the lack of significant quadratic terms implies that the relationships in this case are mostly linear.
The analysis of total flavonoid content exhibited some differences. While the overall model was significant (p=0.0060), ethanol concentration emerged as the most influential factor (p=0.0003). The significant quadratic term for ethanol concentration underscores a nonlinear relationship, indicating that precise control is required for optimal extraction. In this case, neither temperature nor ultrasound power displayed significant main effects (p=0.1312 and p=0.4998, respectively), and there were no significant interaction terms. Although the quadratic term for temperature approached significance (p=0.0574), the data suggest that ethanol concentration is the key parameter for flavonoid extraction, emphasizing the need for careful management.
Regarding antioxidant activity assessed by DPPH, although the linear effect of ultrasound power (β3 = 0.26) was not statistically significant, its interactions with other variables were crucial for enhancing antioxidant activity. The positive interaction term (β23=0.44, p<0.05) suggests that specific combinations of extraction parameters can lead to synergistic effects that increase the antioxidant capacity of the extracts. This indicates that the overall extraction process benefits from the interactions among temperature, ethanol concentration, and ultrasound power, even if individual parameters show limited effects.
In terms of rutin content, the model demonstrated robust significance (p=0.0124), with temperature and ethanol concentration again playing dominant roles (p=0.0010 and p=0.0032, respectively). Unlike TPC, ultrasound power did not have a significant impact on rutin extraction (p=0.5929), and the model revealed a linear relationship for rutin recovery, indicating that fine-tuning temperature and ethanol concentration is essential for maximizing the extraction of specific phenolic compounds.
The linear, interaction, and quadratic effects identified in this study provide valuable insights into how various variables affect the extraction process. The reliability of the models is supported by high R² values and low CVs, making them effective tools for predicting extraction outcomes and optimizing protocols for better yields. Across all responses, total phenolic content, rutin, and total flavonoids—the regression models demonstrated statistical significance, with p-values ranging from less than 0.0001 to 0.0319. The adjusted R² values, which range from 0.69 to 0.98, indicate a strong fit and explain a substantial portion of the variance in the results. This strong correlation is further validated by relatively low CVs for most responses, suggesting precise model predictions. Although some lack-of-fit results, such as the p-value of 0.0618 for flavonoids, suggest minor areas for improvement, the overall non-significant lack-of-fit tests indicate that the models remain reliable for making predictions within the tested conditions. This underscores the effectiveness of the regression models in guiding the extraction process and optimizing results.
Taken together, that ethanol concentration showed to be a critical parameter across all responses, especially for flavonoid extraction with only marginal contributions from temperature and ultrasound power. For TPC and rutin, optimizing temperature in tandem with ethanol concentration appears essential due to their strong interaction, while ultrasound power has lower influence.
Based on the experimental results and statistical analysis, numerical optimizations have been conducted in order to establish the optimum level of independent variables with desirable response of goals. For all responses one optimal condition was obtained: 80 °C temperature, 62.23% ethanol, 56.05% of ultrasound power. Determination of optimal conditions and predicted values was based on desirability function, D = 0.778, in order to focus on high rutin content. In order to verify predictive mathematical model of the investigated process experimental confirmation of obtained was performed on estimated optimal conditions. Predicted and the observed values are presented in Table 3. The predicted results matched well with the experimental results obtained at optimal extraction conditions which were validated by the RSM model with good correlation.
Similar findings were reported by Boudries et al. (2019), who demonstrated that both experimental and modeled data confirmed a significant enhancement in extraction efficiency when ethanol was incorporated into the solvent system. Although temperature also had a positive influence, its effect was comparatively less pronounced in the extraction of phenolic compounds from Capparis spinosa flower buds.
To date, the content of total polyphenols, flavonoids, and flavonols has been extensively investigated in various edible aerial parts of the caper plant. According to Wojdyło et al. (2019), flower buds exhibited notably high levels of total polyphenols (849.4 mg GAE/100 g FW), flavonoids (729.5 mg RE/100 g FW), and flavonols (691.6 mg RE/100 g FW), surpassing the concentrations observed in young caper shoots. In contrast, caper fruits presented considerably lower levels of these compounds, with total polyphenols at 119.2 mg GAE/100 g FW, flavonoids at 81.6 mg RE/100 g FW, and flavonols at 39.9 mg RE/100 g FW [4].
Although research on caper shoots and leaves are limited, some studies have explored their polyphenol content. Gull et al. (2019) reported a relatively low total polyphenol concentration of approximately 28.7 mg GAE/100 g DW in shoots. Tlili et al. (2017), in a study on methanolic extracts from C. spinosa leaves, reported total phenolics, flavonoids, and condensed tannins of 23.37 mg GAE/g DW, 9.05 mg QE/g DW, and 9.35 mg TAE/g DW, respectively. Further insights were provided by Fattahi & Rahimi (2016), who applied response surface methodology to optimize extraction from C. spinosa leaves. The optimal conditions—49% ethanol, 51.8 °C, and a solvent-to-material ratio of 50 (v/w)—resulted in total polyphenol content of 27.44 mg GAE/g DW, total flavonoid content of 26.07 mg QE/g DW, and DPPH radical scavenging activity of 85.74%. In comparison, the present study optimized ultrasound-assisted extraction conditions at 80 °C, 62.23% ethanol, and 56% ultrasound power. Under these parameters, the obtained values were: total polyphenol content of 19.82 mg GAE/g DW, total flavonoid content of 99.26 mg RE/g DW, antioxidant activity of 21.54 mg TE/g DW (DPPH assay), and rutin content of 15.79 mg/g DW. While the TPC obtained was slightly lower than some values reported in literature, the high flavonoid content and particularly high rutin concentration underscore the efficiency of the extraction method. Moreover, the specific quantification of rutin (15.79 mg/g DW) highlights the successful enrichment of this pharmacologically significant compound, which is not always individually assessed in earlier studies. It is important to note that TFC (as RE) encompasses multiple flavonoid constituents beyond rutin, reflecting the cumulative content of flavonoids in the extract. The optimized conditions employed in this research demonstrate a highly effective and sustainable approach to maximizing the recovery of phenolics and flavonoids from Capparis spinosa.
Differences between the present findings and literature values can be attributed to several factors, including the plant part analyzed, geographical origin, genotype, harvesting stage, and extraction methodology. Additionally, the biosynthesis of phenolic compounds and flavonoids is known to be influenced by abiotic stresses, such as heat, which further contributes to variability in phytochemical content [18].
3.3. HPLC Analysis
HPLC analysis was conducted on all extracts in order to determine how extraction conditions affect polyphenolic profile. UnderIn all experimental conditions, rutin was a dominant compound, therefore it was included as a main compound in the optimization process. The HPLC profile of the extract obtained at optimal conditions is presented in Table 4. The HPOLC analysis of optimal extract reviealed several key compounds, including catechin equivalents, caffeine, syringic acid, sinapic acid, rutin, and quercetin-3-glucoside, which are known for their potential health benefits.
The phytochemical composition of Capparis spinosa has been extensively investigated, with several studies highlighting its richness in phenolic and flavonoid compounds. Among these, rutin consistently emerges as the dominant flavonoid. Gull et al. (2019) and Tlili et al. (2017) emphasized C. spinosa as a notable source of rutin and quercetin derivatives, with high pharmacological and nutritional potential. In the present study, HPLC analysis revealed a rutin content of 15.51 mg/g DW, emphasizing the effectiveness of the optimized ultrasound-assisted extraction protocol. This value is notably higher than the 3.96 mg/g DW reported by Tlili et al. (2017), suggesting considerable variability that may be attributed to differences in extraction methods, solvent systems, plant material, and environmental or cultivation conditions. Although ultrasound power did not have a significant impact on rutin extraction (p = 0.5929), the higher rutin yield observed in this study highlights the potential advantages of ultrasound-assisted extraction in enhancing the recovery of specific bioactive compounds.
In addition to rutin, quercetin-3-glucoside (4.27 mg/g DW) was identified in the extract. This specific compound was not reported by Tlili et al. (2017), although their analysis revealed other flavonols such as kaempferol (0.40 mg/g DW) and luteolin (0.78 mg/g DW). While quercetin derivatives are evident in both studies, differences in the types and concentrations of flavonoids underscore the influence of extraction techniques and the specific plant material analyzed. Furthermore, catechin was detected at 2.07 mg/g DW in the present study, which is notably higher than the 0.56 mg/g DW reported by Tlili et al. (2017). In contrast, gallic acid content in this extract was 0.04 mg/g DW, which is lower than the 0.14 mg/g DW observed by Tlili et al. Syringic acid (0.19 mg/g DW) and caffeic acid (0.25 mg/g DW) were also identified in the present extract. In contrast, Tlili et al. (2017) did not report caffeic acid in their analysis and instead identified vanillic acid (0.27 mg/g DW) among the minor phenolic acids. These differences in phenolic acid profiles may reflect not only methodological variations such as the use of ultrasound-assisted extraction with ethanol versus maceration with methanol but also differences in phonological stage of leaf collection, plant genotype, or eco-geographical growing conditions. A notable contrast is the presence of resveratrol, which was the second most abundant compound (2.35 mg/g DW) in the extract analyzed by Tlili et al., yet it was not detected in the current study. Similarly, epicatechin (1.28 mg/g DW) and coumarin (1.33 mg/g DW) were reported by Tlili et al. but were not observed in the present analysis. This could suggest a selectivity of ultrasound-assisted extraction toward specific phenolic compounds, or it may indicate differences in compound solubility and extraction efficiency related to solvent polarity, matrix structure, or compound stability under ultrasonic conditions.
These variations may be attributed to differences in extraction methods (e.g., ultrasound-assisted extraction using ethanol vs. conventional maceration with methanol), solvent polarity, temperature, or ultrasound power intensity, all of which significantly affect the recovery and profile of phenolic compounds. Moreover, the high flavonol content observed in this study may be linked to the plant’s physiological responses to biotic and abiotic stressors. As noted by Stefanucci et al. (2018) the accumulation of flavonols such as rutin, quercetin, and kaempferol often reflects the plant’s adaptive response to environmental pressures, including UV radiation, drought, temperature extremes, or pathogen attack. In addition, Kianersi et al. (2020) demonstrated that exogenous application of salicylic acid and methyl jasmonate can significantly stimulate rutin biosynthesis in C. spinosa in a growth stage-dependent manner [19]. These findings suggest that targeted agronomic interventions, in combination with optimized extraction protocols, could further enhance the yield of valuable bioactive compounds in C. spinosa.
3.4. Cell Culture Response to Extract Treatment
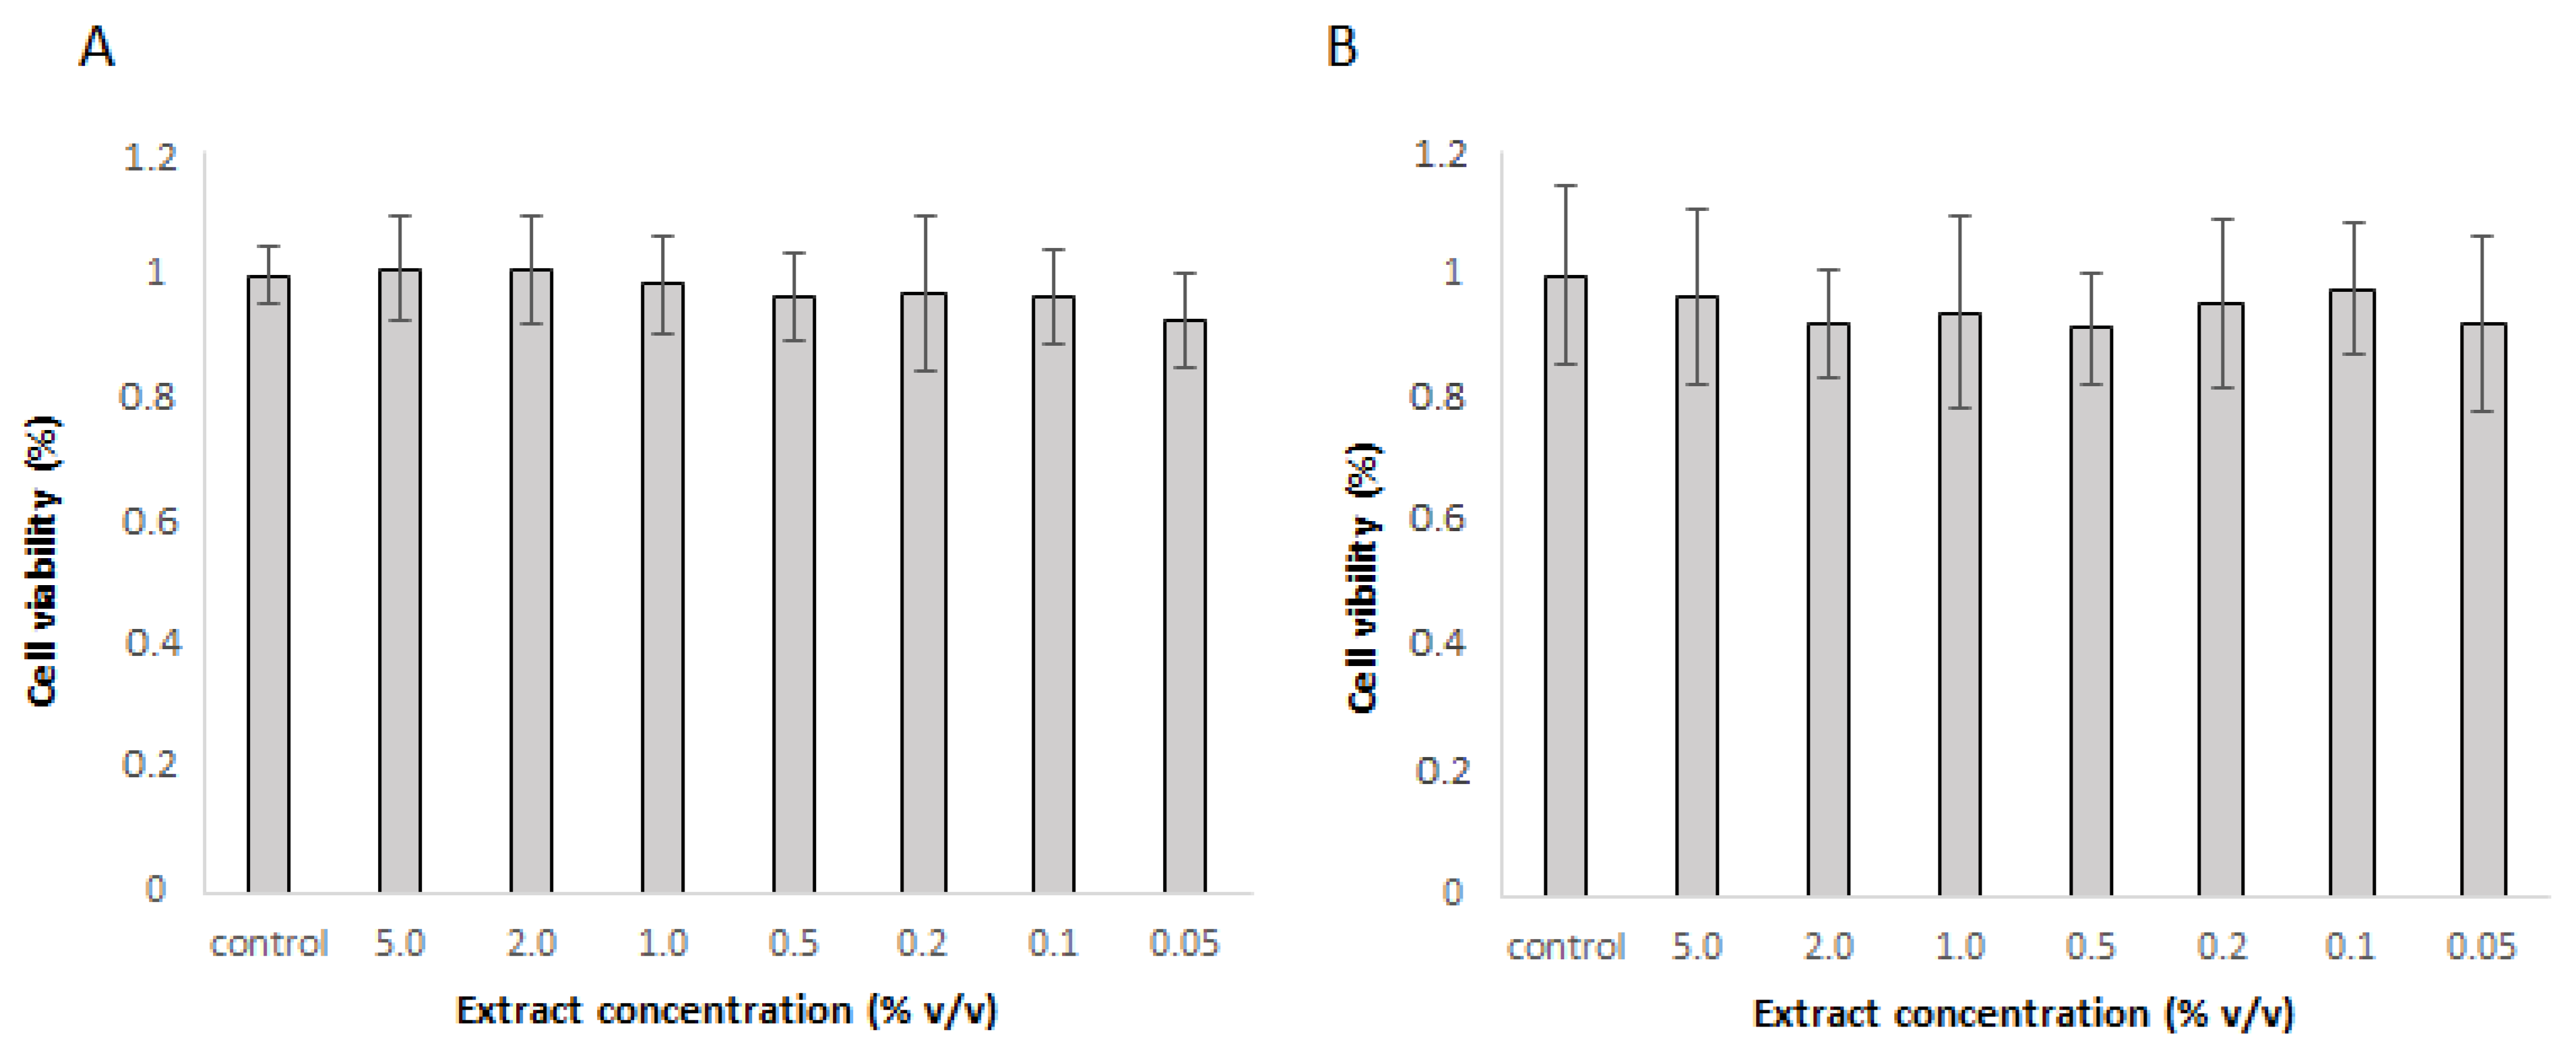
Based on the results in Table 1, the extract prepared at optimal conditions, with the highest rutin level, was selected to test its properties in cell lines. First, cytotoxicity was tested in Caco-2 and Hep G2 cells. The extract was not toxic in concentrations up to 5% v/v in neither cell line. As none of the concentrations were toxic, the extract was used in 1% and 5% concentration for further experiments.
Figure 1.
Cytotoxicity of different extract concentrations as determined by PrestoBlue Assay in A) Caco-2 cells and B) Hep G2 cells. The mean ± SD of three separate experiments is presented.
Figure 1.
Cytotoxicity of different extract concentrations as determined by PrestoBlue Assay in A) Caco-2 cells and B) Hep G2 cells. The mean ± SD of three separate experiments is presented.
In vitro results showed promising results for the antioxidative potential of the extract. The extract was further tested for its ability to protect cells against t-BOOH-induced oxidative stress. DCHF-DA assay which is based on the use of a fluorescent cell permeable probe that reacts with reactive oxygen species (ROS) to form green fluorescent product was used. Given that antioxidative effects in cell cultures depend on the ability of individual compounds to cross cell membranes and the presence of metabolic enzymes that may convert them, the protective effect of the extract against induced oxidative stress was evaluated in Caco-2 and Hep G2 cells. Caco-2 cells, which represent colon cells, were selected as they are the first to encounter ingested substances. Hep G2 cells, representing liver cells, were chosen for their role in metabolizing bioactive compounds. These two cell types are therefore suitable for assessing the safety and potential beneficial effects of dietary substances. In Caco-2 cells, the extract had a significant protective effect in both tested concentrations and reduced the amount of ROS to 79 % and 75 % in 1.0% and 5.0% concentration, respectively (Figure 2A). The results were similar in Hep G2 cells, where the amount of ROS was reduced to 77% with 1.0% extract and to 73% with a 5% extract (Figure 2B).
The protective effect may be exerted through various mechanisms, including the direct action of bioactive compounds, as measured by in vitro tests, or the increased production of endogenous antioxidants. The protective effect of rutin as a dominant compound in optimized extract of C. spinosa and other compounds found in the extract may be mediated through various mechanisms, including the direct action of bioactive compounds, as demonstrated by in vitro tests, or through enhanced production of endogenous antioxidants. Rutin has been shown to modulate several cell signaling pathways involved in cell cycle regulation, apoptosis, and angiogenesis, effectively suppressing key features of cancer progression [20,21,22].
To further investigate these effects, RT-PCR was employed to assess the expression levels of catalase (CAT), glutathione reductase (GR), and superoxide dismutase 1 (SOD-1). In Caco-2 cells (Figure 3A), CAT expression was significantly elevated, showing a 5.3-fold increase with 1.0% extract and a 6.7-fold increase with 5.0% extract compared to control cells. GR expression was also notably up-regulated, with a 7.0-fold increase for the 1.0% extract and an 8.8-fold increase for the 5.0% extract. The effect on SOD-1 was less pronounced, with only a 3.1-fold increase observed at the lower extract concentration. In Hep G2 cells (Figure 3B), GR expression was markedly increased, showing a 10.2-fold up-regulation in response to the 5% extract, while the lower concentration resulted in a moderate 1.8-fold up-regulation of CAT. Other gene expressions remained unaffected.
The non-toxic nature of the extract at the tested concentrations suggests its safe incorporation into functional food products or use as a dietary supplement. Notably, the extract effectively protected cells from induced oxidative stress, as evidenced by significantly lower levels of reactive oxygen species in both cell types when pretreated with the extract. Since the extract was removed prior to the addition of t-BOOH in this experiment, the protective effect cannot be attributed to direct reactions between the bioactive compounds of the extract and t-BOOH in the cell culture media. However, the components absorbed into the cells may act through such mechanisms. Moreover, results from the RT-PCR experiments indicate that the extract not only provides direct protection but also induces the expression of cellular antioxidative enzymes. This effect was more pronounced in Caco-2 cells, where all three tested gene expressions were significantly up-regulated. Less substantial effect in liver cells may be due to their already strong intrinsic antioxidant system and detoxification mechanisms, which may neutralize the active components. This includes phase I and phase II enzymes, known to be expressed in Hep G2 cells [23].
The observed protective effect and the induction of antioxidative enzymes can be attributed to the chemical components detected in the extract. Rutin, the main component, was consistently shown to protect cells from oxidative damage [24,25,26], partly by activating CAT and SOD [27]. Similarly, quercetin demonstrated efficient antioxidant capacity [28,29]. Quercetin increased the expression of CAT and decreased the expression of SOD at low concentrations, but this effect was reversed at high concentrations [27]. Such phenomenon is most commonly observed for complex mixtures of bioactive compounds. According to the principle of hormesis, low concentrations of certain compounds stimulate adaptive cellular responses, but when higher concentrations are used, such compensation is no longer possible [30]. Therefore, the observed induced expression of SOD1 in Caco-2 cells and CAT in Hep G2 cells only at lower extract concentrations is not surprising.
4. Conclusions
This study underscores the remarkable potential of Capparis spinosa leaves as a sustainable and valuable source of bioactive compounds, particularly rutin, which was identified at a notably high concentration (15.51 mg/g DW) using an optimized ultrasound-assisted extraction protocol. Fine-tuning extraction parameters such as ultrasound power, temperature, and ethanol concentration proved effective in maximizing the recovery of phenolics, positioning these often-discarded leaves as a promising raw material for the development of functional foods, nutraceuticals, and pharmaceutical applications. Furthermore, the extract demonstrated potent antioxidant activity, as evidenced by substantial reductions in reactive oxygen species in both Caco-2 and Hep G2 cells under t-BOOH-induced oxidative stress. The protective effects are attributable not only to direct antioxidant mechanisms but also to the upregulation of key endogenous defense enzymes, including catalase (CAT), glutathione reductase, and superoxide dismutase, particularly in intestinal cells. These findings underscore the extract's potential to modulate oxidative stress-related pathways and enhance cellular resilience. Importantly, the extract exhibited no cytotoxicity at the tested concentrations, reinforcing its safety for dietary use. This combination of significant bioactivity, sustainable sourcing, and scalable extraction methods presents a compelling case for the valorization of C. spinosa leaves as an underutilized agricultural byproduct with substantial health benefits and economic value. The results provide a robust foundation for future in vivo studies and the innovation of plant-based health products while highlighting the utility of green extraction technologies as effective tools for unlocking the therapeutic potential of botanical resources.
Funding
This research was conducted as part of a bilateral project between Serbia and Slovenia (2023–2025), in collaboration with the Libyan Medical Research Centre. The study was funded by the Ministry of Science, Technological Development and Innovation of the Republic of Serbia (Grant No. 451-03-136/2025-03/200222) and by the Slovenian Research Agency (research programs P1-0386).
CrediT authorship contribution statement
Abdulhakim Naffati: Writing – original draft, Methodology, Investigation, Formal analysis, Data curation; Alena Stupar: Writing – original draft, Writing – review & editing, Methodology, Investigation, Data curation, Conceptualization; Katja Kramberger: Formal analysis; Nasrien Elfarrah: Writing – original draft; Abdelmoumen Benmerzoug: Writing – original draft; Aleksandra Mišan: Writing – review, Methodology, Supervision; Aleksandra Cvetanović: Writing – review, Methodology; Ana Petelin: Writing – review, Methodology; Zala Jenko Pražnikar: Writing – review; Saša Kenig: Writing – original draft, Writing – review & editing, Methodology, Data curation, Conceptualization, Supervision.
Declaration of competing interest
The authors declare that they have no known competing financial interests or personal relationships that could have appeared to influence the work reported in this paper.
Ethical Approval
Not applicable
Data availability
Data will be made available on request.
References
- Sun, Y.; Yang, T.; Wang, C. Capparis Spinosa L. as a Potential Source of Nutrition and Its Health Benefits in Foods: A Comprehensive Review of Its Phytochemistry, Bioactivities, Safety, and Application. Food Chem. 2023, 409, 135258. [CrossRef]
- Boudries, H.; Nabet, N.; Chougui, N.; Souagui, S.; Loupassaki, S.; Madani, K.; Dimitrov, K. Optimization of Ultrasound-Assisted Extraction of Antioxidant Phenolics from Capparis Spinosa Flower Buds and LC–MS Analysis. J. Food Meas. Charact. 2019, 13, 2241–2252. [CrossRef]
- Rajhi, I.; Hernandez-Ramos, F.; Abderrabba, M.; Dhia, M.T. Ben; Ayadi, S.; Labidi, J. Antioxidant, Antifungal and Phytochemical Investigations of Capparis Spinosa L. Agric. 2021, Vol. 11, Page 1025 2021, 11, 1025. [CrossRef]
- Wojdyło, A.; Nowicka, P.; Grimalt, M.; Legua, P.; Almansa, M.S.; Amorós, A.; Carbonell-Barrachina, Á.A.; Hernández, F. Polyphenol Compounds and Biological Activity of Caper (Capparis Spinosa L.) Flowers Buds. Plants 2019, Vol. 8, Page 539 2019, 8, 539. [CrossRef]
- Grimalt, M.; Hernández, F.; Legua, P.; Amorós, A.; Almansa, M.S. Antioxidant Activity and the Physicochemical Composition of Young Caper Shoots (Capparis Spinosa L.) of Different Spanish Cultivars. Sci. Hortic. (Amsterdam). 2022, 293, 110646. [CrossRef]
- Nabavi, S.F.; Maggi, F.; Daglia, M.; Habtemariam, S.; Rastrelli, L.; Nabavi, S.M. Pharmacological Effects of Capparis Spinosa L. Phyther. Res. 2016, 30, 1733–1744. [CrossRef]
- Khojasteh Rad, M.; Ghani, A.; Ghani, E. In Vitro Effects of Capparis Spinosa L. Extract on Human Sperm Function, DNA Fragmentation, and Oxidative Stress. J. Ethnopharmacol. 2021, 269, 113702. [CrossRef]
- Sut, S.; Dall’Acqua, S.; Zengin, G.; Senkardes, I.; Bulut, G.; Cvetanović, A.; Stupar, A.; Mandić, A.; Picot-Allain, C.; Dogan, A.; et al. Influence of Different Extraction Techniques on the Chemical Profile and Biological Properties of Anthemis Cotula L.: Multifunctional Aspects for Potential Pharmaceutical Applications. J. Pharm. Biomed. Anal. 2019, 173, 75–85. [CrossRef]
- Cvetanović Kljakić, A.; Ocvirk, M.; Rutnik, K.; Košir, I.J.; Pavlić, B.; Mašković, P.; Mašković, J.; Teslić, N.; Stupar, A.; Uba, A.I.; et al. Exploring the Composition and Potential Uses of Four Hops Varieties through Different Extraction Techniques. Food Chem. 2024, 447, 138910. [CrossRef]
- Tomšik, A.; Pavlić, B.; Vladić, J.; Ramić, M.; Brindza, J.; Vidović, S. Optimization of Ultrasound-Assisted Extraction of Bioactive Compounds from Wild Garlic (Allium Ursinum L.). Ultrason. Sonochem. 2016, 29, 502–511. [CrossRef]
- Matić, M.; Stupar, A.; Pezo, L.; Đerić Ilić, N.; Mišan, A.; Teslić, N.; Pojić, M.; Mandić, A. Eco-Friendly Extraction: A Green Approach to Maximizing Bioactive Extraction from Pumpkin (Curcubita Moschata L.). Food Chem. X 2024, 22, 101290. [CrossRef]
- Mišan, A.Č.; Mimica-Dukić, N.M.; Mandić, A.I.; Sakač, M.B.; Milovanović, I.L.; Sedej, I.J. Development of a Rapid Resolution HPLC Method for the Separation and Determination of 17 Phenolic Compounds in Crude Plant Extracts. Cent. Eur. J. Chem. 2011, 9, 133–142. [CrossRef]
- Kramberger, K.; Barlič-Maganja, D.; Pražnikar, Z.J.; Režen, T.; Rozman, D.; Pražnikar, J.; Kenig, S. Whole Transcriptome Expression Array Analysis of Human Colon Fibroblasts Culture Treated with Helichrysum Italicum Supports Its Use in Traditional Medicine. J. Ethnopharmacol. 2022, 296, 115505. [CrossRef]
- Aranda, A.; Sequedo, L.; Tolosa, L.; Quintas, G.; Burello, E.; Castell, J. V.; Gombau, L. Dichloro-Dihydro-Fluorescein Diacetate (DCFH-DA) Assay: A Quantitative Method for Oxidative Stress Assessment of Nanoparticle-Treated Cells. Toxicol. Vitr. 2013, 27, 954–963. [CrossRef]
- Gull, T.; Sultana, B.; Anwar, F.; Nouman, W.; Rosa, E.; Domínguez-Perles, R. HPLC-PDA-ESI-MS n Profiling of Polyphenolics in Different Parts of Capparis Spinosa and Capparis Decidua as Function of Harvesting Seasons. J. Appl. Bot. Food Qual. 2019, 92, 73–80. [CrossRef]
- Tlili, N.; Feriani, A.; Saadoui, E.; Nasri, N.; Khaldi, A. Capparis Spinosa Leaves Extract: Source of Bioantioxidants with Nephroprotective and Hepatoprotective Effects. Biomed. Pharmacother. 2017, 87, 171–179. [CrossRef]
- Fattahi, M.; Rahimi, R. Optimization of Extraction Parameters of Phenolic Antioxidants from Leaves of Capparis Spinosa Using Response Surface Methodology. Food Anal. Methods 2016, 9, 2321–2334. [CrossRef]
- Stefanucci, A.; Zengin, G.; Locatelli, M.; Macedonio, G.; Wang, C.K.; Novellino, E.; Mahomoodally, M.F.; Mollica, A. Impact of Different Geographical Locations on Varying Profile of Bioactives and Associated Functionalities of Caper (Capparis Spinosa L.). Food Chem. Toxicol. 2018, 118, 181–189. [CrossRef]
- Kianersi, F.; Abdollahi, M.R.; Mirzaie-asl, A.; Dastan, D.; Rasheed, F. Biosynthesis of Rutin Changes in Capparis Spinosa Due to Altered Expression of Its Pathway Genes under Elicitors’ Supplementation. Plant Cell. Tissue Organ Cult. 2020, 141, 619–631. [CrossRef]
- Hasibuan, P.A.Z.; Simanjuntak, Y.; Hey-Hawkins, E.; Lubis, M.F.; Rohani, A.S.; Park, M.N.; Kim, B.; Syahputra, R.A. Unlocking the Potential of Flavonoids: Natural Solutions in the Fight against Colon Cancer. Biomed. Pharmacother. 2024, 176, 116827. [CrossRef]
- Suganya, K.; Poornima, A.; Sumathi, S.; Chigurupati, S.; Alyamani, N.M.; Ghazi Felemban, S.; Bhatia, S.; Al-Harrasi, A.; Sayed Moawad, A. Rutin Induces Endoplasmic Reticulum Stress-Associated Apoptosis in Human Triple-Negative Breast Carcinoma MDA-MB-231 Cells – In Vitro and in Silico Docking Studies. Arab. J. Chem. 2022, 15, 104021. [CrossRef]
- Pandey, P.; Khan, F.; Qari, H.A.; Oves, M. Rutin (Bioflavonoid) as Cell Signaling Pathway Modulator: Prospects in Treatment and Chemoprevention. Pharmaceuticals 2021, 14, 1069. [CrossRef]
- Ye, C.-L.; Dai, D.-H.; Hu, W.-L. Antimicrobial and Antioxidant Activities of the Essential Oil from Onion (Allium Cepa L.). Food Control 2013, 30, 48–53. [CrossRef]
- Ding, H.; Li, Y.; Zhao, C.; Yang, Y.; Xiong, C.; Zhang, D.; Feng, S.; Wu, J.; Wang, X. Rutin Supplementation Reduces Oxidative Stress, Inflammation and Apoptosis of Mammary Gland in Sheep During the Transition Period. Front. Vet. Sci. 2022, 9. [CrossRef]
- Aherne, S.A.; O’Brien, N.M. Protection by the Flavonoids Myricetin, Quercetin, and Rutin against Hydrogen Peroxide-Induced DNA Damage in Caco-2 and Hep G2 Cells. Nutr. Cancer 1999, 34, 160–166. [CrossRef]
- Li, F.; Zhang, L.; Zhang, X.; Fang, Q.; Xu, Y.; Wang, H. Rutin Alleviates Pb-Induced Oxidative Stress, Inflammation and Cell Death via Activating Nrf2/ARE System in SH-SY5Y Cells. Neurotoxicology 2024, 104, 1–10. [CrossRef]
- Sun, J.; Wang, H.; Liu, B.; Shi, W.; Shi, J.; Zhang, Z.; Xing, J. Rutin Attenuates H2O2-Induced Oxidation Damage and Apoptosis in Leydig Cells by Activating PI3K/Akt Signal Pathways. Biomed. Pharmacother. 2017, 88, 500–506. [CrossRef]
- Xu, D.; Hu, M.J.; Wang, Y.Q.; Cui, Y.L. Antioxidant Activities of Quercetin and Its Complexes for Medicinal Application. Molecules 2019, 24. [CrossRef]
- Alía, M.; Mateos, R.; Ramos, S.; Lecumberri, E.; Bravo, L.; Goya, L. Influence of Quercetin and Rutin on Growth and Antioxidant Defense System of a Human Hepatoma Cell Line (HepG2). Eur. J. Nutr. 2006, 45, 19–28. [CrossRef]
- Mattson, M.P. Hormesis and Disease Resistance: Activation of Cellular Stress Response Pathways. Hum. Exp. Toxicol. 2008, 27, 155–162. [CrossRef]
Figure 2.
Protective effect of the extract against the oxidative stress induced with t-BOOH and measured with DCFH-DA assay in A) Caco-2 cells and B) Hep G2 cells. The mean ± SD of two separate experiments is presented, * p < 0.05.
Figure 2.
Protective effect of the extract against the oxidative stress induced with t-BOOH and measured with DCFH-DA assay in A) Caco-2 cells and B) Hep G2 cells. The mean ± SD of two separate experiments is presented, * p < 0.05.
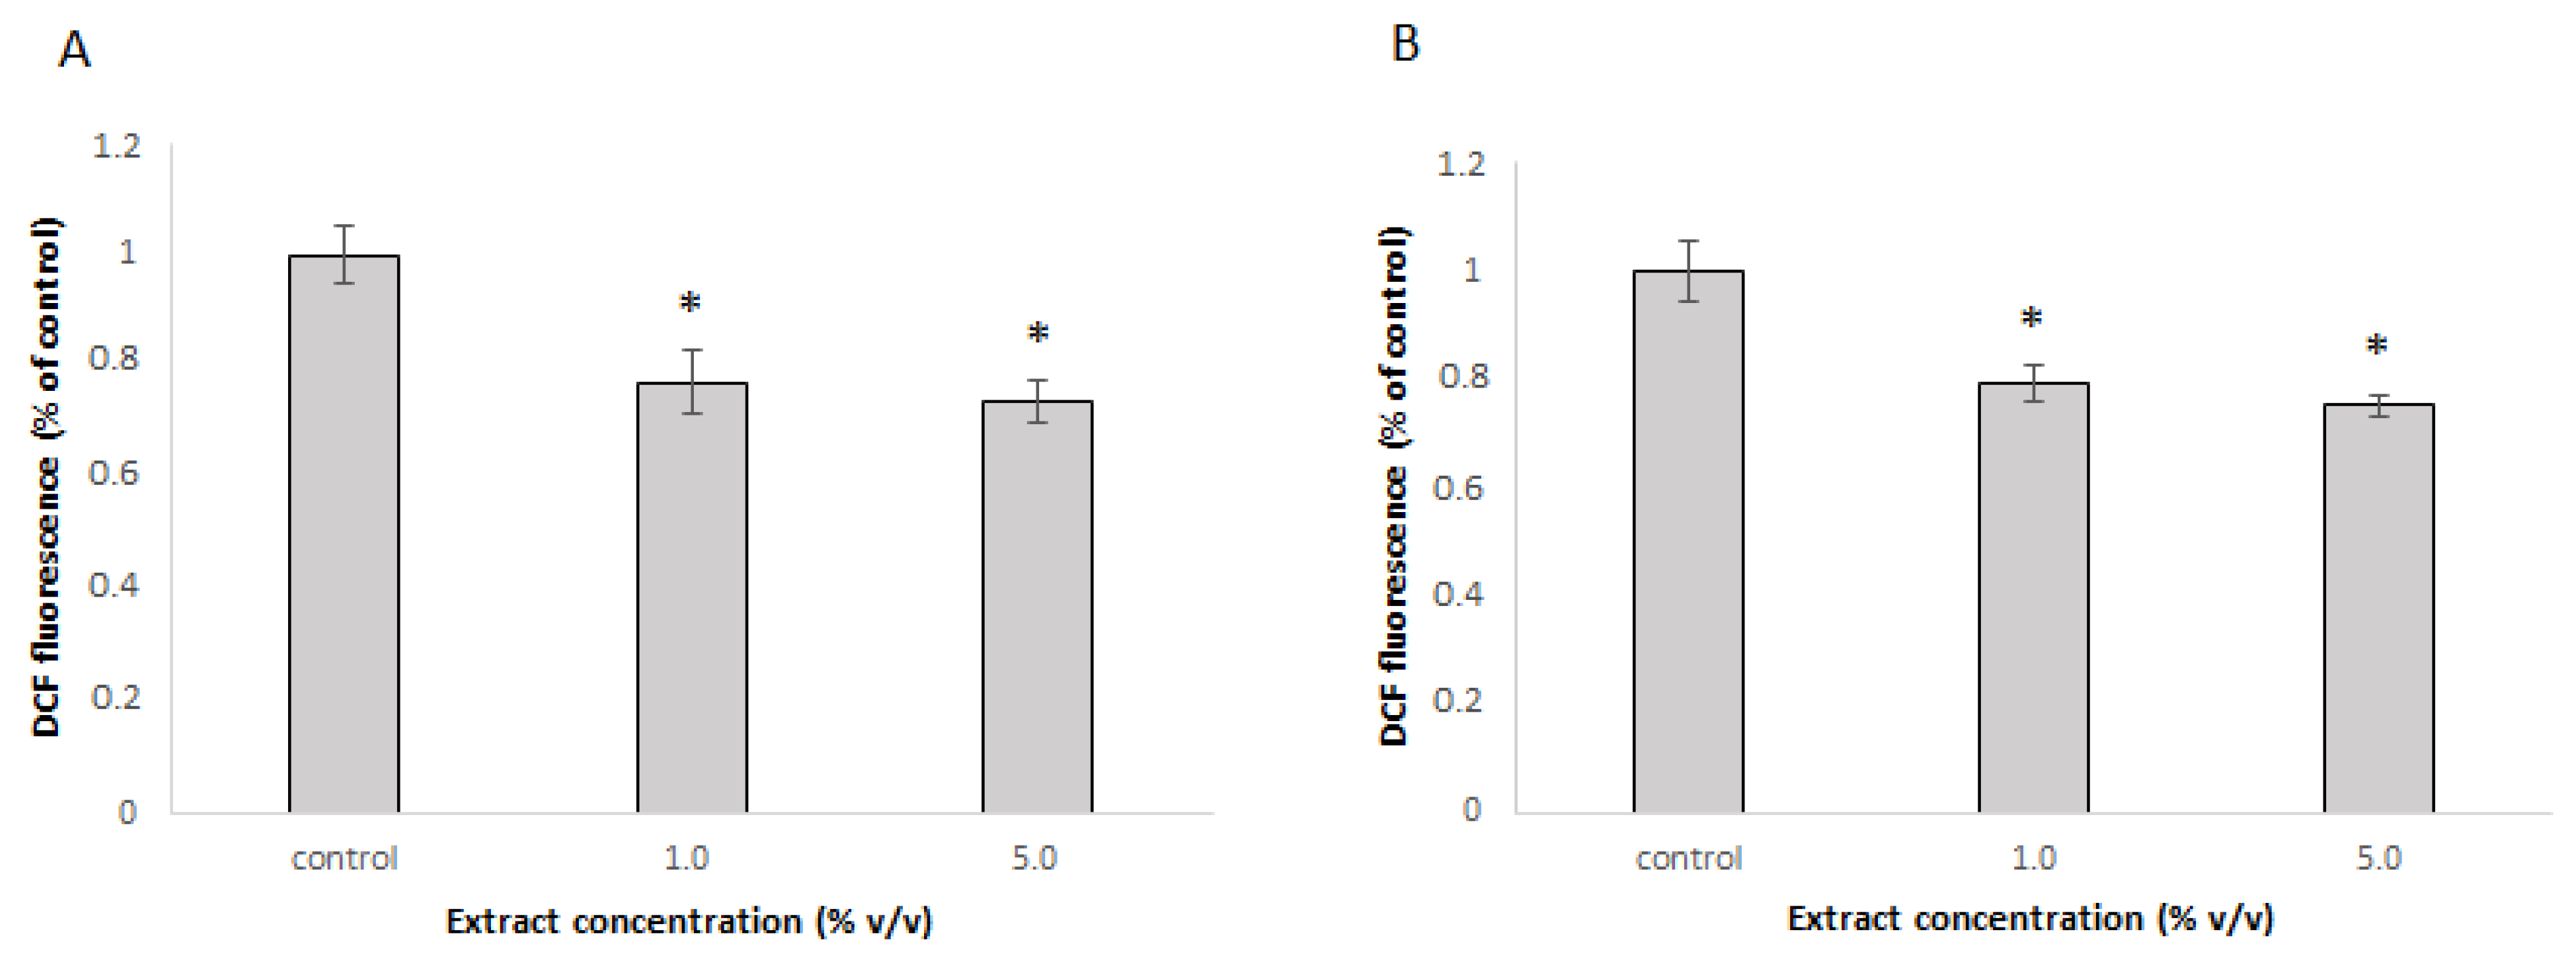
Figure 3.
Expression levels of catalase (CAT), glutathione reductase (GR) and superoxide dismutase 1 (SOD1) in A) Caco-2 cells and B) Hep G2 cells. Expressions were measured by RT-PCR, normalized to 18S rRNA and set as 1 for control sample. Average ± SD is presented. * p < 0.05.
Figure 3.
Expression levels of catalase (CAT), glutathione reductase (GR) and superoxide dismutase 1 (SOD1) in A) Caco-2 cells and B) Hep G2 cells. Expressions were measured by RT-PCR, normalized to 18S rRNA and set as 1 for control sample. Average ± SD is presented. * p < 0.05.
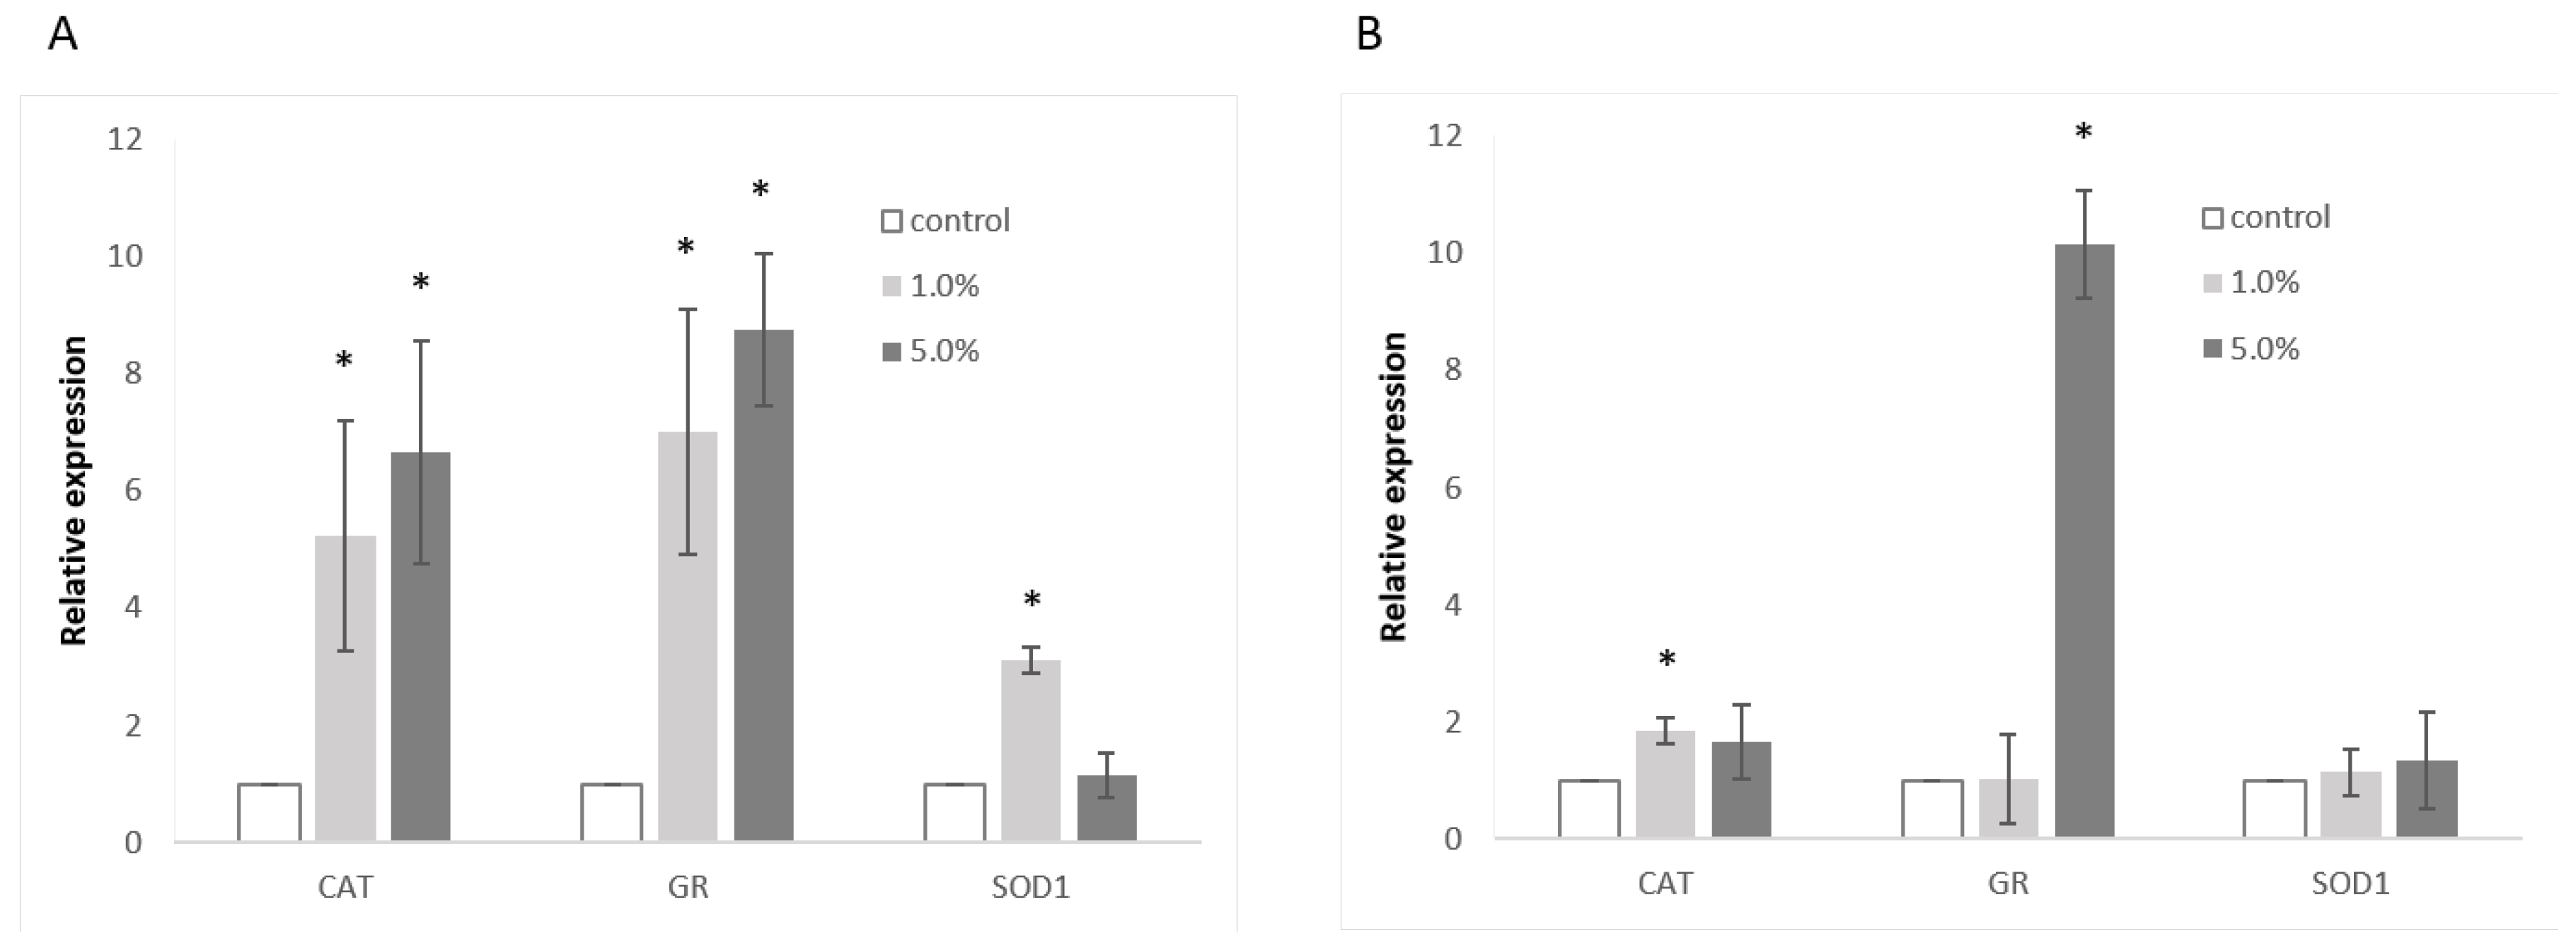

Table 1.
Central composite design of the three-levels and three-variables and experimentally observed values of target responses.
Table 1.
Central composite design of the three-levels and three-variables and experimentally observed values of target responses.
| Extraction temperature (°C) | Ethanol concentration (%) | Ultrasound power (%) | TPC (mg GAE/g DW) | TFC (mg GAE/g DW) | DPPH test C (mg TE/g DW) | Rutin c(mg/g DW) |
| 80 | 30 | 30 | 23.1436 | 90.3909 | 20.6089 | 14.14833 |
| 65 | 50 | 60 | 22.2452 | 91.1791 | 21.1616 | 13.49059 |
| 80 | 30 | 90 | 20.3945 | 94.4752 | 21.1772 | 14.1438 |
| 80 | 50 | 60 | 20.0845 | 94.4752 | 21.3739 | 14.77886 |
| 65 | 50 | 60 | 19.4152 | 88.4563 | 21.1179 | 12.94625 |
| 50 | 50 | 60 | 19.1367 | 90.4482 | 21.3614 | 12.85552 |
| 65 | 70 | 60 | 18.8492 | 97.0834 | 21.3552 | 14.31617 |
| 65 | 50 | 30 | 18.7774 | 84.0997 | 21.0679 | 14.06215 |
| 80 | 70 | 30 | 18.7459 | 101.3826 | 21.3115 | 14.73804 |
| 65 | 30 | 60 | 18.7414 | 90.1759 | 21.2022 | 13.70832 |
| 50 | 30 | 30 | 18.7010 | 91.6520 | 21.0342 | 10.03402 |
| 65 | 50 | 60 | 18.6516 | 132.1364 | 21.8735 | 12.82831 |
| 50 | 30 | 90 | 18.6291 | 89.0152 | 20.9368 | 10.2064 |
| 50 | 70 | 90 | 18.2518 | 101.9988 | 21.4582 | 14.28895 |
| 65 | 50 | 90 | 17.9059 | 90.8638 | 21.3396 | 13.22295 |
| 50 | 70 | 30 | 17.6993 | 99.6486 | 20.0906 | 13.40894 |
| 80 | 70 | 90 | 17.0210 | 107.6595 | 21.3923 | 15.85394 |
TPC-total phenolic content, TFC-total flavonoid content.
Table 2.
Analysis of variance (ANOVA) and descriptive statistics (R2 and CV) of the fitted model.
| Term | Regression coefficient | |||
| Empty Cell | TPC | TFC | DPPH | Rutin content |
| Intercept | ||||
| β0 | 1369 | 1.23 | 6.39 | 20.23 |
| Linear | ||||
| β1 | 3.15* | -0.22* | 3.70 | 7.72* |
| β2 | 0.56 | -0.8* | 0.14 | 3.35* |
| β3 | 3.32* | 0.67* | 0.26 | 8.643e-0.003 |
| β4 | 0.42 | 0.38* | 0.065 | 0.92 |
| Interaction | ||||
| β12 | 1.6 | 0.66* | 0.29 | 2.59* |
| β13 | 0.88 | -0.47 | 0.11 | -5.67* |
| β14 | -0.34 | -0.33 | -0.033 | 1.14 |
| β23 | -1.11 | -0.12 | 0.44* | 7.86* |
| β24 | 1.15 | 0.21 | 0.10 | -0.76 |
| β34 | -0.064 | 0.68* | 0.13 | 2.64* |
| Quadratic | ||||
| β11 | -2.92 | -0.094 | 0.45* | -1.75 |
| β22 | 0.48 | 0.54* | 0.20 | -0.89 |
| β33 | -1.48 | 0.41 | 0.045 | 5.56* |
| β44 | 0.51 | 0.027 | -0.39* | -0.36 |
| R2a | 0.8233 | 0.8393 | 0.9843 | 0.6864 |
| CVb | 17.22 | 35.67 | 6.73 | 8.5588 |
| pm-valuec | 0.0034 | 0.0019 | <0.0001 | <0.0001 |
| plf-valued | 0.2013 | 0.057 | 0.0566 | 0.4860 |
⁎ p < 0.01;⁎⁎ 0.01 ⩽ p < 0.05.; ⁎⁎⁎0.05 ⩽ p < 0.1.; a Coefficient of multiple determination.; b Coefficient of variance [%];c Probability of F value for the model.; d Probability of F value for the lack of fit, TPC-total phenolic content, TFC-total flavonoid content.
Table 3.
Optimized NADES parameters with estimated predicted and observed values.
| Optimal parameters | Predicted Values | Obtained values |
|---|---|---|
| Extraction temperature (°C) | 80 | 80 |
| Ethanol concentration (%) | 62.23 | 62.23 |
| Ultrasound power (%) | 56.05 | 56 |
| TPC (mg GAE/DW) | 19.52 | 19.82 |
| TFC (mg GAE/g DW) | 98.64 | 99.26 |
| DPPH test C (mg TE/g DW) | 21.4475 | 21.5423 |
| Rutin content (mg/g DW) | 15.03 | 15.79 |
TPC-total phenolic content, TFC-total flavonoid content.
Table 4.
HPLC analysis of C. spinosa extractobteined under optimal conditions.
| Compound | Concentration (mg/g) |
| Gallic Acid | 0.0408 |
| Catechin equivalent | 2.0675 |
| Caffeine | 0.2495 |
| Syringic Acid | 0.1927 |
| Sinapic Acid | 0.0502 |
| Rutin | 15.5051 |
| Quercetin-3-Glucoside | 4.2687 |
Disclaimer/Publisher’s Note: The statements, opinions and data contained in all publications are solely those of the individual author(s) and contributor(s) and not of MDPI and/or the editor(s). MDPI and/or the editor(s) disclaim responsibility for any injury to people or property resulting from any ideas, methods, instructions or products referred to in the content. |
© 2025 by the authors. Licensee MDPI, Basel, Switzerland. This article is an open access article distributed under the terms and conditions of the Creative Commons Attribution (CC BY) license (http://creativecommons.org/licenses/by/4.0/).
Copyright: This open access article is published under a Creative Commons CC BY 4.0 license, which permit the free download, distribution, and reuse, provided that the author and preprint are cited in any reuse.


