Submitted:
15 April 2025
Posted:
23 April 2025
You are already at the latest version
Abstract
Quercetin, a potent flavonoid with significant antioxidant and anti-inflammatory properties, is abundantly present in Citrus sinensis (sweet orange). Conventional extraction methods often involve toxic solvents and prolonged extraction times, limiting efficiency and sustainability. This study explores ultrasound-assisted hydrotropic extraction (UAHE) as a green and efficient alternative for quercetin recovery from C. sinensis peel. Hydrotropes (e.g., sodium Benzoate) were employed to enhance solubility, while ultrasound irradiation facilitated cell disruption and mass transfer. Parameters such as hydrotrope concentration, sonication time, temperature, and solid-liquid ratio were optimized using response surface methodology (RSM) to maximize yield. The optimized UAHE process demonstrated a quercetin yield of [91]% under mild conditions, significantly outperforming conventional solvent extraction. UV analysis confirmed the purity of the extracted quercetin. UAHE reduced extraction time and solvent consumption while improving yield, aligning with green chemistry principles. This method offers a scalable, eco-friendly approach for bioactive compound extraction from agro-industrial waste, with potential applications in nutraceuticals and pharmaceuticals.
Keywords:
quercetin
; citrus sinensis
; ultrasound-assisted extraction
; hydrotropy
; green extraction
; response surface methodology
Introduction
Bioactive compounds from natural sources have gained significant attention in recent years due to their diverse pharmacological properties and potential therapeutic applications. Among these compounds, quercetin, a plant flavonoid with remarkable antioxidant and anti-inflammatory properties, has emerged as a compound of particular interest Sharma et al., 2019. However, the practical application of quercetin is often limited by its poor aqueous solubility, which affects its bioavailability and therapeutic efficacy.
Citrus sinensis (orange) peel, a widely available agricultural by-product, contains substantial amounts of quercetin (approximately 300 mg/100g), making it an attractive source for extraction Aranda-Ledesma et al., 2024. Traditional extraction methods often involve organic solvents, which raise environmental concerns and may leave harmful residues in the final product. Therefore, developing green extraction technologies that are both efficient and environmentally sustainable has become imperative.
Hydrotropic extraction has emerged as a promising approach for enhancing the aqueous solubility of poorly soluble compounds. Hydrotropes, such as sodium benzoate, can significantly increase the solubility of hydrophobic compounds through molecular self-assembly and complex formation Narayanan et al., 2022. This technique offers advantages including high selectivity, easy recovery of solutes, and environmental compatibility.
Recent advances in extraction technologies have demonstrated that ultrasound-assisted extraction (UAE) can significantly enhance the recovery of bioactive compounds from plant matrices. The mechanism of UAE involves acoustic cavitation, which creates microscopic bubbles in the extraction medium. The collapse of these bubbles generates localized areas of high temperature and pressure, leading to improved mass transfer and cell wall disruption Borah et al., 2024.
The combination of hydrotropic extraction with ultrasound assistance represents a novel approach that could potentially overcome the limitations of conventional extraction methods. While both techniques have been studied separately, their synergistic effects on quercetin extraction from orange peel have not been thoroughly investigated. The integration of these methods could offer several advantages, including:
- Enhanced extraction efficiency through improved mass transfer
- Reduced extraction time and energy consumption
- Environmentally friendly processing conditions
- Improved selectivity and product quality.
Materials and Methods
2.1. Materials:
All chemicals used were of analytical grade. Sodium benzoate (hydrotrope) and quercetin standard were sourced from SRL, India. Urea was obtained from TCI, India, and acetone from SRL, India. Double distilled water was used throughout the study.
2.1.1. Plant Material
Fresh Citrus sinensis peels were procured from local markets, washed with distilled water, and air-dried at 25 ± 2°C for 48 hours. The dried peels were ground to a fine powder and stored in airtight containers until use.
2.1.2. Equipment
Key equipment included a UV-Visible Spectrophotometer (Hitachi UV-200), Ultrasonic Bath (Equitron), Magnetic Stirrer (Remi 1MLH), and Laboratory Centrifuge (Remi R-24).
2.2. Analytical Methods:
2.2.1. Molar Absorptivity Determination
Standard quercetin solutions were prepared in distilled water, and absorbance was recorded at λmax using a UV-Vis spectrophotometer. Molar absorptivity was calculated using Beer-Lambert’s law from the slope of the absorbance vs. concentration curve.
2.3. Extraction Procedure:
2.3.1. Hydrotropic Solution Preparation
Sodium benzoate solutions (0–3 M) were prepared in distilled water and stirred until fully dissolved.
2.3.2. Ultrasound-Assisted Hydrotropic Extraction (UAHE)
UAHE was carried out using a 3 M sodium benzoate solution (50 mL) and 5 g of orange peel powder at 25 ± 2°C. After 30 minutes of sonication, the mixture was magnetically stirred, filtered, diluted below minimum hydrotrope concentration (MHC), centrifuged (20 min), and the precipitate was redissolved in 50 mL acetone for analysis.
2.4. Optimization Studies
2.4.1. Preliminary Studies
Initial trials identified suitable ranges for hydrotrope concentration, extraction time, and solid loading.
2.4.2. Response Surface Methodology (RSM)
Box-Behnken Design (BBD) was employed to optimize three variables:
- X₁: Hydrotrope concentration
- X₂: Extraction time
- X₃: Solid loading
2.5. Statistical Analysis
Model adequacy was evaluated via ANOVA, R² values, lack of fit tests, and normal probability plots using appropriate statistical software.
Results and Discussion
3.1. Molar Absorptivity of Quercetin
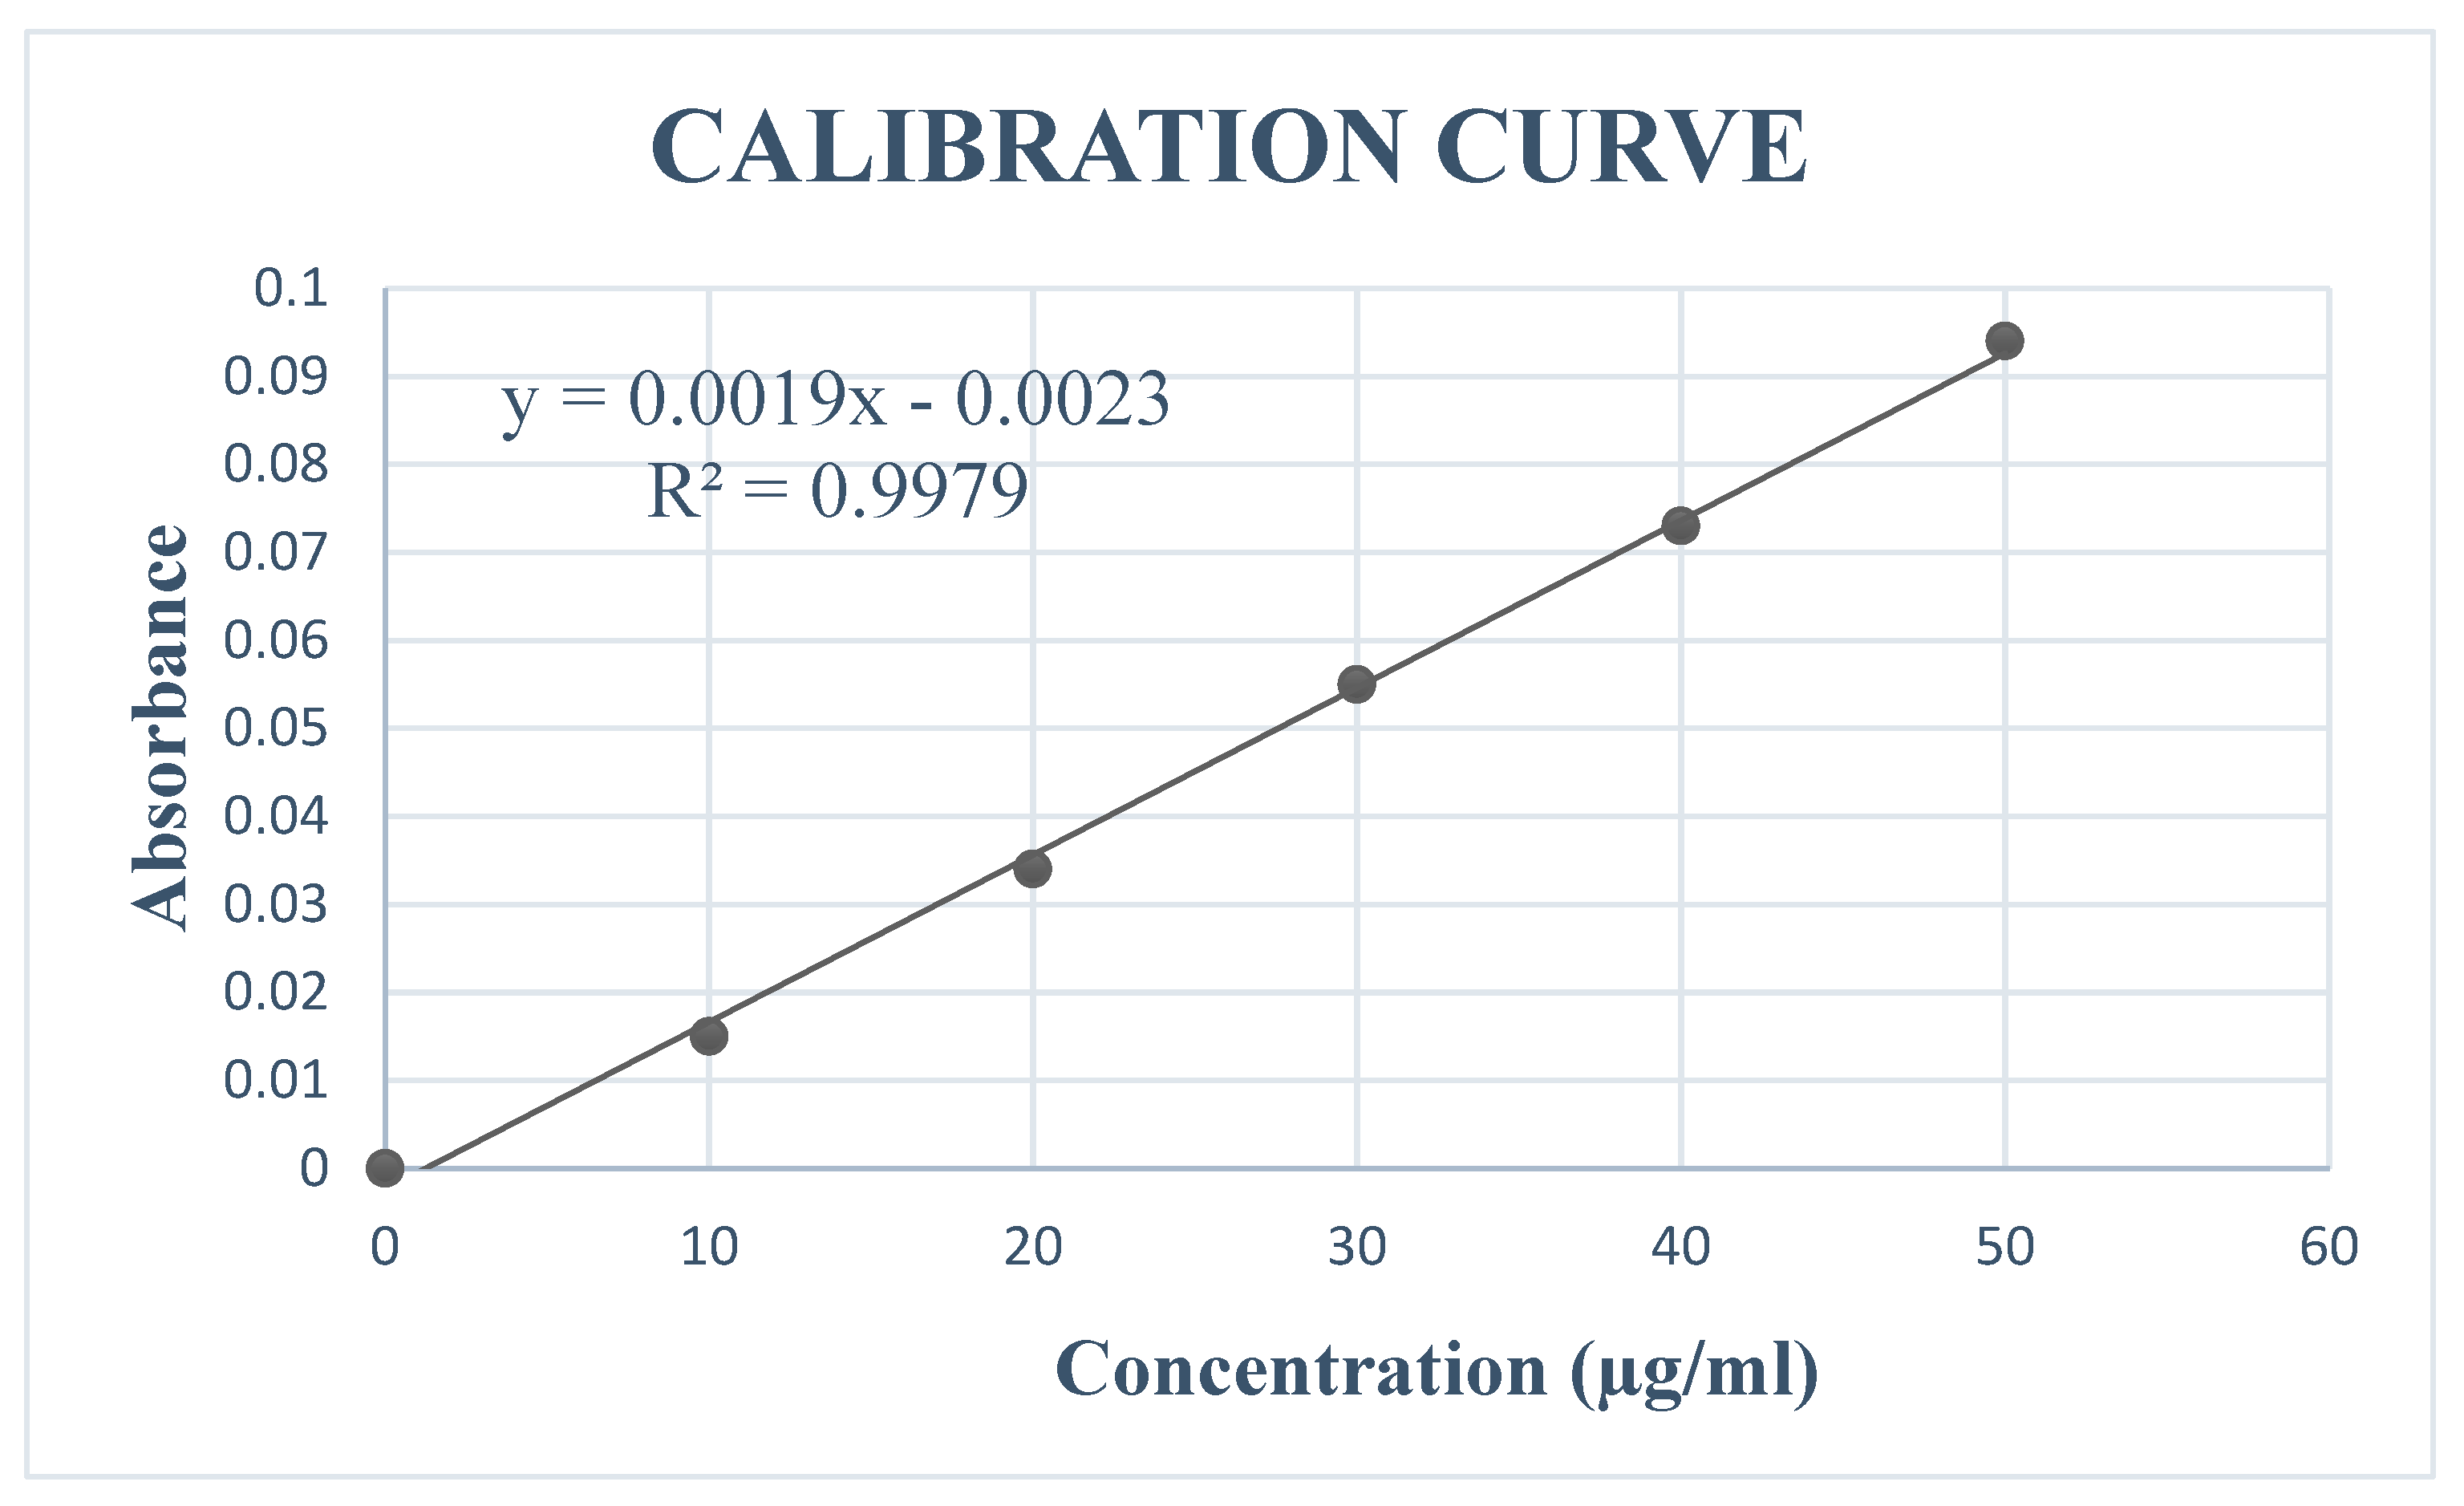
The standard quercetin solutions of 10, 20, 30 40, 50 µg/mL are prepared by adding a known amount of quercetin in 500 ml of double distilled water. The solutions are individually primed below the maximum aqueous solubility of quercetin. Using UV visible spectrophotometer (Elico-SL210), the standard quercetin samples are analysed and the absorbance value at λmax (278.5nm) for each concentration is obtained. The absorbance value of quercetin is represented in Table 3.1 and the UV spectra is represented in figure 4.1.

Table 3.1.
Absorbance value of standard quercetin solution.
| Concentration (µg/ml) | Absorbance |
|---|---|
| 10 | 0.015 |
| 20 | 0.034 |
| 30 | 0.055 |
| 40 | 0.073 |
| 50 | 0.094 |
With the absorbance value, the molar absorptivity value of bio active compounds in water is determined as 13001 mol-1 cm-1 as depicted in Figure 4.2. The obtained molar absorptivity is close to the value seen in literature.
Figure 3.1.
UV Spectra of Quercetin.
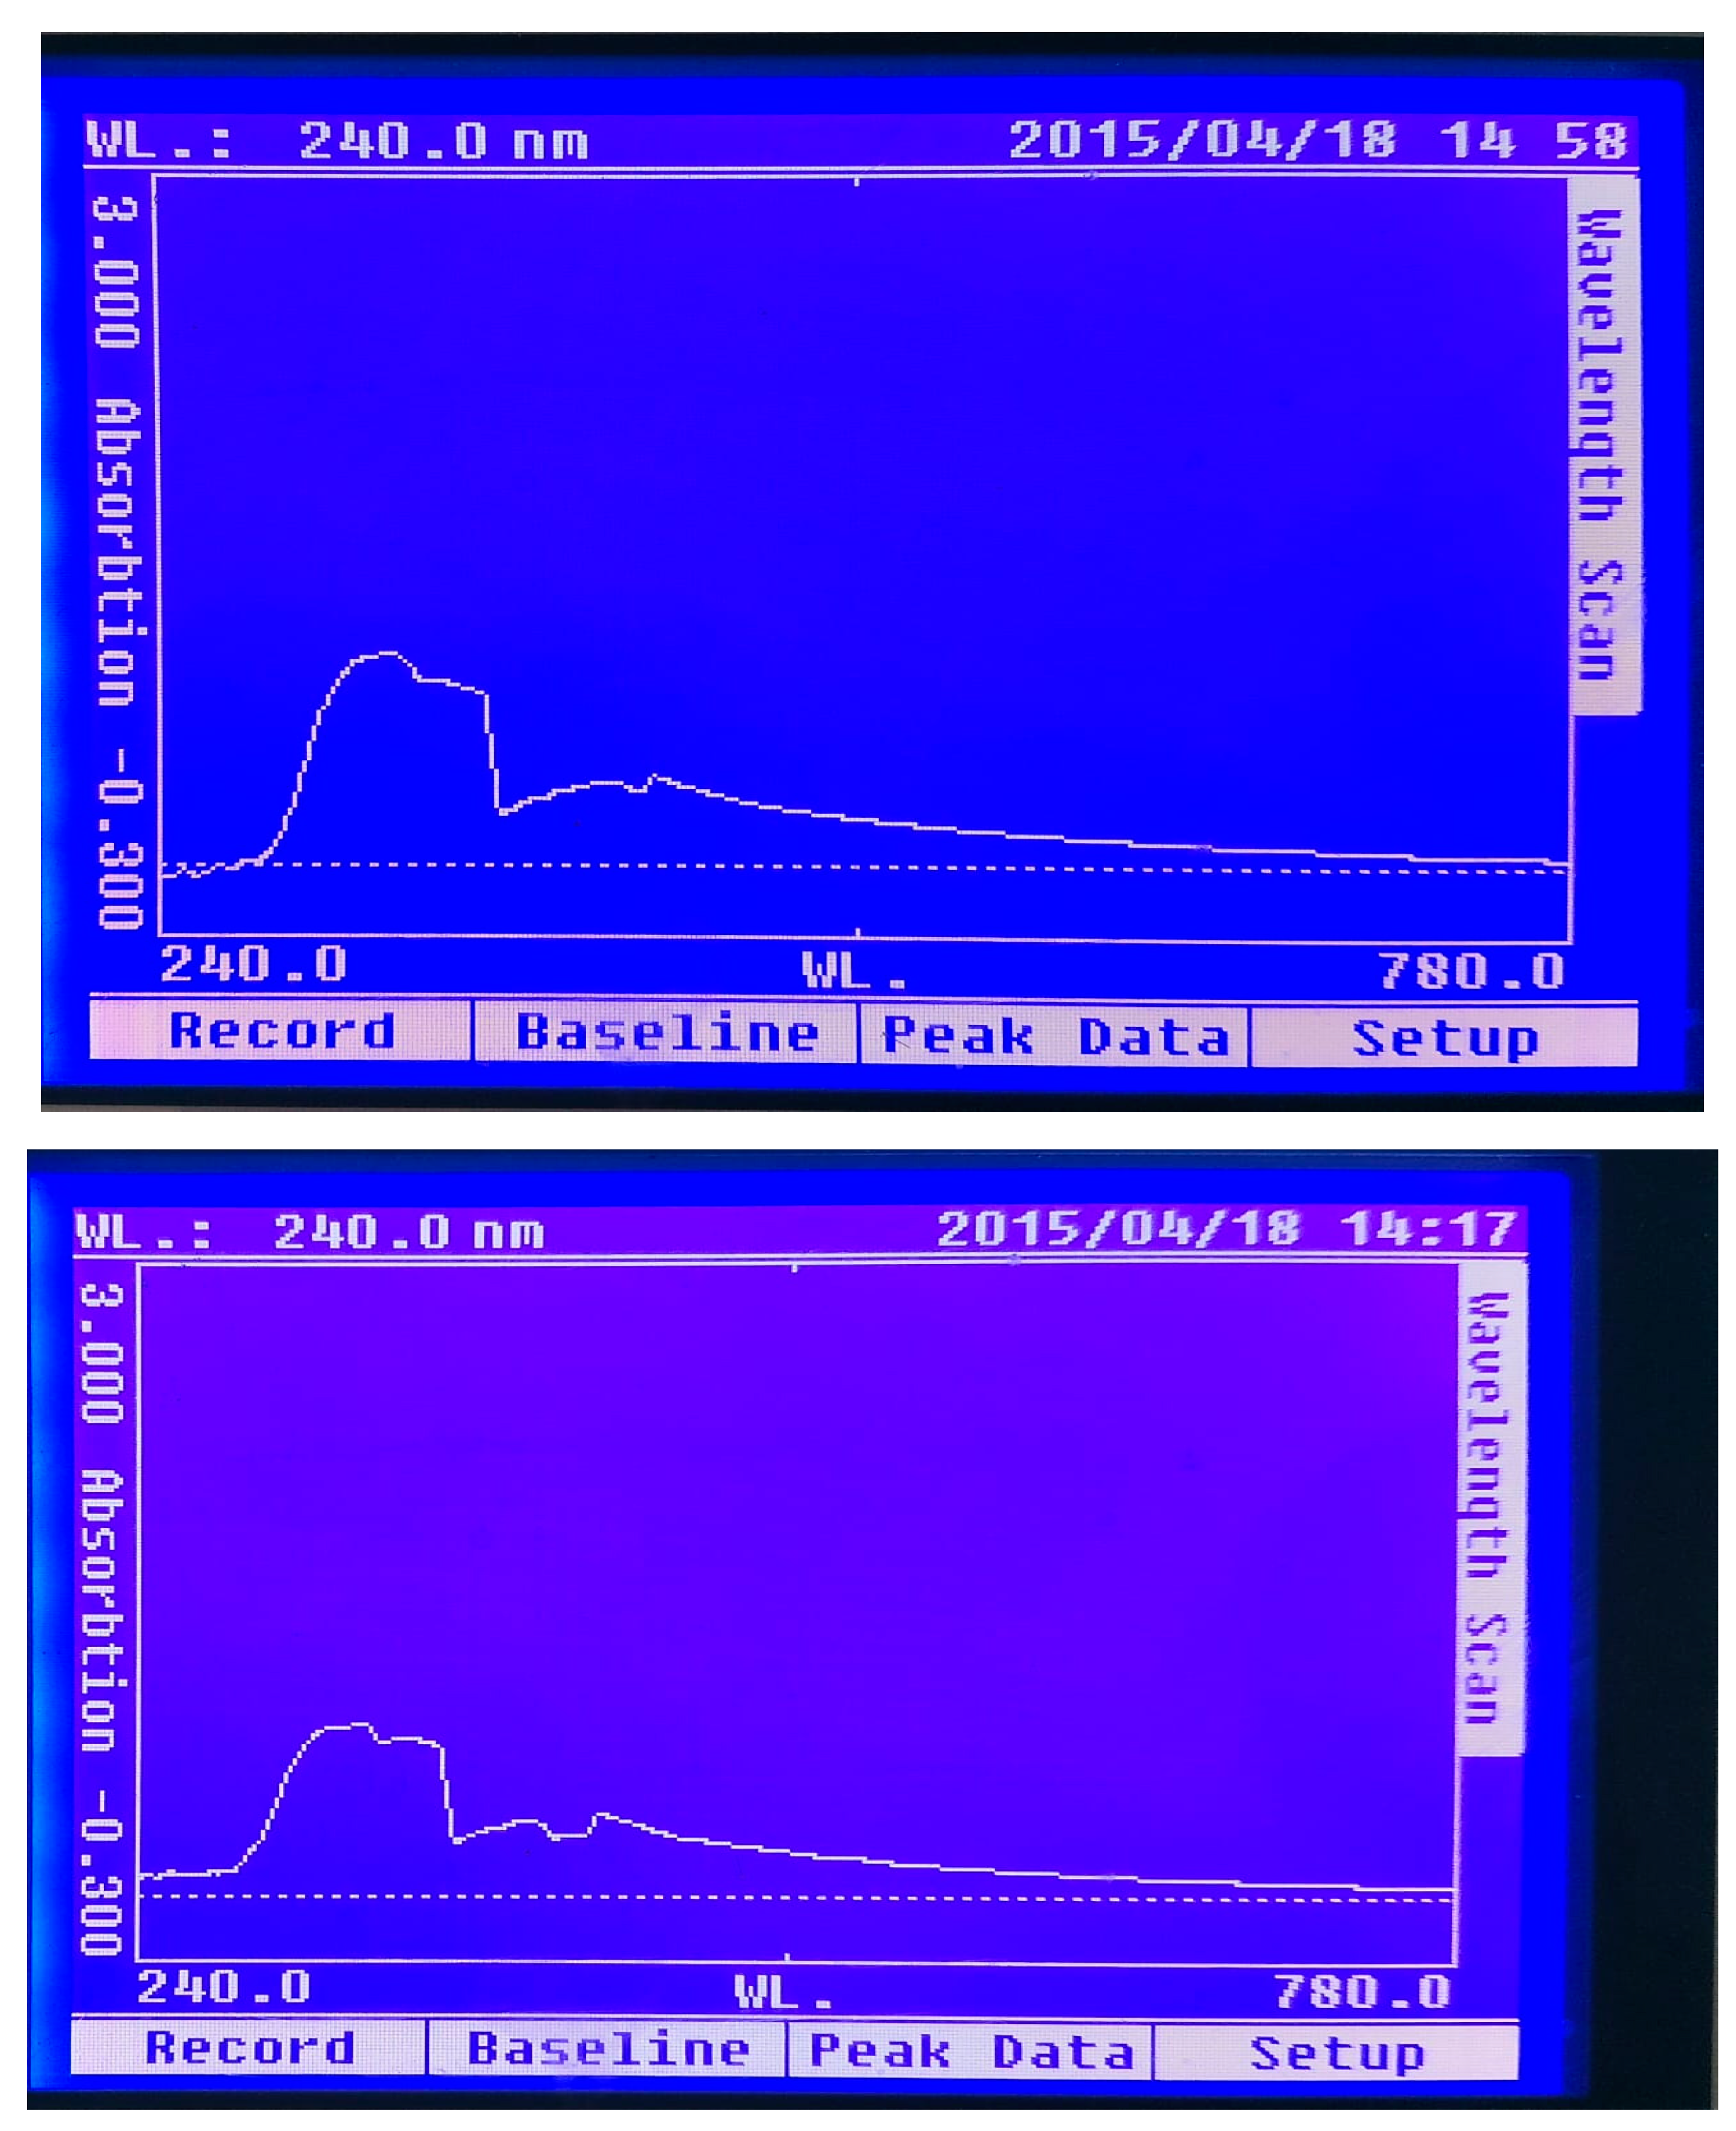
Figure 3.2.
Calibration curve of standard quercetin solution.
3.2. Extraction Parameters Range Fixation
3.2.1. Effect of Hydrotrope on the Solubility of Quercetin
Hydrotrope (SB) is fed in to estimate the efficacy of the solubility on quercetin. The most important scope of this investigation is to enhance the oral efficacy of bio active compounds. Accordingly, the hydrotropes are also chosen in such a way that it should be orally administered. Based on this criterion the hydrotrope, SB (available as food preservative) were selected. The selected hydrotrope is freely soluble in water, nontoxic and do not produce any temperature effect when dissolved in water.
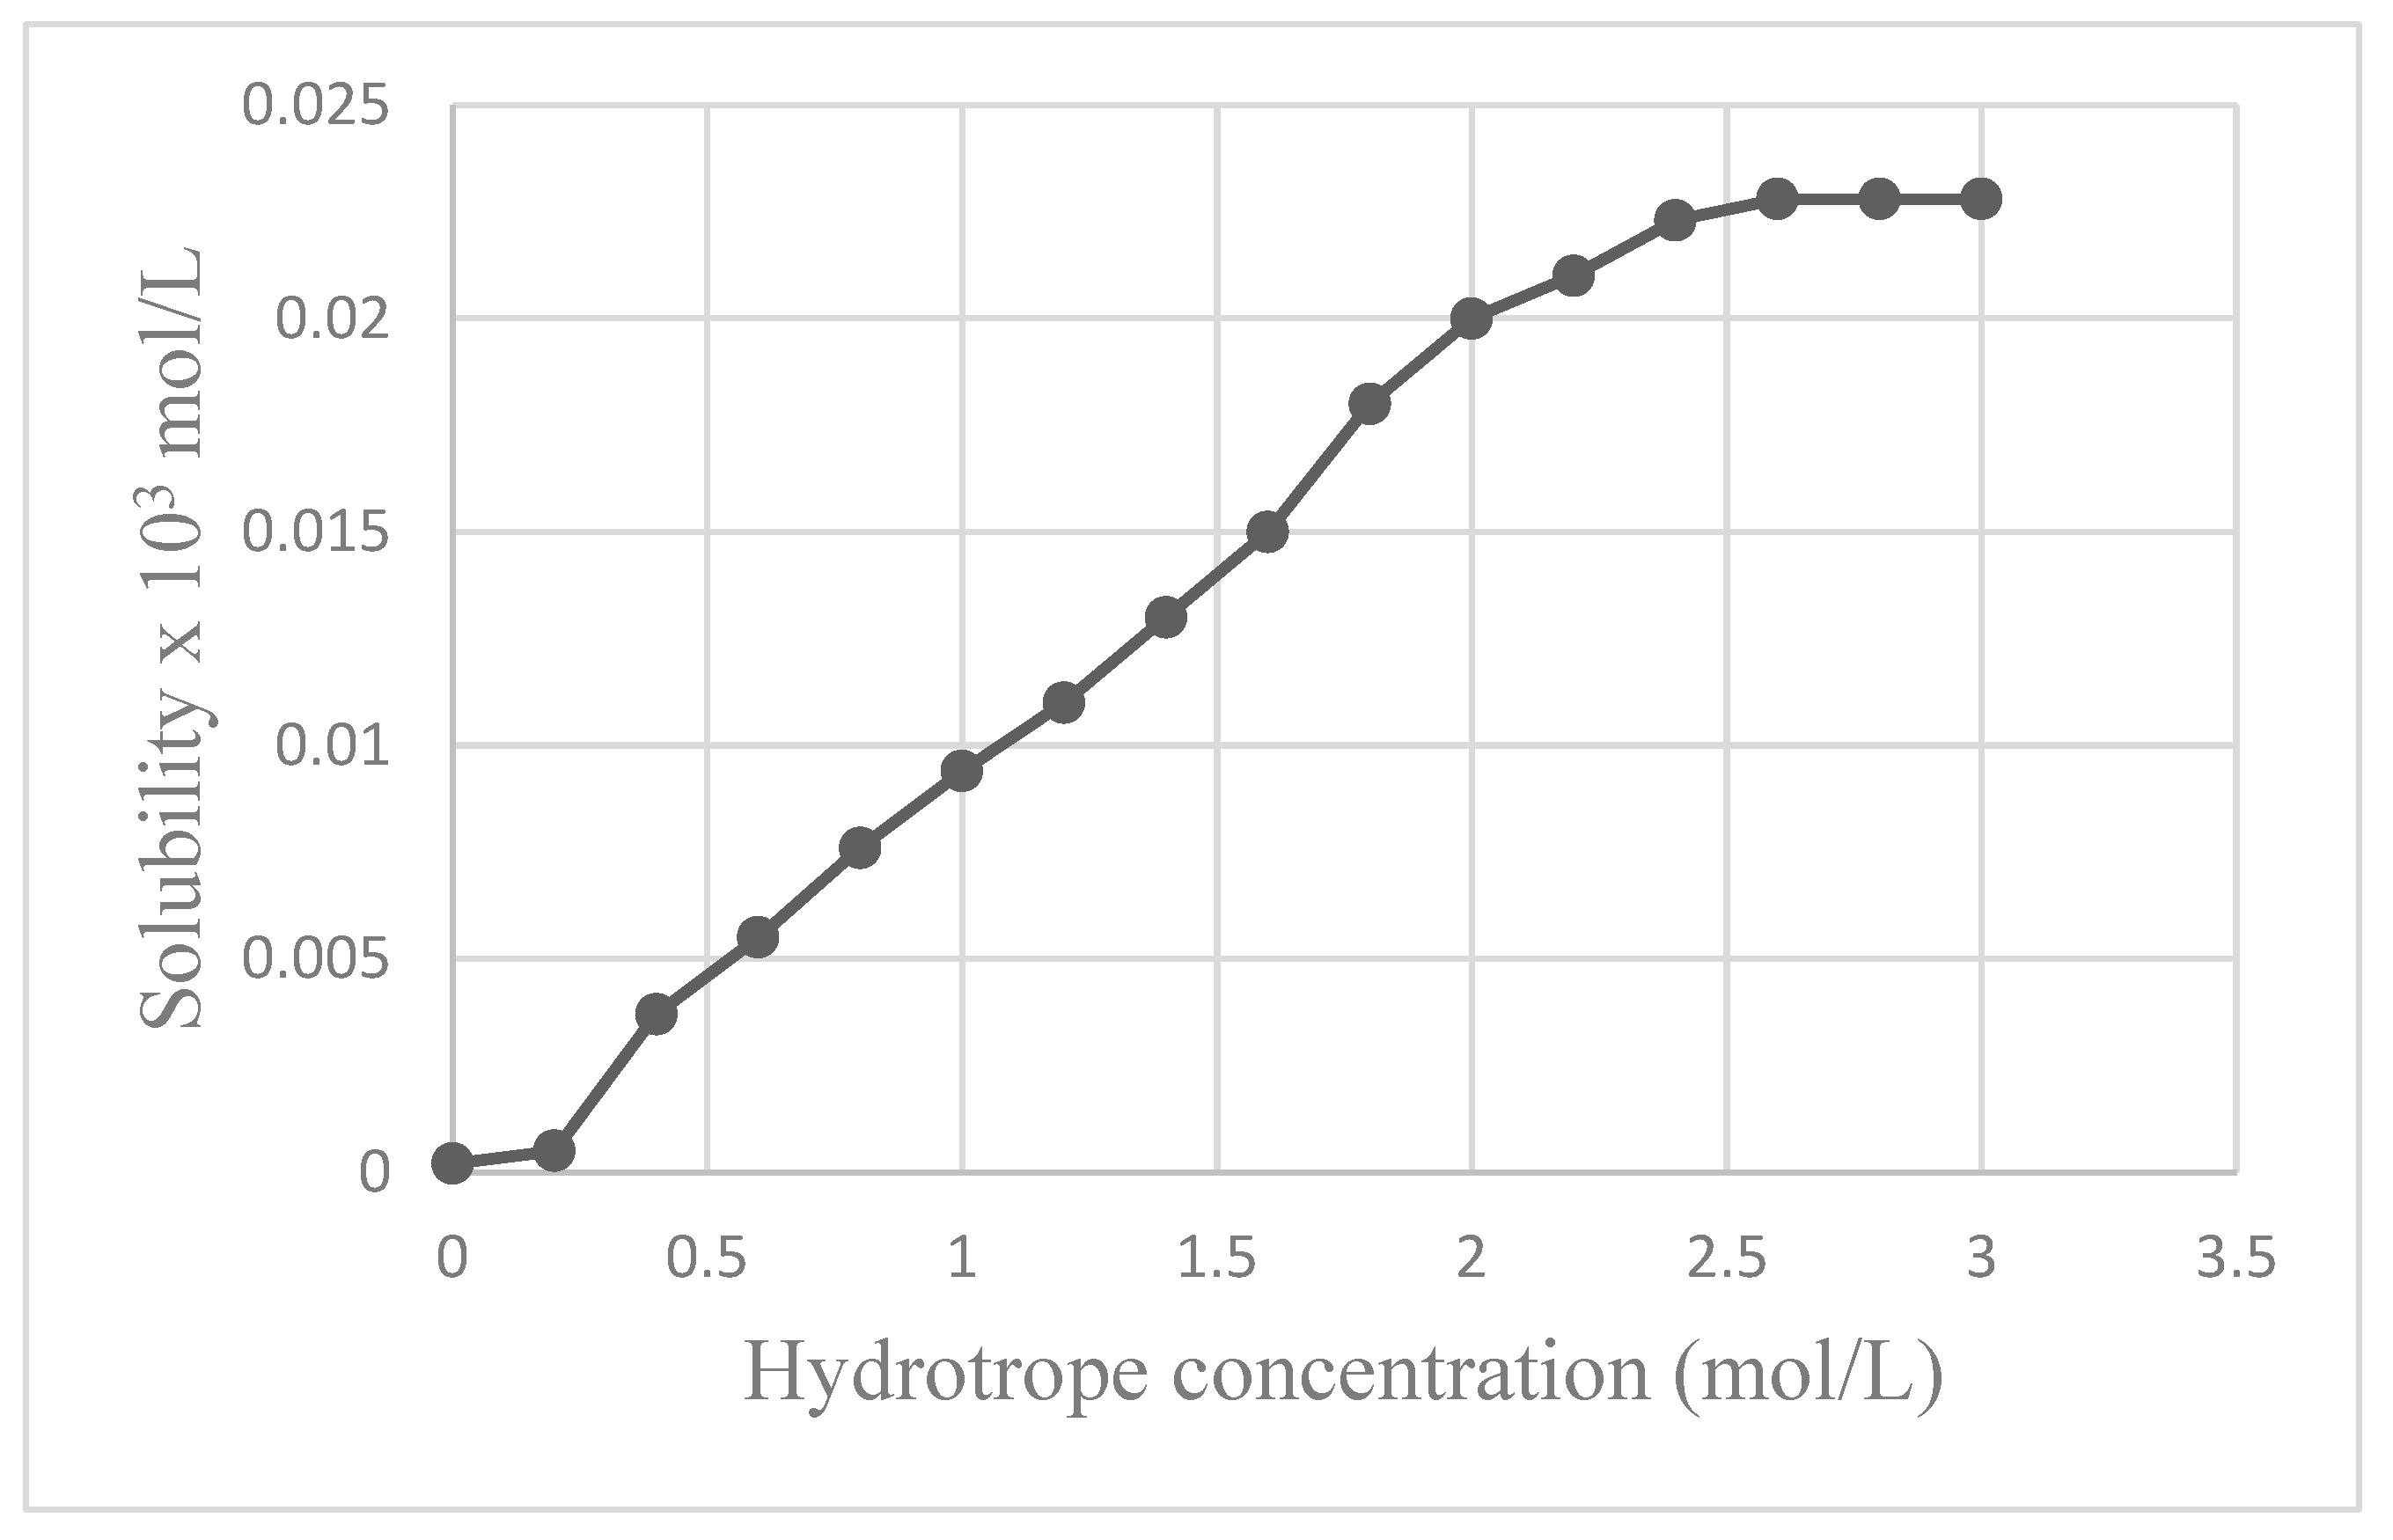
The experimental results for the impact of hydrotrope on the solubility of quercetin is captured in Figure 4.2. The impact of hydrotrope concentration and a wide range of system temperature on the aqueous solubility of quercetin are premeditated. When sodium benzoate, as a hydrotrope is added to the aqueous phase, an appreciable augmentation in solubility is observed. remarkable change During initial stage i.e., when the concentration of hydrotrope is very less, there is no in solubility. When the concentration of hydrotrope reaches above 0.2 mol/L, a significant improvement occurs. On further increase in concentration of hydrotrope, there is an upswing trend in the dissolving of quercetin. There is rising trend in solubilization till the hydrotrope concentration reaches 2.6 mol/L and beyond which there is no visible change in solubility. This may be attributed to the non-availability of sufficient water molecules. It is deciphered from Table 4.2 that the hydrotrope solution facilitates the solubility of quercetin only till 0.2 mol/L and below this concentration there is no glaring change in the solubility. This concentration level of hydrotrope is called Minimum Hydrotropic Concentration (MHC), i.e., for significant solubilization of quercetin to occur, the minimum amount of hydrotrope viz 0.2 mol/L should be available in the aqueous phase.
Table 3.2.
Effect of SB on the solubility of quercetin.
| Hydrotrope Concentration (mol/L) | Solubility x103 mol/L |
|---|---|
| 0 | 0.0002 |
| 0.2 | 0.0005 |
| 0.4 | 0.0037 |
| 0.6 | 0.0055 |
| 0.8 | 0.0076 |
| 1 | 0.0094 |
| 1.2 | 0.011 |
| 1.4 | 0.013 |
| 1.6 | 0.015 |
| 1.8 | 0.018 |
| 2 | 0.02 |
| 2.2 | 0.021 |
| 2.4 | 0.0223 |
| 2.6 | 0.0228 |
| 2.8 | 0.0228 |
| 3 | 0.0228 |
It is also inferred from Table 3.2 that after hydrotrope concentration reaches 2.6 mol/L, there is no appreciable change in solubility of quercetin and the rate of increase in solubility of quercetin dwindles. The value at which there is no appreciable change in solubility is called maximum hydrotrope concentration (Cmax).
The solubility curve can be divided into 3 regions (Figure 3.2) viz, the first one is the self-aggregation region or quercetin inactive region where there is no solubilization. The region above MHC where the very high rate of solubilization occurs represents the second. The region above Cmax is the third one in which the rate of solubilization is less, i.e., above this concentration there is no noticeable increase in solubilization.
Figure 3.3.
Effect of SB on solubility on quercetin.
3.2.2. Extraction Time
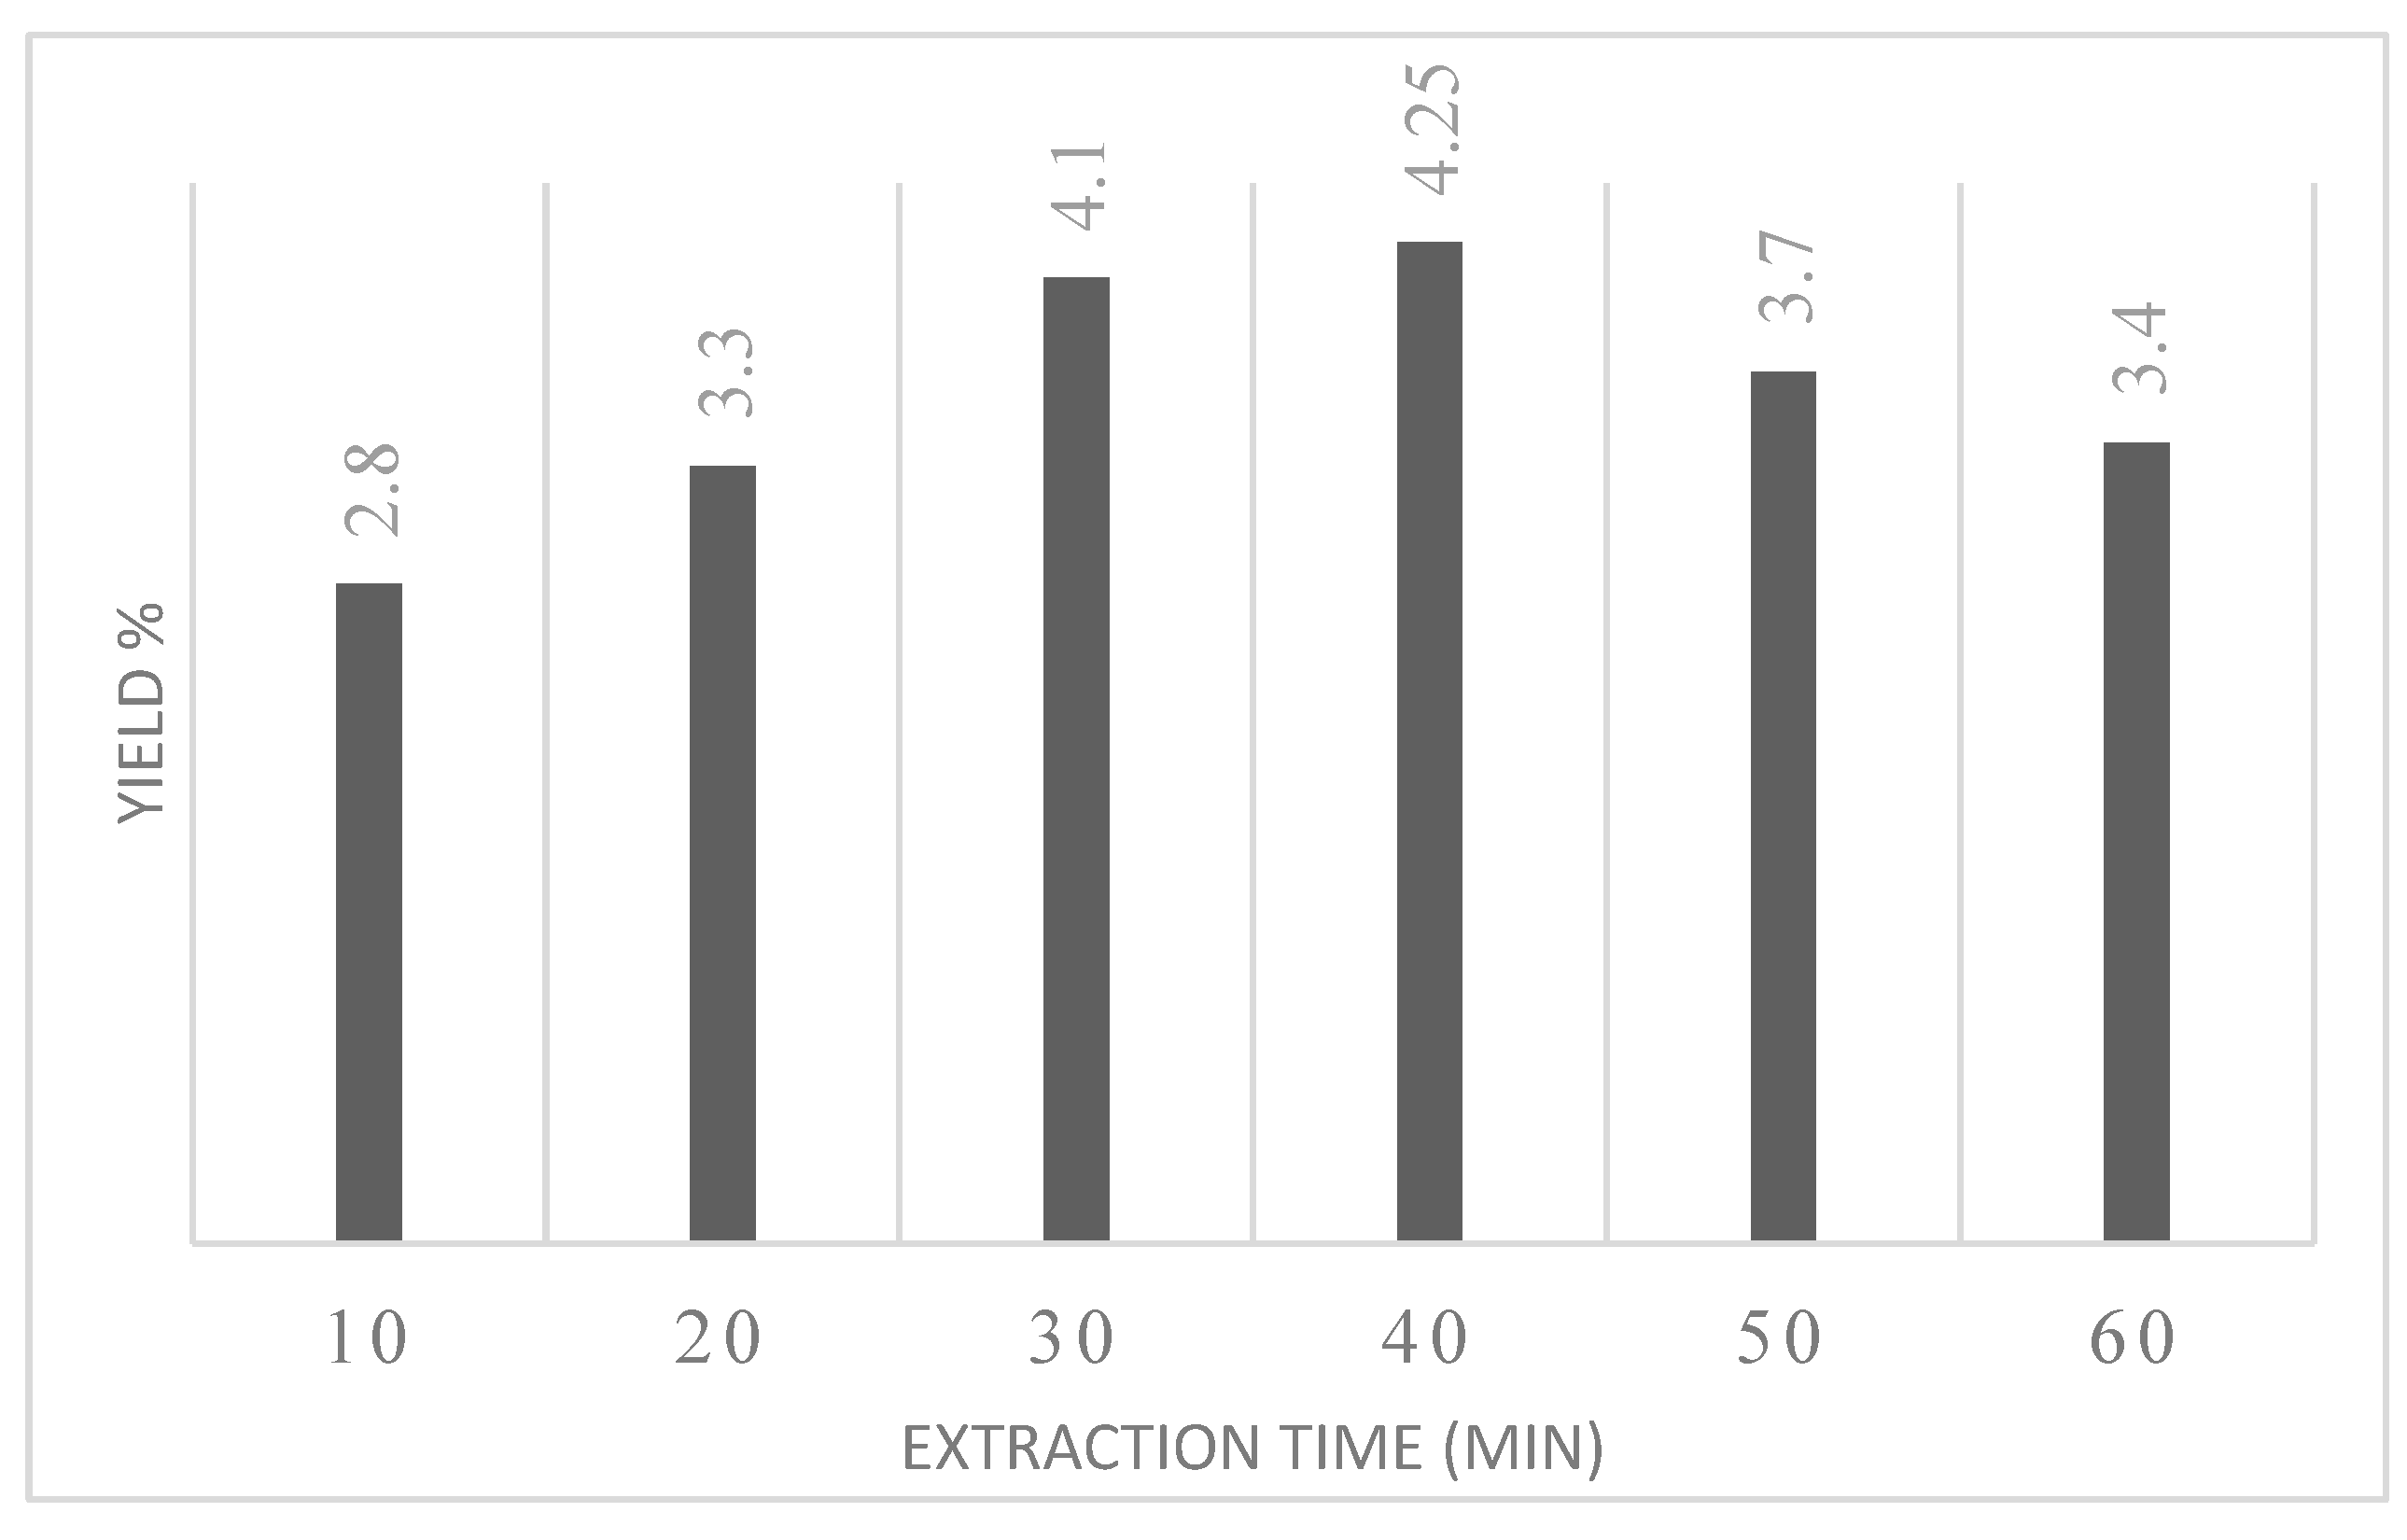
The extraction time was assessed from 10 minutes to 60 minutes. From Figure 3.4, there was a significant increase of yield with increase in extraction time prolonging from 10 to 30 min. After then, yield decreased, meaning that long extraction time would possibly induce degradation of compounds under ultrasound treatment.
Compared to conventional hydrotropic extraction, the time required for extraction was greatly reduced. As reported in the literature, the extraction time was extended up to 8 hours (Nagarajan et al., 2016) in case of conventional hydrotropic extraction. However, embedding ultrasound results in shrunken time of extraction because of improved diffusion of solvent as well as damage of the cell wall.
Figure 3.4.
Effect of extraction time.
3.2.3. Raw Material Loading
The amount of solvent is an important factor for the solute to leach out during UAHE. The yield showed significant increase by increase in raw material loading which meant that an increase of solvent (SB hydrotrope) benefited the release of quercetin from Orange peels. However, higher solid loading decreased the yield possibly due to high liquid–solid ratio and paste-like formation. Large amount of extraction solvent also leads to increase of solvent wastage and process cost (Mtetwa et al., 2020). The raw material loading around 30% w/v were found to be optimum for further study.
3.3. Response Surface Methodology
3.3.1. Optimization with Sodium Benzoate as Hydrotrope
In the present study, RSM model has been used to study relation between yield of quercetin and extraction parameters such as hydrotrope concentration(X1), extraction time(X2) and solid loading(X3). Table 1 specifies the extraction parameters and operating ranges considered.
Table 3.3.
Extraction parameters for RSM (Sodium Benzoate).
| Extraction Parameters | Operating Ranges | |
|---|---|---|
| Lowest | Highest | |
| Hydrotrope concentration (mol) | 1 | 3 |
| Extraction Time (min) | 10 | 30 |
| Solid Loading (w/v) | 10 | 30 |
The selected parameters were optimized using Box-Behnken design in Minitab software. The BBD procedure of RSM resulted in a total of 15 randomized experiments. Based on 15 different extraction parameters, a total of 15 experiments were carried out by Ultrasound-Assisted Hydrotropic Extraction method. The obtained extract is analysed by UV-visible spectroscopy to determine the yield of quercetin.
Table 3.4.
Experimental Design and yield of quercetin extracted with sodium benzoate as hydrotrope.
| Run | Hydrotrope Concentration (mol) |
Extraction time (min) |
Solid Loading (% w/v) |
Yield (µg/g) |
| 1 | 3 | 30 | 20 | 26.6 |
| 2 | 3 | 20 | 30 | 19.9 |
| 3 | 1 | 10 | 20 | 11.9 |
| 4 | 3 | 20 | 10 | 25.6 |
| 5 | 2 | 20 | 20 | 18.7 |
| 6 | 2 | 10 | 30 | 14.6 |
| 7 | 2 | 20 | 20 | 18.8 |
| 8 | 2 | 10 | 10 | 13.77 |
| 9 | 1 | 30 | 20 | 6.7 |
| 10 | 2 | 30 | 30 | 16.4 |
| 11 | 1 | 20 | 10 | 8.5 |
| 12 | 1 | 20 | 30 | 5.57 |
| 13 | 3 | 10 | 20 | 24.8 |
| 14 | 2 | 20 | 20 | 18.8 |
| 15 | 2 | 30 | 10 | 20.3 |
The mathematical model representing the yield of quercetin as a function of independent variables such as hydrotrope concentration, extraction time and solid loading within the region under investigation is expressed by following equation:
YIELD = -11.4 + 11.20 X1 - 0.074 X2 + 1.250 X3 - 1.32 X12 + 0.0005 X22 - 0.0255 X32 + 0.175 X1*X2
- 0.069 X1*X3 - 0.0118 X2*X3 Eqn.(1)
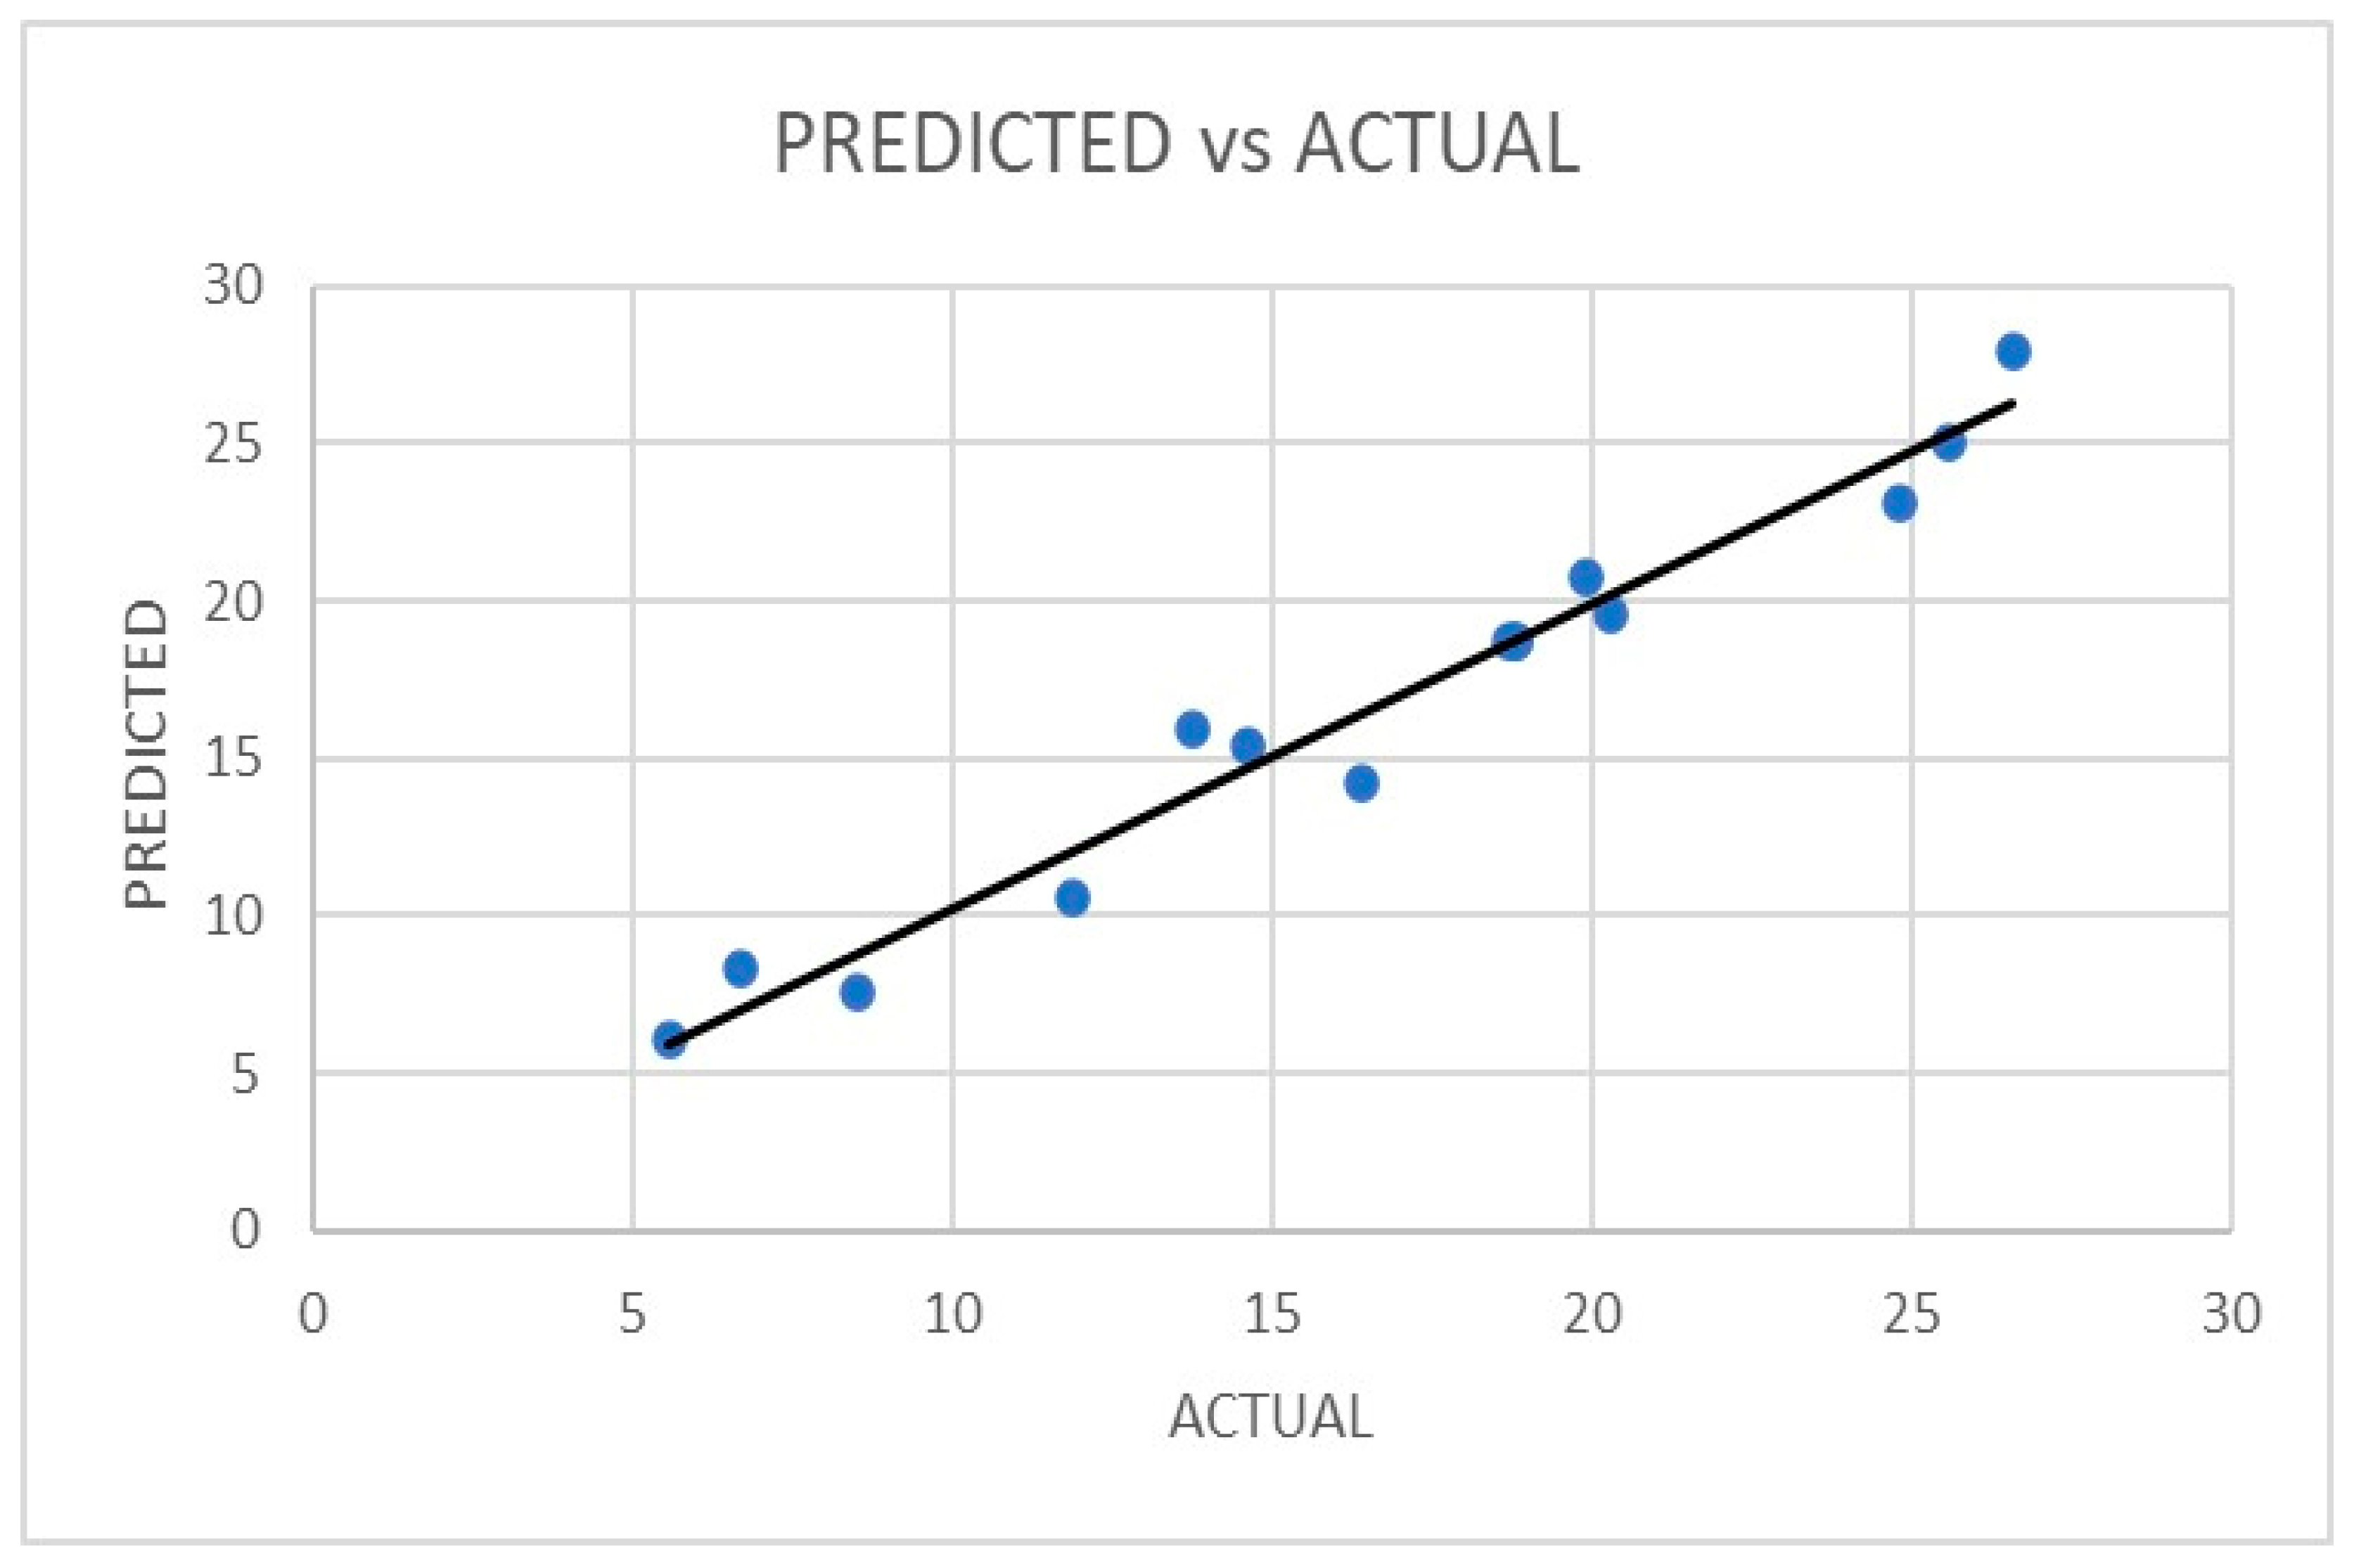
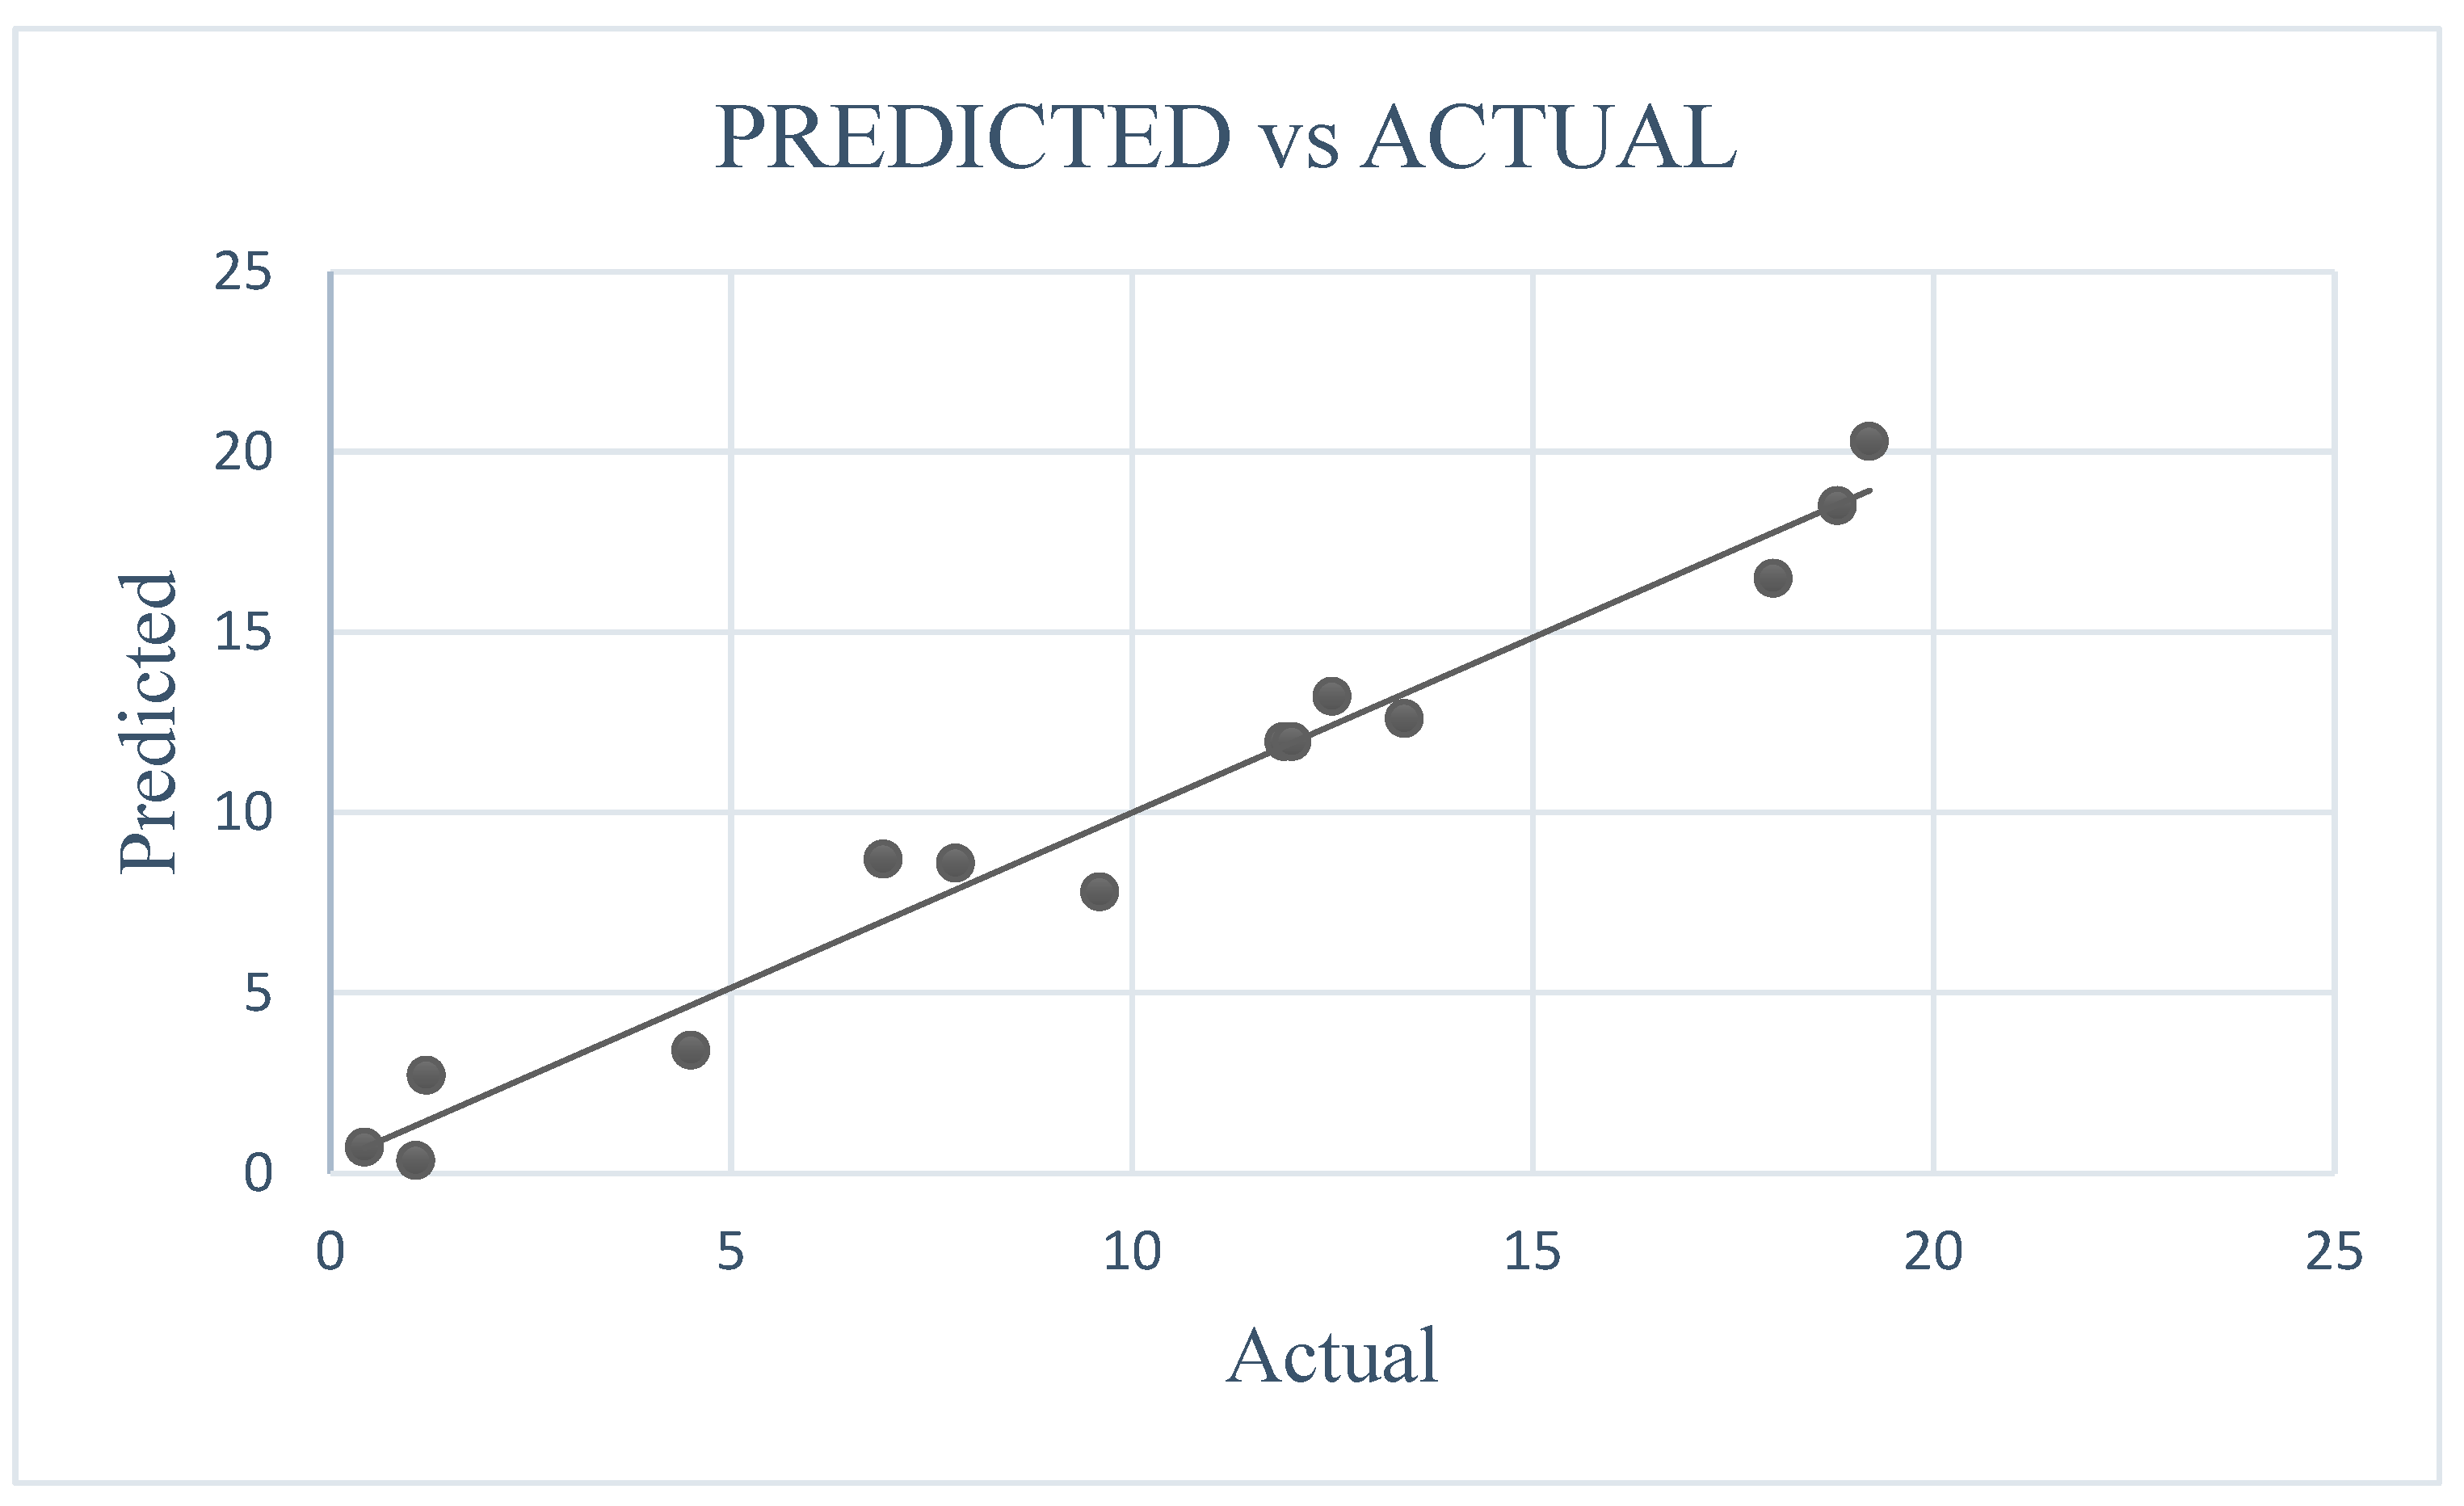
It is obvious from equation 1 that the quercetin yield highly depends on the hydrotrope concentration followed further by extraction time and then by solid loading. The prediction of quercetin yield using equation 1 has been compared with the experimental values as shown in Figure 1. It can be ascertained from the figure that the model equation predictions satisfactorily match the experimental values.
Figure 3.5.
Predicted vs Actual Values.
The Analysis of Variance (ANOVA) to determine the statistical significance of the model equation was evaluated and the results are presented in Table 3.
Table 3.5.
Analysis of Variance for quadratic model (Sodium Benzoate).
| Analysis of Variance (ANOVA) | |||||
| Source | DF | Adj SS | Adj MS | F-Value | P-Value |
| Model | 9 | 584.774 | 64.975 | 15.25 | 0.004 |
| Linear | 3 | 535.836 | 178.612 | 41.92 | 0.001 |
| Hydrotrope Concentration | 1 | 515.687 | 515.687 | 121.03 | 0 |
| Time | 1 | 3.038 | 3.038 | 0.71 | 0.437 |
| Solid Loading | 1 | 17.111 | 17.111 | 4.02 | 0.101 |
| Square | 3 | 29.177 | 9.726 | 2.28 | 0.197 |
| A2 | 1 | 6.442 | 6.442 | 1.51 | 0.274 |
| B2 | 1 | 0.011 | 0.011 | 0 | 0.962 |
| C2 | 1 | 24.072 | 24.072 | 5.65 | 0.063 |
| 2-Way Interaction | 3 | 19.761 | 6.587 | 1.55 | 0.312 |
| AB | 1 | 12.25 | 12.25 | 2.87 | 0.151 |
| AC | 1 | 1.918 | 1.918 | 0.45 | 0.532 |
| BC | 1 | 5.593 | 5.593 | 1.31 | 0.304 |
| Error | 5 | 21.305 | 4.261 | ||
| Lack-of-Fit | 3 | 21.298 | 7.099 | 2129.79 | 0 |
| Pure Error | 2 | 0.007 | 0.003 | ||
| Total | 14 | 606.079 | |||
The ANOVA of the regression model showed that the model is statistically significant (p = 0.001). The linear and quadratic term in the model were highly significant (p = 0.001). The linear and quadratic term in the model were highly significant. In the ANOVA chart if the lack of fit is mentioned as “not significant” then the model is said to be significant. Hence the model for extraction of quercetin is considered significant. The model adequacies were checked by R2. A higher value of R2 (0.96) shows that the predicted model suits the experimental behaviour of the system.
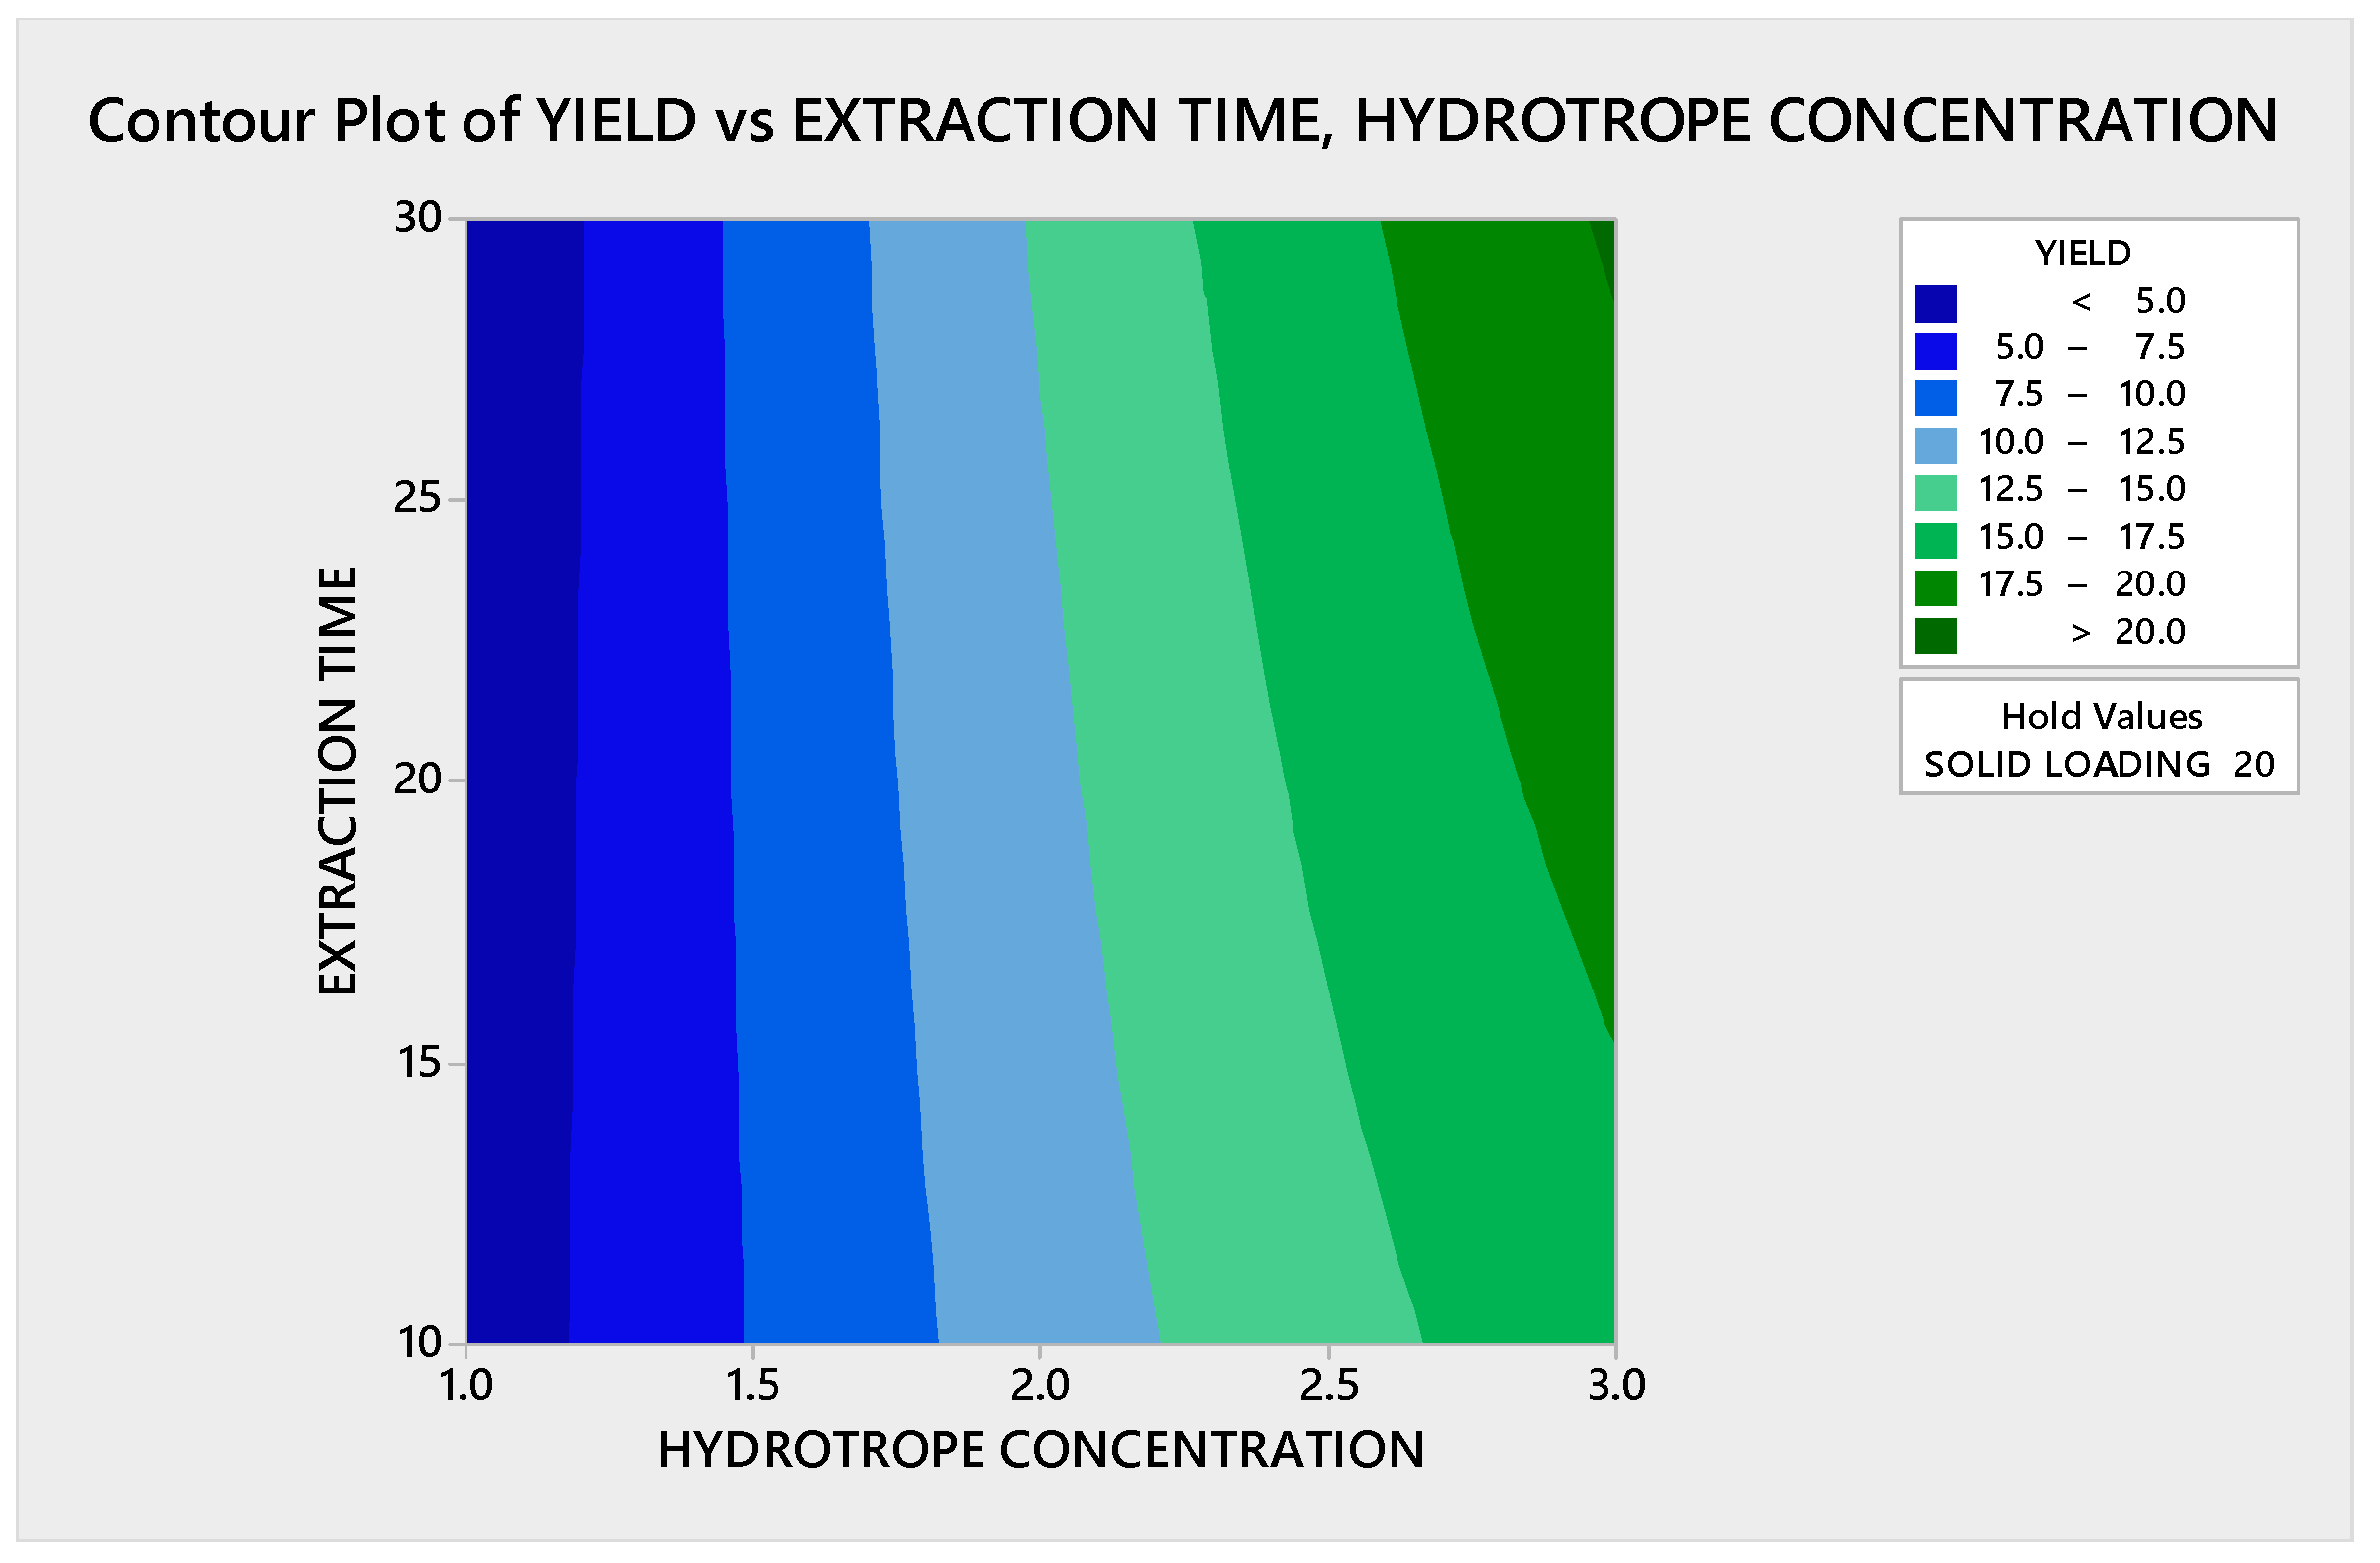
3.3.1.1. Contour Plot Analysis
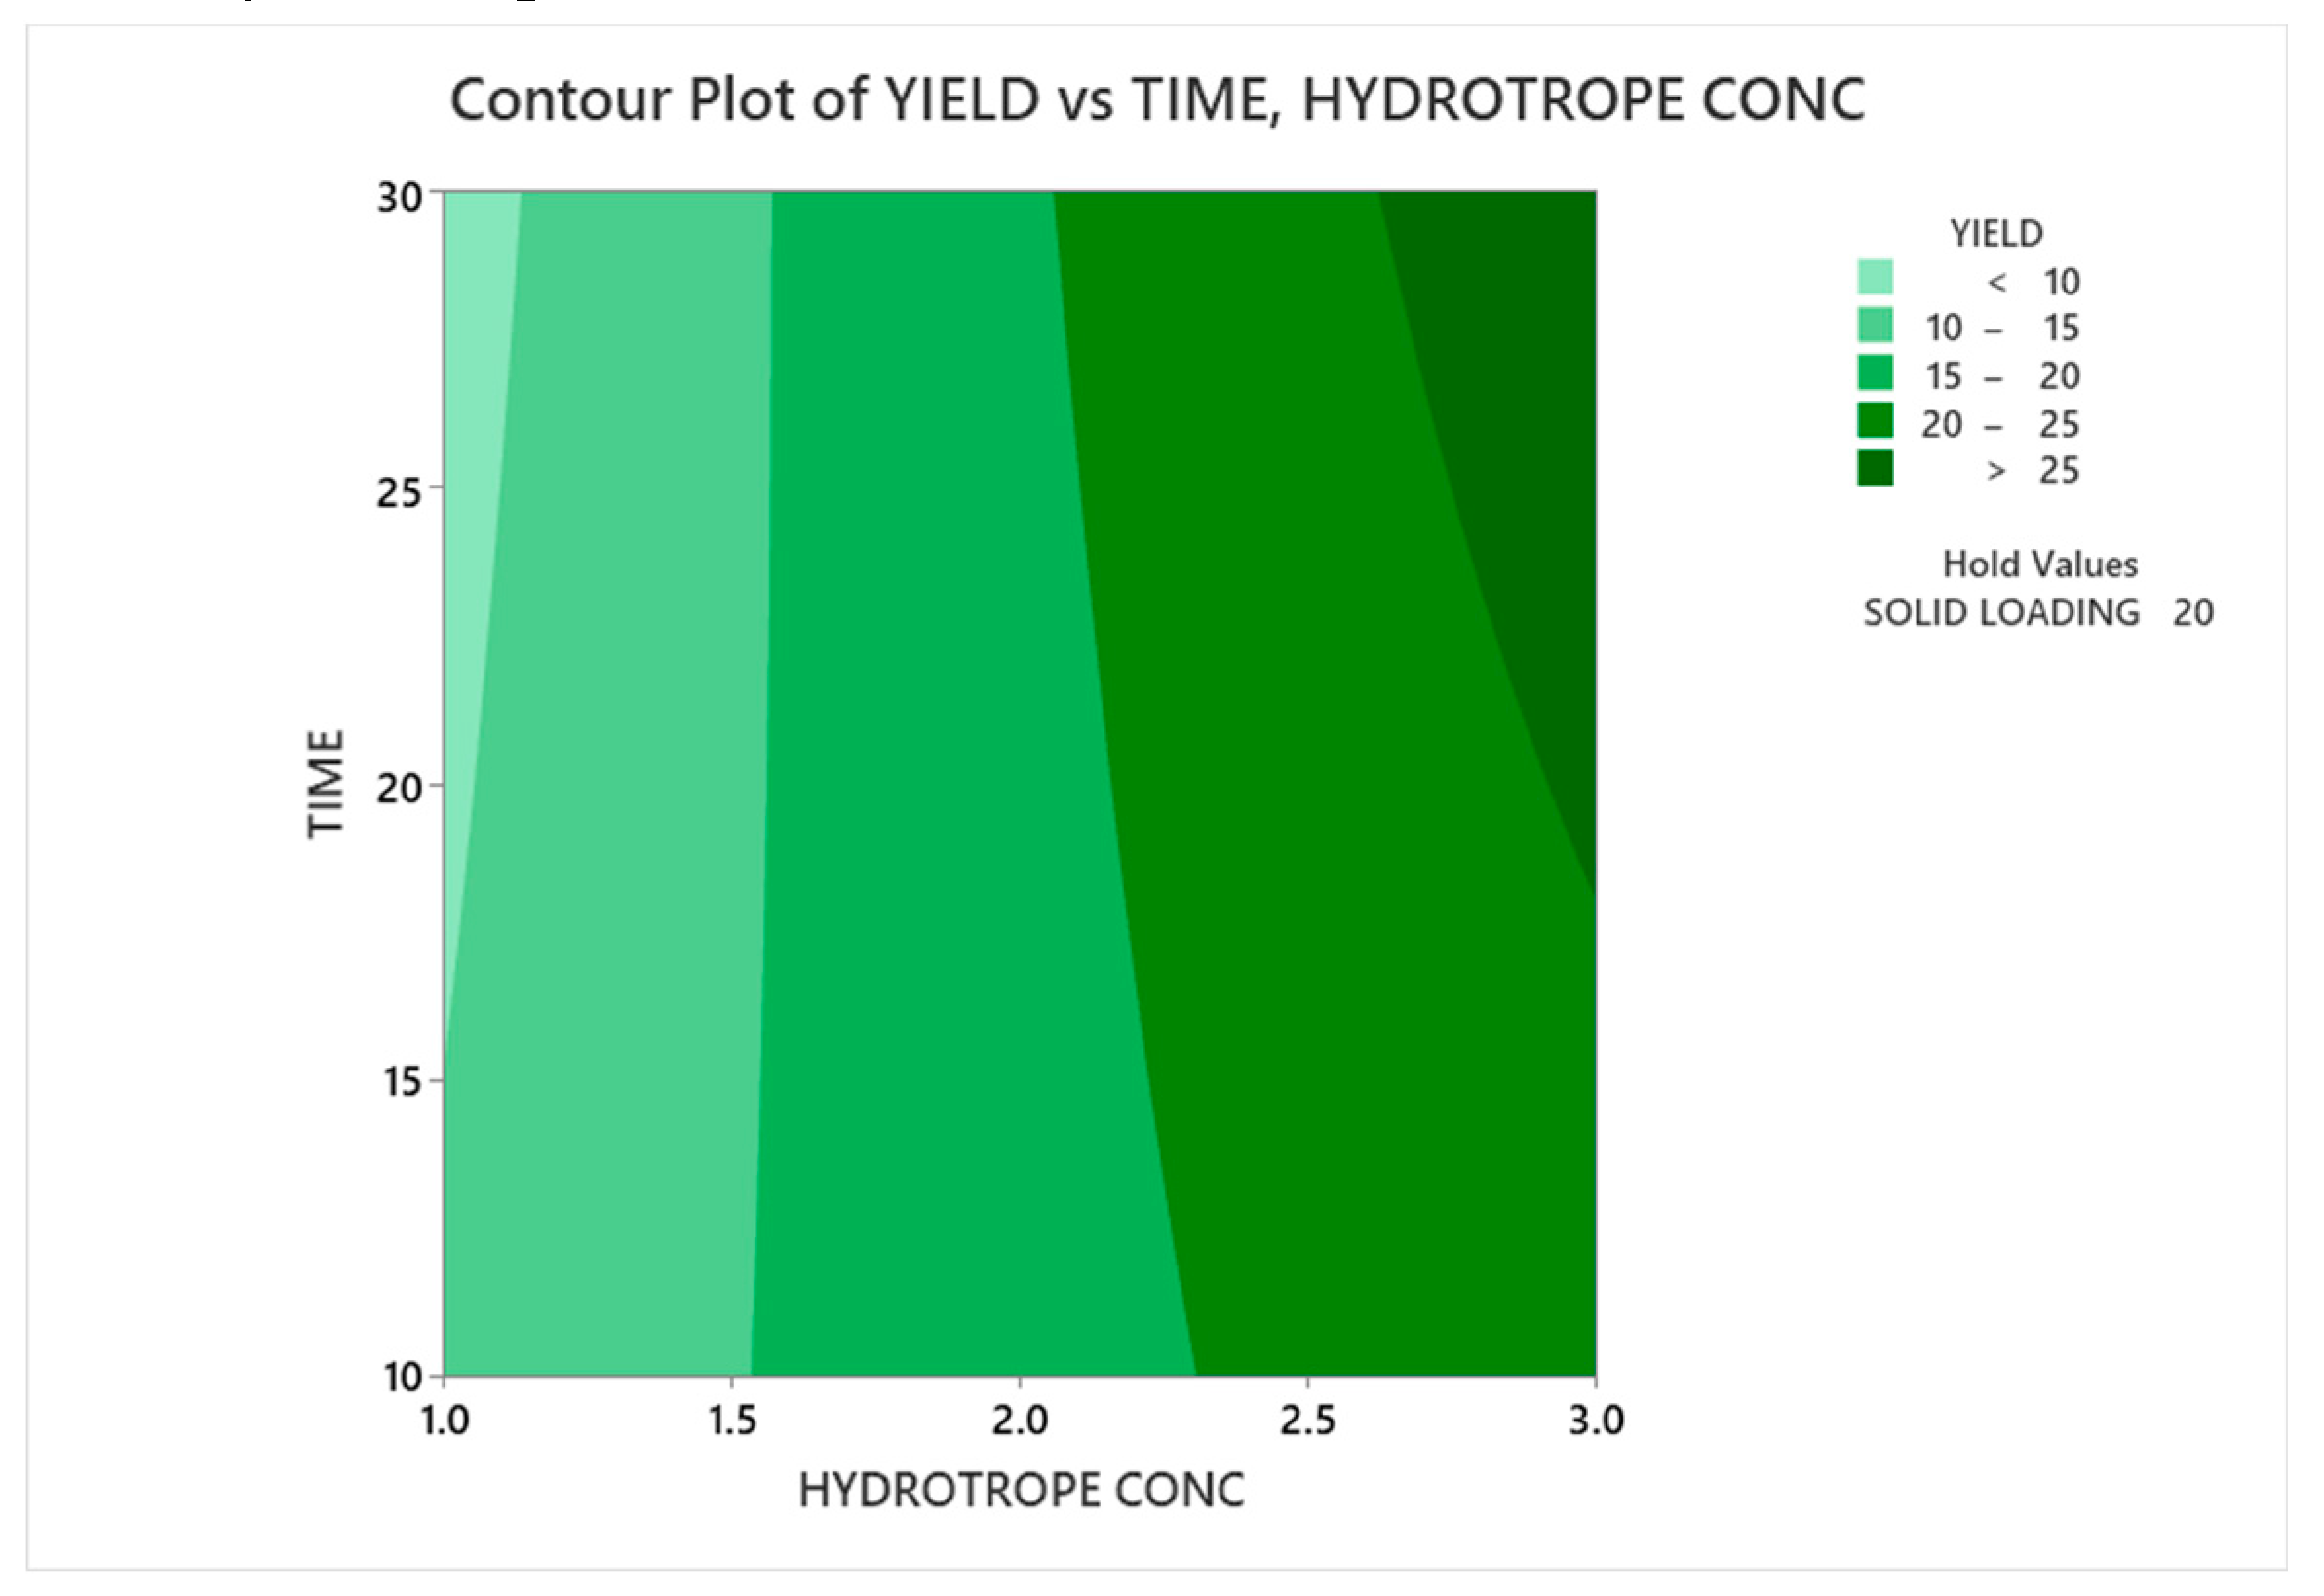
Contour plots showing the effects of extraction parameters on the quercetin yield are given below. The darker green regions in the respective graph indicates the optimum range of parameters to get a higher yield.
(I) Yield vs Time, Hydrotrope concentration
Figure 3.6.
Effect of Yield vs Time, Hydrotrope concentration.
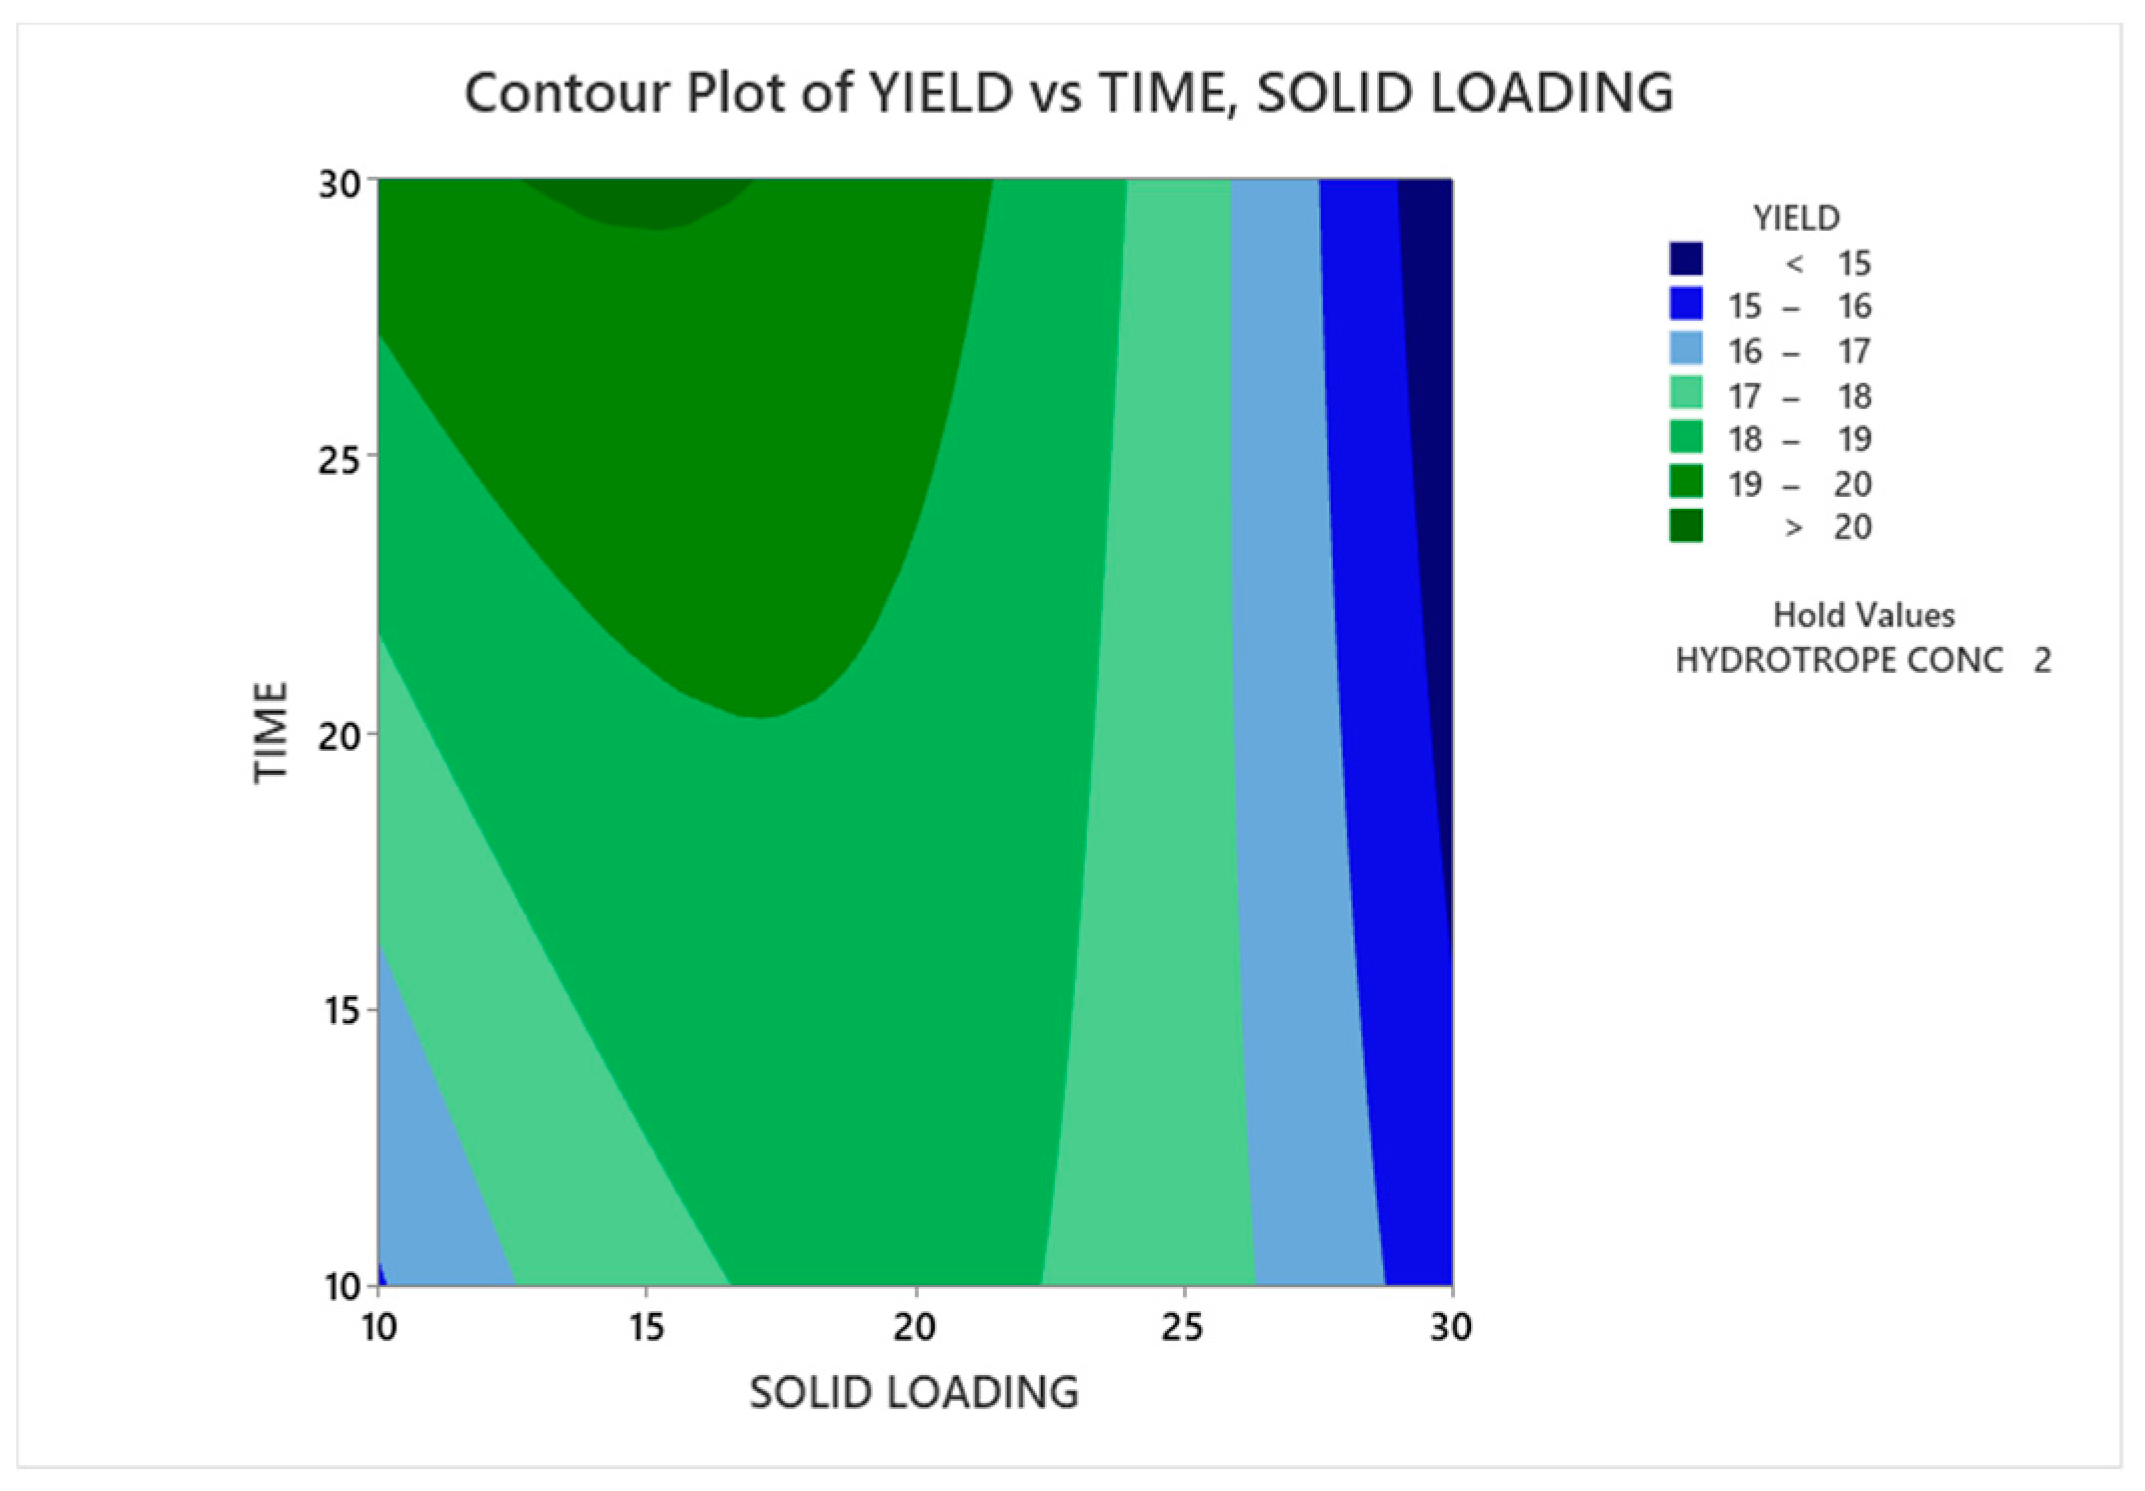
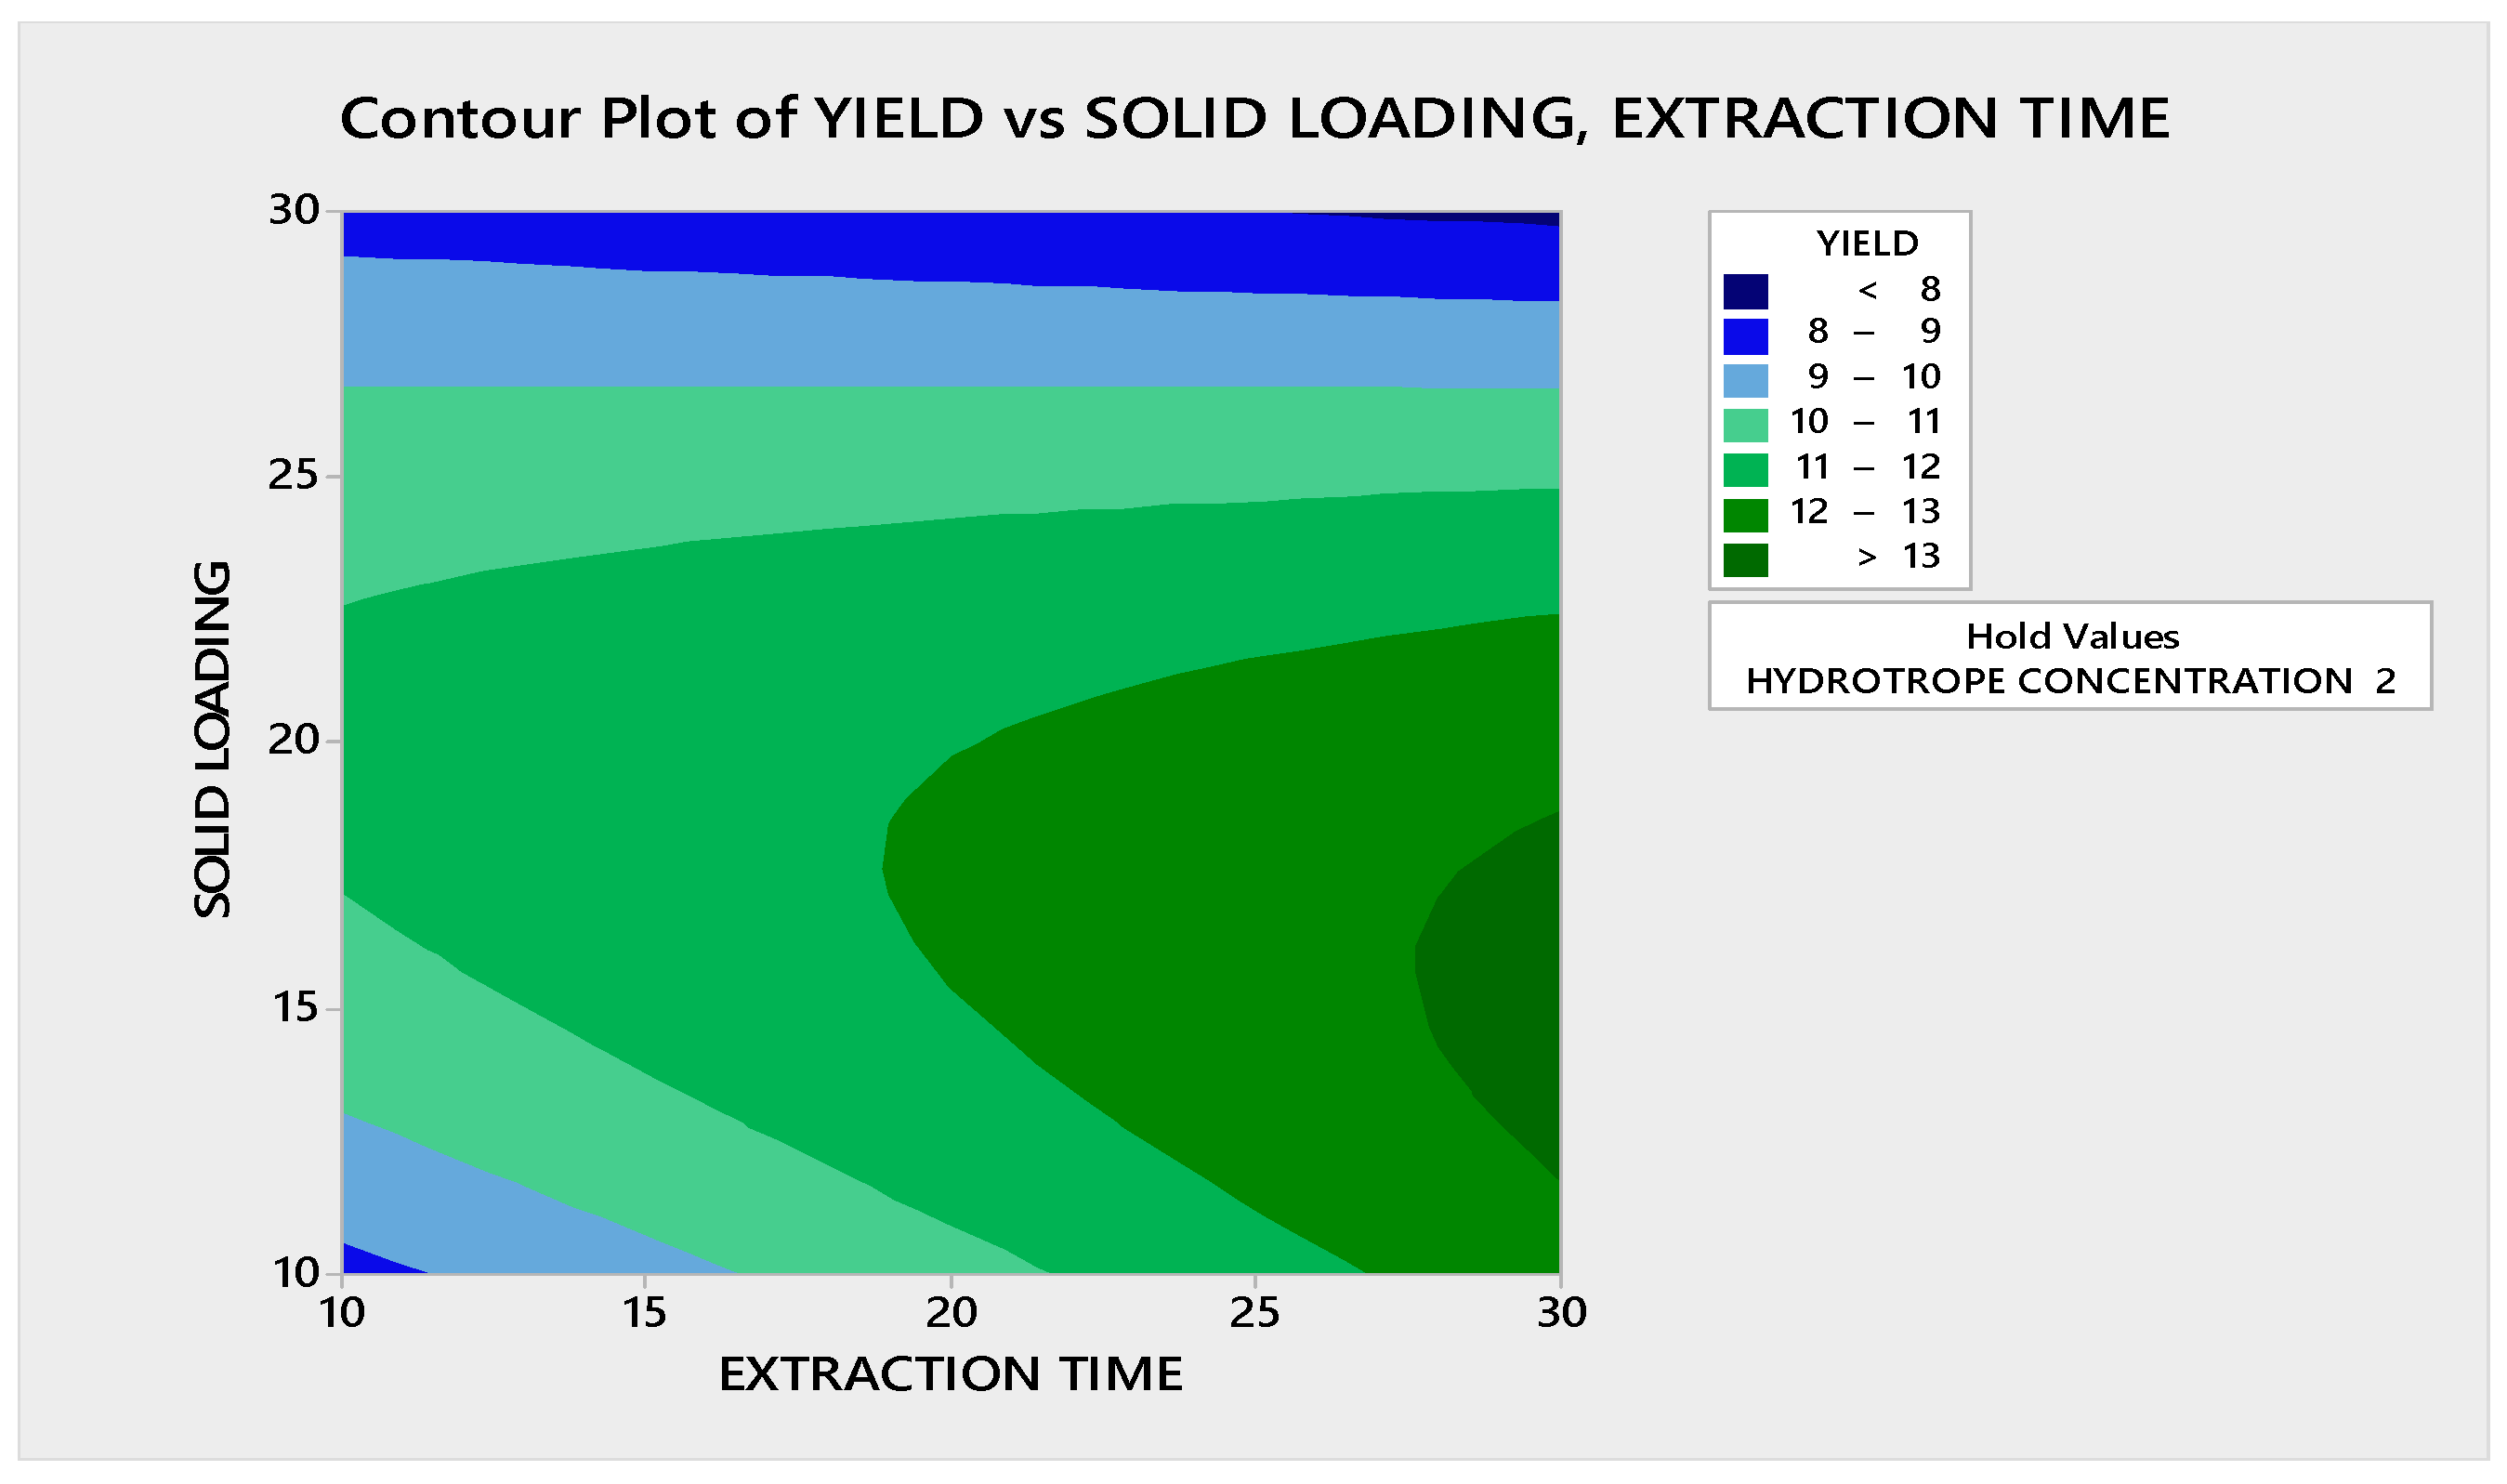
(II) Yield vs Time, Solid Loading
Figure 3.7.
Effect of Yield vs Time, Solid Loading.
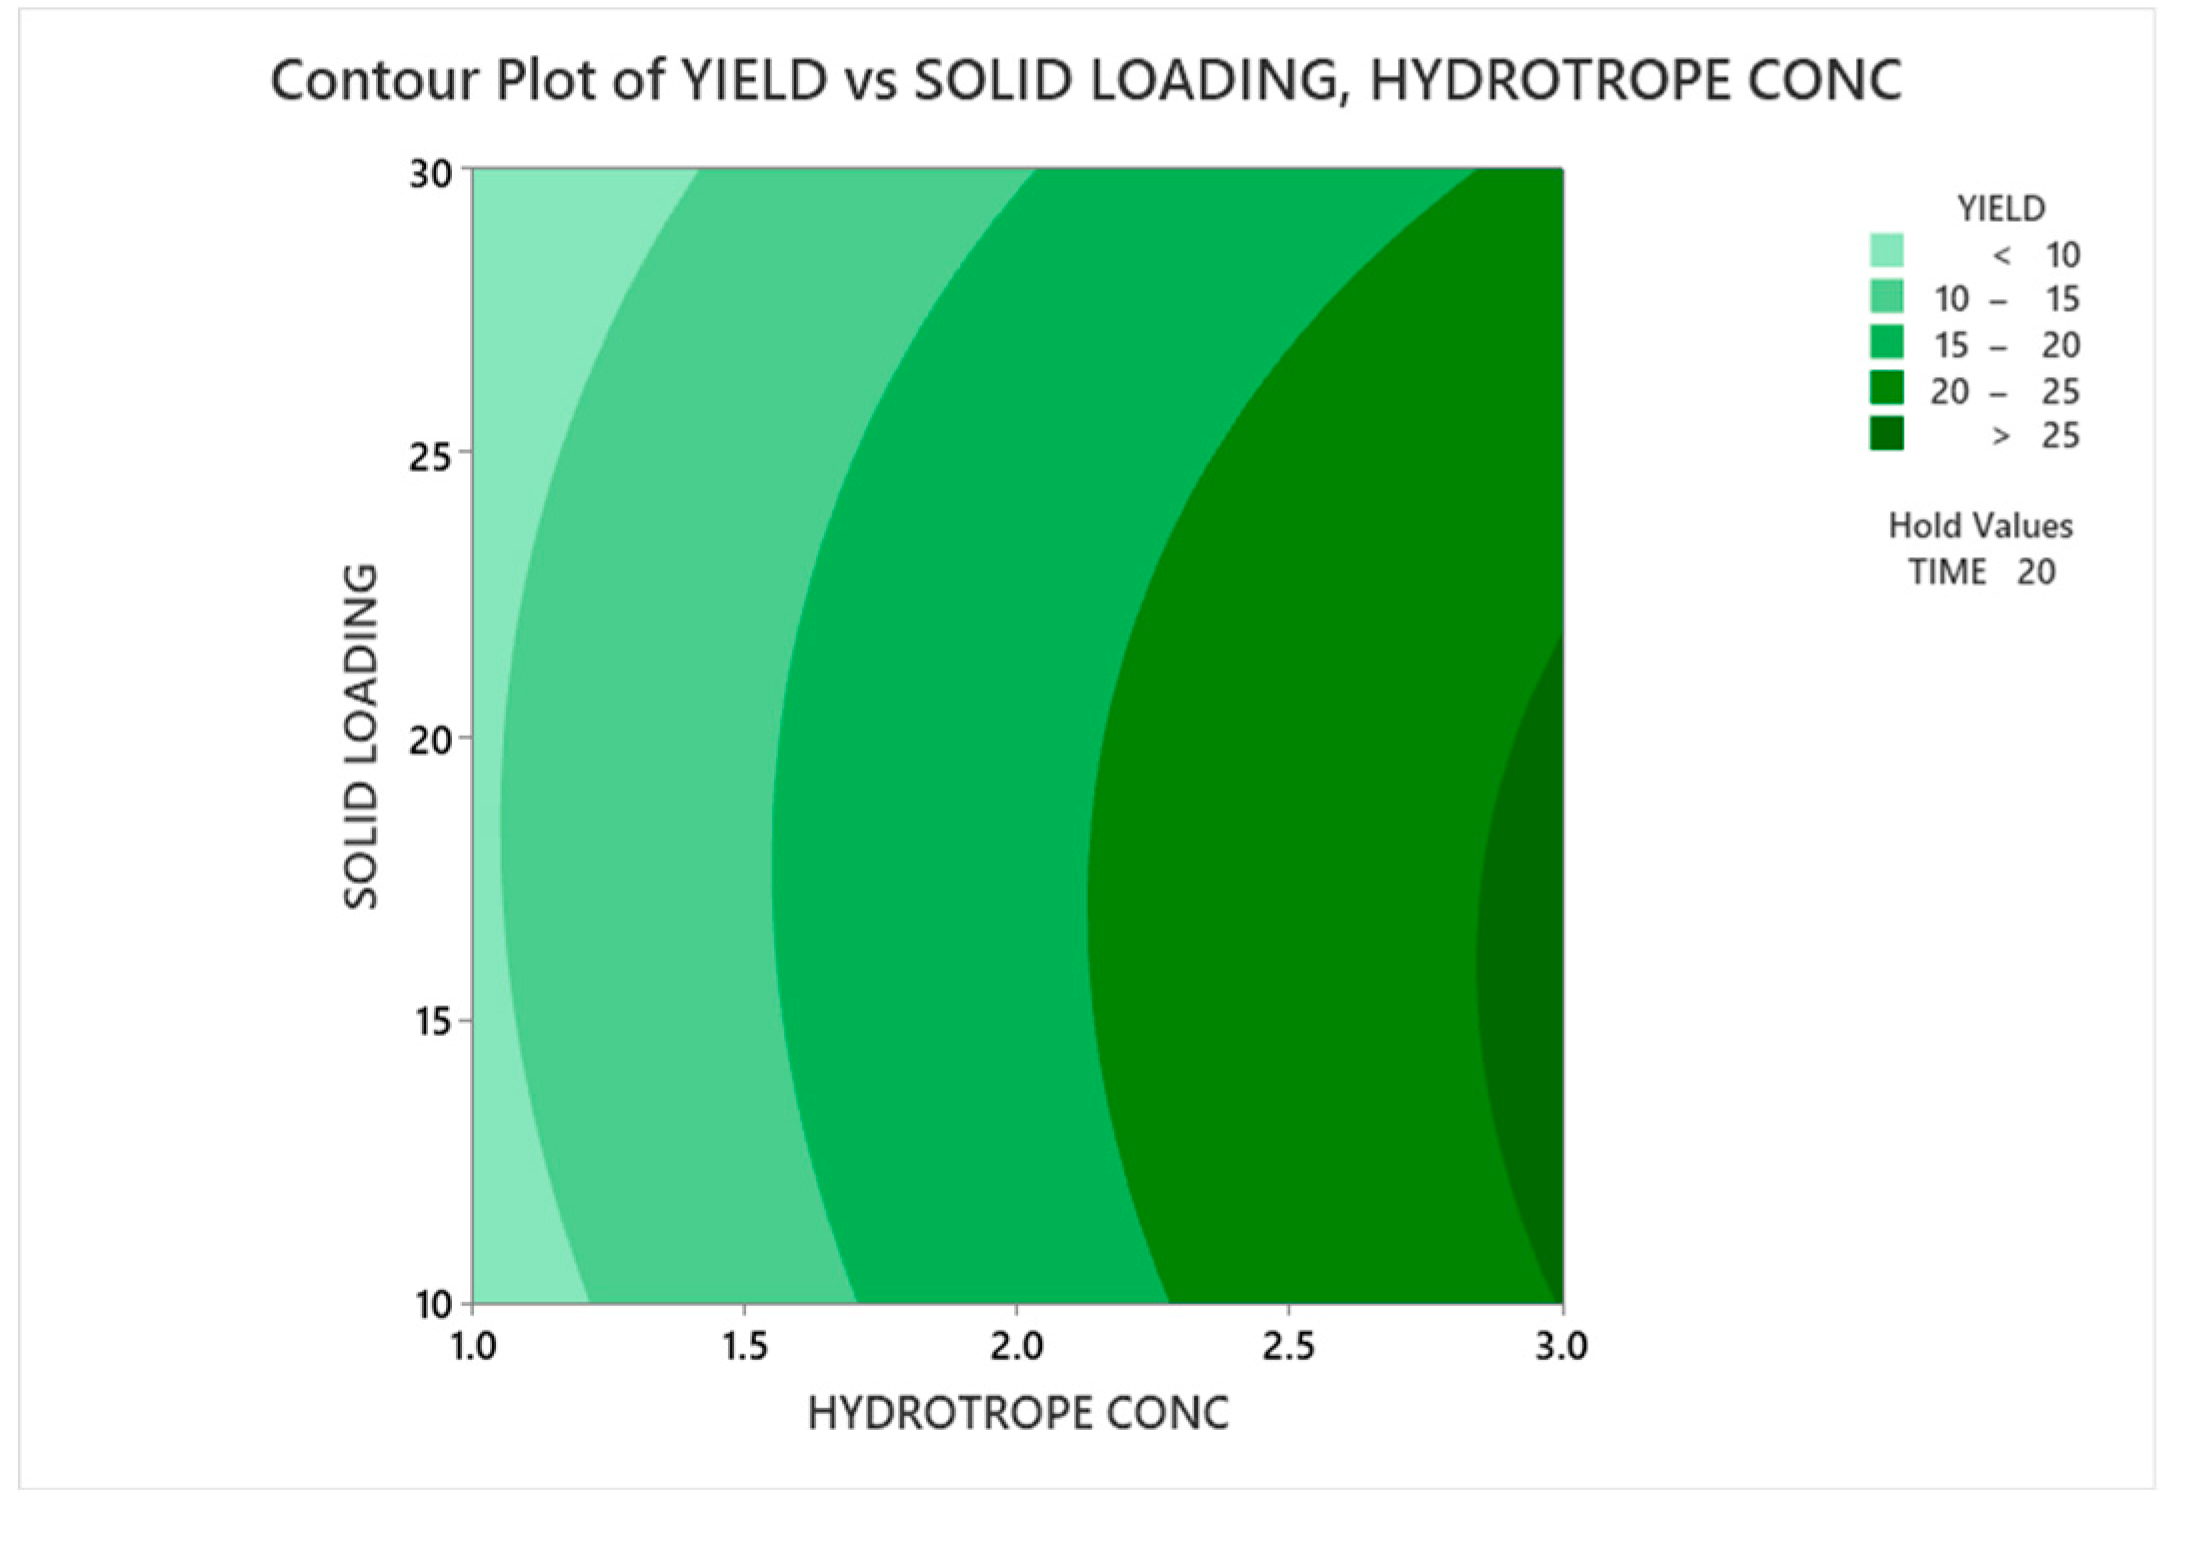
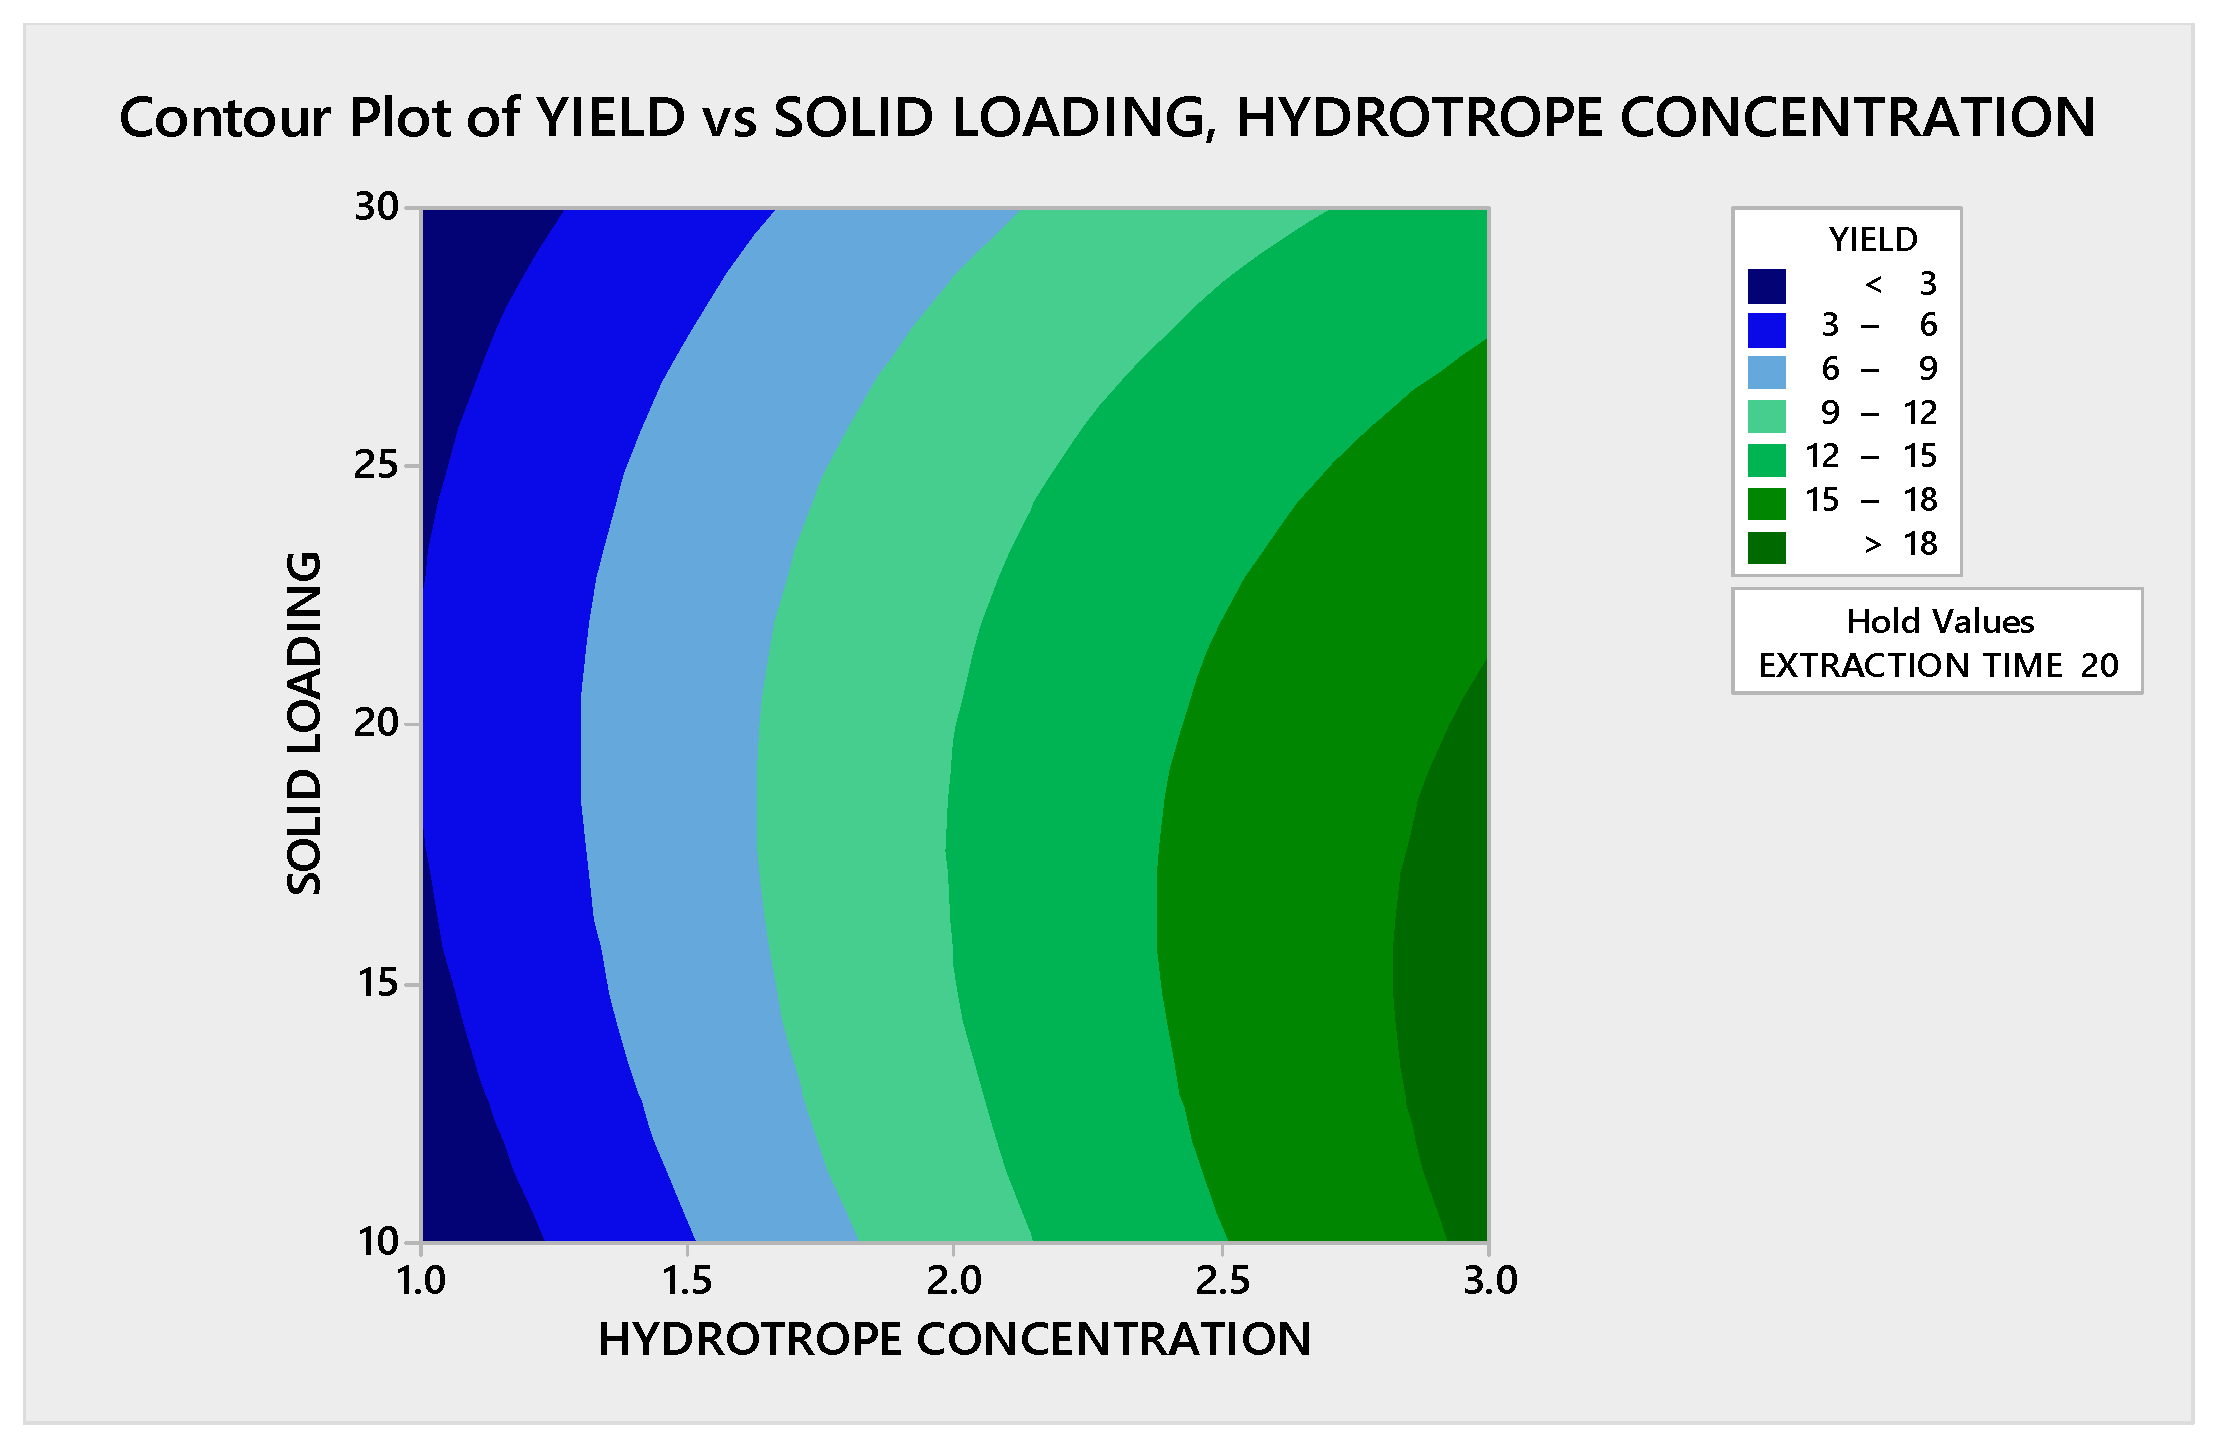
(III) Yield vs Solid Loading, Hydrotrope concentration
Figure 3.8.
Effect of Yield vs Solid Loading, Hydrotrope Concentration.
3.3.1.2. Response Surface Plot Analysis
The RSM plot shows the combined effects of extraction parameters on quercetin yield. Figure 2 shows the effect of hydrotrope concentration and time against quercetin yield with solid loading kept at a constant of 20% w/v. From Figure 3.9, it can be inferred that as hydrotrope concentration is increased, yield increases. Also, when time is increased, yield also increases.
Figure 4.9.
Effect of Hydrotrope concentration, time vs quercetin yield.
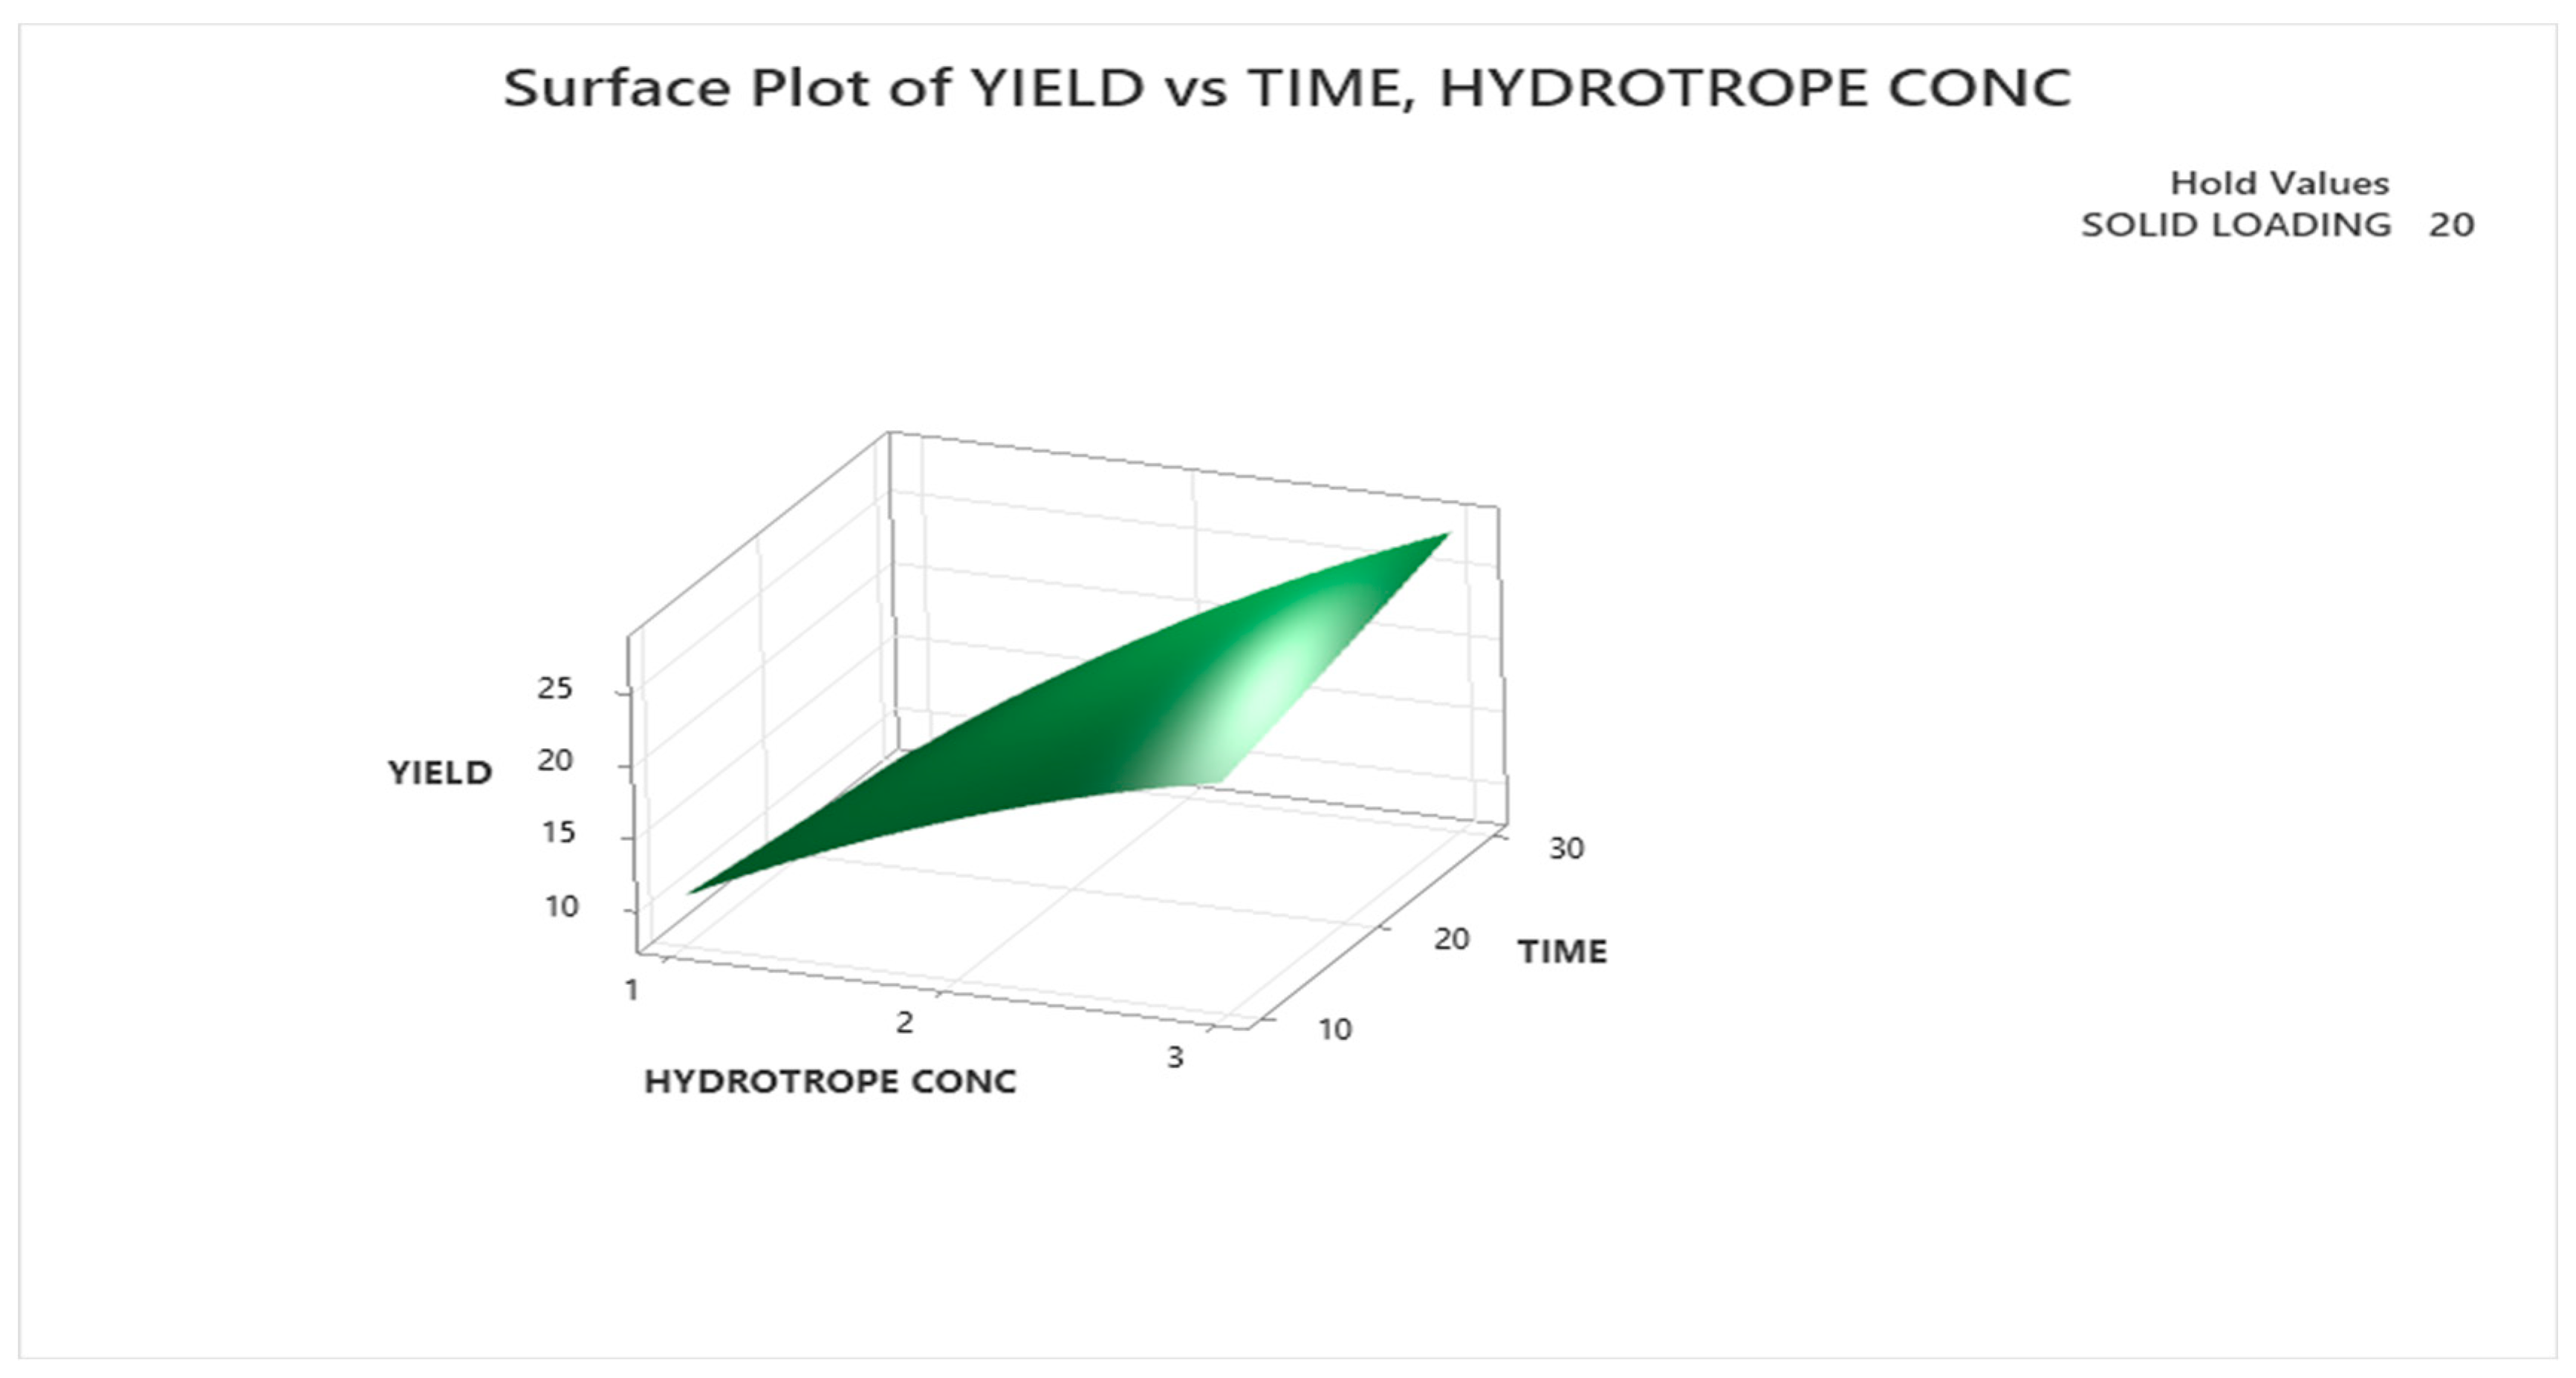
Figure 4.10 shows the effect of time and solid loading against quercetin yield with hydrotrope concentration at constant value of 2 mol. Figure 3 depicts that initially when solid loading is increased, yield also increases but for solid loading beyond 20% w/v, decrease in yield can been seen. This decrease in yield is possibly due to high liquid–solid ratio and paste-like formation.
Figure 3.10.
Effect of solid loading, time vs quercetin yield.
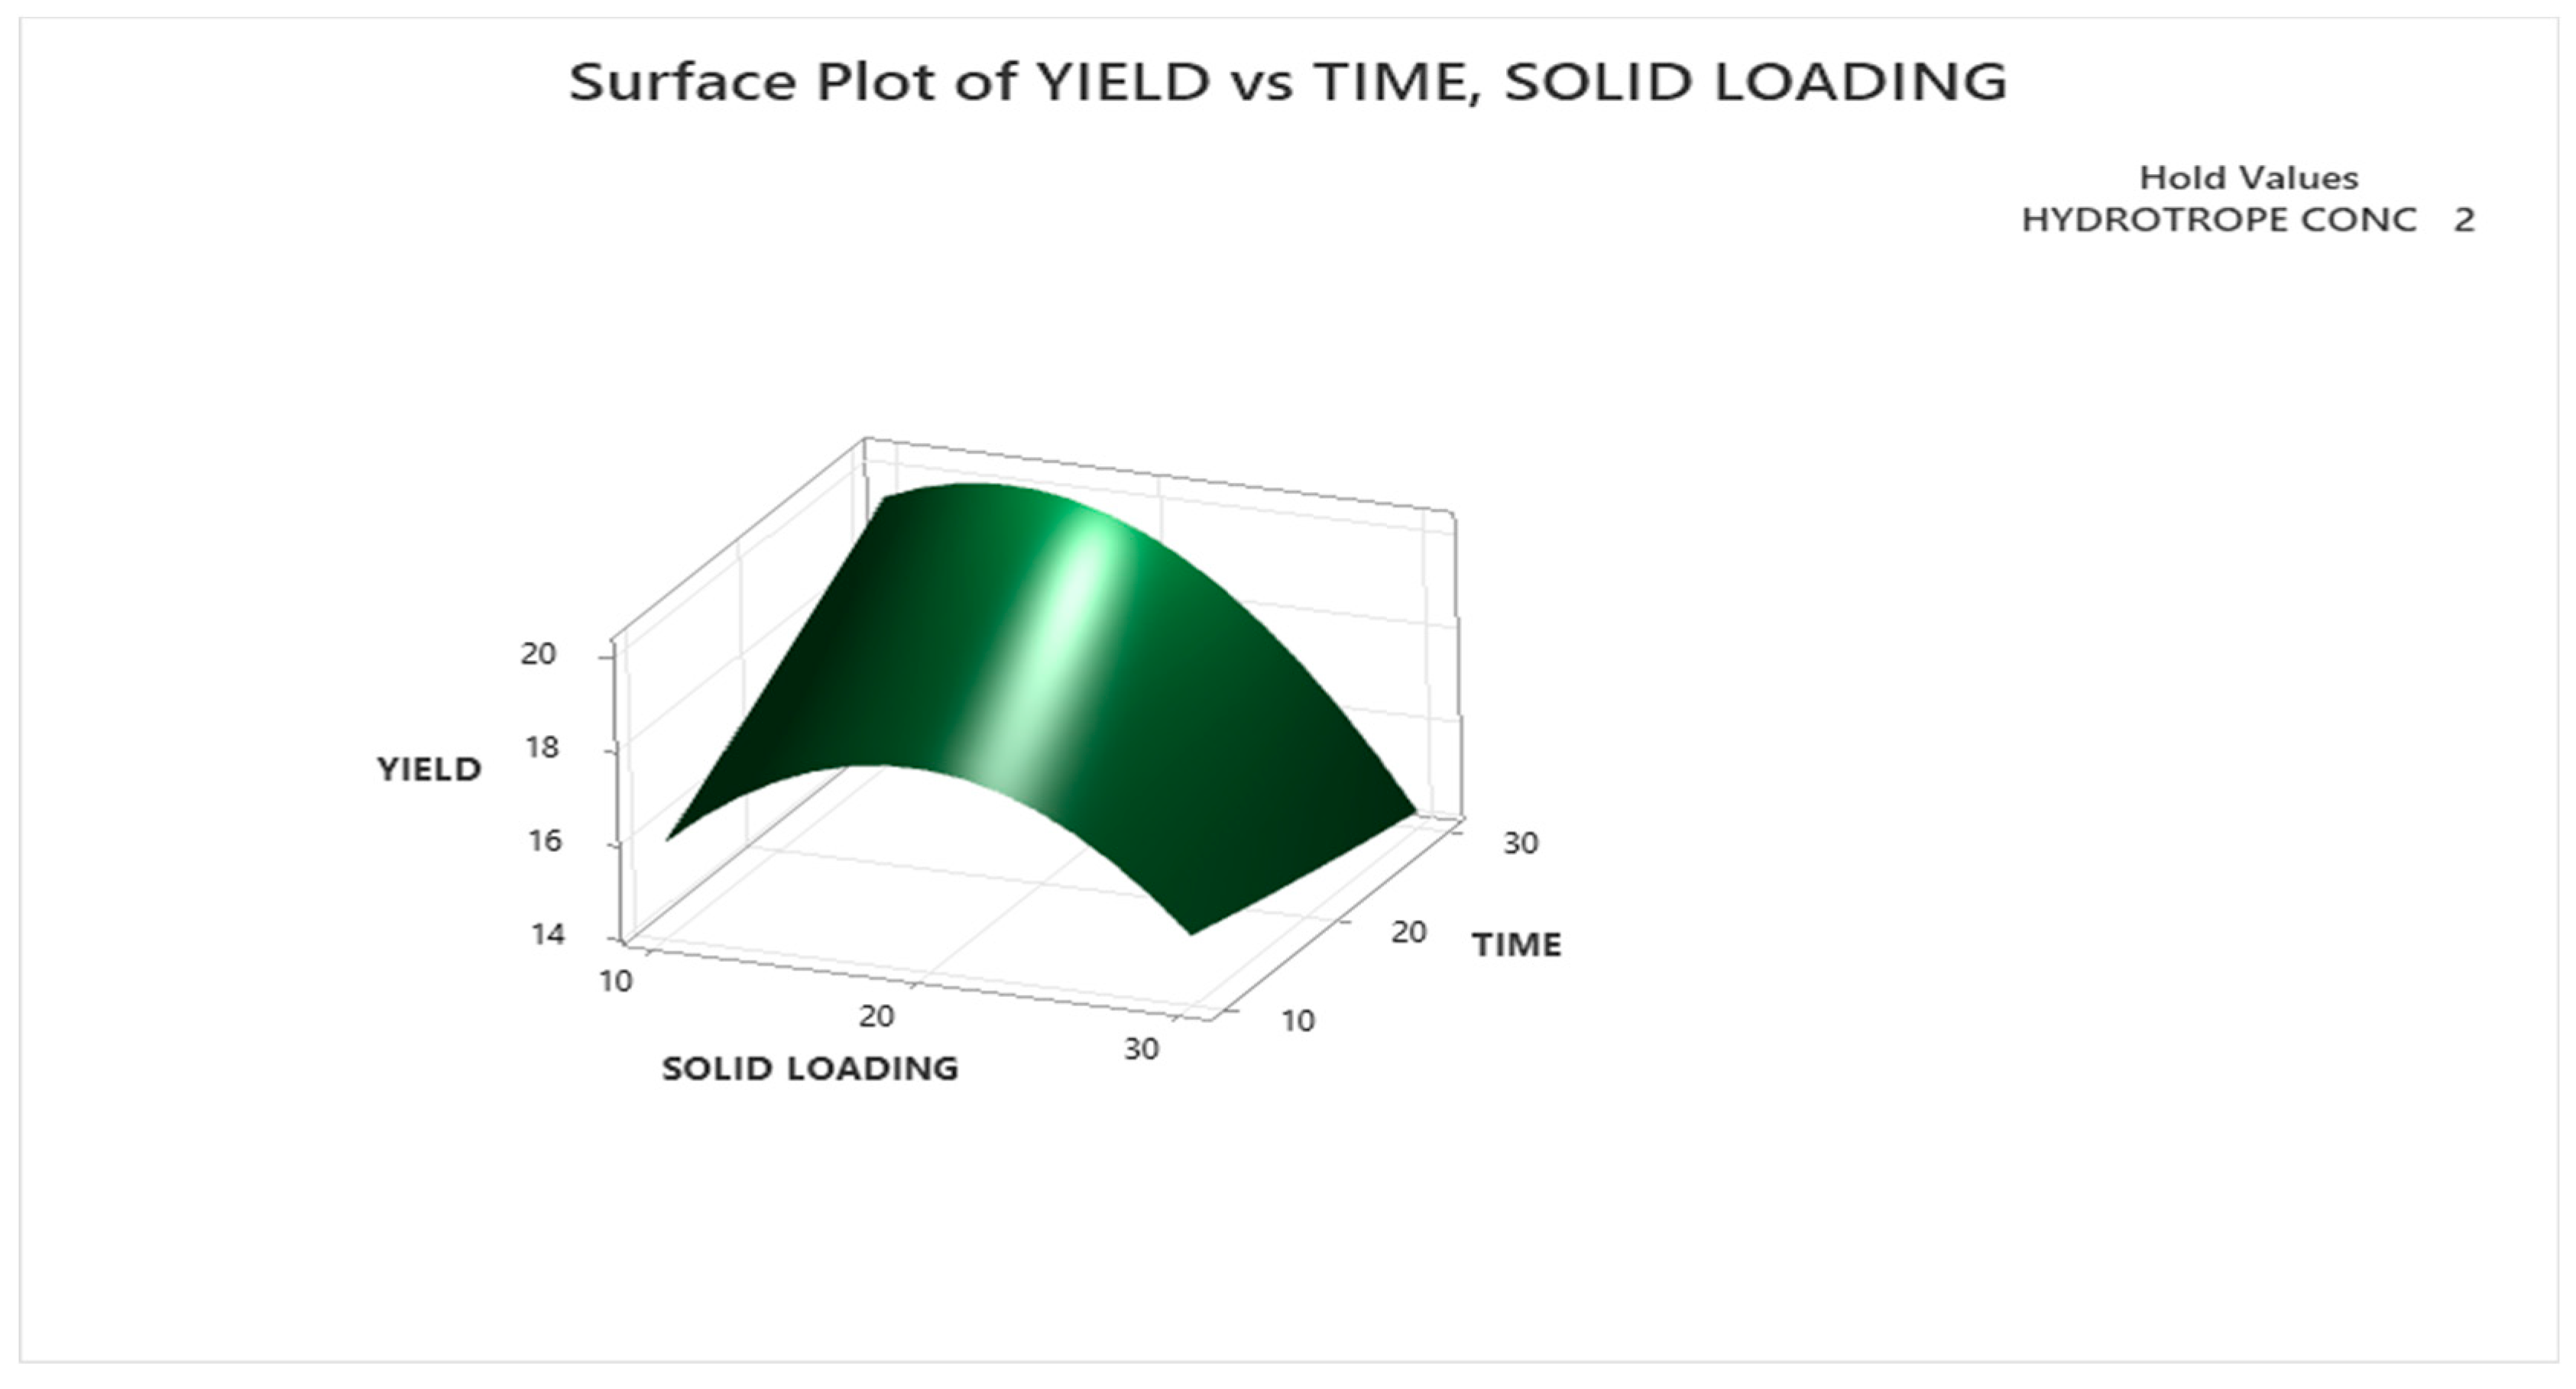
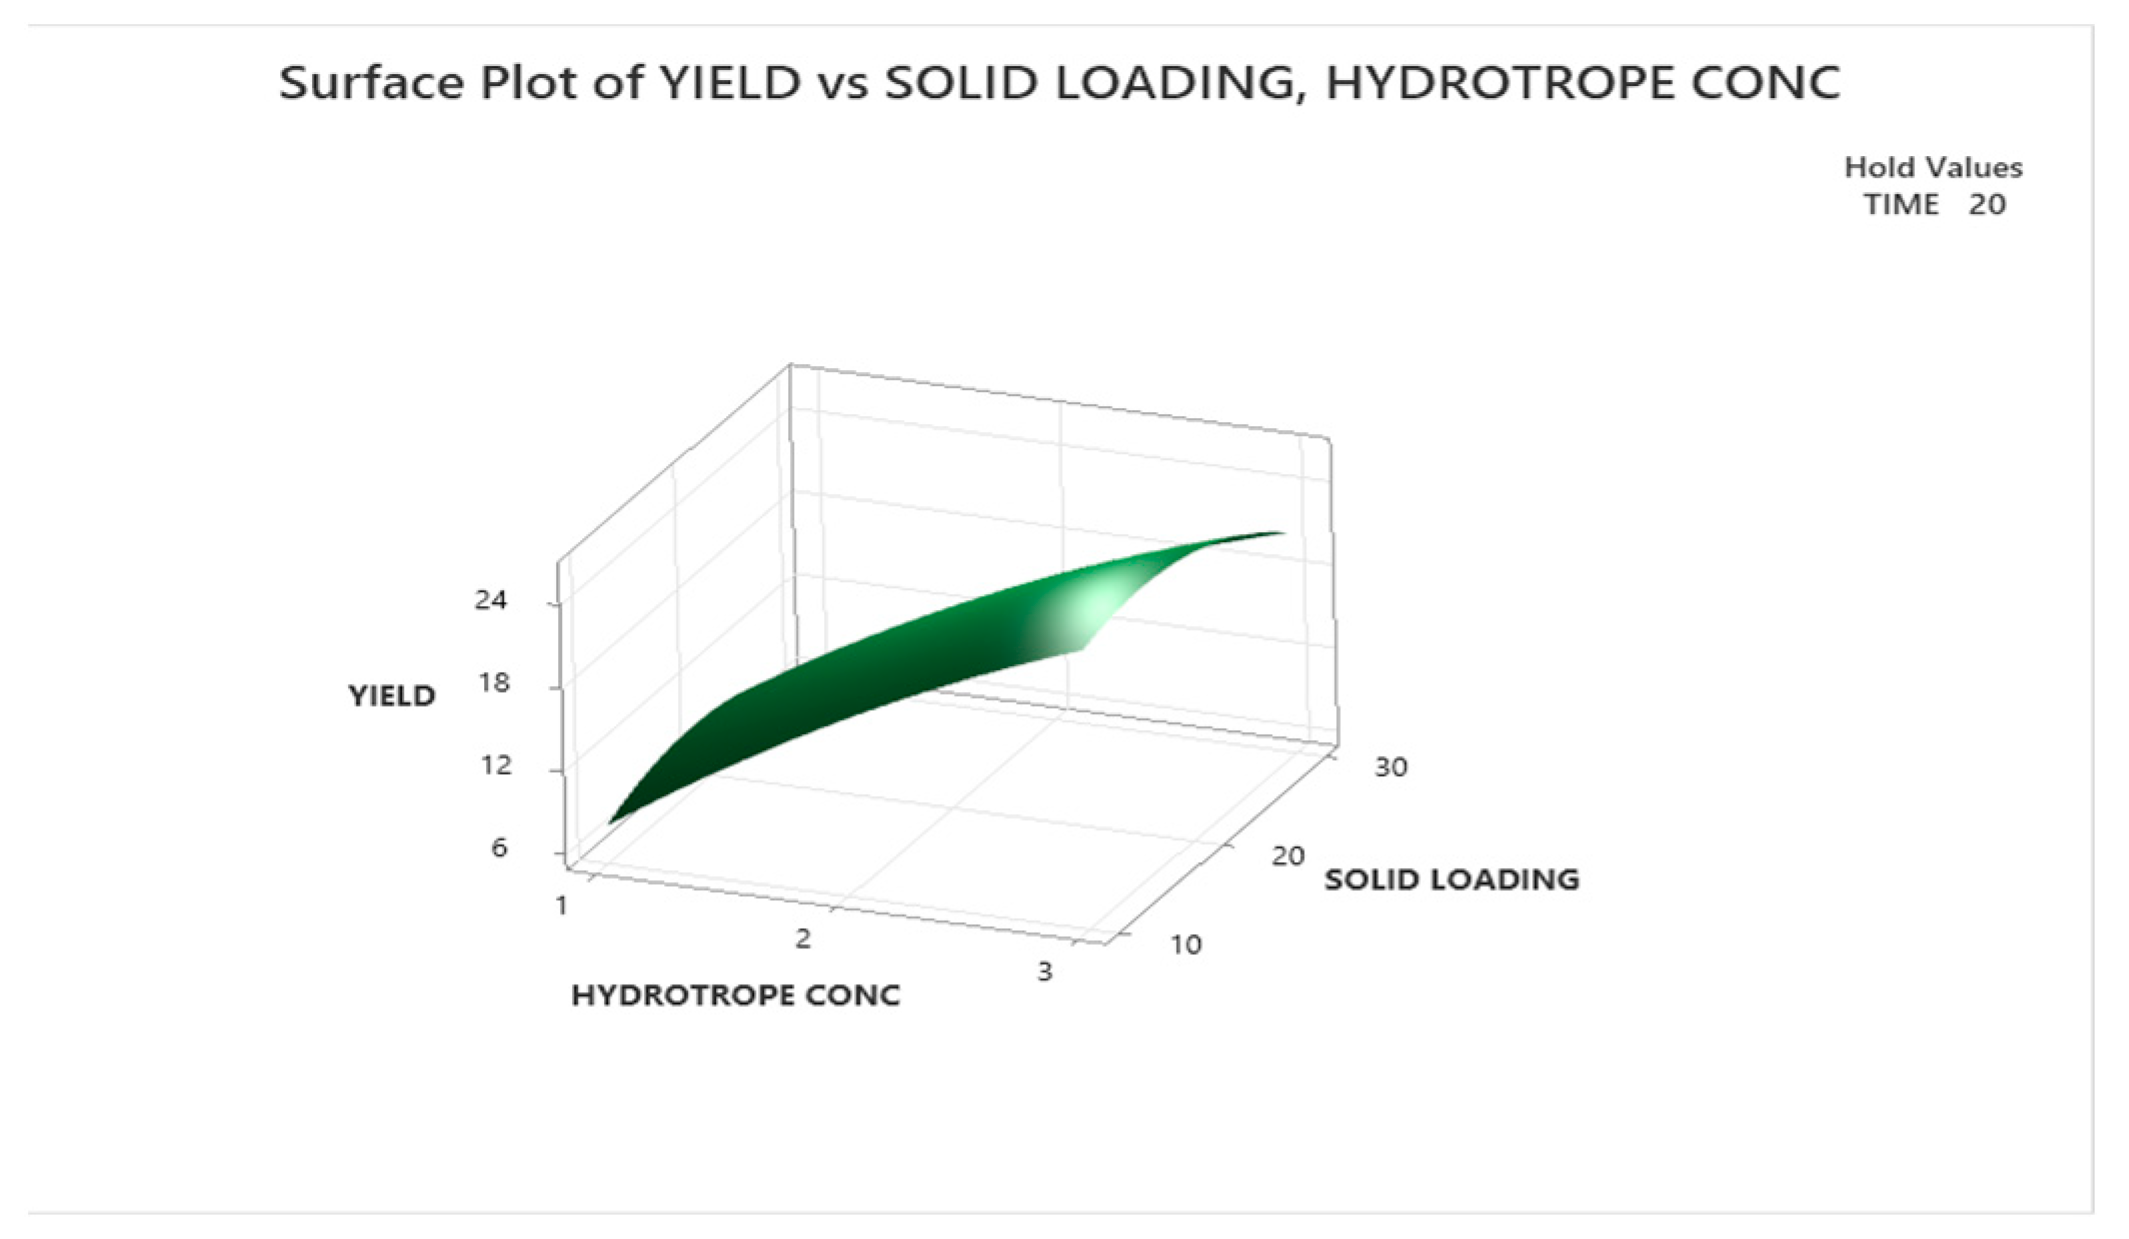
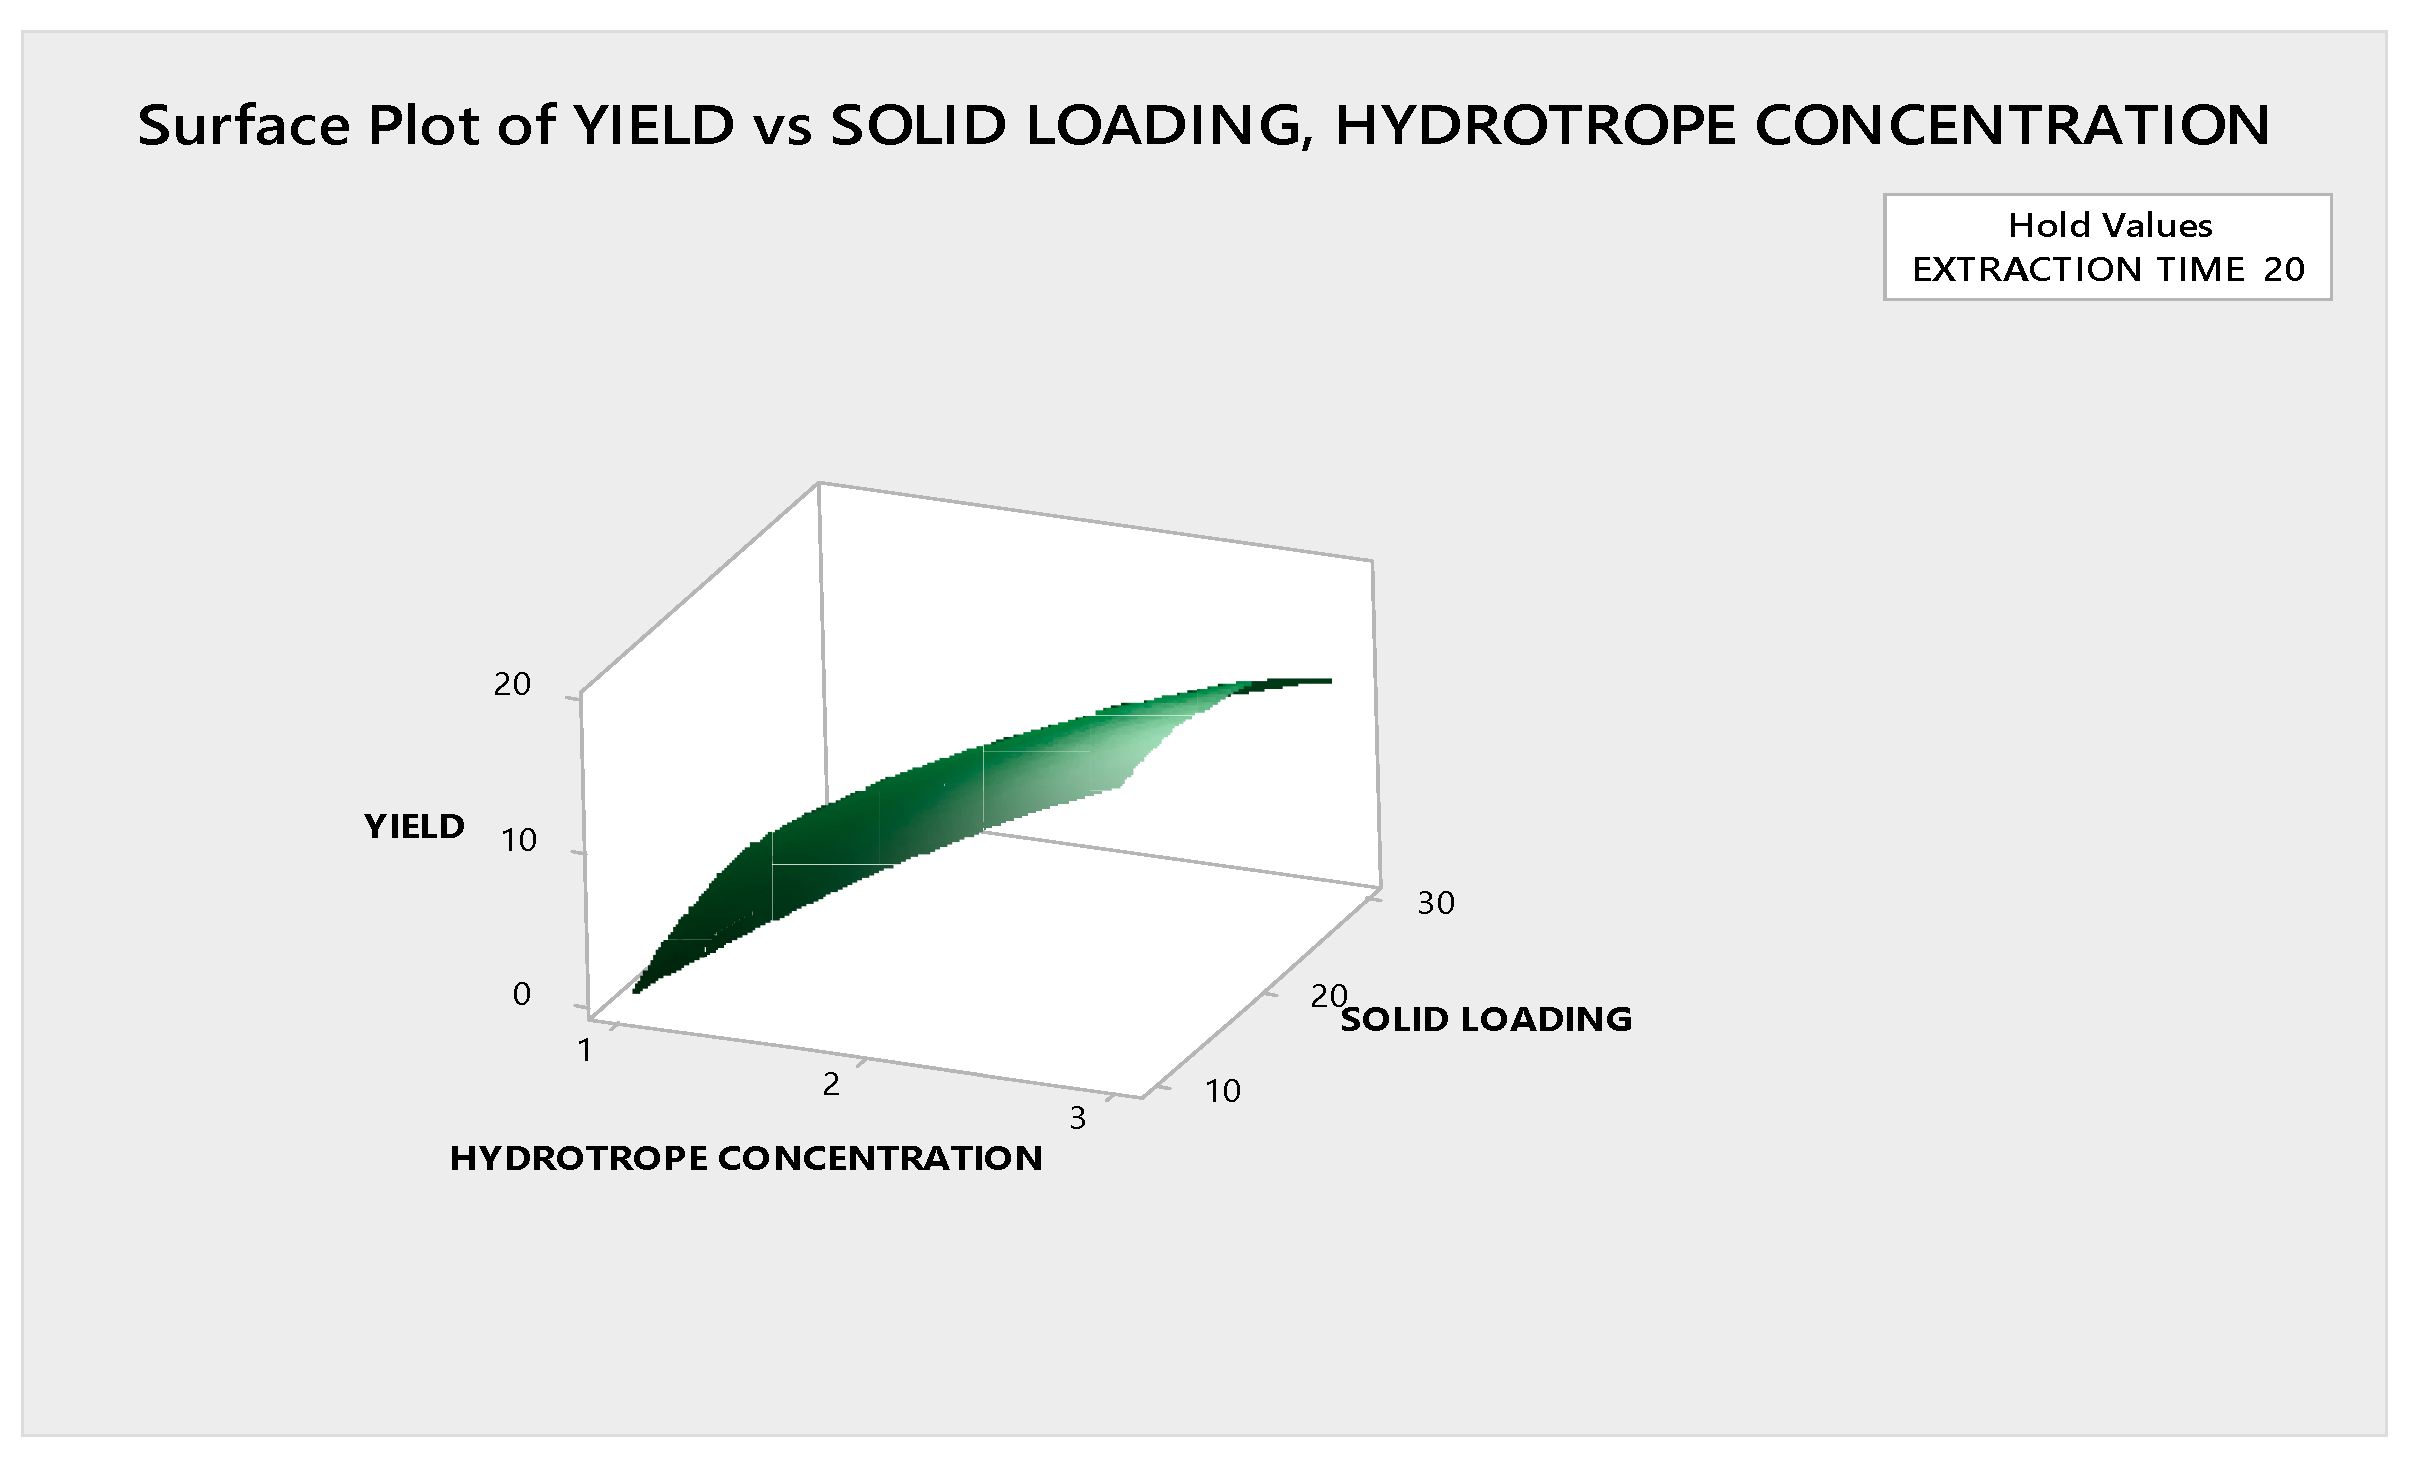
Figure 3.11 shows the effect of hydrotrope concentration, solid loading against quercetin yield with time as a constant at 20 min. Figure 4 depicts that with increase in hydrotrope concentration, yield increases and with increase in solid loading, yield increases initially but then gradually decreases.
Figure 3.11.
Effect of Hydrotrope concentration, solid loading vs quercetin yield.
3.3.2. Optimization with Urea as Hydrotrope
Here, RSM model has been used to study relation between yield of quercetin and extraction parameters such as hydrotrope concentration(X1), extraction time(X2) and solid loading(X3) with Urea as hydrotrope. Table 1 specifies the extraction parameters and operating ranges considered.
Table 3.6.
Extraction parameters for RSM (Urea).
| Extraction Parameters | Operating Ranges | |
|---|---|---|
| Lowest | Highest | |
| X1 - Hydrotrope concentration (mol) | 1 | 3 |
| X2 -Extraction Time (min) | 10 | 30 |
| X3 - Solid Loading (w/v) | 10 | 30 |
The selected parameters were optimized using Box-Behnken design in Minitab software. The BBD procedure of RSM resulted in a total of 15 randomized experiments. Based on 15 different extraction parameters, a total of 15 experiments were carried out by Ultrasound-Assisted Hydrotropic Extraction method. The obtained extract is analysed by UV-visible spectroscopy to determine the yield of quercetin.
Table 3.7.
Experimental Design and yield of quercetin extracted with Urea as hydrotrope.
| Run | Hydrotrope Concentration (mol) |
Extraction time (min) |
Solid Loading (% w/v) |
Yield (µg/g) |
|---|---|---|---|---|
| 1 | 2 | 30 | 30 | 9.6 |
| 2 | 3 | 20 | 30 | 12.5 |
| 3 | 1 | 10 | 20 | 4.5 |
| 4 | 2 | 10 | 30 | 7.8 |
| 5 | 3 | 20 | 10 | 18.8 |
| 6 | 2 | 20 | 20 | 11.9 |
| 7 | 3 | 10 | 20 | 18 |
| 8 | 2 | 20 | 20 | 12 |
| 9 | 3 | 30 | 20 | 19.2 |
| 10 | 2 | 20 | 20 | 12 |
| 11 | 1 | 30 | 20 | 1.2 |
| 12 | 2 | 10 | 10 | 6.9 |
| 13 | 1 | 20 | 10 | 1.07 |
| 14 | 1 | 20 | 30 | 0.43 |
| 15 | 2 | 30 | 10 | 13.4 |
The mathematical model representing the yield of quercetin as a function of independent variables such as hydrotrope concentration, extraction time and solid loading within the region under investigation is expressed by following equation:
YIELD = -23.41 + 13.18 X1 + 0.091 X2 + 1.408 X3 - 1.233 X12 - 0.00008 X22 - 0.02533 X32+ 0.1125 X1*X2- 0.1415 X1*X3- 0.01175 X2*X3 Eqn (1)
It is obvious from equation 1 that the quercetin yield highly depends on the hydrotrope concentration followed further by extraction time and then by solid loading. The prediction of quercetin yield using equation 1 has been compared with the experimental values as shown in Figure 1. It can be ascertained from the figure that the model equation predictions satisfactorily match the experimental values.
Figure 3.12.
Predicted vs Actual Values.
The Analysis of Variance (ANOVA) to determine the statistical significance of the model equation was evaluated and the results are presented in Table 3.
Table 3.8.
Analysis of Variance for quadratic model (Urea).
| Analysis of Variance (ANOVA) | |||||
| Source | DF | Adj SS | Adj MS | F-Value | P-Value |
| Model | 9 | 533.169 | 59.241 | 18.60 | 0.002 |
| Linear | 3 | 486.619 | 162.206 | 50.92 | 0.000 |
| Hydrotrope Concentration | 1 | 469.711 | 469.711 | 147.45 | 0.000 |
| Time | 1 | 4.805 | 4.805 | 1.51 | 0.274 |
| Solid Loading | 1 | 12.103 | 12.103 | 3.80 | 0.109 |
| Square | 3 | 27.956 | 9.319 | 2.93 | 0.139 |
| A2 | 1 | 5.616 | 5.616 | 1.76 | 0.242 |
| B2 | 1 | 0.000 | 0.000 | 0.00 | 0.993 |
| C2 | 1 | 23.696 | 23.696 | 7.44 | 0.041 |
| 2-Way Interaction | 3 | 18.594 | 6.198 | 1.95 | 0.241 |
| AB | 1 | 5.062 | 5.062 | 1.59 | 0.263 |
| AC | 1 | 8.009 | 8.009 | 2.51 | 0.174 |
| BC | 1 | 5.522 | 5.522 | 1.73 | 0.245 |
| Error | 5 | 15.920 | 3.106 | ||
| Lack-of-Fit | 2 | 15.921 | 5.207 | 1592.15 | 0.088 |
| Pure Error | 2 | 0.007 | 0.003 | ||
| Total | 14 | 549.097 | |||
The ANOVA of the regression model showed that the model is statistically significant (p = 0.002). The linear and quadratic term in the model were highly significant (p = 0.000). In the ANOVA chart if the lack of fit is mentioned as “not significant” then the model is said to be significant. Hence the model for extraction of quercetin is considered significant. The model adequacies were checked by R2. A higher value of R2 (0.97) shows that the predicted model suits the experimental behaviour of the system.
3.3.2.1. Contour Plot Analysis
Contour plots showing the effects of extraction parameters on the quercetin yield are given below. The darker green regions in the respective graph indicates the optimum range of parameters to get a higher yield.
Effect of Yield vs Extraction Time, Hydrotrope concentration
Figure 3.13.
Effect of yield vs extraction time, hydrotrope concentration.
Yield vs Solid loading, Hydrotrope concentration
Figure 3.14.
Effect of Yield vs Solid Loading, Hydrotrope concentration.
Effect of yield vs solid loading, extraction time
Figure 3.15.
Effect of Yield vs Solid Loading, Extraction time.
3.3.2.2. Response Surface Plot Analysis
The RSM plot shows the combined effects of extraction parameters on quercetin yield. Figure 3.16 shows the effect of hydrotrope concentration and time against quercetin yield with solid loading kept at a constant of 20% w/v. From Figure 2, it can be inferred that as hydrotrope concentration is increased, yield increases. Also, when time is increased, yield also increases.
Figure 3.16.
Effect of Hydrotrope concentration, time vs quercetin yield.
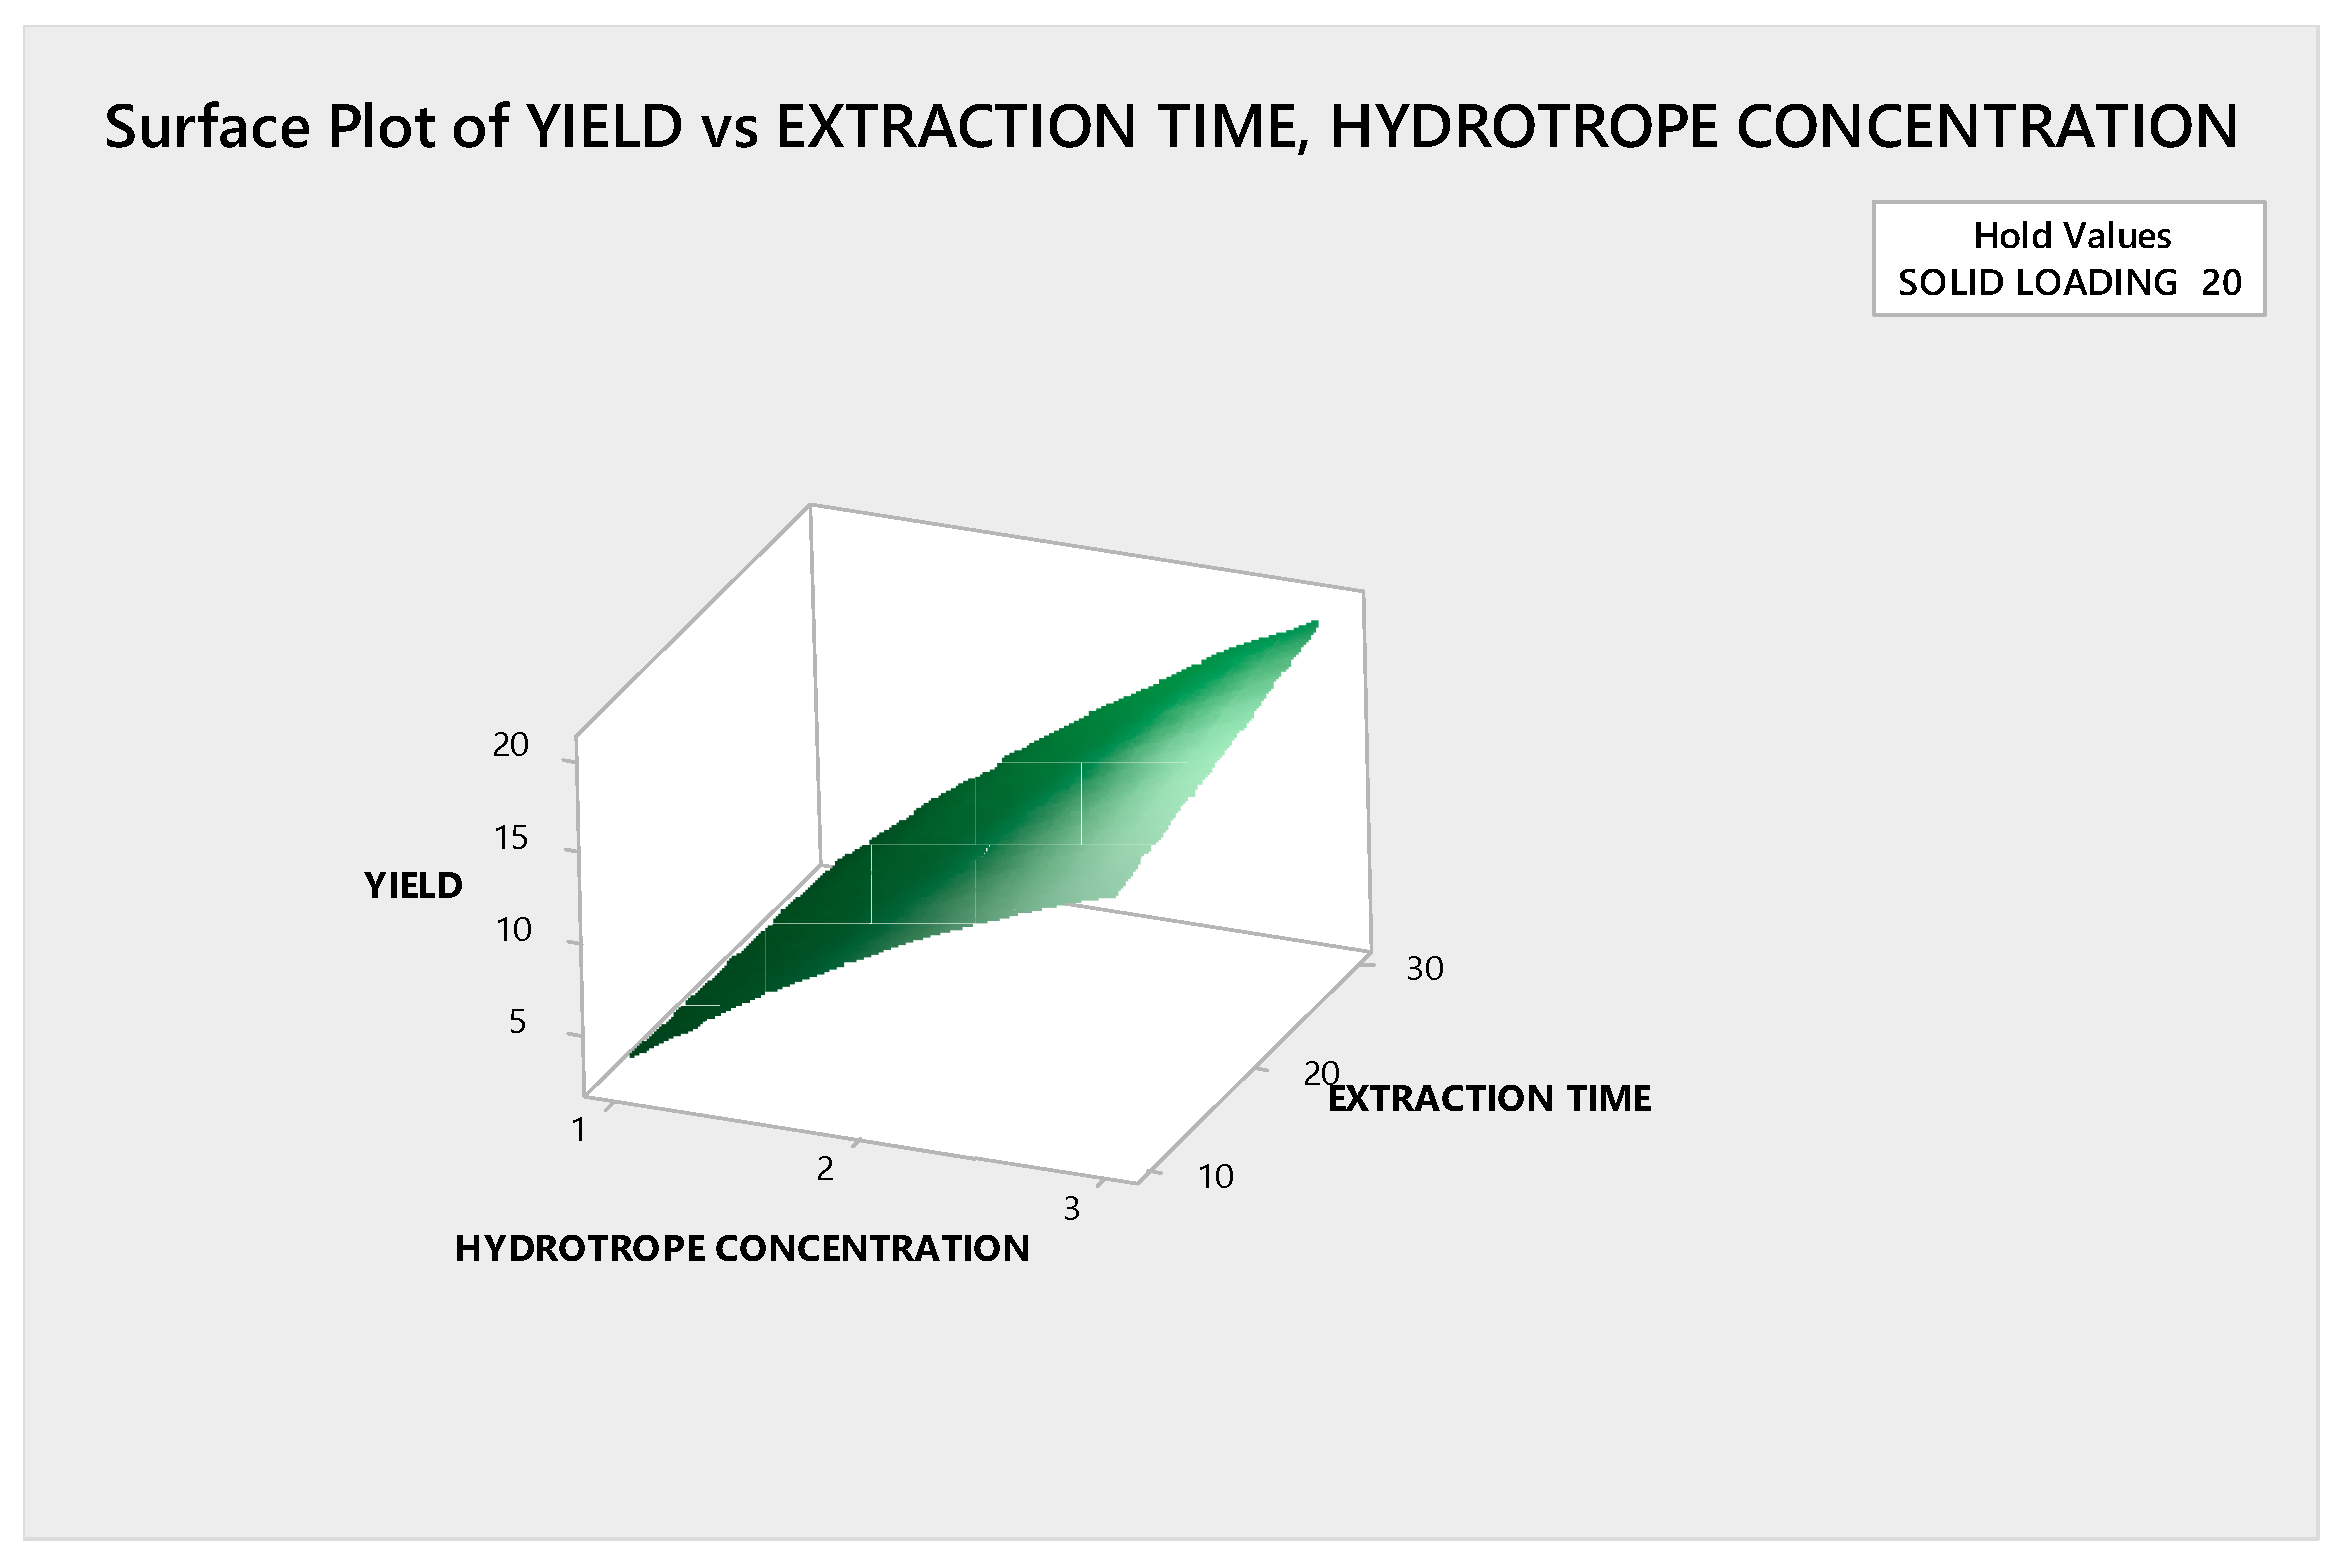
Figure 3.17 shows the effect of time and solid loading against quercetin yield with hydrotrope concentration at constant value of 2 mol. Figure 3 depicts that initially when solid loading is increased, yield also increases but for solid loading beyond 20% w/v, decrease in yield can been seen. This decrease in yield is possibly due to high liquid–solid ratio and paste-like formation.
Figure 3.17.
Effect of solid loading, time vs quercetin yield.
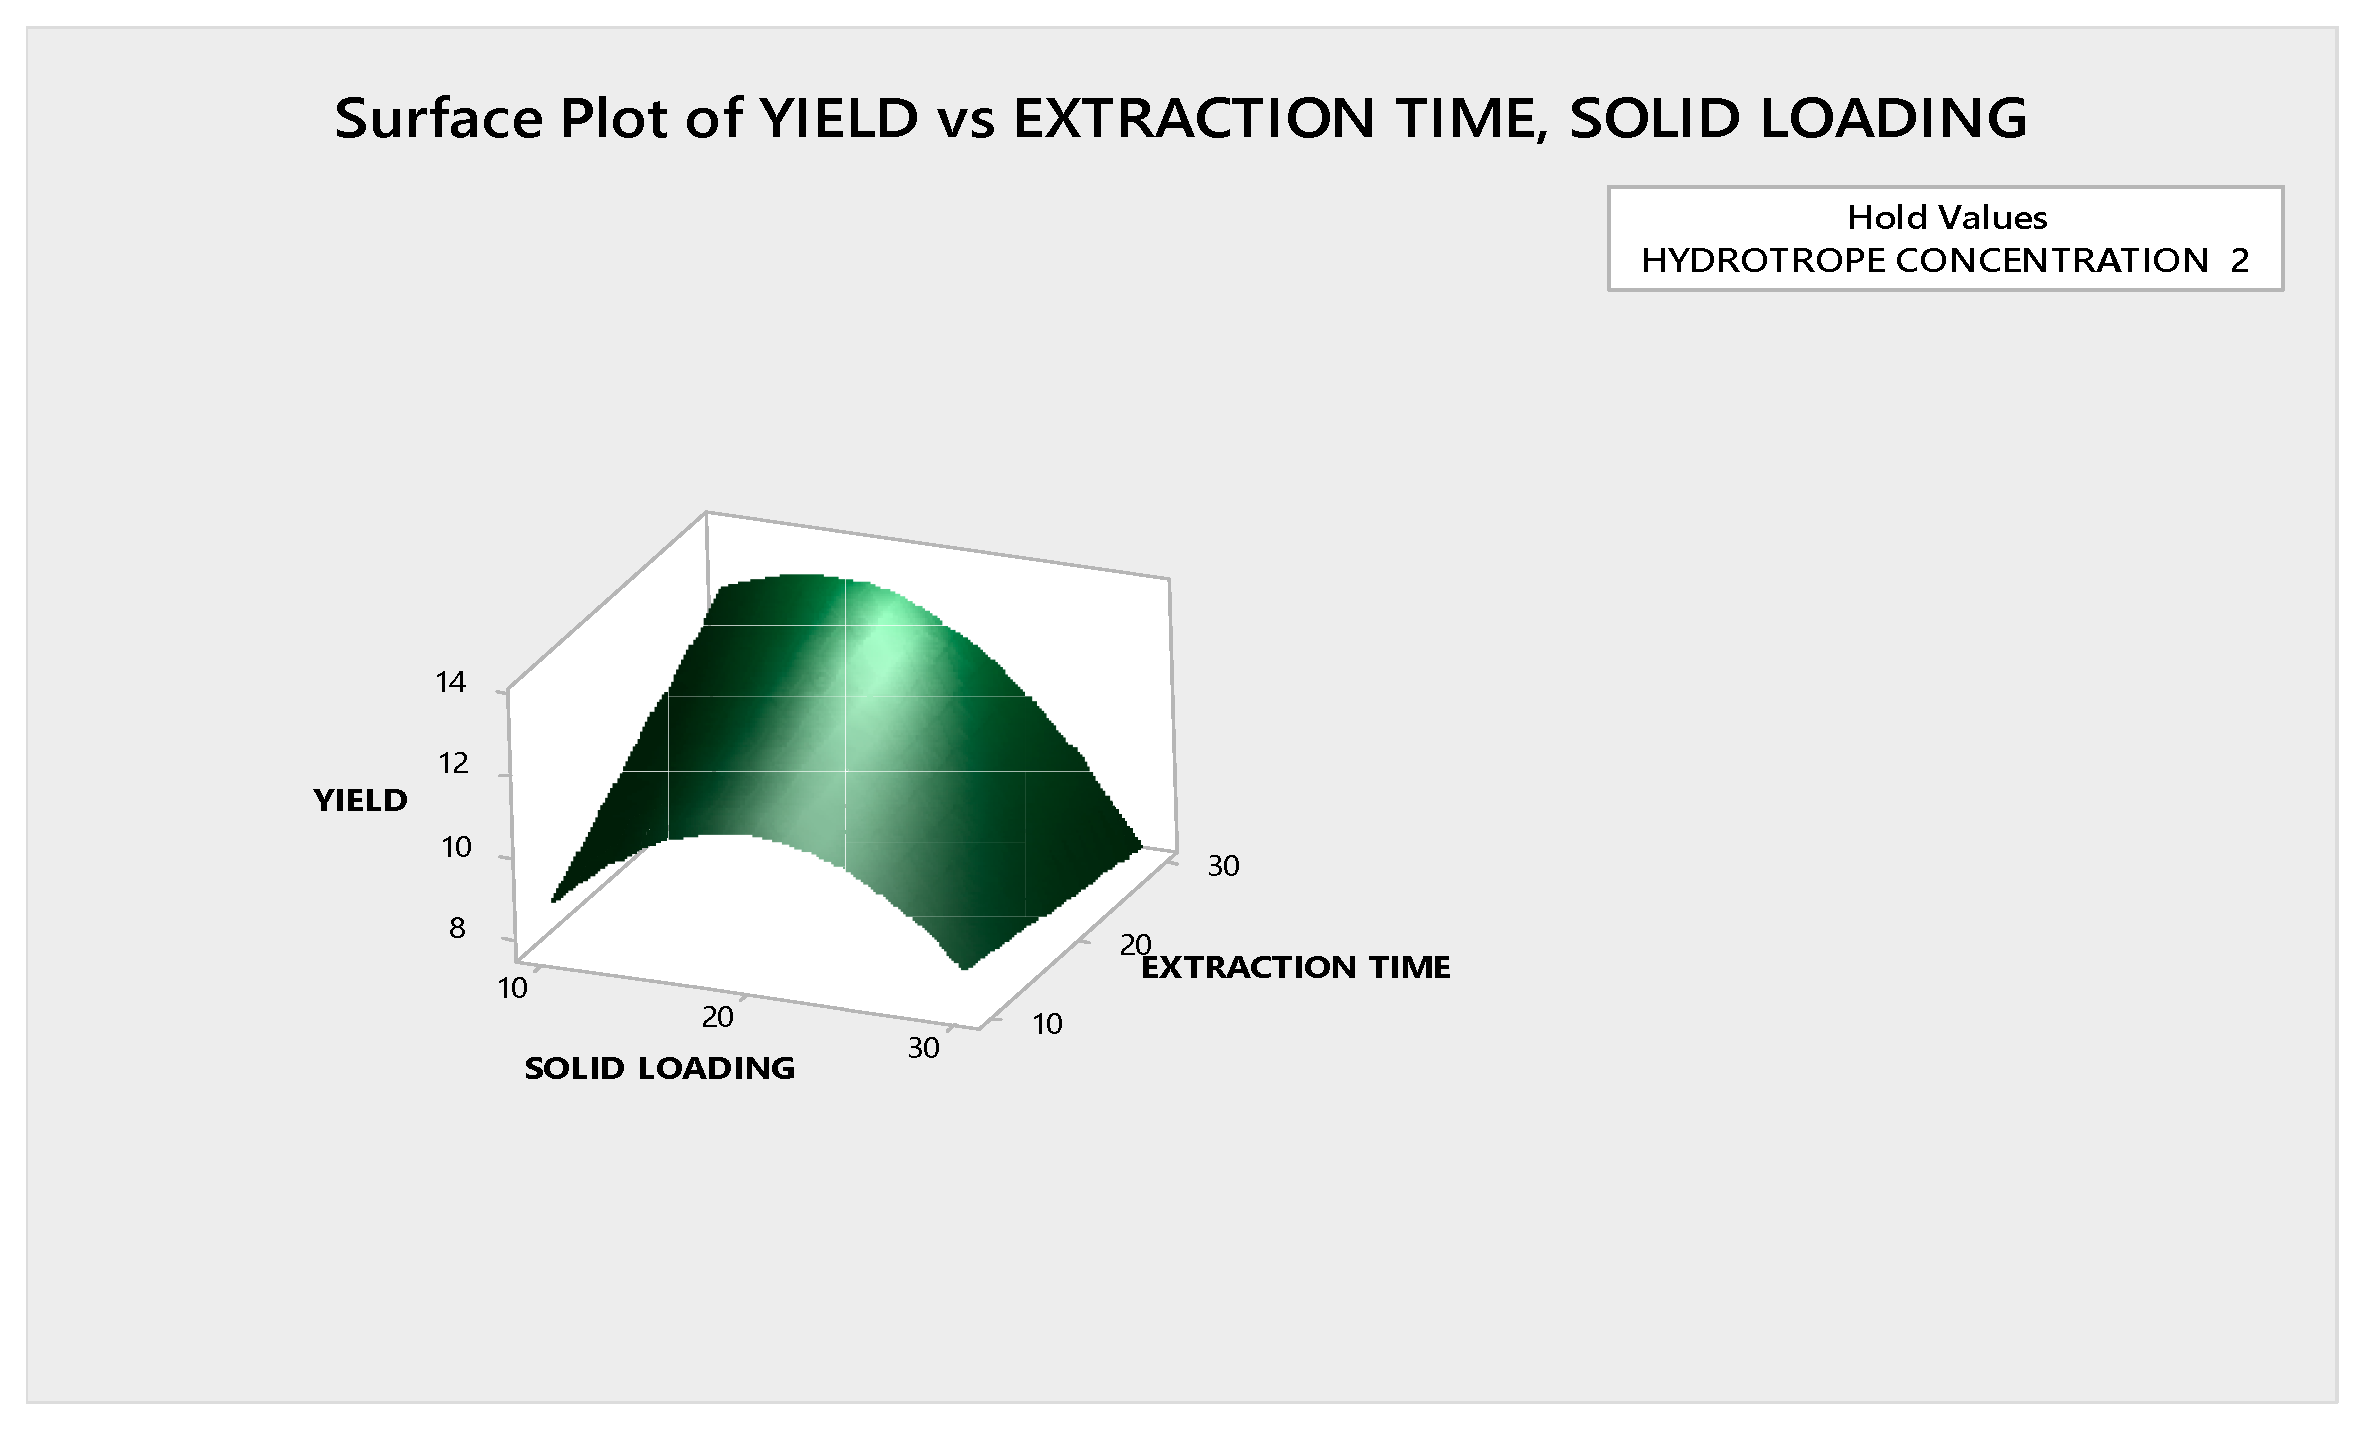
Figure 3.18 shows the effect of hydrotrope concentration, solid loading against quercetin yield with time as a constant at 20 min. Figure 4 depicts that with increase in hydrotrope concentration, yield increases and with increase in solid loading, yield increases initially but then gradually decreases.
Figure 3.18.
Effect of Hydrotrope concentration, solid loading vs quercetin yield.
3.4. Optimization of Ultrasound Assisted Hydrotropic Extraction
The optimized value for the extraction of quercetin with sodium benzoate and Urea as hydrotropes is shown in table 4.9 which is obtained from the RSM Box- Behnken method.
Table 3.9.
Comparison of predicted and experimental yield of quercetin.
| Variables | Optimum Conditions (Urea) |
Optimum Conditions (Sodium benzoate) |
||
|---|---|---|---|---|
| Hydrotropic Concentration (mol) | 3 | 3 | ||
| Extraction Time (min) | 30 | 30 | ||
| Solid Loading (%w/v) | 20 | 20 | ||
| Yield of quercetin (µg/g) | Experimental | Predicted | Experimental | Predicted |
| 19.2 | 20.2875 | 26.2 | 27.235 | |
Conclusion
4.1. Conclusion
The main objective of the present investigation was to enhance the solubility of bio active compound, quercetin using hydrotropic phenomenon. The study is mainly designed to overcome the demerits such as degradation of bioactive compound, post purification and high cost encountered in other solubilization techniques. The conclusions of this study are summarized below:
- ➢
- Sodium benzoate has been chosen as the hydrotrope due to its high solubility in water.
- ➢
- Orange peels has been chosen as the herb for the extraction of quercetin by UAHE.
- ➢
- The molar absorptivity of quercetin in water is determined using UV spectroscopy.
- ➢
- A Minimum Hydrotrope Concentration (MHC) in the aqueous phase is found to be essential for the initiation of the hydrotropic solubilization of bioactive compounds.
- ➢
- The solubilization of bioactive compound increases with the increase in hydrotrope concentration.
- ➢
- UAHE is carried out to fix the range of parameters such as extraction time, raw material loading and hydrotropic concentration. By the trial run, 30 minutes, 30% w/v, 2.6 mol/L was found to be optimum parameters for extraction of quercetin from Orange peels.
- ➢
- Response surface methodology was carried out to study the relation between yield of quercetin and extraction parameters such as hydrotrope concentration, extraction time and solid loading.
- ➢
- The highest yield was obtained at optimum conditions of 3 mol, 30 min, 20 %w/v by using sodium benzoate as hydrotrope.
- ➢
- The highest yield was obtained at optimum conditions of 3 mol, 30 min, 20 %w/v by using sodium benzene sulphonate as hydrotrope.
- ➢
- Sodium benzoate shows better yield than sodium benzene sulphonates.
4.2. Scope for Future Work
The obtained extract of quercetin by ultrasound-assisted hydrotropic extraction shall be subjected to clinical activity such as anti-microbial, anti-inflammatory, anti-cancer testing for pharmaceutical applications.
References
- Baite, T. N. , Mandal, B., & Purkait, M. K. (2021). Ultrasound assisted extraction of gallic acid from Ficus auriculata leaves using green solvent. Food and Bioproducts Processing, 128, 1-11. [CrossRef]
- Balasubramanian, D. , Srinivas, V., Gaikar, V. G., & Sharma, M. M. (1989). Aggregation behavior of hydrotropic compounds in aqueous solution. The Journal of Physical Chemistry, 93(9), 3865-3870. [CrossRef]
- Bernhoft, A. , Siem, H., Bjertness, E., Meltzer, M., Flaten, T., & Holmsen, E. (2010). Bioactive compounds in plants–benefits and risks for man and animals. The Norwegian Academy of Science and Letters, Oslo.
- Chen, Y. H. , & Yang, C. Y. (2020). Ultrasound-assisted extraction of bioactive compounds and antioxidant capacity for the valorization of Elaeocarpus serratus L. leaves. Processes, 8(10), 1218. [CrossRef]
- Dandekar, D. V. , Jayaprakasha, G. K., & Patil, B. S. (2008). Hydrotropic extraction of bioactive limonin from sour orange (Citrus aurantium L.) seeds. Food Chemistry, 109(3), 515-520. [CrossRef]
- Desai, M. A. , & Parikh, J. (2012). Hydrotropic Extraction of Citral from Cymbopogon flexuosus (Steud.) Wats. Industrial & engineering chemistry research, 51(9), 3750-3757. [CrossRef]
- Dhapte, V. , & Mehta, P. (2015). Advances in hydrotropic solutions: An updated review. St. Petersburg Polytechnical University Journal: Physics and Mathematics, 1(4), 424-435. [CrossRef]
- Ganesh Gautam, Verma; et al. (2022). Extraction of quercetin from cinnamon and examination of its antibacterial activity. Journal of emerging research and innovative research, 9(3).
- Ghule, S. N. , & Desai, M. A. (2021). Intensified extraction of valuable compounds from clove buds using ultrasound assisted hydrotropic extraction. Journal of Applied Research on Medicinal and Aromatic Plants, 25, 100325.. [CrossRef]
- Izadiyan, P. , & Hemmateenejad, B. (2016). Multi-response optimization of factors affecting ultrasonic assisted extraction from Iranian basil using central composite design. Food chemistry, 190, 864-870. [CrossRef]
- Jain, P. L. , Patel, S. R., & Desai, M. A. (2020). Enrichment of patchouli alcohol in patchouli oil by aiding sonication in hydrotropic extraction. Industrial Crops and Products, 158, 113011. [CrossRef]
- Keswani, M. , Raghavan, S., & Deymier, P. (2013). Effect of non-ionic surfactants on transient cavitation in a megasonic field. Ultrasonics sonochemistry, 20(1), 603-609. [CrossRef]
- Khadhraoui, B. , Ummat, V., Tiwari, B. K., Fabiano-Tixier, A. S., & Chemat, F. (2021). Review of ultrasound combinations with hybrid and innovative techniques for extraction and processing of food and natural products. Ultrasonics Sonochemistry, 76, 105625. [CrossRef]
- Kitts, D. D. (1994). Bioactive substances in food: identification and potential uses. Canadian journal of physiology and pharmacology, 72(4), 423-434. [CrossRef]
- Mishra, S. P. , & Gaikar, V. G. (2009). Hydrotropic extraction process for recovery of forskolin from Coleus forskohlii roots. Industrial & engineering chemistry research, 48(17), 8083-8090. 8090. [Google Scholar] [CrossRef]
- Mtetwa, M. D. , Qian, L., Zhu, H., Cui, F., Zan, X., Sun, W.,... & Yang, Y. (2020). Ultrasound-assisted extraction and antioxidant activity of polysaccharides from Acanthus ilicifolius. Journal of Food Measurement and Characterization, 14, 1223-1235. [CrossRef]
- Nagarajan, J. , Wah Heng, W., Galanakis, C. M., Nagasundara Ramanan, R., Raghunandan, M. E., Sun, J.,... & Prasad, K. N. (2016). Extraction of phytochemicals using hydrotropic solvents. Separation Science and Technology, 51(7), 1151-1165. [CrossRef]
- Prakash, D. G. , Panneerselvam, P., Madhusudanan, S., & Aditya, V. (2014). Hydrotropic extraction of xanthones from mangosteen pericarp. In Advanced Materials Research (Vol. 984, pp. 372-376). Trans Tech Publications Ltd. [CrossRef]
- Prakashan, N. (2009). Pharmacognosy, Nirali Prakashan.
- Raman, G. , & Gaikar, V. G. (2002). Extraction of piperine from Piper nigrum (black pepper) by hydrotropic solubilization. Industrial & engineering chemistry research, 41(12), 2966-2976. [CrossRef]
- Sachan, N. K. , Bhattacharya, A., Pushkar, S., & Mishra, A. (2009). Biopharmaceutical classification system: A strategic tool for oral drug delivery technology. Asian Journal of Pharmaceutics (AJP), 3(2). [CrossRef]
- Soine, T. O. (1964). Naturally occurring quercetins and related physiological activities. Journal of pharmaceutical sciences, 53(3), 231-264. [CrossRef]
- Stéphane, F. F. Y. , Jules, B. K. J., Batiha, G. E., Ali, I., & Bruno, L. N. (2021). Extraction of bioactive compounds from medicinal plants and herbs. Nat Med Plants.
- Sun, H. , Lin, Q., Wei, W., & Qin, G. (2018). Ultrasound-assisted extraction of resveratrol from grape leaves and its purification on mesoporous carbon. Food science and biotechnology, 27, 1353-1359. [CrossRef]
- Thakker, M. R. , Parikh, J. K., & Desai, M. A. (2018). Ultrasound assisted hydrotropic extraction: a greener approach for the isolation of geraniol from the leaves of Cymbopogon martinii. ACS Sustainable Chemistry & Engineering, 6(3), 3215-3224. [CrossRef]
- Theneshkumar, S. , Gnanaprakash, D., & Nagendra Gandhi, N. (2010). Solubility and mass transfer coefficient enhancement of stearic acid through hydrotropy. Journal of Chemical & Engineering Data, 55(9), 2980-2984. [CrossRef]
- Tiwari, B. K. (2015). Ultrasound: A clean, green extraction technology. TrAC Trends in Analytical Chemistry, 71, 100-109. [CrossRef]
- Vasanth Kumar, E. , Kalyanaraman, G., & Nagarajan, N. G. (2019). Aqueous Solubility Enhancement and Thermodynamic Aggregation Behavior of Resveratrol Using an Eco-Friendly Hydrotropic Phenomenon. Russian Journal of Physical Chemistry A, 93, 2681-2686. [CrossRef]
- Waterman, P. G. (1983). Phylogenetic implications of the distribution of secondary metabolites within the Rutales. Chemistry and chemical taxonomy of the Rutales, 377-400.
- Chemat, F. , et al. (2019). "Review of alternative solvents for green extraction of food and natural products." Trends in Food Science & Technology, 85, 227-240.
- Deng, Q. , et al. (2019). "Ultrasound-assisted extraction of quercetin from onion peel: Optimization and antioxidant activity." Food Chemistry, 276, 591-598.
- Garcia-Castello, E. , et al. (2019). "Optimization of ultrasound-assisted extraction of flavonoids from citrus by-products." Journal of Food Engineering, 245, 167-176.
- Kumar, K. , et al. (2019). "Green extraction techniques for flavonoids from citrus waste." Sustainable Chemistry and Pharmacy, 11, 1-8.
- Londoño-Londoño, J. , et al. (2019). "Citrus flavonoids: Extraction, identification, and antioxidant activity." Journal of Agricultural and Food Chemistry, 67(15), 4129-4145.
- M’hiri, N. , et al. (2019). "Optimization of quercetin extraction from citrus peels by response surface methodology." Journal of Food Measurement and Characterization, 13(1), 662-671. 13(1), 662-67.
- Pingret, D. , et al. (2019). "Lab and pilot-scale ultrasound-assisted extraction of polyphenols from apple pomace." Ultrasonics Sonochemistry, 51, 238-246. [CrossRef]
- Rocha, C. M. R. , et al. (2019). "Optimization of ultrasound-assisted extraction of phenolic compounds from citrus peels." Food Chemistry, 294, 223-230. [CrossRef]
- Roselló-Soto, E. , et al. (2019). "Ultrasound-assisted green extraction of bioactive compounds from citrus by-products." Trends in Food Science & Technology, 86, 385-399.
- Zhu, Z. , et al. (2019). "Ultrasound-enhanced subcritical water extraction of quercetin from onion skin." Journal of Supercritical Fluids, 143, 10-17.
- Gaikwad, K. K. , & Singh, S. (2019). "Hydrotropic extraction of bioactive compounds from plant materials: A review." Journal of Food Process Engineering, 42(3), e12998.
- Kulkarni, S. G. , & Pandit, A. B. (2019). "Intensification of hydrotropic extraction using ultrasound." Chemical Engineering and Processing, 138, 1-8.
- Patil, S. S. , & Rathod, V. K. (2019). "Hydrotropic extraction of curcumin from turmeric using sodium cumene sulfonate." Industrial Crops and Products, 128, 177-182.
- Raman, G. , & Gaikar, V. G. (2019). "Hydrotropic extraction of quercetin from onion peel." Separation and Purification Technology, 209, 793-801.
- Thakker, M. R. , et al. (2019). "Ultrasound-assisted hydrotropic extraction of geraniol from Cymbopogon martinii." ACS Sustainable Chemistry & Engineering, 7(1), 1451-1460.
- Gaikwad, K. K. , et al. (2019). "Ultrasound-assisted hydrotropic extraction of polyphenols from citrus peels." Food and Bioproducts Processing, 114, 175-184.
- Patil, A. P. , & Rathod, V. K. (2019). "Ultrasound-assisted hydrotropic extraction of quercetin from onion peel." Journal of Food Process Engineering, 42(4), e13020.
- Rathod, V. K. , & Pandit, A. B. (2019). "Synergistic effect of ultrasound and hydrotropes on extraction of quercetin." Ultrasonics Sonochemistry, 52, 331-339.
- Górnaś, P. , et al. (2019). "Citrus fruit peels as a source of bioactive flavonoids: Ultrasound-assisted extraction." Antioxidants, 8(4), 126.
- Kumar, S. , et al. (2019). "Sustainable extraction of quercetin from onion peel using hydrotropes." Journal of Cleaner Production, 230, 1135-1144.
- Panda, D. , et al. (2019). "Ultrasound and enzyme-assisted extraction of flavonoids from citrus peels." Biocatalysis and Agricultural Biotechnology, 17, 223-229.
- Roda, A. , et al. (2019). "Optimization of ultrasound-assisted extraction of polyphenols from citrus peel." Food Chemistry, 277, 727-736.
- Alara, O. R. , et al. (2019). "Optimization of microwave-assisted extraction of flavonoids from citrus peels." Journal of Food Science and Technology, 56(5), 2339-2349.
- Chen, M. , et al. (2019). "Optimization of ultrasound-assisted extraction of phenolic compounds from citrus peels using response surface methodology." Journal of the Science of Food and Agriculture, 99(8), 3916-3924.
- Deng, J. , et al. (2019). "Ultrasound-assisted extraction of polyphenols from citrus peels: Optimization and kinetic modeling." Food Chemistry, 276, 591-598.
- Maran, J. P. , et al. (2019). "Ultrasound-assisted extraction of bioactive compounds from citrus peel." Journal of Food Process Engineering, 42(1), e12948.
- Pérez-Ramírez, I. F. , et al. (2019). "HPLC-DAD quantification of flavonoids in citrus by-products." Journal of Chromatography B, 1110-1111, 1-9.
- Spigno, G. , et al. (2019). "Optimization of solvent and ultrasound-assisted extraction of flavonoids from grape marc." Food and Bioprocess Technology, 12(4), 593-602.
- Chemat, F. , et al. (2019). "Review of alternative solvents for green extraction of polyphenols." Green Chemistry, 21(5), 882-896.
- Rombaut, N. , et al. (2019). "Green extraction of polyphenols from citrus peel waste." Journal of Cleaner Production, 208, 1171-1181.
- Li, Y. , et al. (2019). "Antioxidant and anti-inflammatory effects of quercetin from citrus peels." Journal of Functional Foods, 52, 1018.
- Vinatoru, M. , et al. (2019). "Ultrasound-assisted extraction of polyphenols from citrus peel waste." Ultrasonics Sonochemistry, 56, 84-91.
- Barba, F. J. , et al. (2019). "Green extraction of polyphenols from citrus peel by-products." Innovative Food Science & Emerging Technologies, 51, 37-44.
- Deng, J. , et al. (2019). "Ultrasound-assisted extraction of flavonoids from citrus reticulata leaves." Journal of Food Processing and Preservation, 43(2), e13860.
- Garcia-Vaquero, M. , et al. (2019). "Ultrasound-assisted extraction of bioactive compounds from citrus peel waste." Food Chemistry, 274, 793-801.
- Khadhraoui, B. , et al. (2019). "Review of ultrasound combinations with hybrid techniques for extraction of food compounds." Ultrasonics Sonochemistry, 55, 68-85.
- Poojary, M. M. , et al. (2019). "Optimization of ultrasound-assisted extraction of quercetin from onion waste." Food Chemistry, 288, 158-166.
- Safdar, M. N. , et al. (2019). "Ultrasound-assisted extraction of polyphenols from citrus peel waste." Journal of Food Processing and Preservation, 43(4), e13909.
- Zheng, X. , et al. (2019). "Ultrasound-assisted extraction of flavonoids from citrus peel: Optimization and antioxidant activity." Journal of Food Science, 84(6), 1371-1379.
- Tiwari, B. K. (2019). "Ultrasound-assisted extraction of bioactive compounds from citrus peels." Food and Bioprocess Technology, 12(8), 1386-1397.
- Al-Dhabi, N. A. , et al. (2020). "Optimization of ultrasound-assisted extraction of phenolic compounds from Citrus limon peel." Molecules, 25(5), 1156.
- Altemimi, A. , et al. (2019). "Ultrasound-assisted extraction of phenolic acids from citrus by-products." Food Chemistry, 277, 128-134.
- Ameer, K. , et al. (2019). "Optimization of ultrasound-assisted extraction of polyphenols from citrus peels." Journal of Food Science and Technology, 56(4), 2059-2069.
- Azmir, J. , et al. (2019). "Ultrasound-assisted extraction of flavonoids from citrus waste." Industrial Crops and Products, 128, 186-193.
- Bamba, B. S. B. , et al. (2019). "Ultrasound-assisted extraction of polyphenols from orange peel." Ultrasonics Sonochemistry, 50, 331-338.
- Barbieri, J. B. , et al. (2019). "Ultrasound intensification of polyphenol extraction from orange pomace." Food and Bioproducts Processing, 114, 1-8.
- Boukroufa, M. , et al. (2019). "Ultrasound-assisted extraction of polyphenols from citrus peels." Food Chemistry, 283, 431-439.
- Carrera, C. , et al. (2019). "Ultrasound-assisted extraction of bioactive compounds from citrus peel waste." Journal of Food Engineering, 247, 1-9.
- Chen, F. , et al. (2019). "Ultrasound-assisted extraction of flavonoids from citrus peel." Journal of Chromatography A, 1585, 1-10.
- Dahmoune, F. , et al. (2019). "Optimization of ultrasound-assisted extraction of polyphenols from orange peel." Food and Bioprocess Technology, 12(3), 489-498.
- Desai, M. A. , et al. (2019). "Hydrotropic extraction of bioactive compounds from Moringa oleifera leaves." Industrial Crops and Products, 128, 194-201.
- Gaikwad, K. K. , et al. (2019). "Ultrasound-assisted hydrotropic extraction of quercetin from onion peel." Journal of Food Process Engineering, 42(4), e13020.
- Jadhav, D. , et al. (2019). "Hydrotropic extraction of curcumin from turmeric." Separation and Purification Technology, 210, 703-710.
- Kaur, R. , et al. (2019). "Hydrotropic solubilization of quercetin for enhanced extraction." Journal of Molecular Liquids, 273, 346-353.
- Patil, A. P. , et al. (2019). "Intensified hydrotropic extraction of piperine using ultrasound." Chemical Engineering and Processing, 138, 1-9.
- Deng, Q. , et al. (2019). "Response surface methodology for UAE of flavonoids from citrus peel." Food Chemistry, 276, 591-598.
- Garcia-Castello, E. , et al. (2019). "Optimization of UAE of polyphenols from citrus waste." Journal of Food Engineering, 245, 167-176.
- M’hiri, N. , et al. (2019). "RSM optimization of quercetin extraction from citrus peel. Journal of Food Measurement and Characterization.
- Chemat, F. , et al. (2019). "Review of green solvents for polyphenol extraction." Green Chemistry, 21(5), 882-896.
- Rombaut, N. , et al. (2019). "Sustainable extraction of citrus flavonoids." Journal of Cleaner Production, 208, 1171-1181.
- Zhang, L. , et al. (2020). "Deep eutectic solvents for quercetin extraction." Food Chemistry, 310, 125916.
- Kumar, M. , et al. (2020). "Microwave-assisted hydrotropic extraction of quercetin." Journal of Food Processing and Preservation, 44(6), e14462.
- Tiwari, B. K. , et al. (2020). "Hybrid extraction techniques for citrus bioactives." Ultrasonics Sonochemistry, 65, 105048.
- Cui, H. , et al. (2020). "Efficient extraction of quercetin from the peel of citrus fruits using a novel, environmentally friendly green solvent." Journal of Cleaner Production, 247, 119148.
- Satyajit, D. B. (2019). "Extraction of quercetin from citrus sinensis (sweet orange) peels using deep eutectic solvents." Journal of Food Science and Technology, 56(9), 4267-4274.
- Azad, M. A. K. , et al. (2020). "Ultrasound-assisted extractions of flavonoids from Citrus sinensis peels: An eco-friendly approach." Food Science & Nutrition, 8(9), 4784-4796.
- Deng, J. , et al. (2021). "Ultrasound-assisted extraction of quercetin from citrus sinensis peels: Optimization and mechanism." Food Chemistry, 342, 128385.
- Zhang, Y. , et al. (2020). "Sustainable extraction of quercetin from Citrus sinensis using enzyme-assisted ultrasound extraction method." Food Bioproducts Processing, 123, 120-129.
- Kumar, K. , et al. (2019). "Eco-friendly ultrasound-assisted hydrotropic extraction of quercetin from citrus waste." ChemistrySelect, 4, 4928-4935.
- Wang, Y.; et al. (2021). "Application of ultrasound and hydrotropic agents for the extraction of flavonoids: A review." Food Research International, 142, 110179.
- Patil, P. , et al. (2020). "Hydrotropic ultrasonication: A synergistic approach for enhanced extraction of quercetin from orange peels." Industrial Crops and Products, 146, 112215.
Disclaimer/Publisher’s Note: The statements, opinions and data contained in all publications are solely those of the individual author(s) and contributor(s) and not of MDPI and/or the editor(s). MDPI and/or the editor(s) disclaim responsibility for any injury to people or property resulting from any ideas, methods, instructions or products referred to in the content. |
© 2025 by the authors. Licensee MDPI, Basel, Switzerland. This article is an open access article distributed under the terms and conditions of the Creative Commons Attribution (CC BY) license (http://creativecommons.org/licenses/by/4.0/).
Copyright: This open access article is published under a Creative Commons CC BY 4.0 license, which permit the free download, distribution, and reuse, provided that the author and preprint are cited in any reuse.


