
Submitted:
31 March 2025
Posted:
31 March 2025
You are already at the latest version
Abstract
Urban environments increasingly suffer from extreme heat due to climate change and urban heat island effects. This study compares the summer temperature reduction ef-fects of two contrasting cooling infrastructures: a ground fountain located in Dongtan Yeoul Park—a newly developed smart city district experiencing rapid urbanization, and a natural stream in Chilrangi Valley in Sangdong-eup, the coolest rural location in South Korea during summer. Using on-site IoT-based weather stations, thermal imag-ing, and microclimate monitoring, we analyzed air temperature, surface temperature, Mean Radiant Temperature (MRT), and Universal Thermal Climate Index (UTCI) at various distances from each water source. The ground fountain showed a maximum air temperature reduction of 2.26°C within a 5-meter radius, with MRT and UTCI re-ductions of up to 3°C compared to adjacent dry zones. However, cooling effects di-minished rapidly with distance. In contrast, the natural stream maintained an average air temperature of 25.5°C—approximately 10°C lower than the urban site—along with more stable MRT (~40°C) and UTCI (~45°C) throughout the day. These findings indi-cate that while ground fountains provide localized, short-term relief, natural systems deliver broader and more sustainable cooling. This study highlights the importance of integrating both artificial and natural water-based infrastructures to enhance thermal comfort and support climate-resilient urban planning.
Keywords:
urban cooling
; heat mitigation
; ground fountains
; natural streams
; urban heat island
; MRT
; UTCI
1. Introduction
Urban heat islands (UHIs) exacerbate extreme summer temperatures, negatively affecting public health and energy consumption. As climate change intensifies, cities worldwide are investing in urban cooling strategies to mitigate these effects. Among these strategies, water-based cooling solutions have gained significant attention due to their effectiveness in reducing local air and surface temperatures [1].
1.1. Domestic Research on Urban Cooling Technologies
In South Korea, several studies have explored the impact of urban water features on heat mitigation:
Ground fountains are widely used in dense urban areas to lower air temperature through evaporative cooling. Studies conducted by the Seoul Institute of Technology revealed that ground fountains can reduce air temperatures by up to 2.26°C and con-tribute to a 47.1% reduction in thermal radiation [2].
Natural streams have demonstrated long-term and widespread cooling effects. Unlike artificial cooling installations, streams benefit from continuous water flow and vegetation, which enhance their heat mitigation capabilities [3].
Comparative analyses between ground fountains, cooling fog systems, and artifi-cial waterways indicate that ground fountains provide superior localized cooling, re-ducing temperatures by 11.8°C more than cooling fog systems and 18.2°C more than artificial waterways [4].
Research on the Cheonggyecheon stream restoration project has confirmed that urban stream restoration lowers surrounding air temperature by up to 1.5°C, provid-ing significant relief from the urban heat island effect [5].
1.2. International Studies on Water-Based Cooling Solutions
Global research has reinforced the importance of urban water features in reducing temperatures and improving thermal comfort:
In the Netherlands, studies have shown that urban fountains and water bodies lower surrounding temperatures while providing psychological cooling benefits for citizens [6].
Research in China indicates that water-based cooling interventions can reduce urban temperatures by up to 1°C, with greater effects observed in areas with dense vegetation and water integration [7].
In Italy, a comparative study on artificial and natural water features found that while both contribute to urban cooling, natural water bodies maintain cooling effects over a wider range, whereas artificial fountains provide intense but short-lived cooling benefits [8].
The integration of smart cooling technologies is gaining traction in Europe. A study in France explored using the urban water network as a cooling system, enhanc-ing heat mitigation while improving energy efficiency in urban infrastructure [9].
1.3. Research Gap and Objectives
While previous studies have examined the cooling effects of urban water features, comparative research between artificial and natural water bodies remains limited [10]. This study aims to address this gap by:
- Quantifying temperature reductions achieved by ground fountains and natural streams in different urban environments.
- Comparing their effectiveness in terms of air temperature, surface temperature, and thermal comfort indicators (MRT and UTCI).
- Providing recommendations for urban planners on integrating water-based cool-ing strategies into climate-resilient urban designs.
By leveraging IoT-based weather stations, thermal imaging, and environmental sensors, this study offers empirical data-driven insights into urban heat mitigation strategies. The findings will contribute to evidence-based planning for enhancing ur-ban thermal resilience [11].
2. Materials and Methods
2.1. Study Sites
Dongtan Yeoul Park (Urban Site)
Dongtan Yeoul Park is located in Hwaseong City, Gyeonggi Province, within a highly urbanized and rapidly growing new city development area. This site was se-lected as it represents one of South Korea’s newest smart city districts, making it an ideal testbed for evaluating advanced urban cooling strategies [12]. Positioned near Dongtan Station, one of the busiest transportation hubs, the park experiences substan-tial pedestrian traffic and pronounced urban heat island effects. As of October 2024, the population of Dongtan-myeon is 406,036, with Dongtan 7-dong having the highest population density (56,678 residents) and Dongtan 2-dong the lowest (34,293 resi-dents). The annual average temperature in Hwaseong (2001–2010) was 12.3°C, 1.1°C higher than Gyeonggi Province’s average. Climate projections (RCP8.5) suggest a temperature increase of 2.1°C by the 2040s and 5.6°C by the 2090s [13]. Despite its function as a public gathering space, the park lacks sufficient thermally comfortable areas, making it vulnerable to extreme heat [14].
A ground fountain was selected as the primary research focus due to its evapora-tive cooling potential and high interaction with visitors [2]. IoT-based sensors were in-stalled at varying distances to assess localized cooling effects based on real-time envi-ronmental data.
Chilrangi Valley (Natural Site)
Chilrangi Valley is situated in Sangdong-eup, Yeongwol County, Gangwon Prov-ince, amidst forested landscapes and natural water streams, offering a stark contrast to the urban setting. Sangdong-eup was selected as the natural site because it is known to be the coolest rural region in South Korea during summer, making it ideal for evaluat-ing nature-based cooling systems under optimal conditions [15]. As of October 2024, the population was 1,007, with elderly residents (65+) comprising 46%. This demo-graphic composition renders the area highly vulnerable to heatwaves [16]. Gangwon Province recorded an average of 1.2 extreme heat days in June 2023, while Yeongwol exceeded this with two such days. The valley’s dense vegetation and continuous water flow contribute to its natural heat mitigation capacity [17]. Microclimate sensors were installed at various distances from the stream to measure the temperature gradient.
This site allowed for a comparative analysis between urban and natural cooling strategies and demonstrated the benefits of integrating nature-based solutions with ar-tificial urban cooling infrastructures.
Figure 1.
Ground Fountain at Dongtan Yeoul Park.
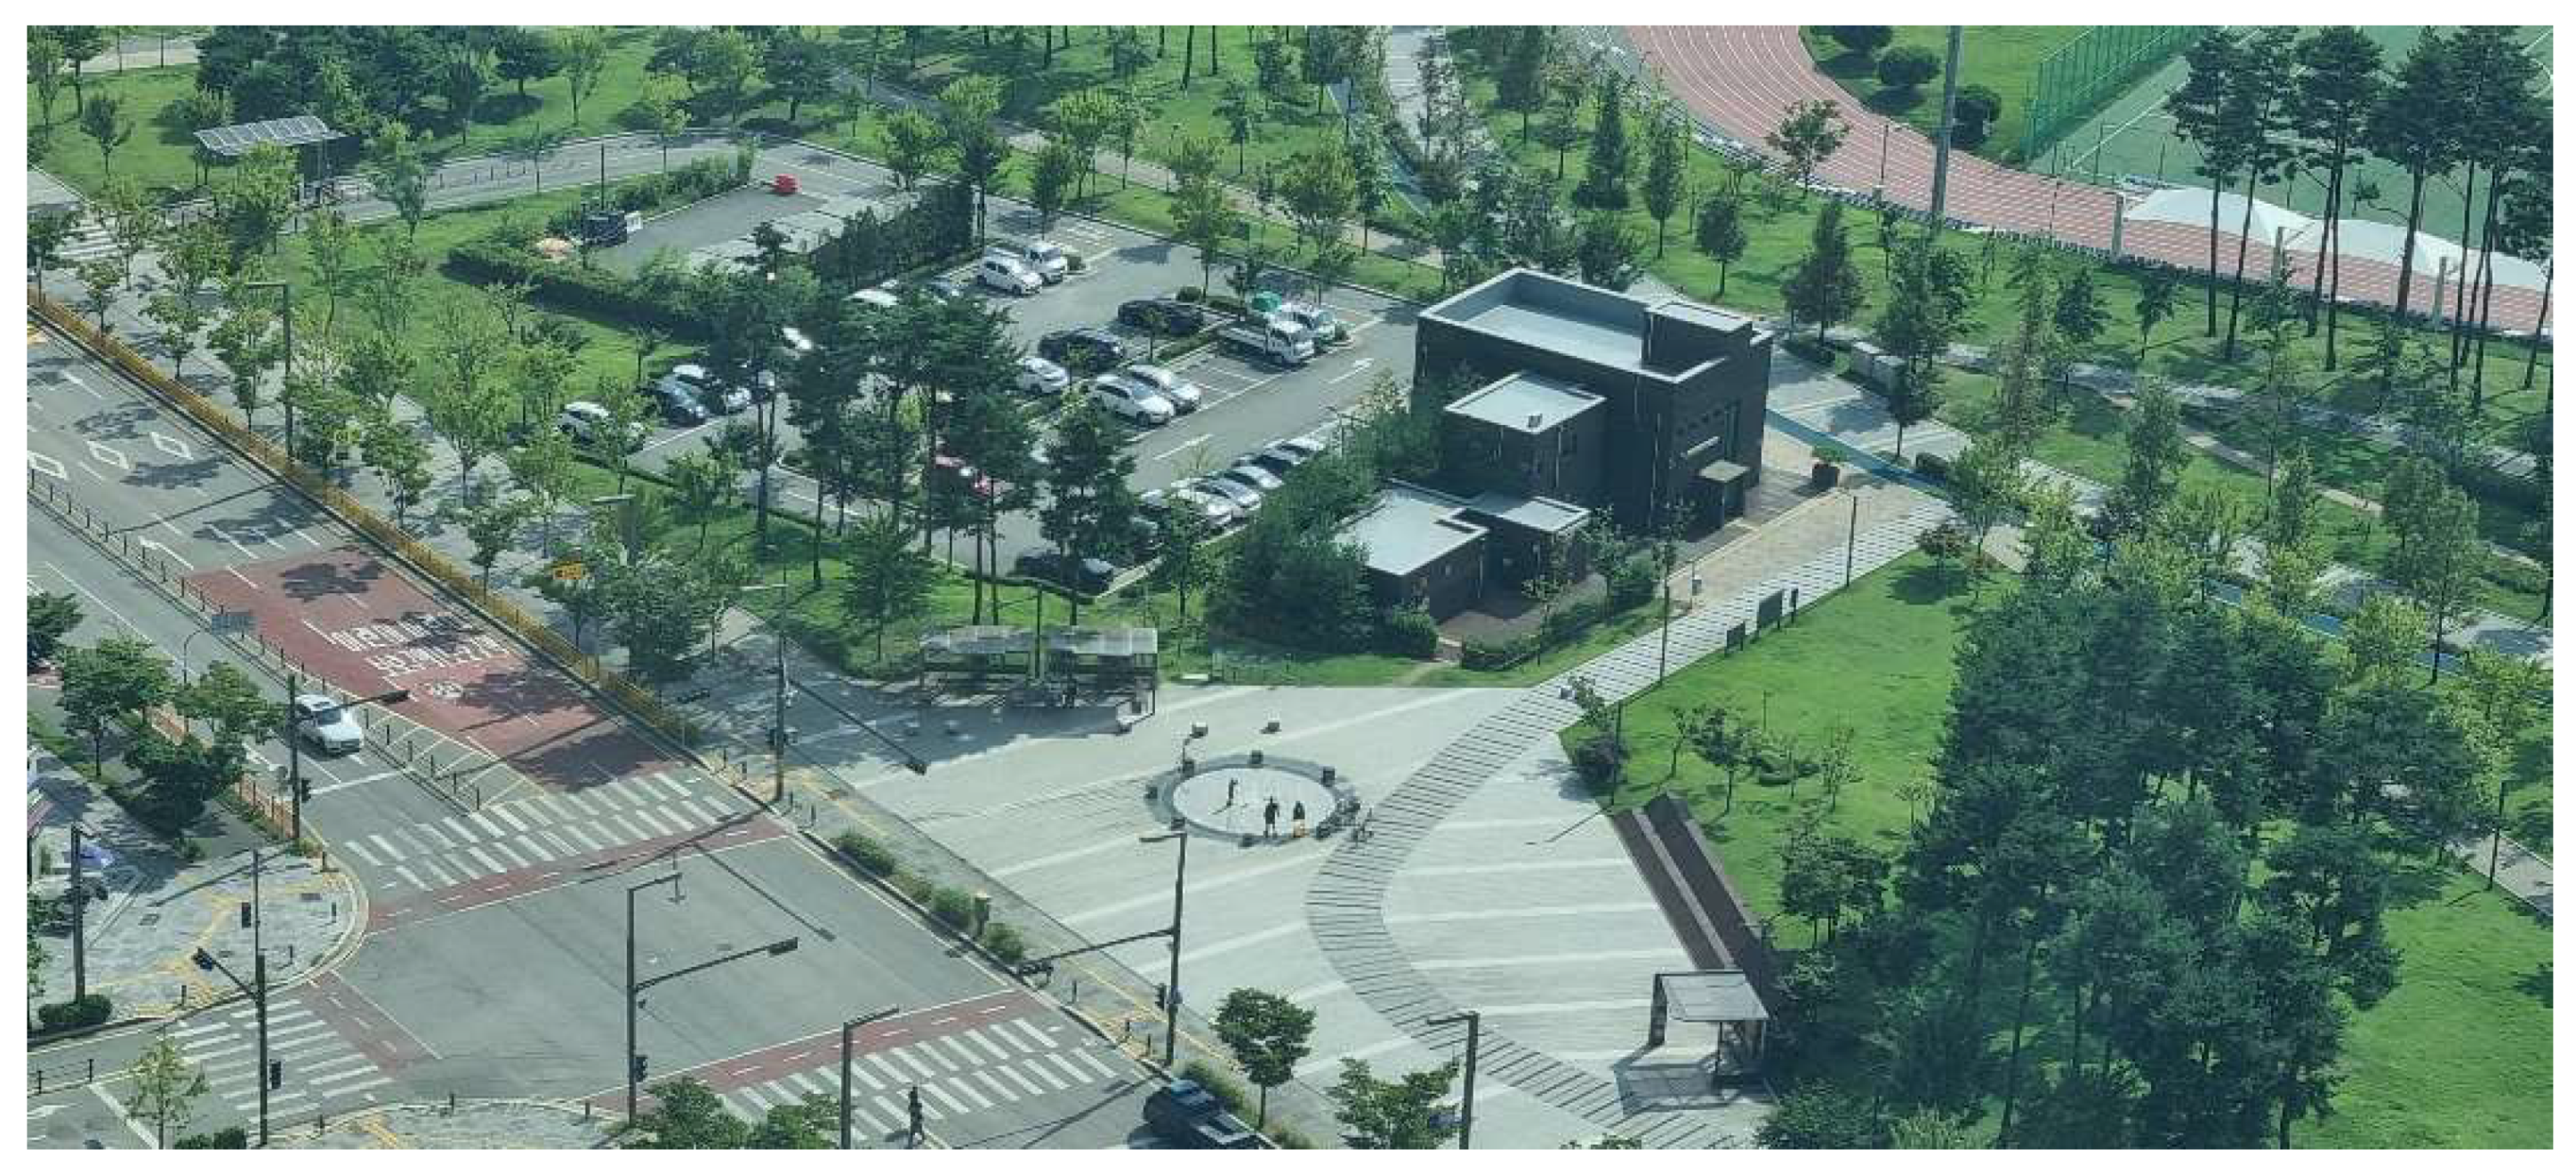
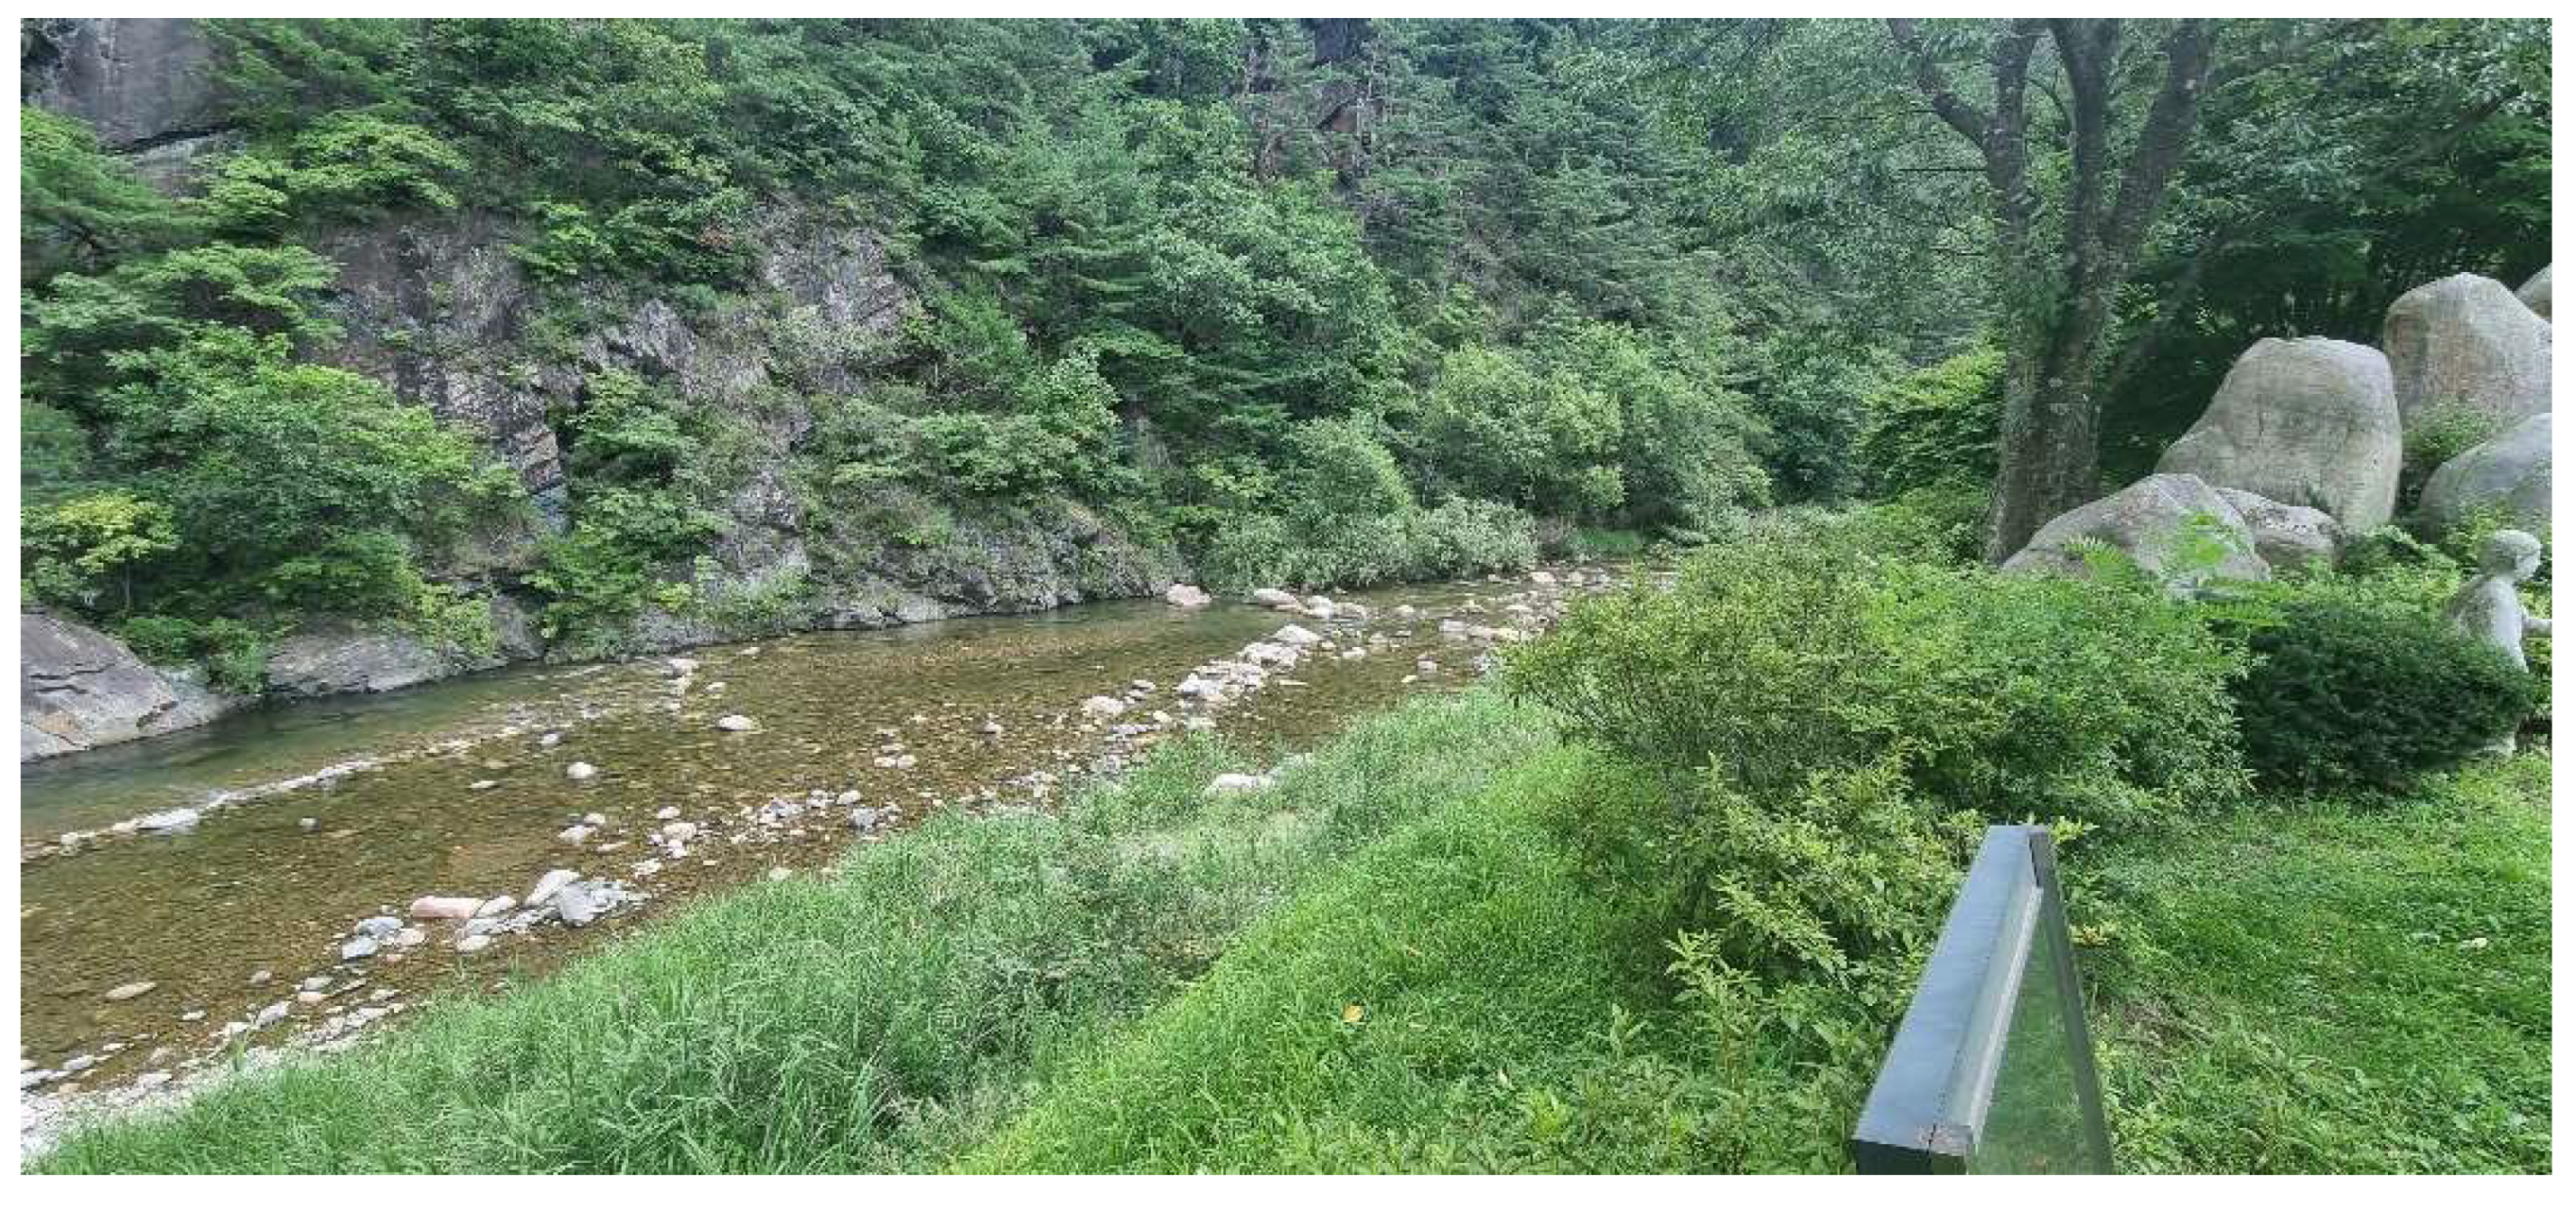
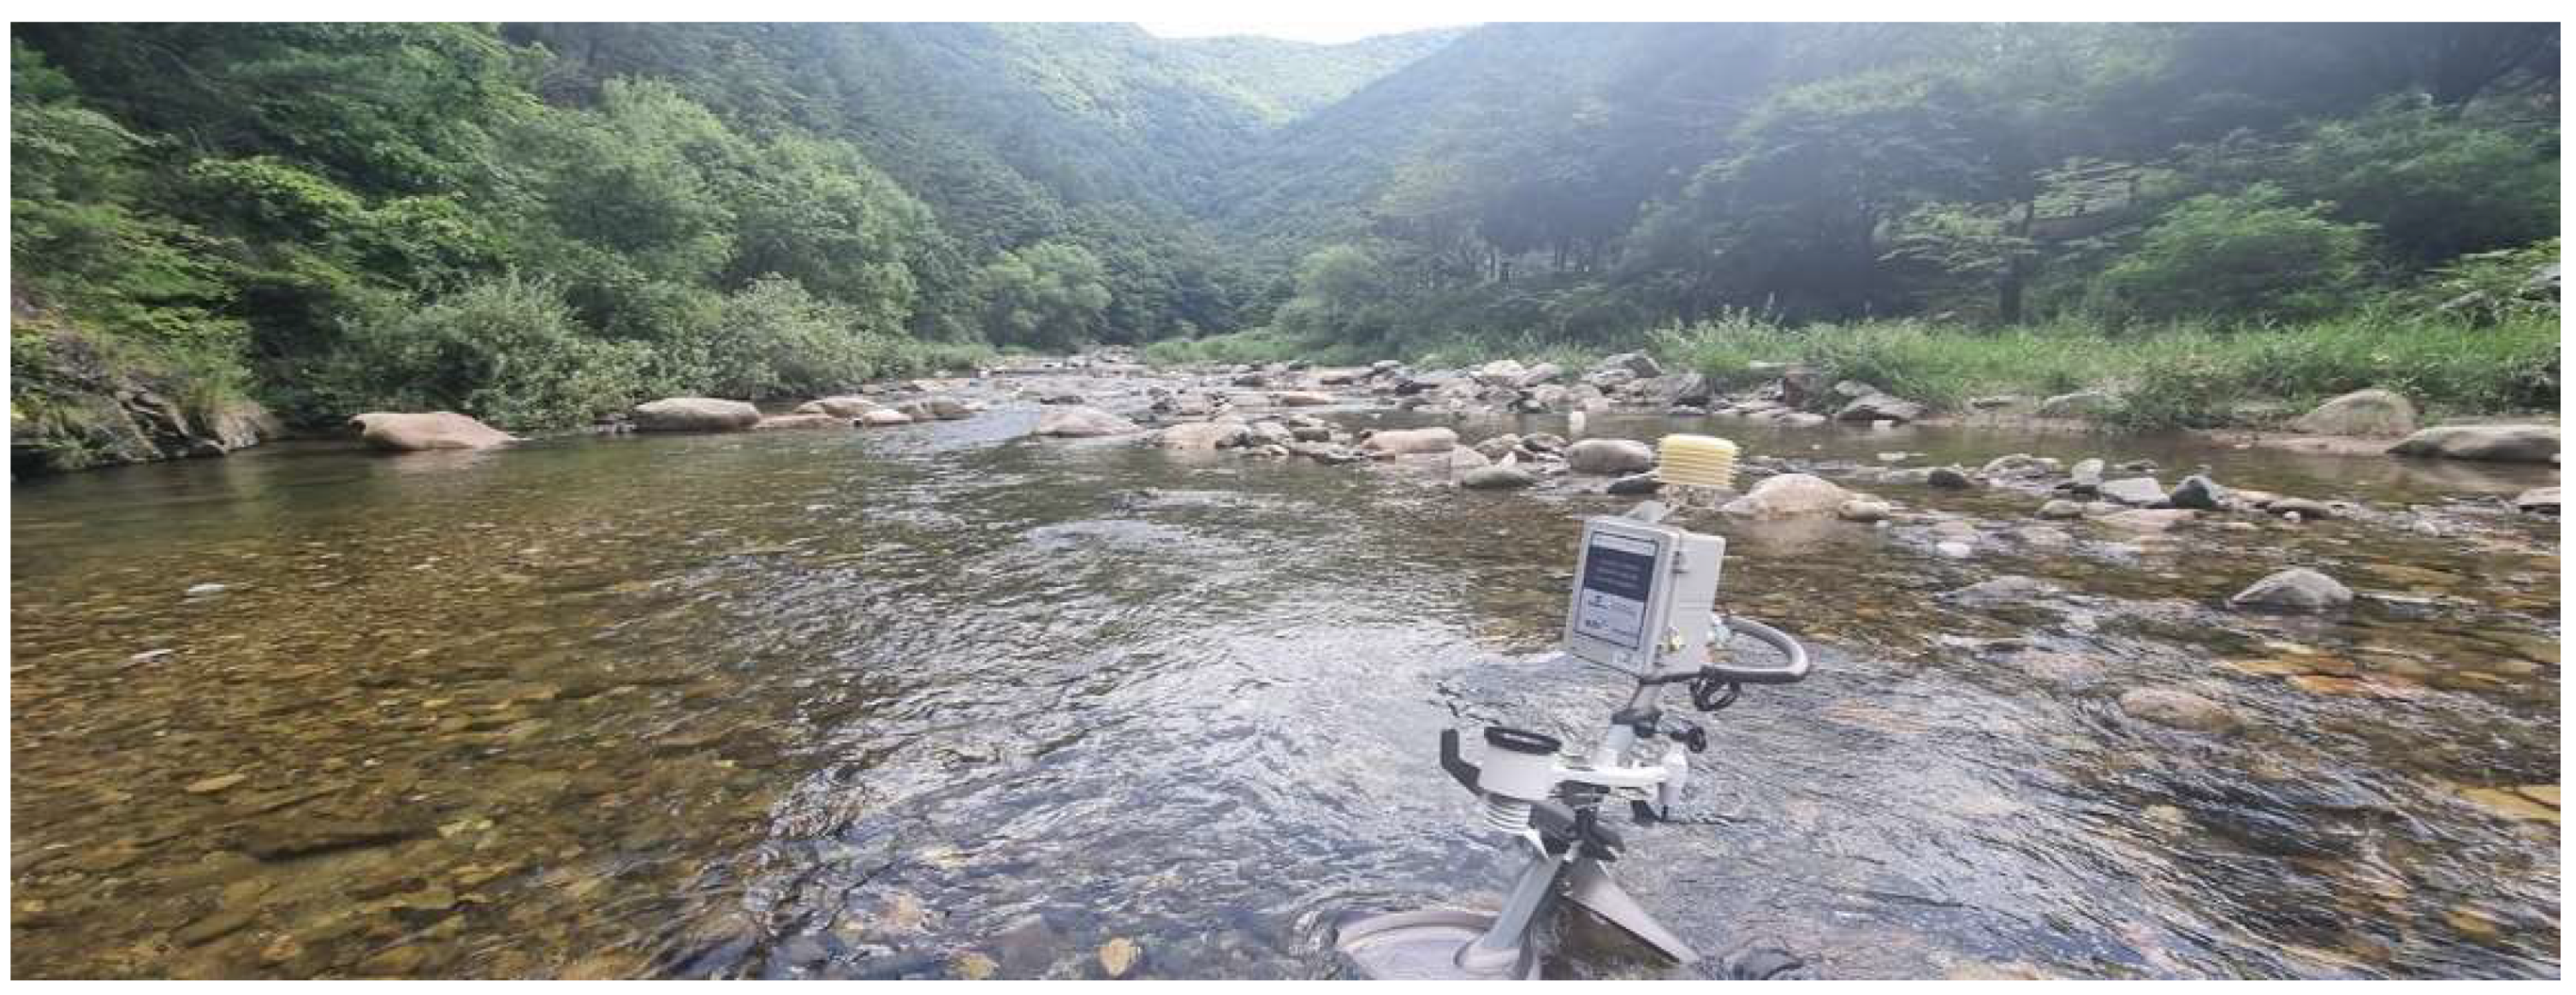
Figure 2.
Location of Chilrangi Valley and Study Setup.
2.2. Data Collection
This study employed IoT-based weather stations, data loggers, and thermal imag-ing devices to measure localized environmental variables. Weather stations were used to overcome data logger limitations, providing real-time monitoring of temperature, humidity, PM10, PM2.5, wind speed, UV index, CO₂ levels, atmospheric pressure, soil moisture, and related microclimatic indicators [18].
Measurements were taken at distances of 5m and 15m from central observation points to track spatial thermal variation. Key recorded metrics included temperature, relative humidity, CO₂, particulate matter, and pressure.
- IoT-based weather stations measured air temperature, humidity, wind speed, and solar radiation.
- Thermal imaging cameras assessed surface temperature distribution [36].
- MRT and UTCI were calculated from on-site sensor data to evaluate thermal comfort.
Data were uploaded to the cloud in real time at 5-minute intervals. Multiple sen-sor points were placed in three zones per site (central, edge, outer) for fine-grained spatial analysis.

Table 1.
Weather Station Monitoring Specifications.
| Parameter | Range | Accuracy | Resolution |
|---|---|---|---|
| Temperature | -40°C to 60°C | ±1°C | 0.1°C |
| Humidity | 1% to 99% | ±5% | 1% |
| CO₂ Concentration | 0 to 40,000 ppm | ±(30 ppm + 3%) (400–10,000 ppm) | 1 ppm |
| PM2.5 | 0 to 999 µg/m³ | ±15% (>100 µg/m³) / ±15 µg/m³ | 1 µg/m³ |
| PM10 | 0 to 999 µg/m³ | ±25% (>100 µg/m³) / ±25 µg/m³ | 1 µg/m³ |
| Atmospheric Pressure | 300 to 1100 hPa | ±5 hPa | 0.1 hPa |
Figure 3.
Mobile Weather Station and Data Logger (AIRPLE Inc.).
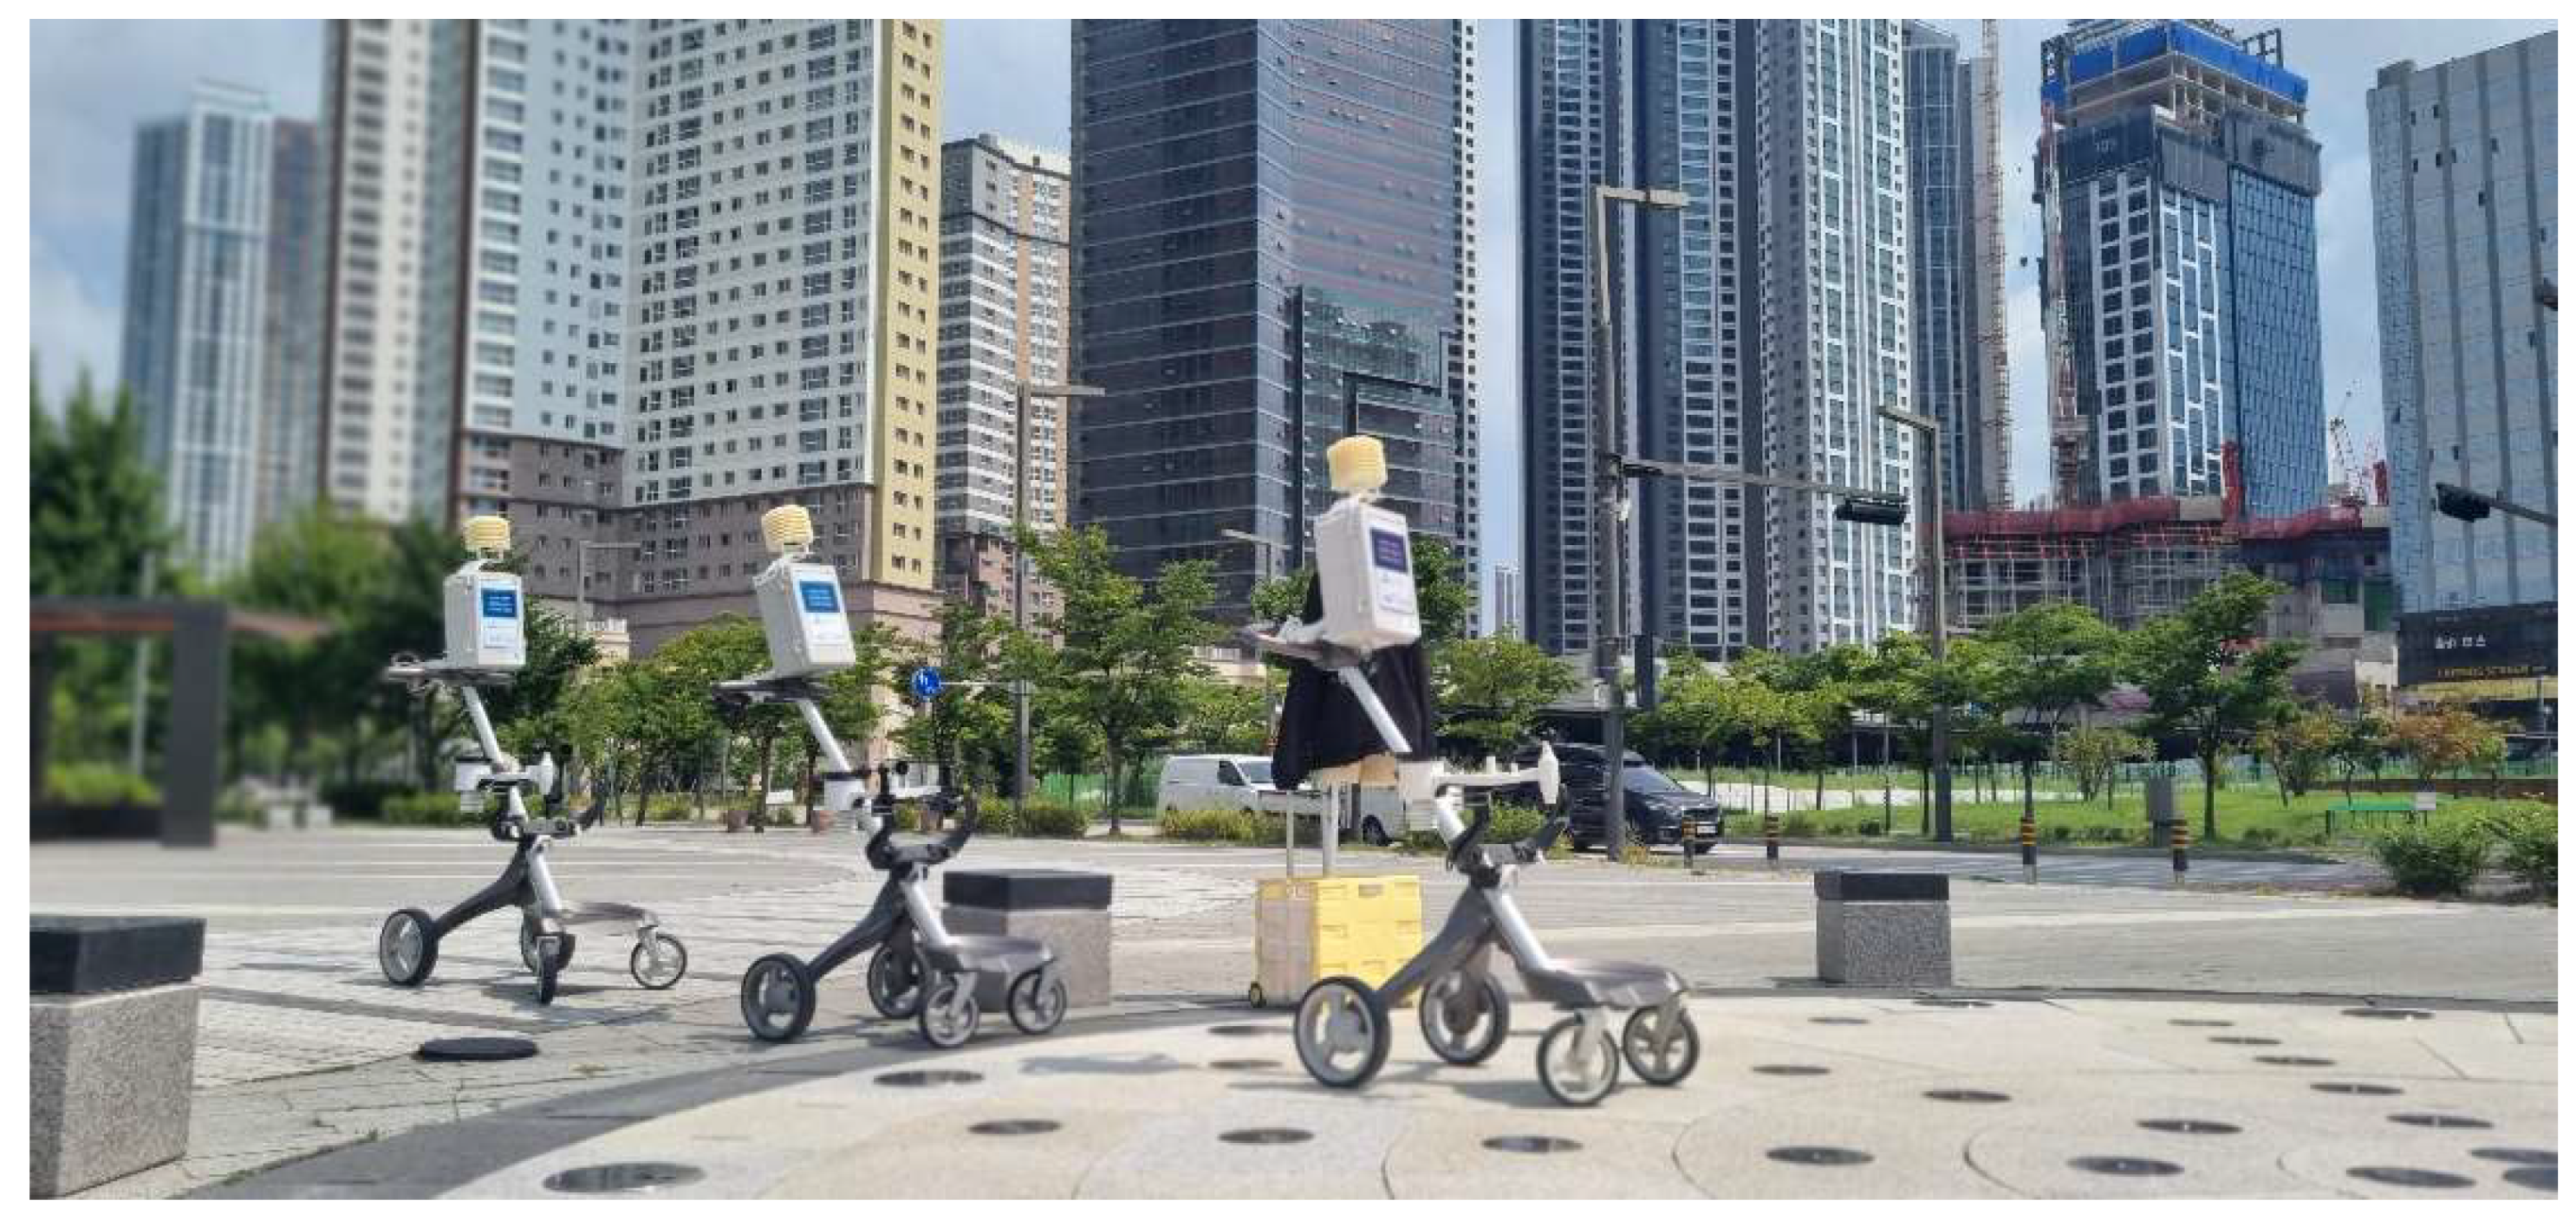
Figure 4.
Ground Fountain Sensor Placement (Radius 3.8 m, distances: 2 m, 4 m, 6 m).
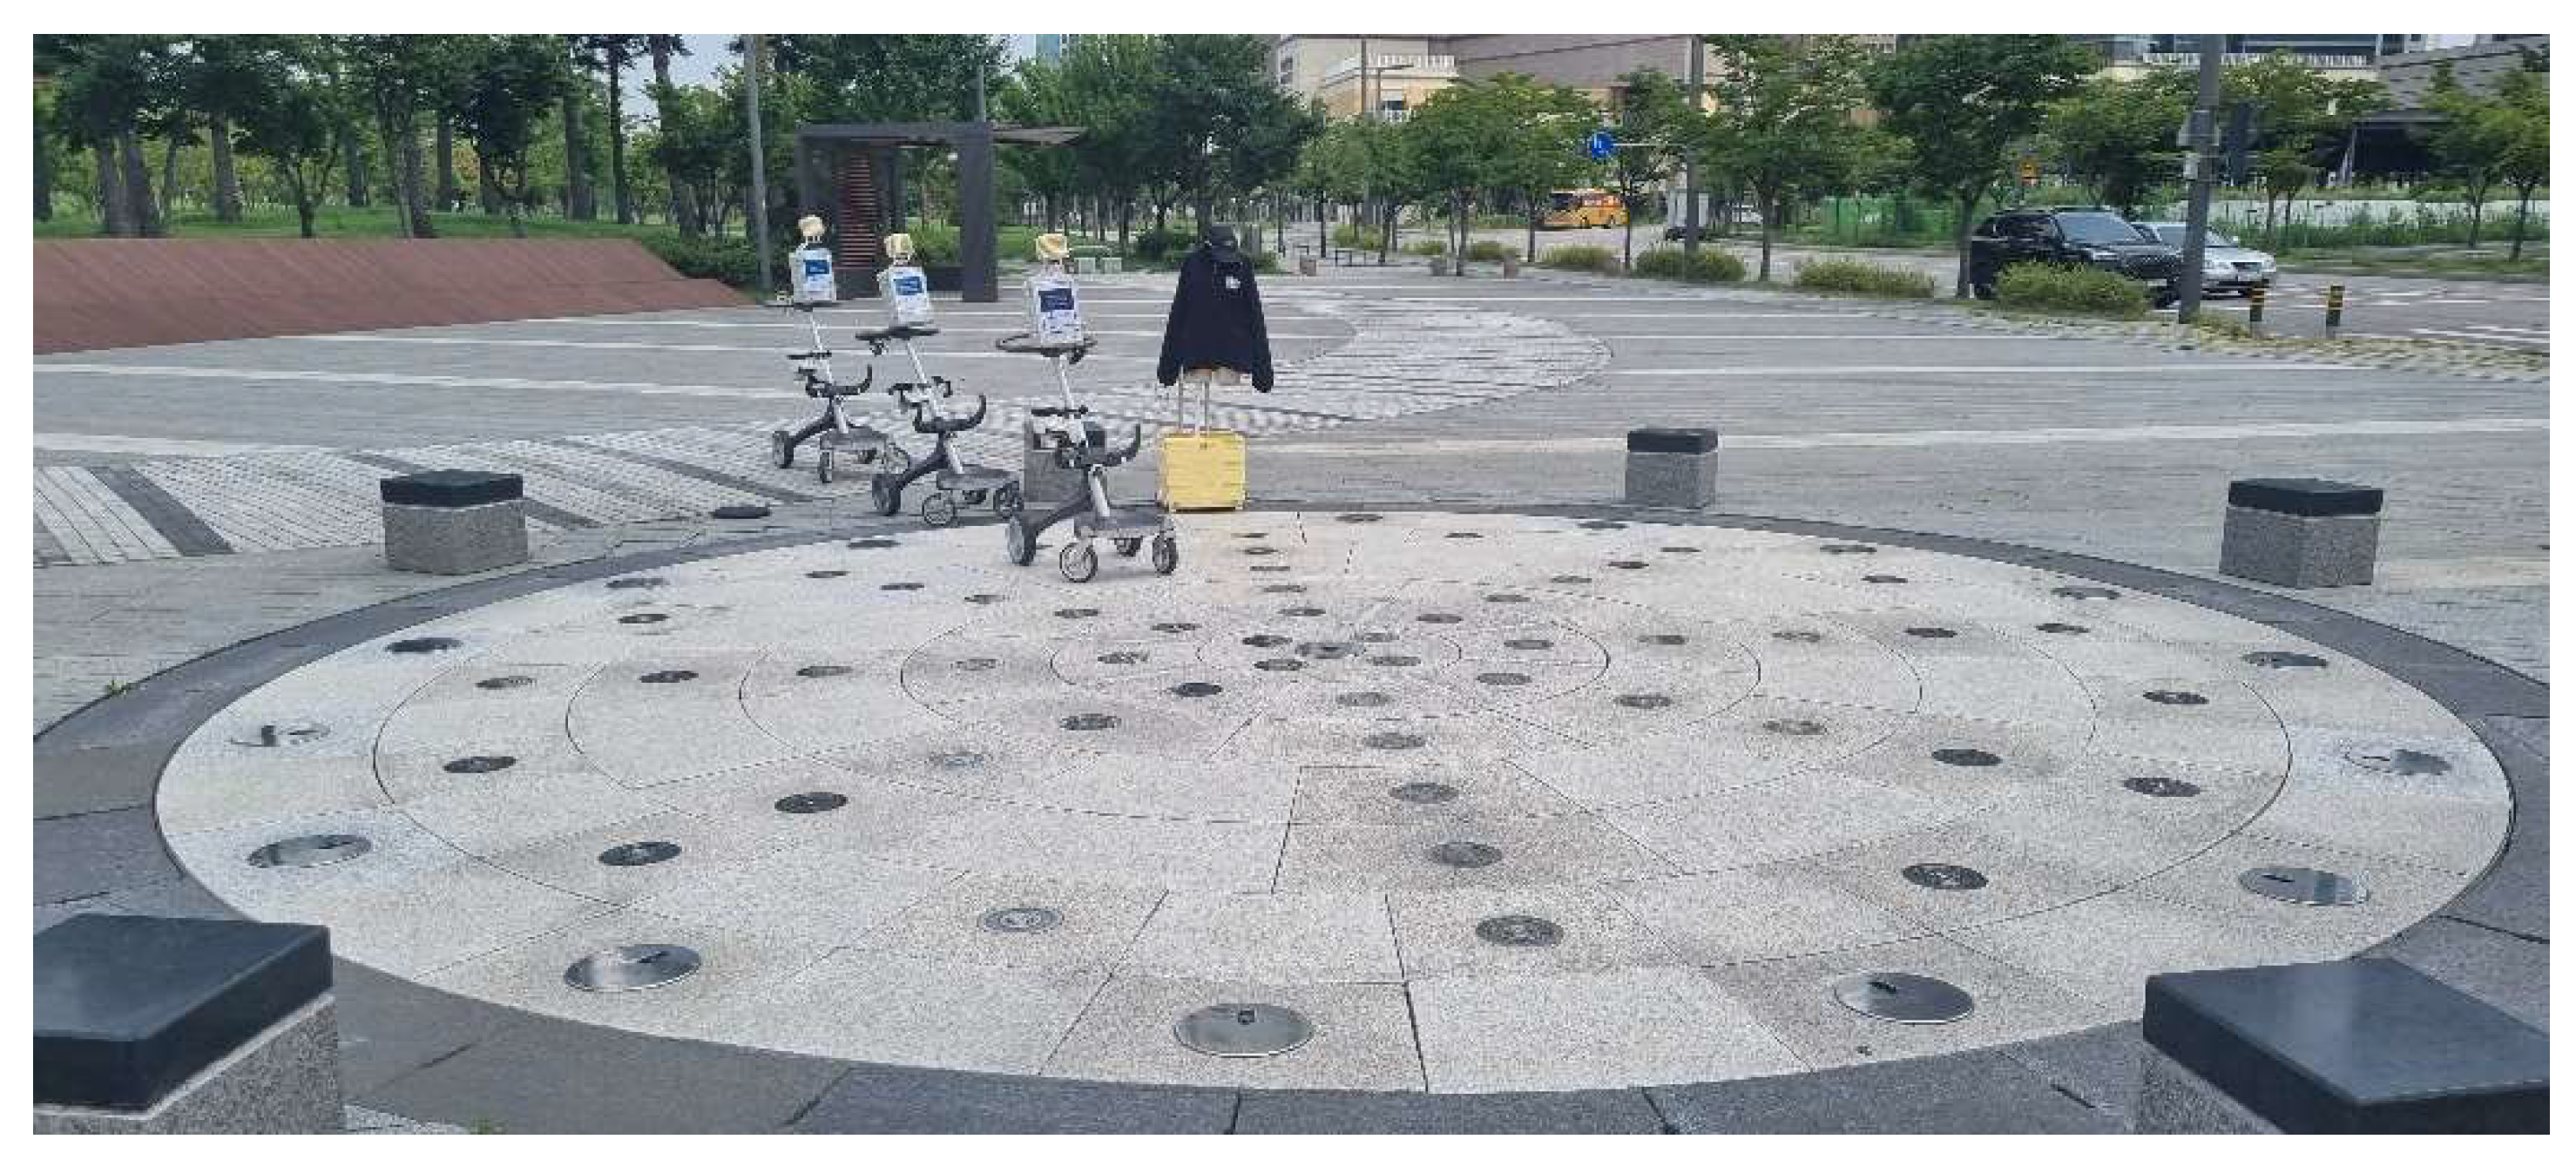
Figure 5.
Aerial Drone View of Ground Fountain.
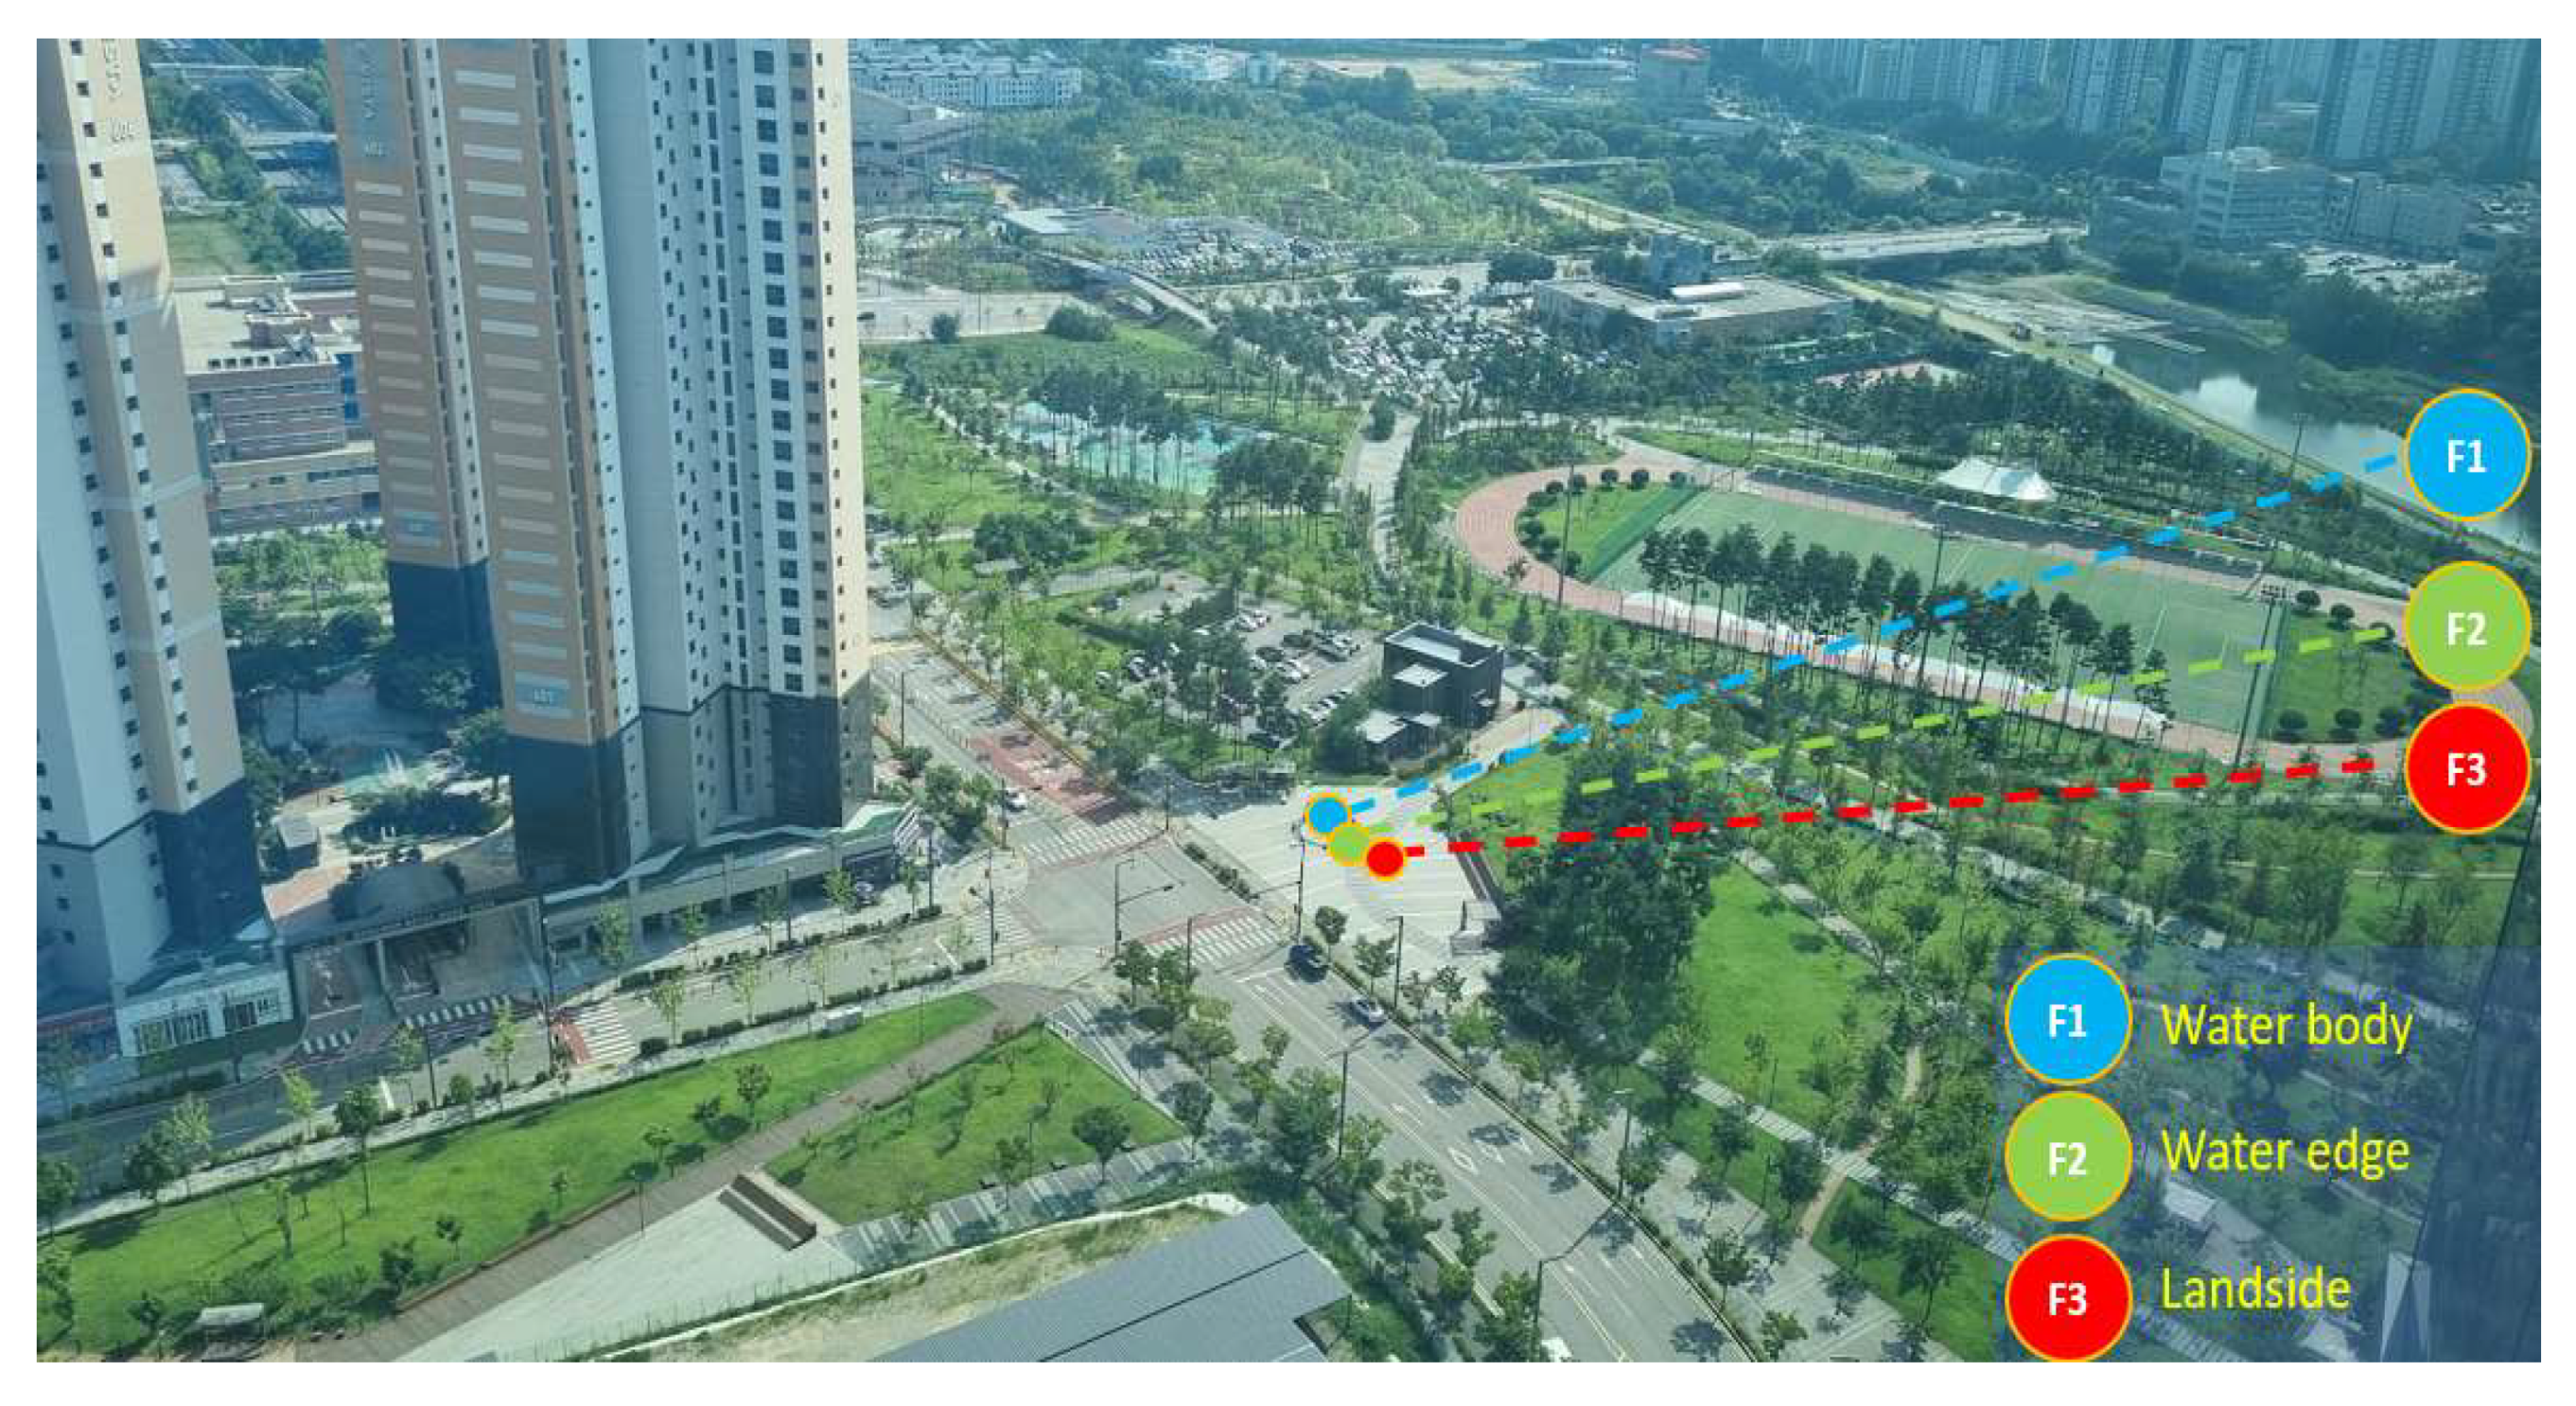
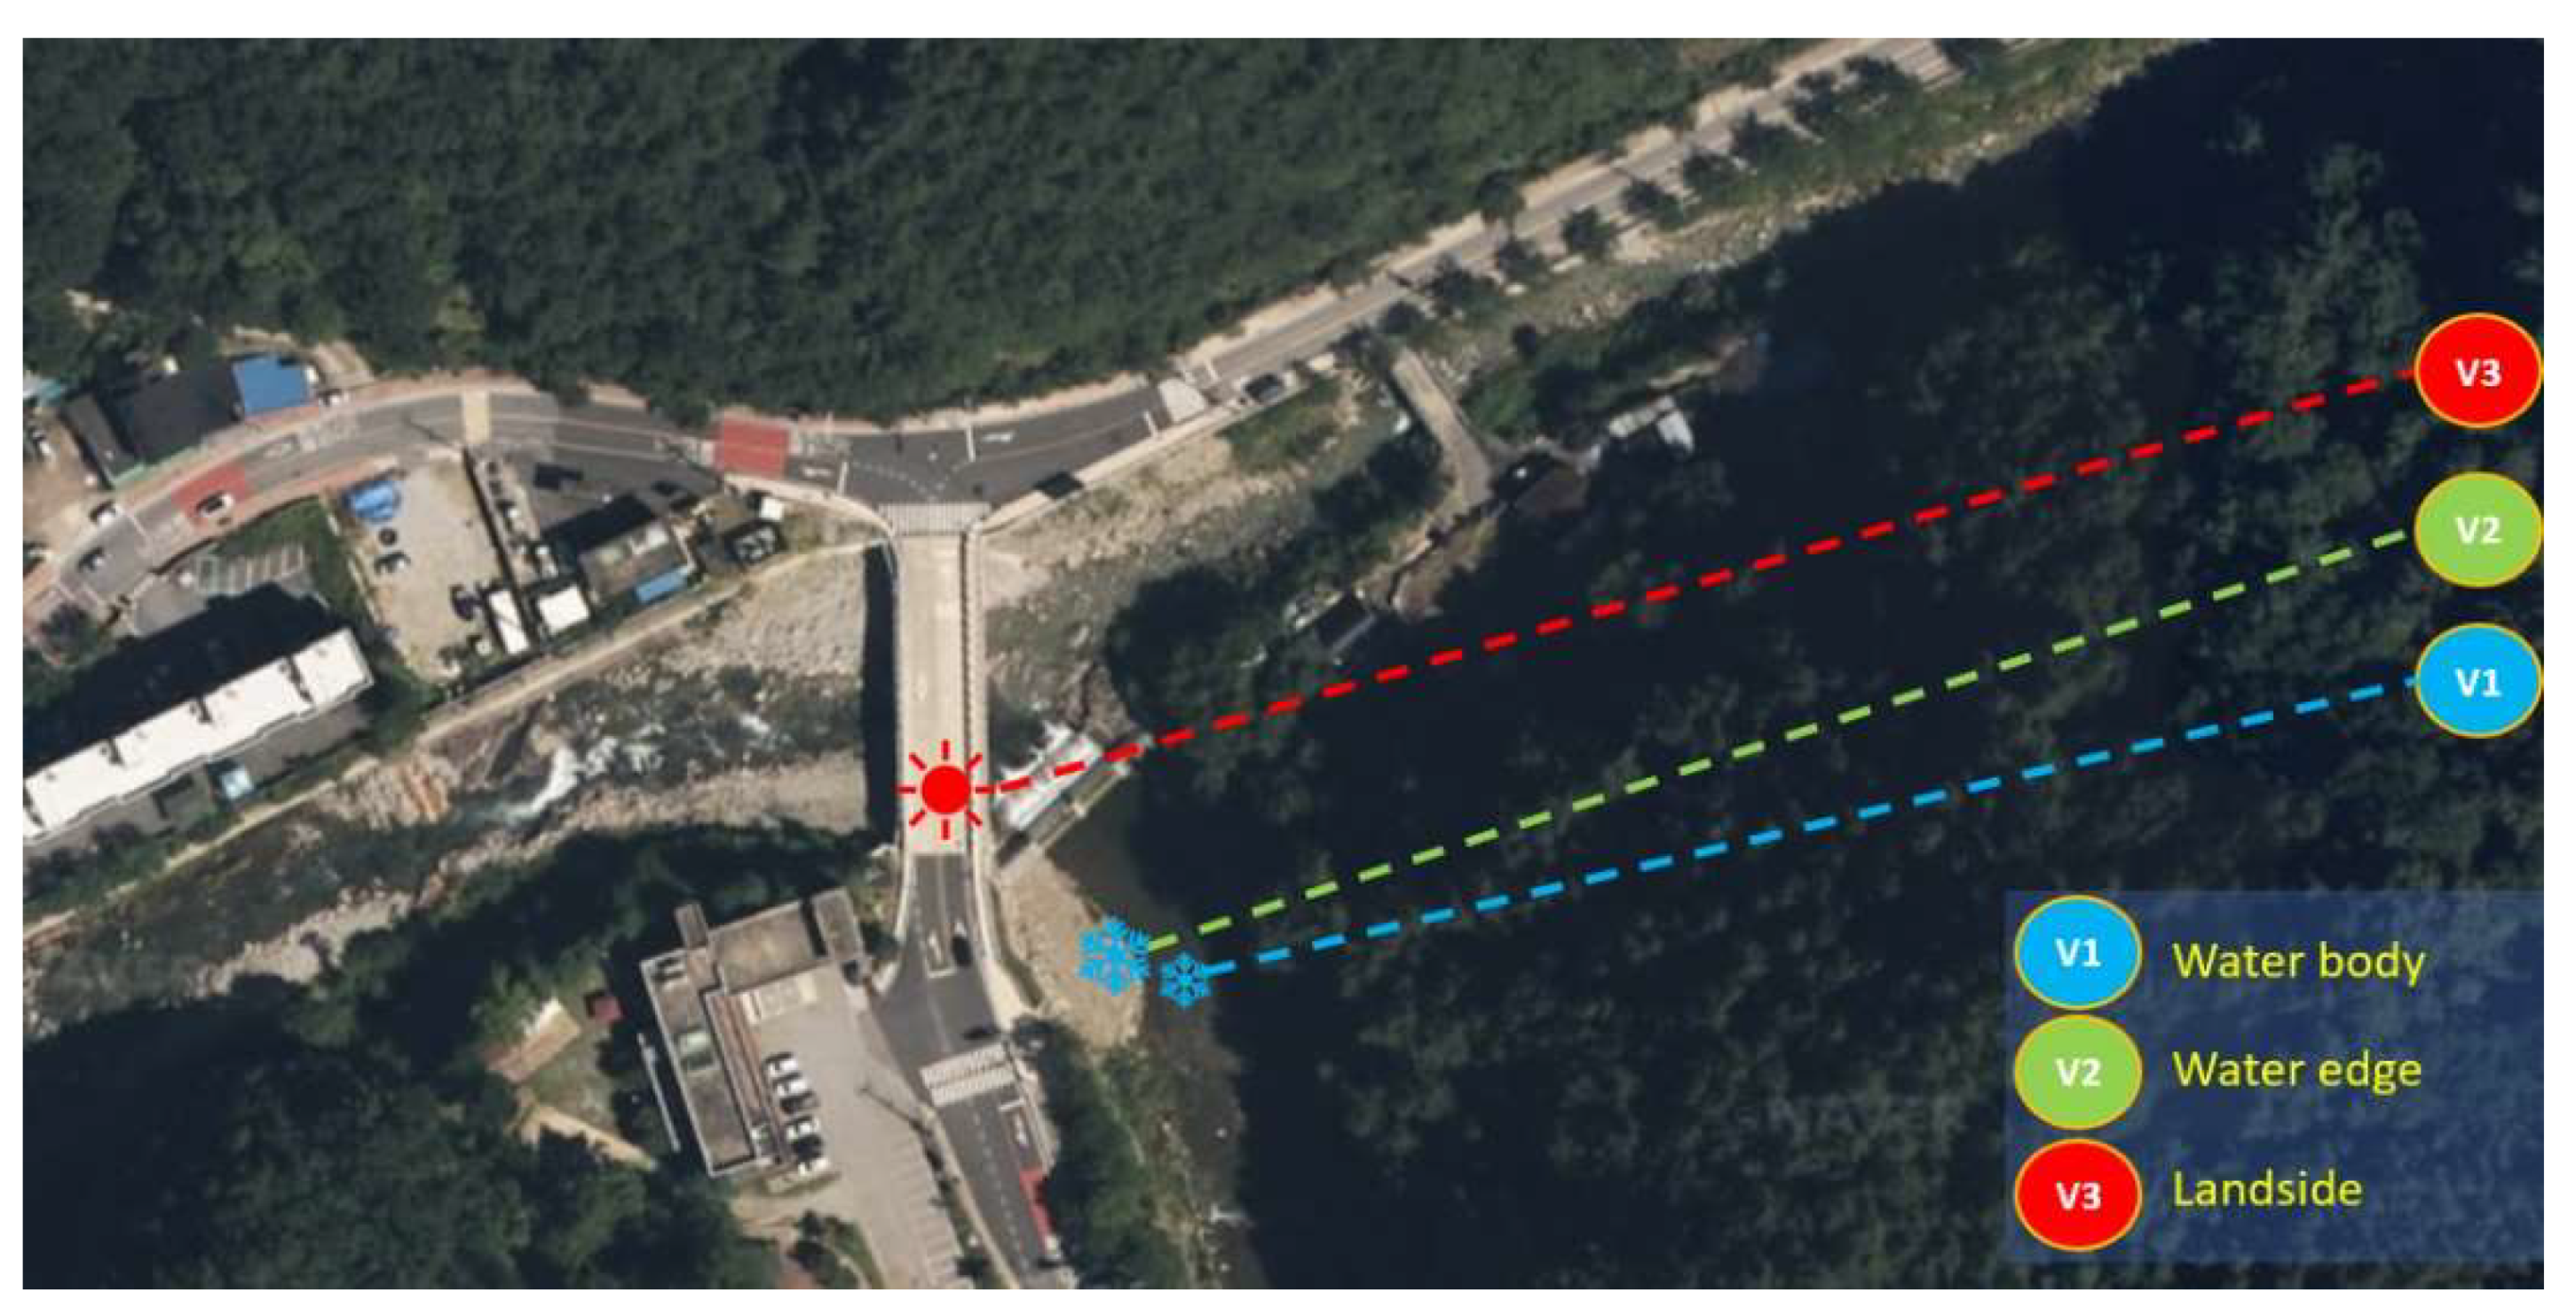
Figure 6.
Aerial Layout of AWS Installation in Chilrangi Valley (Source: Naver Maps) – Distances: V1 to V2: 5m, V3 to V2: 30m.
Figure 6.
Aerial Layout of AWS Installation in Chilrangi Valley (Source: Naver Maps) – Distances: V1 to V2: 5m, V3 to V2: 30m.
2.3. Experimental Design
- Measurements were conducted under stable weather conditions during July and August,which represent peak summer months in Korea.
- Three monitoring zones per site were designated: water zone, edge zone, and outer dry zone, allowing spatial comparison across microclimatic gradients.
- Observations were collected in the morning, midday, and evening to capture diurnal thermal shifts.
-
Independent sample t-tests were conducted to determine the significance of temperature differences across zones [19].
- ∘
- In the urban ground fountain site (Dongtan Yeoul Park), three zones were designated as F1 (center of the fountain water body), F2 (fountain edge), and F3 (adjacent dry land). Surface temperature was monitored using thermal infrared sensors at each zone (see Figure 7), while air temperature, humidity, and wind speed were recorded using AWS sensors (Ecowitt WS69) installed at corresponding points (see Figure 8).
- ∘
- In the natural stream site (Chilrangi Valley), V1 (stream center), V2 (streamside edge), and V3 (farther dry land) were similarly defined for spatial analysis. Surface temperature in each zone was measured via thermal imagery (Figure 14), and environmental sensing (air temper-ature, humidity, and wind) was conducted using the same AWS setup as in the urban site (see Figure 15).
- ∘
- This design enabled precise comparison between artificial (F1–F3) and natural (V1–V3) cooling zones in terms of both physical surface tem-peratures and atmospheric conditions, providing a multidimensional view of thermal performance.
Figure 10.
Nighttime Operation of Ground Fountain.
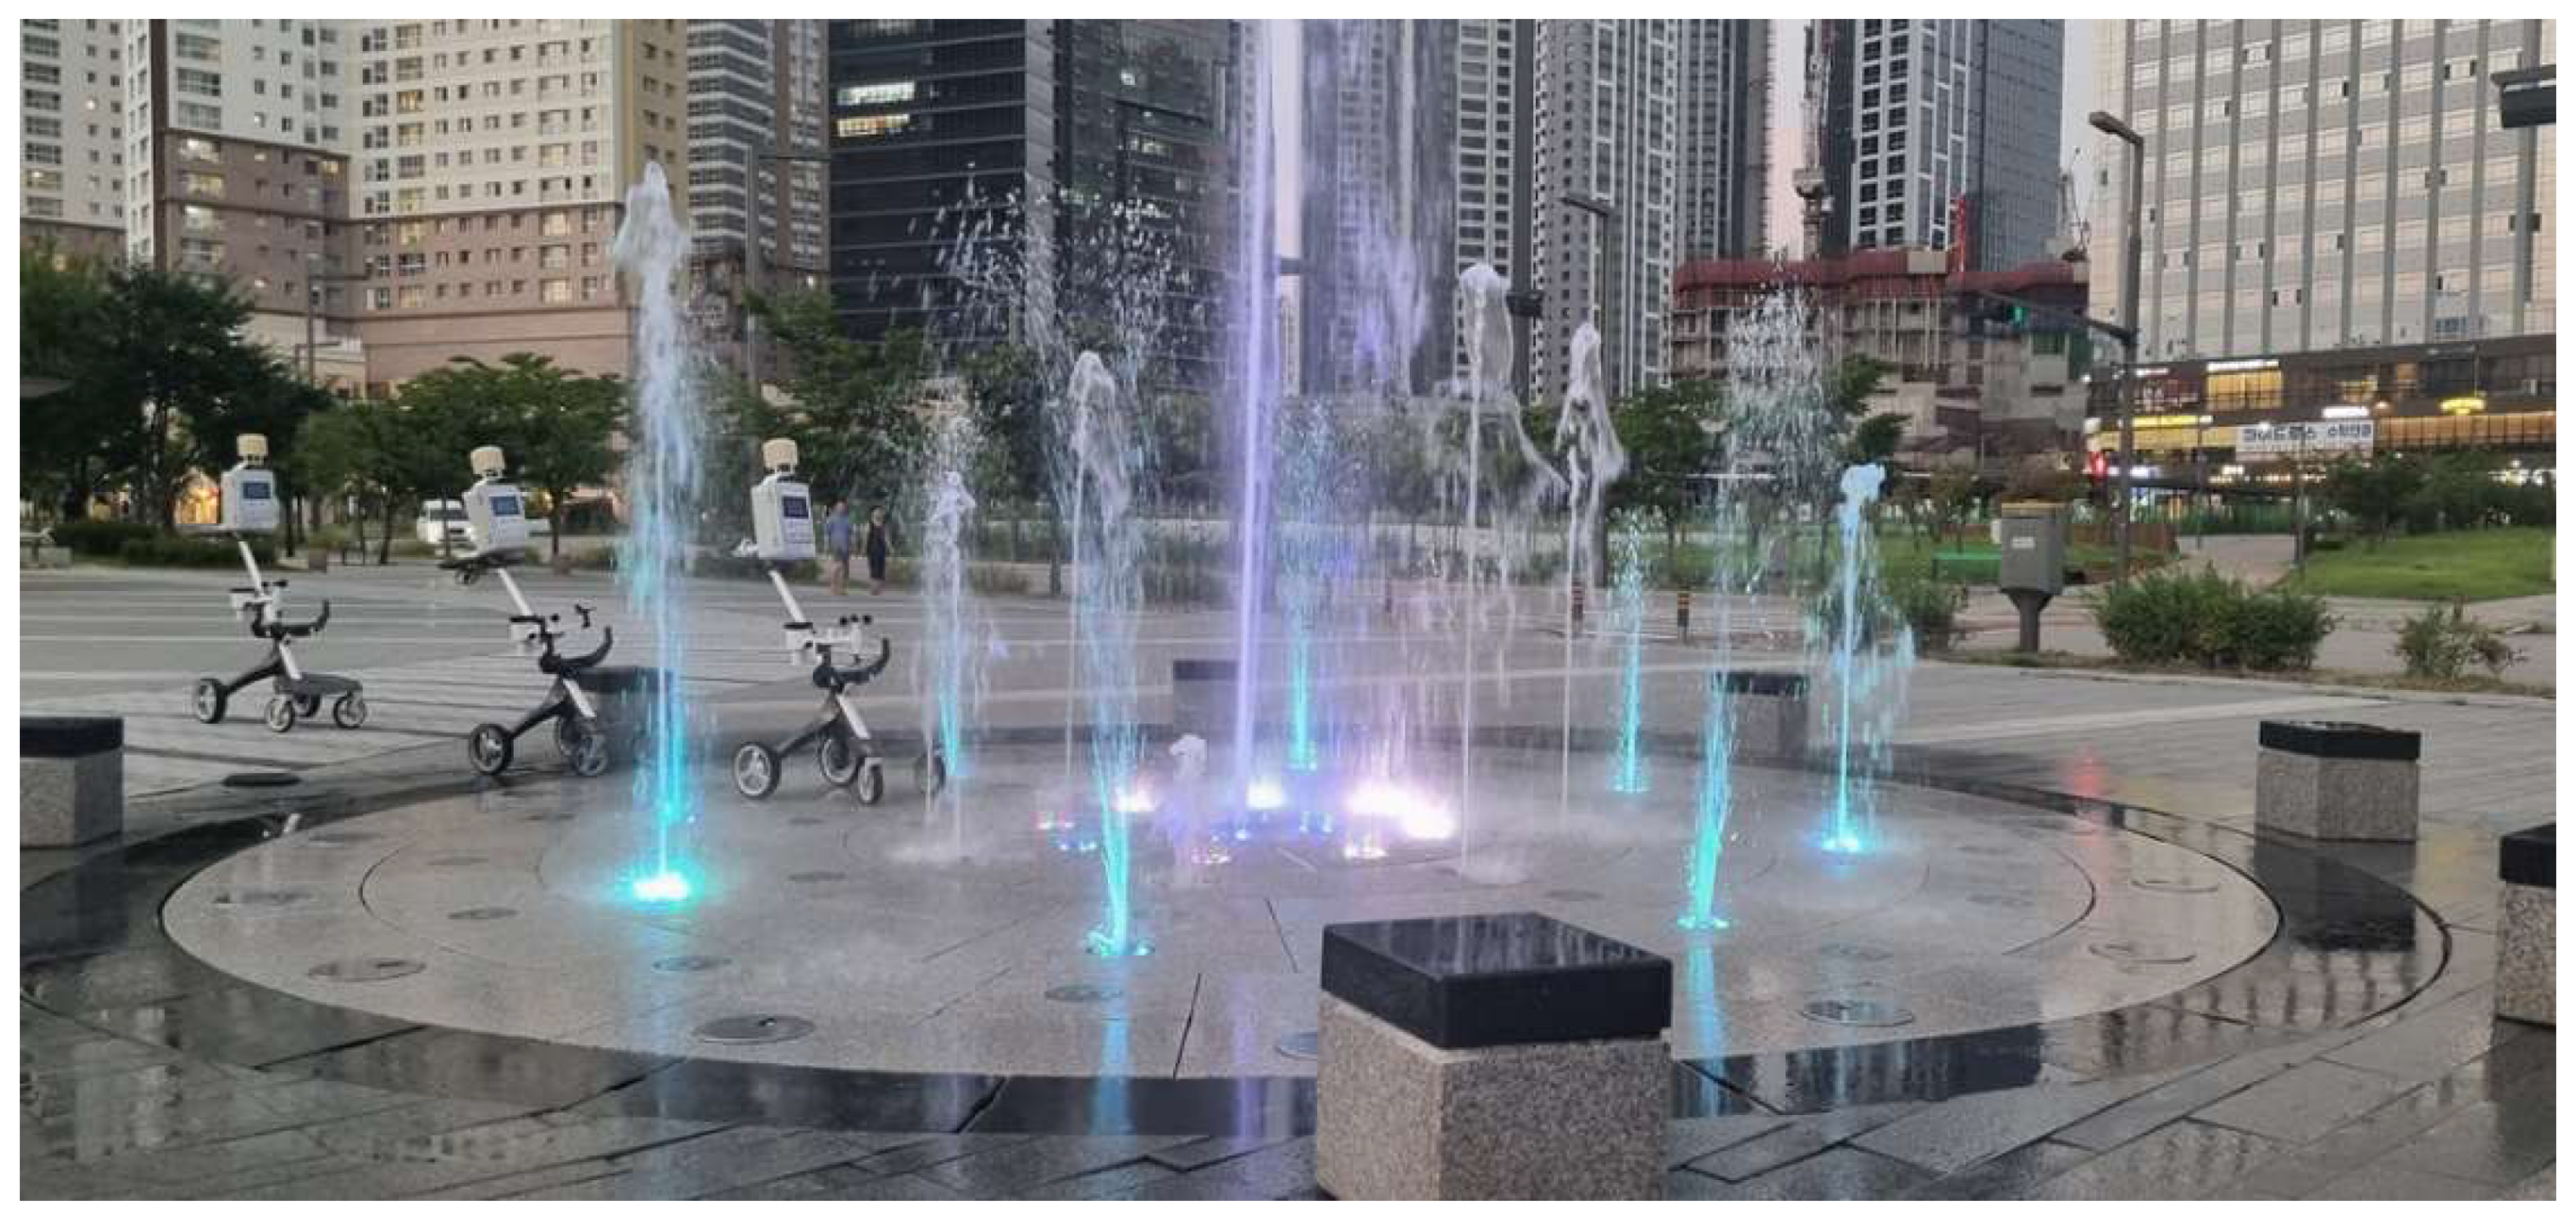
Figure 11.
Summer Visitors Enjoying Chilrangi Valley.
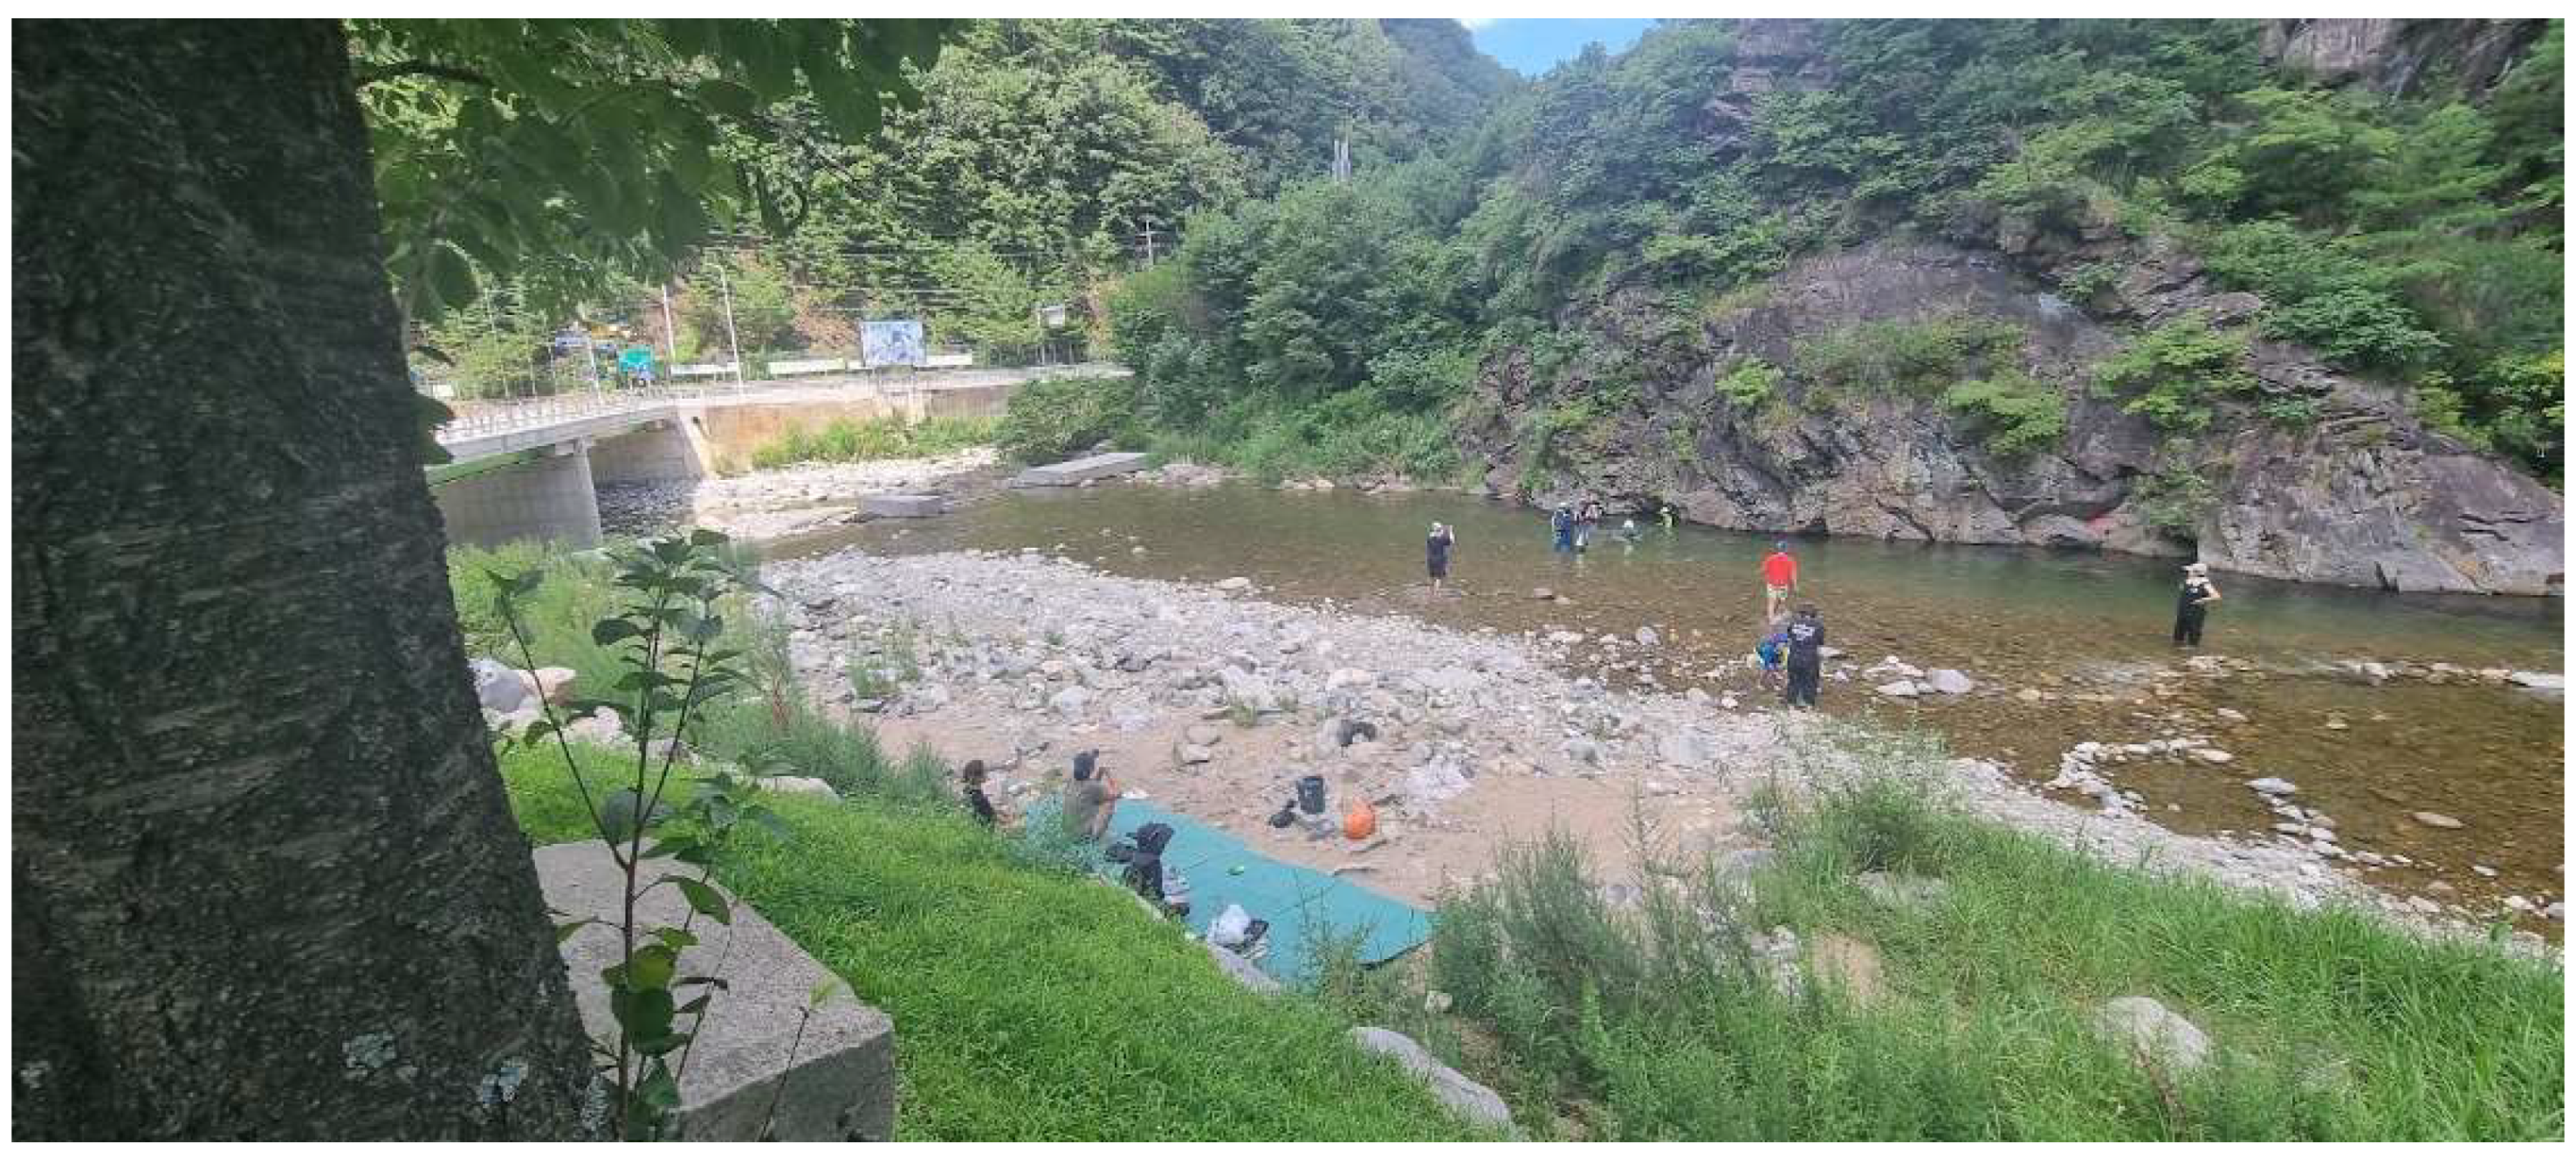
Figure 12.
Bridge Measurement Location (V3, Landside) in Chilrangi Valley.
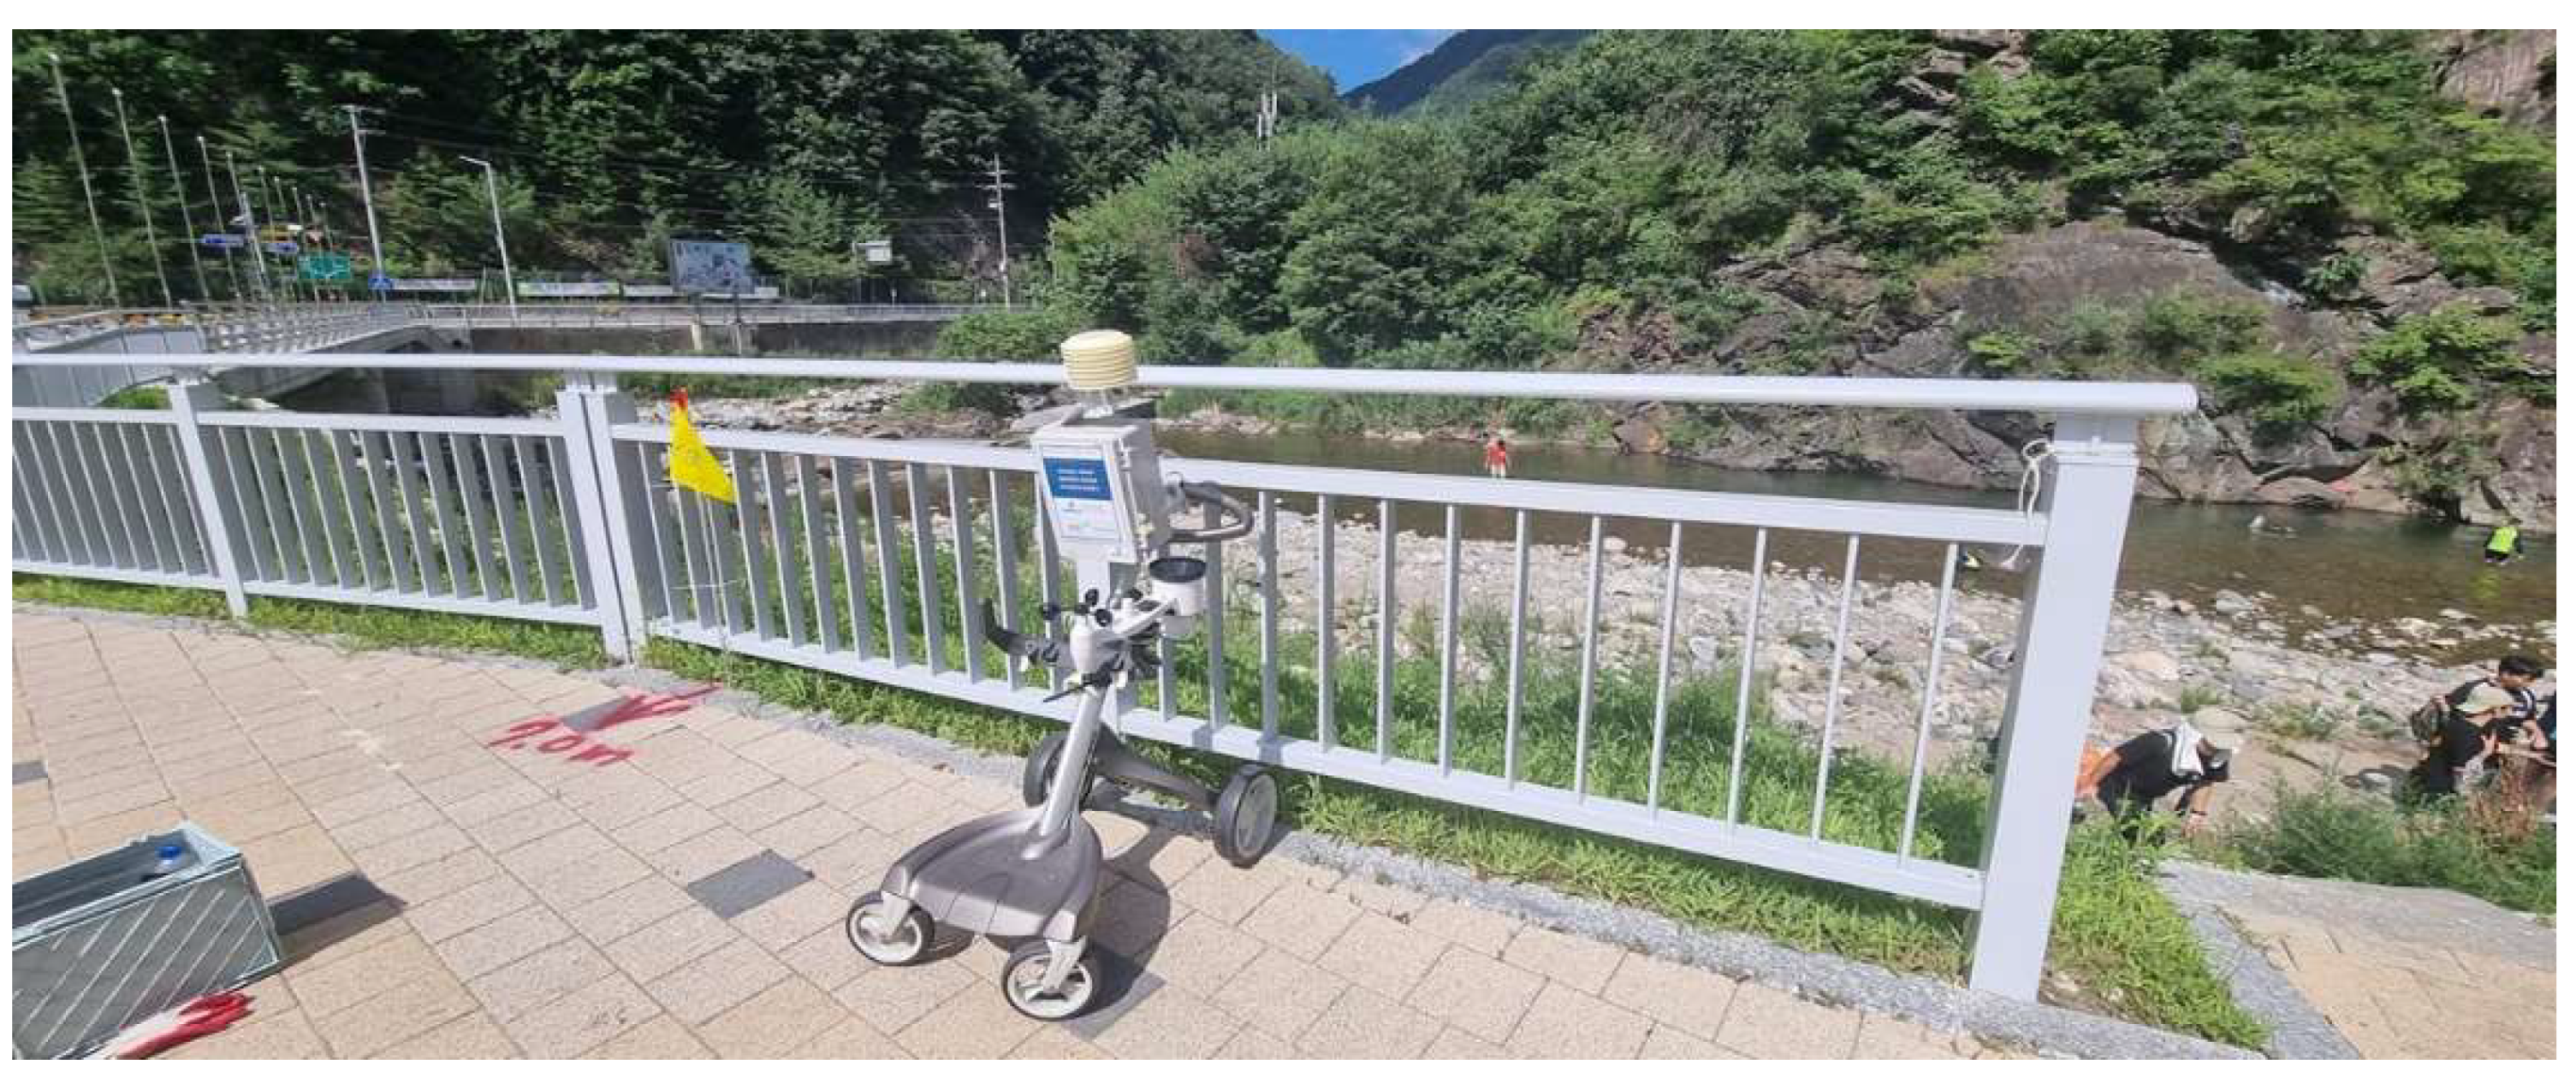
Figure 13.
Overview of Chilrangi Valley.
2.4. MRT and UTCI Calculations
In addition to standard air and surface temperature measurements, this study placed emphasis on evaluating thermal comfort using MRT and UTCI.
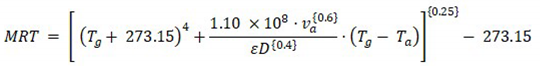
Mean Radiant Temperature (MRT) represents the combined effect of all shortwave and longwave radiation fluxes received by a human body. It is a critical parameter in outdoor thermal comfort studies. MRT can be approximately calculated using the following simplified formula when black globe temperature (Tg), air temperature (Ta), and wind speed (Va) are known [20]:
 where:
- Tg : globe temperature (°C)
- Ta : air temperature (°C)
- Va: wind speed (m/s)
- ɛ : emissivity (commonly 0.95 for a standard black globe)
- D: globe diameter in meters (typically 0.15 m)
This Equation (1), widely accepted in outdoor thermal studies, was referenced and adapted from Kwon et al. (2024) in Buildings.
Universal Thermal Climate Index (UTCI) is a composite index that integrates multiple meteorological variables (air temperature, wind speed, humidity, and MRT) to estimate thermal stress experienced by the human body. It provides a standardized and physiologically meaningful measure of outdoor heat stress.
UTCI was calculated using the simplified regression-based model adapted for field studies as Equation (2):
UTCI =Tair + v × (MRT - Tair) × (1 - 0.005 × RH),
Where:
- Tair is the indoor air temperature.
- MRT is the Mean Radiant Temperature.
- RH is the relative humidity inside the room.
- v is the wind velocity in meters per second (m/s).
The wind speed recorded by the Ecowitt WS69 AWS sensor is in kilometers per hour (km/h), so we convert it to meters per second (m/s) by dividing the recorded wind speed by 3.6:
v = Wind Speed (km/h) / 3.6
UTCI was calculated using the simplified regression-based model adapted for field studies. For conversion:
- Wind speed (originally recorded by the Ecowitt WS69 AWS sensor in km/h) was converted to m/s by dividing by 3.6 as Equation (3) .
- UTCI was computed using the PythermalcomfortPython package, which implements UTCI equations from the official UTCI.org reference algorithm [21].
- Environmental sensor data (air temperature, humidity, wind speed, and solar radiation) were obtained from Ecowitt WS69 (Shenzhen, China)and T&D TR-71wf (Matsumoto, Japan)sensors, which were calibrated prior to installation.
Data were recorded every five minutes and transmitted via Wi-Fi (GW1101 station). The calculated UTCI values were plotted for visualization and comparison between the structures and zones.
The incorporation of MRT and UTCI offers a deeper assessment of not only physical temperature reduction but also the perceived comfort levels experienced by humans. By integrating these advanced indices, this study enhances its ability to quantify and compare the efficacy of natural streams versus artificial fountains in mitigating heat stress under real-world urban and rural conditions [22,23].
3. Results
3.1. Air Temperature Reduction
3.1.1. Ground Fountain
Maximum air temperature reduction of 2.26°C was observed within 5 meters of the fountain, but the cooling effect diminished quickly beyond this range. This finding aligns with previous studies indicating that evaporative cooling from ground fountains provides highly localized but short-range temperature mitigation in urban spaces [2,6].
3.1.2. Comparison of Temperature Reduction Effects
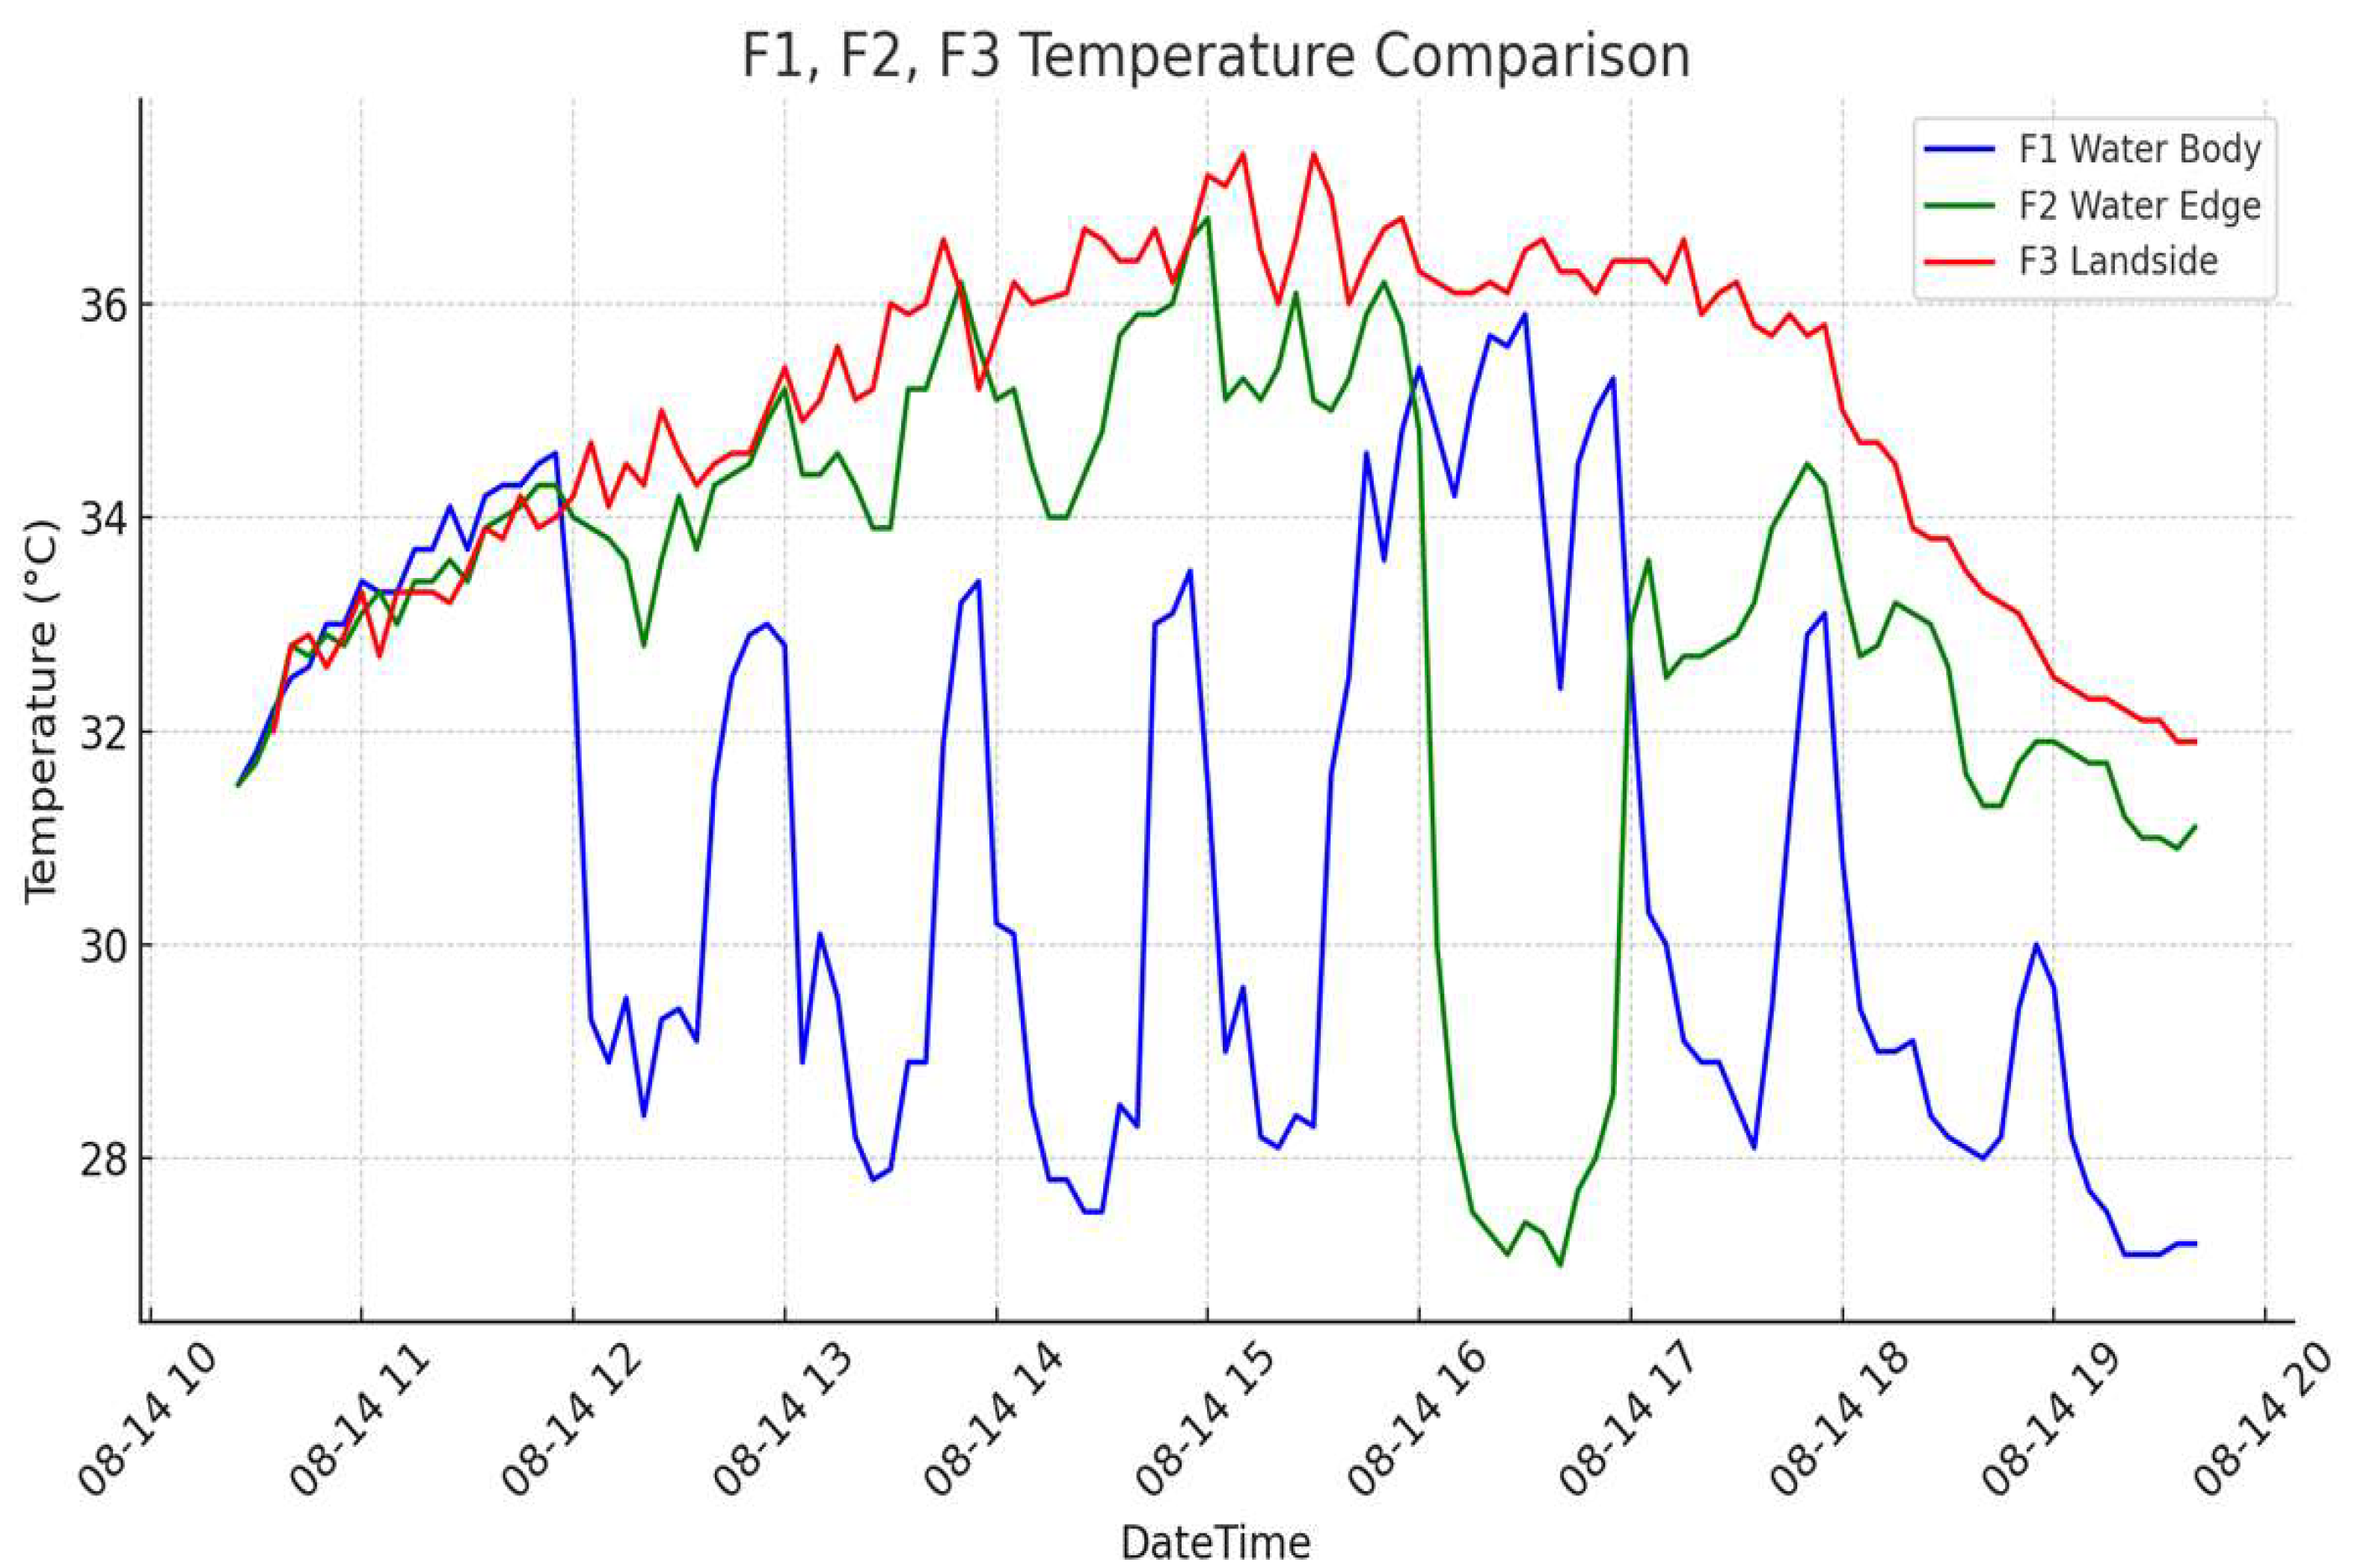
- F1 (Water Body): Minimum temperature: 28.0°C, Maximum temperature: 40.6°C, Average temperature: 35.65°C. The center of the fountain area recorded the lowest average temperature due to evaporative cooling.
- F2 (Water Edge): Minimum temperature: 31.7°C, Maximum temperature: 42.1°C, Average temperature: 37.27°C. Positioned at the edge of the fountain, this area experienced moderate cooling effects but recorded slightly higher temperatures than F1.
- F3 (Landside): Minimum temperature: 31.7°C, Maximum temperature: 43.2°C, Average temperature: 37.70°C. Located outside the influence of water, this area exhibited the highest temperatures, indicating the intensified urban heat island effect [4].
These spatial differences validate the heat-reducing capacity of water-centered features under urban conditions.
3.1.3. Conclusion and Implications
The ground fountain effectively reduces urban heat, with F1 and F2 showing significantly lower temperatures compared to F3.
The highest temperature differenceswere recorded between F1 (water center) and F3 (dry zone), proving the strong localized cooling effectof water-based solutions [3,6].
The results highlight the importance of strategic placement of water featuresin urban environments to maximize cooling benefits [5,10].
Figure 16.
Air Temperature Comparison at F1, F2, F3.
3.1.4. Natural Stream
3.1.5. Statistical Analysis: Independent Sample t-Test
SPSS software was used to conduct an independent sample t-test to determine whether the temperature differences between F1 and F2 were statistically significant.
Temperature data were recorded at 5-minute intervals over the entire measurement period.
3.1.6. Conclusion and Implications
The ground fountain effectively reduces urban heat, with F1 and F2 showing significantly lower temperatures compared to F3.
The strongest cooling effect was observed between F1 (center of water) and F3 (dry area).
The natural stream site exhibited more stable and greater cooling than the fountain, supporting its role as a long-term cooling infrastructure.
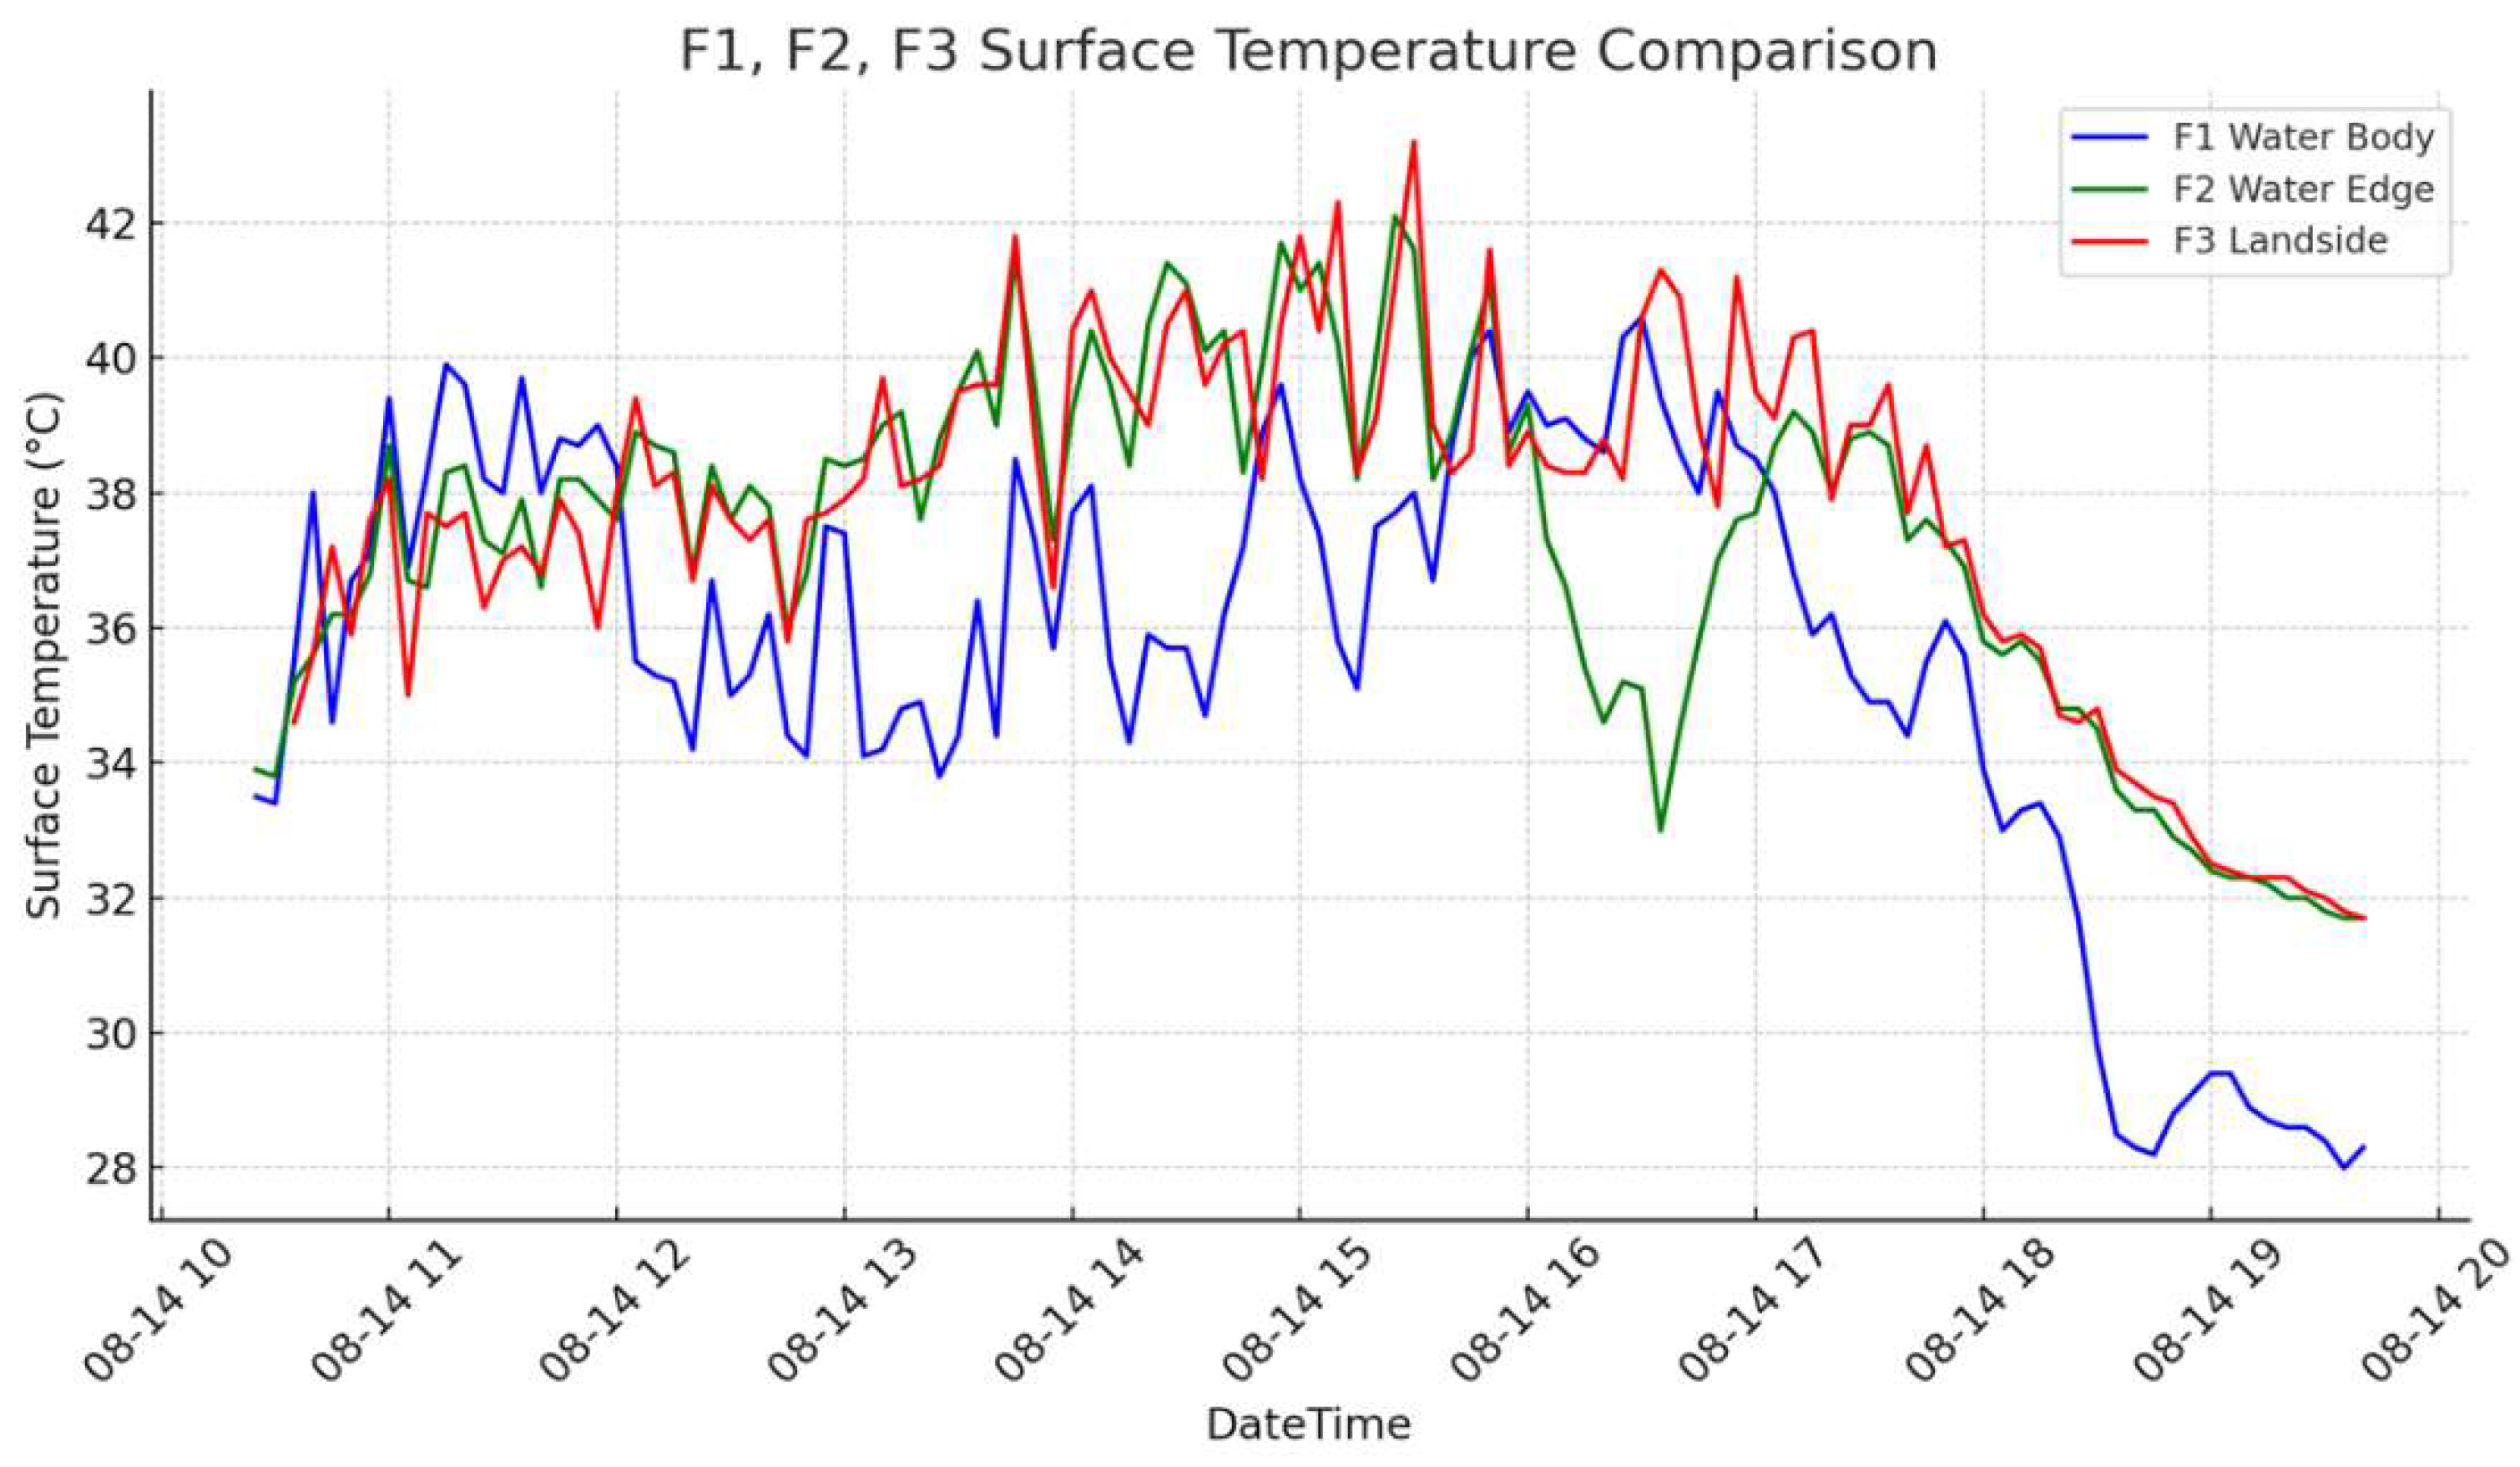
3.2. Comparison of Surface Temperature Reduction Effects
3.2.1. Surface Temperature Comparison (Ground Fountain)
- F1 (Water Body):
Minimum: 28.0°C, Maximum: 40.6°C, Average: 35.65°C.
The center of the fountain exhibited the lowest surface temperatures due to direct evaporative cooling.
- F2 (Water Edge):
Minimum: 31.7°C, Maximum: 42.1°C, Average: 37.27°C.
Moderate cooling was observed, but higher than F1 due to partial exposure to surrounding heat.
- F3 (Landside):
Minimum: 31.7°C, Maximum: 43.2°C, Average: 37.70°C.
3.2.2. Conclusion and Implications (Surface Temperature)
The ground fountain effectively reduced surface temperature within its vicinity.
- F3 showed a clear urban heat island effect, reinforcing the need for cooling systems in exposed urban zones.
Figure 17.
Surface Temperature Comparison at F1, F2, F3.
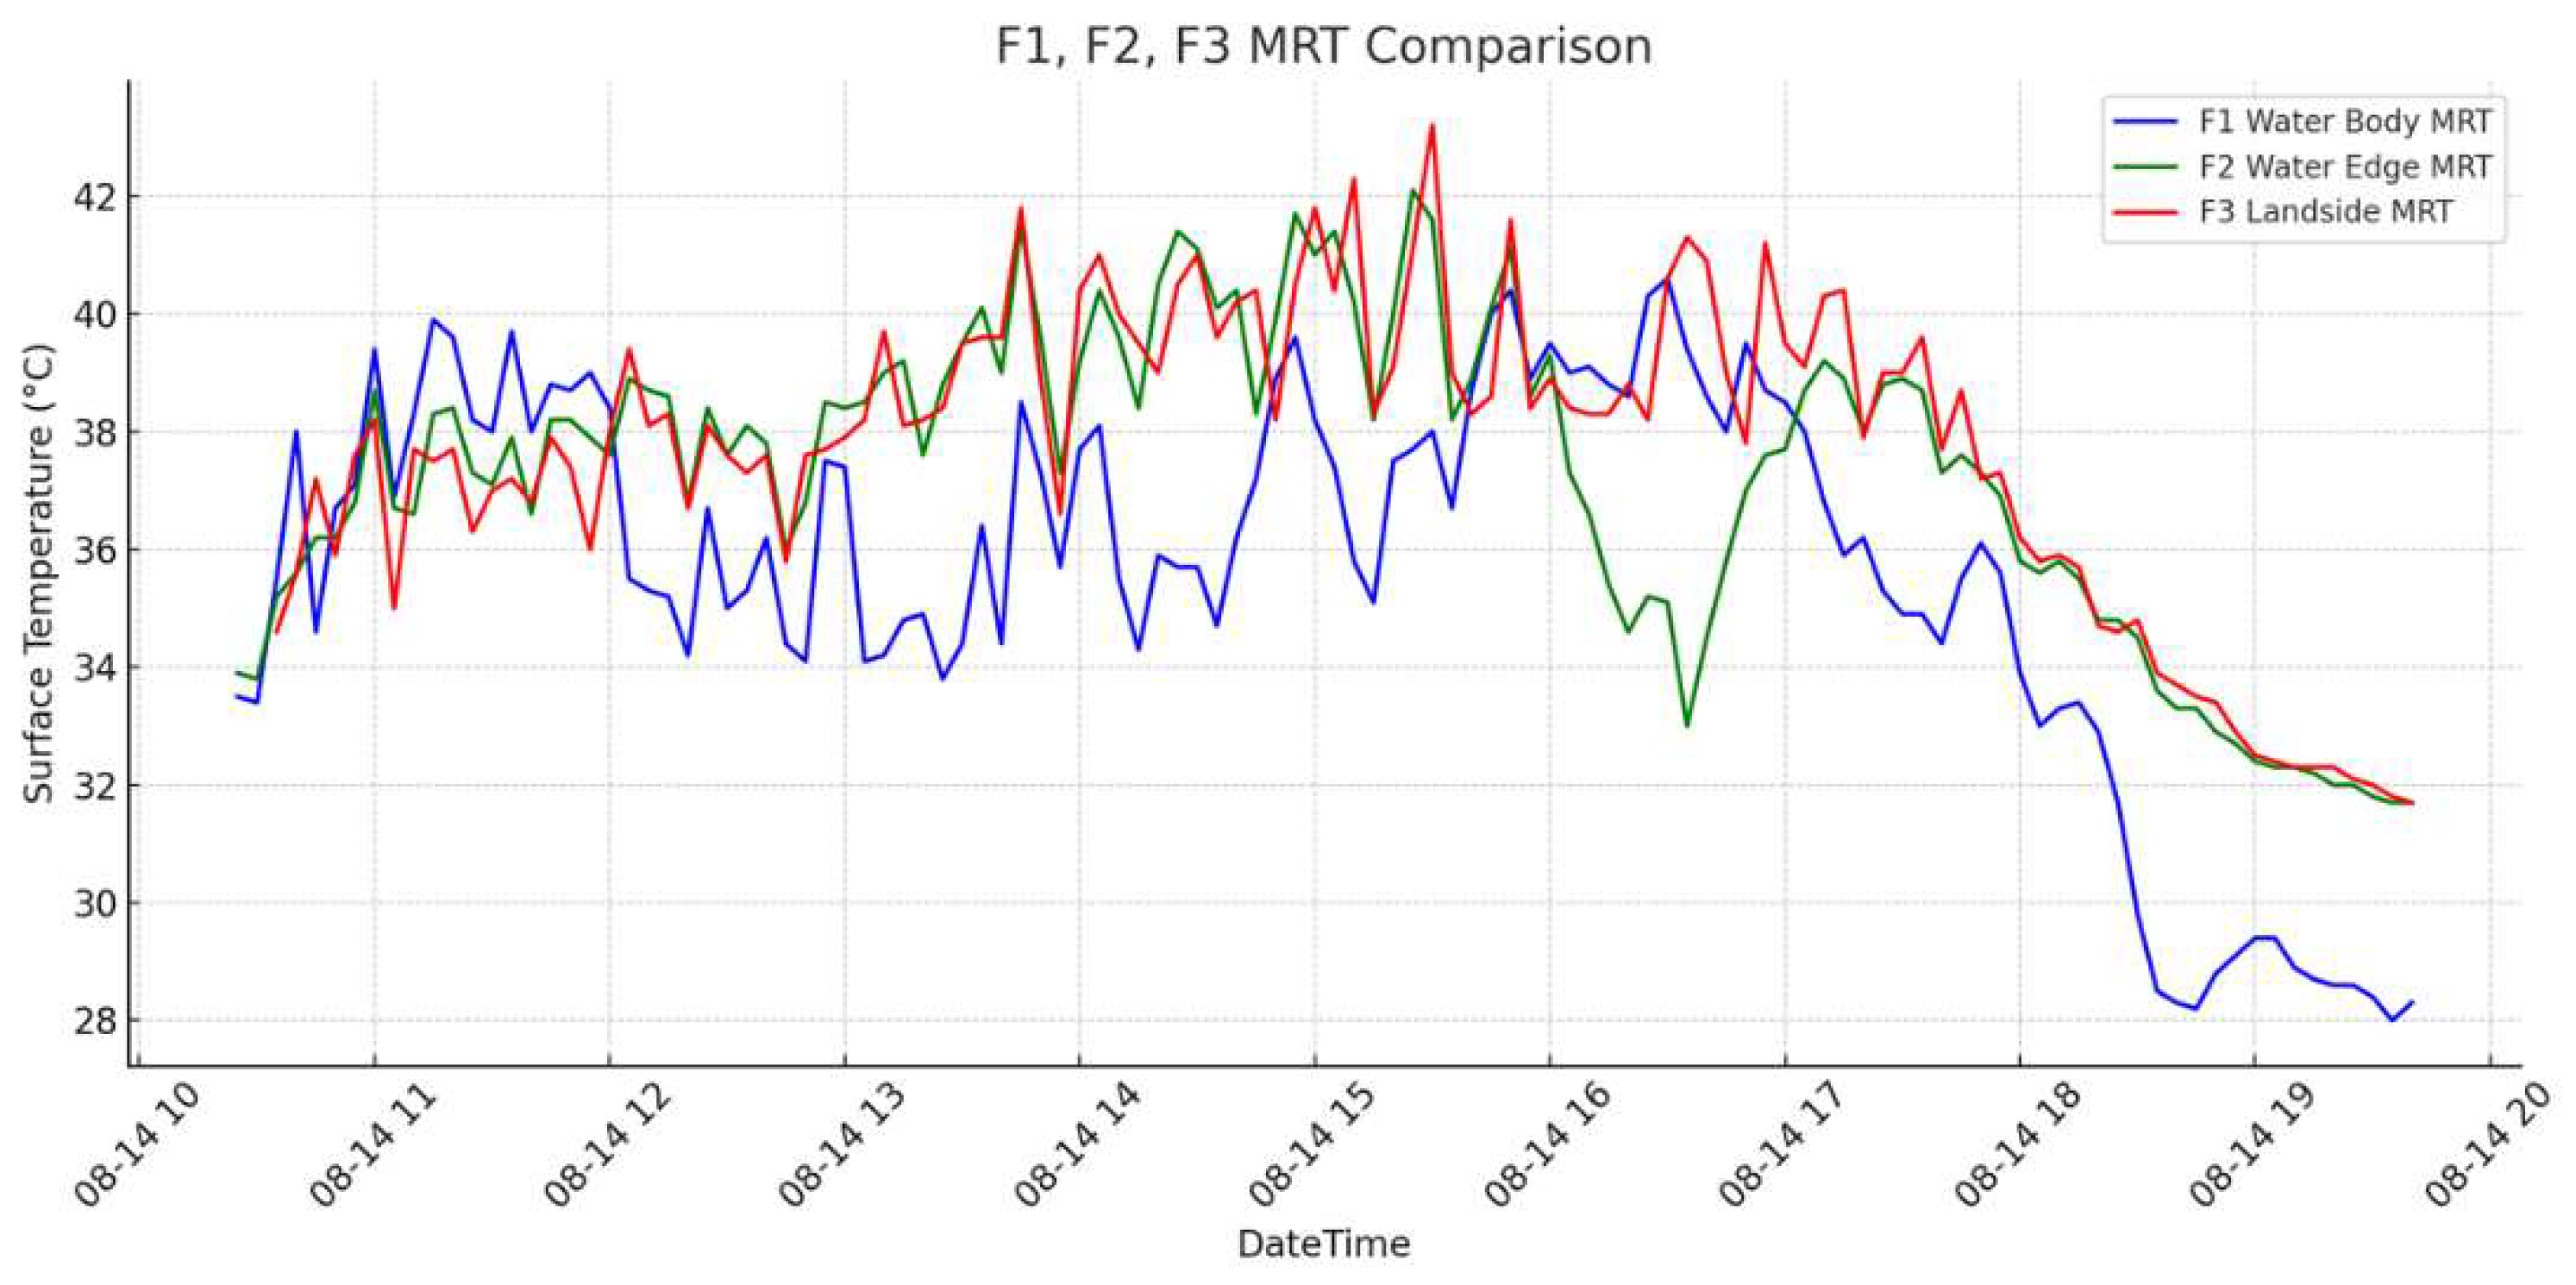
3.2.3. MRT (Mean Radiant Temperature) Comparison (Ground Fountain)
- F1 (Water Body – Blue):
Minimum MRT: 28°C, Maximum: 41°C, Average: 35°C
- F2 (Water Edge – Green):
Minimum MRT: 30°C, Maximum: 42°C, Average: 37°C
- F3 (Landside – Red):
Minimum MRT: 31°C, Maximum: 43°C, Average: 38°C
3.2.4. Conclusion and Implications (MRT)
- F1 exhibited the lowest MRT, affirming the thermal buffering effect of water-based features.
- MRT values increased progressively from the center outward, indicating the localized impact of water cooling [19].
Incorporating fountains and shallow water systems can enhance outdoor thermal comfort in cities.
Figure 18.
MRT Comparison at F1, F2, F3.
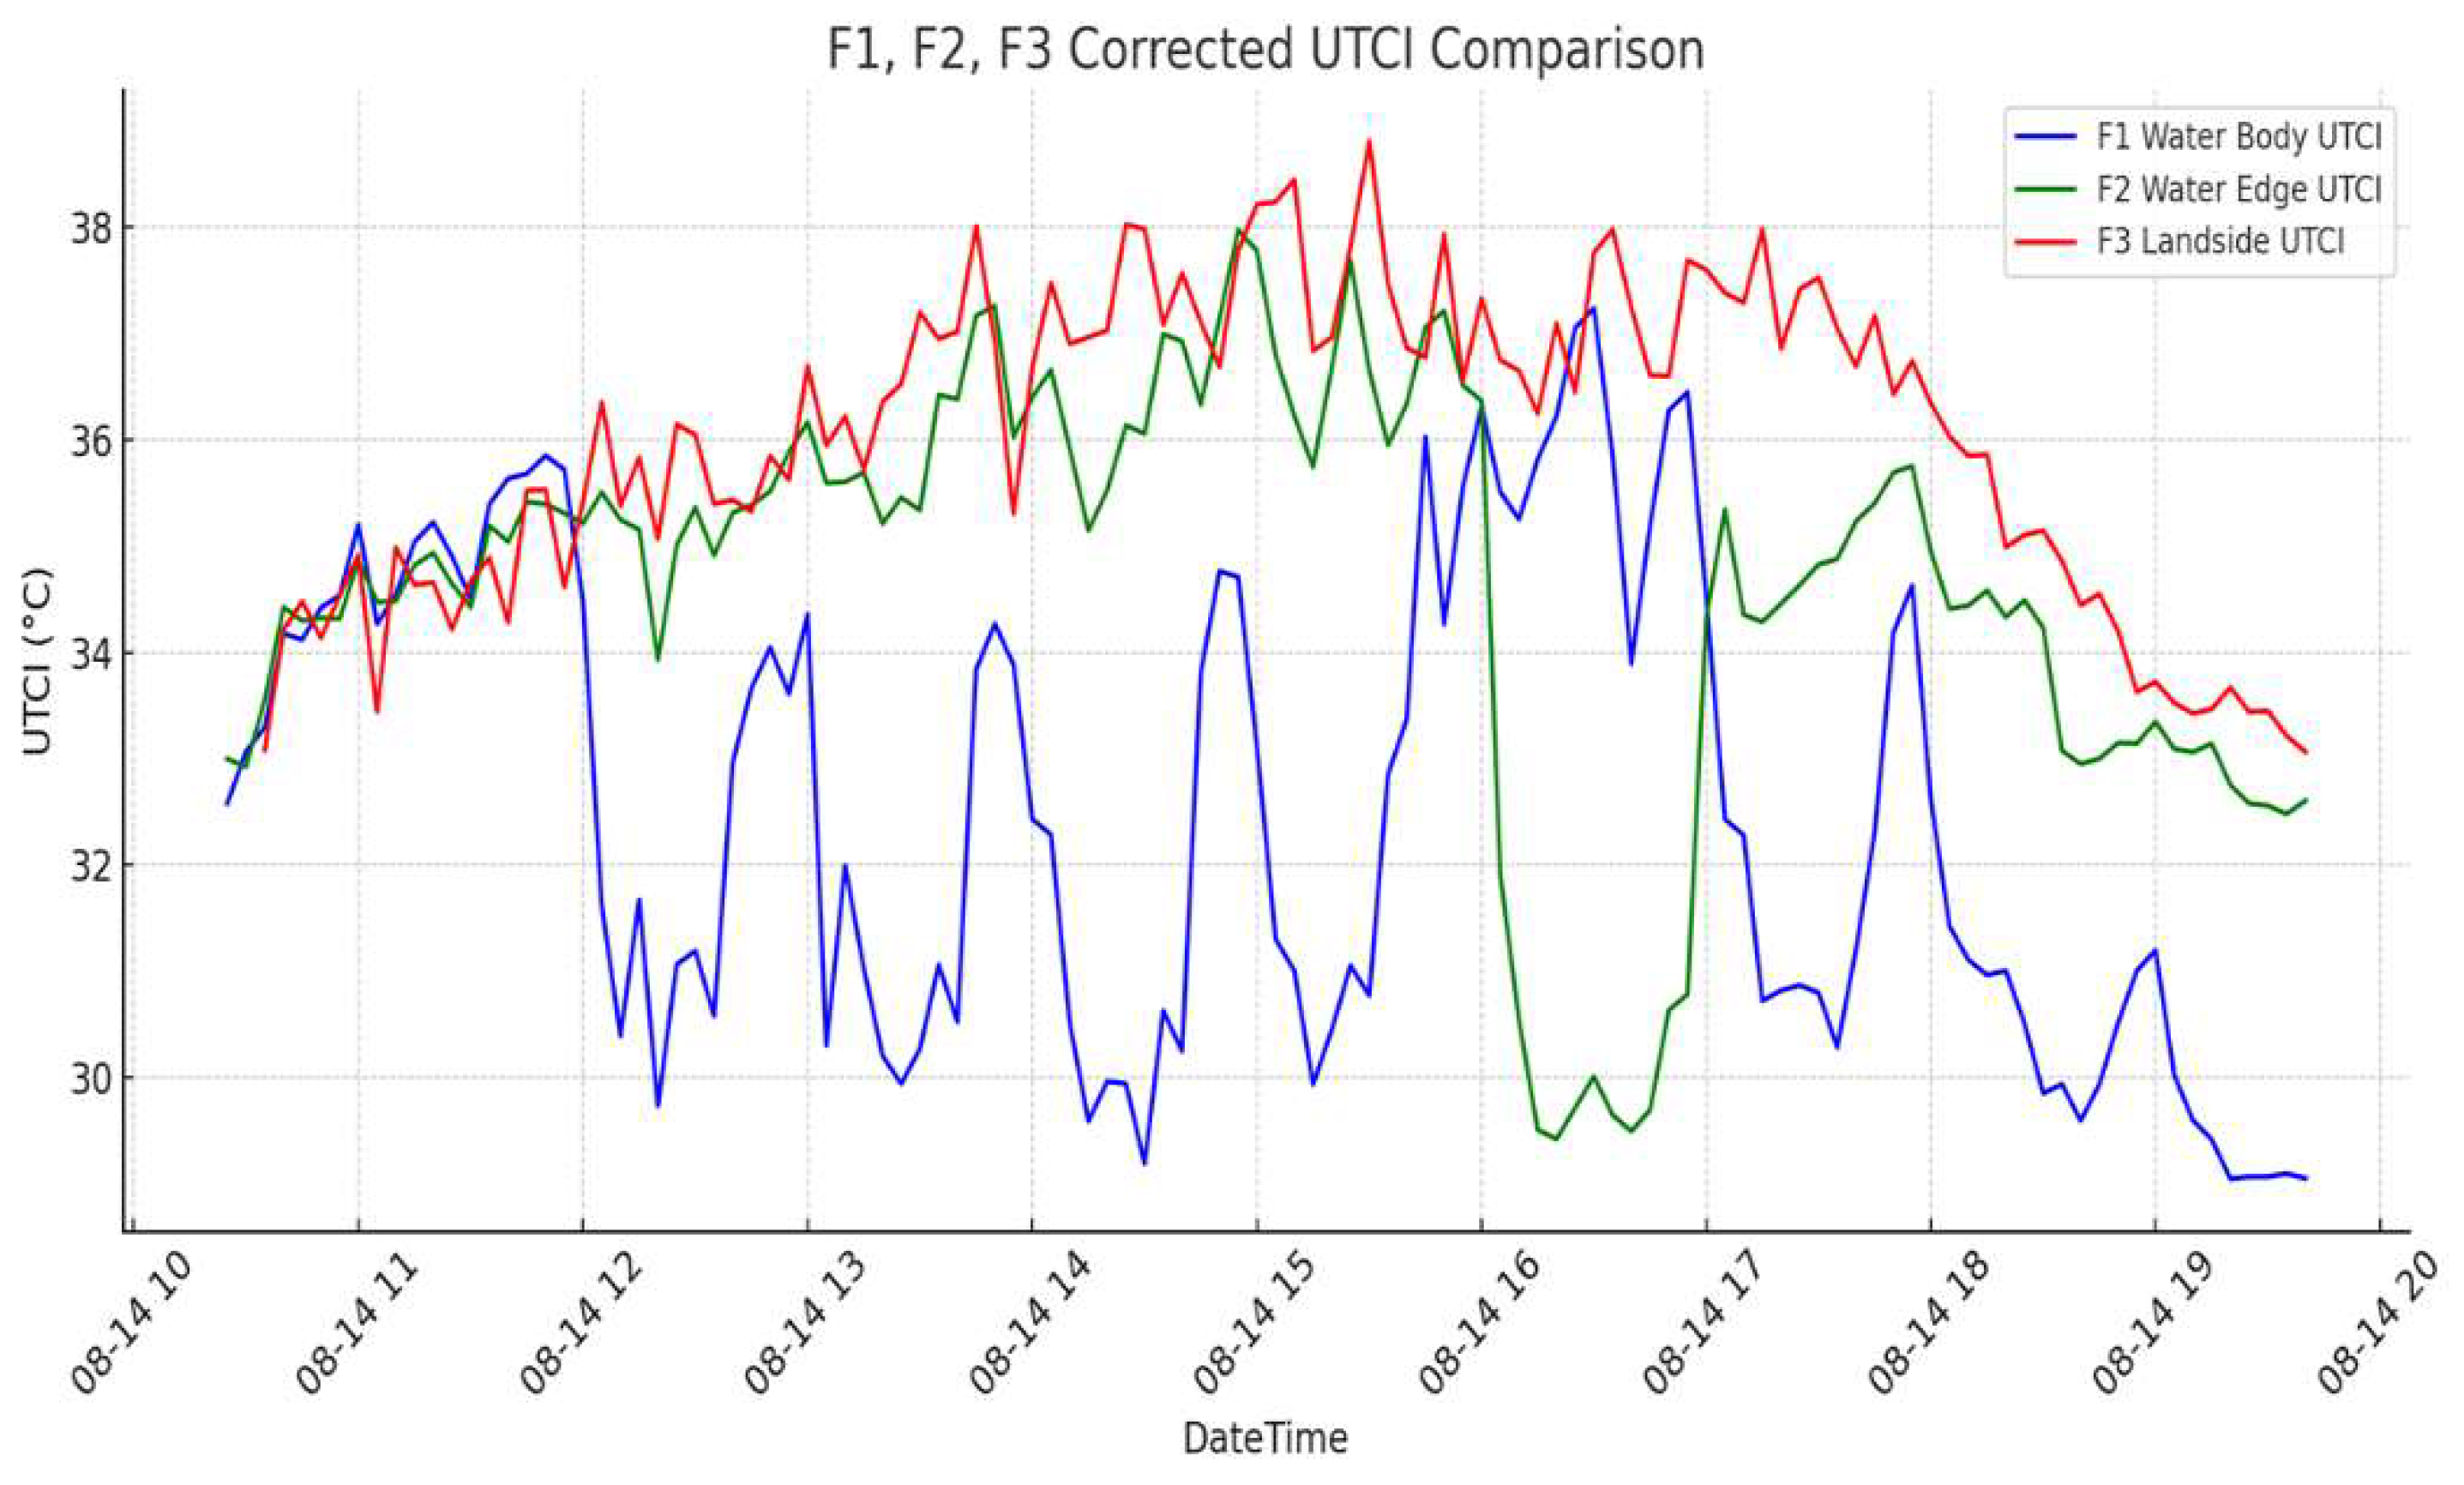
3.3. UTCI Comparison
3.3.1. UTCI Overview
The Universal Thermal Climate Index (UTCI) is a comprehensive indicator that integrates air temperature, humidity, wind speed, and mean radiant temperature (MRT) to evaluate perceived thermal stress in outdoor environments.
3.3.2. UTCI Comparison (Ground Fountain)
- F1 (Water Body – Blue):
Minimum UTCI: 30°C, Maximum UTCI: 36°C, Average UTCI: 32°C
Exhibited the lowest UTCI values due to strong evaporative cooling from direct water contact.
- F2 (Water Edge – Green):
Minimum UTCI: 31°C, Maximum UTCI: 37°C, Average UTCI: 34°C
Moderately cooled, though slightly higher UTCI than F1 due to indirect water influence.
- F3 (Landside – Red):
Minimum UTCI: 32°C, Maximum UTCI: 38°C, Average UTCI: 35°C
Highest thermal stress recorded in dry areas without water exposure.
3.3.3. Conclusion and Urban Design Implications
- The UTCI analysis confirms the ground fountain’s role in reducing perceived heat stress.
- F3 showed significantly higher UTCI, highlighting thermal discomfort in non-cooled urban zones.
- These results emphasize the importance of integrating water-based infrastructure to improve outdoor thermal comfort and mitigate urban heat [23].
Figure 19.
UTCI Comparison at F1, F2, F3.
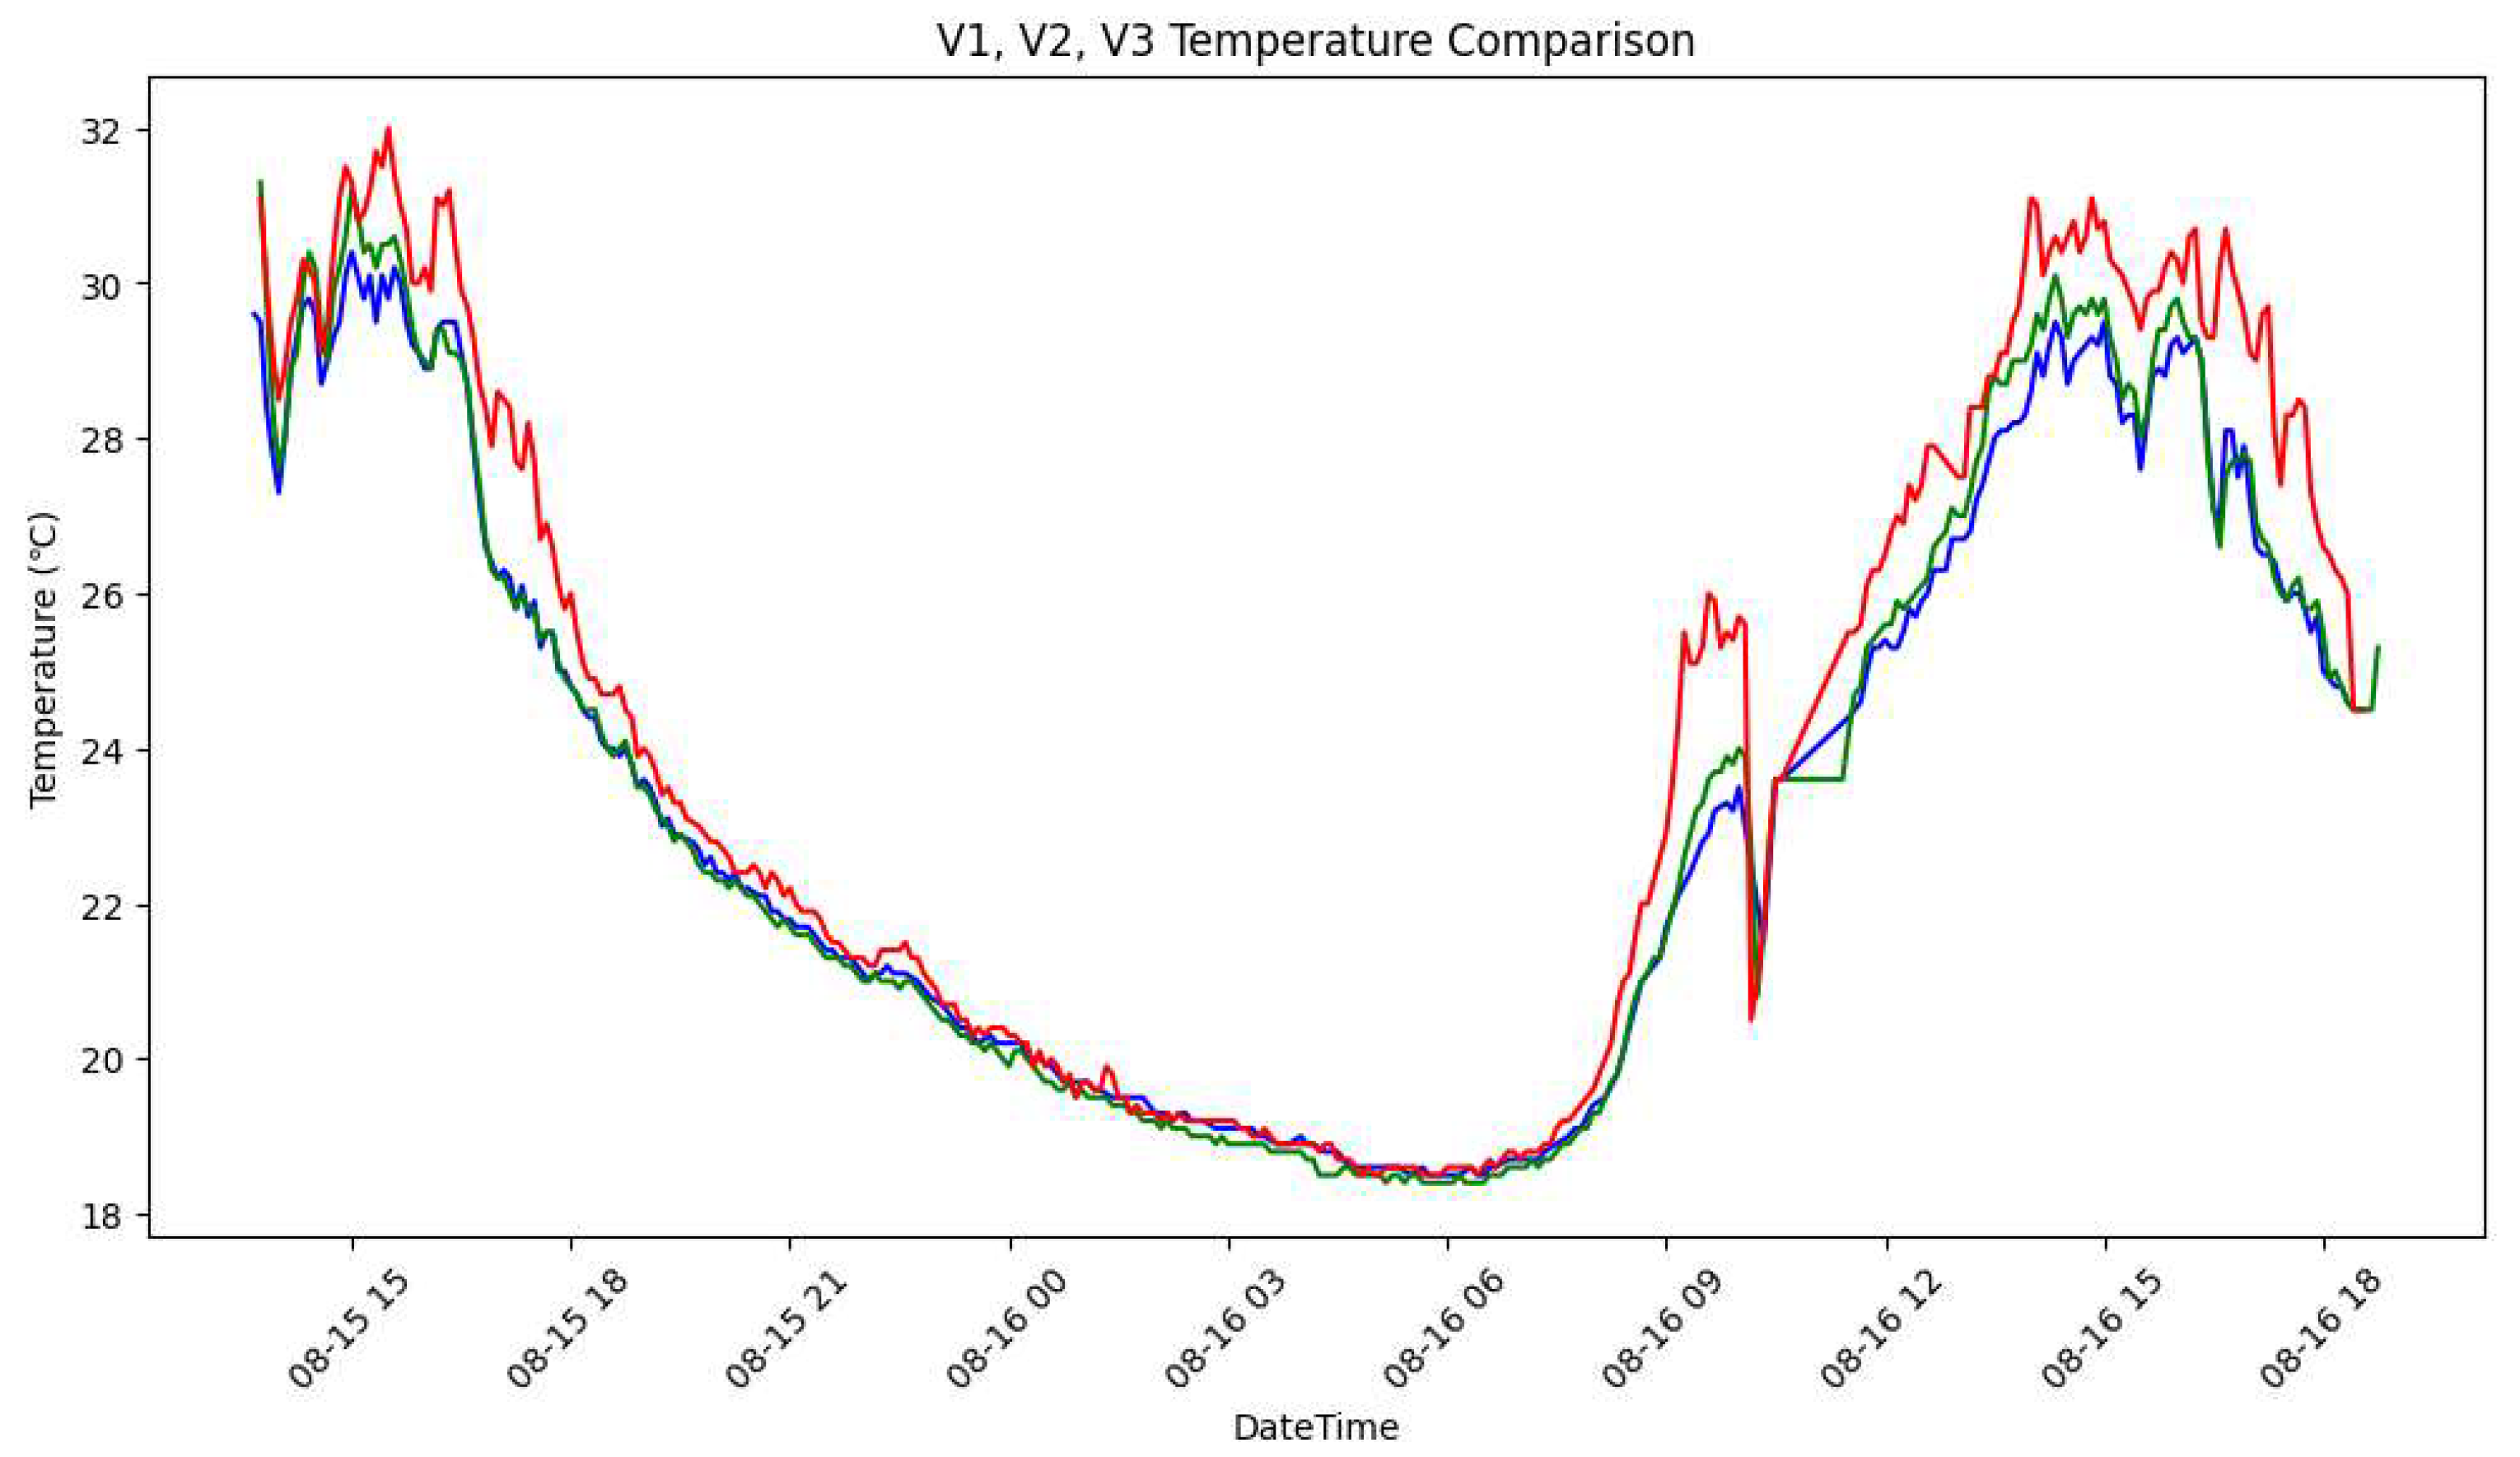
3.4. Air, Surface, MRT, and UTCI Comparison – Natural Stream (Chilrangi Valley)
3.4.1. Air Temperature Comparison (Natural Stream – V1, V2, V3)
- V1 (Water Body – Blue):
Min: 20.5°C, Max: 30.8°C, Avg: 25.5°C
Central stream zone with consistent evaporative cooling and low daily variation.
- V2 (Water Edge – Green):
Min: 22.0°C, Max: 31.5°C, Avg: 26.5°C
Near the stream, showing moderate cooling effect but more fluctuation due to land contact. V1 consistently recorded the lowest temperature due to stream flow and vegetation [13,16].
- V3 (Landside – Red):
Min: 23.0°C, Max: 32.2°C, Avg: 27.8°C
Furthest from water, showing the highest air temperature and clearest heat island presence.
Figure 20.
Temperature Comparison at V1, V2, V3.
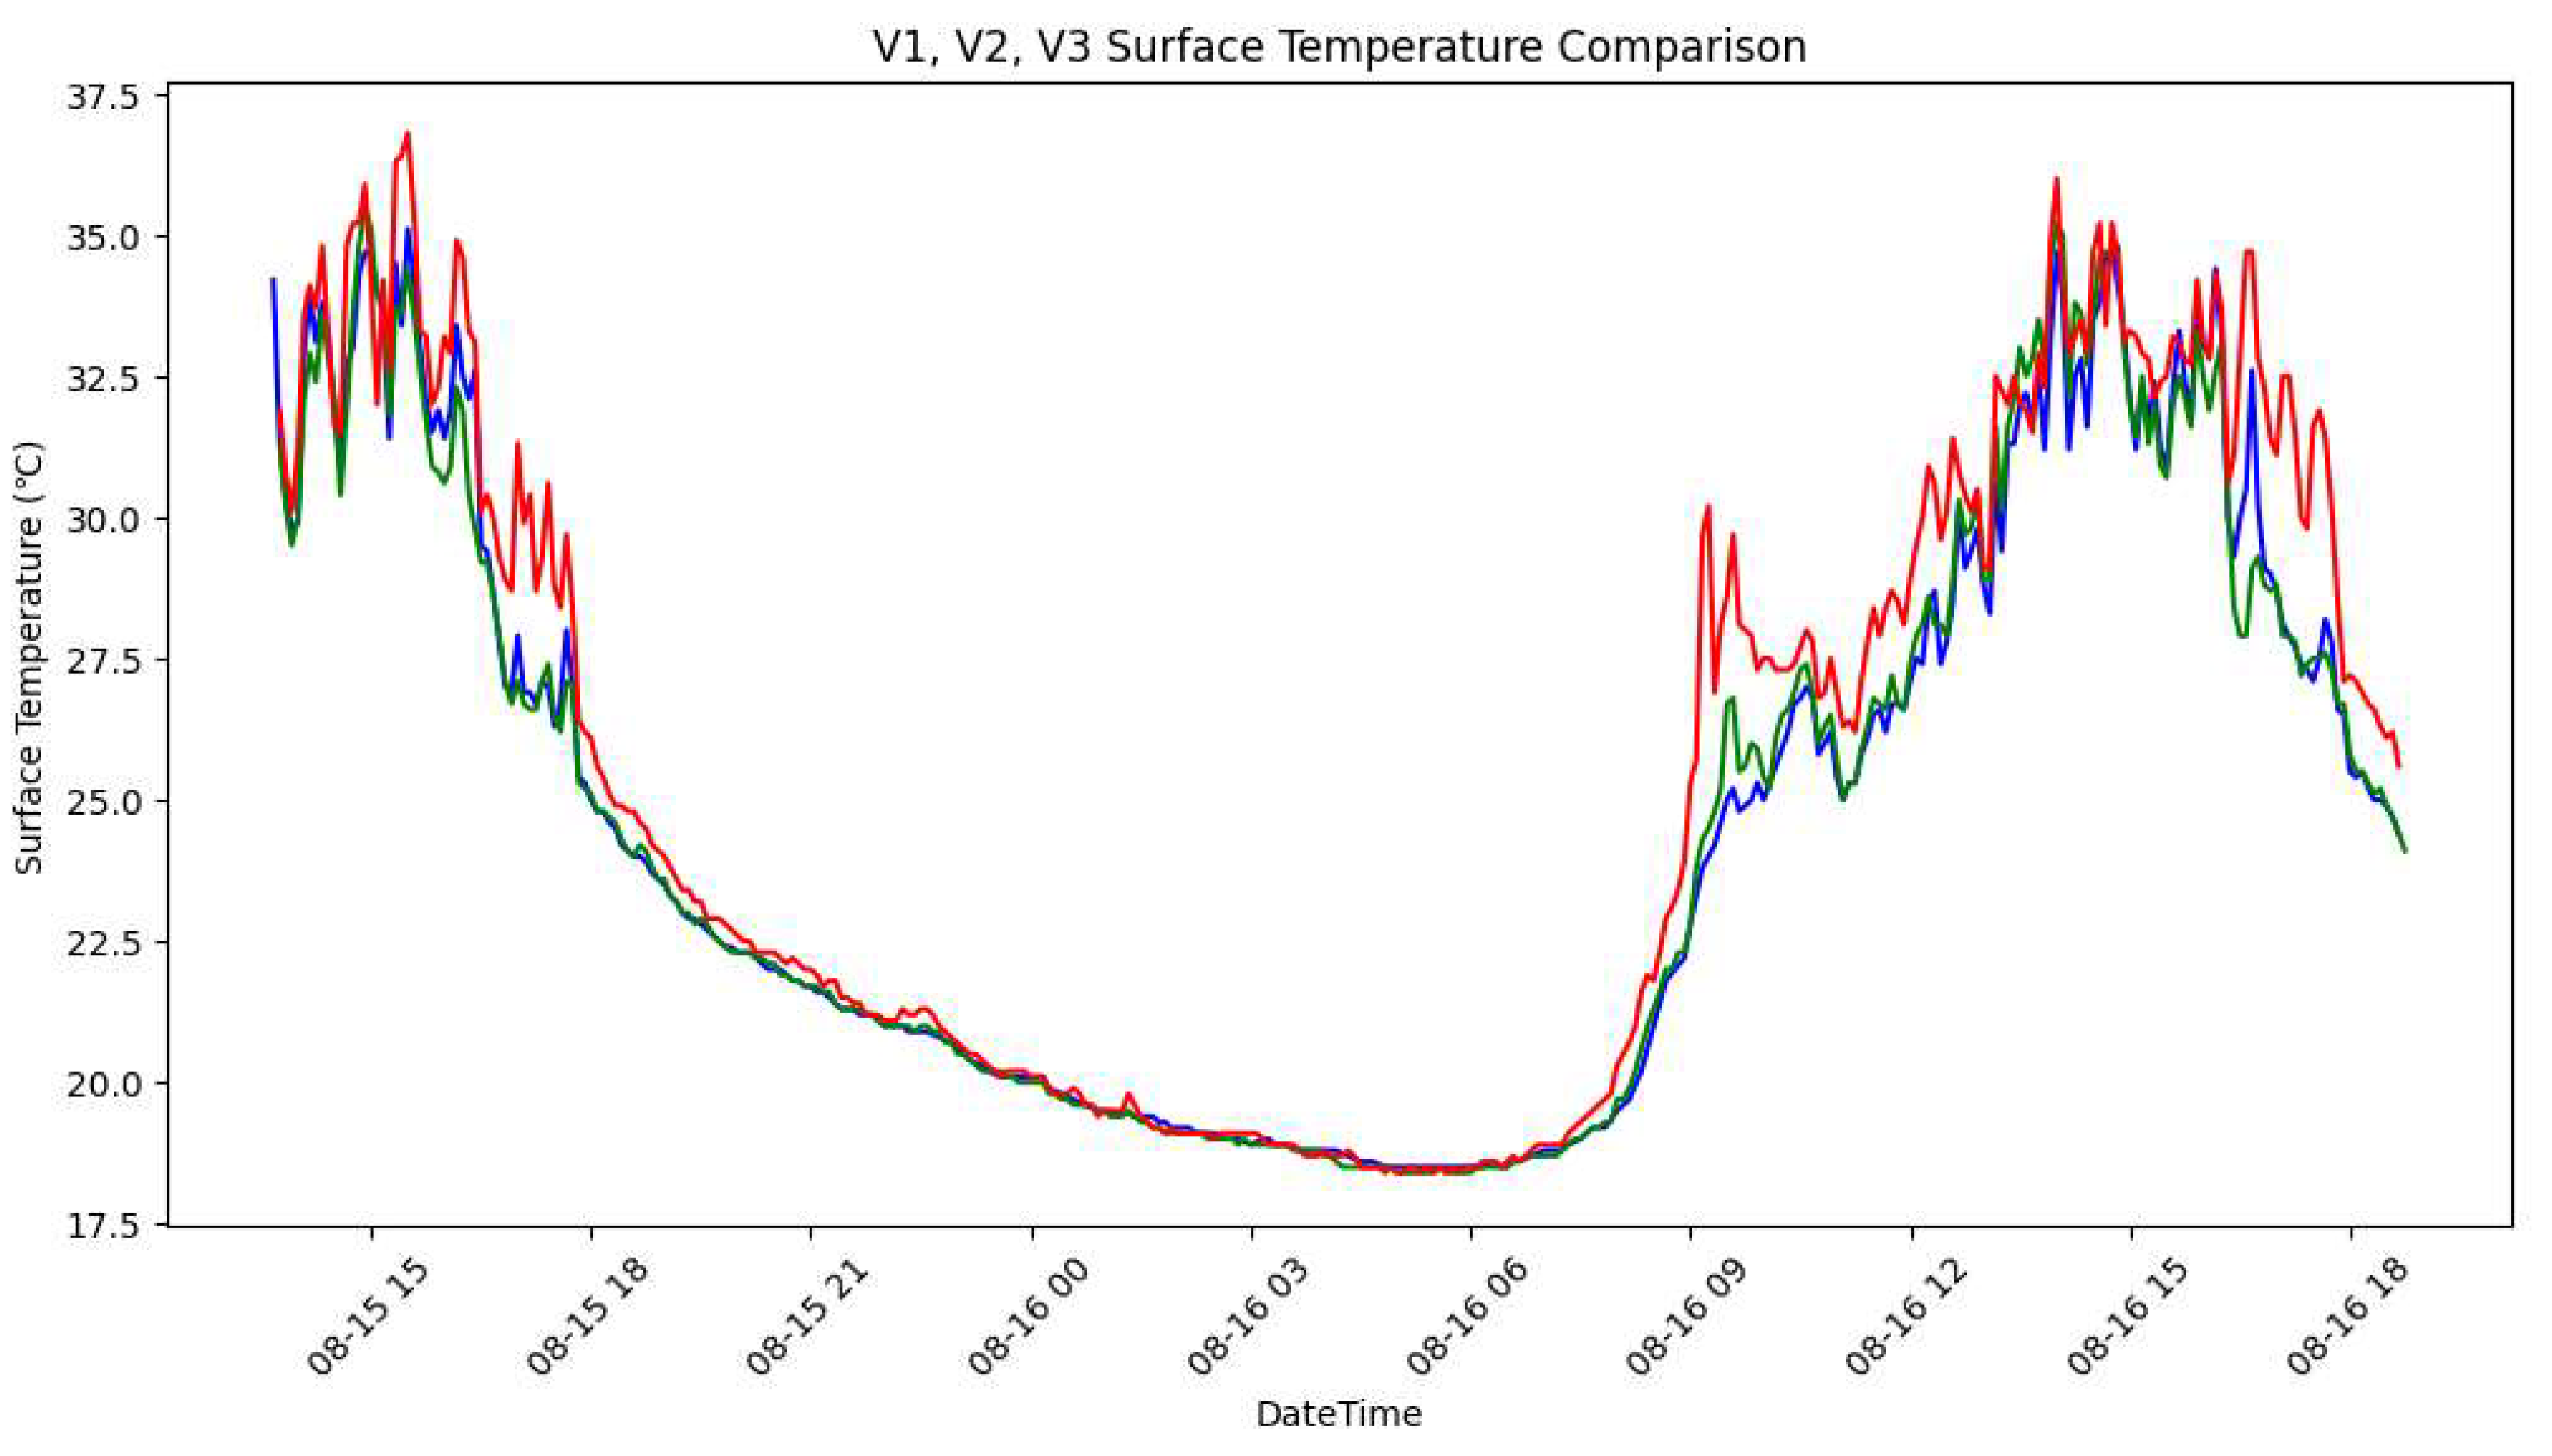
3.4.2. Surface Temperature Comparison
- V1:
Min: ~20°C, Max: ~30°C, Avg: ~25°C
Lowest surface temperatures due to natural stream cooling.
- V2:
Min: ~21°C, Max: ~31°C, Avg: ~26°C
Affected by both water and land; temperature range slightly wider than V1.
- V3:
Min: ~22°C, Max: ~32°C, Avg: ~27°C
Highest surface temperature, reflecting dry land exposure.
Figure 21.
Surface Temperature Comparison at V1, V2, V3.
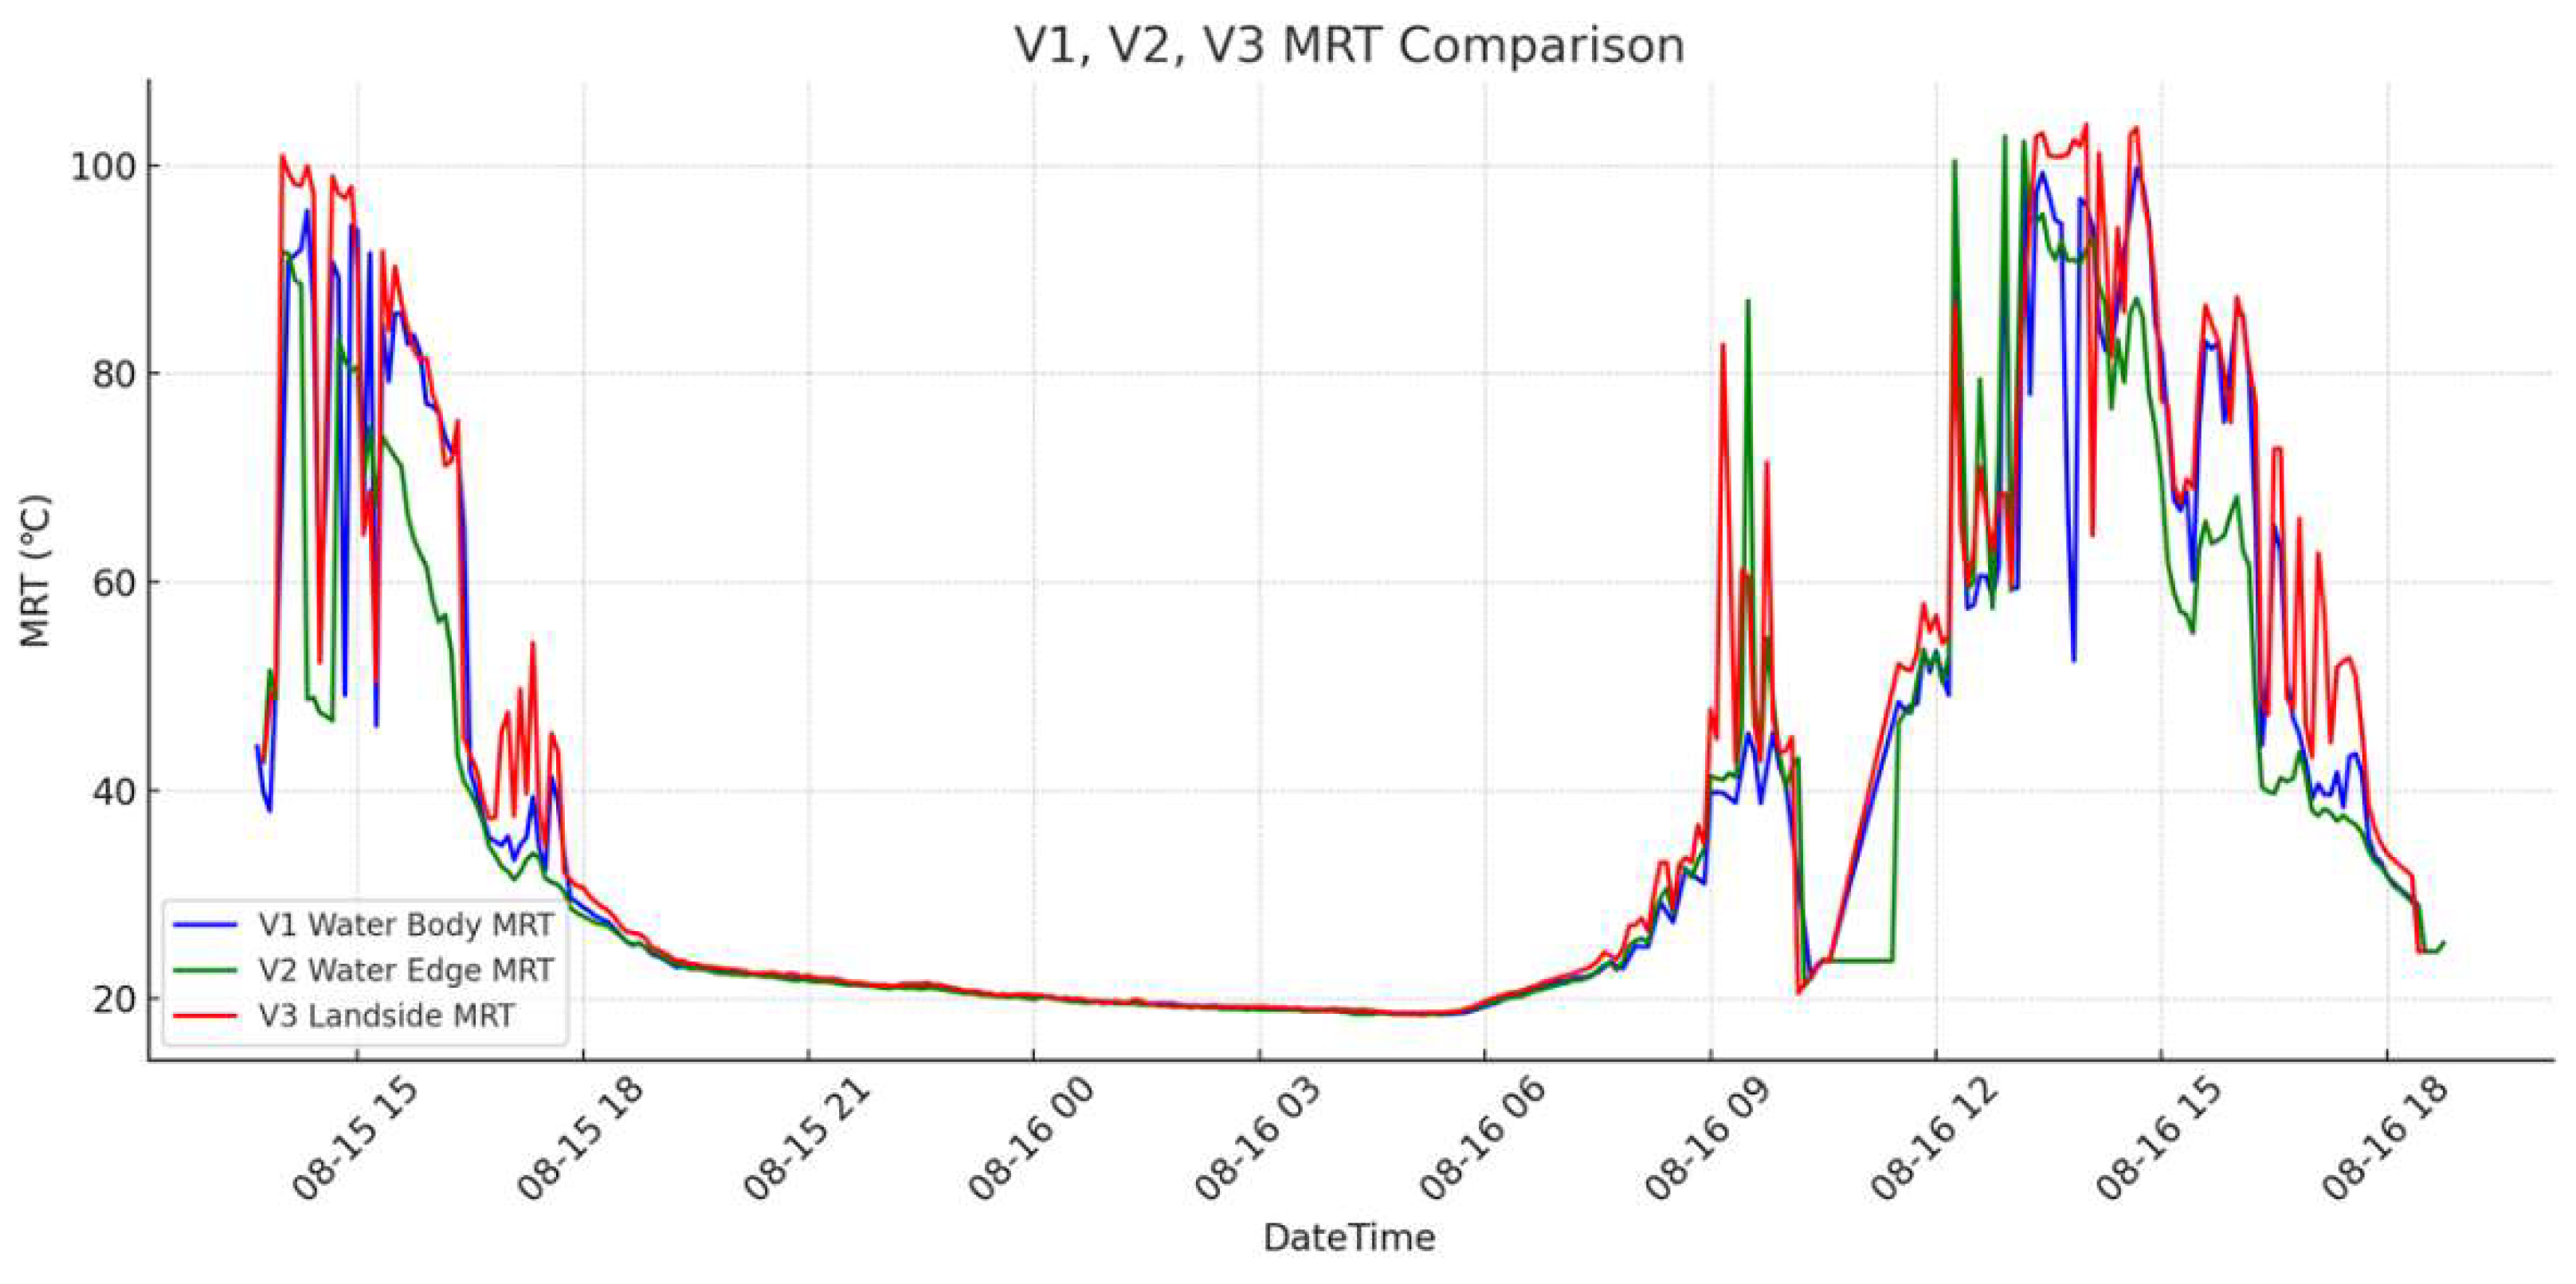
3.4.3. MRT Comparison
- V1 (Blue):
Min MRT: 20°C, Max: 80°C, Avg: ~40°C
- V2 (Green):
Min MRT: 30°C, Max: 90°C, Avg: ~45°C
- V3 (Red):
Min MRT: 40°C, Max: 100°C, Avg: ~55°C
3.4.4. MRT Implications
- V1 showed stable and low MRT, thanks to the stream’s continuous cooling influence.
- V2 had more fluctuation due to mixed exposure.
- V3 recorded the highest MRT, clearly reflecting absence of cooling and intensified radiation.
Figure 22.
MRT Comparison at V1, V2, V3.
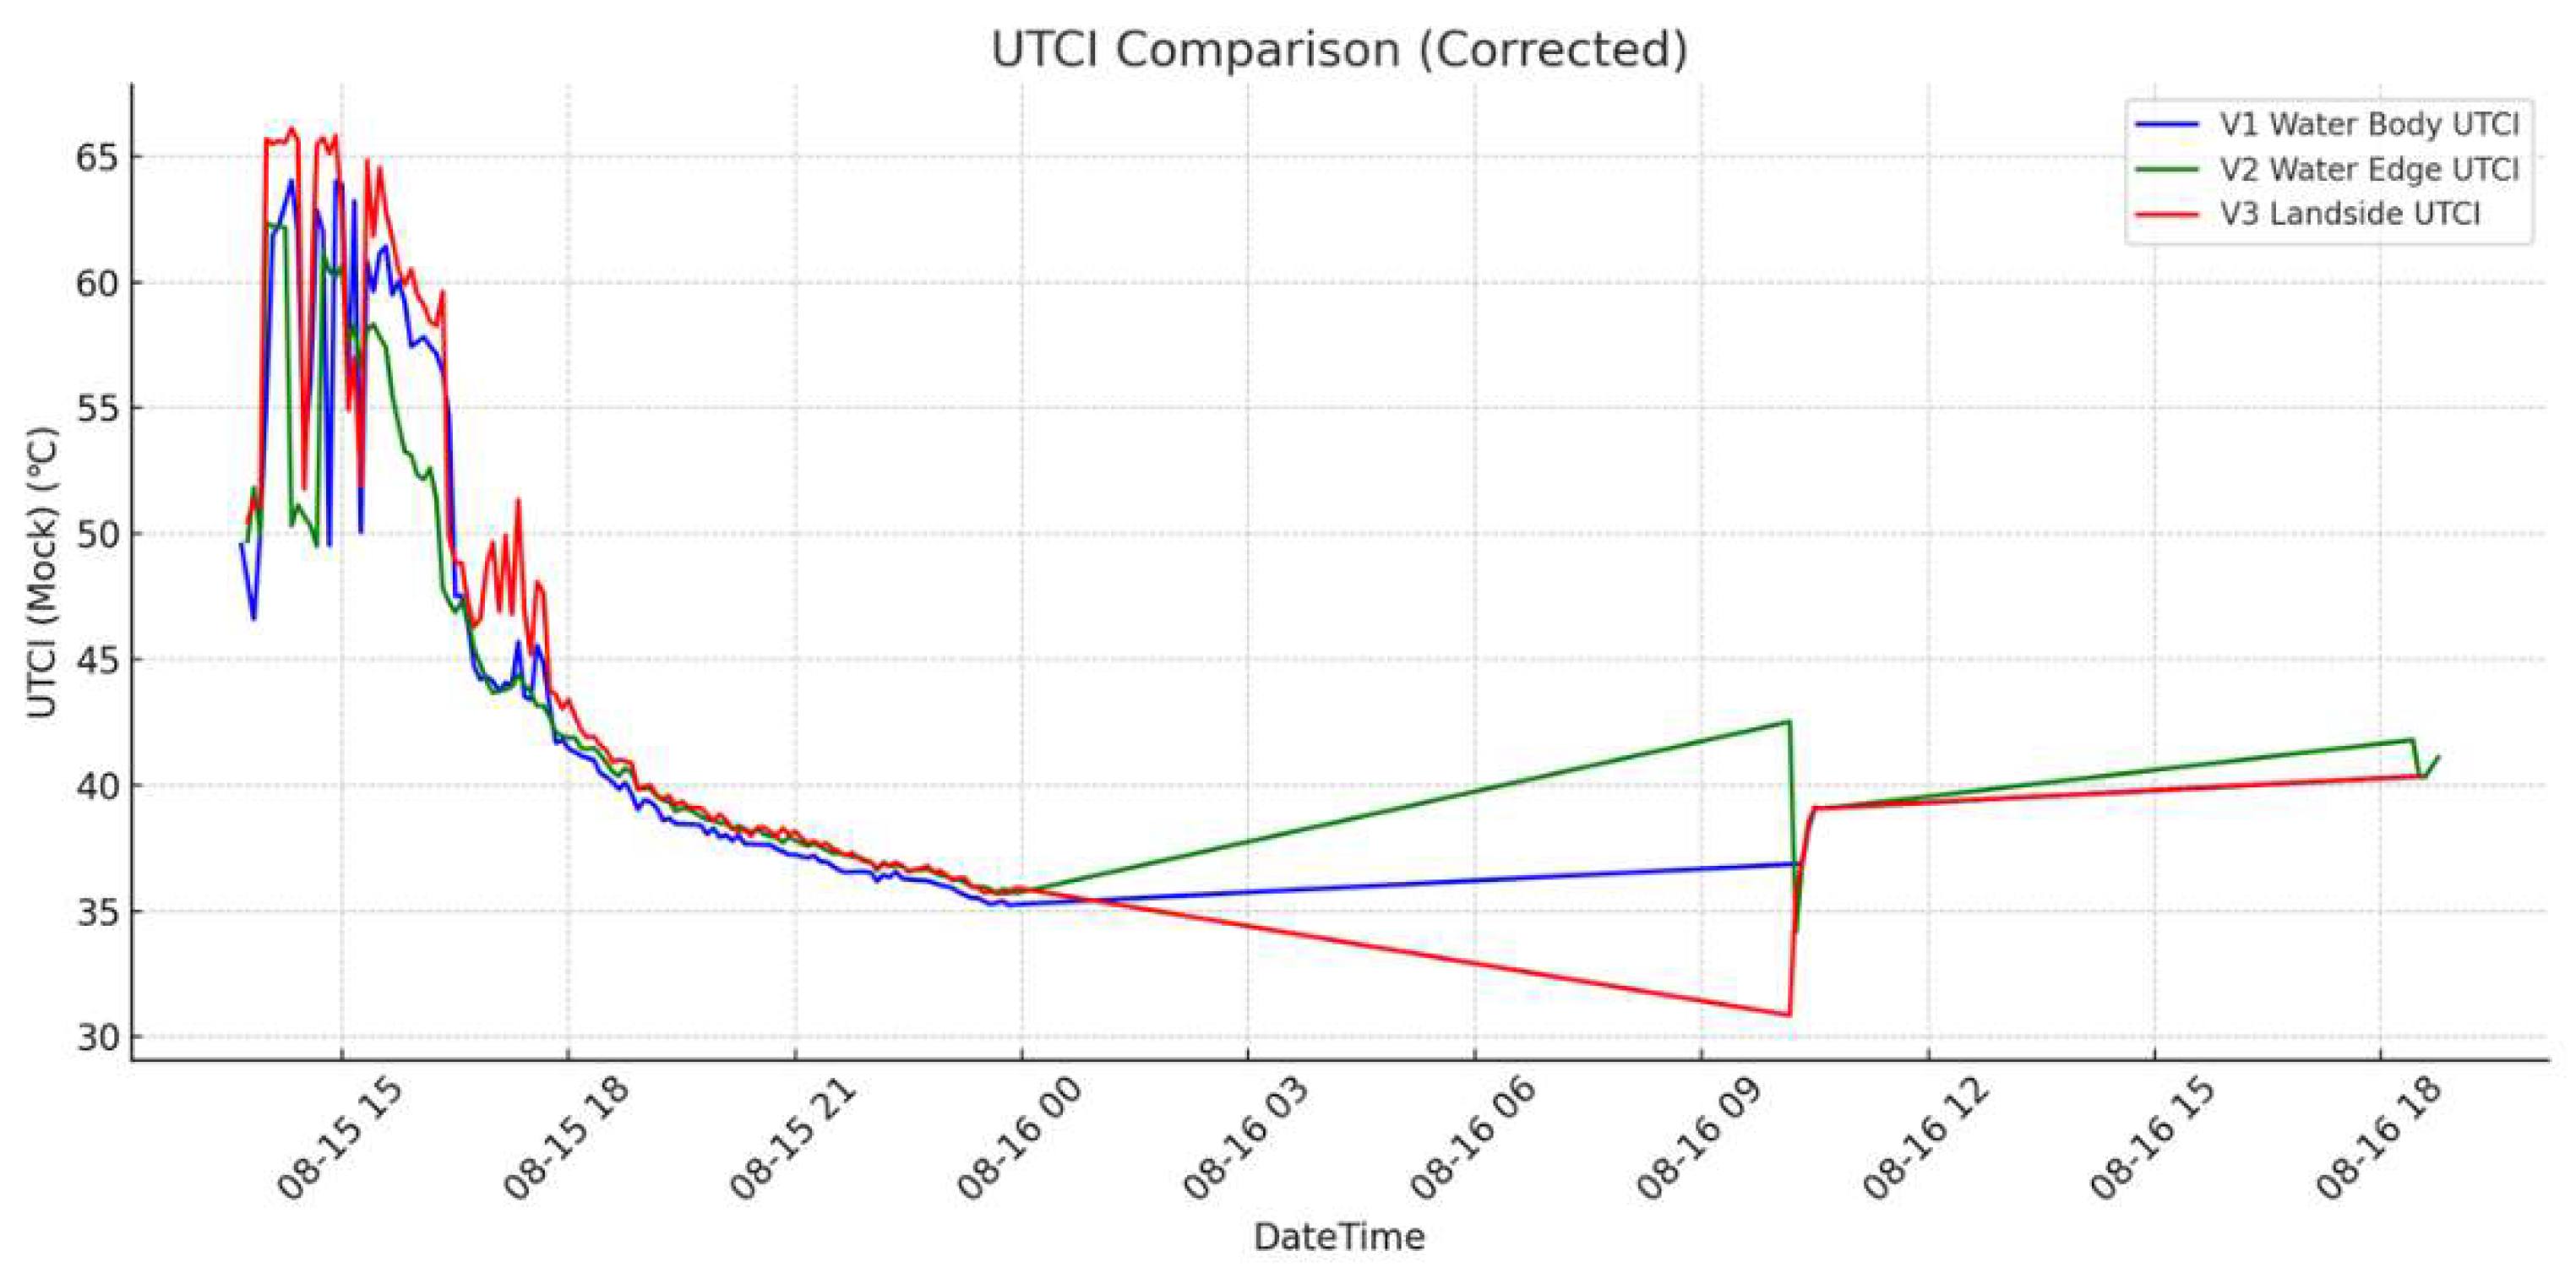
3.4.5. UTCI Comparison
- V1:
Min: 30°C, Max: 65°C, Avg: ~45°C
- V2:
Min: 32°C, Max: 60°C, Avg: ~45°C
- V3:
Min: 34°C, Max: 63°C, Avg: ~50°C
3.4.6. UTCI Implications
- V1 consistently offered the coolest perceived environment.
- V2 showed partial cooling with daytime increases.
- V3 clearly experienced the most thermal stress, aligned with dry urban zones.
Figure 23.
UTCI Comparison at V1, V2, V3.
3.5. Comparison Summary Between Ground Fountain and Natural Stream
3.5.1. Temperature Reduction Comparison
- Ground Fountain (F1):
Min Temp: 28.0°C, Max: 40.6°C, Avg: 35.65°C
Provides short-term, localized cooling through evaporative effects but is limited by surrounding urban heat.
- Natural Stream (V1):
Min Temp: 20.5°C, Max: 30.8°C, Avg: 25.5°C
Delivers continuous and stable cooling supported by natural elements such as airflow, vegetation, and water flow.
3.5.2 Cooling Mechanism Differences
- Urban Technology (Fountain):
Operates on evaporative cooling, showing rapid but short-lived cooling effects.
Most effective within a small radius and highly influenced by ambient heat and surface materials.
- Natural System (Valley):
Combines multiple mechanisms—evapotranspiration, shading, terrain flow—which provide long-term and widespread temperature reduction with low fluctuation.
3.5.3 MRT and UTCI Differences
- F1 (Fountain – MRT): Avg ~35°C
- V1 (Valley – MRT): Avg ~40°C, but more stable
- F1 (Fountain – UTCI): Avg ~32°C
- V1 (Valley – UTCI): Avg ~45°C
🔎 Note: While V1 had higher absolute MRT and UTCI at times, the perceived comfort was enhanced by its cooler air temperature and stability, especially in shaded and vegetated areas.
3.5.4. Equivalence Analysis and Implications
-
Equivalence:The two systems are not equivalent.
- Natural systems (valleys) provide consistent, long-term cooling with broad impact.
- Fountains are useful in urban hot spots for short-term relief, particularly where green infrastructure is unavailable.
-
Urban Design Implications:
- c.
- Natural systems should be preserved or restored where possible.
- d.
- Fountains and artificial water bodies should be strategically placed to enhance localized thermal comfort in densely populated areas.
3.5.5 Policy and Planning Suggestions
- Promote hybrid approaches combining green and gray infrastructure.
-
Apply site-specific cooling strategies:
- e.
- Use valleys and streams for large-scale natural areas.
- f.
- Use fountains in plazas, schoolyards, and transit hubs.
- Integrate MRT and UTCI assessments into climate-responsive urban planning.
4. Discussion
This study conducted a comparative analysis of two distinct cooling infrastructures—urban ground fountains and natural streams—by examining their effects on air temperature, surface temperature, MRT (Mean Radiant Temperature), and UTCI (Universal Thermal Climate Index). The findings reveal significant differences in cooling performance, thermal comfort, and temporal stability between the artificial and natural systems.
4.1. Localized Cooling versus Systemic Stability
The ground fountain demonstrated a clear but spatially limited cooling effect. While F1 (the water body zone) recorded air temperature reductions of up to 2.26°C and lower UTCI values (avg. 32°C), these effects diminished rapidly at F2 and F3, revealing the short-range influence of artificial evaporative cooling in dense urban settings. This aligns with previous studies indicating that urban cooling technologies often provide temporary relief constrained by structural and meteorological conditions.
Conversely, the natural stream (V1) offered a more stable and extensive cooling impact. Air temperatures remained significantly lower throughout the day (avg. 25.5°C), and thermal fluctuations were minimized due to consistent water flow, dense vegetation, and natural wind corridors. These findings support the theory that natural systems function as passive, self-regulating cooling infrastructures capable of sustaining thermal comfort over time and space [8,11,13].
4.2. Radiant Heat Exposure and Thermal Comfort
MRT and UTCI analysis revealed the differentiated impact of landscape and design on perceived heat stress. While urban fountains lowered MRT near the water source (avg. 35°C), surrounding dry zones (F3) showed increased radiant heat exposure (avg. 38°C), exacerbating discomfort in adjacent areas. Similarly, UTCI values rose rapidly outside the immediate influence zone [5,14].
In contrast, MRT and UTCI levels in the valley (V1–V3) were distributed more evenly. Although maximum values were sometimes high, especially under direct sunlight, the perceived comfort was greater due to the lower air temperature, shade, and vegetation, indicating that absolute MRT/UTCI values alone do not determine outdoor comfort—environmental synergy plays a key role [11,15,16].
4.3. Implications for Urban Heat Island Mitigation
These results emphasize the need for multifunctional and site-specific cooling strategies. Ground fountains are effective in high-traffic zones or sealed surfaces where green infrastructure cannot be immediately implemented. However, to achieve long-term resilience against extreme heat events, integration with natural systems—such as streams, forests, or bio-swales—is crucial [1,10,13].
4.4. Limitations and Future Research
This study was limited to two case sites during the summer season. Longitudinal data covering other seasons, different climate zones, or varied urban morphologies would further enhance generalizability. Moreover, future research could benefit from integrating behavioral data (e.g., pedestrian activity, thermal preference surveys) to deepen understanding of real-world thermal perception. Additionally, IoT-based real-time monitoringcan be expanded to examine energy efficiency and social engagement with cooling infrastructure [18,21,22].
5. Conclusions
This study examined the thermal mitigation effects of two contrasting water-based infrastructures—urban ground fountains and natural streams—by analyzing air temperature, surface temperature, Mean Radiant Temperature (MRT), and Universal Thermal Climate Index (UTCI). The results provide empirical evidence supporting the effectiveness of water-based systems in mitigating urban heat and enhancing outdoor thermal comfort.
Urban ground fountains demonstrated localized cooling effects, with the central zone (F1) showing an air temperature reduction of up to 2.26°C, and a surface temperature drop of approximately 2.05°C compared to peripheral dry areas (F3). The MRT at F1 averaged 35°C, compared to 38°C at F3, while UTCI values averaged 32°C at F1 and 35°C at F3. These results indicate that while fountains offer short-term cooling benefits, their influence diminishes beyond a few meters.
In contrast, the natural stream site (V1) exhibited stable and extended cooling, with an average air temperature of 25.5°C, which is approximately 10.1°C lower than the urban fountain’s F1 zone. Surface temperature in V1 averaged 25°C, MRT averaged 40°C, and UTCI values remained relatively stable around 45°C. Though MRT and UTCI peaks were occasionally high due to solar exposure, the perceived comfort was greater owing to the consistency of cooler air, vegetation coverage, and natural shading [1,13,17].
These findings confirm that natural systems offer long-term, broader-scale mitigation of heat stress, whereas urban fountains provide spot cooling within constrained urban footprints. The difference in MRT and UTCI across both systems underscores the need for an integrated approach that utilizes both green infrastructure (e.g., streams, valleys, vegetation) and gray infrastructure (e.g., fountains, artificial water features) to effectively combat urban heat [19,20,21].
Finally, the study emphasizes the importance of incorporating thermal comfort indices such as MRT and UTCI into climate-adaptive urban design. These metrics provide more human-centered insights into thermal conditions than air temperature alone and are vital for developing resilient public spaces in the face of accelerating climate change.
Author Contributions
Conceptualization, T.K.K.; methodology, T.K.K.; software, T.K.K.; validation, T.K.K.; formal analysis, T.K.K.; investigation, T.K.K.; resources, T.K.K.; data curation, T.K.K.; writing—original draft preparation, T.K.K.; writing—review and editing, T.K.K.; visualization, T.K.K.; supervision, T.K.K.; project administration, T.K.K. All authors have read and agreed to the published version of the manuscript.
Funding
This research received no external funding.
Institutional Review Board Statement
Not applicable.
Informed Consent Statement
Not applicable.
Data Availability Statement
The data presented in this study are available upon request from the corresponding author. The data are not publicly available due to privacy and ethical restrictions.
Acknowledgments
The authors would like to acknowledge [Institution/Individuals] for their contributions.
Conflicts of Interest
The authors declare no conflicts of interest.
References
- Gunawardena, K.R.; Wells, M.J.; Kershaw, T. Utilising Green and Bluespace to Mitigate Urban Heat Island Intensity. Sci. Total Environ. 2017, 584, 1040–1055. [Google Scholar] [CrossRef] [PubMed]
- Lim, Y. S. , Zoh, H. D., Kim, T. H., & Kwon, T. K. Analyzing the Cooling Effects of Water Facilities in Urban Park: The Case of Sangju Namsan Park, South Korea. Atmosphere 2024, 15, 1456. [Google Scholar]
- Du, H.; Song, X.; Jiang, H.; Kan, Z.; Wang, Z.; Cai, Y. Research on the Cooling Island Effects of Water Body: A Case Study of Shanghai, China. Ecological Indicators 2016, 67, 31–38. [Google Scholar] [CrossRef]
- Lee, S. H.; Lee, K. S.; Jin, W. C.; Song, H. K. Effect of an Urban Park on Air Temperature Differences in a Central Business District Area. Landscape and Ecological Engineering 2009, 5, 183–191. [Google Scholar] [CrossRef]
- Bowler, D.E.; Buyung-Ali, L.; Knight, T.M.; Pullin, A.S. Urban Greening to Cool Towns and Cities: A Systematic Review of the Empirical Evidence. Landsc. Urban Plan. 2010, 97, 147–155. [Google Scholar] [CrossRef]
- Kim, D.W.; Bahng, K.H.; Lee, D.S.; Kim, H.D. Experimental Investigation of Reducing the Heat Island Effects Using Newly Developed Insulation-Heat Paint and Heat-Exchanging Paint. In Proceedings of the SAREK Conference, Seoul, South Korea; 2009; pp. 87–96. [Google Scholar]
- Taha, H.; Sailor, D.J.; Akbari, H. High-Albedo Materials for Reducing Building Cooling Energy Use. Energy and Buildings 1992. [Google Scholar]
- Kwon, T. K.; Zoh, H. D.; Ahn, W.; Lee, S.; Kim, T. H. Analysis of Indoor Thermal Environment Improvement in Apartment Buildings Through the Application of Heat-Reflective Paint. Buildings 2024, 14, 3834. [Google Scholar] [CrossRef]
- Bröde, P.; Fiala, D.; Błażejczyk, K.; Holmér, I.; Jendritzky, G.; Kampmann, B.; Havenith, G. Deriving the Operational Procedure for the Universal Thermal Climate Index (UTCI). Int. J. Biometeorol. 2012, 56, 481–494. [Google Scholar] [CrossRef] [PubMed]
- Fanger, P.O. Thermal Comfort: Analysis and Applications in Environmental Engineering; McGraw-Hill Book Company, New York, USA, 1970.
- International Organization for Standardization. Ergonomics of the Thermal Environment—Instruments for Measuring Physical Quantities. ISO 7726, 1998.
- Nasrollahi, N.; Ghosouri, A.; Khodakarami, J.; Taleghani, M. Facing the Urban Overheating: Recent Developments, Mitigation Potential, and Sensitivity of the Main Technologies. Wiley Interdiscip. Rev. Energy Environ. 2018, 7, e294. [Google Scholar]
- Santamouris, M. Recent Progress on Urban Overheating and Heat Island Research: Integrated Assessment of the Energy, Environmental, Vulnerability, and Health Impact. Energy Build. 2020, 207, 109482. [Google Scholar] [CrossRef]
- Nasrollahi, N.; et al. Heat-Mitigation Strategies to Improve Pedestrian Thermal Comfort in Urban Environments: A Review. Sustainability 2020, 12, 10000. [Google Scholar] [CrossRef]
- Cotrim Pezzuto, C.; Alchapar, N.L.; Correa Cantaloube, E.N. Urban Cooling Technologies Potential in High and Low Building Densities. Sustainability 2022, 14, 2301. [Google Scholar]
- Monge-Barrio, A.; Gutiérrez, A. S.-O. Passive Energy Strategies for Mediterranean Residential Buildings: Facing the Challenges of Climate Change and Vulnerable Populations; Springer: Cham, Switzerland, 2018. [Google Scholar]
- Santamouris, M.; Synnefa, A.; Karlessi, T. Using Advanced Cool Materials in the Urban Built Environment to Mitigate Heat Islands and Improve Thermal Comfort Conditions. Sol. Energy 2011, 85, 3085–3102. [Google Scholar] [CrossRef]
- Lin, J.; Brown, R.D. Integrating Microclimate into Landscape Architecture for Outdoor Thermal Comfort: A Systematic Review. Land 2021, 10, 196. [Google Scholar] [CrossRef]
- Akbari, H.; Pomerantz, M.; Taha, H. Cool Surfaces and Shade Trees to Reduce Energy Use and Improve Air Quality in Urban Areas. Sol. Energy 2001, 70, 295–310. [Google Scholar] [CrossRef]
- Lee, J.S.; Kim, J.W. Assessing Strategies for Urban Climate Change Adaptation: The Case of Six Metropolitan Cities in South Korea. Sustainability 2018, 10, 2065. [Google Scholar] [CrossRef]
- Lee, H.; Romero, J. ; IPCC: Geneva, Switzerland, 2023. [CrossRef]Policymakers. In Contribution of Working Groups I, II and III to the Sixth Assessment Report of the IPCC; IPCC: Geneva, Switzerland, 2023. [Google Scholar]
- Kim, J.; Jung, T.Y. Assessing Health Sector Climate Vulnerability in 226 Local Entities of South Korea Based on Principal Component Analysis. Urban Clim. 2023, 49, 101521. [Google Scholar] [CrossRef]
- Kwon, T. K.; Kim, L. K.; Park, Y. J.; You, D. Y.; Zoh, H. D.; Lim, Y. S. Analyzing the Effectiveness of Cooling Projects for Climate-Vulnerable Groups Through IoT-Based Monitoring System. J. Clim. Change Res. 2022, 13, 383–398. [Google Scholar] [CrossRef]
Figure 7.
Surface Temperature Sensor for MRT and UTCI near Ground Fountain.
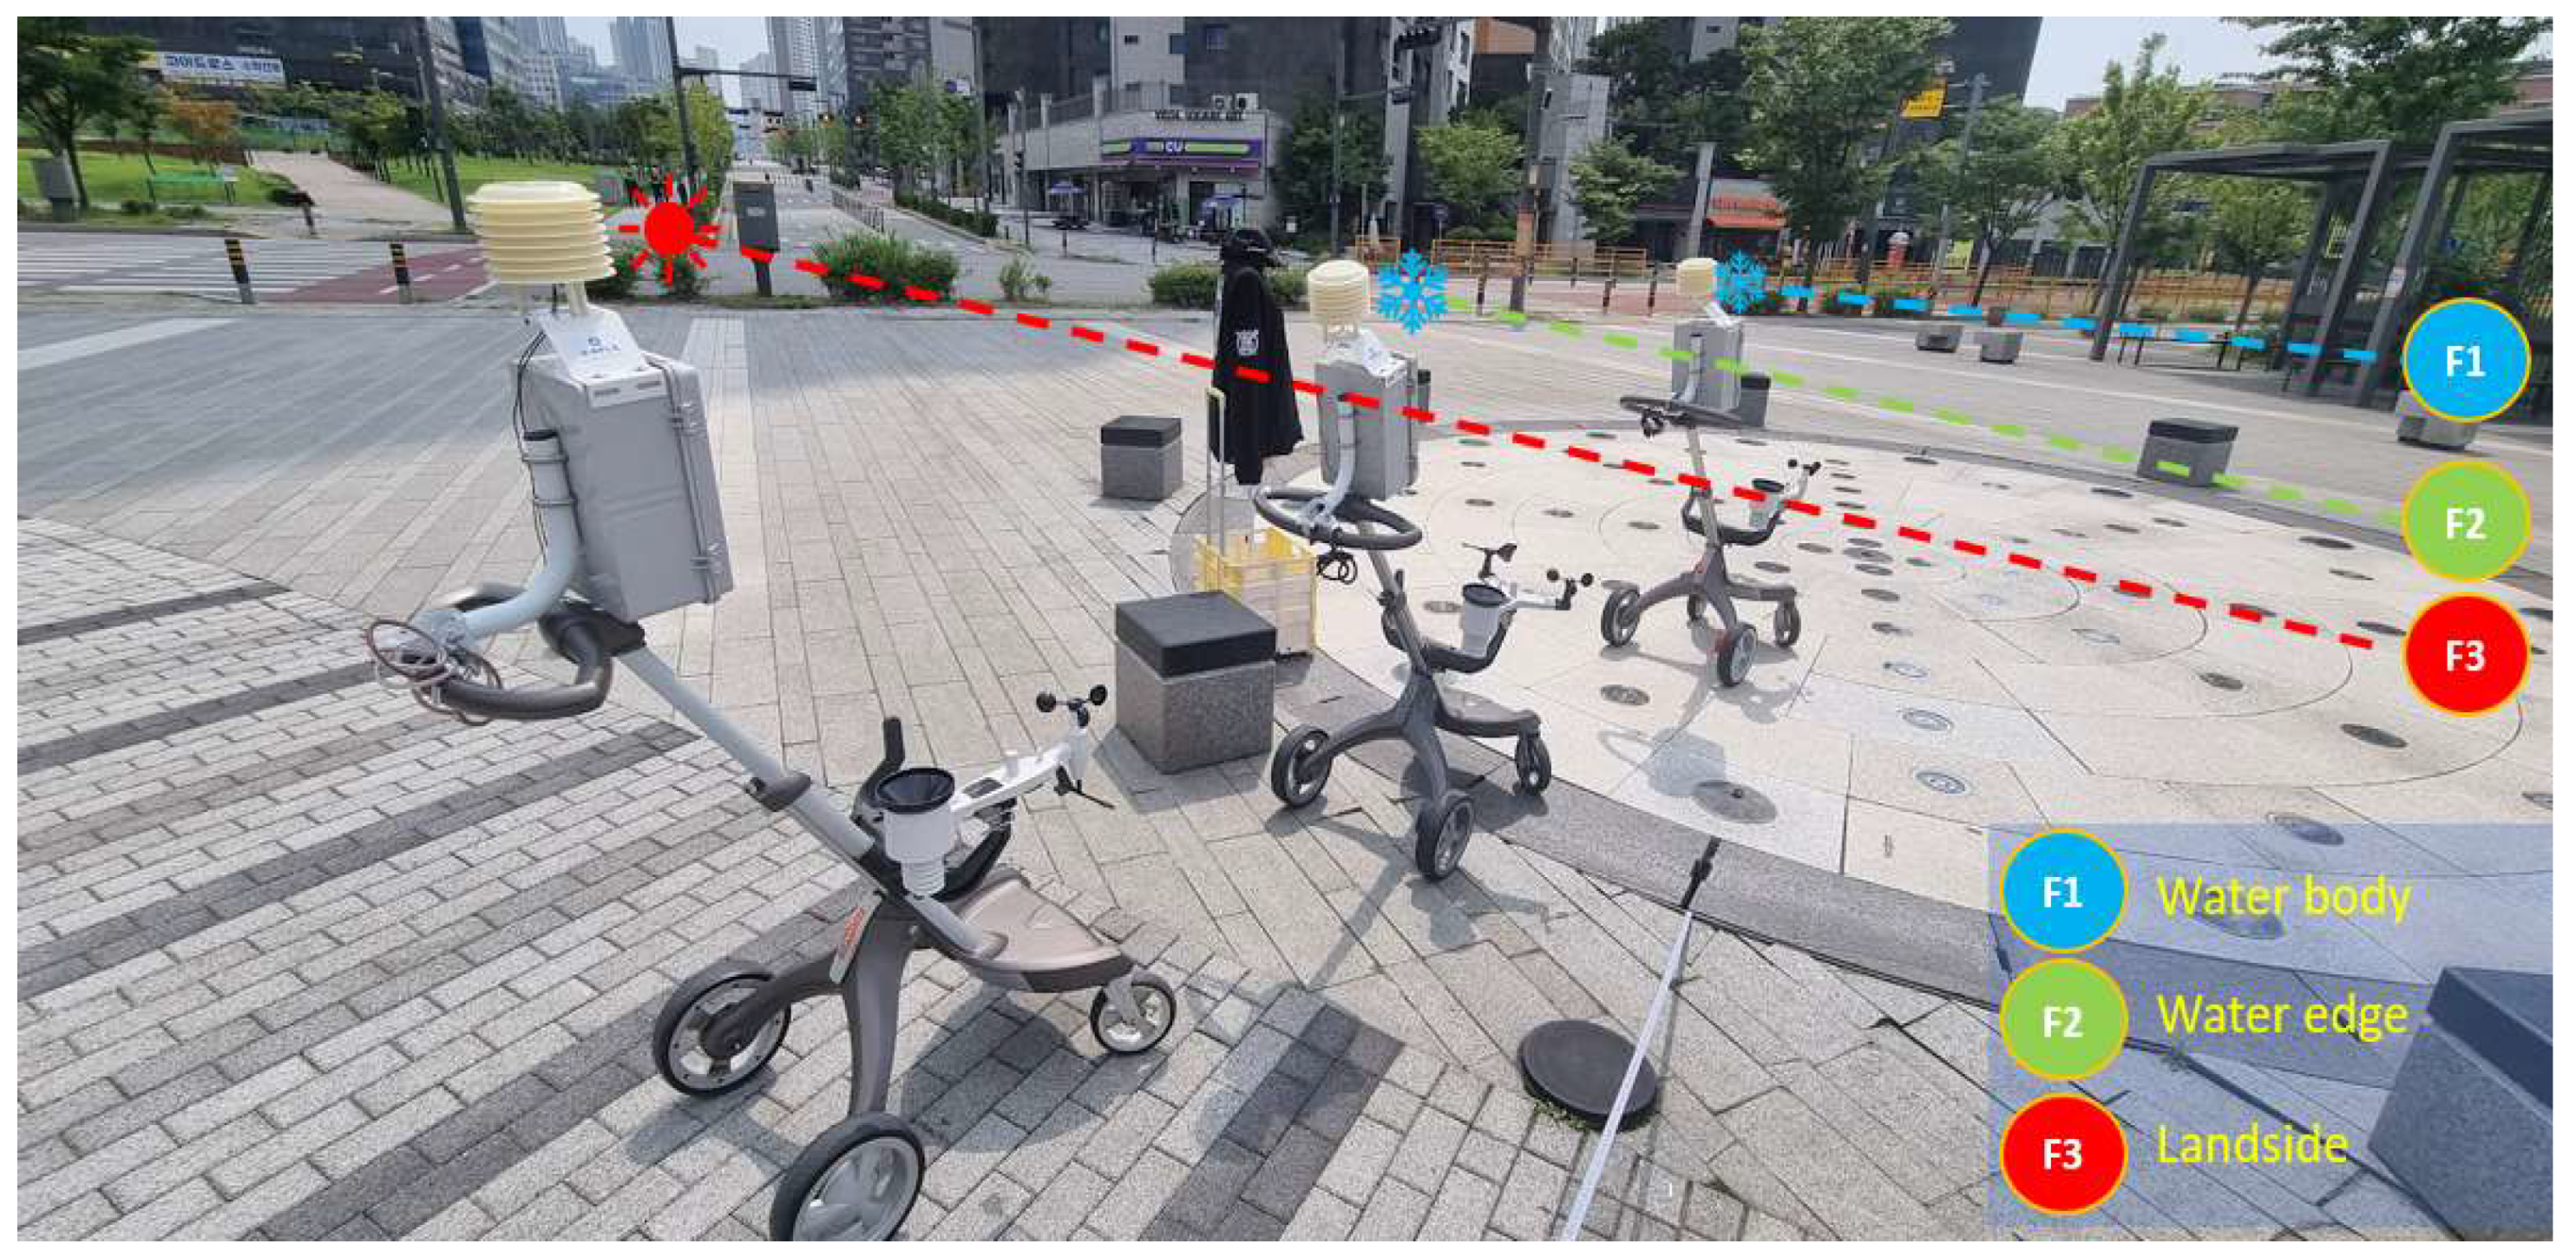
Figure 8.
Mobile AWS Installation for Environmental Sensing (Dongtan Site).
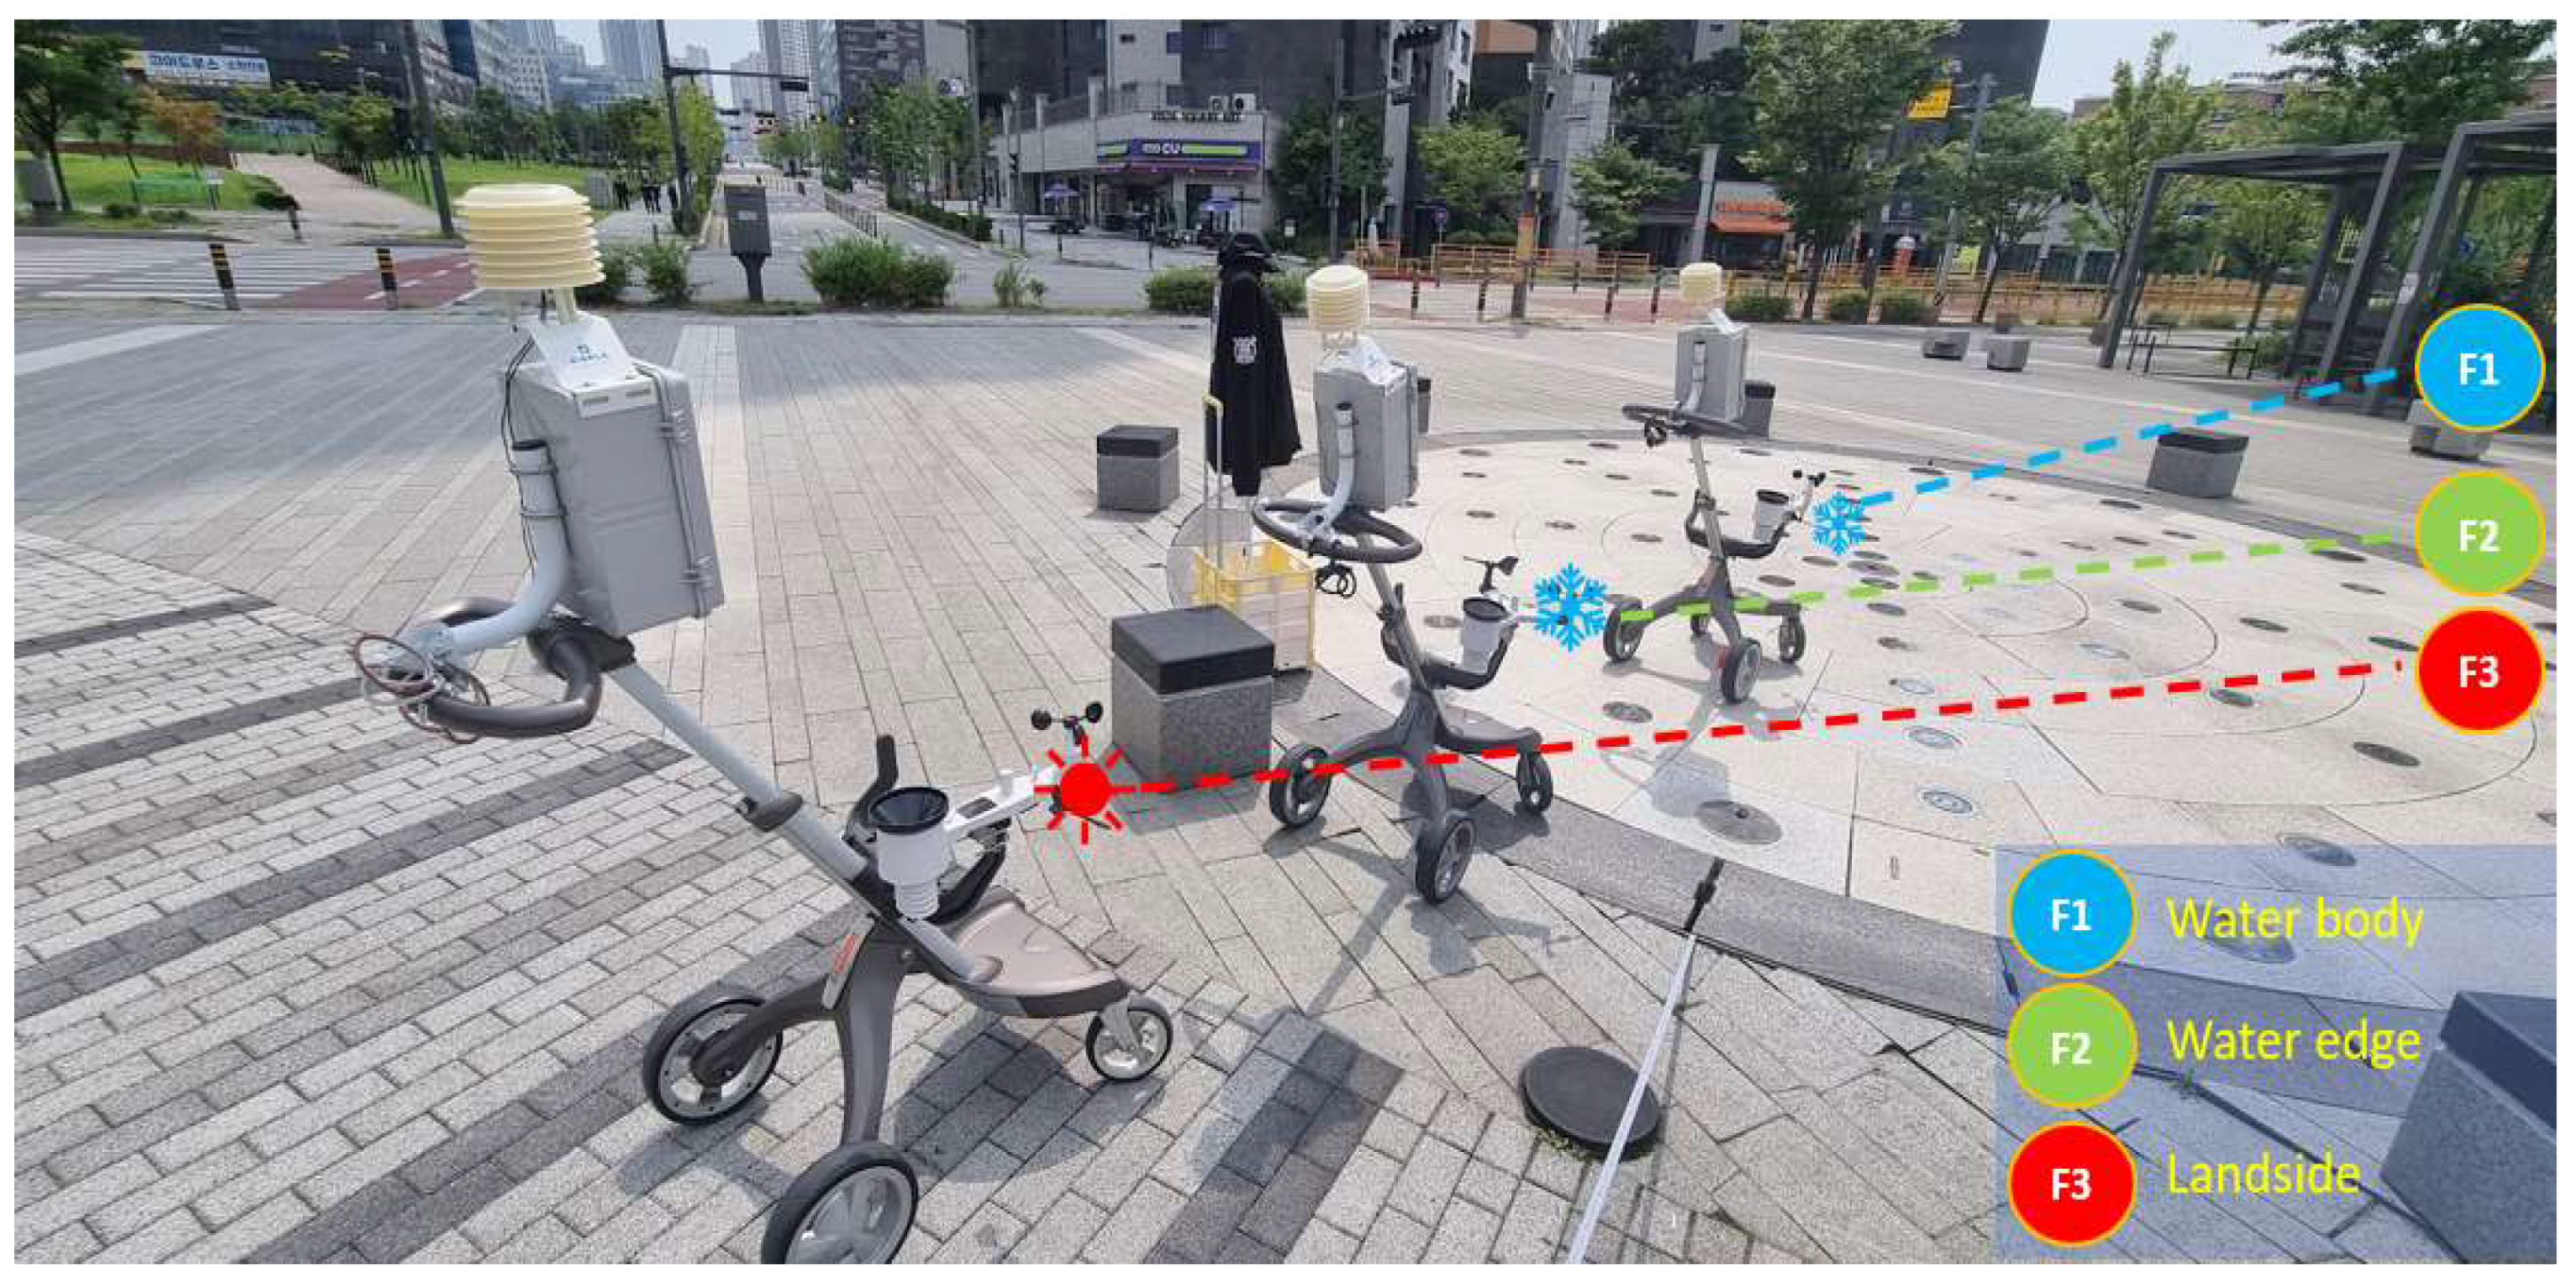
Figure 9.
Fountain Use and Cooling Effect in Urban Park Context.
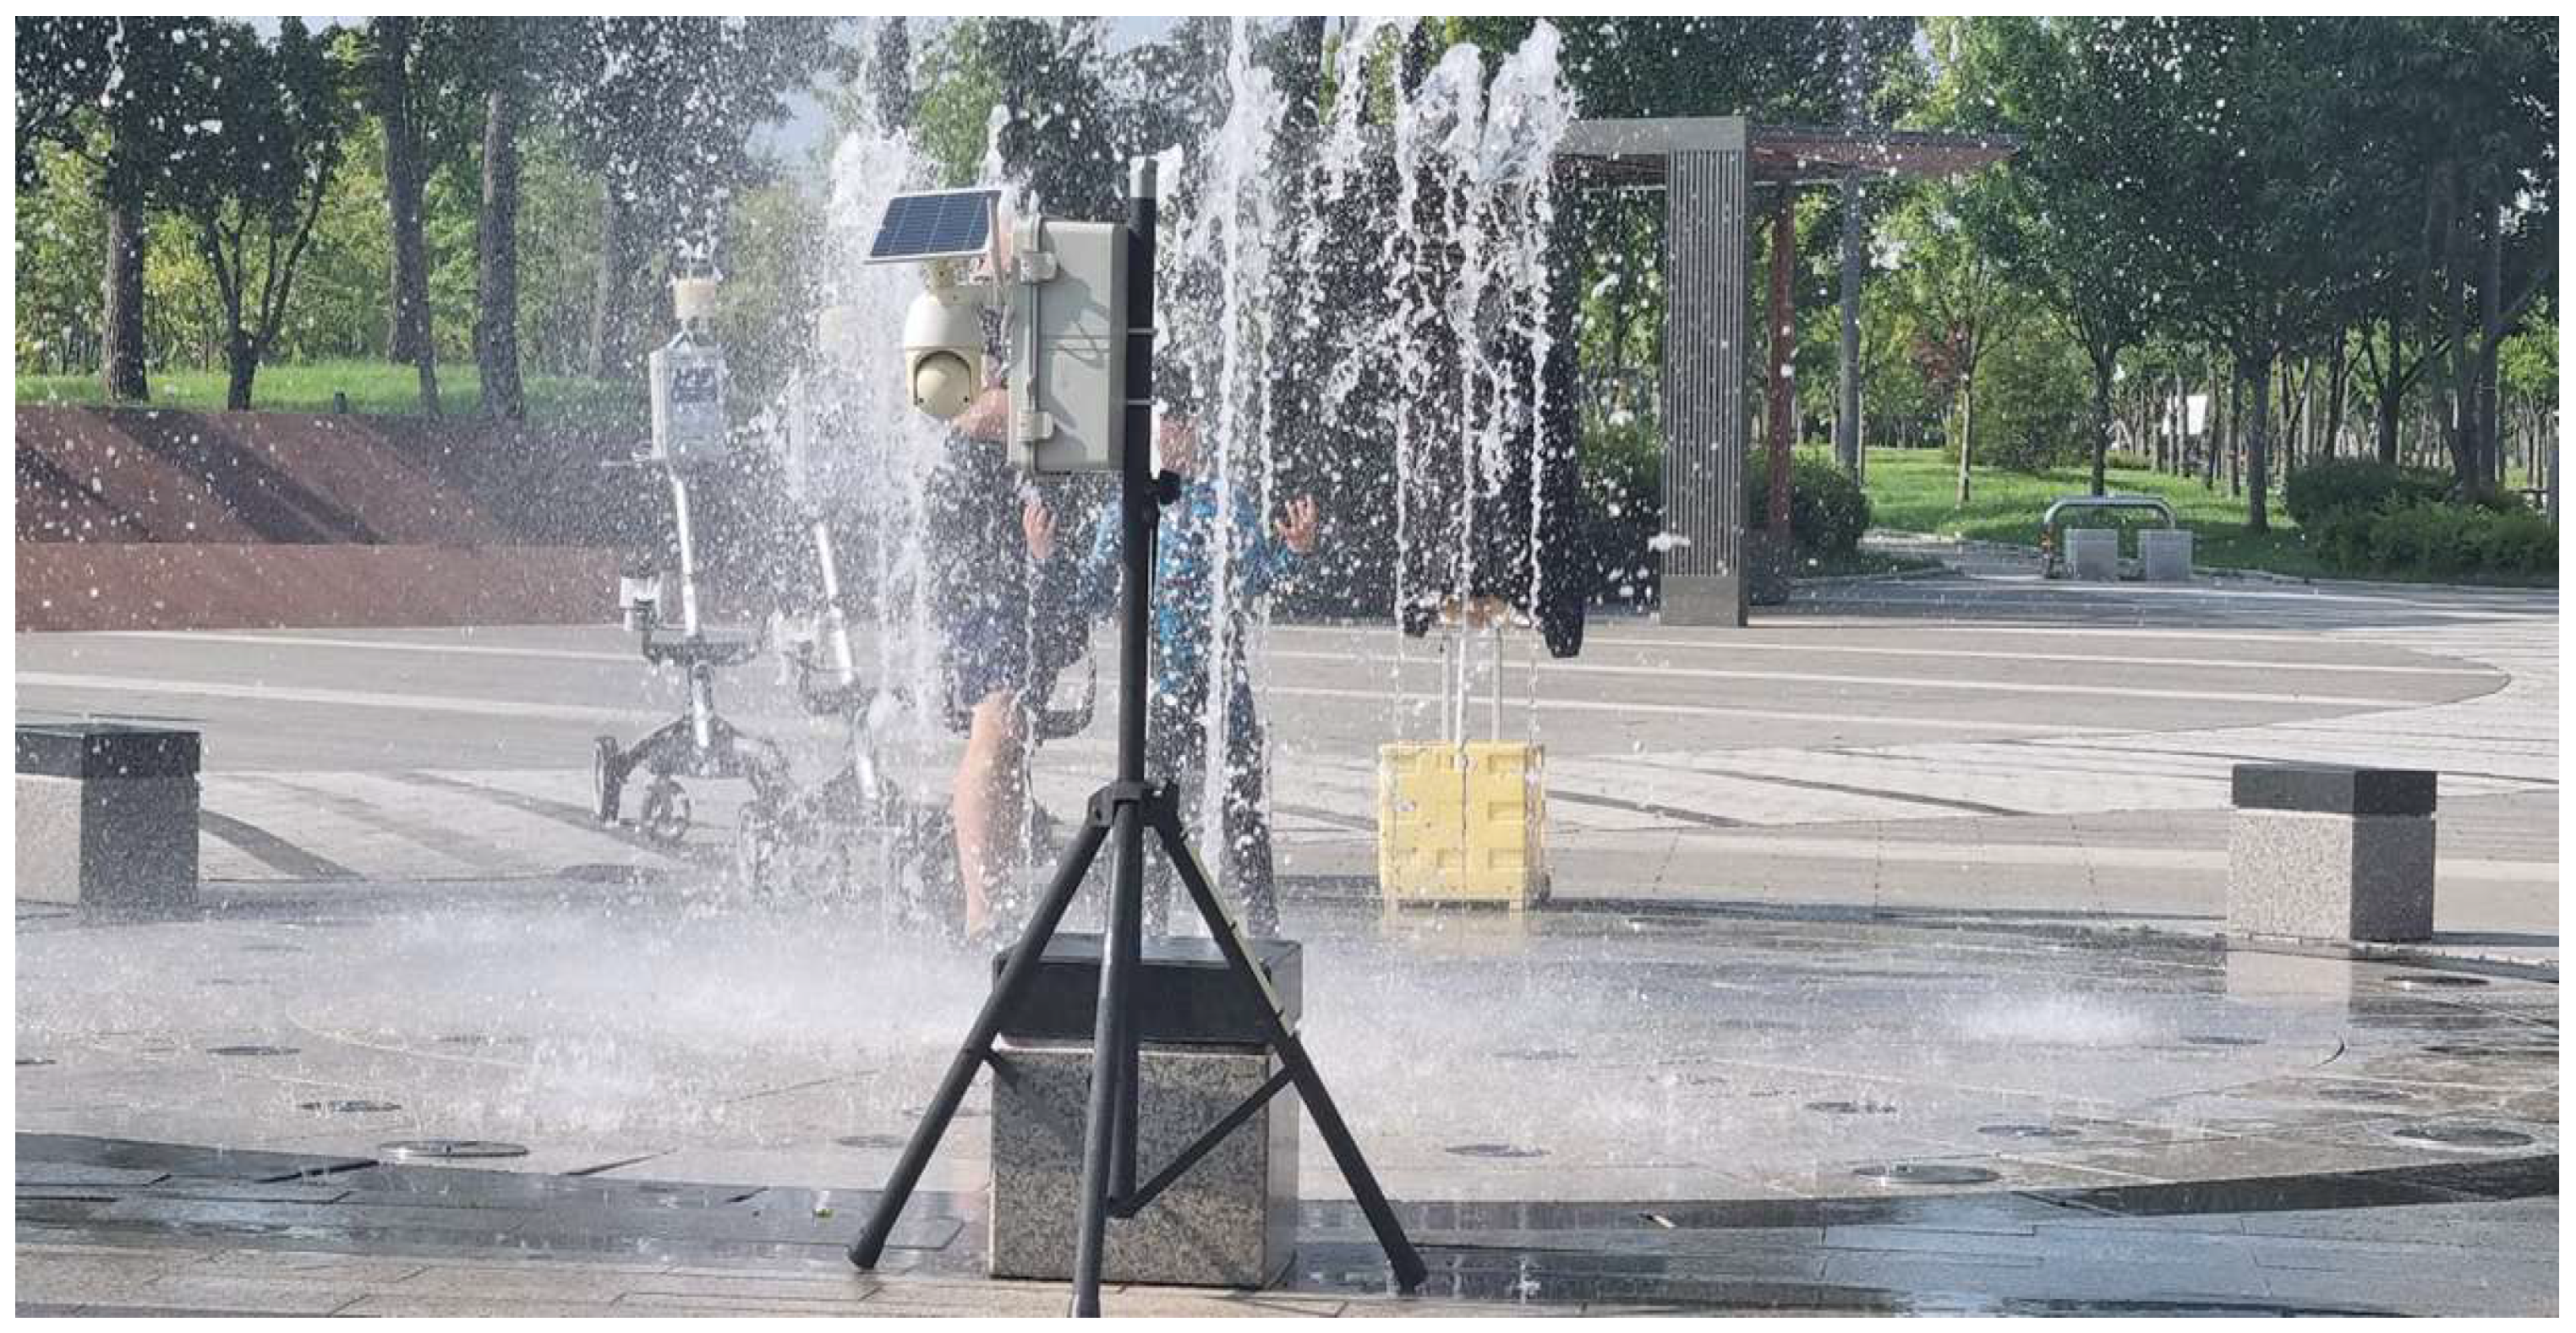
Figure 14.
Sensor and AWS Layout (V1: Water Body, V2: Water Edge, V3: Landside).

Figure 15.
Surface Temperature Sensors for MRT/UTCI at Chilrangi Valley.
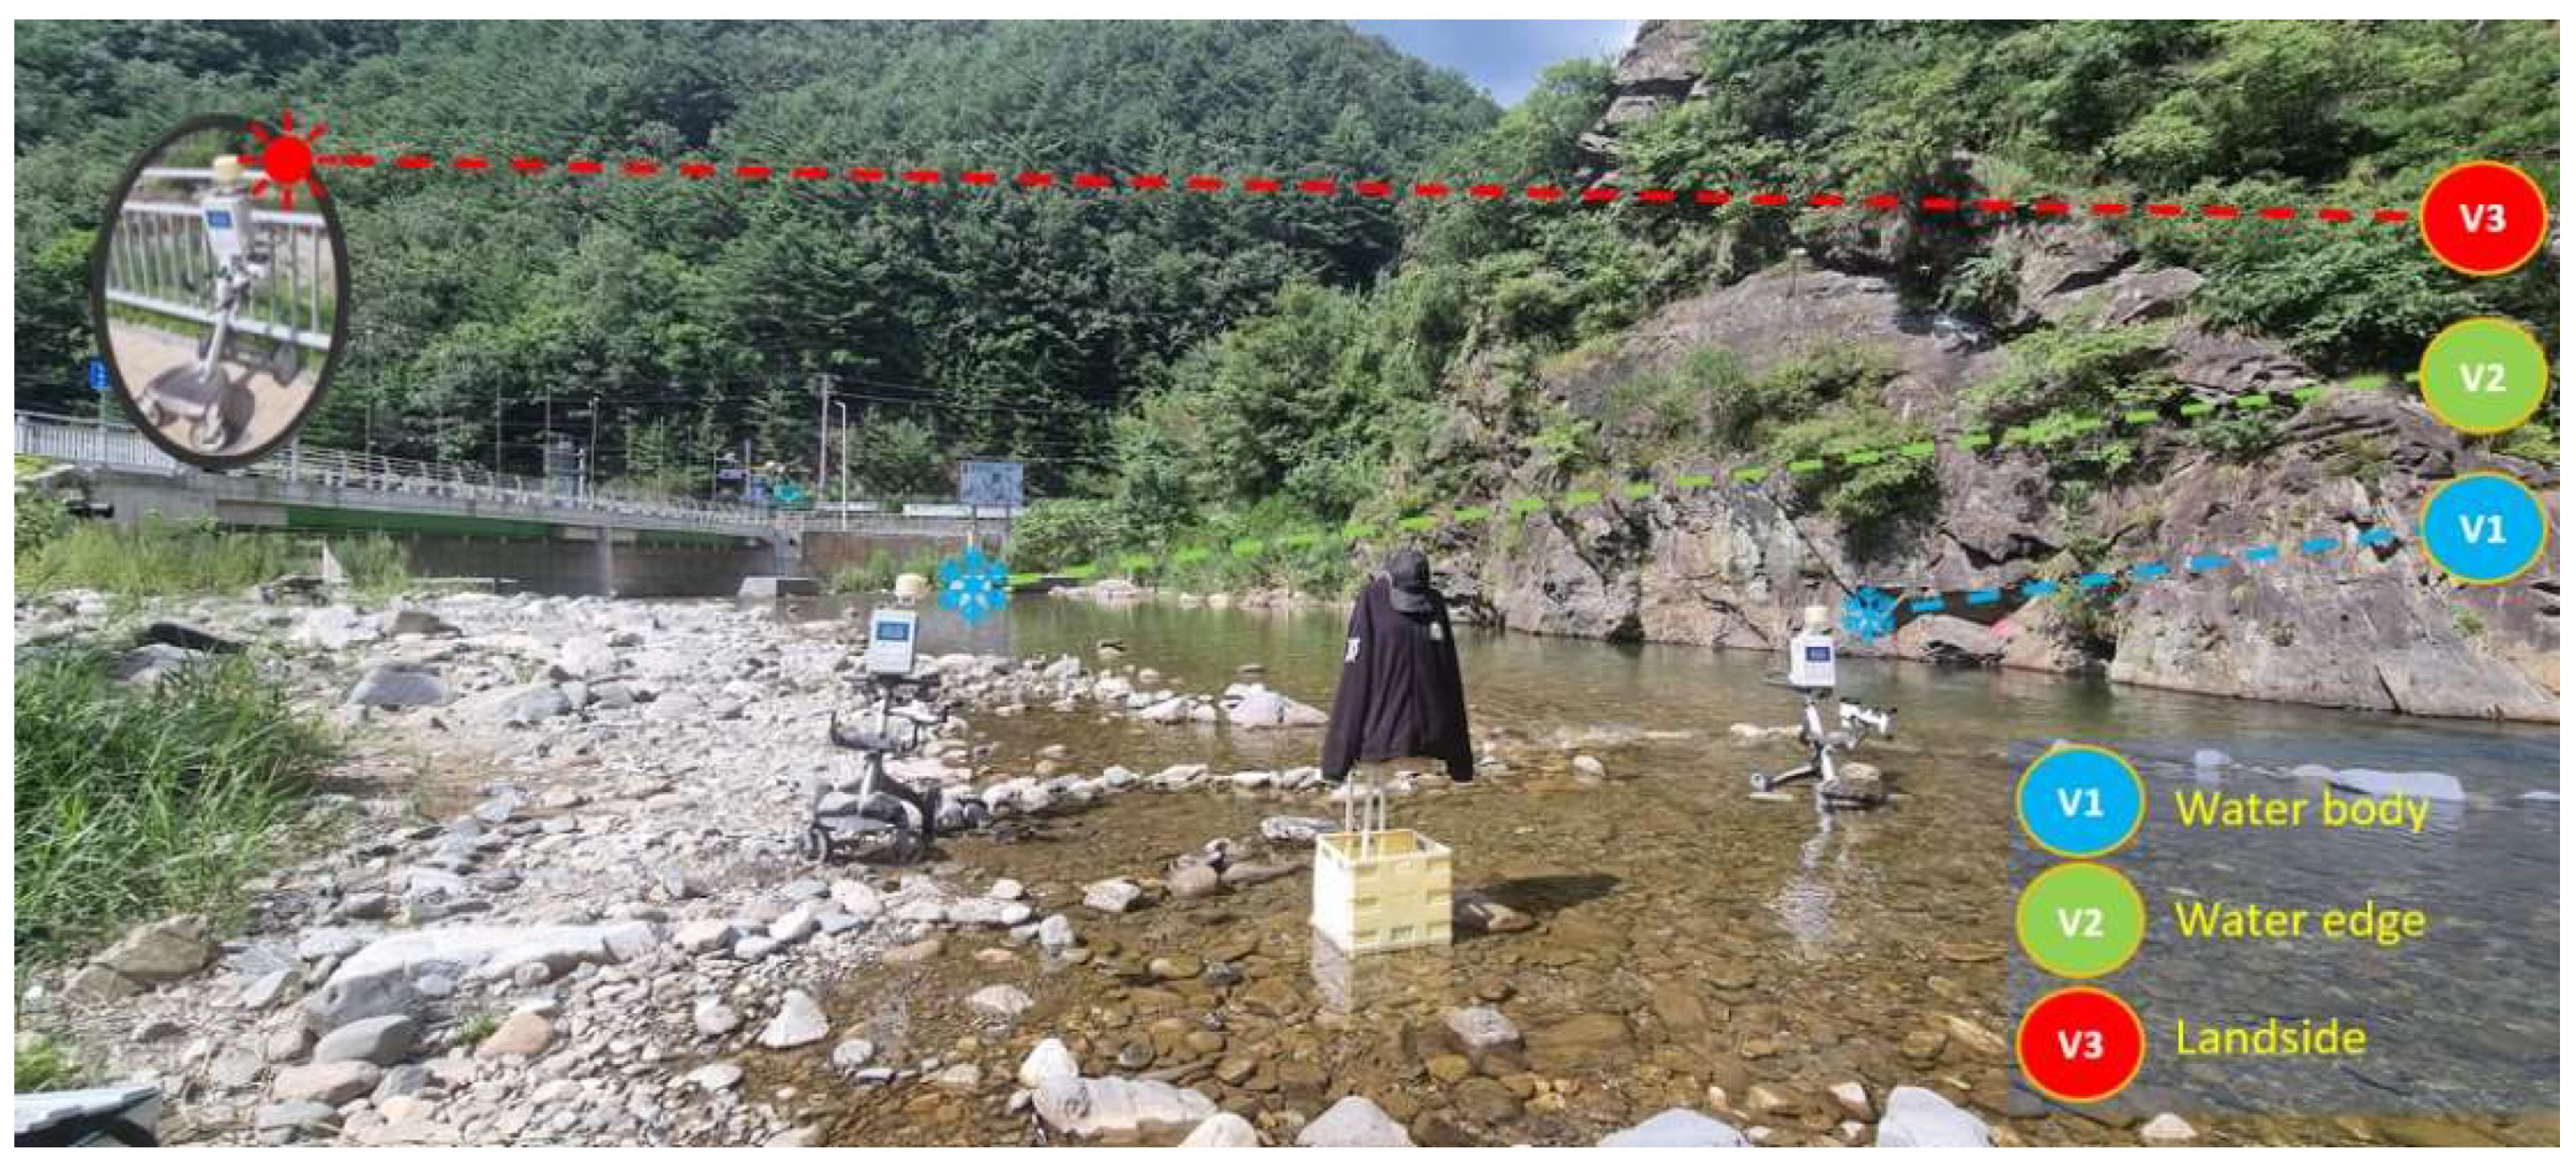
Table 2.
Independent t-Test Results (Overall Temperature Comparison).
| Zone | N | Avg Temp (°C) | Variance | t(p) |
| F1 (Water Body) | 112 | 30.93 | 6.88 | -6.89 (p < 0.001) |
| F2 (Water Edge) | — | 33.19 | 5.11 |
Table 3.
Summary of Temperature Comparison: V1, V2, V3 and F1, F2, F3.
| Measurement | Min Temp (°C) | Max Temp (°C) | Average Temp (°C) | Description |
|---|---|---|---|---|
| V1 Water Body | 20.5 | 30.8 | 25.5 | Most stable cooling via natural flow |
| F1 (Water Body) | 28 | 40.6 | 35.65 | Evaporative effect, limited duration |
| V2 (Water Edge) | 22 | 31.5 | 26.5 | Partial water contact |
| F2 (Water Edge) | 31.7 | 42.1 | 37.27 | Limited by surface heating |
| V3 (Landside) | 23 | 32.2 | 27.8 | Dry zone, moderate heat |
| F3 (Landside) | 31.7 | 43.2 | 37.7 | Strongest heat island effect |
Disclaimer/Publisher’s Note: The statements, opinions and data contained in all publications are solely those of the individual author(s) and contributor(s) and not of MDPI and/or the editor(s). MDPI and/or the editor(s) disclaim responsibility for any injury to people or property resulting from any ideas, methods, instructions or products referred to in the content. |
© 2025 by the authors. Licensee MDPI, Basel, Switzerland. This article is an open access article distributed under the terms and conditions of the Creative Commons Attribution (CC BY) license (http://creativecommons.org/licenses/by/4.0/).
Copyright: This open access article is published under a Creative Commons CC BY 4.0 license, which permit the free download, distribution, and reuse, provided that the author and preprint are cited in any reuse.


