
Submitted:
30 August 2024
Posted:
02 September 2024
You are already at the latest version
Abstract
This study investigates the cooling effects of water facilities installed in urban parks, focusing on Sangju Namsan Park. The park features a water path and a cooling fog system, introduced as part of an environmental adaptation project to mitigate urban heat. Microclimate data were collected during the hot summer months of 2023 to assess the impact of these facilities on air temperature, humidity, and perceived thermal comfort. Results indicate that the water path and fog system reduced surface temperatures by up to 1.08°C, with additional benefits in reducing fine particulate matter and CO2 levels. The findings suggest that strategically placed water features can enhance thermal comfort and air quality in urban parks, offering a practical approach to climate change adaptation in urban planning. These insights are crucial for urban planners and policymakers aiming to improve public health and quality of life in the face of climate change.
Keywords:
Urban parks
; Climate adaptation
; Cooling effects
; Microclimate
; Water facilities
; Urban heat island
; Thermal comfort
; Sangju Namsan Park
1. Introduction
With the increasing focus on climate change, various local governments are implementing climate adaptation measures in urban parks and public spaces. In particular, various water spaces and facilities that can reduce temperatures on hot summer days have been introduced. Climate change has significant impacts on the health of urban residents, and urban parks and green spaces are crucial for responding to these challenges. Parks help stabilize the local climate by purifying the air, and provide essential shade that mitigates the urban heat island effect. As the importance of addressing climate change grows, urban parks are increasingly seen not just as spaces for public recreation, but also as vital areas for improving urban thermal environments and effectively removing air pollutants such as fine particulate matter.
Previous studies have primarily focused on examining the effects of urban parks on temperature reduction. Research on the temperature reduction effects of urban parks and changes in meteorological measurements has been conducted across various regions and scales, both in South Korea and internationally. In South Korea, studies have analyzed temperature changes before and after park construction, examined how park size and conditions affect temperature reduction, compared thermal comfort indices between forested areas and lawns, and assessed the impact of parks on fine dust reduction. These studies consistently show that parks significantly reduce temperatures and fine dust, but the extent and range of temperature reduction vary depending on the park's location, size, measurement methods, and duration. Also, several studies in various countries have explored the temperature reduction effects of urban parks and green spaces during summer. These studies have investigated the complex effects of parks on thermal comfort and the urban heat island effect from various perspectives, with most finding that parks reduce temperatures by between 0.8°C and 3.8°C. For instance, a 1.12 ha green space was found to reduce temperatures by 0.78°C within a 90 m radius, and some studies reported effects ranging from 5°C to 7°C, indicating that the size of the green space greatly influences its cooling effect [1, 2, 3, 4]. As shown by the results of the above studies, the extent to which urban parks reduce surrounding temperatures varies depending on factors such as the park's canopy cover, size, and shape. This highlights the need to consider these elements in the planning and design of urban parks to mitigate the heat island effect exacerbated by climate change. Also, most prior studies have focused on a macro scale, using simulation techniques to estimate the effects of thermal environment improvement rather than measuring the actual effects. Additionally, most studies have analyzed large parks, with few examining the effects of small parks. Although some studies have investigated the effects of water spaces and climate adaptation facilities within parks, few have examined the impact of water spaces or facilities on the surrounding thermal environment.
Therefore, this study investigates the effects of water facilities within the park by using the data we collected from sensors that capture microclimate data. Specifically, we monitored and analyzed Sangju Namsan Park, where water path and cooling fog systems were introduced as part of an environmental adaptation project.
2. Literature Review
Studies on the temperature reduction effects of urban parks and changes in meteorological measurements have been conducted on parks across various regions and scales, both domestically and internationally. In prior research in South Korea, analyses were conducted on temperature differences before and after park construction [5]. temperature reduction effects based on the size and conditions of green spaces or parks [2,6], and comparisons of thermal comfort indices between forested areas and lawns [7]. Additionally, studies have also examined the effects of parks in reducing fine dust [8,9,10,11,12,13,14,15]. These studies consistently show that parks significantly reduce temperatures and fine dust, but the extent and range of temperature reduction vary depending on the park's location, size, measurement methods, and duration.
Research on the impact of park size on urban temperature reduction has been conducted using various methodologies. For example, a study which focused on Ilsan New Town, and analyzed the effect of park size on temperature reduction, offering insights for park planning to mitigate the urban heat island effect [16]. This study explored the minimum size of parks and the spatial impact on temperature reduction, seeking ways in which parks can positively influence the urban environment. Another method is to use satellite images. A study analyzed satellite imagery to evaluate the impact of green spaces in reducing urban temperatures, which extracted surface temperatures and corrected them to air temperatures, observing how temperatures changed within 500 meters of green spaces [17]. Also, several studies have recently been made in research on securing carbon sinks and carbon reduction strategies pertaining to park and green space management [18,19,20].
Also, these studies that examine the effects of urban green and blue infrastructure have covered various regions. Several studies conducted in several different regions have also explored the temperature reduction effects of urban parks and green spaces during summer [21,22,23,24]. These studies have investigated the complex effects of parks on thermal comfort and the urban heat island effect from various perspectives, with most finding that parks reduce temperatures by between 0.8°C and 3.8°C, and some studies reporting effects ranging from 5°C to 7°C. Such temperature reduction effects can occur not only within the park, but also extend to surrounding areas, indicating that parks can play an important role in improving urban environments during summer months [13,25]. In line with the findings of previous studies, one study that examined the micro-scale effects demonstrated that a relatively small green space of 1.12 ha had a cooling distance of 90 meters and a temperature reduction of 0.78°C, showing that the size of green spaces significantly influences their cooling effects [26]. The temperature reduction effect of green spaces within parks can vary depending on the climate, urban form, and land cover types where the park is located, suggesting that the effects of parks in improving the thermal environment can differ according to the park's size, location, and weather conditions. Therefore, it is important to conduct appropriate measurements tailored to the specific conditions of each area.
The previous literature has established the role of not only parks but also blue and green spaces in thermal comfort and microclimate regulation. These research findings emphasize the need to integrate such spaces into urban planning policies to improve quality of life and public health.
3. Study Area and Research Method
3.1. Study Area and Data Collection
This study examines Sangju Namsan Park, which was selected for a climate change adaptation project led by the Ministry of the Environment that involved installing facilities to improve the thermal environment in urban public spaces and parks. Sangju is a small city located in the inland region of northwestern Gyeongsangbuk-do, and is influenced by a continental climate. The average annual temperature is 13.4°C, average annual daily maximum temperature is 19.2°C, and average annual daily minimum temperature is 8.3°C, resulting in a relatively large annual daily temperature range of 10.9°C. As of the end of July 2023, Sangju had a population of 94,386 (46,448 male, 47,938 female). The average age is 53.0 years, indicating an aging population. The proportion of the population vulnerable to high summer temperatures (those younger than 18 or aged 65 and older) is about 42.5%, with the elderly group (65+) accounting for approximately 34.4%, making it the second most aged region in South Korea.
The specific data collection process is as follows. This study collected microclimate data during summer months, using data loggers and weather stations capable of measuring temperature, humidity, fine dust, and CO₂ at 5-minute intervals. To accurately measure the effects of water facilities, preliminary measurements were conducted during afternoon hours over two days on June 27 and 28, 2023. Based on these measurements, the locations for equipment installation were determined, and microclimate data were collected from late July to August 2023, for about 28 days, at locations with and without water facilities. Weather stations were installed at three locations: near the water path facility, at the park entrance about 30 meters from the water path rest area, and near a pergola featuring a cooling fog system. Additionally, data loggers were installed at six locations: two near the water path rest area, two in green spaces located away from the water path rest area, and two near the water pump facility to measure changes in surface temperature. The exact equipment locations where the equipment was installed are shown in Figure 1 and Figure 2.
Microclimate data were collected using these devices at 5-minute intervals over a 28-day period from July to August. Supplementary data were also collected using thermal imaging cameras, drones, and pedestrian flow sensors. The specific measurement equipment and details are provided in Table 1 and Table 2.
3.3. Research Method –Analysis
The collected data were analyzed using IBM SPSS statistical software (version 28.0.1.1). One-way analysis of variance (ANOVA) was used to determine the statistical significance of temperature differences across various locations within the study area. Post-hoc tests, such as the Duncan test, were employed to further investigate the significance of measured differences between individual sites. Additionally, the analysis incorporated the perceived temperature measured by the equipment, along with the actual meteorological values. The formula used by the Korea Meteorological Administration to calculate perceived temperature during summer is as follows.
4. Results
4.1. Effect on Thermal Environment – Reduced Surface Temperature
As shown in Figure 3, thermal imaging camera footage was used to measure temperatures at the small water path rest area and various measurement sites. The results are shown in Table 3. In the central area of the park, the measurement sensors recorded a spot point temperature of 39.7°C and a temperature range of 38.6°C–58.8°C (minimum to maximum); 39.1°C (range 35.0°C–60.1°C) at the small water path; and 36.8°C (range 32.2°C–53.3°C) at the site with the cooling fog system. The thermal camera data showed that the lowest temperatures were recorded in the pergola, followed by the small water path rest area and the park center.
The results presented in Figure 3 and Table 3 show the surface temperatures of each facility recorded on a hot day. The overall thermal image footage of the park, including the small water path rest area, shows that the water in the small water path had a spot point temperature of 33.5°C, minimum temperature of 32.2°C, and maximum surface temperature of 62.5°C. Even in summer conditions, when surrounding surfaces showed significant temperature increases, it was observed that the temperature of the water in the path remained relatively low, between 30°C and 32°C. Specifically, the surface temperature of the water path rest area was recorded as 32.2°C, compared to a maximum surrounding temperature of 43.6°C, indicating that the water path rest area provided a cooling effect relative to its surroundings. This suggests that the water path feature has the potential to serve as an effective cooling space for vulnerable populations. Although rainwater retention and purification facilities may have limited effect in reducing maximum temperature, the relatively low water temperature in the water path rest area shows potential for providing a comfortable environment on hot summer days.
4.2. Effect on Thermal Environment –Temperature Changes
Over the course of the entire measurement period, the average temperature of the water path rest area was 25.73°C, that of the park center was 25.86°C, and the pergola had the lowest average temperature at 25.67°C. Hourly averages and variations in temperature and humidity are shown in Figure 3.
The comparison of average temperatures shown in Figure 4 showed that the maximum temperature difference between the water path rest area and the park center was 0.22°C, with the highest temperature difference being 3.2°C. The difference between the water path rest area and the pergola was measured at 0.35°C, with the highest temperature difference being 3.3°C. And the comparison of average humidity during the measurement period showed that the maximum humidity difference between the water path rest area and the park center was 2.4%, with the highest humidity difference being 21%. The difference between the water path rest area and the pergola was measured at 4.04%, with the highest humidity difference being 11%. While there are differences depending on the specific measurement time, overall, the pergola showed the lowest temperatures, likely due to periodic water spraying and some shading at the measurement site.
ANOVA analysis based on the entire microclimate data set revealed that perceived temperature showed greater differences between sites than did actual temperature. Additionally, the pergola had the lowest measurements for PM2.5 and CO2, indicating that the water path rest area was effective not only in reducing temperature but also in improving air quality. Specifically, the park center (B) had the highest average temperature at 25.86°C, followed by the water path rest area (A) at 25.73°C, and the pergola (C) at 25.67°C. This indicates that the water path rest area and pergola provided cooler environments compared to the central zone of the park. The same trend was observed for perceived temperature, being highest at the park center (B) at 27.72°C, followed by the water path rest area (A) at 27.63°C, and lowest at the pergola (C) at 27.22°C.
These results indicate the presence of cooling effects provided by the water path rest area and pergola. The subtle differences in temperature and perceived temperature indicate that these areas can offer some protection from the heat. Overall, the water features showed a cooling effect, with lower measured and perceived temperatures compared to the park center. In particular, the pergola, with its operational cooling fog system, provided an even more comfortable environment by reducing fine dust and CO₂ levels.

Table 4.
Sangju Microclimate Measurement ANOVA Results (August 9 to September 7) .
| Classification | n | Average | SD | F | p-value | Duncan | |
|---|---|---|---|---|---|---|---|
| Temperature (℃) |
a. Water path rest area | 6991 | 25.73 | 3.46 | 5.94 | 0.003* | a,c<b |
| b. Park center | 6991 | 25.86 | 3.46 | ||||
| c. Pergola | 6991 | 25.67 | 3.26 | ||||
| Perceived temperature (℃) | a. Water path rest area | 6991 | 27.63 | 6.21 | 14.04 | <0.001** | c<a,b |
| b. Park center | 6991 | 27.72 | 6.10 | ||||
| c. Pergola | 6991 | 27.22 | 5.52 | ||||
| Humidity (%) |
a. Water path rest area | 6991 | 87.27 | 12.32 | 218.31 | <0.001** | c<b<a |
| b. Park center | 6991 | 85.15 | 12.29 | ||||
| c. Pergola | 6991 | 83.04 | 11.27 | ||||
| PM2.5 (ug/m3) |
a. Water path rest area | 7077 | 10.94 | 11.95 | 211.92 | <0.001* | c<a<b |
| b. Park center | 7077 | 13.91 | 13.98 | ||||
| c. Pergola | 7077 | 9.36 | 14.06 | ||||
| PM10 (ug/m3) |
a. Water path rest area | 7077 | 4.09 | 4.17 | 403.12 | <0.001* | c<b<a |
| b. Park center | 7077 | 3.33 | 3.57 | ||||
| c. Pergola | 7077 | 2.28 | 3.67 | ||||
| CO2 (ppm) |
a. Water path rest area | 3615 | 506.73 | 33.45 | 70143.12 | <0.001* | C<b<a |
| b. Park center | 3615 | 397.79 | 32.00 | ||||
| c. Pergola | 3615 | 207.62 | 37.42 | ||||
To more specifically compare the effects of improved thermal environment, the following Table 5-8 compares temperatures during active periods, afternoon hours, and times when temperatures exceeded the heatwave threshold of 33°C. Specifically, for the study period August 7 to September 7: Hourly temperature data collected from 7 AM to 10 PM follow the trend: park center > water path rest area > pergola, with differences of 0.30°C and 0.15°C, respectively; Data from 10 AM to 4 PM follow the trend: park center, water path rest area > pergola, with differences of 1.08°C and 0.36°C, respectively; Data from 10 AM to 2 PM follow the trend: park center, water path rest area > pergola, with differences of 0.32°C and 0.30°C, respectively. A final comparison of hourly temperature data during periods exceeding the heatwave threshold of 33°C shows the trend: park center, water path rest area > pergola, with differences of 0.83°C and 0.84°C, respectively.
Table 5.
Sangju Temperature ANOVA Results (August 7–September 7, when measured temperatures above 33°C temperature).
Table 5.
Sangju Temperature ANOVA Results (August 7–September 7, when measured temperatures above 33°C temperature).
| Classification | n | Average | SD | F | p-value | Duncan | |
|---|---|---|---|---|---|---|---|
| Temperature (℃) |
a. Water path rest area | 208 | 34.30 | 0.67 | 50.30 | <0.001* | c<a,b |
| b. Park center | 208 | 34.29 | 0.63 | ||||
| c. Pergola | 208 | 33.46 | 0.72 | ||||
Table 5.
Sangju Temperature ANOVA Results (August 7–September 7, time between 07:00-22:00).
| Classification | n | Average | SD | F | p-value | Duncan | |
|---|---|---|---|---|---|---|---|
| Temperature (℃) |
a. Water path rest area | 4435 | 27.07 | 3.38 | 9.16 | <0.001* | c<a<b |
| b. Park center | 4435 | 27.22 | 3.35 | ||||
| c. Pergola | 4435 | 26.92 | 3.14 | ||||
Table 7.
Sangju High-Temperature ANOVA Results (August 7–September 7, time between 10:00-14:00).
| Classification | n | Average | SD | F | p-value | Duncan | |
|---|---|---|---|---|---|---|---|
| Temperature (℃) |
a. Water path rest area | 1124 | 28.54 | 3.42 | 3.06 | 0.045* | c<a,b |
| b. Park center | 1124 | 28.56 | 3.32 | ||||
| c. Pergola | 1124 | 28.24 | 3.12 | ||||
Table 8.
Sangju High-Temperature ANOVA Results (August 7–September 7, time between 10:00-16:00).
| Classification | n | Average | SD | F | p-value | Duncan | |
|---|---|---|---|---|---|---|---|
| Temperature (℃) |
a. Water path rest area | 1739 | 28.89 | 3.56 | 7.97 | <0.001* | c<a,b |
| b. Park center | 1739 | 29.97 | 3.47 | ||||
| c. Pergola | 1739 | 28.53 | 3.28 | ||||
4.3. Other Data: Changes in Park Usage
Apart from the temperature data, to examine whether the improved thermal environment provided by water spaces and facilities influenced park usage, pedestrian flow sensors were used to observe daily and hourly changes in park usage from August 9 to September 7. The graphs below show variations in visitor usage by time of day and weekday/weekend. Overall, the highest levels of park usage were observed between 6 PM and 8 PM, when temperatures drop.
Figure 5.
(a) Sangju Daily Park Usage (August 9–September 7); (b) Sangju Hourly Park Usage (August 9–September 7).
Figure 5.
(a) Sangju Daily Park Usage (August 9–September 7); (b) Sangju Hourly Park Usage (August 9–September 7).
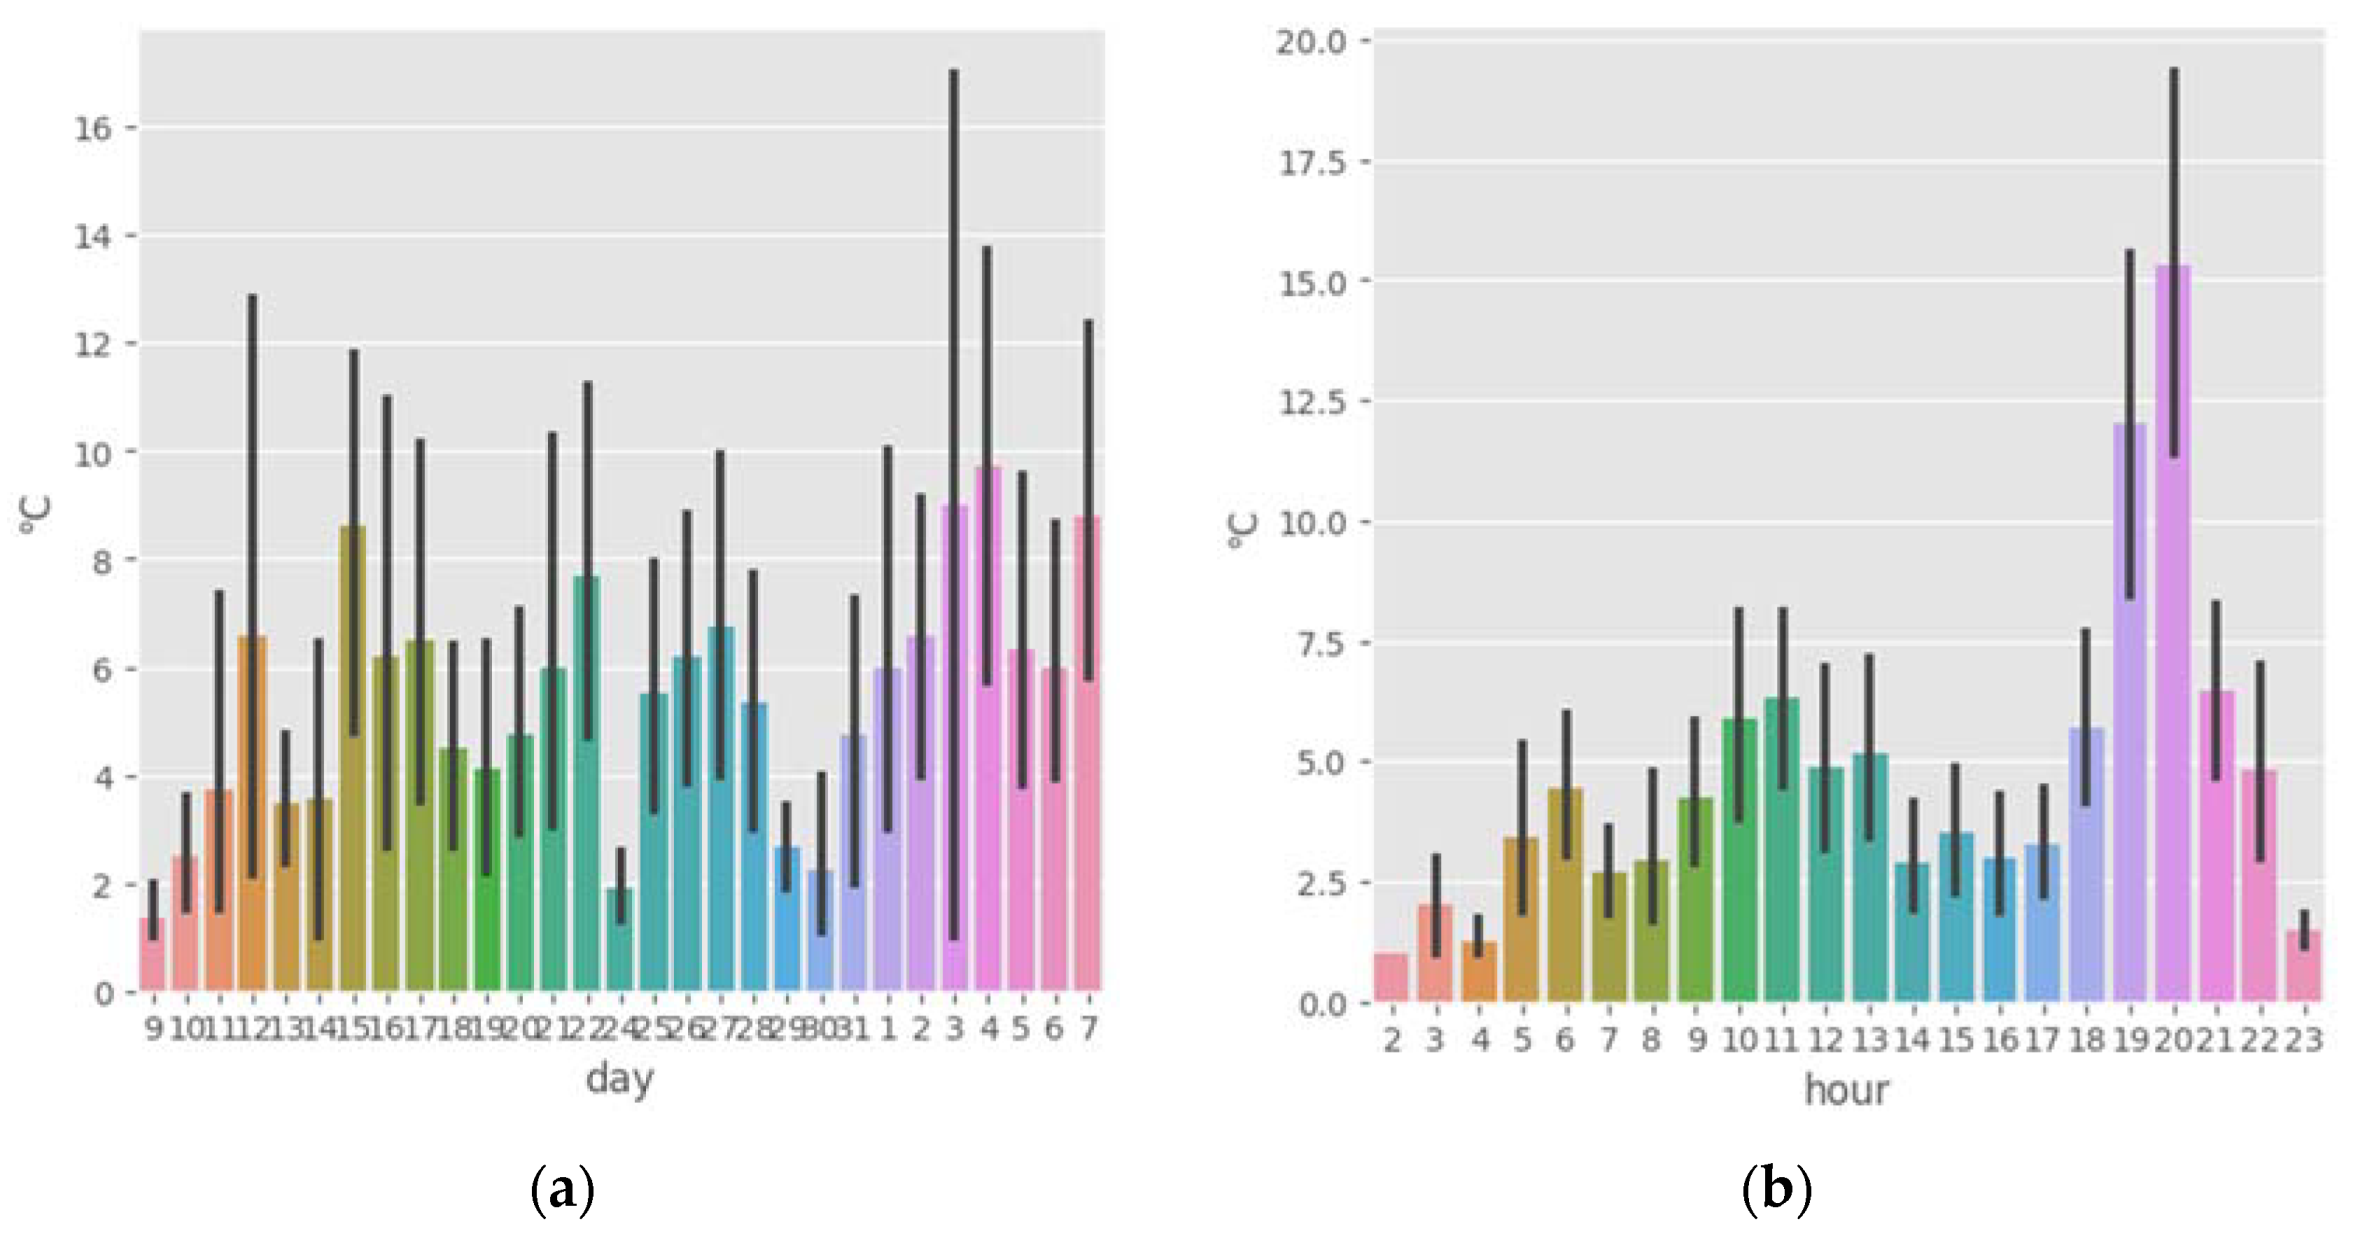
Figure 6 shows the relationship between measured microclimate data and park usage showed that park usage was highest at temperatures between 23°C and 28°C, at humidity levels of 75%–85%, and when the UVI was low, which roughly tells that people used park more when it is good weather condition. However, the sample size used to determine park usage was not large, and there were likely significant variations based on the time of day. Nevertheless, long-term data collection to examine how actual microclimate metrics relate to park usage could yield significant insights for park management, policy-making, and academic research.
5. Conclusions
This study collected microclimate data to examine how water paths and cooling fog systems installed in a small urban park influenced the thermal environment. Analyzing the temperature distribution from August 7 to September 7, 2023 during a period of hot summer weather, the water path rest area recorded the lowest average temperature of 25.73°C, maintaining an average temperature 0.13°C lower than surrounding spaces, indicating a cooling effect. Specifically, the pergola, with an average temperature of 25.67°C, recorded the second lowest temperature after the water path rest area, with a temperature difference of 0.19°C , confirming the additional cooling effect of the pergola's fog system.
The cooling effect provided by water features was most pronounced during the hottest hours of the day (10 AM to 4 PM), with average temperatures at the pergola (C) being 0.36°C lower than at the water path rest area (A) and 1.08°C lower than at the park center (B). ANOVA showed that at elevated temperatures exceeding 33°C, the lack of shade available at the water path rest area limited its contribution to temperature reduction, with the park center (B) and the water path rest area (A) being 0.83°C and 0.84°C hotter, respectively, than the pergola (C). The results of this study demonstrate that facilities such as water paths and cooling fog systems in parks not only contribute to improving the thermal environment but also have significant effects on other environmental factors such as humidity, atmospheric particulates, and CO2 levels.
However, careful consideration is needed when considering where to locate water facilities, how to encourage comfortable use by park visitors, and the periodic maintenance and management of such facilities. Additionally, it is important to explore ways to effectively utilize not only water paths but also various other facilities for climate change adaptation in parks and public spaces.
Author Contributions
Conceptualization, Y.S. and T.K.; methodology, T.H. and H.D.Z.; software, T.K.; validation, H.D.Z.; formal analysis, H.D.Z ; investigation, T.H.; resources, T.H. ; data curation, D.H.; writing—original draft preparation, T.K.; writing—review and editing, Y.S. and H.D.Z.; visualization, T.K.; supervision, T.K. and T.H. All authors have read and agreed to the published version of the manuscript.
Funding
This research was funded by the supporting project for climate-vulnerable groups and regions conducted by Korea Environment Institute (2024-001-03))
Acknowledgement
This paper is modified based on the findings of the supporting project for climate-vulnerable groups and regions conducted by Korea Environment Institute (2023-001-03))
Data Availability Statement
Not applicable
Conflicts of Interest
The authors declare there are no conflicts of interest
Funding
“This research was funded by Korea Environmental Institute’s Climate Crisis Vulnerable
References
- Cohen, P.; Potchter, O. l Matzarakis, A. Daily and seasonal climatic conditions of green urban open spaces in the Mediterranean climate and their impact on human comfort. 2012. Building and Environment, 51, 285-295.
- Lee, S.-H.; Lee, K.-S.; Jin, W.-C.; Song, H.-K. Effect of an urban park on air temperature differences in a central business district area. Landsc. Ecol. Eng. 2009, 5, 183–191. [Google Scholar] [CrossRef]
- Chang, C.-R.; Li, M.-H.; Chang, S.-D. A preliminary study on the local cool-island intensity of Taipei city parks. Landsc. Urban Plan. 2007, 80, 386–395. [Google Scholar] [CrossRef]
- Yan, H.; Wu, F.; Dong, L. Influence of a large urban park on the local urban thermal environment. Sci. Total Environ. 2018, 622–623, 882–891. [Google Scholar] [CrossRef] [PubMed]
- Kim, D.W.; Kim, J.K.; Jung, E. An analysis of micro-climate environmental changes followed by establishment of an urban park-focused on the Junggu in Daegu city. 2010, Journal of the Urban Design Institute of Korea Urban Design, 11.2: 77-94.
- Choi, H.-A.; Lee, W.-K.; Byun, W.-H. Determining the Effect of Green Spaces on Urban Heat Distribution Using Satellite Imagery. Asian J. Atmospheric Environ. 2012, 6, 127–135. [Google Scholar] [CrossRef]
- Ryu, N.-H.; Lee, C.-S. Effects for the Thermal Comfort Index Improvement of Park Woodlands and Lawns in Summer. J. Korean Inst. Landsc. Arch. 2014, 42, 21–30. [Google Scholar] [CrossRef]
- Koo, M.-A. The Relationship between Particular Matter Reduction and Space Shielding Rate in Urban Neighborhood Park. J. Korean Inst. Landsc. Arch. 2019, 47, 67–77. [Google Scholar] [CrossRef]
- Ahn, R.; Hong, S. Characteristics of Particulate Matter 2.5 by Type of Space of Urban Park-Focusing on the Songsanghyeon Plaza in Busan. 2021. Journal of the Korean Institute of Landscape Architecture, 49.6: 37-48.
- Lee, A.; Jeong, S.; Joo, J.; Park, C.-R.; Kim, J.; Kim, S. Potential role of urban forest in removing PM2.5: A case study in Seoul by deep learning with satellite data. Urban Clim. 2021, 36, 100795. [Google Scholar] [CrossRef]
- Park, J.; Lee, P. S. H. Relationship between remotely sensed ambient PM 10 and PM 2.5 and urban Forest in Seoul, South Korea. 2020. Forests 11(10): 1060.
- Hwang,K.; Han, B.; Kwark, J. Park, S. A study on decreasing effects of ultra-fine particles (PM 2.5) by structures in a roadside buffer green-A buffer green in Songpa-gu, Seoul. Journal of the Korean Institute of Landscape Architecture, 2018, 46.4: 61-75.
- Lee, A.; Jeong, S.; Joo, J.; Park, C.-R.; Kim, J.; Kim, S. Potential role of urban forest in removing PM2.5: A case study in Seoul by deep learning with satellite data. Urban Clim. 2021, 36, 100795. [Google Scholar] [CrossRef]
- Park, J. ; P. S. H. Lee. Relationship between remotely sensed ambient PM 10 and PM 2.5 and urban Forest in Seoul, South Korea. 2020. Forests 11(10): 1060.
- Hwang, K; Han, B.; Kwar, J.; Park, S. A study on decreasing effects of ultra-fine particles (PM 2.5) by structures in a roadside buffer green-A buffer green in Songpa-gu, Seoul. 2018,Journal of the Korean Institute of Landscape Architecture, 46.4: 61-75.
- Park, J.-H.; Cho, G.-H. Influence of park size on the park cooling effect - Focused on Ilsan new town in Korea. J. Korea Plan. Assoc. 2016, 51. [Google Scholar] [CrossRef]
- Yoon, M.; Ahn, D. 4: An Application of Satellite Image Analysis to Visualize the Effects of Urban Green Areas on Temperature, 2009, Journal of the Korean Institute of Landscape Architecture, 37(3), 2009.
- Singkran, N. Carbon sink capacity of public parks and carbon sequestration efficiency improvements in a dense urban landscape. Environ. Monit. Assess. 2022, 194, 1–15. [Google Scholar] [CrossRef] [PubMed]
- Rodríguez, L. C.; Cuesta, F. The metropolitan parks of Quito as important carbon sinks. 2024.
- Gao, S.; Tao, P.; Zhao, Z.; Dong, X.; Li, J.; Yao, P. Estimation and Differential Analysis of the Carbon Sink Service Radius of Urban Green Spaces in the Beijing Plain Area. Sustainability 2024, 16, 1406. [Google Scholar] [CrossRef]
- Yan, H.; Wu, F.; Dong, L. Influence of a large urban park on the local urban thermal environment. Sci. Total Environ. 2018, 622–623, 882–891. [Google Scholar] [CrossRef] [PubMed]
- Li, Y.; Fan, S.; Li, K. ; Zhang, Y Microclimate in an urban park and its influencing factors: A case study of Tiantan Park in Beijing, China. 2021. Urban Ecosystems, 24: 767-778.
- Cheung, P.K.; Jim, C.; Siu, C.T. Effects of urban park design features on summer air temperature and humidity in compact-city milieu. Appl. Geogr. 2021, 129. [Google Scholar] [CrossRef]
- George, N.J; Zafiriadis, K. The impact of park trees on microclimate in urban areas. 2006. Urban Ecosystems, 9: 195-209.
- Yang, P.; Xiao, Z.-N.; Ye, M.-S. Cooling effect of urban parks and their relationship with urban heat islands. Atmospheric Ocean. Sci. Lett. 2016, 9, 298–305. [Google Scholar] [CrossRef]
- Du, H.; Song, X.; Jiang, H.; Kan, Z.; Wang, Z.; Cai, Y. Research on the cooling island effects of water body: A case study of Shanghai, China. Ecol. Indic. 2016, 67, 31–38. [Google Scholar] [CrossRef]
Figure 1.
Locations for measuring devices – (left) aerial view, (right) map view.
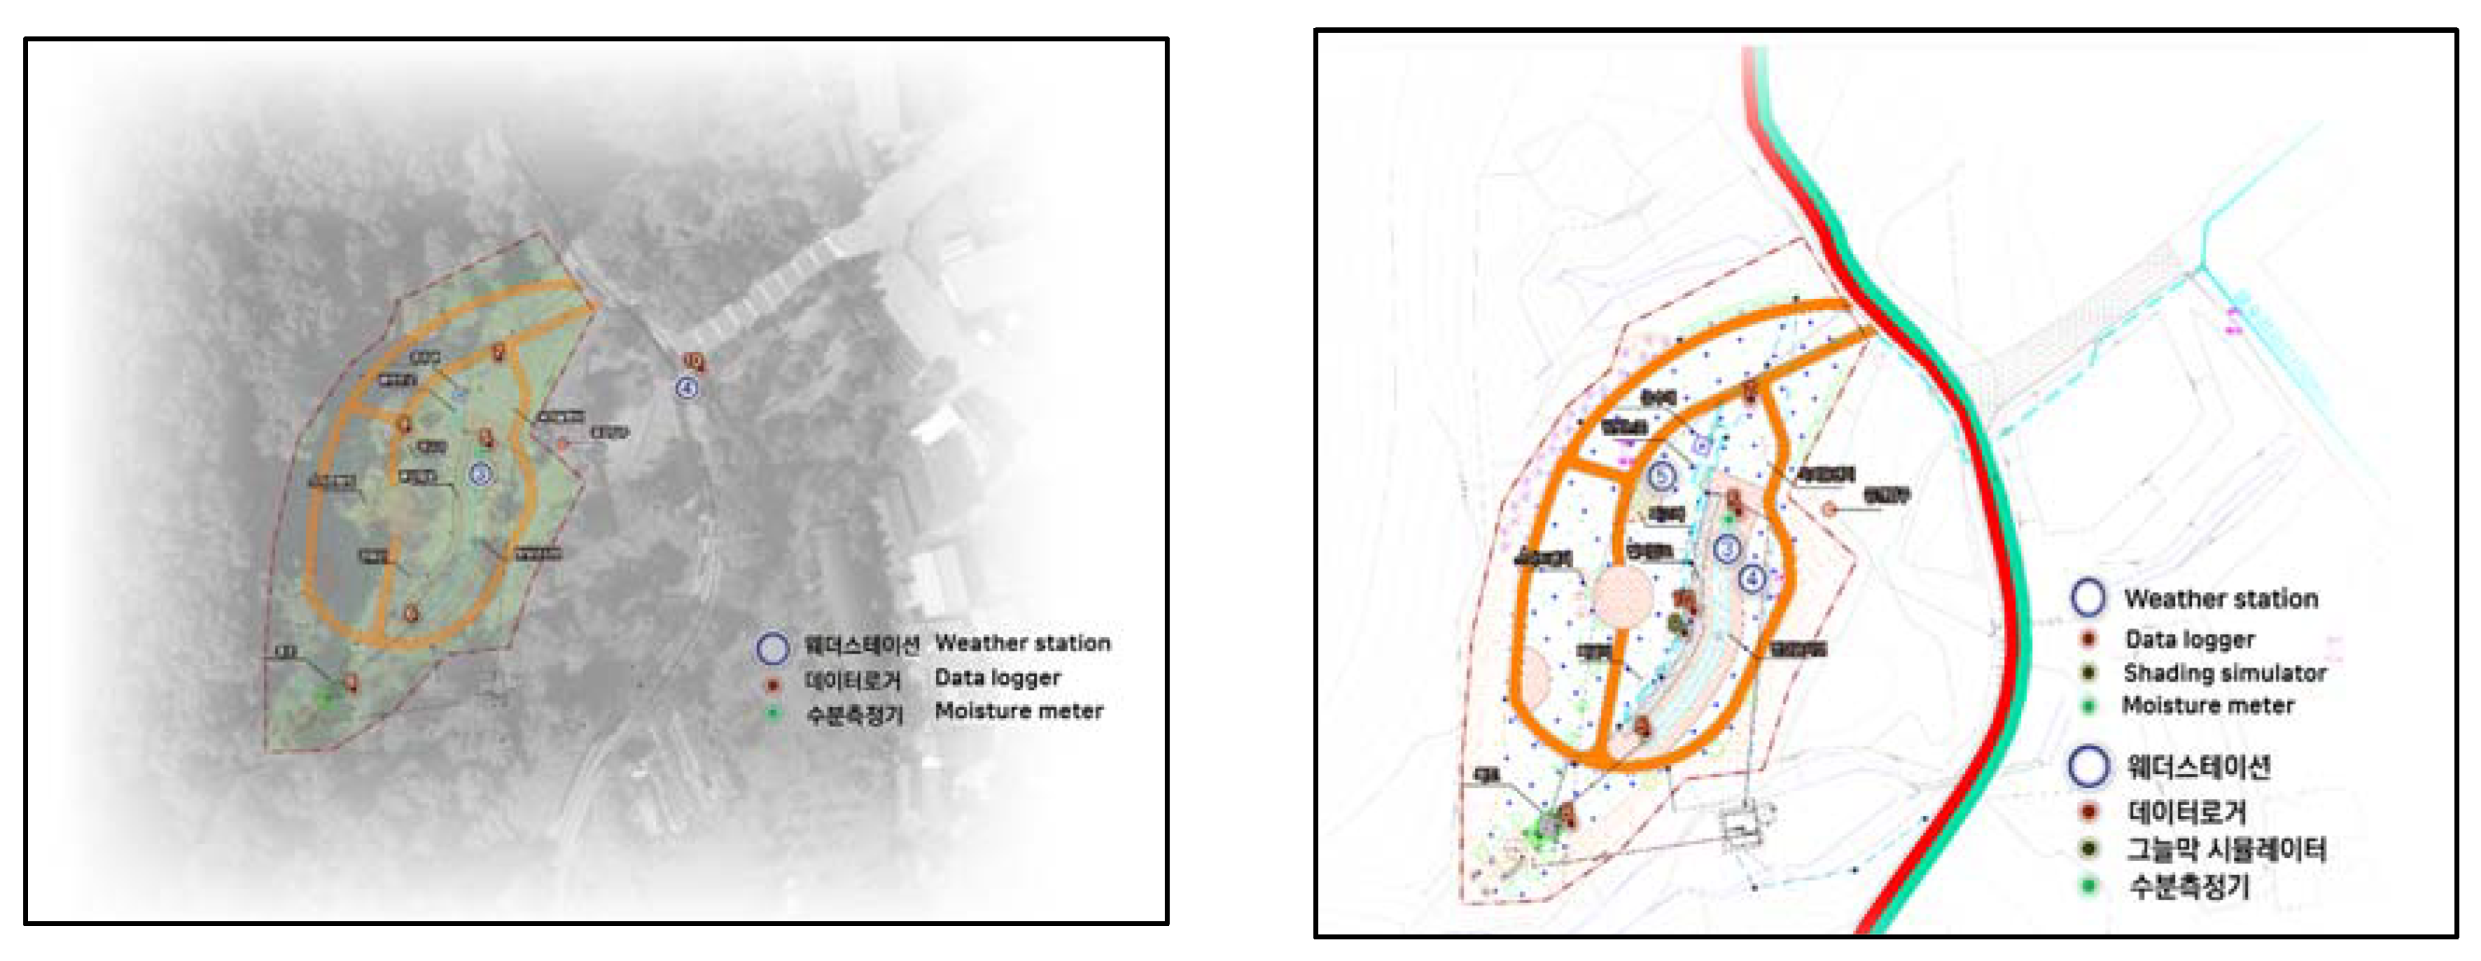
Figure 2.
(a) View of smart park from north; (b) View of smart park from south side(c) Park central zone; (d) Water Path; (e) Pergola(with cooling fog).
Figure 2.
(a) View of smart park from north; (b) View of smart park from south side(c) Park central zone; (d) Water Path; (e) Pergola(with cooling fog).
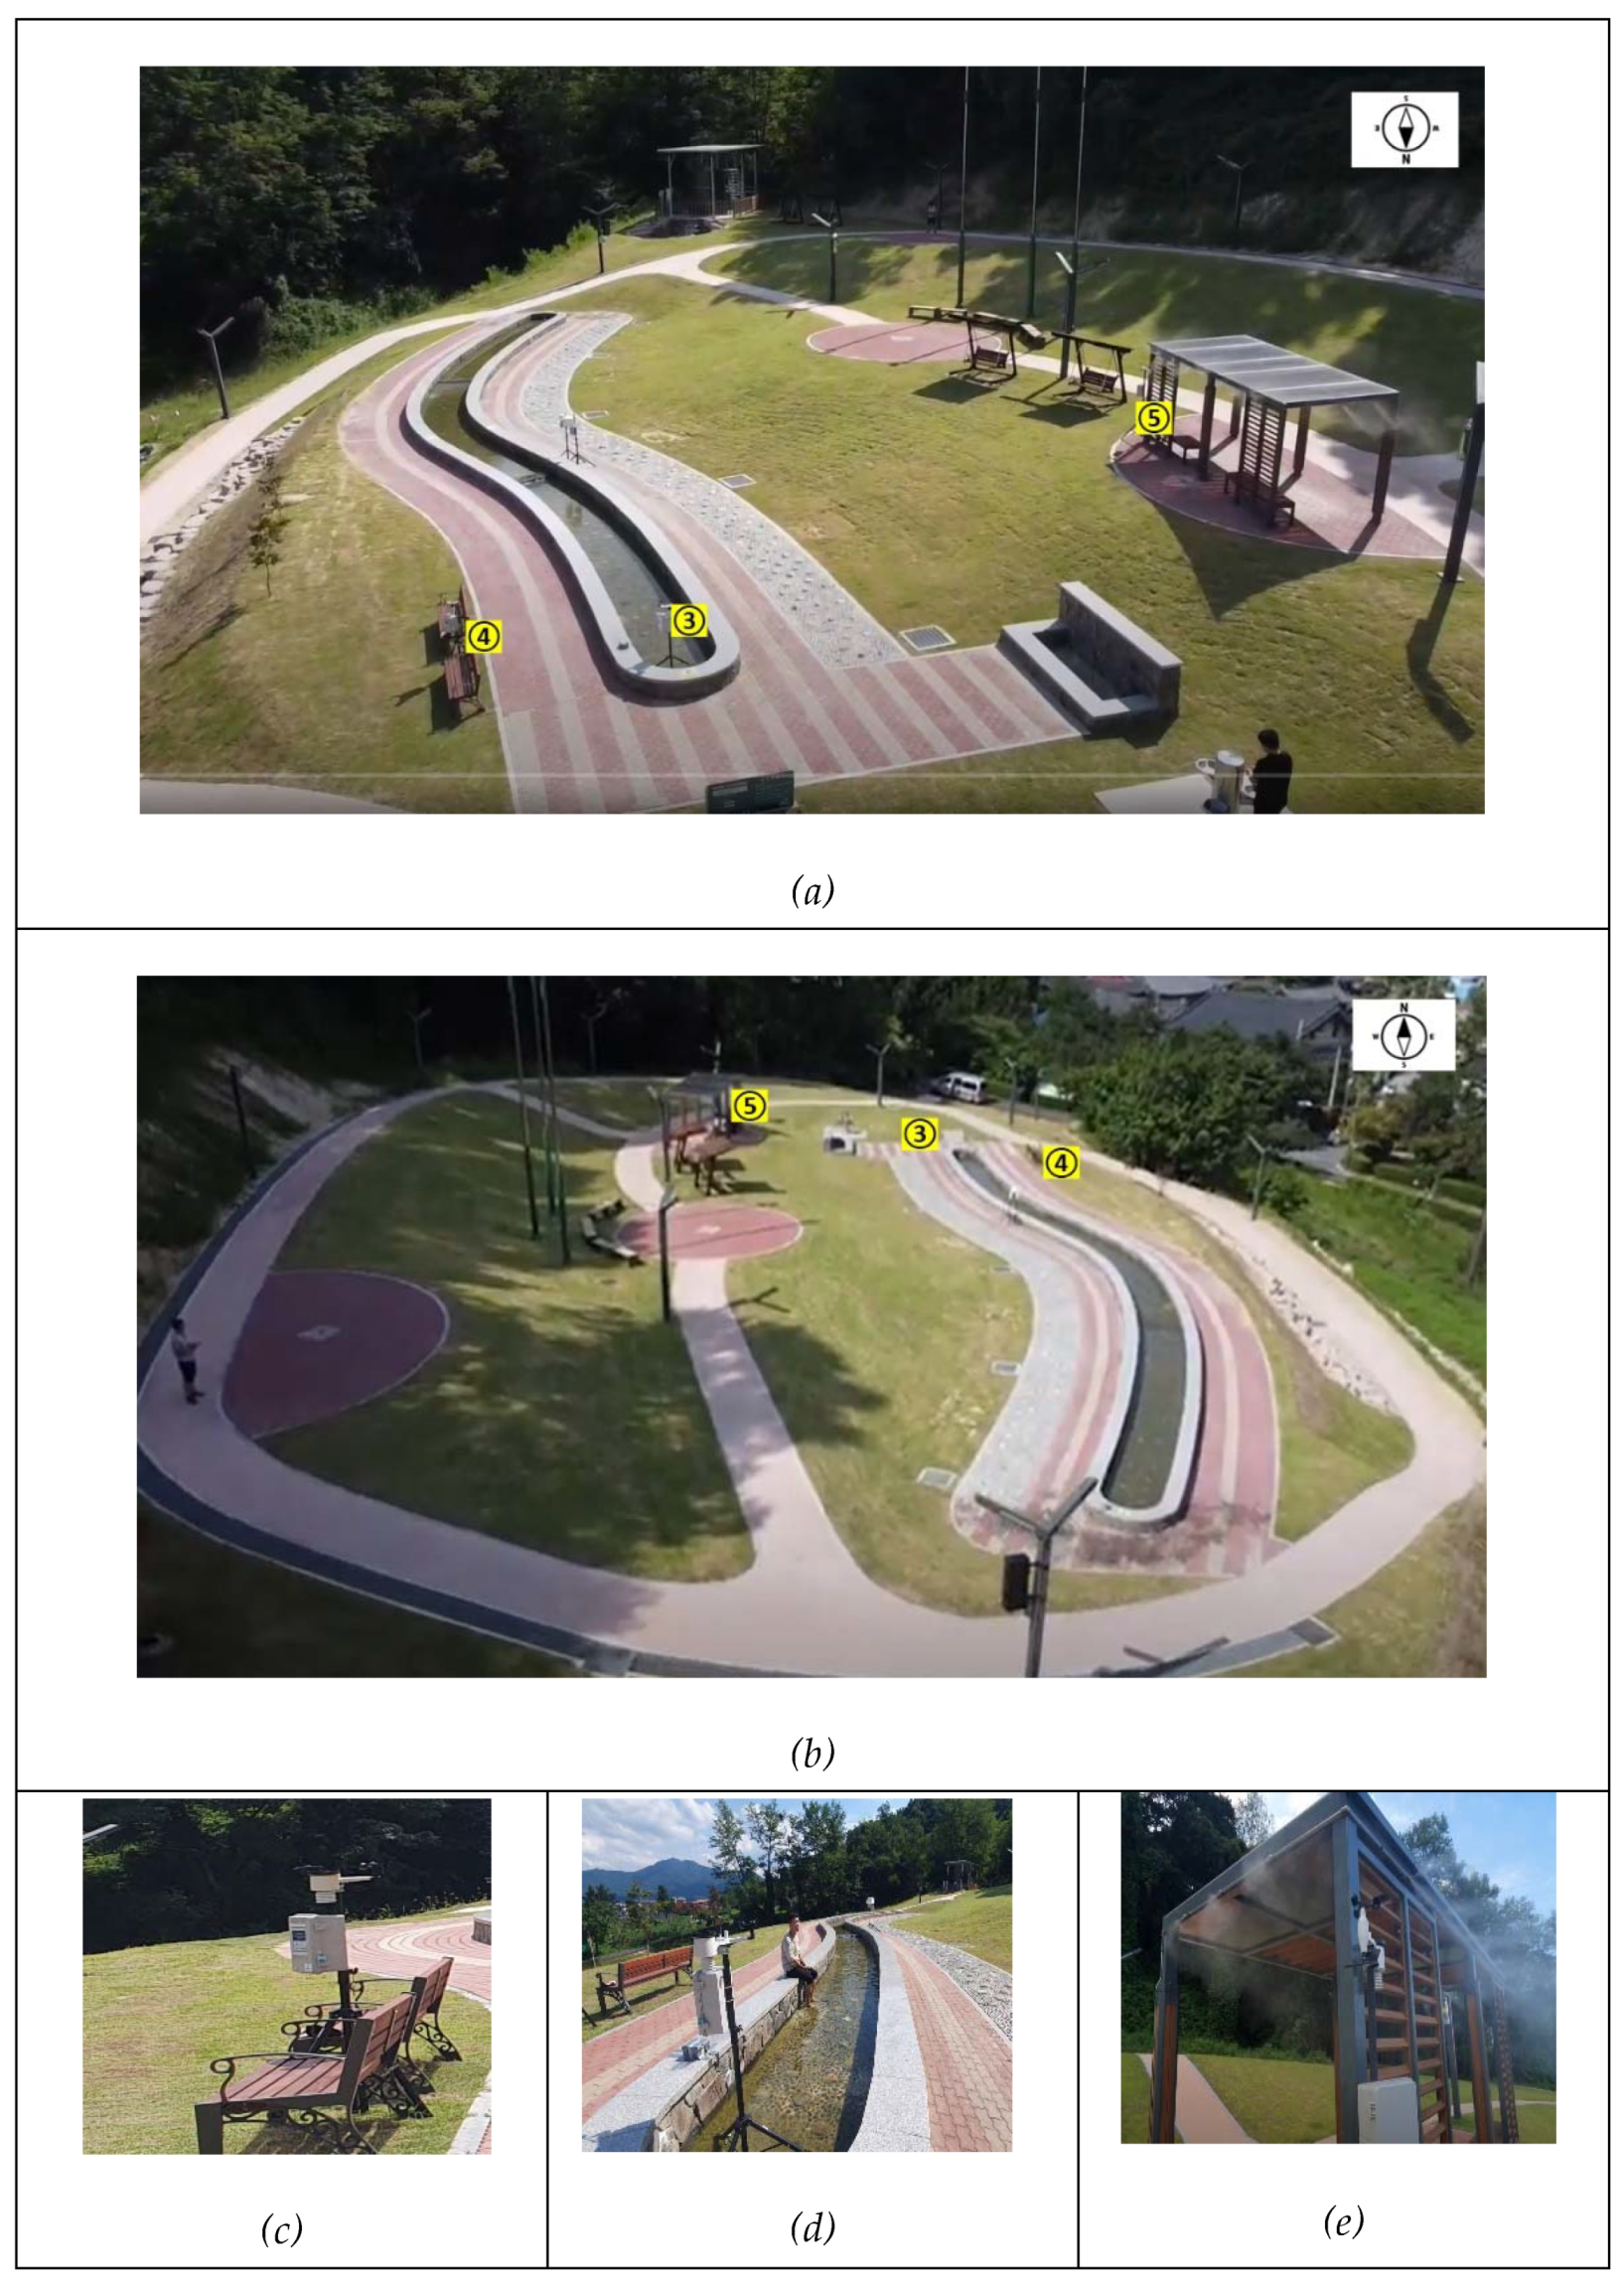
Figure 3.
(a) Park central zone; (b) Small water path; (c) Pergola; (d) Overlook of small waterpath
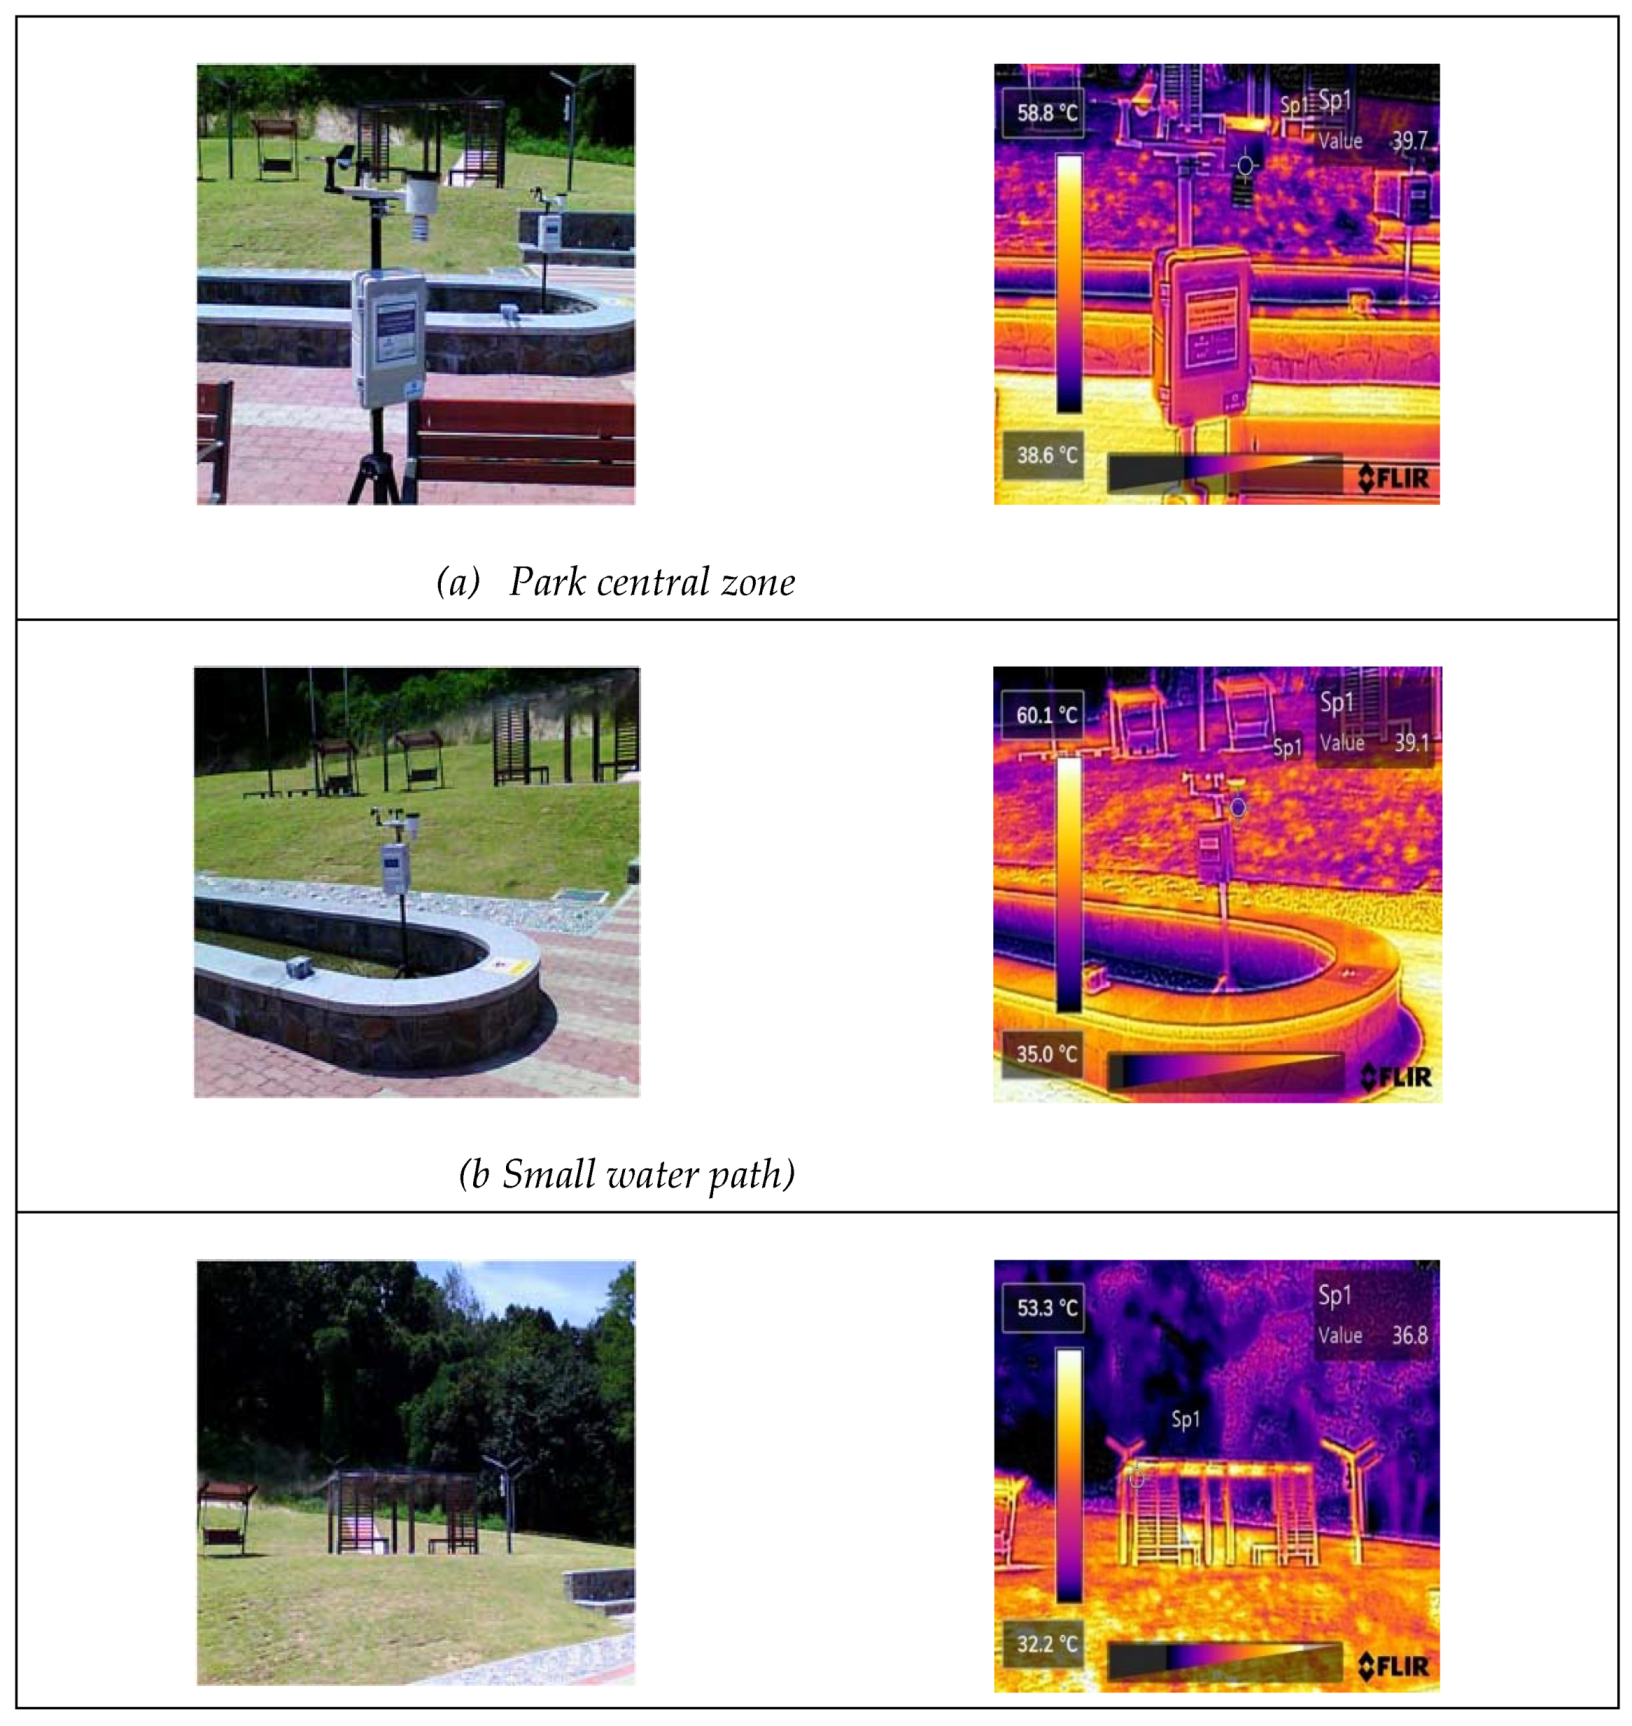
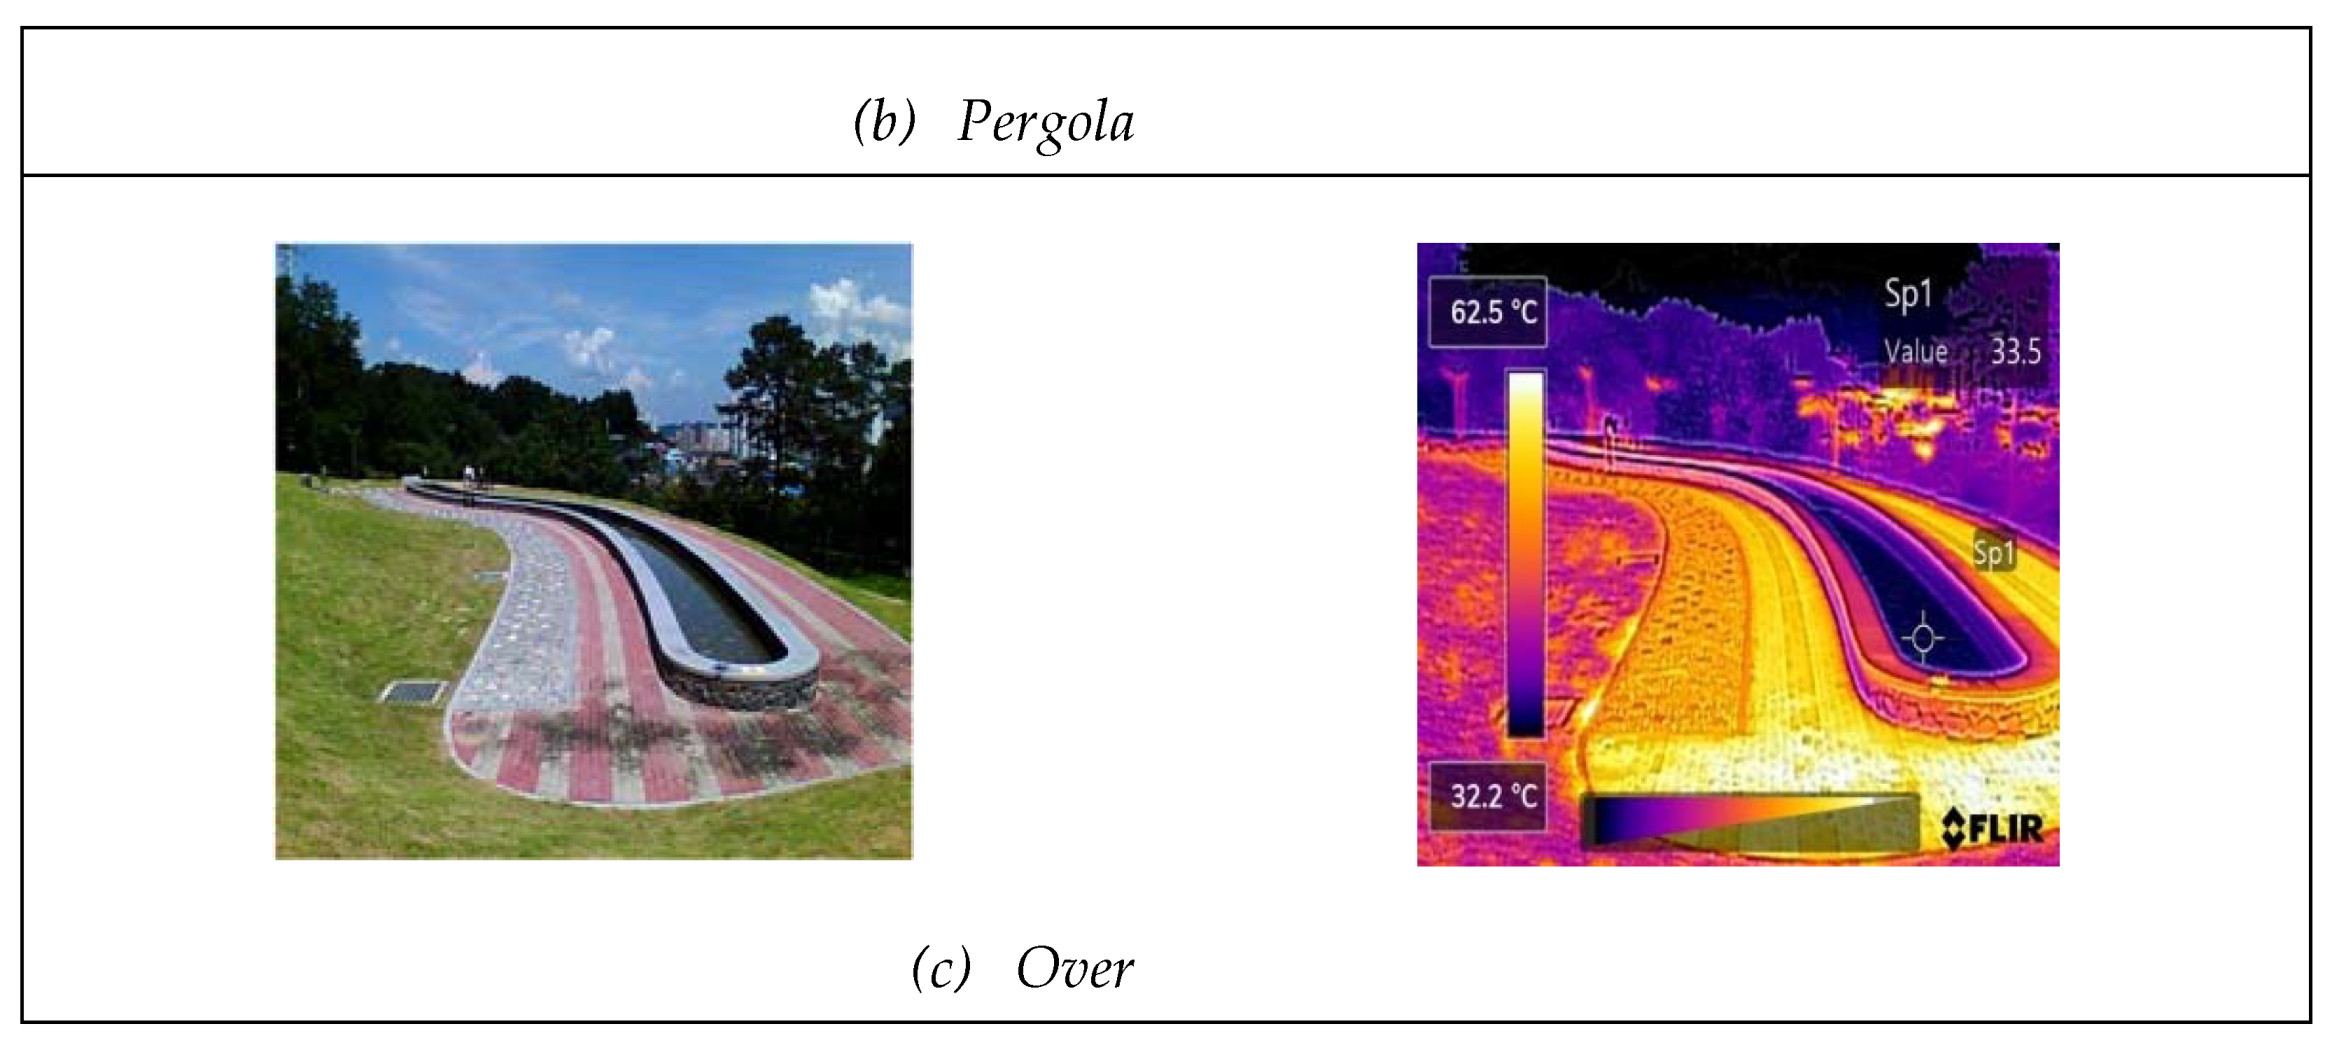
Figure 4.
(a) Comparison of hourly temperature measurements; (b) Comparison of hourly humidity measurements .
Figure 4.
(a) Comparison of hourly temperature measurements; (b) Comparison of hourly humidity measurements .
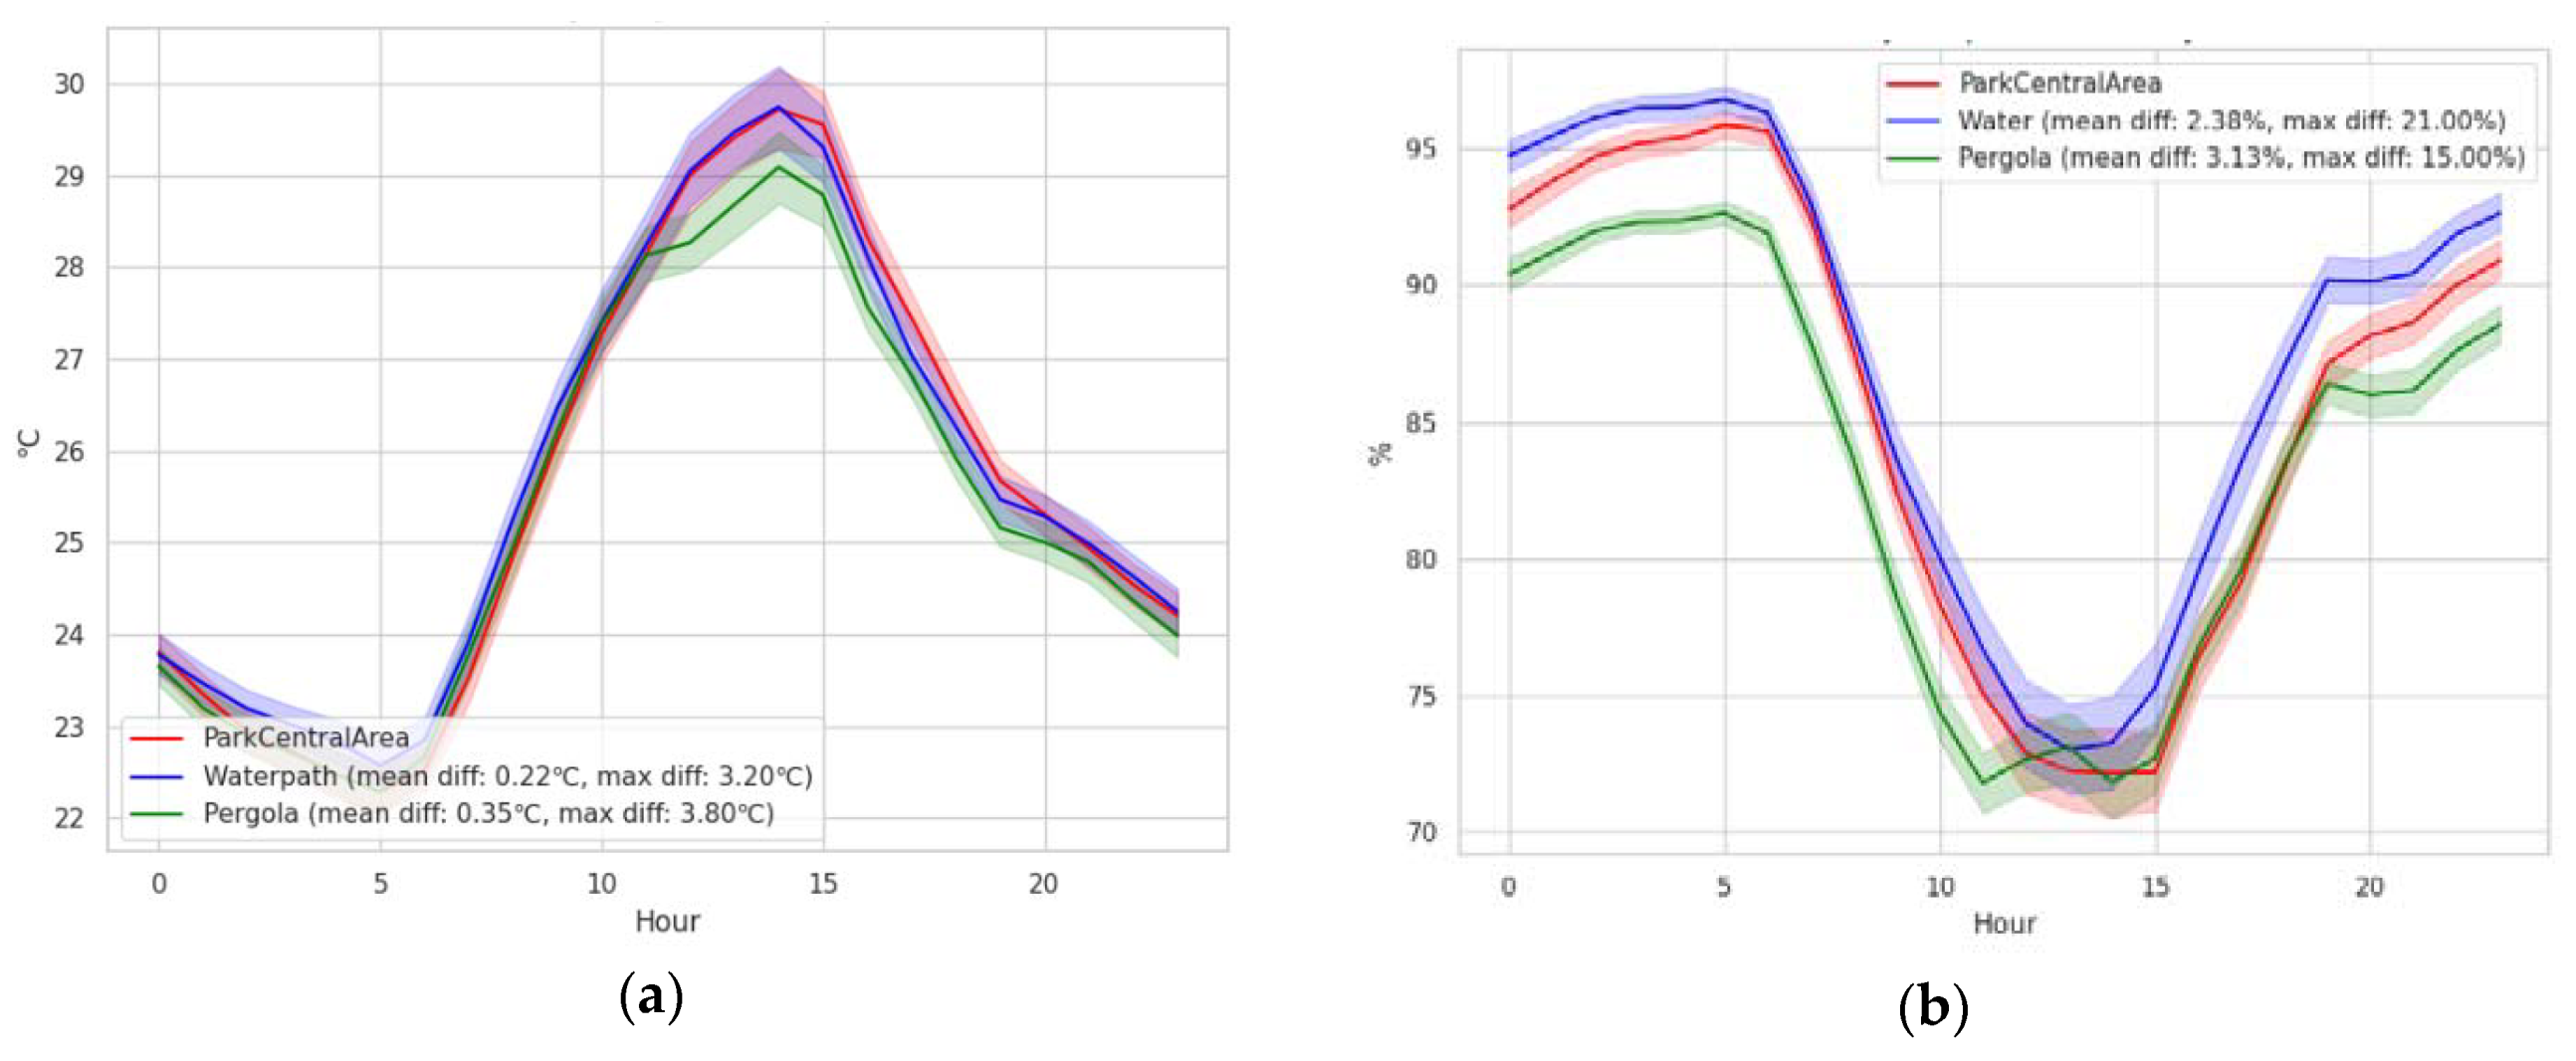
Figure 6.
Correlation between the number of observed people and measured climate data – (left) temperature, (middle) humidity, (right) solar and UVI.
Figure 6.
Correlation between the number of observed people and measured climate data – (left) temperature, (middle) humidity, (right) solar and UVI.

Table 1.
Detailed Monitoring Plan and Content (Weather Stations).
| Category | Detailed Plan and Content |
|---|---|
| Monitoring Target | Utilizing urban buffer green spaces and unused spaces |
| Data Collection Items | Measuring air quality, temperature, humidity, fine dust, wind speed, etc. |
| Monitoring System Configuration | Microclimate sensors, cloud servers, central monitoring system, etc. |
| Measurement Methods | Measurement tools: IoT sensors, on-site application, comparison at 5 m and 15 m distance |
| Measurement period: Approximately 28 days from July to August | |
| Measurement time: 24 hours | |
| Measurement interval (frequency): Checked every 5 minutes, etc. |
Table 2.
Detailed Monitoring Plan and Content (Thermal Imaging Camera).
| Category | Detailed Plan and Content |
|---|---|
| Monitoring Target | Users of the cooling water path facility |
| Data Collection Items | Changes in body heat and thermal sensation before and after use |
| Monitoring System Configuration | Monitoring the effects of reduced body heat and changes in thermal sensation using a thermal imaging camera |
| Measurement Methods | Measurement tools: Thermal imaging camera, comparison at 1–5 m distance from users |
| Measurement period: Based on the operation period of the water path rest area | |
| Measurement time: Noon to 3 PM, during user activity | |
| Measurement interval (frequency): 3-minute intervals, tracking for 15 minutes before and after use |
Table 3.
Spot Point Temp, Min Temp, Max Temp
| Section | Spot Point Temp (℃) |
Min. Temp (℃) | Max. Temp (℃) |
|---|---|---|---|
| Park central zone | 39.7 | 38.6 | 58.8 |
| Small water path | 39.1 | 35.0 | 60.1 |
| Pergola | 36.8 | 32.2 | 53.3 |
| Park with smallwater path | 33.5 | 32.2 | 62.5 |
Disclaimer/Publisher’s Note: The statements, opinions and data contained in all publications are solely those of the individual author(s) and contributor(s) and not of MDPI and/or the editor(s). MDPI and/or the editor(s) disclaim responsibility for any injury to people or property resulting from any ideas, methods, instructions or products referred to in the content. |
© 2024 by the authors. Licensee MDPI, Basel, Switzerland. This article is an open access article distributed under the terms and conditions of the Creative Commons Attribution (CC BY) license (https://creativecommons.org/licenses/by/4.0/).
Copyright: This open access article is published under a Creative Commons CC BY 4.0 license, which permit the free download, distribution, and reuse, provided that the author and preprint are cited in any reuse.


