
Submitted:
15 October 2024
Posted:
15 October 2024
You are already at the latest version
Abstract
Urban heat islands (UHI), exacerbated by climate change, significantly increase heat stress, particularly affecting vulnerable populations such as the elderly and children. This study evaluates the effectiveness of various urban heat mitigation technologies, including cooling fog systems, cool roofs (reflective paint), shading structures, and small water paths, in reducing temperatures and enhancing thermal comfort. Field tests were conducted from 2021 to 2023 across Gimhae-si, Yechun-gun, Geyang-gu, and Sangju-si, with support from the Korean Ministry of Environment. Results demonstrated that cooling fog systems provided immediate temperature reductions, lowering ambient temperatures by up to 3.1°C, while cool roofs reduced surface temperatures by 2-3°C. Shading structures reduced surface temperatures by up to 10°C, and small water paths cooled air temperatures by up to 1.5°C, also increasing humidity and improving thermal comfort. The findings suggest that a combination of these technologies can effectively mitigate urban heat stress, especially in areas with vulnerable populations.
Keywords:
Urban Heat Island (UHI)
; Climate Change Adaptation
; Cooling Technologies
; Vulnerable Populations
; Thermal Comfort
; Passive Cooling Solutions.
1. Introduction
1.1. Background and Problem Statement
The urban heat island (UHI) effect and climate change pose significant challenges to modern cities worldwide, leading to increased thermal stress, particularly during heat waves[1,2]. The UHI effect results from the replacement of natural landscapes with heat-absorbing surfaces such as buildings, roads, and other urban infrastructure[2,3]. As these surfaces absorb and re-emit solar radiation, urban areas become significantly warmer than their rural surroundings[4], particularly during the summer months. This temperature differential not only intensifies energy consumption but also exacerbates health risks, particularly for urban populations[5,6,7].
The combined impact of the UHI effect and climate change is most pronounced during heatwaves, which have become more frequent and severe owing to rising global temperatures[7]. Vulnerable populations, such as the elderly, children, and those with preexisting health conditions, are disproportionately affected by these extreme temperatures[9,10], underscoring the urgency for effective heat mitigation strategies to safeguard public health in urban environments[11,12].
In response to these challenges, the Korean Ministry of Environment initiated a comprehensive project between 2021 and 2023 to test and implement various urban heat-mitigation technologies[13,14]. The project focused on protecting vulnerable populations from the adverse effects of climate change and extreme heat. Field tests were conducted in cities such as Yechun-gun, Sangju-si, Geyang-gu, and Gimhae-si, where technologies like cooling fog systems, cool roofs, shading structures, and the small water path were deployed to reduce urban temperatures and improve thermal comfort in public spaces.
For this study, IoT-based environmental sensors were deployed to track temperature, humidity, wind speed, and solar radiation in real-time. These data were automatically uploaded to a cloud server every five minutes, using devices such as the Ecowitt GW1101 Wi-Fi Weather Station with WS69 (7-in-1 Outdoor Sensor Array) and T&D TR-71wf Data Logger temperature sensors. These sensors were calibrated before installation, with performance specifications provided in Table 1. The sensors appear sufficient for the purposes of the study, especially considering the accuracy and resolution provided. They are capable of capturing the necessary environmental changes in temperature, humidity, wind speed, and solar radiation, which are essential for evaluating urban cooling technologies. The sensors provide reliable data to monitor and analyze the effectiveness of cooling fog systems, shading structures, cool roofs, and small water paths in mitigating urban heat.
These sensors provided reliable data to monitor and analyze the effectiveness of technologies such as cooling fog systems, cool roofs, shading structures, and small water paths in mitigating urban heat.
1.2. Urban Heat Mitigation Technologies
Several technologies have been developed to address the UHI effect and enhance thermal comfort in urban areas[15,16,17]. These include both active and passive cooling solutions, targeting different aspects of urban heat stress[18,19].
- Small Water Paths: These passive cooling solutions use water channels in urban parks and public spaces to cool surrounding air through evaporative effects.
While these technologies show promise individually, there is limited research on their combined effects in real-world urban environments. This study addresses this gap by evaluating the synergistic effectiveness of these technologies in various settings.
1.3. Research Objectives
The primary aim of this study is to assess the effectiveness of four urban heat mitigation technologies—cooling fog systems, cool roofs, shading structures, and small water paths—in reducing temperatures and improving thermal comfort, with a particular focus on vulnerable populations. Specifically, the study seeks to:
- Evaluate the temperature reduction capabilities of each technology in urban settings.
- Compare the effectiveness of active cooling technologies (cooling fog) with that of passive solutions (cool roofs, shading structures, and small water paths).
- Provide actionable insights for urban planners and policymakers on the deployment of these technologies to protect vulnerable populations from extreme heat.
1.4. Significance of the Study
This study provides valuable empirical data from real-world experiments, offering insights into the performance of heat-mitigation technologies under urban conditions. Its significance lies in several areas. It emphasizes the protection of vulnerable populations, such as the elderly, children, and low-income communities, who are most at risk during extreme heat events. The findings can inform urban planning and policy initiatives aimed at reducing heat stress, ensuring that at-risk populations are protected from the impacts of climate change. By sharing the results of these experiments, this study provides a blueprint for other cities looking to implement heat mitigation strategies cost-effectively.
2. Theoretical Framework
2.1. Urban Heat Island (UHI) Effect and Climate Change
The urban heat island (UHI) effect and climate change have become critical challenges in modern urban environments. The UHI effect refers to the temperature differential between urban areas and their rural surroundings caused by factors such as energy consumption, industrial activities, and infrastructure that absorb and re-emit solar radiation. This phenomenon contributes to increased energy consumption and worsens the health conditions of city dwellers, particularly during summer heat waves.
2.2. Urban Heat Island Effect
The UHI effect is characterized by urban regions maintaining higher temperatures than rural areas, primarily owing to buildings and paved surfaces absorbing and radiating heat. This effect intensifies during heatwaves, significantly increasing urban temperatures and imposing increased heat stress on city inhabitants. This, in turn, leads to higher energy consumption for cooling, elevated costs, and increased greenhouse gas emissions, further intensifying the effects of climate change.
2.3. Climate Change and Heat Stress
Climate change is driving global temperature increases, with an increase in the frequency and intensity of summer heatwaves. Combined with the UHI effect, this amplifies heat stress in urban areas. Heat stress can overwhelm the body's ability to regulate temperature, posing serious health risks, especially in vulnerable populations such as the elderly, children, and individuals with pre-existing conditions. As a result, cities must adopt effective technological solutions to mitigate heat stress and protect at-risk groups.
2.4. Principles and Effects of Urban Heat Mitigation Technologies
In response to UHI and climate change, various heat mitigation technologies have been developed and implemented. The primary technologies examined in this study include:
- Cooling Fog Systems: This technology disperses fine water droplets into the air, which cools the surrounding environment as they evaporate. Cooling fog is particularly effective in public spaces, offering immediate temperature reduction in high-traffic outdoor areas.
- Shading Structures: Shading structures block direct sunlight and reduce the temperature in the shaded areas. These structures are commonly installed in parks, playgrounds, bus stops, and other public spaces to reduce the heat stress. Studies have shown that shading can significantly lower the ambient air temperature and perceived discomfort.
- Cool Roofs (Reflective Paint): Reflective coatings applied to building exteriors reflect solar radiation, reducing surface and indoor temperatures. This technology is especially effective in lowering the energy demand for cooling during summer and mitigating UHI effects.
- Small water paths: These small artificial water channels help to absorb and dissipate heat from the surrounding environment. They provide cooling in urban parks and public spaces and offer psychological benefits by creating tranquil, pleasant environments for rest and relaxation.
The extensive field tests conducted with the support of the Korean Ministry of Environment in cities such as Yechun-gun, Sangju-si, Geyang-gu, and Gimhae-si offer valuable insights into the practical implementation of these technologies in real-world settings.
2.5. Review of Previous Studies
Several studies have evaluated individual heat-mitigation technologies, but few have explored the combined effects of multiple technologies in urban environments. This study addresses this gap by examining the synergistic effects of cooling fog, shading structures, cool roofs, and waterway shelters in mitigating urban heat stress.
- Shading Structures: Shading structures are well known for their ability to reduce solar exposure, but there is relatively little research quantifying their specific temperature reduction effects. Studies suggest that the material and design of the shading structure significantly impact its effectiveness. For instance, natural tree shade can reduce surrounding air temperatures by up to 5°C, while artificial shading structures demonstrate similar temperature reductions. [27,28].
- Cool Roofs: Cool roofs have been extensively studied and are shown to reduce surface temperatures by up to 15°C by reflecting solar radiation, which significantly lowers the amount of heat absorbed by the building. This reduction in surface temperature leads to a decrease in energy demand for cooling, particularly during summer months[26,29].
- Cooling Fog: Cooling fog systems are effective in lowering ambient temperatures, particularly during heatwaves, with reductions of 4°C to 6°C reported in various studies. However, here are concerns regarding water consumption, prompting further research into optimizing these systems to balance cooling efficiency with resource conservation[30,31].
- Waterway Shelters: Water features such as small water paths consistently reduce both surface and air temperatures by 2°C to 4°C through evaporative cooling. These features are particularly effective in parks and outdoor spaces, providing not only passive cooling but also aesthetic and psychological benefits. However, challenges such as maintenance and ensuring that the system operates effectively under all conditions have been noted[32,33].
The studies reviewed underscore the positive impacts of various heat mitigation strategies in urban environments. Notably, cool roofs and cooling fog systems show immediate and effective temperature reductions, while shading structures and water features provide long-term, passive cooling. This study will build on these findings by evaluating the combined effect of these technologies in mitigating heat stress in urban environments.
2.6. Significance of the Study
This study provides a comprehensive evaluation of urban heat mitigation technologies, focusing on their real-world applicability and potential to reduce heat stress in urban environments. The key contributions of this study are as follows.
- Integrated Approach: Unlike previous research that focused on individual technologies, this study evaluated multiple technologies in combination, providing a holistic analysis of their collective impact on urban heat mitigation.
- Field-tested Validation: The field tests conducted in collaboration with the Korean Ministry of Environment over multiple years (2021–2023) offer valuable practical data. This data demonstrates how these technologies perform in real-world urban settings, offering insights that can inform future urban planning and policy efforts.
- Policy Implications: The findings from this study provide actionable insights for local governments in Korea and globally, particularly those aiming to implement heat mitigation strategies to protect vulnerable populations. This study sets a benchmark for other local governments and provides a reference for large-scale heat-mitigation initiatives that require significant investment, energy, and time.
3. Methodology
3.1. Overview of Technologies Evaluated
This study evaluated the cooling effects of several urban heat mitigation technologies, including cooling fog, cool roofs (reflective paint), shading structures, and small water path. This research focuses on their effectiveness in improving thermal comfort, particularly for vulnerable populations exposed to extreme heat. These field tests were supported by the Korean Ministry of Environment between 2021 and 2023 as part of broader efforts to mitigate the impacts of climate change and heatwaves on urban communities.
Data collection was conducted using IoT-based environmental sensors and data loggers at various sites, through extensive monitoring in locations such as Yechun-gun, Sangju-si, Geyang-gu, and Gimhae-si where these heat mitigation systems were implemented.
3.2. Experimental Setup
3.2.1. Cool Roof (Reflective Paint) Experimentation
Objective: To evaluate the cooling performance of reflective coatings (cool roofs) applied to building surfaces and assess their impact on the surface and ambient temperatures.
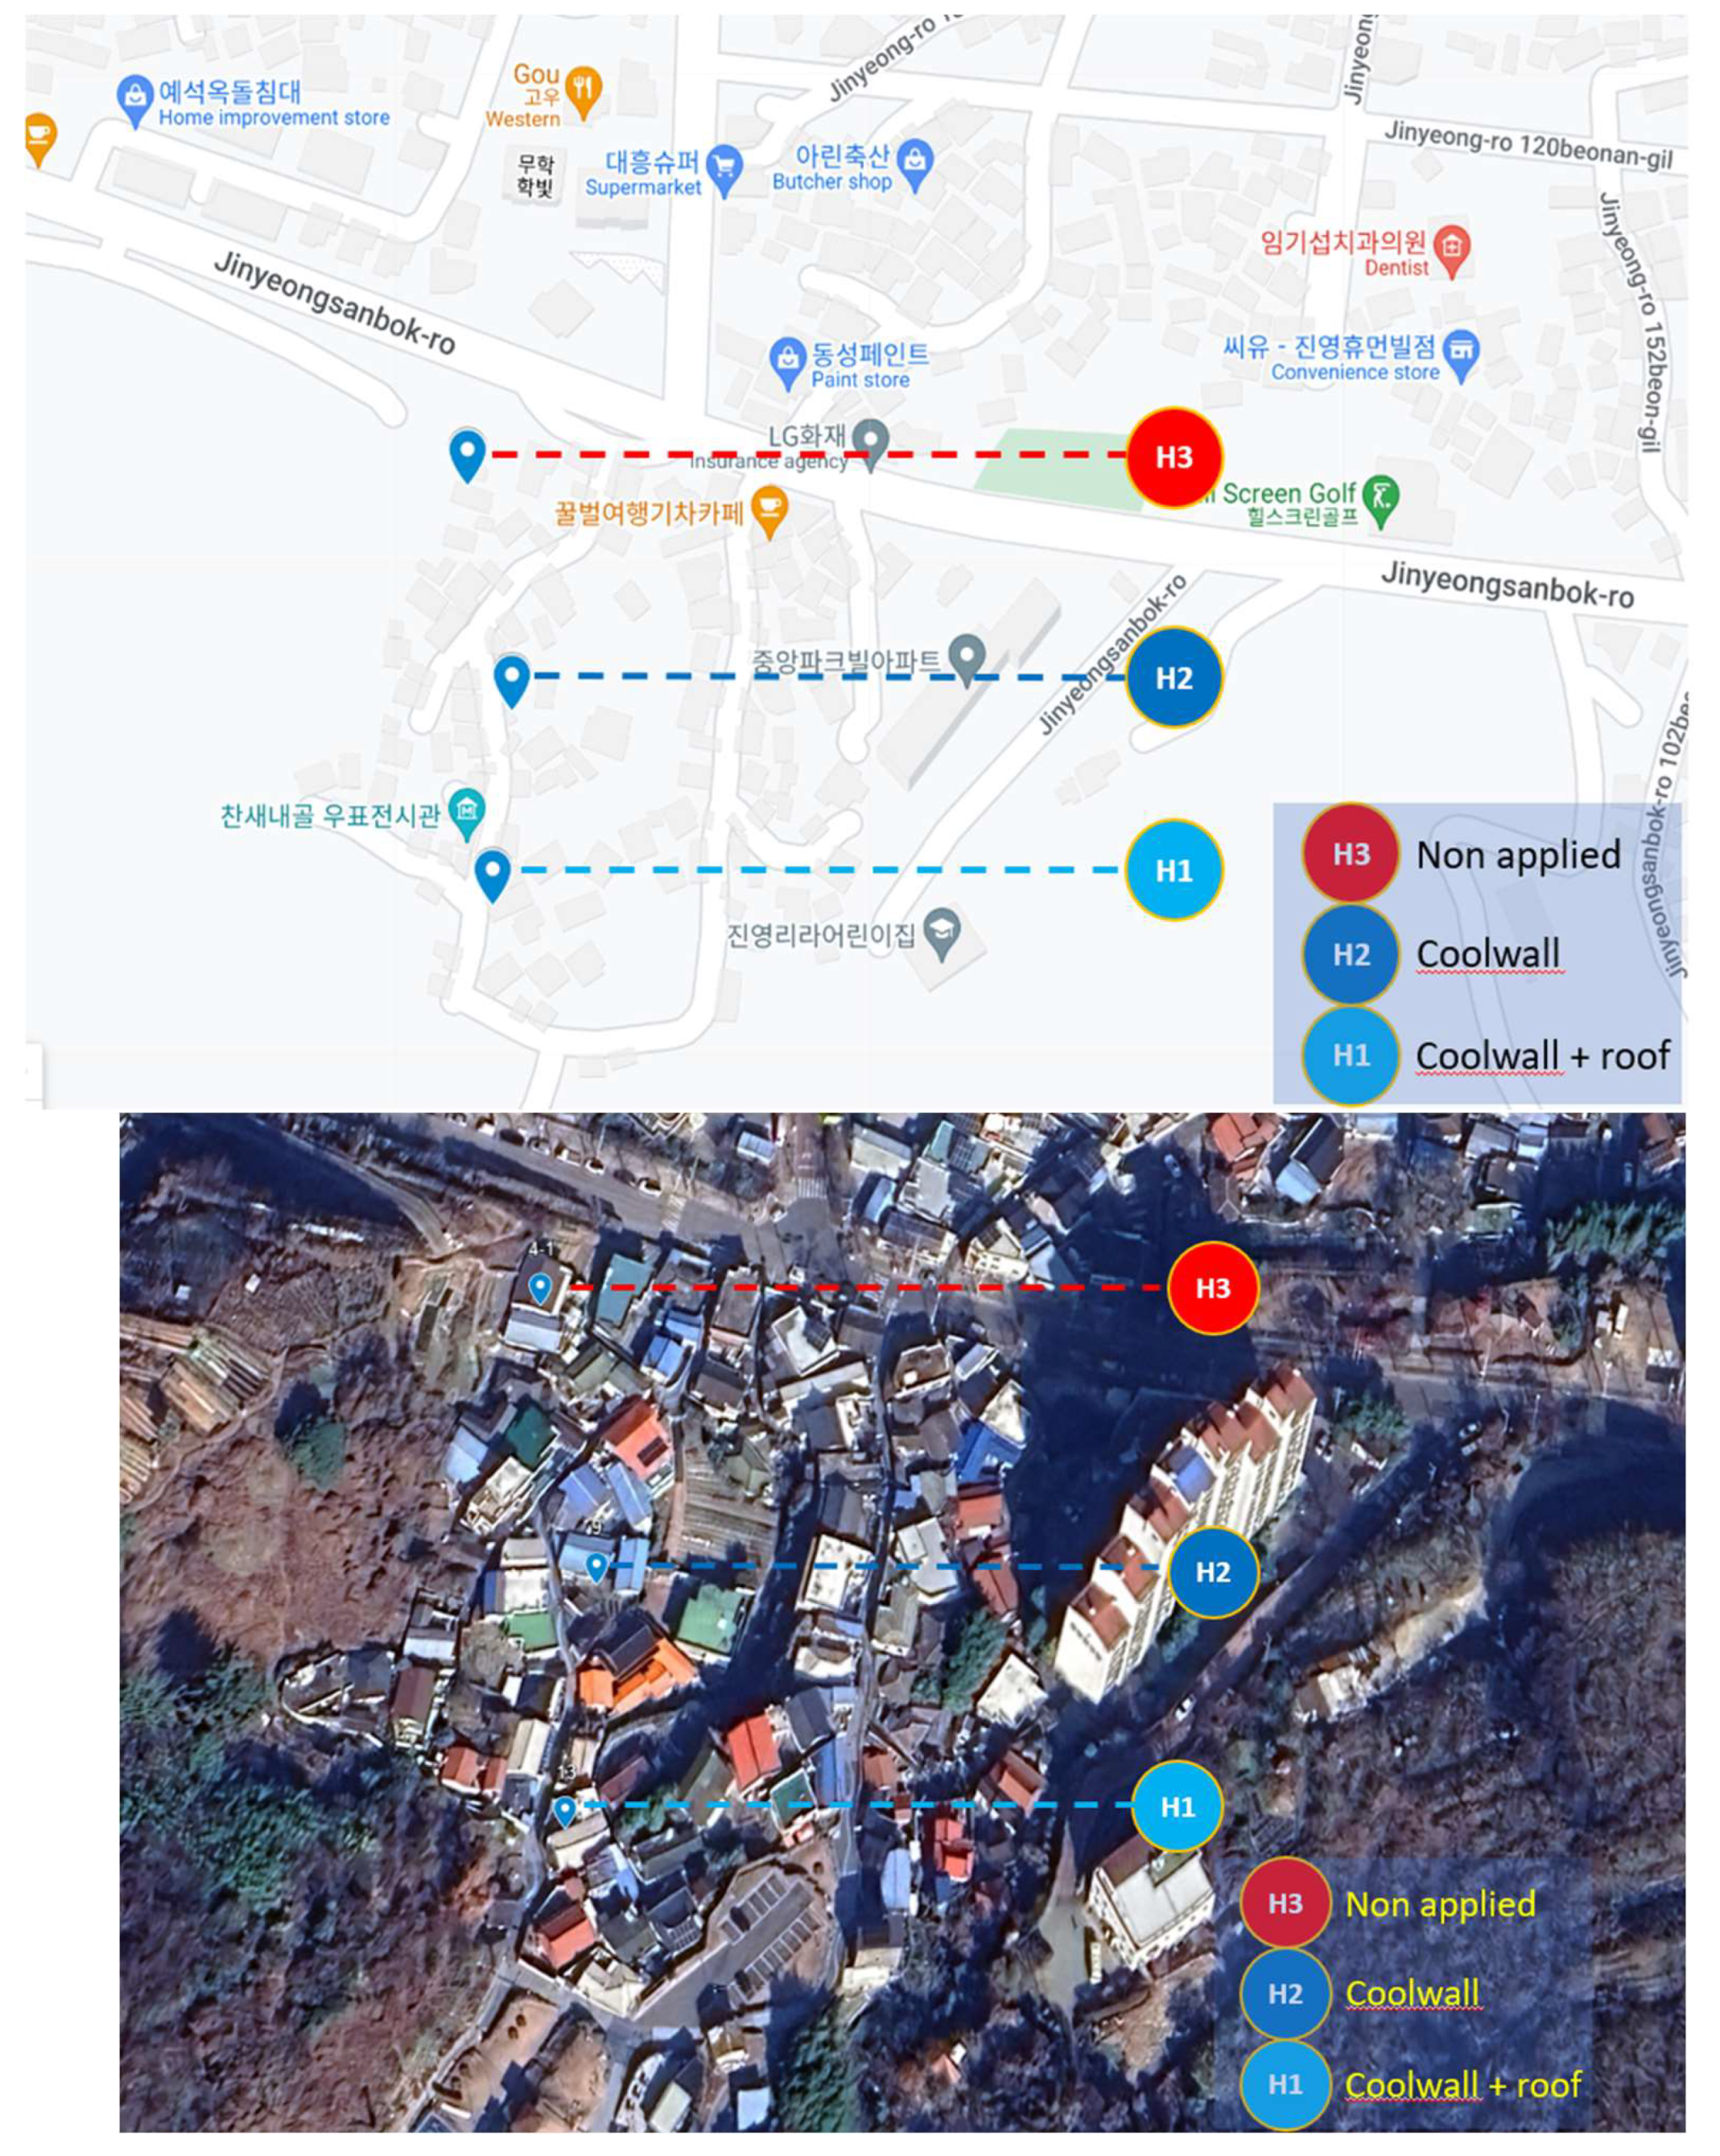
Study Location: Reflective paint was applied to the rooftops and external walls of buildings in selected test sites located in Jinyeong-eup, Gimhae-si. This region is located in the southeastern part of South Korea, in close proximity to urbanized industrial centers such as Busan and Changwon. The region experiences a humid subtropical climate (Cfa), characterized by hot, humid summers and relatively mild winters. Due to its inland location and urban development, the area faces significant heat stress during the summer months, exacerbating the urban heat island (UHI) effect.
Furthermore, the region is particularly vulnerable to the effects of climate change, as increasing global temperatures have led to more frequent and intense heatwaves, contributing to higher energy demands for cooling, as well as exacerbating public health risks, especially for vulnerable populations. The increasing frequency of extreme weather events, including typhoons and heavy rainfall, also compounds the region’s climate vulnerability. These factors make Gimhae-si, and specifically Jinyeong-eup, an ideal location to test the effectiveness of cool roof technology as a potential adaptation strategy for mitigating heat stress and improving urban resilience[34,35].
Experimental Design:
Three test sites were selected for comparison.
- ■
- H1: Cool roof and cool wall applied.
- ■
- H2: Cool wall only.
- ■
- H3: Control site (non-applied).
Monitoring Equipment: IoT-based temperature and humidity sensors were installed to continuously monitor changes in the temperature and humidity levels before and after the application of reflective coatings.
Data Collected:
- ■
- Surface temperatures of rooftops and walls, indoor temperatures, and ambient air temperatures above 1.5M from the surface were measured using T&D TR-71wf Data logger temperature sensors from August 27 to September 1, 2021.
Figure 1.
Site Map of Jinyeong-eup, Gimhae-si showing cool wall and roof applications (Source: Google Maps). H1 Representing the Coolwall+roof , H2 Representing the Coolwall and H3 Representing the Non applied site.
Figure 1.
Site Map of Jinyeong-eup, Gimhae-si showing cool wall and roof applications (Source: Google Maps). H1 Representing the Coolwall+roof , H2 Representing the Coolwall and H3 Representing the Non applied site.
3.2.2. Cooling Fog Experimentation in Yechun-gun
- Objective: To assess the cooling effects of a cooling fog system installed in a public outdoor space specifically designed to improve thermal comfort for vulnerable populations and high-traffic areas such as playgrounds.
-
Study Location: A cooling fog system was deployed at a children's playground in Yechun-gun (also spelled Yecheon-gun), located in the northern part of Gyeongsangbuk-do province, South Korea. This region experiences a temperate climate with four distinct seasons (Dwa, according to the Köppen climate classification), with hot, humid summers and cold winters.In recent years, climate change has contributed to a noticeable rise in the frequency and intensity of heatwaves in this region, especially during the summer months, making the area increasingly susceptible to heat-related risks. Yechun-gun is primarily a rural area with a significant aging population, which adds to the vulnerability of the region in terms of climate change adaptation. Elderly residents are particularly at risk from extreme heat, as they are more sensitive to heat stress. The rise in temperatures due to climate change has increased energy demand, particularly for cooling, and has also heightened health risks for both elderly populations and children. These conditions make Yechun-gun a strategic location to deploy cooling technologies such as cooling fog systems, which are designed to mitigate heat stress in public spaces, especially during peak summer months. The implementation of cooling fog systems is particularly crucial in regions like Yechun-gun, where local populations are heavily reliant on outdoor public spaces for daily activities, and where public health infrastructures may not be as readily equipped to handle the intensifying climate conditions[35,36,37].

Table 2.
Field Test Sites, Sections, Addresses, and Applications for Coolwall and Coolroof in Jinyeong-eup, Gimhae-si.
Table 2.
Field Test Sites, Sections, Addresses, and Applications for Coolwall and Coolroof in Jinyeong-eup, Gimhae-si.
| Section | Site | Address | Application |
|---|---|---|---|
| H1 | 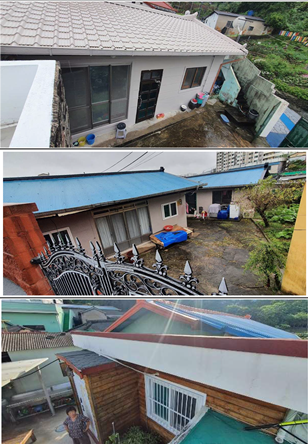 |
13, Jinyeongsanbok-ro 72beon-gil, Jinyeong-eup, Gimhae-si, Gyeongsangnam-do, South Korea | Coolwall+roof |
| H2 | 9, Jinyeongsanbok-ro 72beon-gil, Jinyeong-eup, Gimhae-si, Gyeongsangnam-do, South Korea | Coolwall | |
| H3 | 4-1, Jinyeongsanbok-ro 72beon-gil, Jinyeong-eup, Gimhae-si, Gyeongsangnam-do, South Korea | Non applied |
- •
- Experimental Design:
Fog System Setup: Fog nozzles were installed at heights between 3 and 4 m, and the system was operated during the hottest hours of the day (12:00–16:00). A nearby control area without cooling fog was used for comparison.
- ■
-
Monitoring Equipment: IoT temperature sensors were placed at different distances from the fog system and sunny zone 9m to measure the cooling effect.
- ■
- Ecowitt WS69 IoT-based temperature sensors were installed around the cooling fog zone (W1) and a sunny control zone (W2).
- ■
- Data Collected:
Ambient air temperature (measured before and after fogging)
Humidity levels around the system
- ■
- Measurement Period: The IoT sensors monitored temperature and humidity levels from September 13, 2021, focusing on peak afternoon hours.
Table 3.
Temperature Measurement Sensor Installation.
| Section | Rooftop | Indoor | Application |
|---|---|---|---|
| H1 |  |
 |
Coolwall+roof |
| H2 | Coolwall | ||
| H3 | Non applied |
Figure 2.
Site Map of Yechun-gun showing cooling fog and sunny zone for the comparison testing (Source: Google Maps).
Figure 2.
Site Map of Yechun-gun showing cooling fog and sunny zone for the comparison testing (Source: Google Maps).
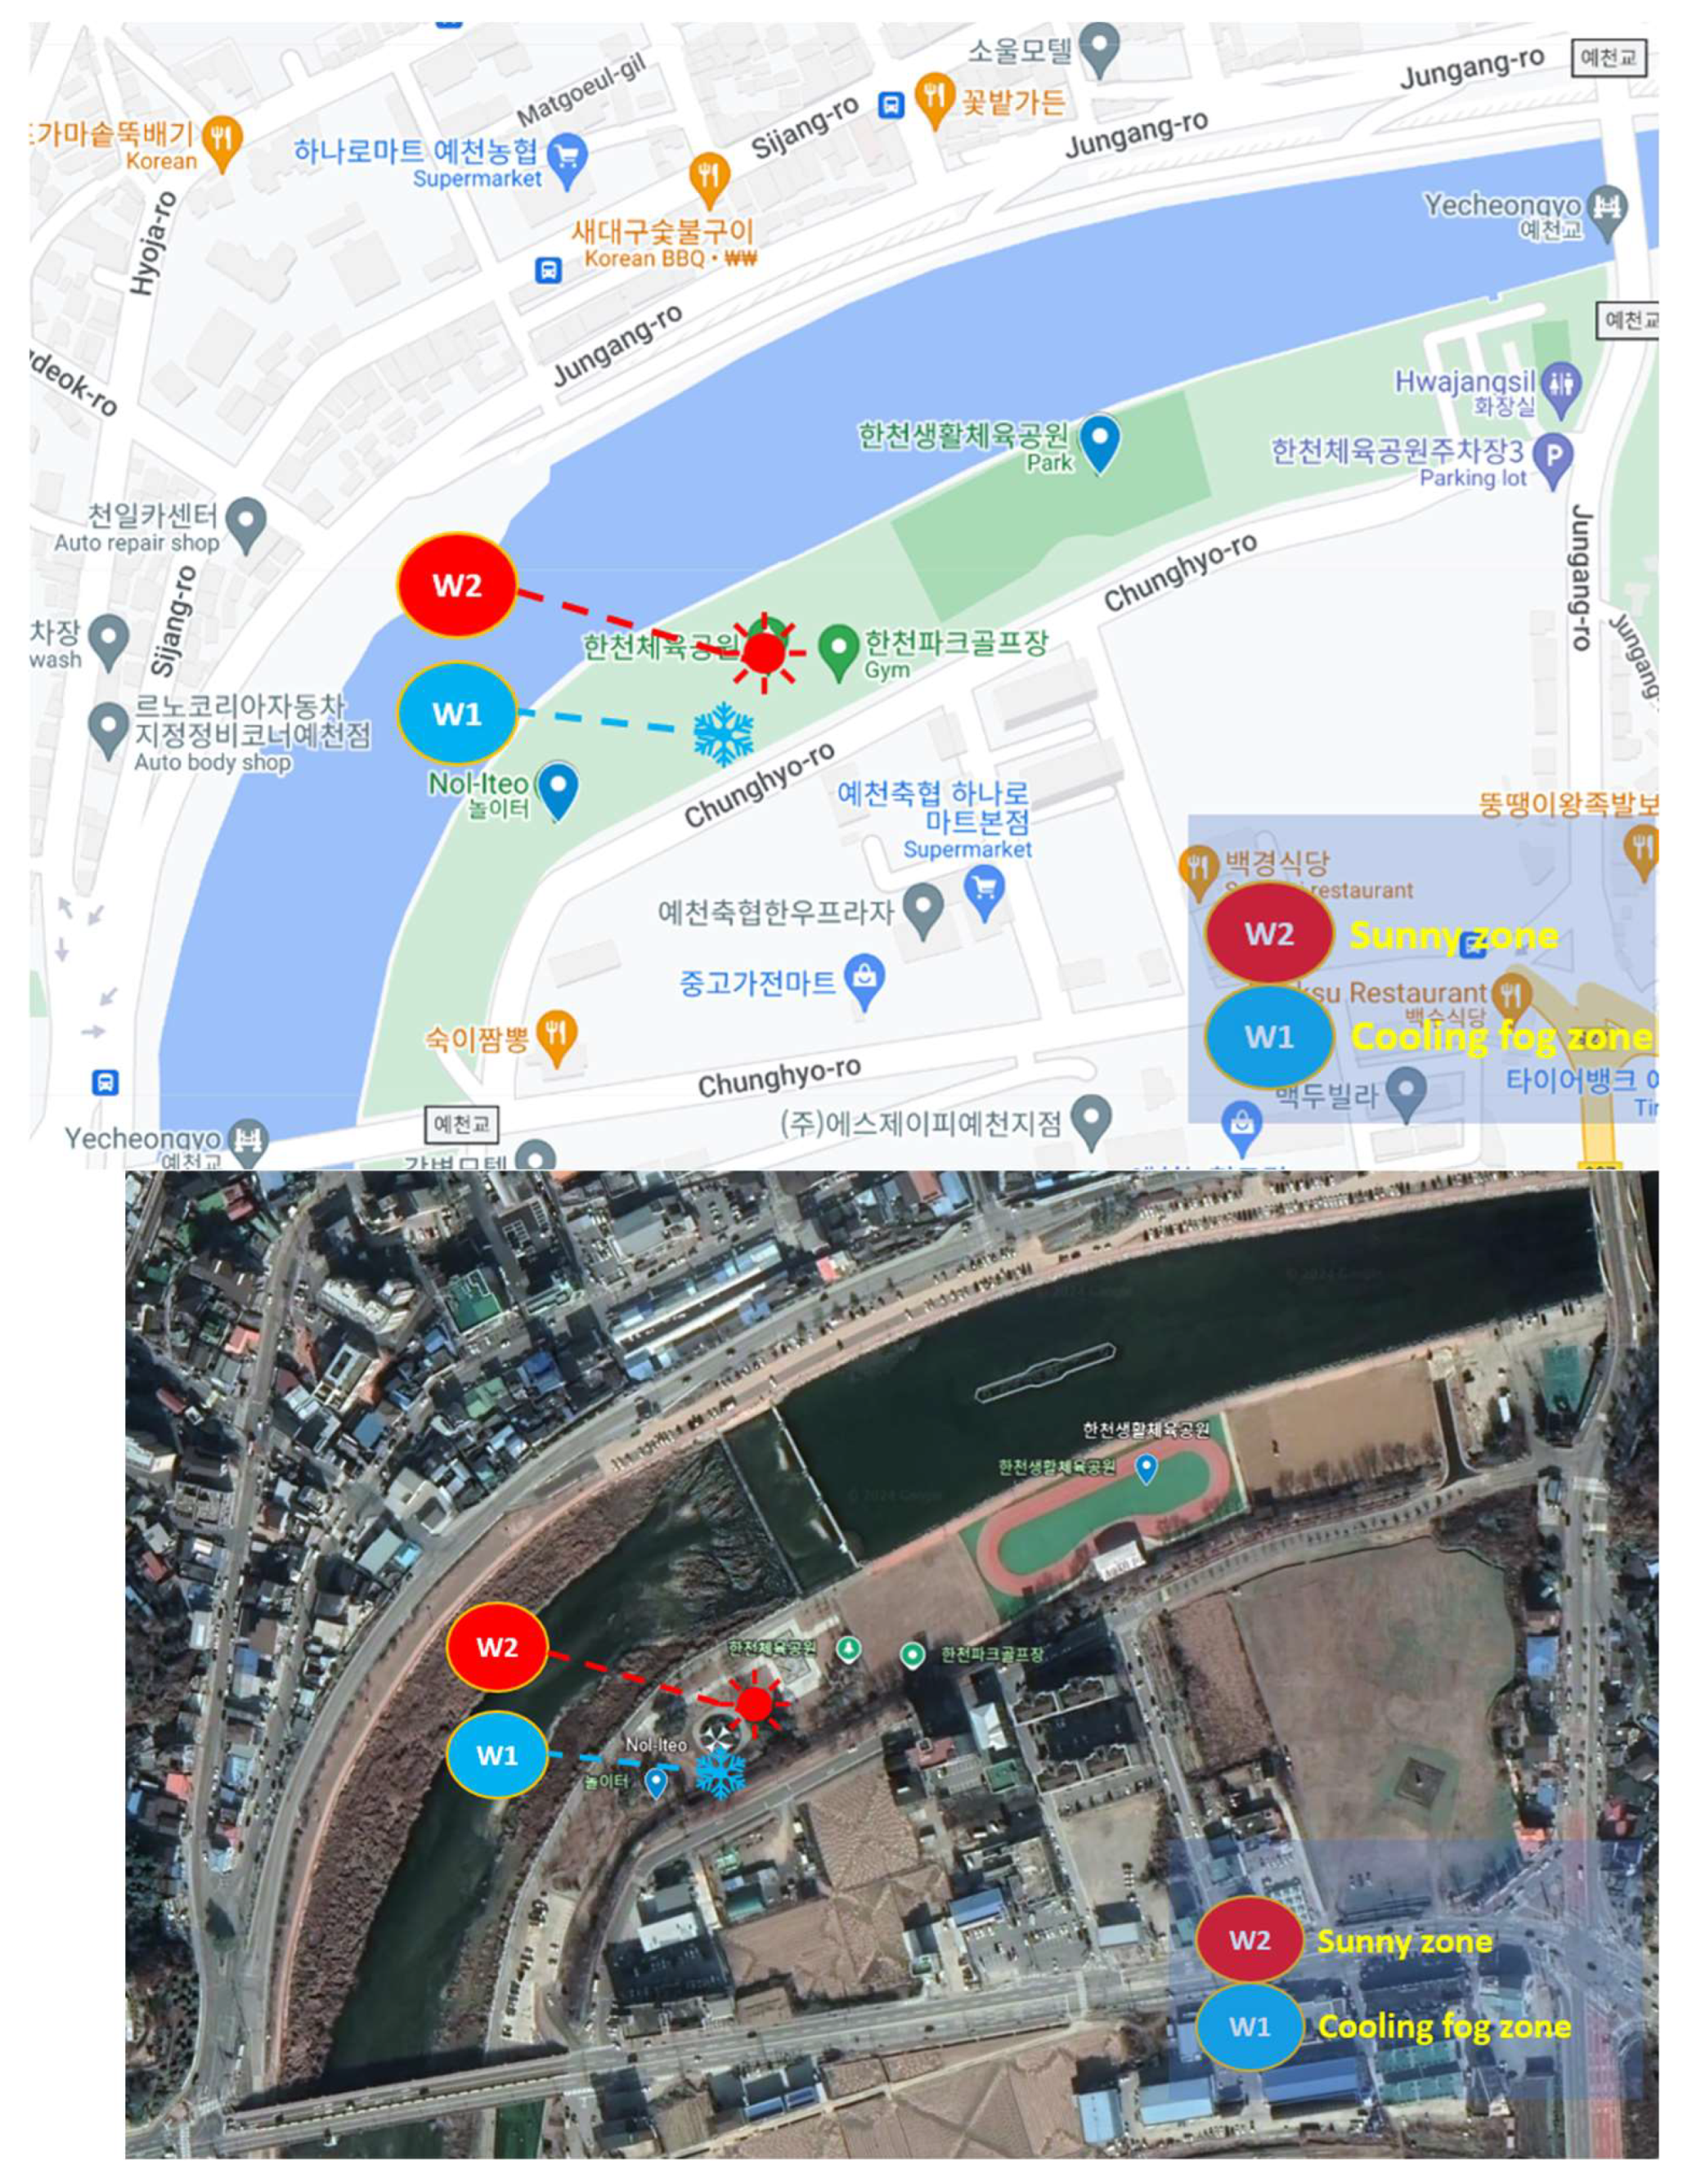
Figure 3.
Field Test Site for Testing the Cooling Fog System in Yechun-gun, with W1 Representing the Cooling Fog Zone and W2 Representing the Sunny Zone.
Figure 3.
Field Test Site for Testing the Cooling Fog System in Yechun-gun, with W1 Representing the Cooling Fog Zone and W2 Representing the Sunny Zone.
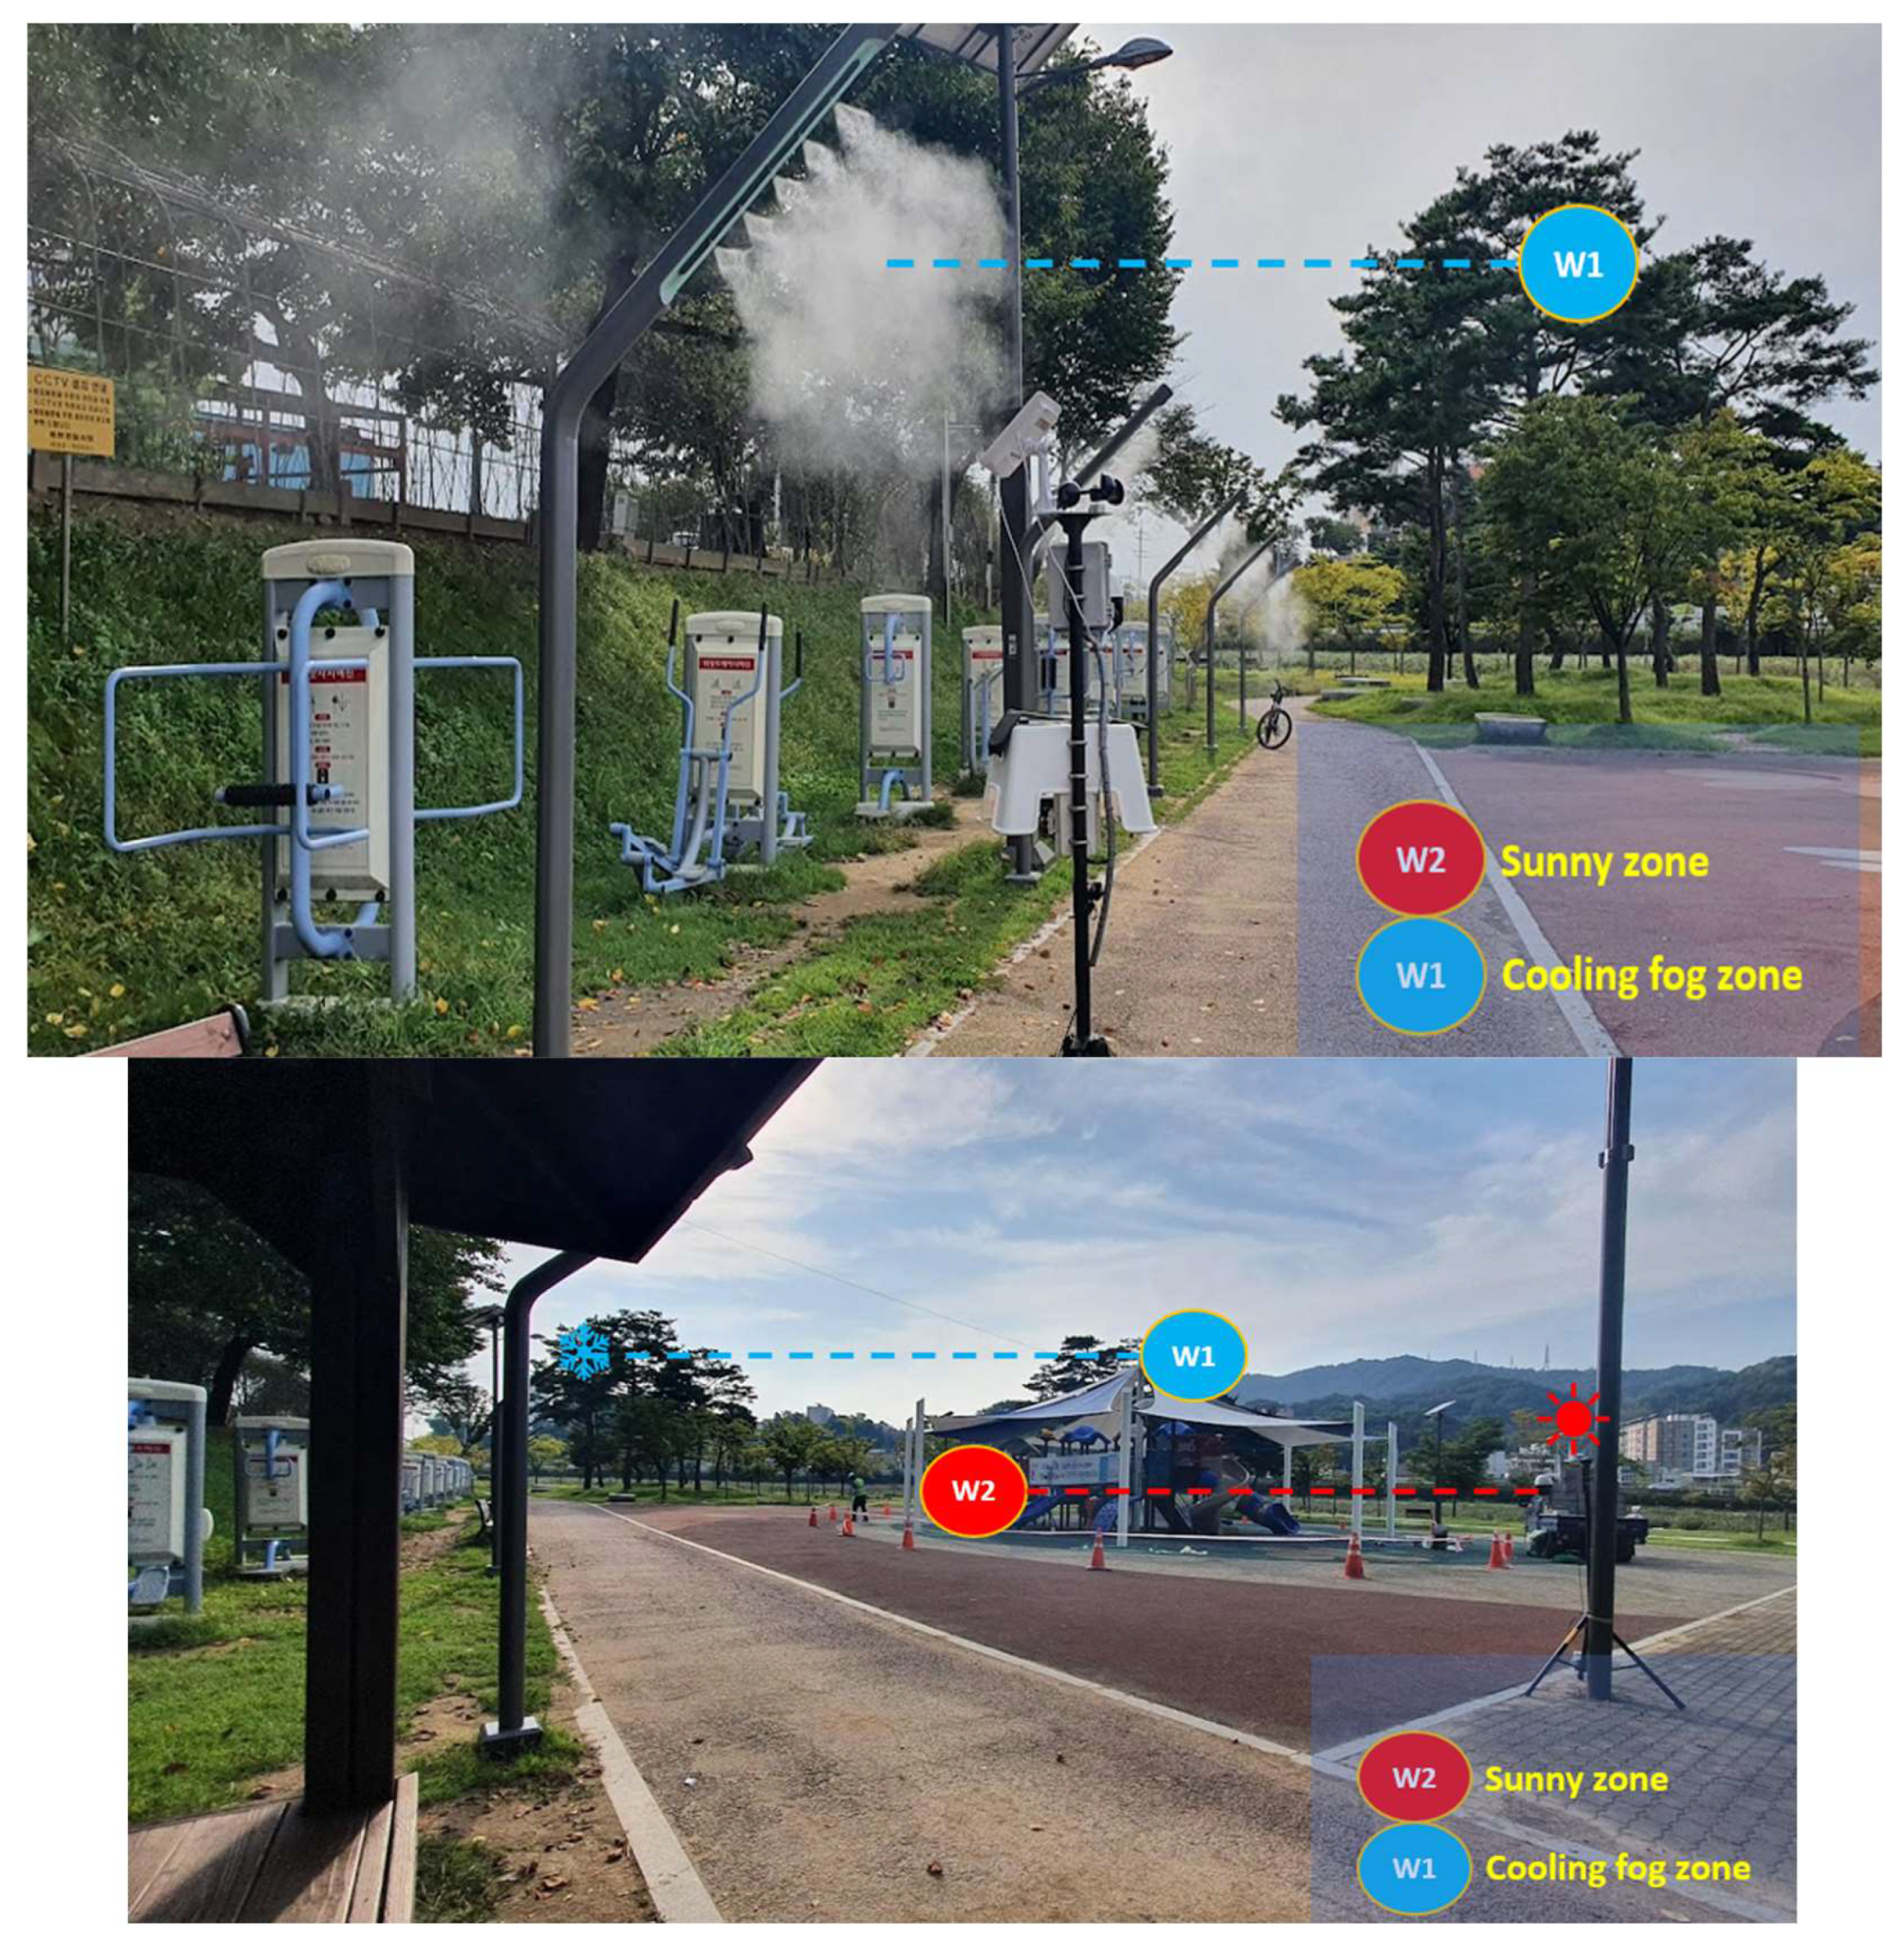
Table 4.
Field Test Sites, Sections, Addresses, and Applications for Cooling Fog Zone and Sunny Zone in Yechun-gun.
Table 4.
Field Test Sites, Sections, Addresses, and Applications for Cooling Fog Zone and Sunny Zone in Yechun-gun.
| Section | Site | Address | Application |
|---|---|---|---|
| W1 | 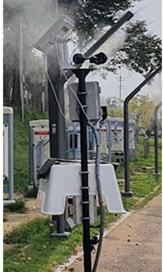 |
Hancheon Sports Park 166-1, Cheongcheon-ri, Yecheon-eup, Yecheon-gun, Gyeongsangbuk-do, South Korea |
Cooling fog zone |
| W2 | 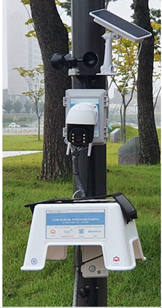 |
Hancheon Sports Park 166-1, Cheongcheon-ri, Yecheon-eup, Yecheon-gun, Gyeongsangbuk-do, South Korea |
Sunny zone |
3.2.3. Shading Structure Experimentation in Geyang-gu
- Objective: To evaluate the impact of shading structures on reducing heat exposure in public outdoor areas, particularly for vulnerable populations, such as children and the elderly.
- Study Location: Shading structures were installed in key public spaces within Geyang-gu, a district in Incheon Metropolitan City, located in the northwestern part of South Korea. Incheon has a coastal climate due to its proximity to the Yellow Sea, with warm, humid summers and cold winters. Geyang-gu, being part of a rapidly urbanizing area, experiences the effects of the urban heat island (UHI) phenomenon, which intensifies the already rising temperatures caused by global climate change.
The region is particularly vulnerable to the impacts of climate change due to its dense population, urban sprawl, and a high concentration of concrete and asphalt surfaces that absorb and radiate heat, contributing to elevated urban temperatures. The elderly population and young children in Geyang-gu are especially at risk from extreme heat, as they are more susceptible to heat-related illnesses. Additionally, the growing frequency of heatwaves in recent years has increased energy demands for cooling, exacerbating environmental and public health issues.
To address these challenges, the installation of shading structures in public spaces, such as playgrounds and rest areas, is seen as a vital adaptation strategy. These structures provide passive cooling by blocking direct solar radiation, reducing heat stress for vulnerable populations, and creating cooler, more comfortable outdoor environments[38,39,40].
Figure 4.
Site Map of Geyang-gu, Incheon-si for the shadow structure applications (Source: Google Maps).
Figure 4.
Site Map of Geyang-gu, Incheon-si for the shadow structure applications (Source: Google Maps).
- •
- Experimental Design:
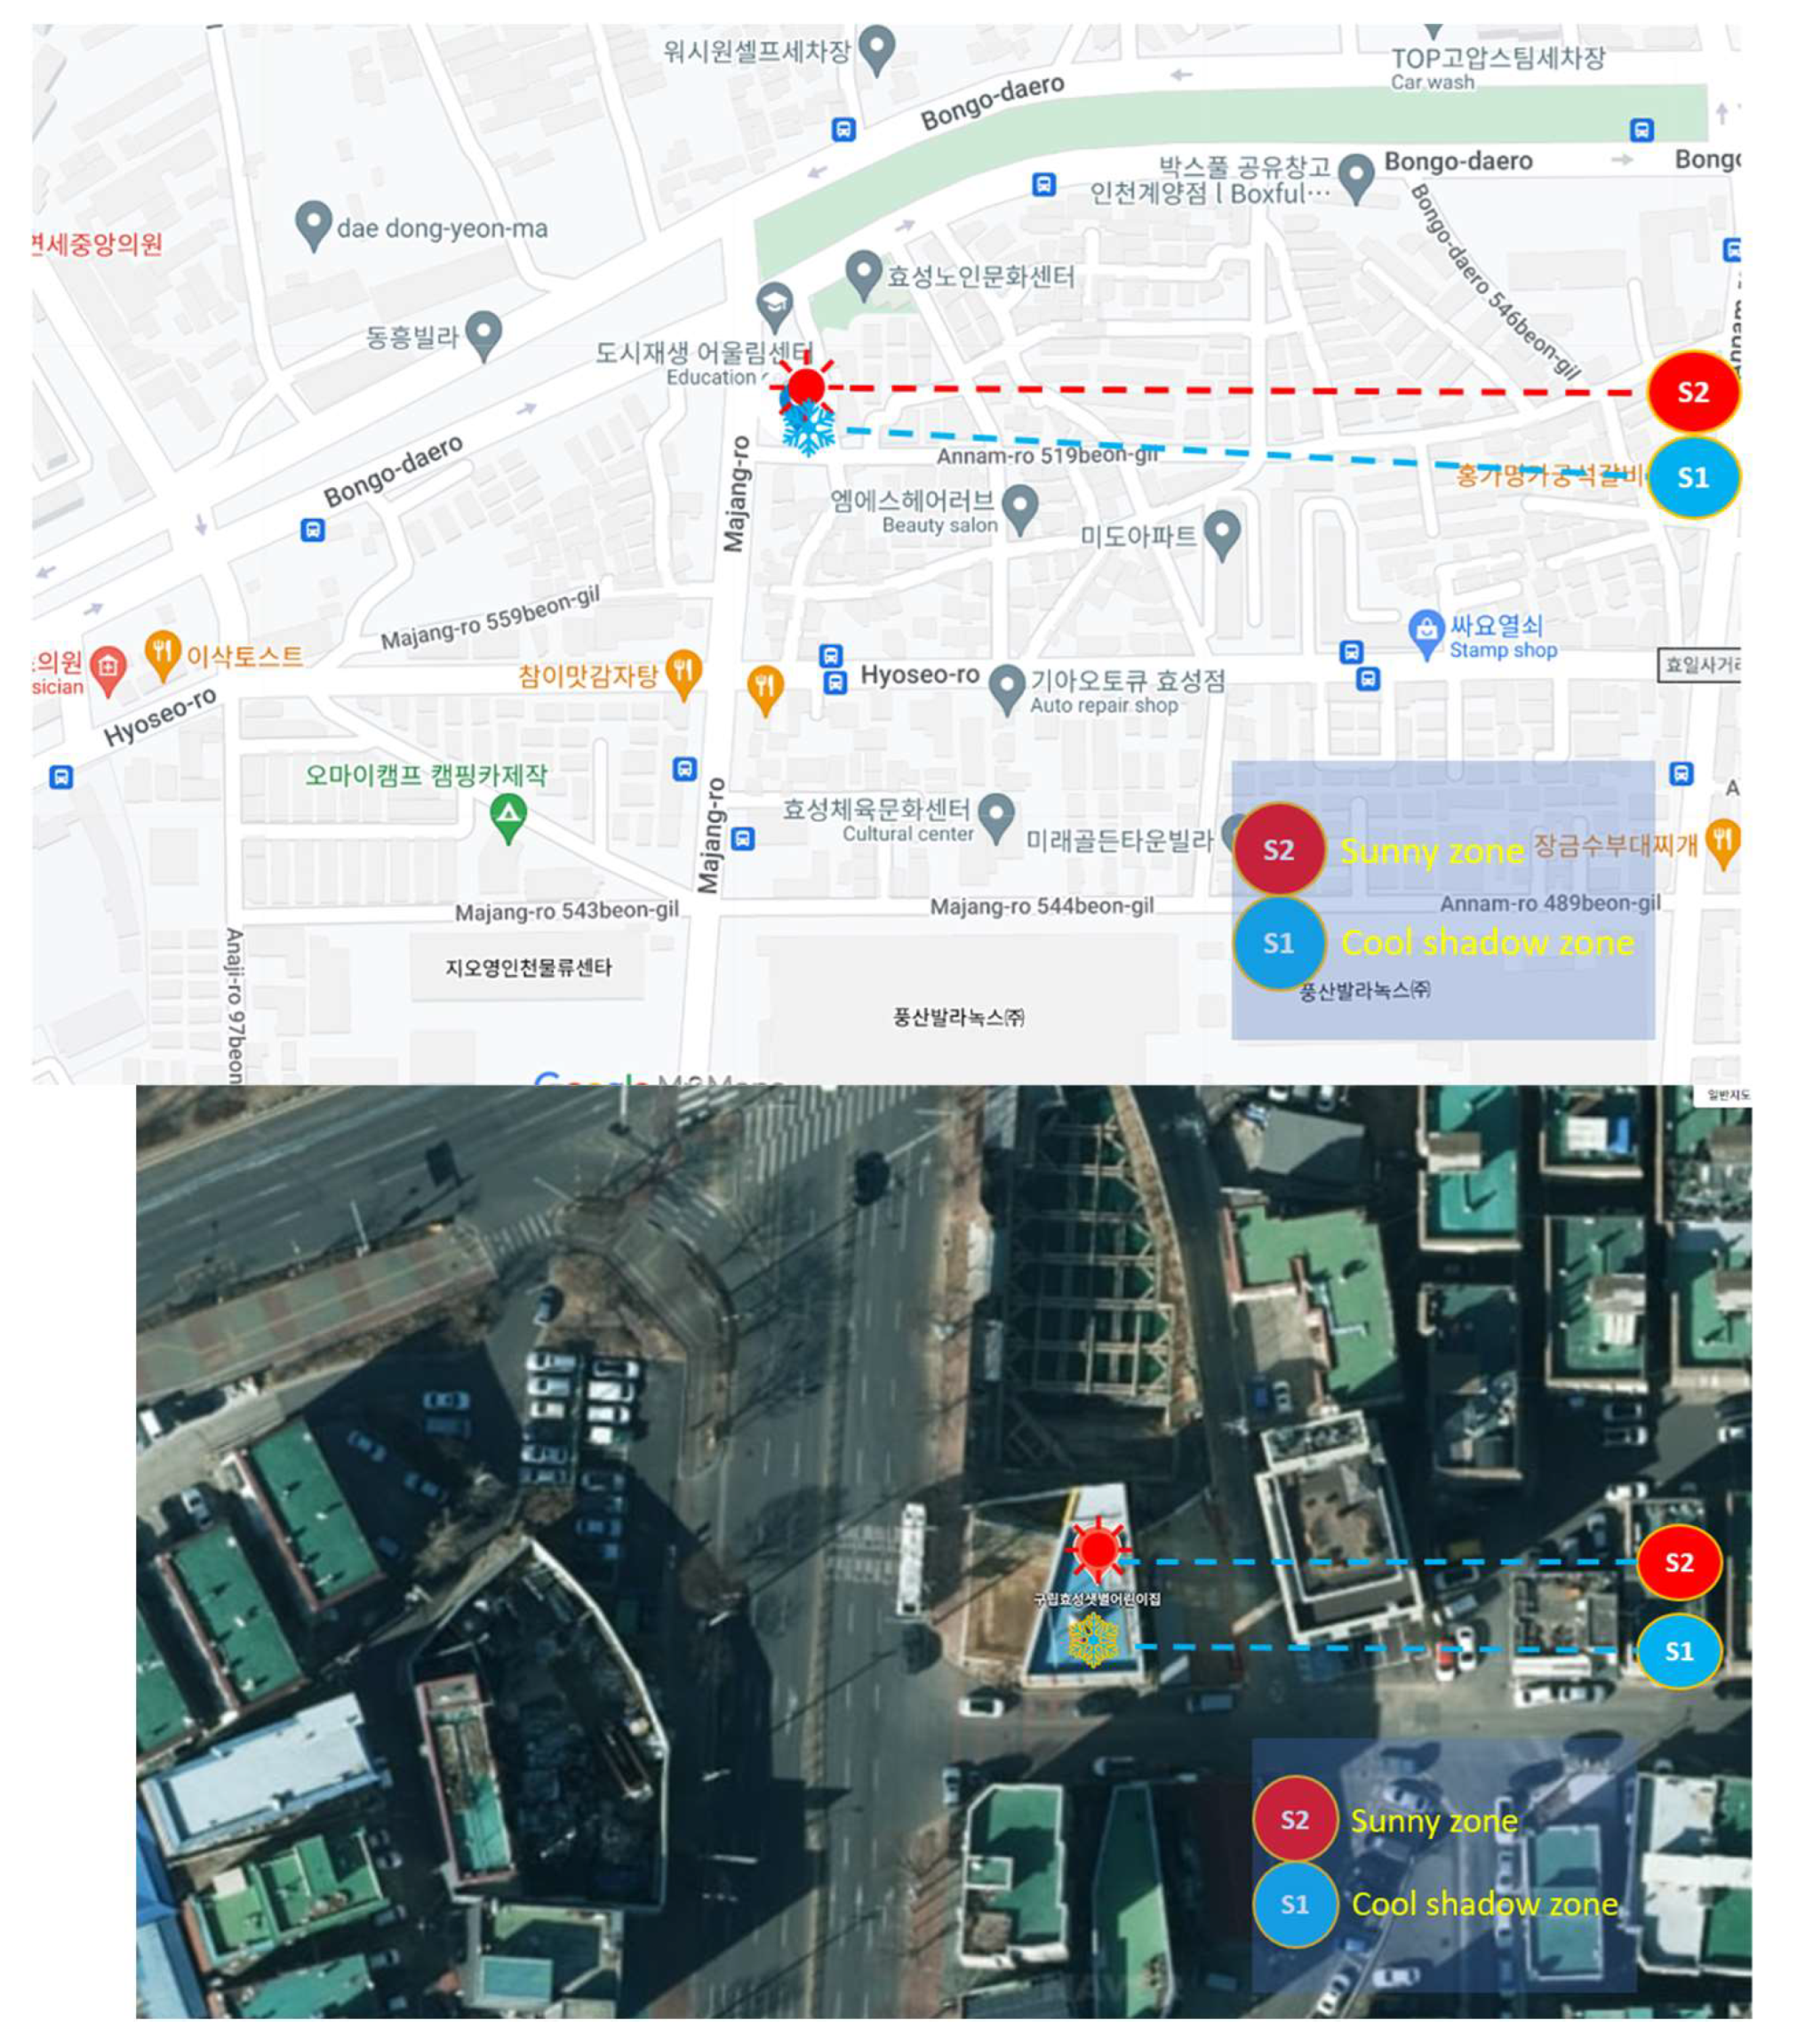
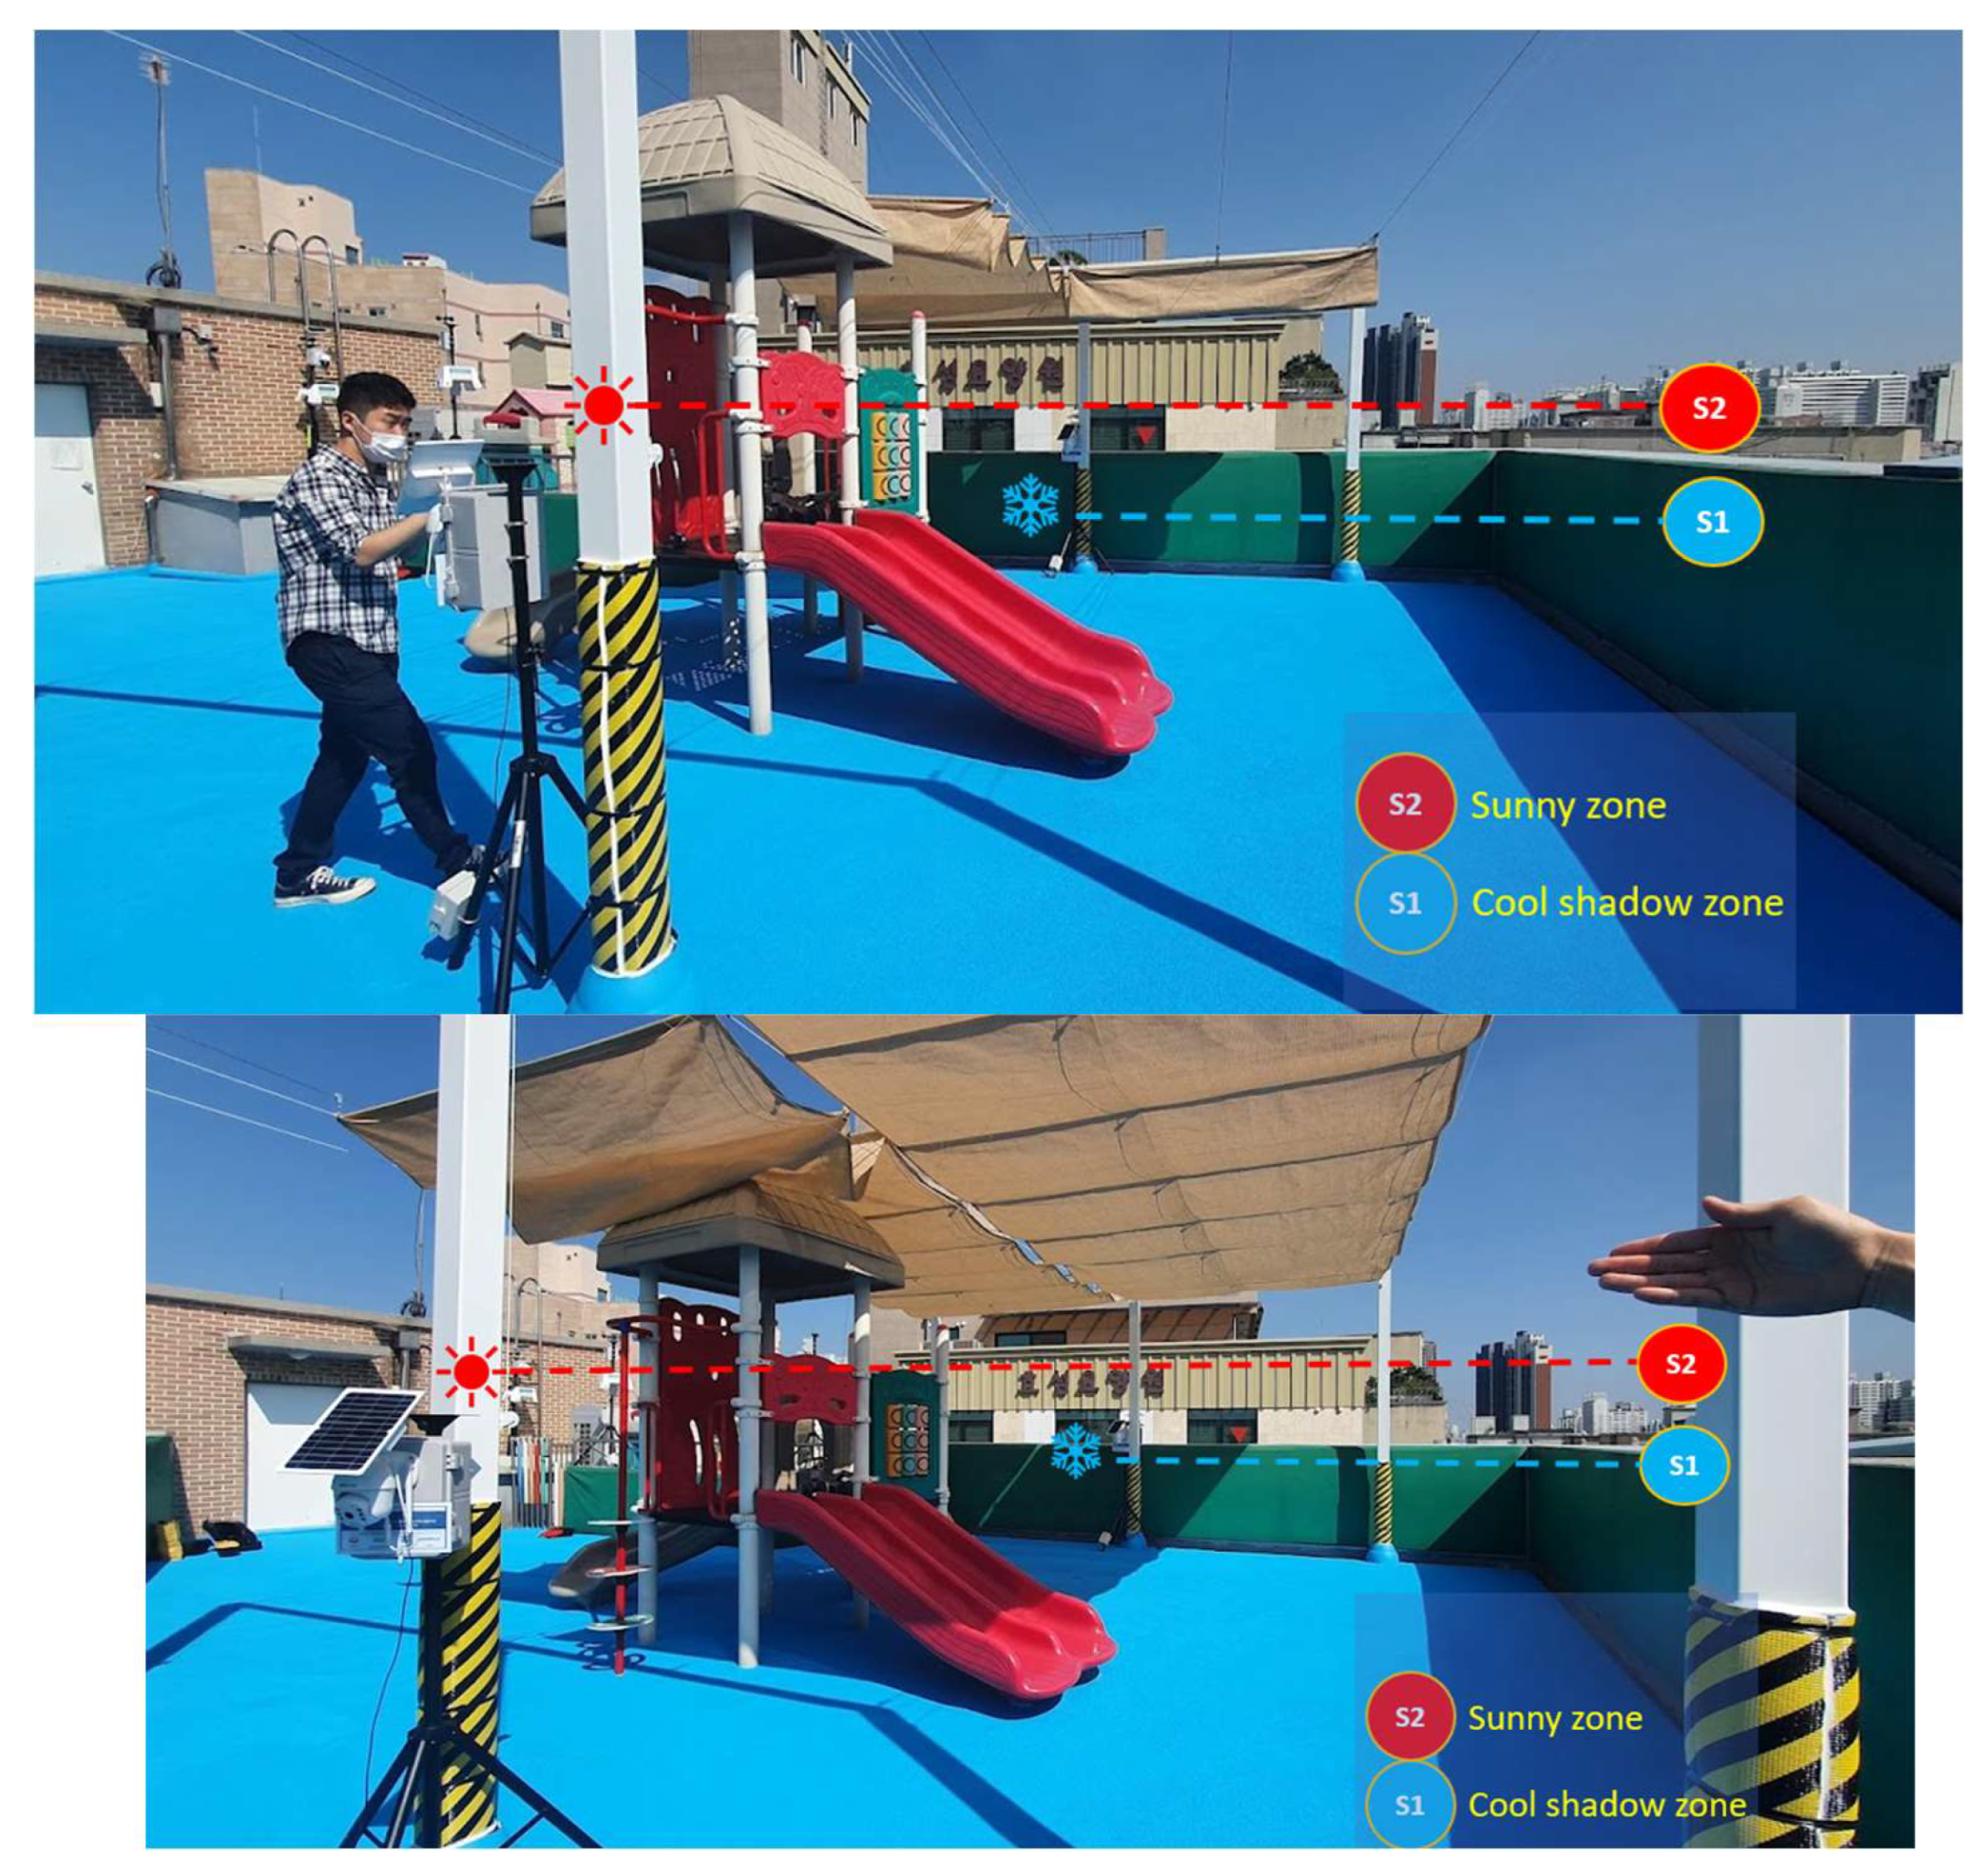
Shading Setup: Large shading structures were installed in playgrounds and outdoor rest areas to block direct sunlight and provide thermal comfort to pedestrians and children. The shading structures were designed with materials that maximized solar reflectivity and reduced heat absorption.
S1 : Cool shadow zone
S2 : Sunny zone
Monitoring Equipment: T&D TR-71wf Data logger emperature sensors were placed under the shading structures to measure the reduction in ambient temperatures, while control areas without shading were monitored for comparison.
- ■
- Data Collected:
Surface temperature beneath the shading structures and sunny zone
Measurement Period: Data loger’s sensors were installed under the shading structures in a playground. Comparisons were made with nearby unshaded areas from September 30 to October 4, 2021. Sensing data were measured at every 5 minutes.
Figure 5.
Field Test Site for Testing the Shadow Structure System in Geyang-gu, Incheon-si with S1 Representing the Cool Shadow Zone and S2 Representing the Sunny Zone.
Figure 5.
Field Test Site for Testing the Shadow Structure System in Geyang-gu, Incheon-si with S1 Representing the Cool Shadow Zone and S2 Representing the Sunny Zone.
3.2.4. Small water path Experimentation in Sangju-si
- Objective: To assess the cooling effects of waterway shelters designed for passive cooling in public parks, particularly for vulnerable populations such as the elderly and young children
-
Study Location: A small water path was constructed and tested in Namsan Park, located in Sangju-si, Gyeongsangbuk-do. Sangju-si is situated in the central part of South Korea and experiences a humid continental climate with hot summers and cold winters. Due to its inland location, Sangju-si is particularly vulnerable to extreme temperatures, with significant heatwaves becoming more frequent during the summer months.The combination of high daytime temperatures and prolonged heatwaves has increased the need for effective climate adaptation strategies in the region.Sangju-si’s rural demographic, with a considerable portion of the population being elderly, amplifies the region’s climate change vulnerability. Elderly residents are more susceptible to heat stress, while the lack of extensive urban infrastructure means the community relies heavily on natural and built cooling features, such as water paths, to mitigate the effects of extreme heat. The introduction of a 150-meter-long water path in Namsan Park aims to provide passive cooling through evaporative effects, offering relief from the high summer temperatures and improving thermal comfort for park visitors. This feature is particularly important as it creates a cooler microclimate in public spaces frequently used by elderly residents and young children, who are most at risk from heat-related health issues.
The deployment of passive cooling systems, such as small water paths, in regions like Sangju-si is crucial to adapting to the changing climate, helping to alleviate heat stress in outdoor public spaces[40,41,42].
- •
- Experimental Design:
Small water path installation: Shallow water channels were constructed along the park walkways, offering cooling effects through evaporative cooling. Control areas without water features were included for comparison.
P1 : Small water path
P2 : Sunny Zone
Monitoring Equipment: Ecowitt ws69 temperature and humidity sensors were positioned in the center of the paths and sunny zone which 6 meters away from the path, monitoring temperature differences between areas cooled by water and those sunny zone without water features to compare cooling effects.
- ■
- Data Collected:
Surface temperature of the walkways near the water channels
Air temperature at pedestrian level.
Relative humidity levels and solar radiation data
Measurement Period: Wet-bulb temperature and humidity sensors were positioned along the water path (P1) and in a sunny control zone (P2). Data was collected from August 5 to 8, 2023, with a focus on midday temperature and humidity trends. The data has been uploaded to the server at every 5min.
Table 5.
Field Test Sites, Sections, Sensor installment, Addresses, and Applications for Cool Shadow Zone and Sunny Zone in Geyang-gu, Incheon-si.
Table 5.
Field Test Sites, Sections, Sensor installment, Addresses, and Applications for Cool Shadow Zone and Sunny Zone in Geyang-gu, Incheon-si.
| Section | Sensor installment | Address | Application |
|---|---|---|---|
| S1 | 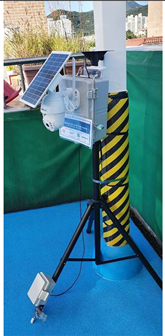 |
Hyo-seong Daycare Center 280, Hyo-seong-dong, Geyang-gu, Incheon, South Korea |
Cool shadow zone |
| S2 | |
Hyo-seong Daycare Center 280, Hyo-seong-dong, Geyang-gu, Incheon, South Korea |
Sunny zone |
Figure 6.
Site Map of Sangju-si for the small water path applications (Source: Google Maps).
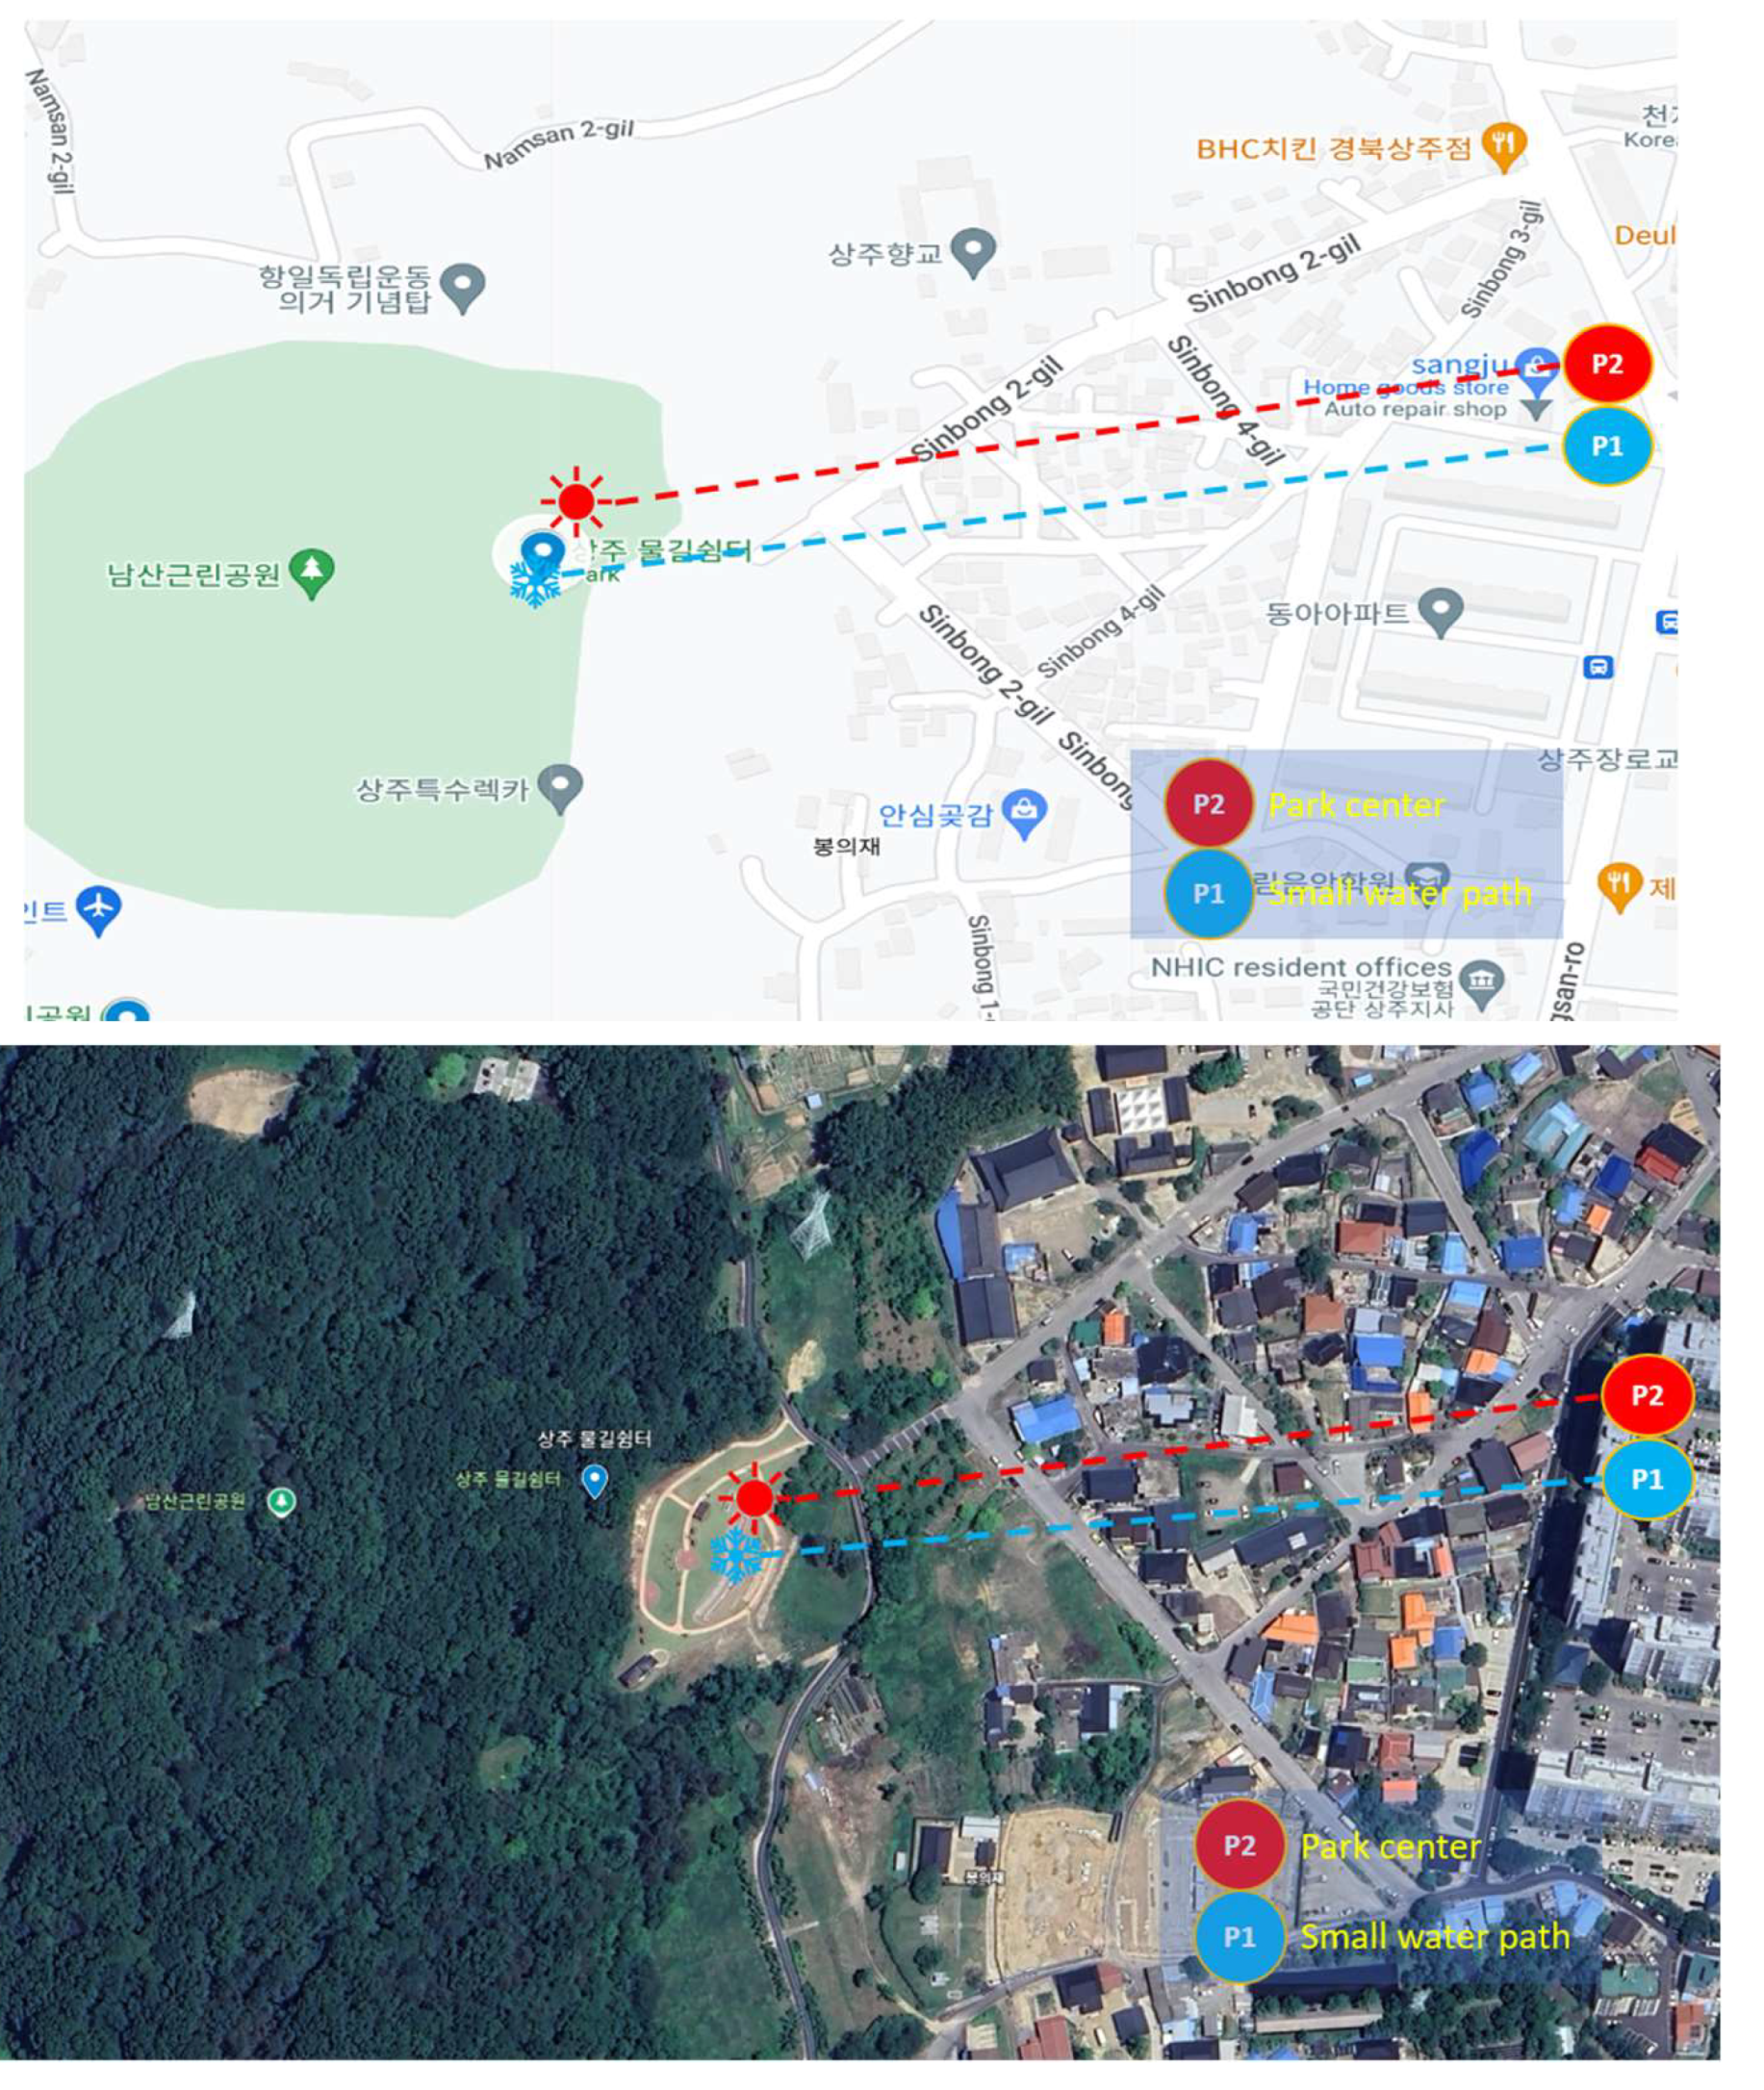
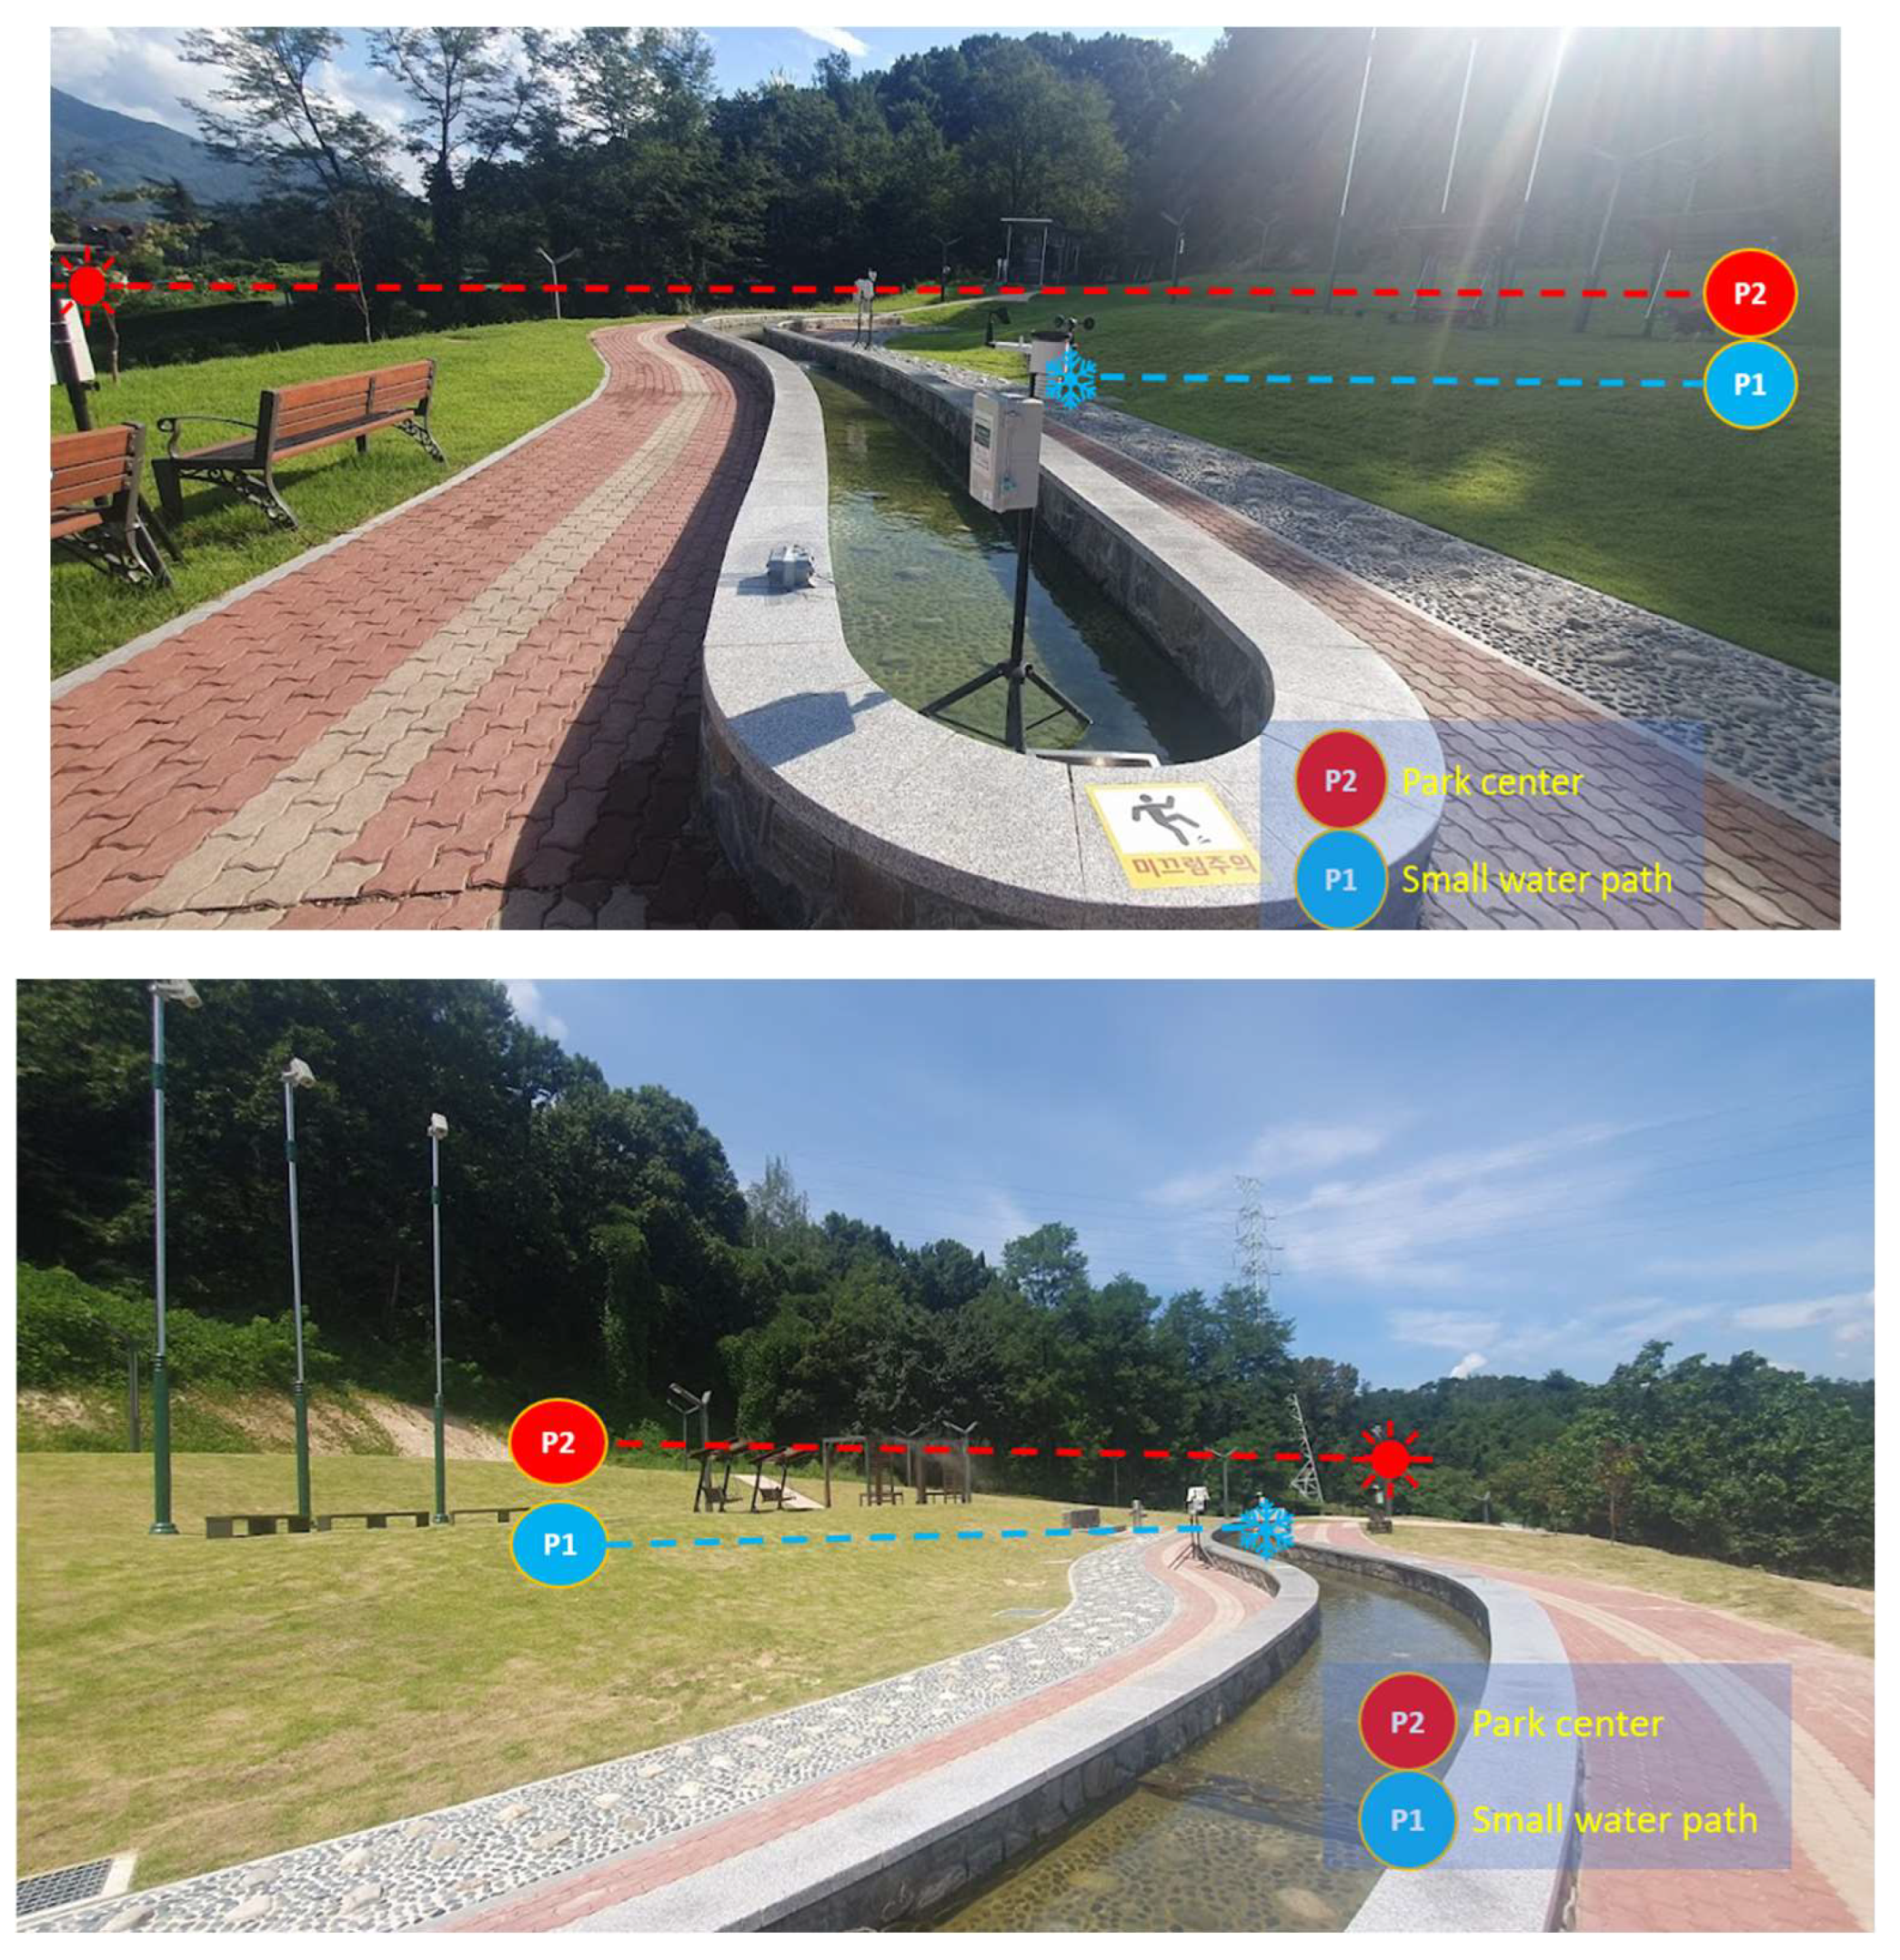
Figure 7.
Field Test Site for Testing the Small water path in Sangju-si, with P1 Representing the Small water path and P2 Representing the Sunny Zone.
Figure 7.
Field Test Site for Testing the Small water path in Sangju-si, with P1 Representing the Small water path and P2 Representing the Sunny Zone.
3.3. Data Analysis
The data collected from each experimental site were analyzed to evaluate the effectiveness of each cooling technology in reducing heat stress and improving thermal comfort. The following analysis methods were applied:
3.3.1. Temperature Reduction Comparison:
- Surface and Ambient Temperature: The primary method of analysis was the comparison of surface and ambient air temperatures before and after the installation of each technology. For each experimental site, temperature data were gathered using IoT-based sensors and data loggers at key intervals. Sensors recorded the rooftop surface temperatures (for cool roofs) and ambient air temperatures (for cooling fog, shading structures, and small water paths).
- Baseline vs. Post-Installation: Data were collected continuously both before and after the technology implementations. The temperature reduction effects were measured by comparing the baseline (pre-installation) temperatures with post-installation values under similar environmental conditions.
- Peak Heat Hours: Special emphasis was placed on peak heat periods (typically 12:00–16:00), where temperature reductions were most critical. For example, cooling fog and shading structures were assessed for their ability to reduce midday heat, while small water paths and cool roofs were evaluated for their overall daily temperature performance.
3.3.2. Direct and Indirect Temperature Effects:
- Direct Effects: The direct effects refer to the surface and ambient air temperature reductions caused by the technologies themselves. For example, cooling fog reduced ambient air temperatures in W1 (Cooling Fog Zone) by up to 5°C compared to W2 (Sunny Zone).
- Indirect Effects: Indirect effects were particularly relevant for cool roofs, where the impact on indoor temperatures and potential energy savings were analyzed. Buildings treated with reflective coatings not only experienced surface temperature reductions of up to 5°C but also saw indoor temperature reductions, reducing the demand for cooling.
Table 6.
Field Test Sites, Sections, Sensor installment, Addresses, and Applications for Small water path and Sunny Zone in Geyang-gu
Table 6.
Field Test Sites, Sections, Sensor installment, Addresses, and Applications for Small water path and Sunny Zone in Geyang-gu
| Section | Sensor installment | Address | Application |
|---|---|---|---|
| P1 | 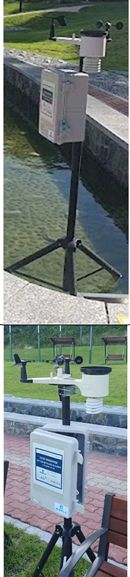 |
Water Path Rest Area in Namsan Park 3, Namsan-dong, Sangju-si, Gyeongsangbuk-do, South Korea |
Small water path |
| P2 | Water Path Rest Area in Namsan Park 3, Namsan-dong, Sangju-si, Gyeongsangbuk-do, South Korea |
Sunny zone |
3.3.3. Temporal Analysis:
- Daily and Hourly Trends: Temperature data were analyzed in both daily and hourly increments. For example, data collected from August 27 to September 1, 2021 in Gimhae-si showed consistent cooling effects of cool roofs during midday heat, with peak reductions between 12:00 and 15:00.
- Day-to-Night Temperature Gaps: Additionally, nighttime temperatures were analyzed to determine the lasting effects of each cooling technology. Technologies like cool roofs and shading structures maintained lower temperatures even after peak sunlight hours.
3.3.4. Statistical Analysis:
- Mean Temperature Reductions: The mean temperature reduction for each technology was calculated across the monitoring period. These reductions were averaged across multiple sites and compared to control areas without the cooling technologies. For example, the mean temperature reduction from shading structures was up to 10°C during peak hours.
- Comparison of Temperature Gaps: The temperature gaps between treated and control areas were assessed using graphical analysis (as seen in the previous figures). This was particularly relevant for small water paths and shading structures, where the difference between shaded and sunny zones varied throughout the day.
4. Theoretical Framework
4.1. Cool Roof (Reflective Paint) Results
The cool roof (reflective paint) experiment conducted in Gimhae-si demonstrated a significant reduction in surface temperatures on the rooftops and external walls where reflective coatings were applied. The following key results were observed:
4.1.1 Surface Temperature Reduction:
The application of reflective coatings to rooftops led to a surface temperature reduction of up to 3°C compared to non-applied surfaces during peak heat hours (12:00–15:00). Buildings with both cool roof and cool wall treatments exhibited the greatest surface temperature reduction, consistently staying below 40°C, while untreated surfaces exceeded 40°C.
H1 (Coolwall + Roof) also showed the lowest rooftop surface temperatures, suggesting that the reflective coating on the roof effectively reduced overall heat absorption. During peak heat hours, H1 was about 2-3°C cooler than H2 and H3.
H2 (Coolwall) recorded surface temperatures higher than H1 but lower than H3, highlighting the importance of roof treatments. This suggests that while walls play a role in temperature reduction, the roof remains a critical factor in heat absorption and overall cooling. H3 (Non-applied) had the highest surface temperatures, particularly during peak hours, where temperatures often exceeded 40°C. Without reflective coatings, the roof absorbed substantial heat, leading to higher surface temperatures and increased internal and surrounding air temperatures.
4.1.2 Air Temperature Reduction:
Reflective surfaces contributed to an average air temperature reduction of 1-2°C at 1.5 meters above ground level. The largest cooling effects were observed during the hottest parts of the day, demonstrating that reflective coatings can mitigate heat buildup in the surrounding environment.
H1 (Coolwall + Roof) consistently showed the lowest air temperature readings at 1.5 meters compared to H2 (Coolwall) and H3 (Non-applied). The temperature reduction was particularly noticeable during the hottest parts of the day, where H1 remained 1-2°C cooler than H2 and H3. This highlights the efficacy of combining both cool walls and roofs in mitigating heat buildup around buildings. H2 (Coolwall) exhibited slightly higher temperatures compared to H1, but it was generally lower than H3 (Non-applied). This suggests that applying reflective paint only to the walls provided some benefit but was less effective than when both walls and roofs were treated. H3 (Non-applied) displayed the highest air temperatures, especially during afternoon peaks. This implies that without any reflective coatings, the structure absorbed and radiated more heat, leading to increased air temperatures in its vicinity.
The temperature differences between H1, H2, and H3 were most pronounced during peak heat periods (late morning to early afternoon. The cooling effect of H1 (Coolwall + Roof) was most significant during midday when solar radiation was highest, reinforcing the advantage of combining both cool walls and roofs for better temperature mitigation. Nighttime temperatures for all three areas converged, as the impact of direct solar radiation diminished after sunset, reducing the temperature differences.
4.1.3 Key Observations:
The surface temperatures in H1 stayed lower throughout the day, demonstrating the effectiveness of reflective coatings in keeping rooftops cool. This cooling likely reduced heat transfer into the building, enhancing indoor comfort as well.
These findings are consistent with previous research, confirming that cool roofs provide both direct cooling to buildings and secondary benefits by reducing the heat absorption in urban environments. H2 (Coolwall), though effective in lowering wall temperatures, had higher rooftop surface temperatures, emphasizing the need to treat both roofs and walls in heat mitigation strategies. H3 (Non-applied) exhibited the poorest thermal comfort, with much higher surface temperatures contributing to increased air temperatures and heat buildup in the surrounding environment.
Figure 8.
Comparing the 1.5M air temperatures and rooftop surface temperatures for the cool wall (top), cool wall + roof, and non-applied surfaces (bottom) during the period from August 27 to September 1, 2021. The results show significant differences in both air and surface temperatures, with the cool roof and cool wall applications reducing the surface temperature, especially during peak heat times.
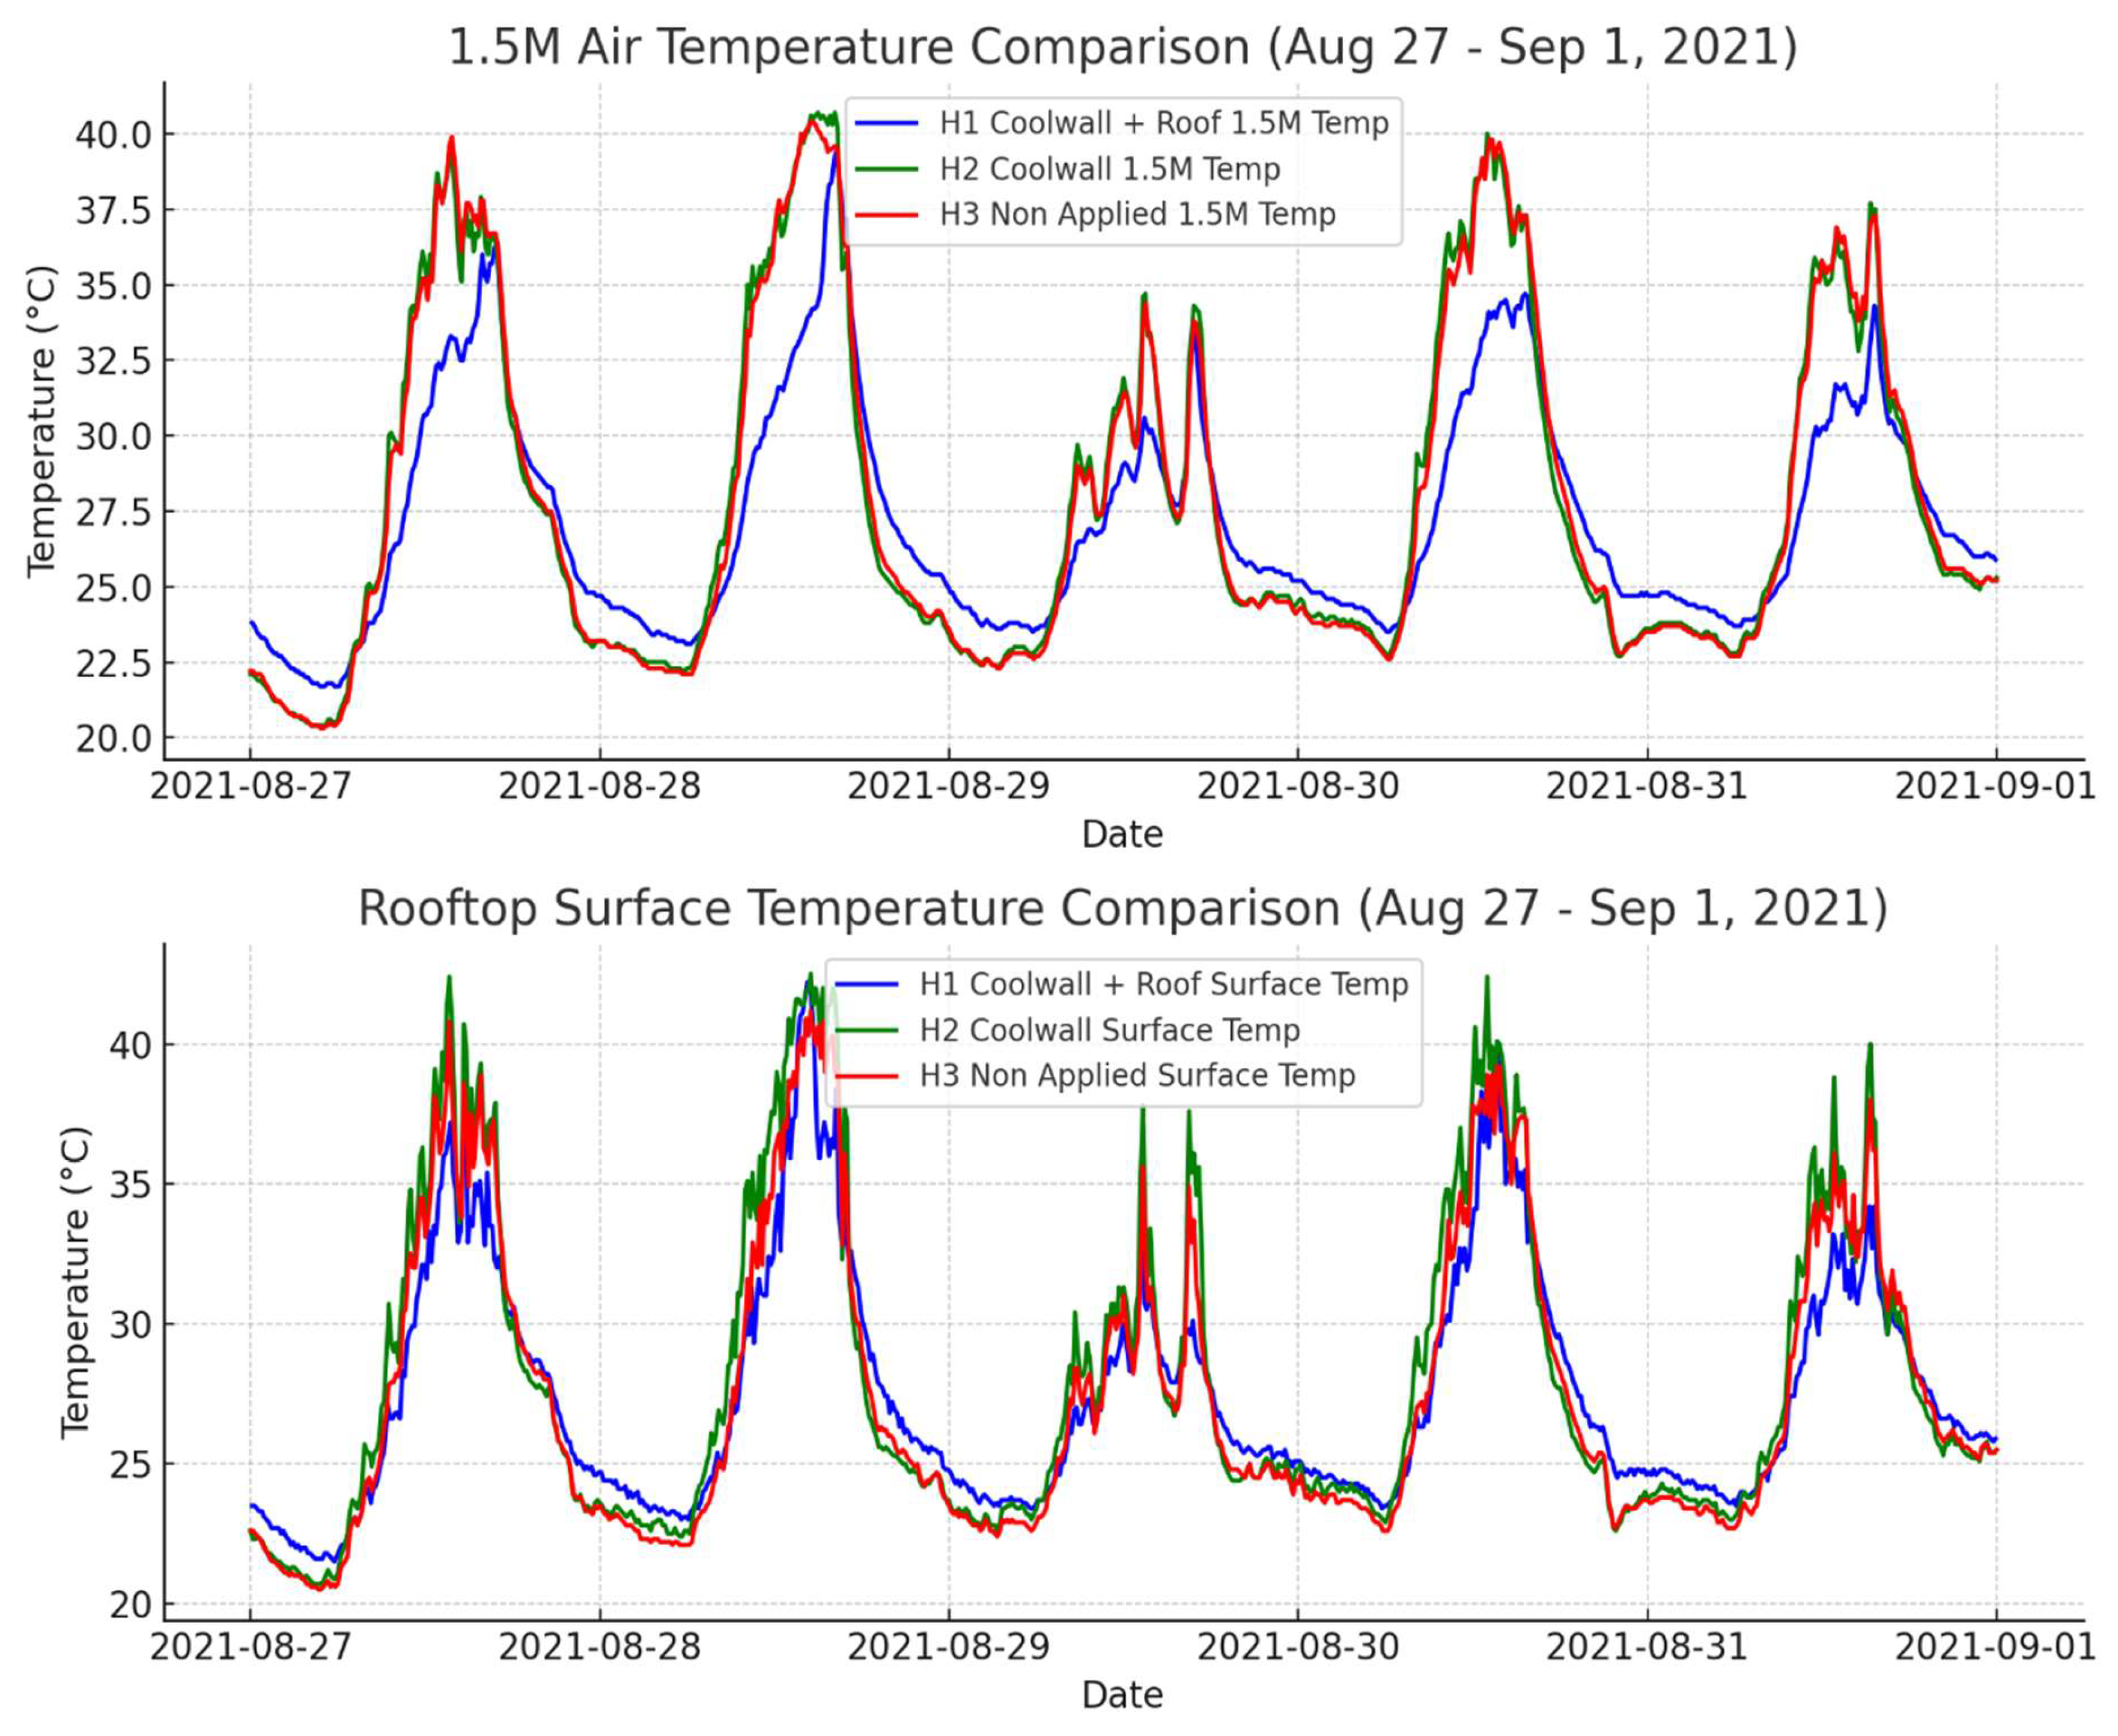
Figure 9.
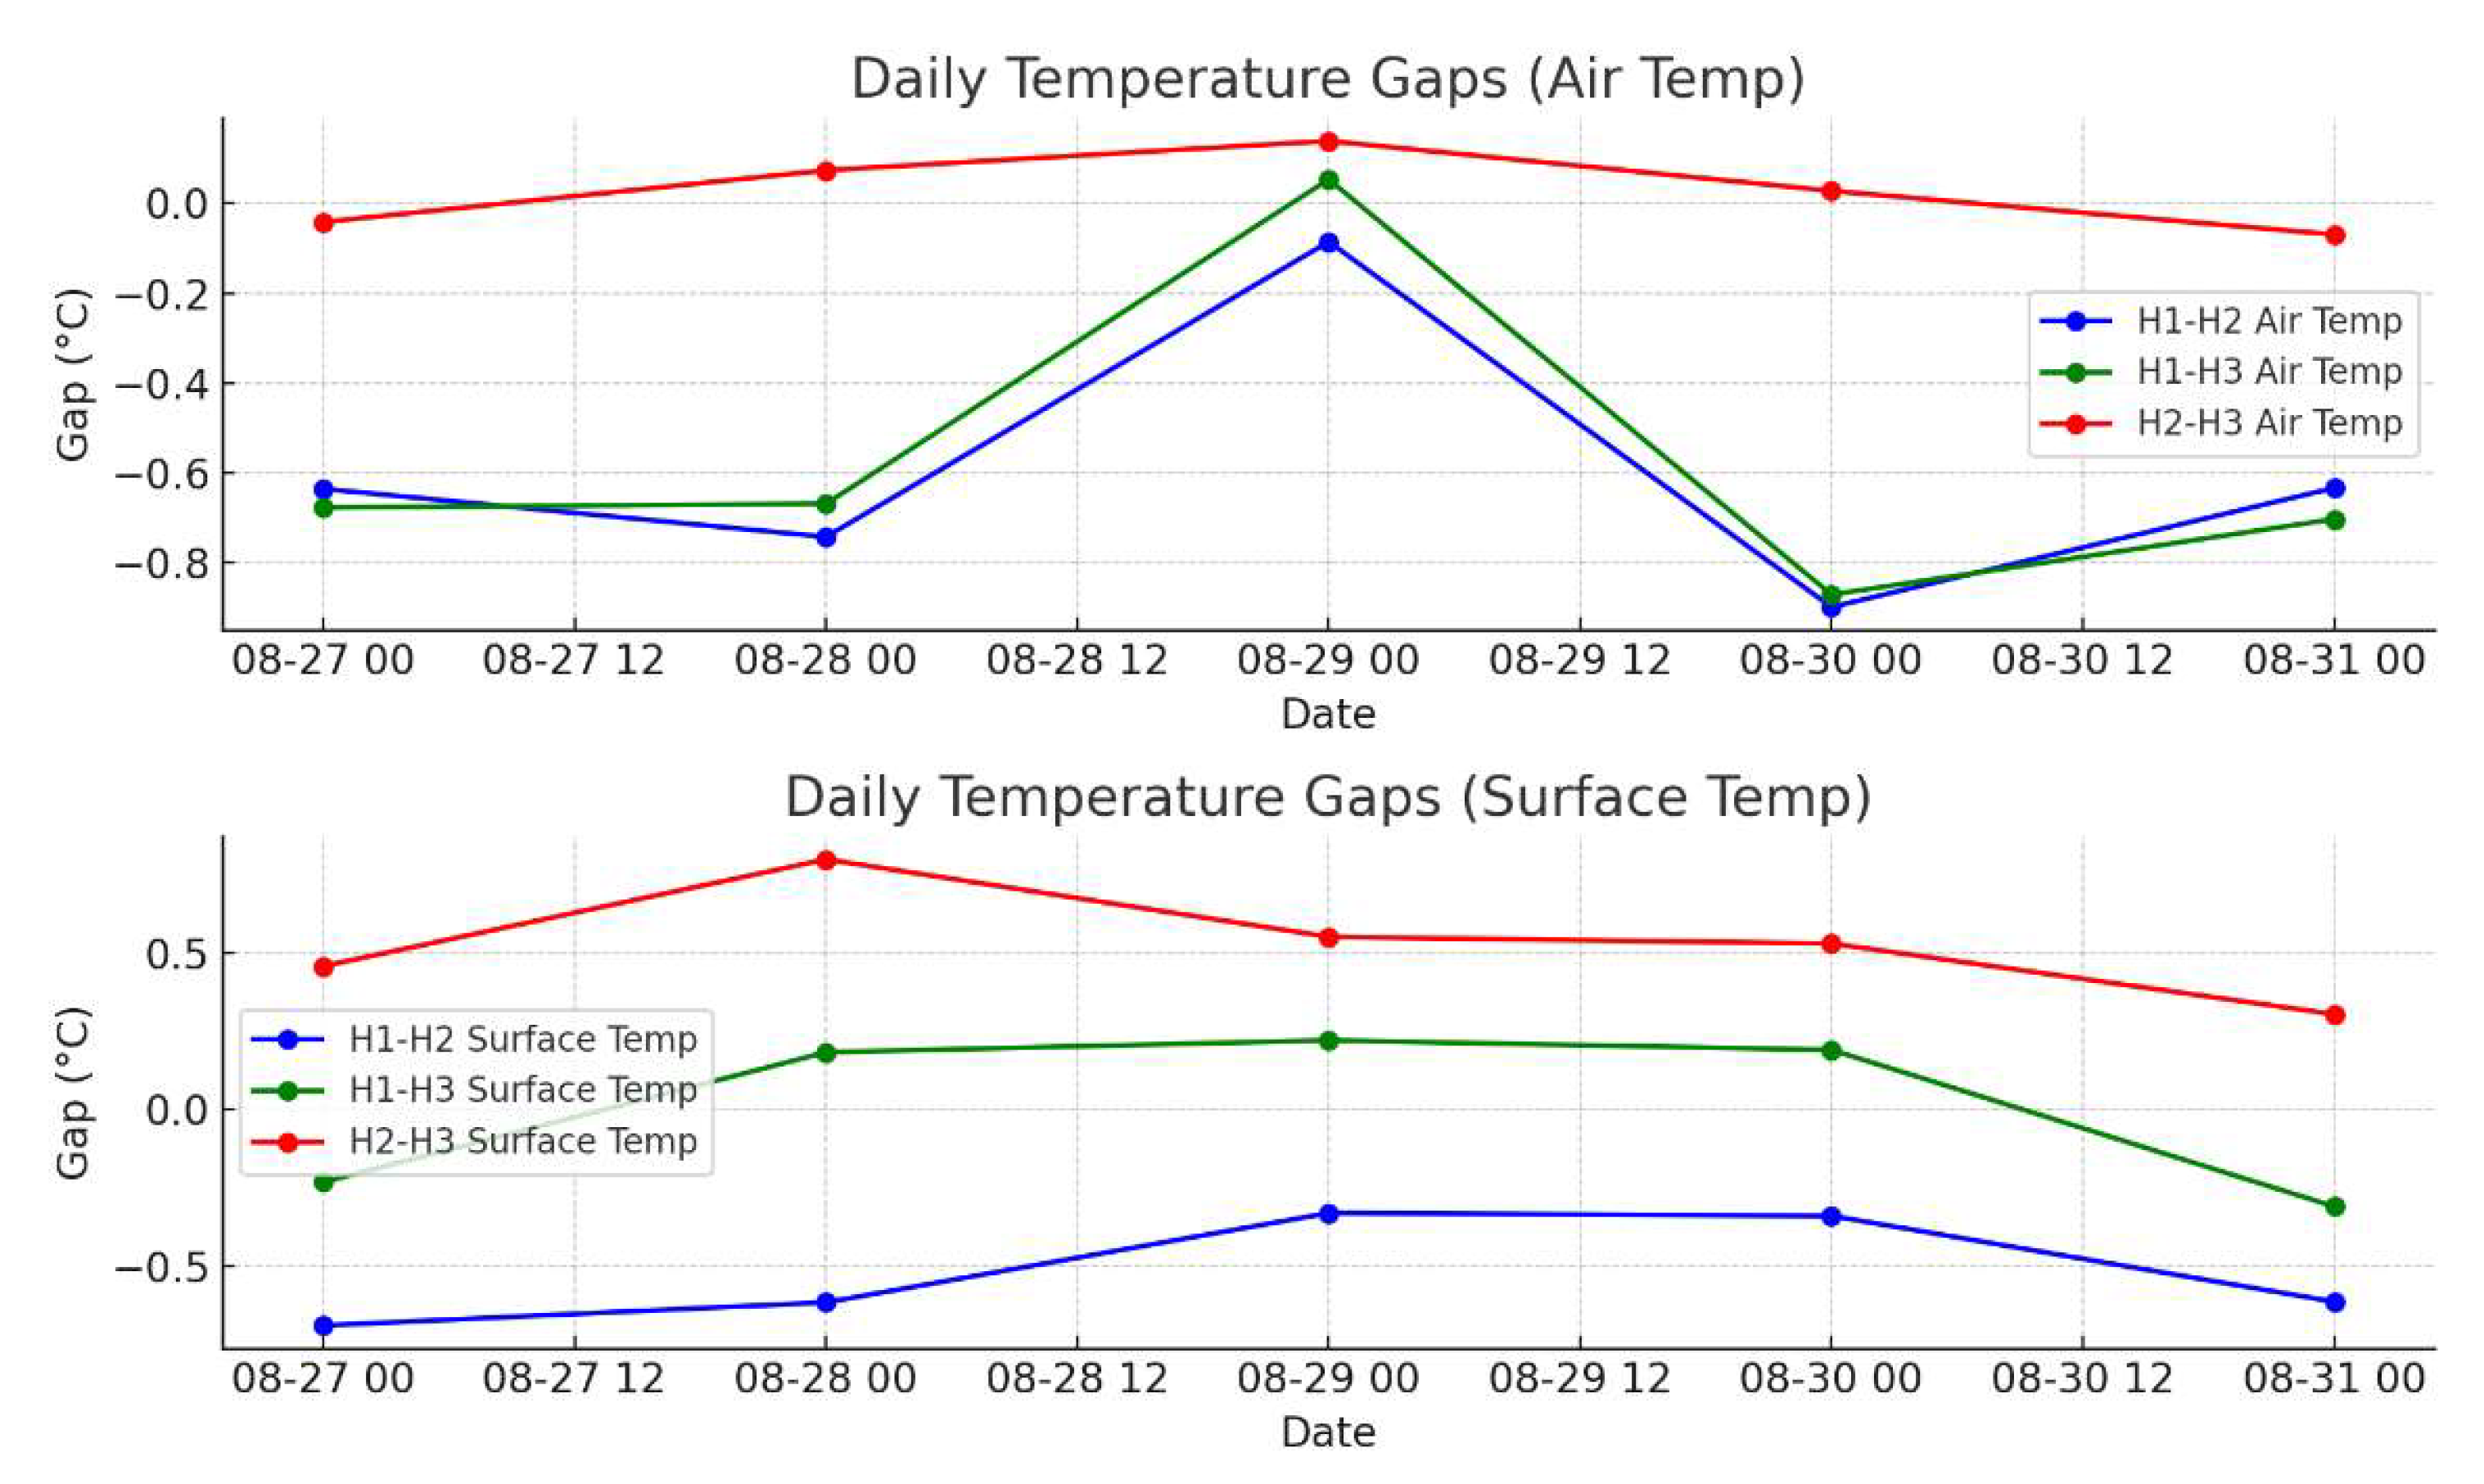
Daily temperature gaps between H1, H2, and H3 for both air temperature (top graph) and surface temperature (bottom graph). These graphs illustrate how the gaps fluctuate over the period from August 27 to August 31, 2021.
Figure 9.
Daily temperature gaps between H1, H2, and H3 for both air temperature (top graph) and surface temperature (bottom graph). These graphs illustrate how the gaps fluctuate over the period from August 27 to August 31, 2021.
4.2. Cooling Fog Results in Yechun-gun
The cooling fog system installed in Yechun-gun provided immediate and noticeable reductions in ambient air temperature in the playground where it was deployed. The key findings of the experiment are as follows.
4.2.1 Cooling Fog System Effect on Air Temperature:
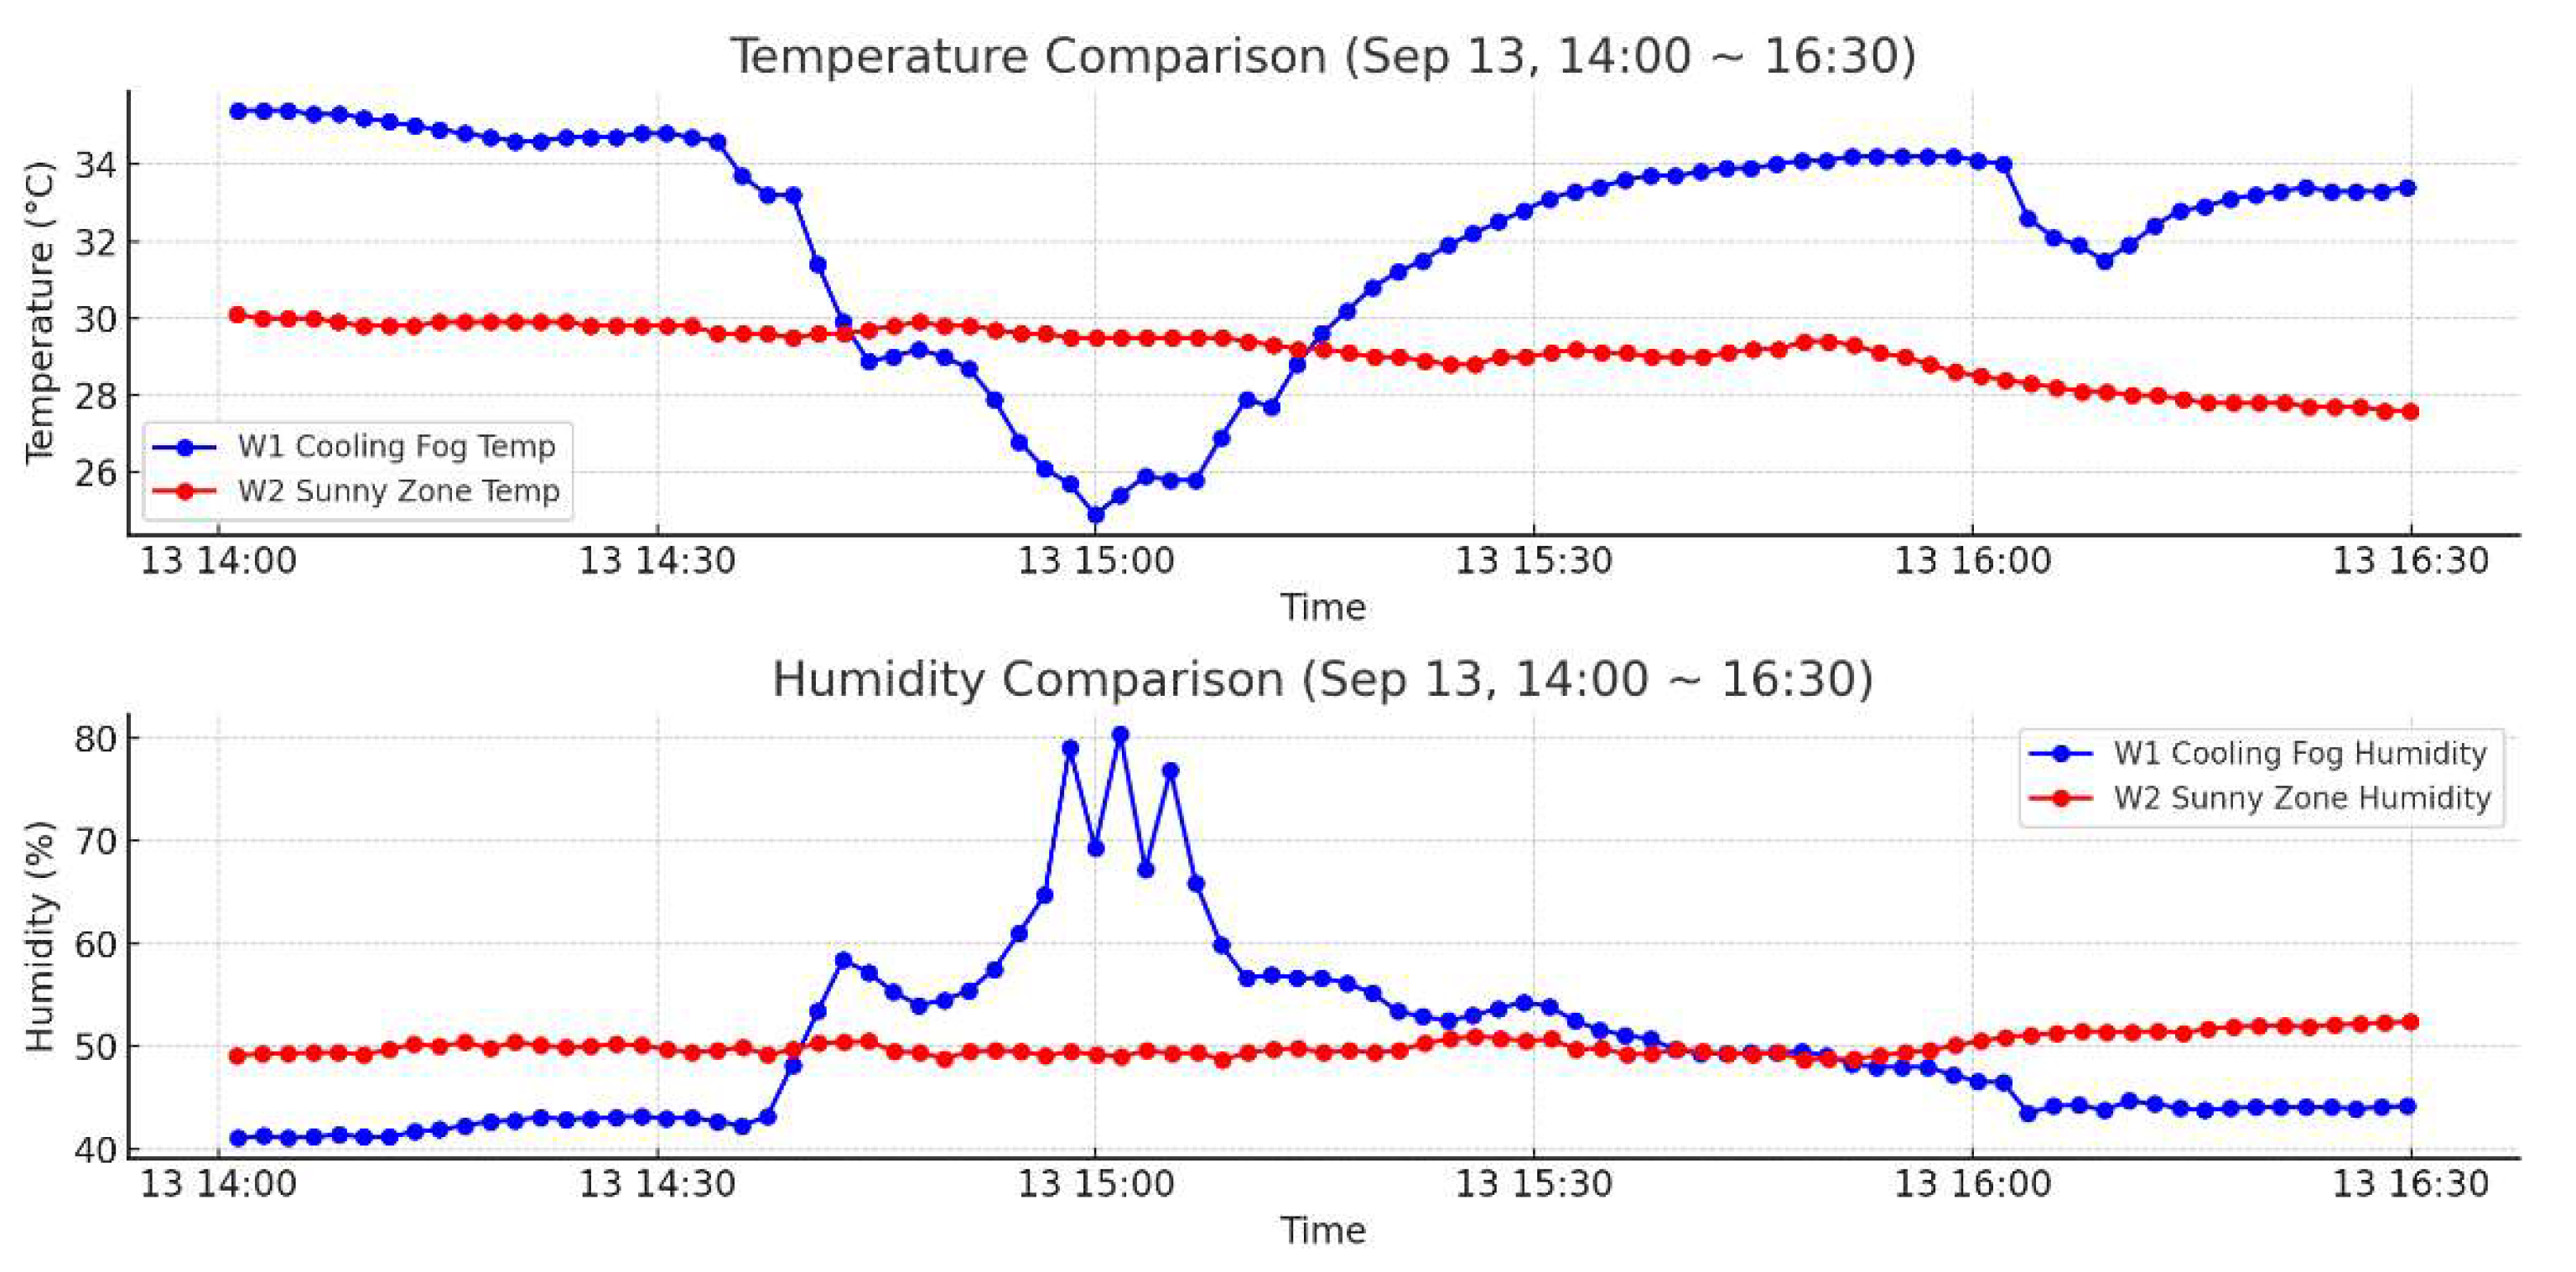
The cooling fog system deployed in Yechun-gun demonstrated a clear and immediate reduction in ambient air temperature in the playground zone where it was activated. Before activation, the temperature in the cooling fog zone (W1) remained stable at approximately 35°C, while the sunny zone (W2) showed a slightly lower temperature, averaging around 30°C. After the activation of the cooling fog system at around 14:30, the air temperature in the W1 zone dropped sharply by approximately 1.3°C within the first 30 minutes, reducing the temperature to around 28.8°C. The cooling effect continued until around 15:00, with a total temperature reduction of 3.1°C compared to the pre-activation phase.
4.2.2 Humidity Increase:
In addition to temperature reduction, the cooling fog system significantly increased the relative humidity in the cooling fog zone. Before the system's activation, the humidity in the W1 zone was stable at around 41%, similar to the humidity levels in the W2 sunny zone. Once the system was turned on, the humidity in the W1 zone rose sharply to approximately 60% during the 14:30 to 15:00 period. The maximum humidity increase observed was around 20%, while the W2 zone remained stable at around 50% humidity. This shows that the fog system not only cooled the air but also increased moisture in the environment, improving thermal comfort.
4.2.3 Cooling Efficiency Analysis:
The analysis of the temperature difference between the cooling fog zone (W1) and the sunny zone (W2) further illustrates the cooling system’s efficiency. During the activation period, the temperature difference between the two zones widened, with W1 consistently remaining cooler by approximately 3°C. After the system was turned off at 15:00, the temperature in W1 gradually increased, but the cooling effect lingered, maintaining a lower temperature compared to W2, suggesting a lasting impact even after deactivation.
The overall cooling efficiency can be summarized as:
- Pre-activation temperature difference: W1 was already cooler by approximately 1.8°C due to environmental factors.
- Post-activation cooling effect: An additional 1.3°C temperature reduction was achieved after activation, for a total cooling effect of 3.1°C.
4.2.4 Key Observations:
Temperature Reduction: The cooling fog system led to a significant temperature reduction in the W1 zone, with a total drop of up to 3.1°C during its operational window (14:30–15:00). This cooling effect was observed rapidly within minutes of activation, proving the system's immediate efficiency.
Humidity Increase: The cooling fog system increased the relative humidity in the W1 zone by approximately 20%, further enhancing the cooling sensation and improving comfort in the surrounding area.
Extended Cooling Impact: The cooling effect was sustained even after the system was turned off, as temperatures in W1 remained lower compared to W2, suggesting that the system had a residual cooling impact.
Comparison with Sunny Zone (W2): While W2 experienced a steady temperature decrease due to natural conditions, it did not benefit from the sharp reduction observed in W1, indicating that the cooling fog system was the main driver of temperature reduction in W1.
These findings confirm that the cooling fog system is an effective tool for reducing ambient air temperature and increasing humidity, especially in outdoor recreational spaces like playgrounds. This system can be particularly useful in mitigating the effects of heat during peak afternoon hours, enhancing comfort and safety for users.
Figure 10.
The temperature in the cooling fog zone (W1) dropped noticeably between 14:30 and 15:00, reflecting the cooling effect of the system, while the sunny zone temperature (W2) remained relatively stable (top side). The humidity in the cooling fog zone spiked during the same period, indicating the activation of the fog system, while humidity in the sunny zone remained constant(bottom side). These graphs demonstrate the immediate cooling and humidifying effect of the cooling fog system in the playground.
4.3. Shading Structure Results in Geyang-gu
The installation of shading structures in public spaces in Geyang-gu has shown promising results in reducing direct solar exposure and lowering air temperatures in shaded areas.
4.3.1 Shading Effect on Surface Temperature:
The installation of shading structures in the public playground of Geyang-gu had a significant effect on reducing surface temperatures in the shaded area (S1) compared to the unshaded sunny area (S2). In the early morning, surface temperatures in both zones remained relatively cool, ranging between 15°C to 20°C.
However, as sunlight exposure increased, the sunny zone (S2) experienced a sharp rise in surface temperature, peaking at approximately 55°C during midday. On the other hand, the surface temperature in the shaded zone (S1) rose more gradually, with maximum temperatures reaching around 45°C. The shading structure helped to maintain surface temperatures in S1 at a significantly lower level, especially during the hottest hours of the day. The maximum observed temperature difference between S1 and S2 was approximately 10°C.
4.3.2 Surface Temperature Reduction Efficiency:
The temperature difference between the shaded zone (S1) and the sunny zone (S2) became most pronounced during the peak sunlight hours, from approximately 12:00 PM to 3:00 PM. While the unshaded surfaces in S2 reached extreme temperatures of up to 55°C, the shaded zone (S1) remained consistently cooler by about 8°C to 10°C.
This effect demonstrates that the shading structure not only reduces direct sunlight exposure but also plays a crucial role in lowering surface temperatures, which is critical for improving the comfort and safety of users in public playgrounds and other outdoor spaces. The shading effect was most effective during midday when solar radiation was at its highest.
4.3.3 Cooling Efficiency Analysis:
The comparison of surface temperatures between the shaded zone (S1) and the sunny zone (S2) reveals the efficiency of the shading structure in mitigating heat. During peak sunlight, S2 surface temperatures spiked rapidly, while S1 surfaces increased at a much slower rate.
Throughout the day, the surface temperature difference between the two zones remained significant, particularly during the hottest parts of the day. The shaded zone (S1) consistently stayed cooler, with temperature reductions ranging from 5°C to 10°C compared to the sunny zone (S2). This difference highlights the effectiveness of the shading structure in cooling surfaces exposed to intense sunlight.
Summary of Cooling Efficiency:
- Pre-peak temperature difference: S1 was cooler by an average of 2°C to 3°C in the morning.
- Peak sunlight cooling effect: S1 surfaces were up to 10°C cooler than S2 during peak sunlight hours.
- Overall cooling efficiency: The shading structure provided a substantial cooling effect, with up to 10°C surface temperature reduction compared to unshaded surfaces.
4.3.4 Key Observations:
- Surface Temperature Reduction: The shading structure led to a notable reduction in surface temperature within the shaded zone (S1). During the hottest part of the day, the temperature in S1 was reduced by as much as 10°C compared to the sunny zone (S2), proving the structure's effectiveness in moderating surface heat.
- Sustained Cooling Impact: Even after peak sunlight hours, the cooling effect in S1 persisted. The surface temperatures in the shaded zone remained significantly lower than those in the sunny zone, indicating a lasting cooling impact provided by the shading structure.
- Comparison with Sunny Zone (S2): While the sunny zone (S2) experienced extremely high surface temperatures during midday (up to 55°C), the shaded surfaces in S1 remained much cooler. This demonstrates that shading is a critical factor in reducing surface temperatures in public spaces, making them safer and more comfortable for users.
These results confirm that shading structures can be highly effective in reducing surface temperatures in outdoor environments, particularly during the peak hours of sunlight. This has important implications for urban heat mitigation strategies, especially in spaces designed for public use, such as playgrounds and recreational areas.
Figure 11.
Surface temperature comparison between cool shadow zone(S1) and sunny zone (S2).As seen in the graph, the Sunny Zone experiences significantly higher temperature peaks compared to the Cool Shadow Zone, particularly during daytime hours. This illustrates the impact of shading structures in reducing temperature in public spaces.
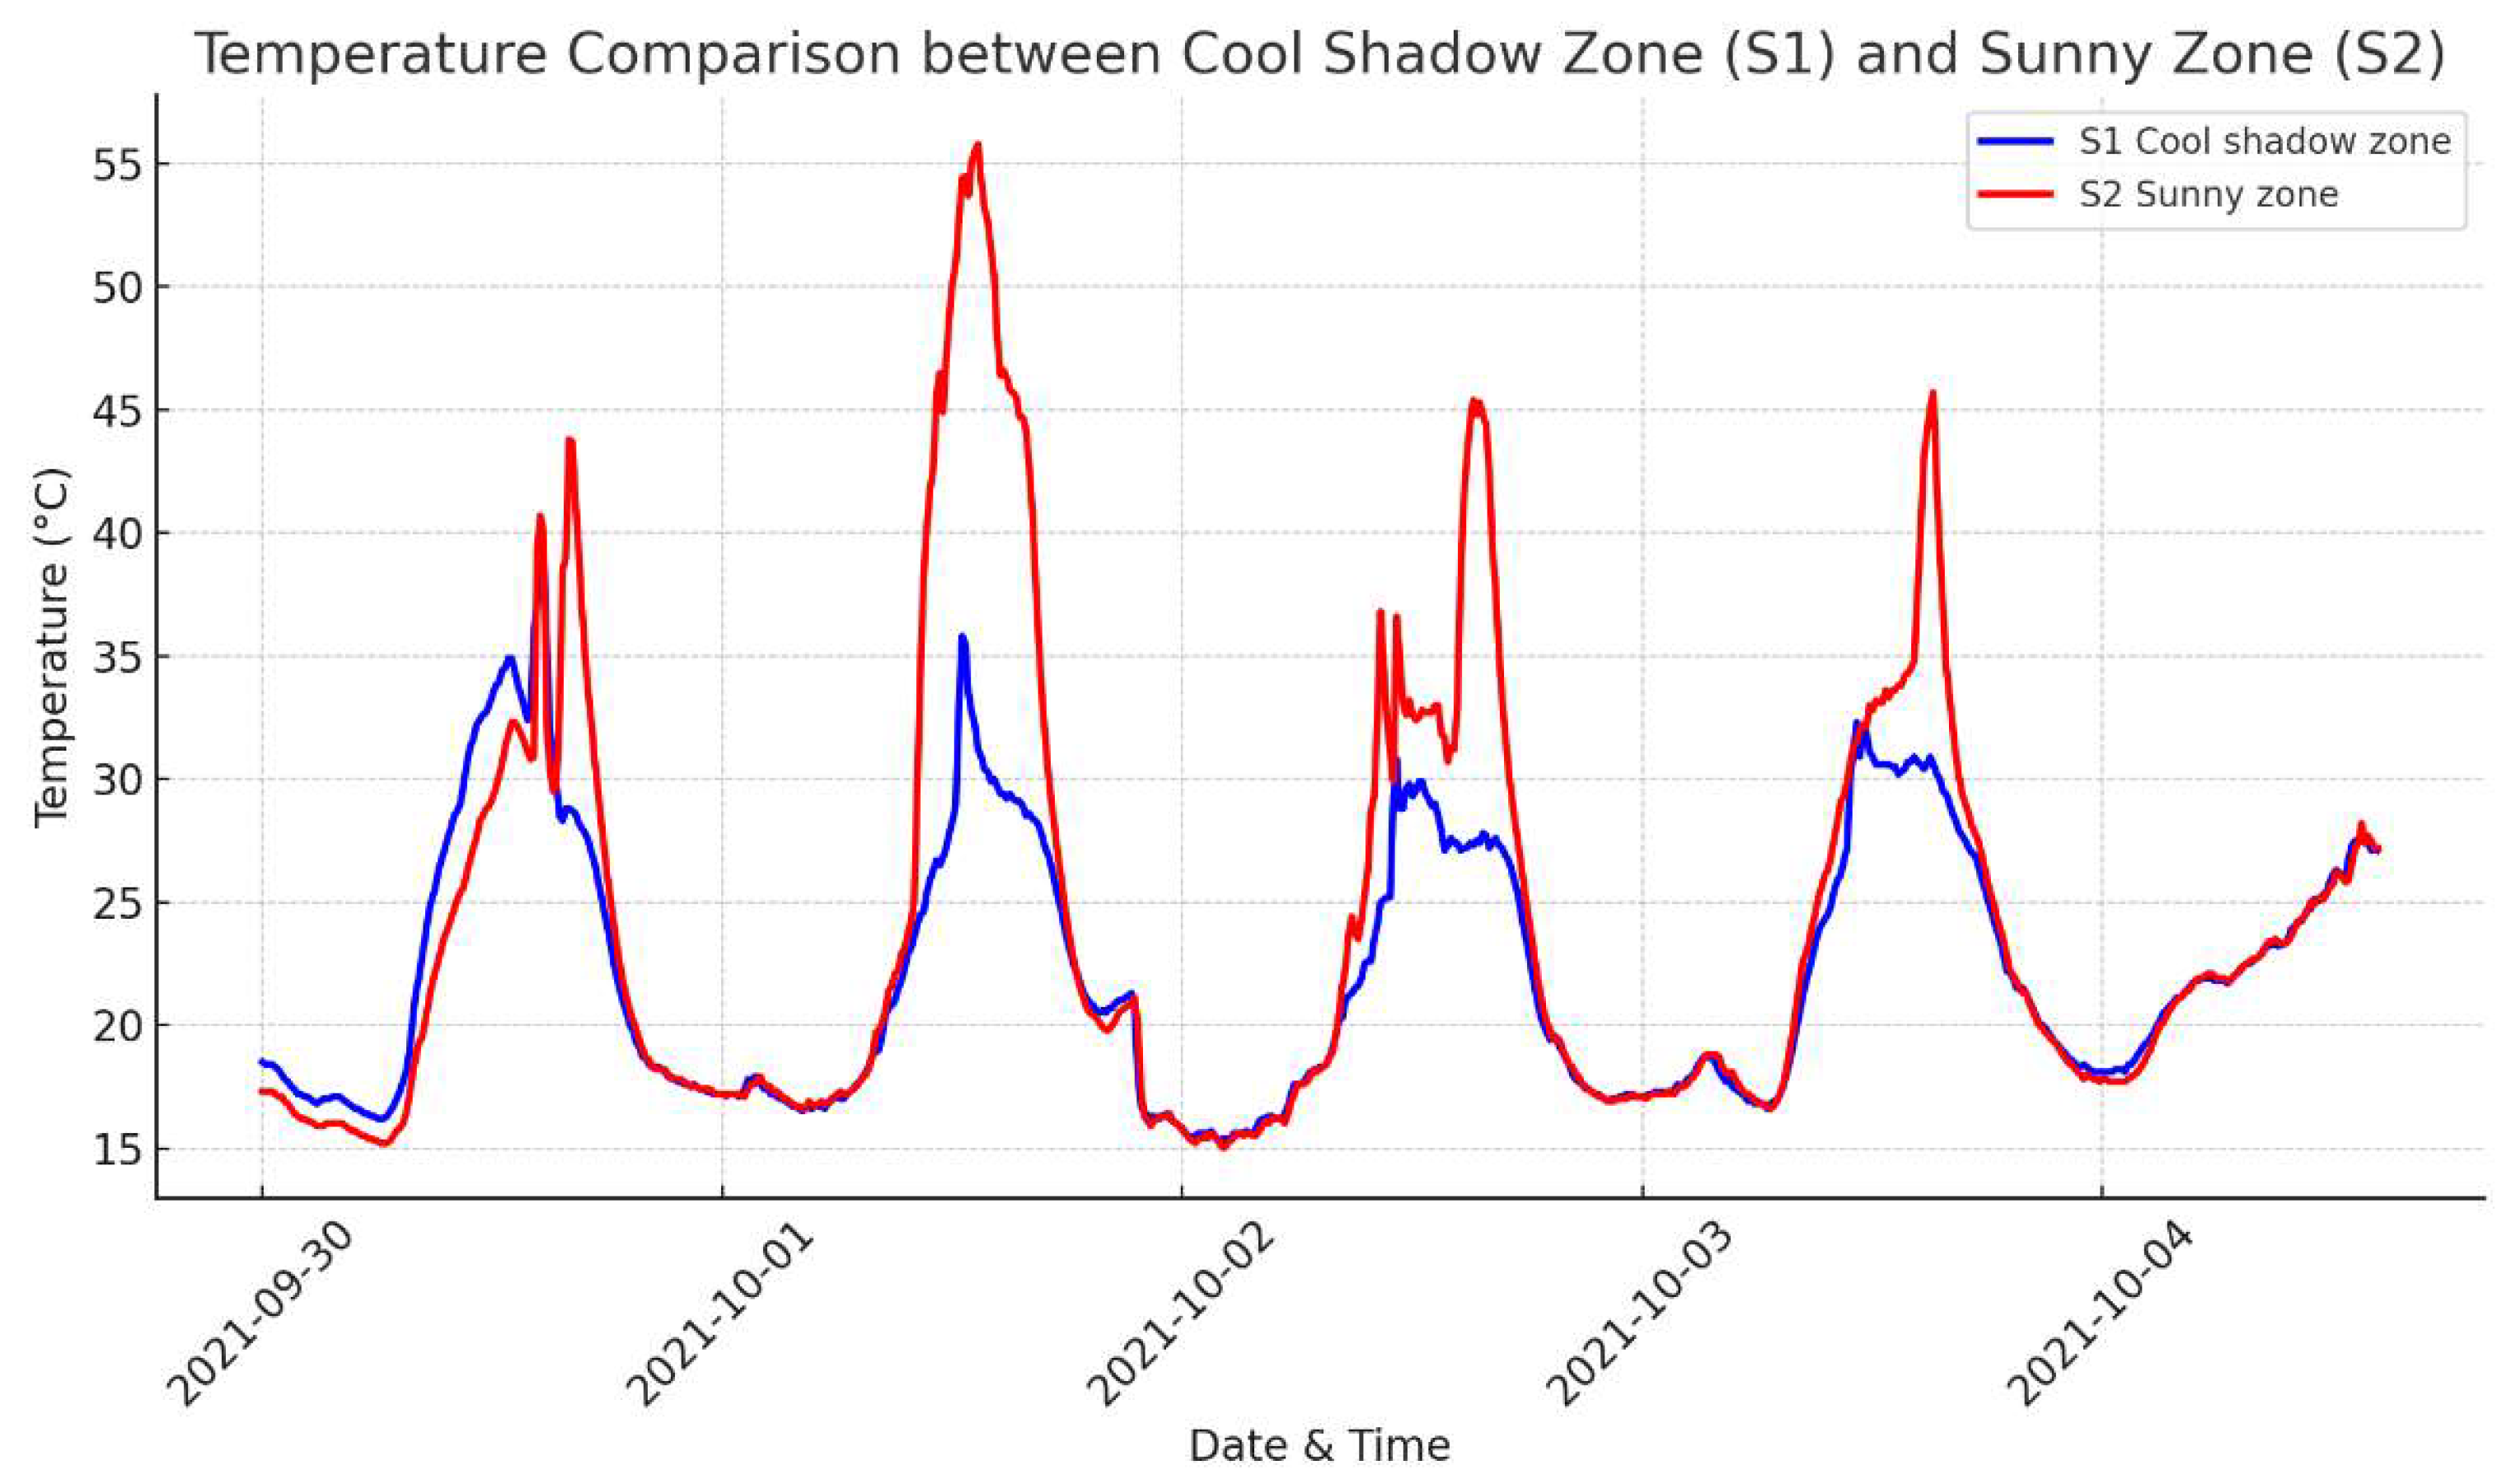
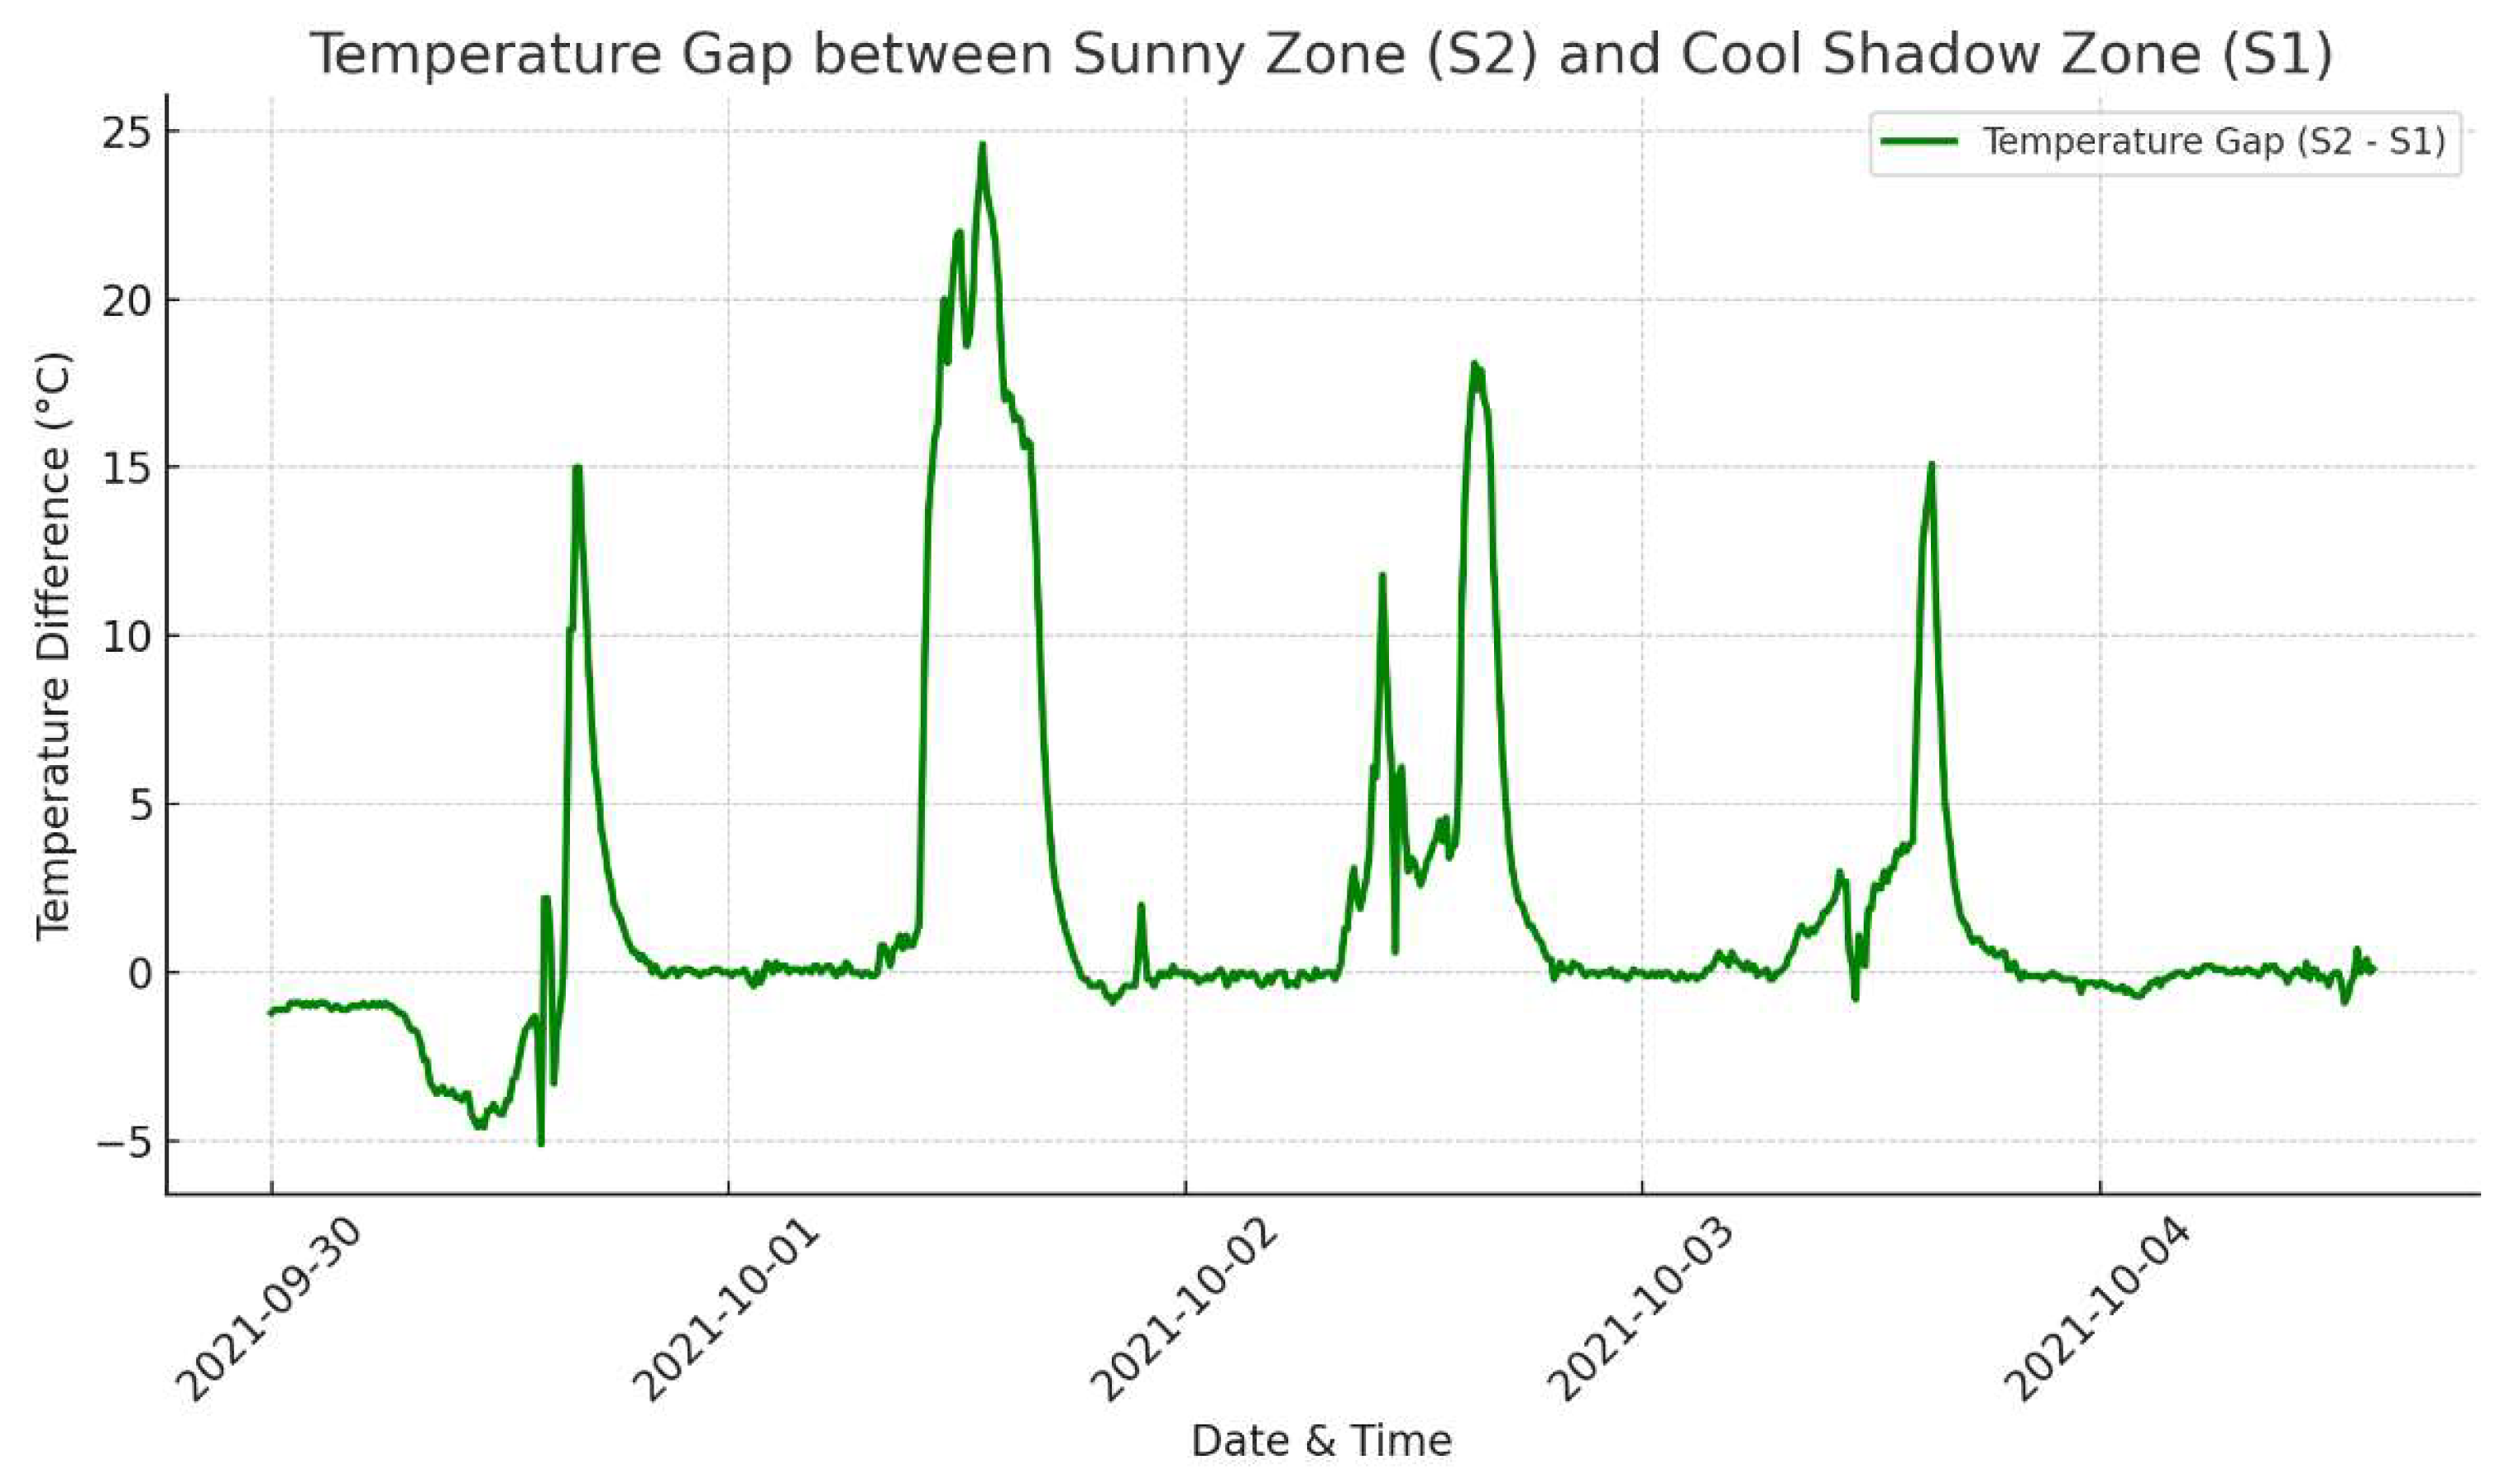
Figure 12.
The temperature gap between the Sunny Zone (S2) and the Cool Shadow Zone (S1) over time. The graph illustrates that during peak sunlight hours, the temperature difference can reach up to 25°C, with the Sunny Zone (S2) being significantly hotter than the shaded area (S1). This demonstrates the substantial cooling effect of the shading structure, particularly during the hottest parts of the day.
4.4. Small water path Results in Sangju-si
The small water path installed in Namsan Park in Sangju-si demonstrates the cooling potential of passive water features in urban parks. The waterway provided a continuous cooling effect throughout summer.
4.4.1 Small Water Path Effect on Air Temperature::
The small water path installed in Namsan Park, Sangju-si, demonstrated a continuous cooling effect on air temperature in the immediate surroundings. Before the cooling effect of the water path became noticeable, temperatures in both the water path zone (P1) and the sunny zone (P2) remained relatively close, with P1 averaging approximately 35°C and P2 at around 36°C in the early afternoon on August 6.
As the day progressed and the water path's cooling influence became more apparent, P1 began to show consistently lower temperatures compared to P2. On average, the temperature in P1 was around 0.5°C to 1°C lower than P2 during the peak daytime hours. This cooling effect was most pronounced in the late afternoon and evening, demonstrating the water path's ability to moderate air temperature, particularly during the hottest periods of the day.
4.2.2 Humidity Increase:
In addition to reducing air temperature, the presence of the small water path led to an increase in relative humidity in the surrounding area. The humidity in the water path zone (P1) remained consistently higher than the sunny zone (P2) throughout the observation period.
In the morning of August 6, the humidity in P1 and P2 was relatively close, with both zones exhibiting levels between 60% and 65%. However, as the day progressed, P1 saw a sharp rise in humidity, peaking at over 90% in the late afternoon, while P2 remained slightly lower, averaging around 85%. This increase in relative humidity around the water path indicates that the feature not only cools the surrounding air but also adds moisture, improving thermal comfort.
4.2.3 Cooling Efficiency Analysis:
The temperature difference between the small water path zone (P1) and the sunny zone (P2) highlights the cooling efficiency of passive water features. During the observation period, P1 consistently remained cooler than P2, with the most significant temperature gap occurring in the late afternoon, where P1 was up to 1.5°C cooler than P2.
This cooling effect was sustained through the evening, as the water path continued to moderate the air temperature. Even during peak heat, the presence of the water path prevented the air in P1 from rising as sharply as in P2, creating a more comfortable environment for park users.
Summary of Cooling Efficiency:
- Initial temperature difference: In the early afternoon, the temperature difference between P1 and P2 was minimal, with P1 being only about 0.5°C cooler.
- Peak cooling effect: The maximum cooling effect was observed in the late afternoon, where P1 was up to 1.5°C cooler than P2.
- Overall cooling impact: The small water path provided a consistent cooling effect, with an average temperature reduction of around 0.5°C to 1°C compared to the sunny zone.
4.2.4 Key Observations:
- Temperature Reduction: The small water path demonstrated a significant temperature reduction effect, with air temperatures in P1 being up to 1.5°C cooler than the sunny zone (P2) during peak sunlight hours. This cooling effect was sustained throughout the day, particularly in the late afternoon.
- Humidity Increase: The relative humidity in the water path zone (P1) was consistently higher than in the sunny zone (P2), with humidity levels in P1 reaching up to 90% during the hottest part of the day, compared to around 85% in P2. This indicates that the water path not only reduced air temperature but also increased moisture in the surrounding area, enhancing comfort.
- Extended Cooling Impact: The cooling effect of the water path was maintained even after peak sunlight hours, suggesting a lasting cooling impact. As temperatures in P2 began to decline naturally, P1 continued to remain slightly cooler, demonstrating the residual cooling benefit of the water path.
- Comparison with Sunny Zone (P2): While both zones experienced similar temperature trends throughout the day, P2 consistently showed higher temperatures, indicating that the small water path was the primary driver of the cooling effect in P1.
These findings confirm that passive water features, such as small water paths, are an effective tool for reducing air temperatures and increasing humidity in urban parks. These features are particularly useful for mitigating the effects of heat during peak afternoon hours, providing a more comfortable and enjoyable environment for park visitors.
Figure 13.
(a) Comparison of hourly air temperature measurements; (b) Comparison of hourly humidity measurements Here is the temperature comparison graph between the Small Water Path (P1) and the Sunny Zone (P2) from August 5 to August 8. The data indicates that the water path (P1) consistently showed lower temperatures than the sunny zone (P2), particularly during the night and early morning hours. However, during peak daylight, the temperatures of both zones remained quite close.
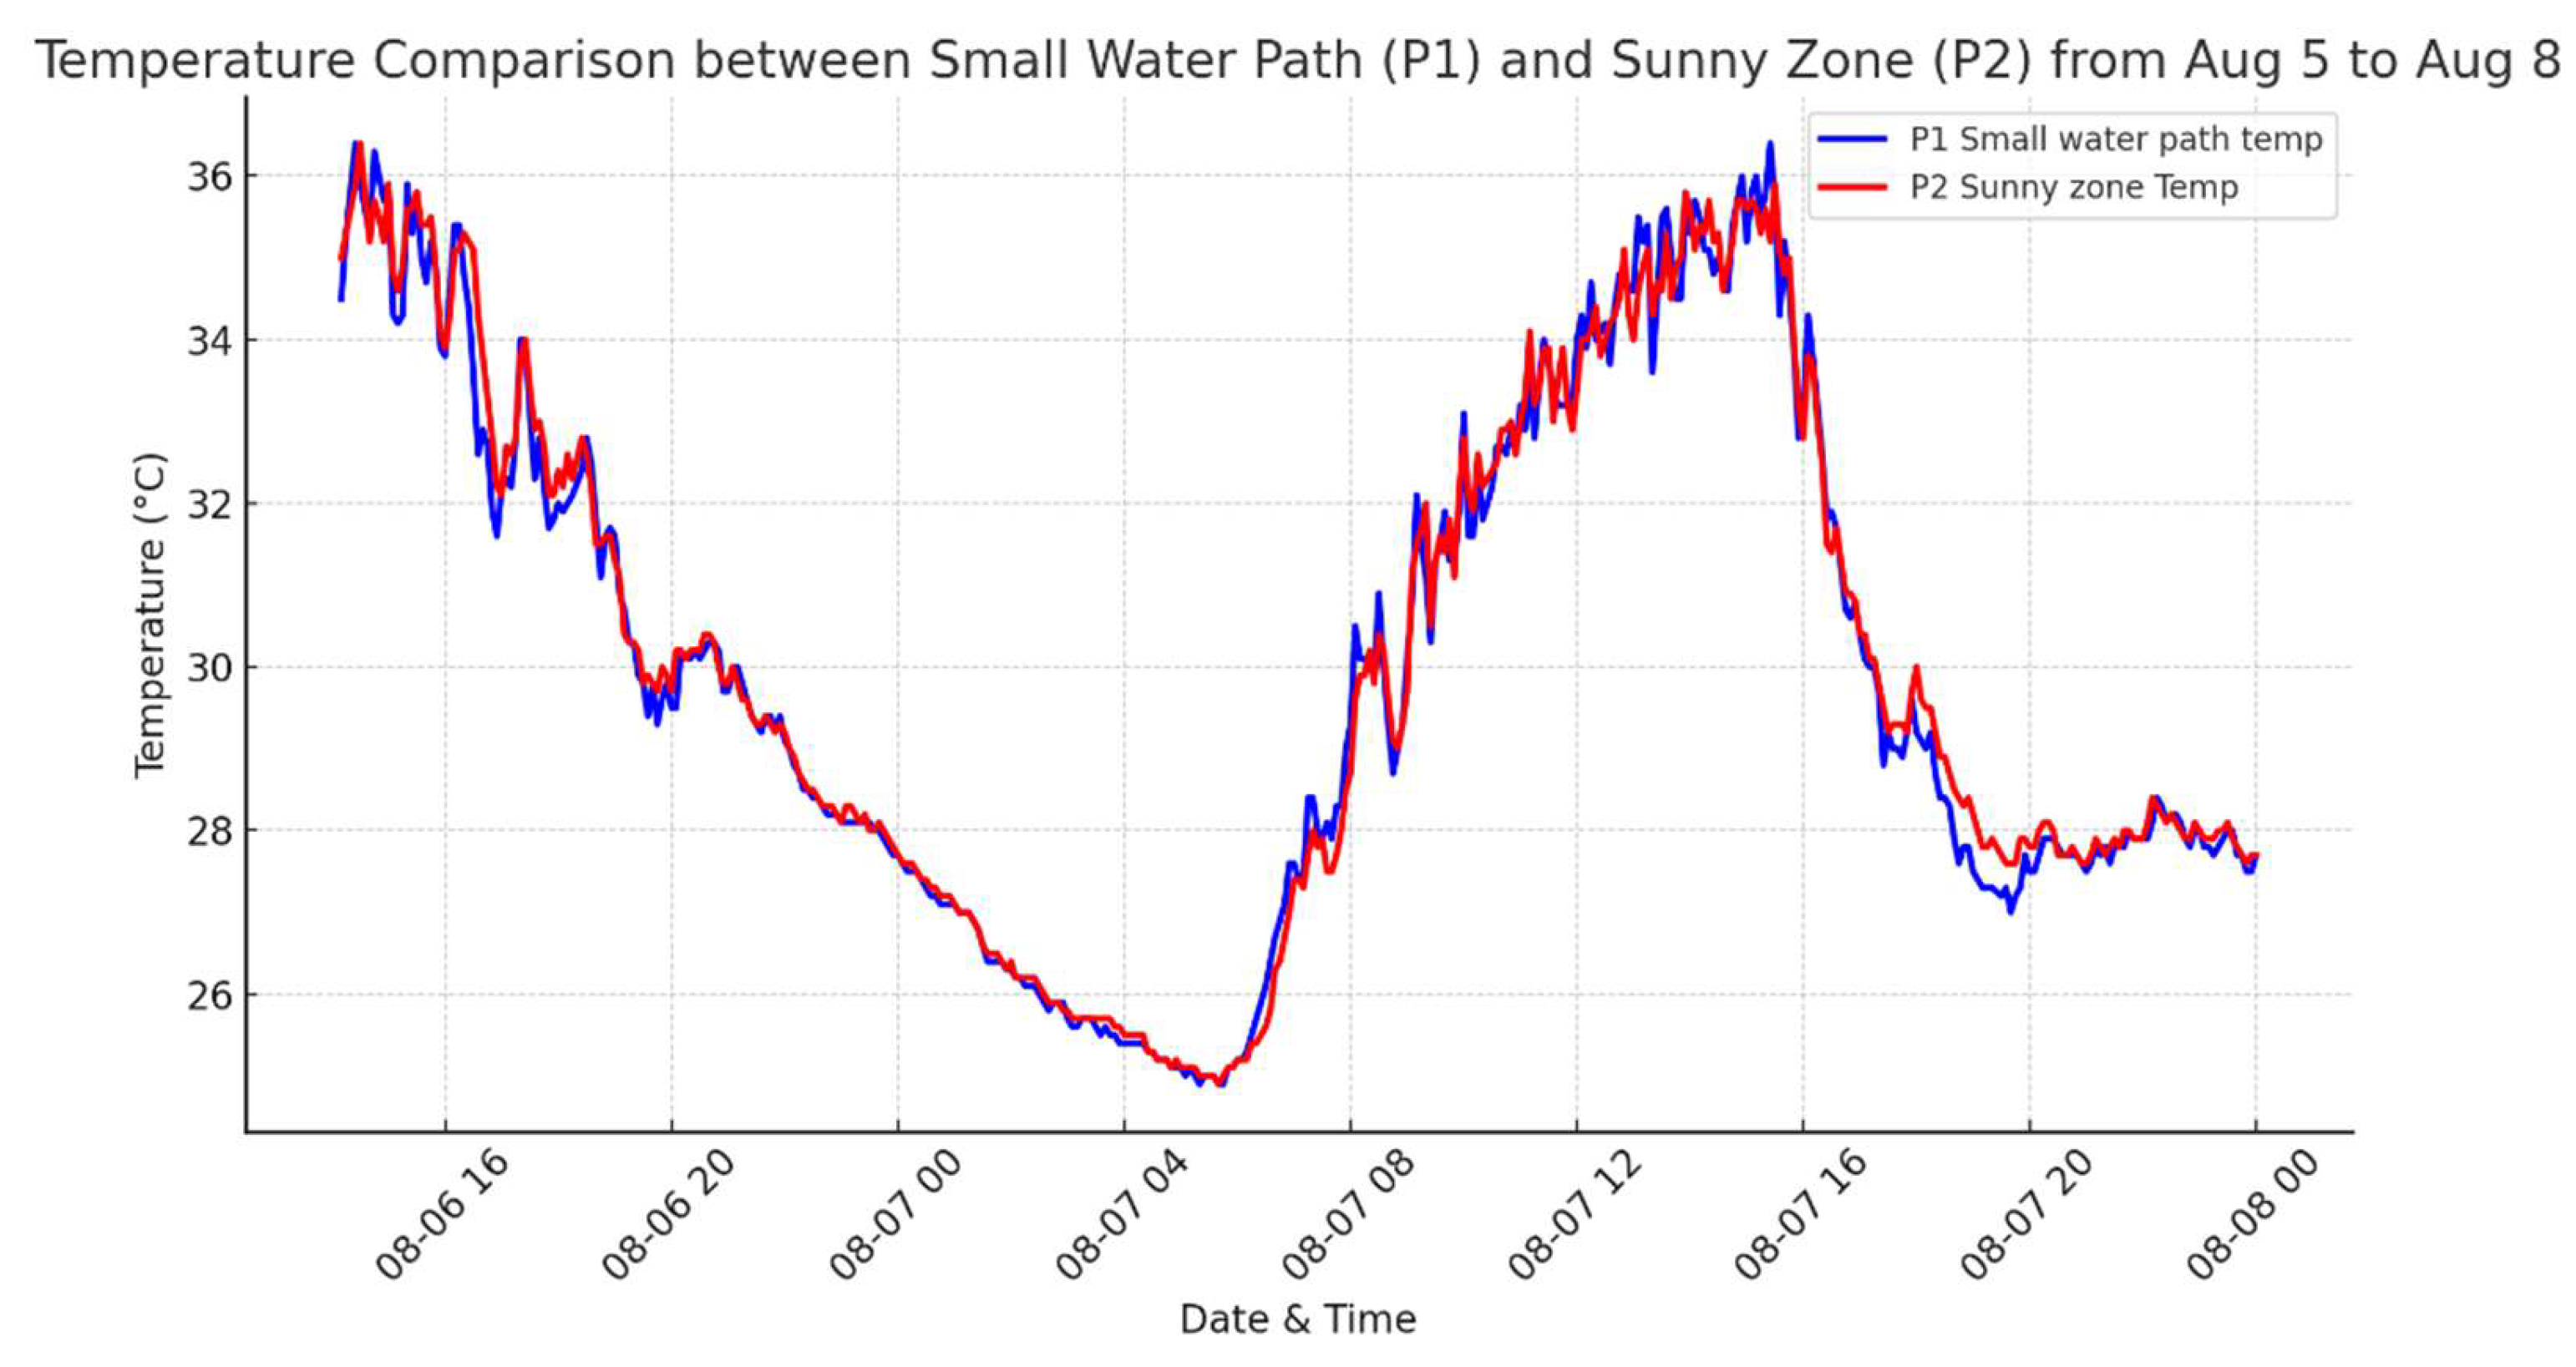
Figure 14.
The temperature gap between the Sunny Zone (P2) and the Small Water Path (P1) from August 5 to August 8. The temperature difference fluctuates throughout the day, with P2 (sunny zone) generally being slightly warmer than P1 (water path), especially during the daytime. However, there are periods where P1 is briefly warmer, possibly due to local variations in air temperature.
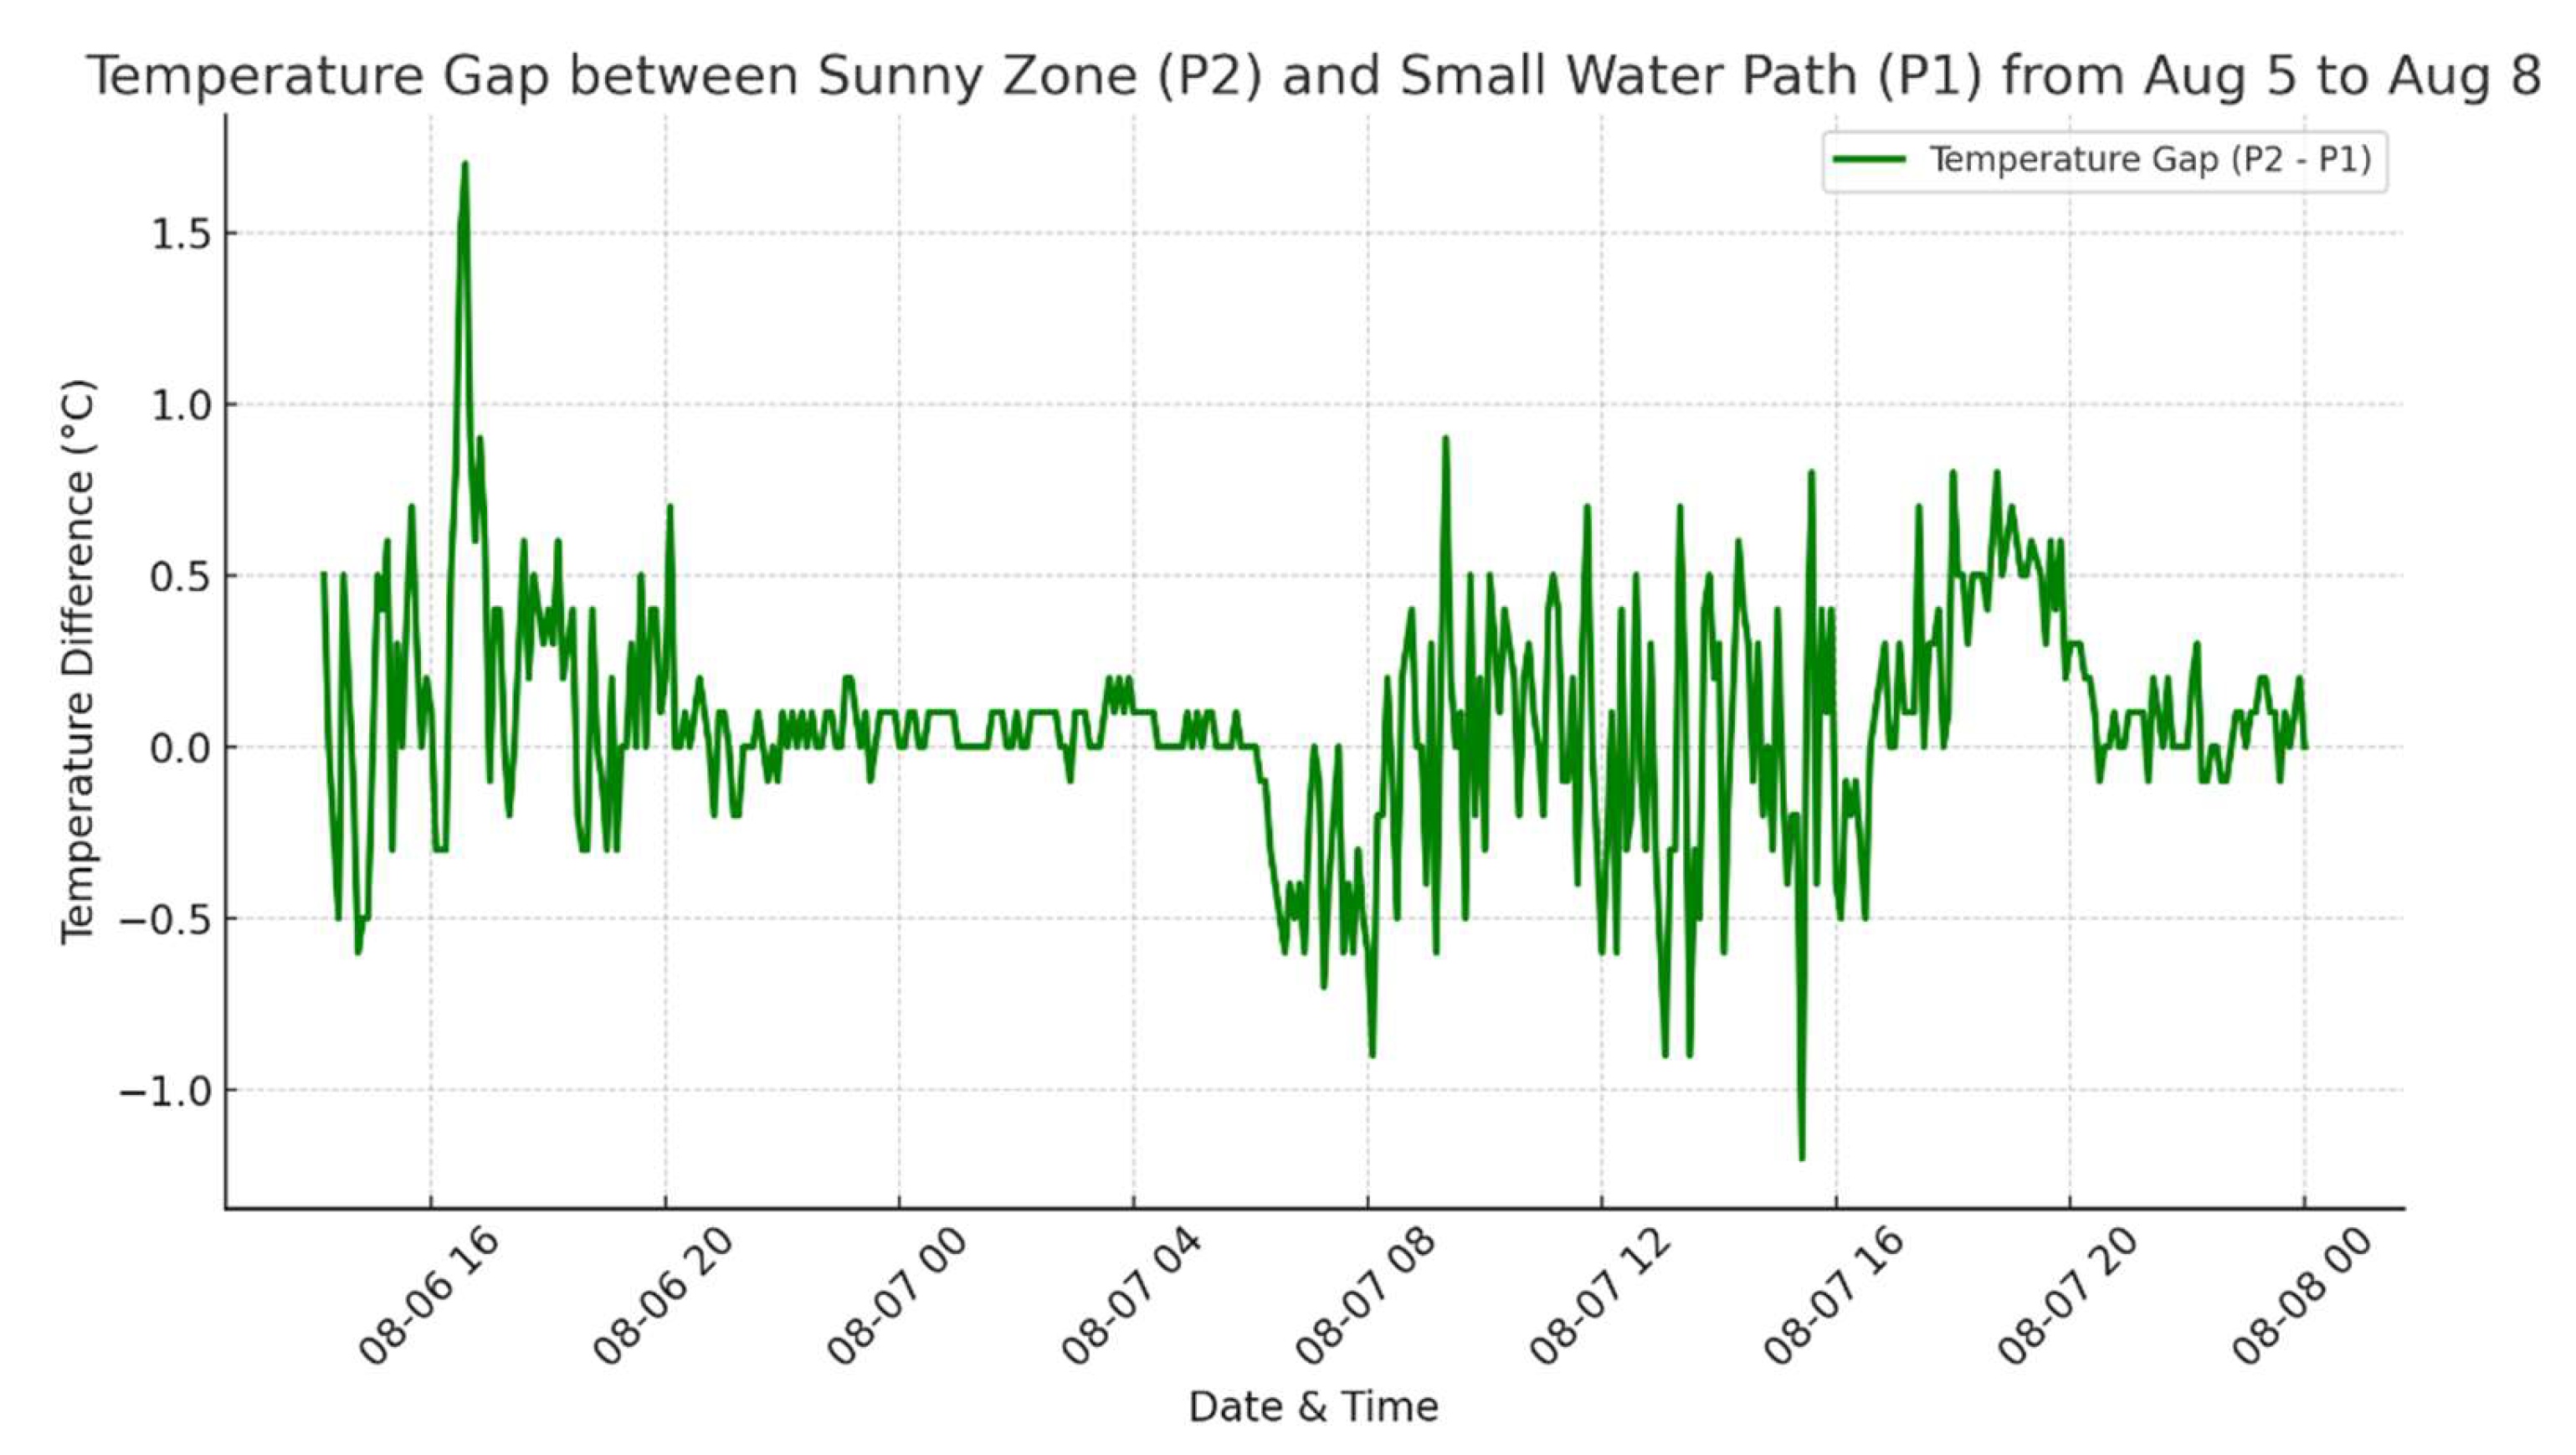
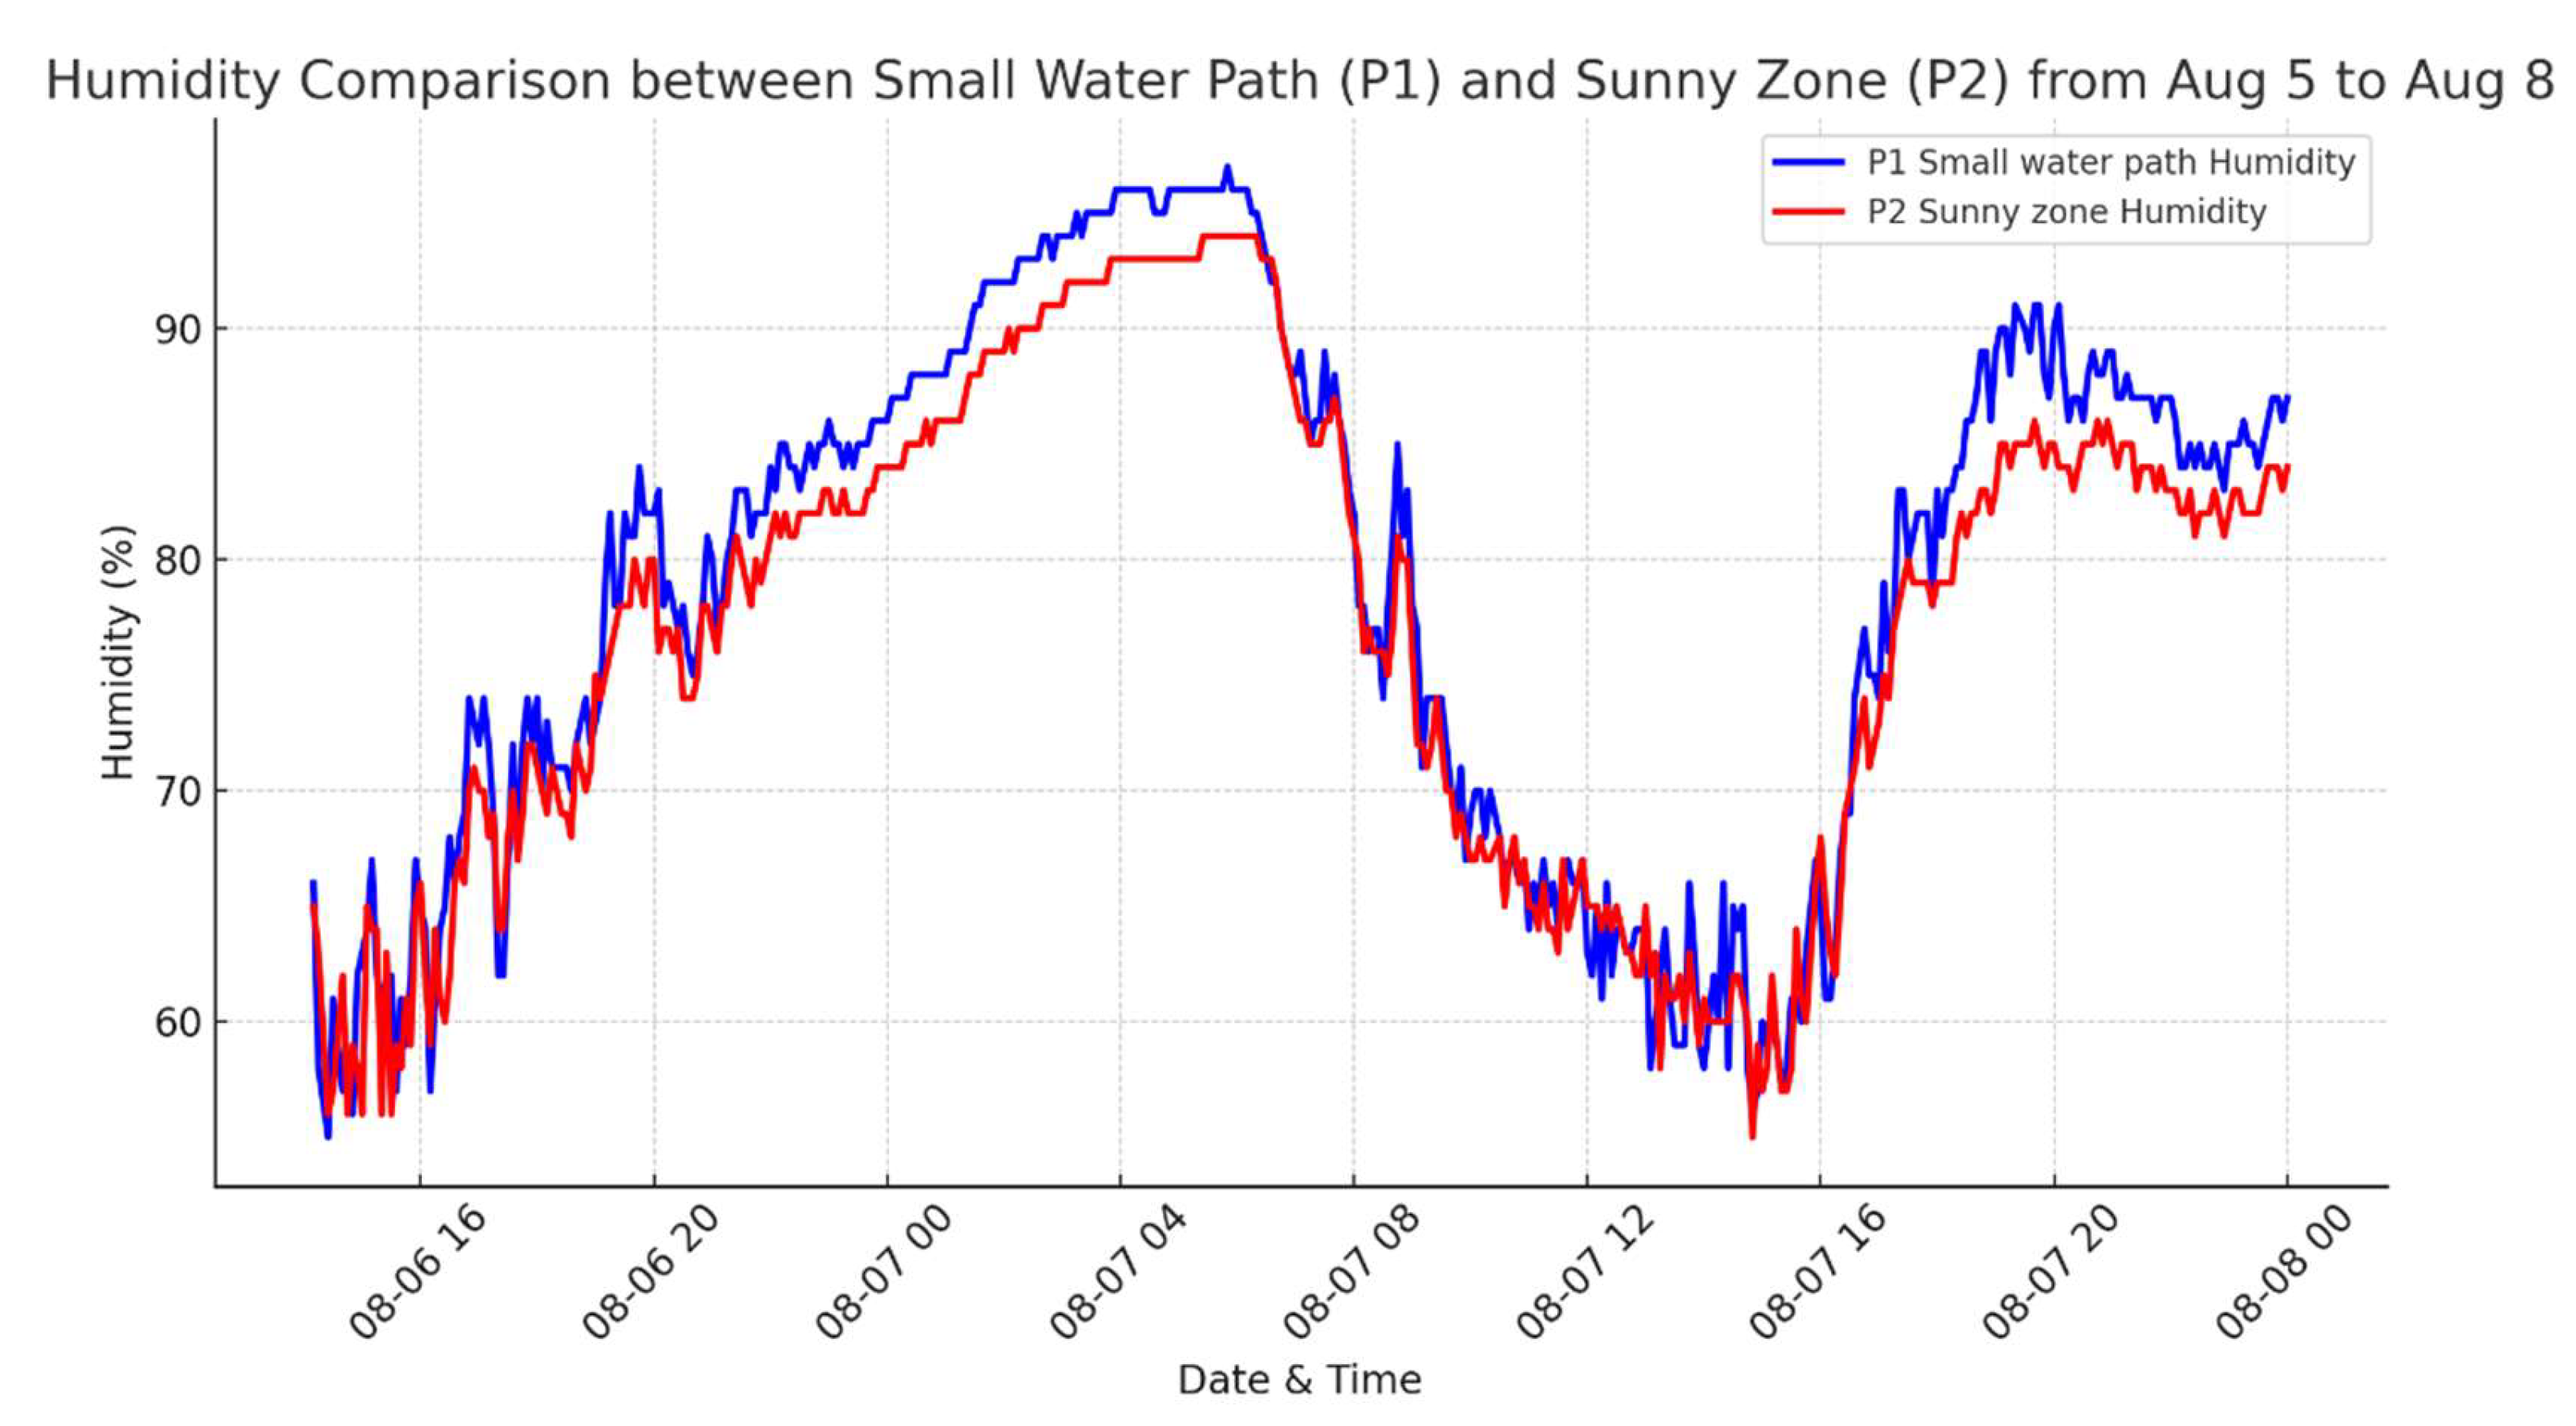
Figure 15.
Humidity comparison between the Small Water Path (P1) and the Sunny Zone (P2) from August 5 to August 8. The small water path (P1) generally has higher humidity levels compared to the sunny zone (P2), especially during the late afternoon and evening hours. This shows the cooling water path's ability to increase moisture in the air, contributing to a more comfortable environment.
4.5. Comparative Analysis of Technologies
The results demonstrated that each cooling technology provided measurable benefits in reducing temperatures and improving thermal comfort, albeit in different ways. Cooling fog and shading structures provided immediate relief in high-traffic areas, whereas cool roofs offered long-term reductions in building surface and indoor temperatures. Waterway shelters, such as the small water path, offer a steady cooling effect and enhance the aesthetic and psychological experiences in urban parks.
- Temperature Reduction Comparison.
Cool Roof + Cool Wall: Combined treatments showed a 2-3°C reduction in surface temperature during peak hours, providing the greatest cooling effect on both air and surface temperatures. Shading Structures: 2.5°C reduction in air temperature, with a 50% reduction in solar radiation.
Cool Wall: A 1-2°C reduction in surface temperature, demonstrating that reflective walls are effective, but less so compared to when both roofs and walls are treated.
Cooling Fog: Showed an up to 3.1°C reduction in ambient air temperature during its operational window, making it highly effective for immediate cooling in high-traffic outdoor areas.
Shading Structures: Reduced surface temperatures by up to 10°C during peak sunlight hours, demonstrating significant cooling potential for public playgrounds and parks.
Small Water Path: Provided a 1.5°C reduction in air temperature during peak sunlight hours, with an additional benefit of increased humidity levels that enhanced thermal comfort
- Thermal Comfort and User Feedback:
All technologies contributed to significant improvements in thermal comfort. Cooling fog was particularly effective in outdoor high-traffic areas, while shading structures and small water paths were well-received in parks and public spaces. Cool roofs and walls helped to mitigate heat in and around buildings, contributing to both indoor comfort and energy savings.
These results suggest that a combination of cooling fog, shading structures, and cool roofs could be the most effective solution for mitigating heat stress in urban environments, particularly for vulnerable populations. Small water paths, while offering less dramatic temperature reductions than cooling fog, provide steady, passive cooling solutions that are aesthetically pleasing and were well-received by park visitors.
Table 7.
Cooling solutions, their effectiveness in reducing temperatures, and key observations.
| Cooling Solution | Temperature Reduction | Key Observation | Measurement Period |
|---|---|---|---|
| Cool Roof + Cool Wall | 2-3°C during peak hours | Combining both cool roof and cool walls showed the best reduction in surface and air temperatures. | 27 Aug. 2021 - 1 Sep. 2021 |
| Cool Wall | 1-2°C compared to non-applied surfaces | Effective for reducing wall temperatures but less effective compared to combined treatments. | 27 Aug. 2021 - 1 Sep. 2021 |
| Cooling Fog System | Up to 3.1°C during operational window | Immediate reduction of ambient air temperature after system activation. | 13 Sep. 2021 (2:00 PM – 4:30 PM) |
| Shading Structure | Up to 10°C during peak sunlight | Consistent cooling effect, especially during the hottest part of the day. | 30 Sep. 2021 - 4 Oct. 2021 |
| Small Water Path | Up to 1.5°C during peak sunlight | Moderate temperature reduction with increased humidity levels in the surrounding area.1 | 5 Aug. 2023 - 8 Aug. 2023 |
5. Conclusion and Recommendations
5.1. Conclusion
This study evaluates the performance of several urban heat mitigation technologies, including cooling fog systems, cool roofs (reflective paint), shading structures, and small water paths, with a focus on improving the thermal comfort of vulnerable populations. Field tests, conducted from 2021 to 2023 in collaboration with the Korean Ministry of Environment, demonstrated that each technology has unique strengths in reducing surface and ambient temperatures, improving thermal comfort, and contributing to energy savings.
- Cooling Fog was one of the most effective solutions for providing immediate temperature reductions in high-traffic outdoor areas, reducing ambient temperatures by up to 3.1°C during operational periods, which greatly improved perceived comfort.
- Cool Roofs (Reflective Paint) offered significant reductions in both surface and indoor temperatures, contributing to long-term energy savings. Buildings treated with reflective coatings experienced surface temperature reductions of 2-3°C.
- Shading Structures provided a low-maintenance solution for mitigating solar exposure and improving thermal comfort in outdoor public spaces. Surface temperature reductions of up to 10°C were recorded in shaded areas, particularly during peak sunlight hours.
- Waterway Shelters offered steady passive cooling, with air temperature reductions of up to 1.5°C and humidity increases that enhanced thermal comfort for park visitors. This cooling effect was particularly noticeable in the late afternoon and evening hours.
The results suggest that a combination of these technologies can effectively mitigate heat stress in urban environments, especially for vulnerable populations such as the elderly, children, and individuals with health conditions. By integrating active cooling technologies (such as cooling fog systems) with passive solutions (such as shading structures, cool roofs, and small water paths), cities can create more thermally comfortable and sustainable environments.
5.2. Recommendations
Based on the findings of this study, the following recommendations are proposed for urban planners, policymakers, and local governments seeking to implement effective heat-mitigation strategies:
- 1.
- Adopt a Holistic Approach to Urban Heat Mitigation
Cities should integrate both active and passive cooling technologies to address heat stress across a variety of environments. Cooling fog systems should be installed in high-traffic areas such as playgrounds, public squares, and transport hubs, whereas cool roofs and shading structures should be prioritized in areas where long-term energy savings and comfort are needed. Small water paths can be incorporated into parks and recreational spaces to provide passive cooling and enhance the aesthetic value of urban areas.
- 2.
- Prioritize Vulnerable Populations in Heat Mitigation Efforts
Urban heat mitigation strategies should prioritize the protection of vulnerable populations, including the elderly, children, and low-income communities, who are disproportionately affected by extreme heat. The Korean Ministry of Environment’s initiative to fund and implement heat mitigation technologies in cities such as Yechun-gun and Sangju-si serves as a model for how local governments can support vulnerable groups through targeted interventions. Similar projects should be replicated in other regions to ensure that urban populations are protected from the adverse effects of climate change and heat waves.
- 3.
- Incorporate Heat Mitigation into Urban Planning Policies
Urban planning policies should incorporate heat-mitigation measures as part of broader climate adaptation strategies. Local governments should mandate the use of cool roofs in new buildings, particularly in dense urban areas, and encourage the adoption of shading structures in public spaces. Additionally, small water paths and green infrastructure should be integrated into the design of parks and public spaces to provide passive cooling solutions that are both sustainable and aesthetically pleasing.
- 4.
- Monitor and Evaluate the Effectiveness of Cooling Technologies
Continuous monitoring and evaluation of cooling technologies are essential to ensure their long-term effectiveness. Data collected through IoT-based sensors and user feedback should be analyzed regularly to assess the performance of cooling systems and identify areas for improvement. Policymakers should allocate resources for ongoing research and development of heat mitigation technologies, with a focus on optimizing their effectiveness under different environmental conditions.
- 5.
- Collaborate with International Cities to Share Best Practices
Given the global nature of climate change, international collaboration between cities is crucial for sharing best practices and lessons learned from heat-mitigation projects. The successful implementation of heat mitigation technologies in Korea’s urban centers can serve as a valuable reference for other cities worldwide. Local governments should seek opportunities to collaborate with international partners to exchange knowledge, develop innovative solutions, and improve their resilience to extreme heat.
5.3. Future Research
While this study provides valuable insights into the effectiveness of various cooling technologies, further research is needed to explore the long-term impacts of these interventions under changing climate conditions. Future studies should focus on the following aspects.
- Long-term Monitoring: The monitoring period should be extended to assess the year-round performance of cooling technologies and their effectiveness under different seasonal conditions.
- Cost–benefit Analysis: Future studies should conduct detailed cost-benefit analyses of cooling technologies to determine the most cost-effective solutions for urban areas with varying budget constraints.
- Integration of Green Infrastructure: Research should explore how cooling technologies can be combined with green infrastructure (e.g., urban forests and green roofs) to maximize their cooling potential while enhancing biodiversity and environmental sustainability.
Author Contributions
Conceptualization, Y.S. and T.K.; methodology, T.H. and T.K..; software, T.K.; validation, T.K..; formal analysis, T.K.; investigation, T.H.; resources, T.H. ; data curation, T.K..; writing—original draft preparation, T.K.; writing—review and editing, Y.S. and T.K.; visualization, T.K.; supervision, T.K. and T.H. All authors have read and agreed to the published version of the manuscript.
Funding
This research was funded by the supporting project for climate-vulnerable groups and regions conducted by Korea Environment Institute (2024-001-03)
Data Availability Statement
Not applicable
Acknowledgement
This paper is modified based on the findings of the supporting project for climate-vulnerable groups and regions conducted by Korea Environment Institute (2023-001-03) (2021-001-05)
Conflicts of Interest
The authors declare there are no conflicts of interest
References
- LEAL FILHO, W.; Karimi, A.; Mohajerani, A.; Jeffrey-Bailey, T. Addressing the Urban Heat Island Effect: A Cross-Country Assessment of the Role of Green Infrastructure. Sustainability 2021, 13, 753. [Google Scholar] [CrossRef]
- Karimi, A.; Mohajerani, A.; Jeffrey-Bailey, T. New Developments and Future Challenges in Reducing and Controlling Heat Island Effect in Urban Areas. Environment, Development and Sustainability 2023, 25, 10485–10531. [Google Scholar] [CrossRef]
- Mohajerani, A.; Bakaric, J.; Jeffrey-Bailey, T. The Urban Heat Island Effect, Its Causes, and Mitigation, with Reference to the Thermal Properties of Asphalt Concrete. Journal of Environmental Management 2017, 197, 522–538. [Google Scholar] [CrossRef]
- Almusaed, A.; Almusaed, A. The Urban Heat Island Phenomenon upon Urban Components. In Biophilic and Bioclimatic Architecture: Analytical Therapy for the Next Generation of Passive Sustainable Architecture; Springer, 2011; pp. 139–150.
- Santamouris, M. Recent Progress on Urban Overheating and Heat Island Research: Integrated Assessment of the Energy, Environmental, Vulnerability, and Health Impact. Synergies with the Global Climate Change. Energy and Buildings 2020, 207, 109482. [Google Scholar] [CrossRef]
- Singh, N.; Singh, S.; Mall, R.K. Urban Ecology and Human Health: Implications of Urban Heat Island, Air Pollution, and Climate Change Nexus. In Urban Ecology; Elsevier, 2020; pp. 317–334.
- Harlan, S.L.; Ruddell, D.M. Climate Change and Health in Cities: Impacts of Heat and Air Pollution and Potential Co-Benefits from Mitigation and Adaptation. Current Opinion in Environmental Sustainability 2011, 3, 126–134. [Google Scholar] [CrossRef]
- Heisler, G.M.; Brazel, A.J. The Urban Physical Environment: Temperature and Urban Heat Islands. Urban Ecosystem Ecology 2010, 55, 29–56. [Google Scholar]
- Bayram, H.; et al. Impact of Global Climate Change on Pulmonary Health: Susceptible and Vulnerable Populations. Annals of the American Thoracic Society 2023, 20, 1088–1095. [Google Scholar] [CrossRef]
- Leap, S.R.; et al. Effects of Extreme Weather on Health in Underserved Communities. Annals of Allergy, Asthma & Immunology.
- Nasrollahi, N.; et al. Heat-Mitigation Strategies to Improve Pedestrian Thermal Comfort in Urban Environments: A Review. Sustainability 2020, 12, 10000. [Google Scholar] [CrossRef]
- Pisello, A.L.; et al. Facing the Urban Overheating: Recent Developments, Mitigation Potential, and Sensitivity of the Main Technologies. Wiley Interdisciplinary Reviews: Energy and Environment 2018, 7, e294. [Google Scholar] [CrossRef]
- Kwon, T.; Jo, H.; Lim, Y. Research on the Development of Simulation Equipment for Measuring the Effect of Urban Shade Structures. Journal of Environmental Technology 2022, 23, 169–176. [Google Scholar]
- Kwon, T.; et al. Analysis of the Effectiveness of a Heat Insulation Project Supporting Vulnerable Populations Through IoT Monitoring Systems: A Case Study of Residential Areas in Jinyeong-eup, Gimhae-si. Journal of Climate Change Research 2022, 13, 383–398. [Google Scholar] [CrossRef]
- Keim, M.E. Preventing Disasters: Public Health Vulnerability Reduction as a Sustainable Adaptation to Climate Change. Disaster Medicine and Public Health Preparedness 2011, 5, 140–148. [Google Scholar] [CrossRef] [PubMed]
- Santamouris, M. Cooling the Cities: A Review of Reflective and Green Roof Mitigation Technologies to Fight Heat Island and Improve Comfort in Urban Environments. Solar Energy 2014, 103, 682–703. [Google Scholar] [CrossRef]
- Lee, Y.Y.; et al. Overview of Urban Heat Island (UHI) Phenomenon Towards Human Thermal Comfort. Environmental Engineering & Management Journal 2017, 16. [Google Scholar]
- Cotrim Pezzuto, C.; Alchapar, N.L.; Correa Cantaloube, E.N. Urban Cooling Technologies Potential in High and Low Building Densities. Sustainability 2022, 14, 2301. [Google Scholar]
- Monge-Barrio, A.; Gutiérrez, A. S.-O. Passive Energy Strategies for Mediterranean Residential Buildings: Facing the Challenges of Climate Change and Vulnerable Populations; Springer: Cham, Switzerland, 2018. [Google Scholar]
- Bom, G. J. (Ed.) . Evaporative Air-Conditioning: Applications for Environmentally Friendly Cooling; World Bank Publications: Washington, DC, 1999. [Google Scholar]
- Saleh, A.; Al-Nimr, M.A. The Effectiveness of Multi-Stage Dehumidification–Humidification for Improving the Cooling Ability of Evaporative Air Conditioning. Proceedings of the Institution of Mechanical Engineers, Part A: Journal of Power and Energy 2009, 223, 11–20. [Google Scholar] [CrossRef]
- Rawat, M.; Singh, R.N. A Study on the Comparative Review of Cool Roof Thermal Performance in Various Regions. Energy and Built Environment 2022, 3, 327–347. [Google Scholar] [CrossRef]
- Zinzi, M.; Fasano, G. Properties and Performance of Advanced Reflective Paints to Reduce the Cooling Loads in Buildings and Mitigate the Heat Island Effect in Urban Areas. International Journal of Sustainable Energy 2009, 28, 123–129. [Google Scholar] [CrossRef]
- Minangi, F.S.; Alibaba, H.Z. Effect of Shading on Thermal Performance of Dormitory Building in Hot Climate. International Journal of Interdisciplinary Research and Innovation 2018, 6, 610–621. [Google Scholar]
- Shrestha, S. Fixed External Shading and Daylight Quality: Four Case Studies. MS Thesis, Kansas State University, 2016.
- Santamouris, M.; Synnefa, A.; Karlessi, T. Using Advanced Cool Materials in the Urban Built Environment to Mitigate Heat Islands and Improve Thermal Comfort Conditions. Solar Energy 2011, 85, 3085–3102. [Google Scholar] [CrossRef]
- Akbari, H.; Pomerantz, M.; Taha, H. Cool surfaces and shade trees to reduce energy use and improve air quality in urban areas. Solar Energy 2001, 70, 295–310. [Google Scholar] [CrossRef]
- Mayer, H.; Ali-Toudert, F. Effects of street design on outdoor thermal comfort. Landscape, Environment and Society 2006, 45.
- Levinson, R.; Akbari, H. Potential Benefits of Cool Roofs on Commercial Buildings: Conserving Energy, Saving Money, and Reducing Emissions of Greenhouse Gases and Air Pollutants. Energy Efficiency 2010, 3, 53–61. [Google Scholar] [CrossRef]
- Khalili, S.; Fayaz, R.; Zolfaghari, S.A. Analyzing Outdoor Thermal Comfort Conditions in a University Campus in Hot-Arid Climate: A Case Study in Birjand, Iran. Urban Climate 2022, 43, 101128. [Google Scholar] [CrossRef]
- Lin, J.; Brown, R.D. Integrating Microclimate into Landscape Architecture for Outdoor Thermal Comfort: A Systematic Review. Land 2021, 10, 196. [Google Scholar] [CrossRef]
- Bowler, D.E.; Buyung-Ali, L.; Knight, T.M.; Pullin, A.S. Urban Greening to Cool Towns and Cities: A Systematic Review of the Empirical Evidence. Landscape and Urban Planning 2010, 97, 147–155. [Google Scholar] [CrossRef]
- Gunawardena, K.R.; Wells, M.J.; Kershaw, T. Utilising Green and Bluespace to Mitigate Urban Heat Island Intensity. Science of the Total Environment 2017, 584, 1040–1055. [Google Scholar] [CrossRef]
- Kim, D.; Kang, J.E. Integrating Climate Change Adaptation into Community Planning Using a Participatory Process: The Case of Saebat Maeul Community in Busan, Korea. Environment and Planning B: Urban Analytics and City Science 2018, 45, 669–690. [Google Scholar] [CrossRef]
- Lee, J.S.; Kim, J.W. Assessing Strategies for Urban Climate Change Adaptation: The Case of Six Metropolitan Cities in South Korea. Sustainability 2018, 10, 2065. [Google Scholar] [CrossRef]
- Kim, J.; Jung, T.Y. Assessing Health Sector Climate Vulnerability in 226 Local Entities of South Korea Based on Principal Component Analysis. Urban Climate 2023, 49, 101521. [Google Scholar] [CrossRef]
- Masson-Delmotte, V.P.; et al. Summary for Policymakers. In Climate Change 2021: The Physical Science Basis. Contribution of Working Group I to the Sixth Assessment Report of the Intergovernmental Panel on Climate Change; IPCC, Geneva, Switzerland, 2021.
- Hong, J.W.; et al. Temporal Dynamics of Urban Heat Island Correlated with the Socio-Economic Development Over the Past Half-Century in Seoul, Korea. Environmental Pollution 2019, 254, 112934. [Google Scholar] [CrossRef]
- Choi, Y.; Lee, Y.H. Urban Effect on Sea-Breeze-Initiated Rainfall: A Case Study for Seoul Metropolitan Area. Atmosphere 2021, 12, 1483. [Google Scholar] [CrossRef]
- Lee, H.; et al. Climate Change 2023: Synthesis Report, Summary for Policymakers. In Contribution of Working Groups I, II and III to the Sixth Assessment Report of the Intergovernmental Panel on Climate Change; IPCC, Geneva, Switzerland, 2023.
- Lee, S.; Paavola, J.; Dessai, S. Deeper Understanding of the Barriers to National Climate Adaptation Policy: The Case of South Korea. Mitigation and Adaptation Strategies for Global Change 2023, 28, 4. [Google Scholar] [CrossRef]
- Jung, J.G. An Analysis of Regional Climate Change Vulnerability in Korean Agriculture. MS Thesis, Seoul National University, 2019.
Table 1.
Automatic Weather Station WS69 specification (Source : ecowitt) .
| Measurement | Range | Accuracy | Resolution |
|---|---|---|---|
| Wind Speed | 0 m/s ~ 50 m/s | ± 1 m/s (speed < 10 m/s); ± 10% (speed ≥ 10 m/s) | 0.1 m/s |
| Wind Direction | 0° ~ 359° | ± 15° | 1° |
| Temperature | -40°C to 60°C | ± 0.3°C (± 0.6°F) | 0.1°C (0.1°F) |
| Humidity | 1% to 99% | ± 3.5% | 0.01 |
| Light | 0 Klux to 200 Klux | ± 25% | 0.1 Klux |
| UVI (Ultraviolet Index) | 1 ~ 15 | ± 2 | 1 |
| Rainfall | 0 ~ 9999 mm | ± 10% | 0.3 mm (volume < 1000 mm); 1 mm (volume ≥ 1000 mm) |
Disclaimer/Publisher’s Note: The statements, opinions and data contained in all publications are solely those of the individual author(s) and contributor(s) and not of MDPI and/or the editor(s). MDPI and/or the editor(s) disclaim responsibility for any injury to people or property resulting from any ideas, methods, instructions or products referred to in the content. |
© 2024 by the authors. Licensee MDPI, Basel, Switzerland. This article is an open access article distributed under the terms and conditions of the Creative Commons Attribution (CC BY) license (http://creativecommons.org/licenses/by/4.0/).
Copyright: This open access article is published under a Creative Commons CC BY 4.0 license, which permit the free download, distribution, and reuse, provided that the author and preprint are cited in any reuse.


